Embed Size (px)
Citation preview

Investor Meeting
June 21, 2007

2 June 21, 2007
Today’s Schedule
Time Topic Speaker
11:00 - 11:30am Registration & Display of RR Donnelley Offerings
11:30 - 11:45am Welcome and Introduction Dan Leib
11:45 - 12:00pm One RR Donnelley Tom Quinlan
12:00 - 1:00pm Industry Dynamics & RR Donnelley Strategy
John Paloian Dan Knotts
1:00 - 1:30pm Financial Review Dan Leib Tom Quinlan
Q&A

3 June 21, 2007
Safe Harbor Statement
Use of Forward-Looking Statements This presentation contains "forward-looking statements" as defined in the U.S. Private Securities Litigation Reform Act of 1995. Readers are cautioned not to place undue reliance on these forward-looking statements and any such forward-looking statements are qualified in their entirety by reference to the following cautionary statements. All forward-looking statements speak only as of the date of this presentation and are based on current expectations and involve a number of assumptions, risks and uncertainties that could cause the actual results to differ materially from such forward-looking statements. The company does not undertake to and specifically declines any obligation to publicly release the results of any revisions to these forward-looking statements that may be made to reflect future events or circumstances after the date of such statement or to reflect the occurrence of anticipated or unanticipated events.
The factors that could cause material differences in the expected results of RR Donnelley include, without limitation, the following: the successful execution and integration of acquisitions and the performance of the company's businesses following acquisitions; the ability to implement comprehensive plans for the execution of cross-selling, cost containment, asset rationalization and other key strategies; competitive pressures in all markets in which the company operates; factors that affect customer demand, including changes in postal rates and postal regulations, changes in the capital markets, changes in advertising markets, the rate of migration from paper-based forms to digital format, customers' budgetary constraints and customers' changes in short-range and long-range plans; shortages or changes in availability, or increases in costs of, key materials (such as ink, paper and fuel); and other risks and uncertainties described in RR Donnelley's periodic filings with the Securities and Exchange Commission (SEC). Readers are strongly encouraged to read the full cautionary statements contained in RR Donnelley's filings with the SEC. RR Donnelley disclaims any obligation to update or revise any forward-looking statements.

4 June 21, 2007
Non-GAAP Financial Information
The company believes that certain non-GAAP measures, when presented in conjunction with comparable GAAP measures, are useful because that information is an appropriate measure for evaluating the company’s operating performance. Internally, the company uses this non-GAAP information as an indicator of business performance, and evaluates management’s effectiveness with specific reference to these indicators. These measures should be considered in addition to, not a substitute for, or superior to, measures of financial performance prepared in accordance with GAAP.
A reconciliation of GAAP net earnings to non-GAAP net earnings and further descriptions are presented in the tables attached to our Earnings Releases, which are available in the investors section of our website, rrdonnelley.com. Also available in the investors section of our website, rrdonnelley.com, is a description of additional non-GAAP financial measures referred to in this presentation.
Twelve Months Ended December 31,
In $ millions, except EPS 2003 2004 2005 2006
Income from Cont. Ops EPS
Income from Cont. Ops EPS
Income from Cont. Ops EPS
Income from Cont. Ops EPS
GAAP results $292.7 $1.54 $459.2 $0.88 $450.4 $0.63 $750.7 $1.83
AdjustmentsRestructuring and impairments - net 12.5 0.07 107.4 0.31 419.8 1.83 206.1 0.79 Integration charges - - 80.8 0.23 8.3 0.02 - - Income Tax adjustment - (0.44) - (0.16) - - - (0.11) Net (income) from Discontinued Operations - 0.13 - 0.39 - (0.19) - 0.01 Cumulative effect of change in accounting principle - - - 0.03 - - - - Other non-GAAP adjustments - 0.01 - (0.03) - - - 0.03 Total Adjustment 12.5 (0.23) 188.2 0.77 428.1 1.66 206.1 0.72
Non-GAAP results 305.2 $1.31 647.4 $1.65 878.5 $2.29 956.8 $2.55
Depreciation and amortization 270.3 385.5 425.0 463.3 EBITDA (non-GAAP) $575.5 $1,032.9 $1,303.5 $1,420.1

5 June 21, 2007
Agenda
One RR Donnelley
Industry Dynamics & RR Donnelley Strategy
Financial Review
Q&A

6 June 21, 2007
Building RR Donnelley to Succeed
Note: (1) In addition, RRD completed the acquisition of Ad-Plex Rhodes Charlestown facility in August, 2005, Spencer Press in November, 2005, CMCS in December, 2005 and Canadian Bank Note in October, 2006
May 2003February 2004
June 2005
April 2006
Acquisitions(1)Divestitures
December 2005
October 2004Package Logistics
July 2005
Sept 2005Poligrafia
January 2007
May 2007
7 June 21, 2007
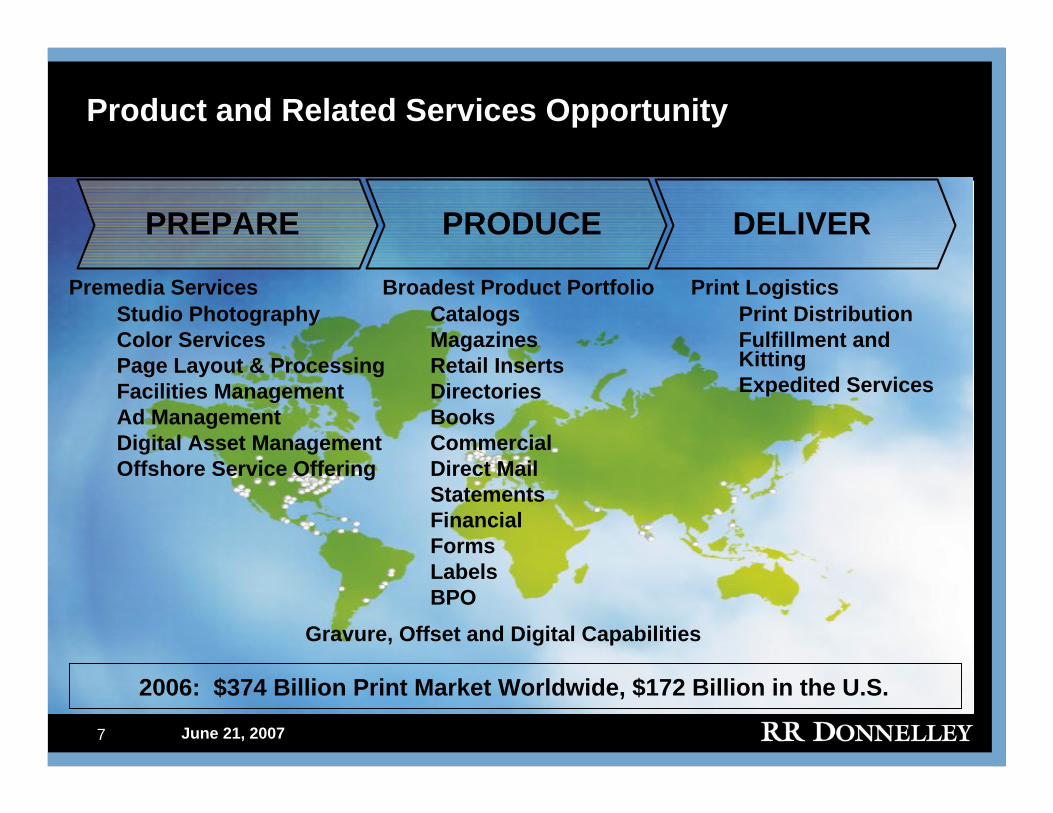
Product and Related Services Opportunity
PREPARE PRODUCE DELIVER
Premedia ServicesStudio PhotographyColor ServicesPage Layout & ProcessingFacilities ManagementAd ManagementDigital Asset ManagementOffshore Service Offering
Broadest Product PortfolioCatalogsMagazinesRetail InsertsDirectoriesBooksCommercialDirect MailStatementsFinancialFormsLabelsBPO
Print LogisticsPrint DistributionFulfillment and KittingExpedited Services
2006: $374 Billion Print Market Worldwide, $172 Billion in the U.S.
Gravure, Offset and Digital Capabilities
8 June 21, 2007
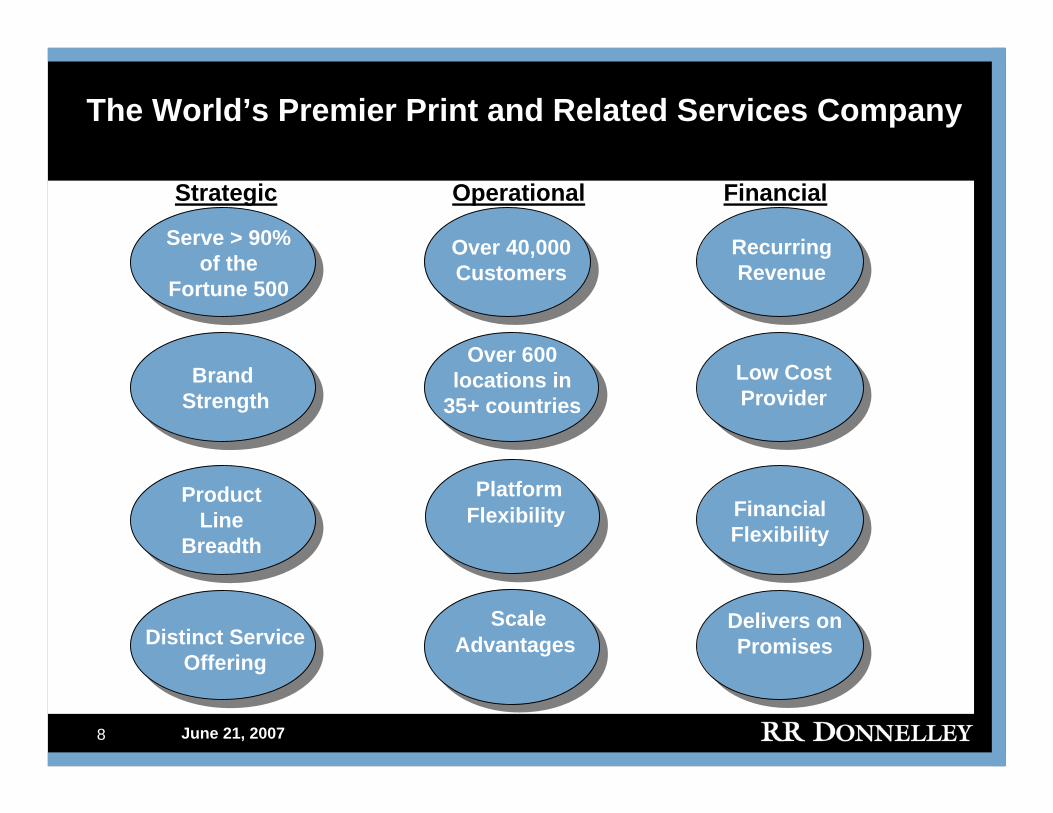
The World’s Premier Print and Related Services Company
Brand Strength
Distinct ServiceOffering
Delivers on Promises
Over 600 locations in
35+ countries
Serve > 90% of the
Fortune 500
Scale Advantages
Financial Flexibility
Low Cost Provider
Product Line
Breadth
Recurring Revenue
Strategic Operational Financial
Over 40,000 Customers
Platform Flexibility

9 June 21, 2007
Simplified Branding
Rebrand Moore Wallace and certain other trade names as RR Donnelley
Effective Q3 2007, we will realign the management and reporting structure
Simplifies client and internal interactions
Results in an approximately $315 million non-cash impairment charge

10 June 21, 2007
10
Deep Customer Relationships
Blue Chip Customer Relationships
And many others…
Total of 40,000 Customers
125 customers with revenue > $10 million (1)
950 customers with revenue > $1 million (1)
Serve over 90% of Fortune 500 and have approximately 15% of their print spend
• Opportunity to continue to grow our Fortune 500 Relationships
(1) Includes only revenue generated in North America
11 June 21, 2007
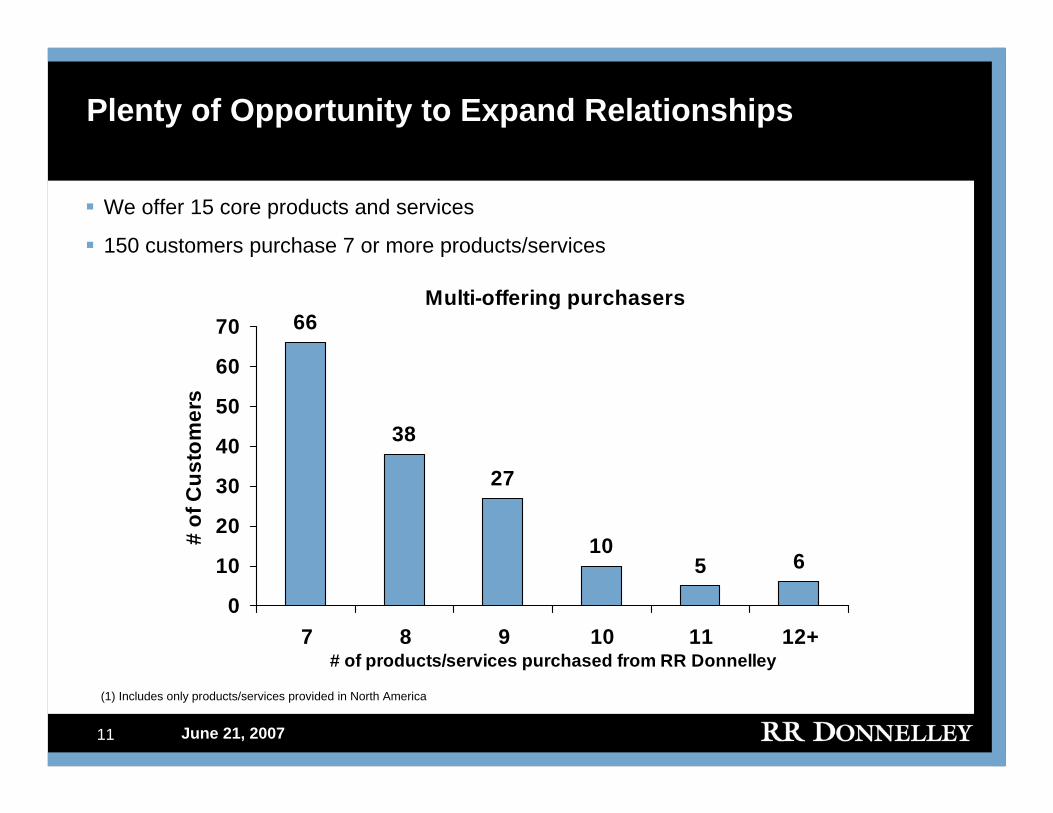
Plenty of Opportunity to Expand Relationships
We offer 15 core products and services
150 customers purchase 7 or more products/services
(1) Includes only products/services provided in North America
Multi-offering purchasers66
38
27
105 6
0
10
20
30
40
50
60
70
7 8 9 10 11 12+# of products/services purchased from RR Donnelley
# of
Cus
tom
ers
12 June 21, 2007
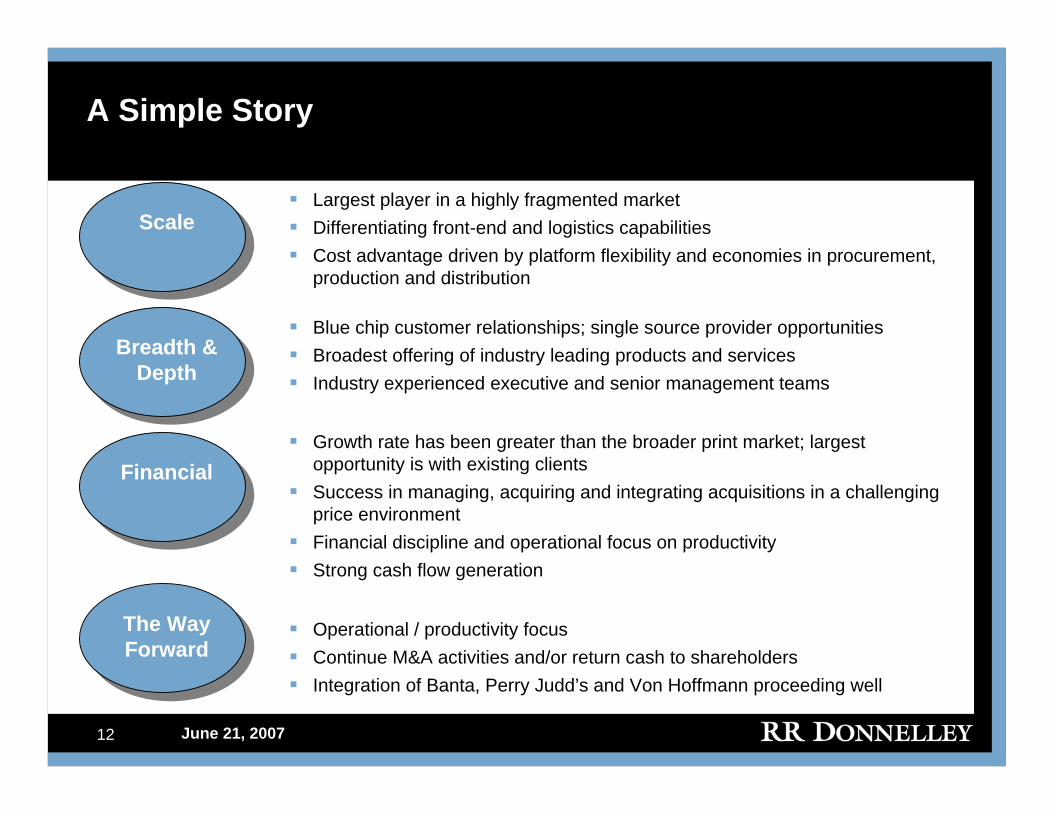
A Simple Story
Largest player in a highly fragmented marketDifferentiating front-end and logistics capabilitiesCost advantage driven by platform flexibility and economies in procurement, production and distribution
Scale
Breadth & Depth
Blue chip customer relationships; single source provider opportunitiesBroadest offering of industry leading products and servicesIndustry experienced executive and senior management teams
FinancialGrowth rate has been greater than the broader print market; largest opportunity is with existing clientsSuccess in managing, acquiring and integrating acquisitions in a challenging price environmentFinancial discipline and operational focus on productivityStrong cash flow generation
The Way Forward
Operational / productivity focusContinue M&A activities and/or return cash to shareholdersIntegration of Banta, Perry Judd’s and Von Hoffmann proceeding well

13 June 21, 2007
Agenda
One RR Donnelley
Industry Dynamics & RR Donnelley Strategy
Financial Review
Q&A

14 June 21, 2007
Trends Shaping Industry
Customer Relationship Management
Consolidation(Printers, Suppliers
& Customers)
Electronic Substitution
Trends generally continuing at same paceImpact differs by print sector: results in new products / services
Total System Cost Focus
Regulatory Changes
Shift toward variable (customized), higher value-add printIT / data management capabilities increasingly importantto customers
Pricing pressureLarge / diversified printers are better positioned to be successfulPrivate equity presence changing buying dynamics
Positive and negative implicationsPrinters’ ability to offer compliance assurance / secure environment increasingly important
Printers who are able to offer lowest total print / document management cost and higher ROI are advantaged

15 June 21, 2007
Consolidating Industry*
*Sample representation – estimated total of 39,088 printing facilities in the United States at the end of 2006 (PIA/GATF, April 3, 2007). Source: RR Donnelley management estimates

16 June 21, 2007
Consolidating Supplier Base
Flint/NAPIC + Continental BASF Graphics + Alper Ink Group + SICPA + Day
Flint acquired by XSYS European
Source: RR Donnelley management estimates
1980
2007
Paper Suppliers
Stora/Enso
Bowater/Avenor
Domtar/WeyerhaeuserAbitibi/BowaterMead/WestvacoUPM/KymmeneIP/ChampionGeorgia Pacific/Ft. James
Ink Suppliers
Dai Nippon/SunINX/Acme + Midland

17 June 21, 2007
Consolidation Runs Across Business Spectrum
Media Companies
Retailers
Catalogers
Magazine & Book Publishers
Pharmaceuticals
Automotive
Bank/Financial Institutions
Food Industry
18 June 21, 2007
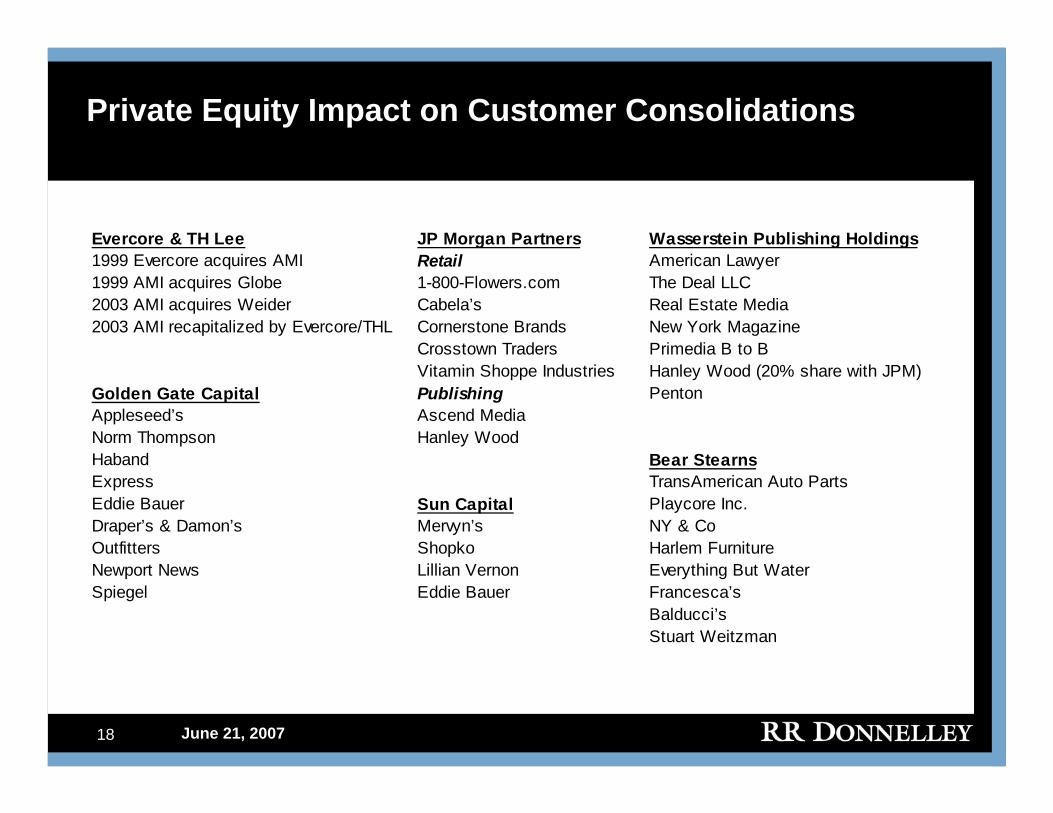
Private Equity Impact on Customer Consolidations
Evercore & TH Lee JP Morgan Partners Wasserstein Publishing Holdings1999 Evercore acquires AMI Retail American Lawyer 1999 AMI acquires Globe 1-800-Flowers.com The Deal LLC 2003 AMI acquires Weider Cabela’s Real Estate Media 2003 AMI recapitalized by Evercore/THL Cornerstone Brands New York Magazine
Crosstown Traders Primedia B to B Vitamin Shoppe Industries Hanley Wood (20% share with JPM)
Golden Gate Capital Publishing Penton Appleseed’s Ascend MediaNorm Thompson Hanley WoodHaband Bear StearnsExpress TransAmerican Auto Parts Eddie Bauer Sun Capital Playcore Inc. Draper’s & Damon’s Mervyn’s NY & Co Outfitters Shopko Harlem Furniture Newport News Lillian Vernon Everything But Water Spiegel Eddie Bauer Francesca’s
Balducci’s Stuart Weitzman

19 June 21, 2007
Change in Ownership has Driven Change in Buying Dynamics
From… To…
Focus on lowest total document management costs and also on achieving highest ROI
Contractual relationship
Fragmented print procurement across different functions / divisions / geographies
Focus on lowest print cost
In-house print / document management
Transactional relationships
Consolidated print procurement,centrally managed
Outsourcing non-core processes including print / document process management

20 June 21, 2007
The Evolution of Print Relationships
Source: Derived from InfoTrends/Cap Ventures
Single Product Relationships
Time
Cus
tom
er R
elat
ions
hips
Outsourced print andValue-Added Services
Multiple Product Relationships
Total Cost of Process/Procurement
Function
100% of Core Product(s)
1864 2000 2006 2007+
Client’s focus on print supply chain, not just print
RRD reaches across total value chain
Ability to bring scale• Procurement• Distribution• Production
Leverage the relationship• 100% Positions• Trust in place• Vested Interest

21 June 21, 2007
The Evolution of RR Donnelley’s Strategy
ManagementPut “World Class” team together
Built support infrastructure
• Admin/Finance/Ops
InvestmentDeveloped and implemented new strategy
Built, through organic investments and acquisitions, flexible full-service platform
OperationalFocused on continual productivity improvements
Absorbed equipment installs
Absorbed and integrated acquisitions
Asserted disciplines/metrics (cost compression culture)

22 June 21, 2007
The RR Donnelley Strategy – Profitable Growth
Targeted sales strategy• Winners/consolidators in their space• Contractual opportunities – opening the window• 100% positions
Disciplined investment approach• Organic investment• Targeted acquisitions
Trade-off with capital expenditures
Productivity and waste reduction
Building a Global Platform for Global Customer Needs

23 June 21, 2007
The RR Donnelley Strategy – A Disciplined Approach
Key Elements
Market / platform versus business unit approach
Window of opportunity - prioritization
Standardized capital investment approach
Flexibility to adapt to evolving customer needs

24 June 21, 2007
One RR Donnelley (Illustrative)
Magazine Publisher
Book Publisher
Directory Publisher
Healthcare Financial Retail
Internal Process (Pricing, Production Planning)
One Global Platform
Sales and Marketing
Sheetfed
PREPARE PRODUCE DELIVERGravure Offset
DigitalBindery

25 June 21, 2007
The RR Donnelley Strategy - Driving Profitable Growth
Sales growth targets
Platform optimization• Asset utilization
• Productivity focus
Organic investment• Expand and upgrade base platform
• Equipment balance
Acquisitions• Targeted for customers, equipment, capacity, capabilities, people
• Disciplined analysis

26 June 21, 2007
Platform Optimization - Asset Utilization
36%64%
1st Half 2nd Half
Off peak (1H) growth has exceeded peak (2H) growth by over $100 million from 2004 to 2006
% of Revenue Growth (2004 – 2006)*
* 2004-06 growth in most historically seasonal offerings (magazines, catalogs, retail inserts, books and directories)

27 June 21, 2007
Platform Optimization – Productivity Focus
Leverage RR Donnelley scale• Supply chain
• Shared services
• One platform
Targeted investment• Quality and service
• Waste, throughput and cost takeout

28 June 21, 2007
Organic Investment
Capacity investment• 50+ presses and binding lines installed• Assortment of standardized asset types to optimize platform• Overall increase in capacity utilization
Capability investment• Targeted to meet market and customer requirements• Standardization to drive flexibility
Productivity / Compliance / Maintenance investment• Relentless approach to cost takeout and waste reduction• Safety focused• Infrastructure requirements

29 June 21, 2007
The RR Donnelley Strategy – A Living Process
Keys to Success
Industry and market knowledge
Sales planning
Leveraging scale as one platform
Investment prioritization
Sales Growth Targets
Platform Optimization
Organic Investment
Acquisitions

30 June 21, 2007
RR Donnelley - An Unmatched Portfolio
Books
Statements BPO & Document
ManagementCatalogs
Commercial Printing
Direct Mail
Directories
In-Box & Global Turnkey
Solutions
Logistics/Fulfillment Services
Magazines
Labels & Label SystemsRetail Inserts
Financial Services
eCommerce Tools
Forms
Premedia Services
2006: $374 Billion Market Worldwide, $172 Billion in the U.S.

31 June 21, 2007
RR Donnelley International Presence

32 June 21, 2007
New Customers and Expansion of Relationships
Since February 2004, the contract value of our largest new business wins and renewals…
Totals over $6.5 billion

33 June 21, 2007
RRD Existing Global Customers

34 June 21, 2007
RR Donnelley is Differentiated to Drive Growth
Comprehensive global printing & print-related services platform• Reaches across total value chain• Allows for maximum cost compression
Global outsourcing / procurement capabilityScale associated with leveraged buying
• Materials• Logistics
Leveraging long-term customer relationships/contracts• 100% positions in place• Trust is already earned• “Vested interest”
Financial strength and stability

35 June 21, 2007
Agenda
One RR Donnelley
Industry Dynamics & RR Donnelley Strategy
Financial Review
Q&A
36 June 21, 2007
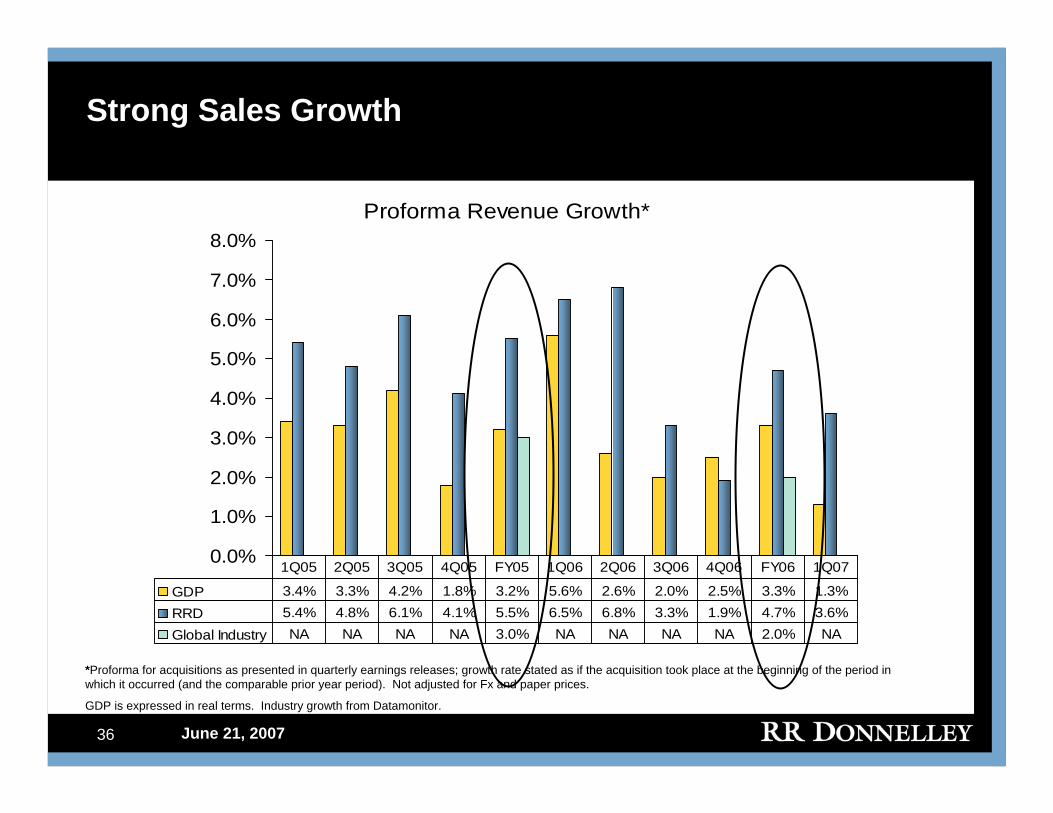
Strong Sales Growth
Proforma Revenue Growth*
0.0%
1.0%
2.0%
3.0%
4.0%
5.0%
6.0%
7.0%
8.0%
GDP 3.4% 3.3% 4.2% 1.8% 3.2% 5.6% 2.6% 2.0% 2.5% 3.3% 1.3%RRD 5.4% 4.8% 6.1% 4.1% 5.5% 6.5% 6.8% 3.3% 1.9% 4.7% 3.6%Global Industry NA NA NA NA 3.0% NA NA NA NA 2.0% NA
1Q05 2Q05 3Q05 4Q05 FY05 1Q06 2Q06 3Q06 4Q06 FY06 1Q07
*Proforma for acquisitions as presented in quarterly earnings releases; growth rate stated as if the acquisition took place at the beginning of the period in which it occurred (and the comparable prior year period). Not adjusted for Fx and paper prices.
GDP is expressed in real terms. Industry growth from Datamonitor.

37 June 21, 2007
4,183
7,156
8,430
9,317
0
2,000
4,000
6,000
8,000
10,000
2003 2004 2005 2006
Rev
enue
($m
m)
EBITDA Growth has Exceeded Sales Growth
CAGR = 35%
576
1,033
1,304
1,420
0
400
800
1,200
1,600
2003 2004 2005 2006
EBIT
DA
($m
m)
CAGR = 31%

38 June 21, 2007
0%
100%
Revenue Cost of Sales SG&A D&A Earnings fromCont. Ops
% o
f Rev
enue
Materials Labor Other Semi-variable Fixed D&A
2006 Profitability and Cost Detail
39 June 21, 2007
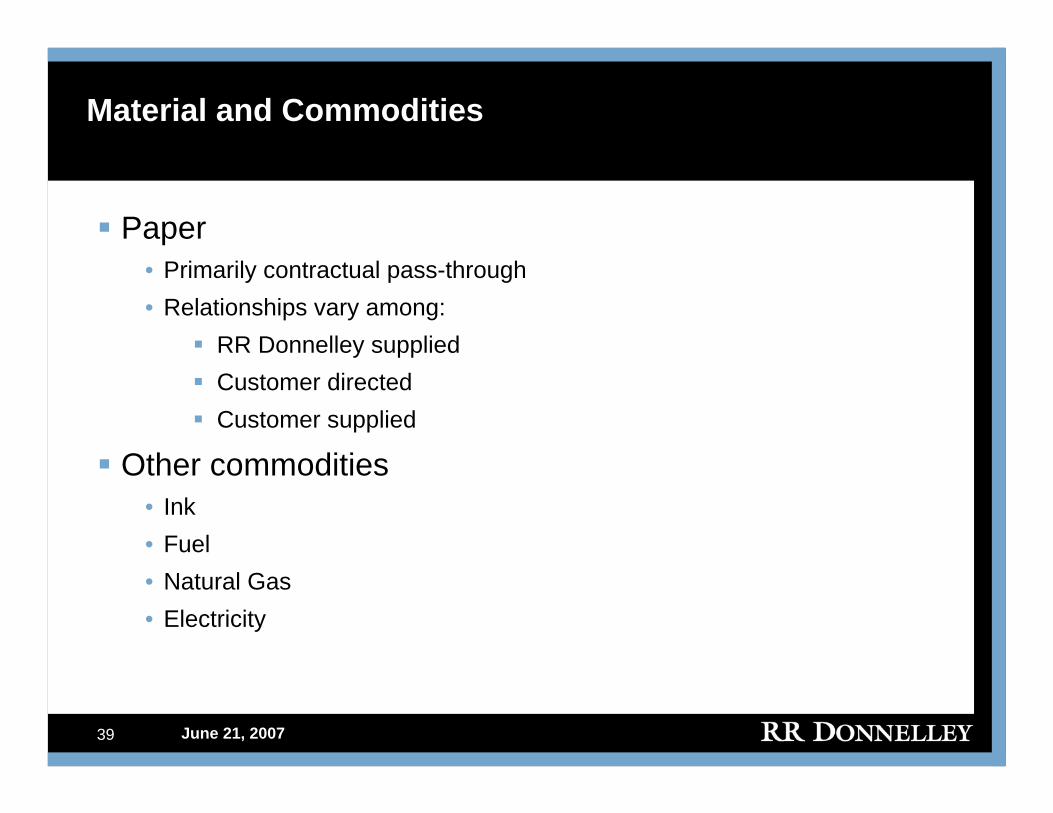
Material and Commodities
Paper• Primarily contractual pass-through• Relationships vary among:
RR Donnelley suppliedCustomer directedCustomer supplied
Other commodities• Ink• Fuel• Natural Gas• Electricity

40 June 21, 2007
270
386425
463
595
193
265
471
374
450-475
4.6%3.7%
5.6%
4.0% 4.0%
0
100
200
300
400
500
600
700
2003 2004 2005 2006 2007
Depreciation & AmortizationCapexCapex as % Revenue
Historically, D&A has exceeded Capital Expenditures
$ in Millions
Capital expenditure as a % of Revenue is expected to decrease in 2008
2008 capex expected to decrease to 3.5% to 4.0% of revenue
Platform refresh investments

41 June 21, 2007
$1.31
$1.65
$2.29$2.55
$0.11
$0.18
$0.23
$0.35
$2.70 - 2.75
$0.00
$0.00
$0.50
$1.00
$1.50
$2.00
$2.50
$3.00
$3.50
2003 2004 2005 2006 2007
Strong Non-GAAP Earnings per Share Growth
CAGR = 20%
CAGR = 24%, adjusted for purchasing accounting amortization
Non-GAAP EPS Dilutive Impact of Purchasing Accounting
Note: Dilutive impact of Purchase Accounting amortization calculated using amortization of intangibles, tax effected at the company’s non-GAAP effective tax rate.

42 June 21, 2007
Business Generates Substantial Cash Flow
$376
$759
$972$904
$183
$494 $501 $530
0
200
400
600
800
1,000
1,200
2003 2004 2005 2006
Cash Flow from Continuing Ops (CFFCO)CFFCO - Capex
$mm

43 June 21, 2007
Debt Maturity Profile
$ in millions
400499
624 598499
969
$0
$200
$400
$600
$800
$1,000
$1,200
2007 2008 2009 2010 2011 2012 2013 2014 2015 2016+
Weighted average interest rate of ~5.50% on existing long-term debt• Most outstanding debt at fixed rate
Few near-term maturities
3.75% 4.95% 4.95% 5.50% 6.65%Interest Rate 5.63%

44 June 21, 2007
Cash
Internal
Investment
Share
BuybackDividend Acquisition Debt Repay
• Organic Growth
• Cost Management
• Maintenance
Multiple Avenues to Value Creation
• Topline growth in line with GDP• Productivity to offset price• Cash flow and capital allocated to
drive value
• Discount to intrinsic value
• Accretive use of cash
• Furthers customer relationship
• Cost synergies
• Excess capacity
• Investor preference for distribution
• ST cash management
• Strong credit metrics

45 June 21, 2007
Balanced Capital Deployment
Very strong balance sheet and cash position
Strong investment grade credit ratings• Moody’s = Baa2• S&P = BBB+
Prioritization of cash flows• Dividend maintained at $1.04 per share/year• Internal capital to support growth/productivity• Continued M&A and/or return cash to shareholders
46 June 21, 2007
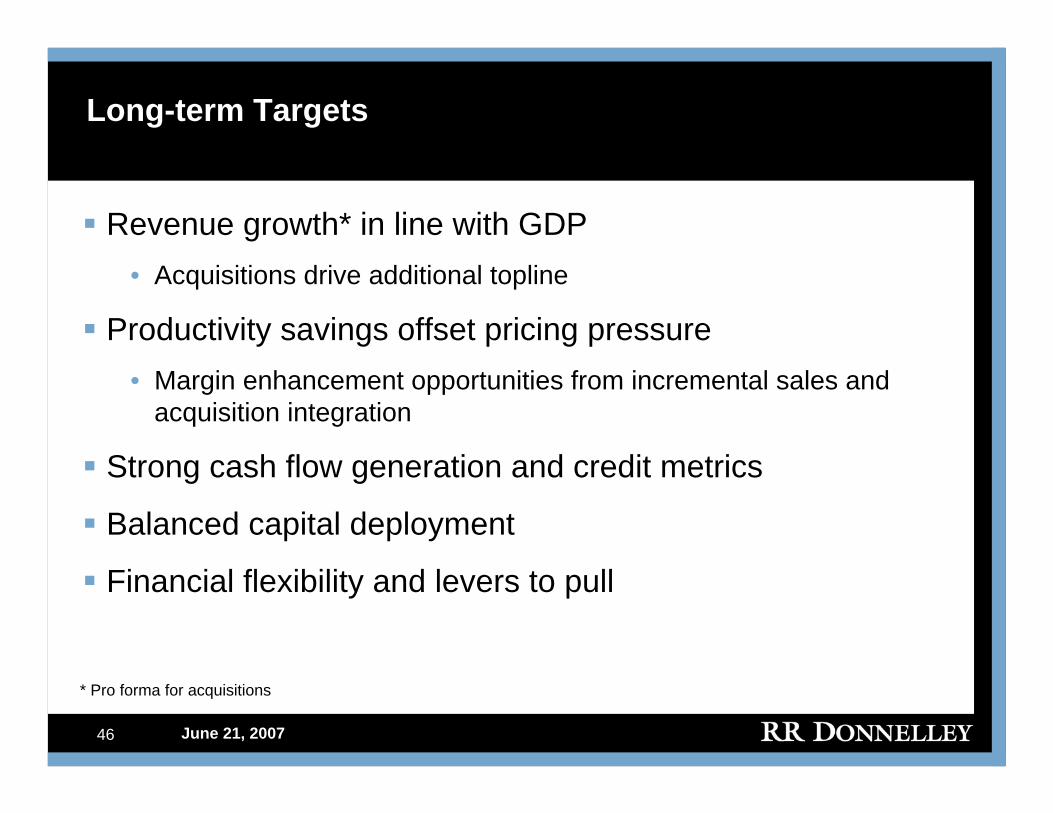
Long-term Targets
Revenue growth* in line with GDP• Acquisitions drive additional topline
Productivity savings offset pricing pressure• Margin enhancement opportunities from incremental sales and
acquisition integration
Strong cash flow generation and credit metrics
Balanced capital deployment
Financial flexibility and levers to pull
* Pro forma for acquisitions
47 June 21, 2007
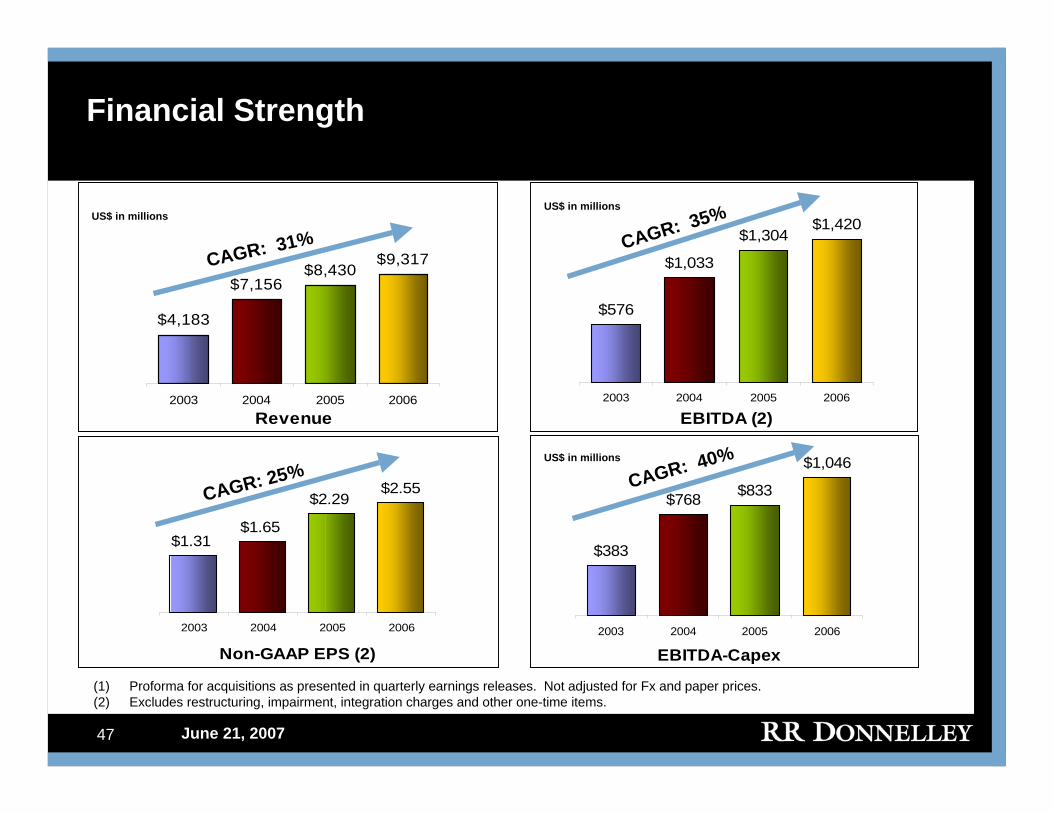
Financial Strength
$576
$1,033
$1,304$1,420
2003 2004 2005 2006
EBITDA (2)
$1.31$1.65
$2.29$2.55
2003 2004 2005 2006
Non-GAAP EPS (2)
$383
$768 $833
$1,046
2003 2004 2005 2006
EBITDA-Capex
CAGR: 25% CAGR: 40%
CAGR: 35%
(1) Proforma for acquisitions as presented in quarterly earnings releases. Not adjusted for Fx and paper prices.(2) Excludes restructuring, impairment, integration charges and other one-time items.
US$ in millions
US$ in millions
$4,183
$7,156$8,430
$9,317
2003 2004 2005 2006Revenue
CAGR: 31%US$ in millions
48 June 21, 2007
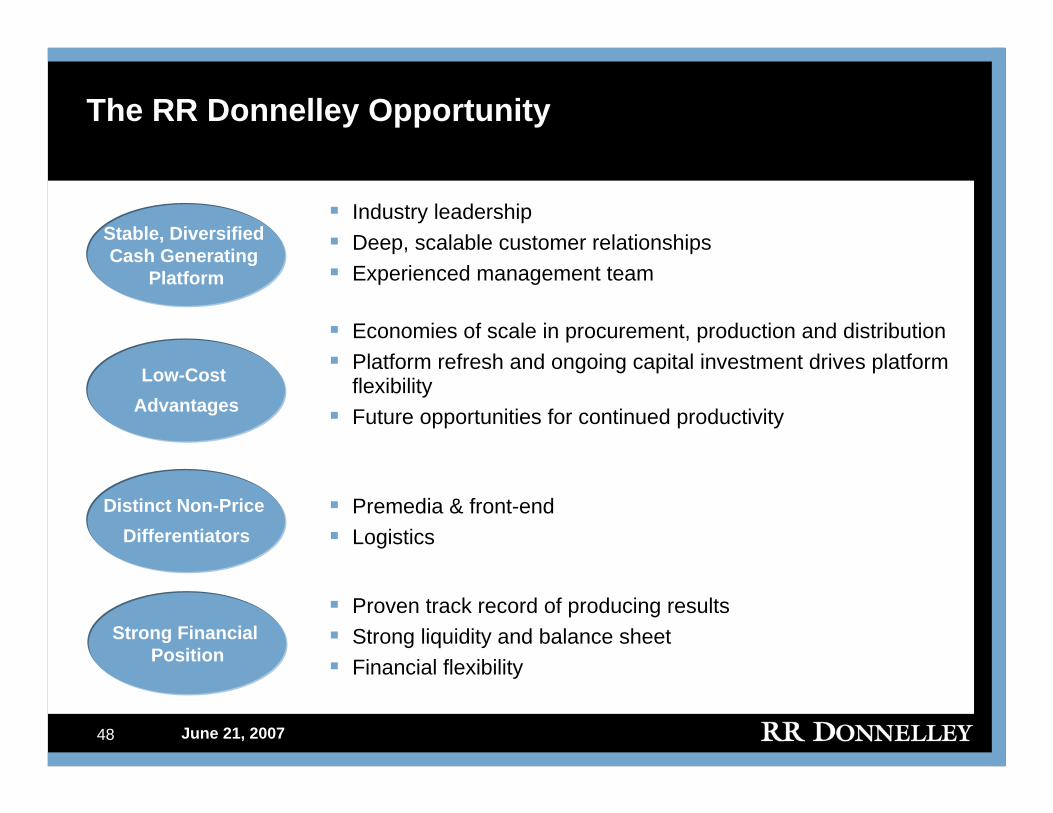
Distinct Non-Price Differentiators
Low-Cost Advantages
Stable, Diversified Cash Generating
Platform
Industry leadership Deep, scalable customer relationshipsExperienced management team
Economies of scale in procurement, production and distributionPlatform refresh and ongoing capital investment drives platform flexibilityFuture opportunities for continued productivity
Premedia & front-endLogistics
Strong Financial Position
The RR Donnelley Opportunity
Proven track record of producing resultsStrong liquidity and balance sheetFinancial flexibility
49 June 21, 2007
Agenda
One RR Donnelley
Industry Dynamics & RR Donnelley Strategy
Financial Review
Q&A
Investor Meeting
June 21, 2007