Embed Size (px)
Citation preview
Credit Suisse Chemical Conference
September 27, 2007
2
Certain information in this presentation may be considered forward-looking information within the meaning of the Private Securities Litigation Reform Act of 1995. This information is based on the Company's current expectations and actual results could vary materially depending on risks and uncertainties that may affect the Company's operations, markets, services, prices and other factors as discussed in filings with the Securities and Exchange Commission. These risks and uncertainties include, but are not limited to, industry and economic conditions, competitive, legal, governmental and technological factors. There is no assurance that the Company's expectations will be realized. The Company assumes no obligation to update any forward-looking information contained in this presentation should circumstances change, except as otherwise required by securities and other applicable laws.
This presentation contains non-GAAP financial measu res. A reconciliation to the nearest U.S. GAAP financial measures is included at the end of the presentation.
Forward-Looking Statements
3
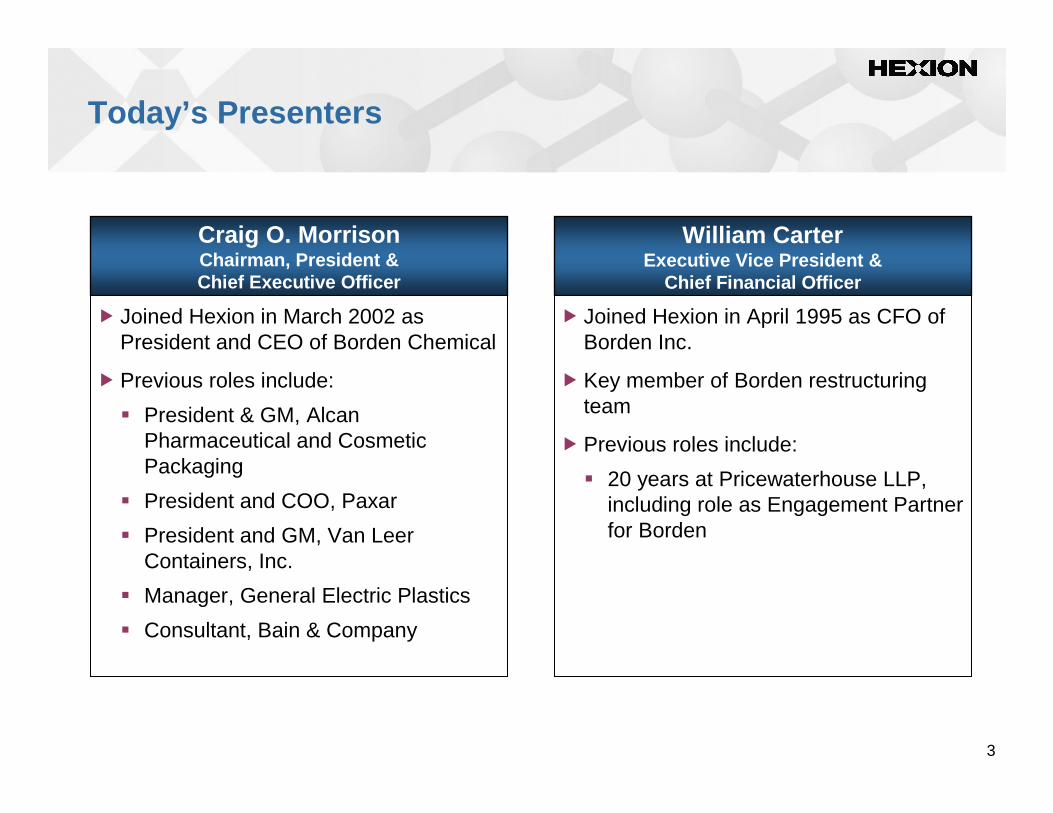
Today’s Presenters
Craig O. MorrisonChairman, President &Chief Executive Officer
William CarterExecutive Vice President &
Chief Financial Officer
� Joined Hexion in March 2002 as President and CEO of Borden Chemical
� Previous roles include:
� President & GM, Alcan Pharmaceutical and Cosmetic Packaging
� President and COO, Paxar
� President and GM, Van Leer Containers, Inc.
� Manager, General Electric Plastics
� Consultant, Bain & Company
� Joined Hexion in April 1995 as CFO of Borden Inc.
� Key member of Borden restructuring team
� Previous roles include:
� 20 years at Pricewaterhouse LLP, including role as Engagement Partner for Borden
Hexion Overview
Craig O. MorrisonChairman, President & Chief Executive Officer
5
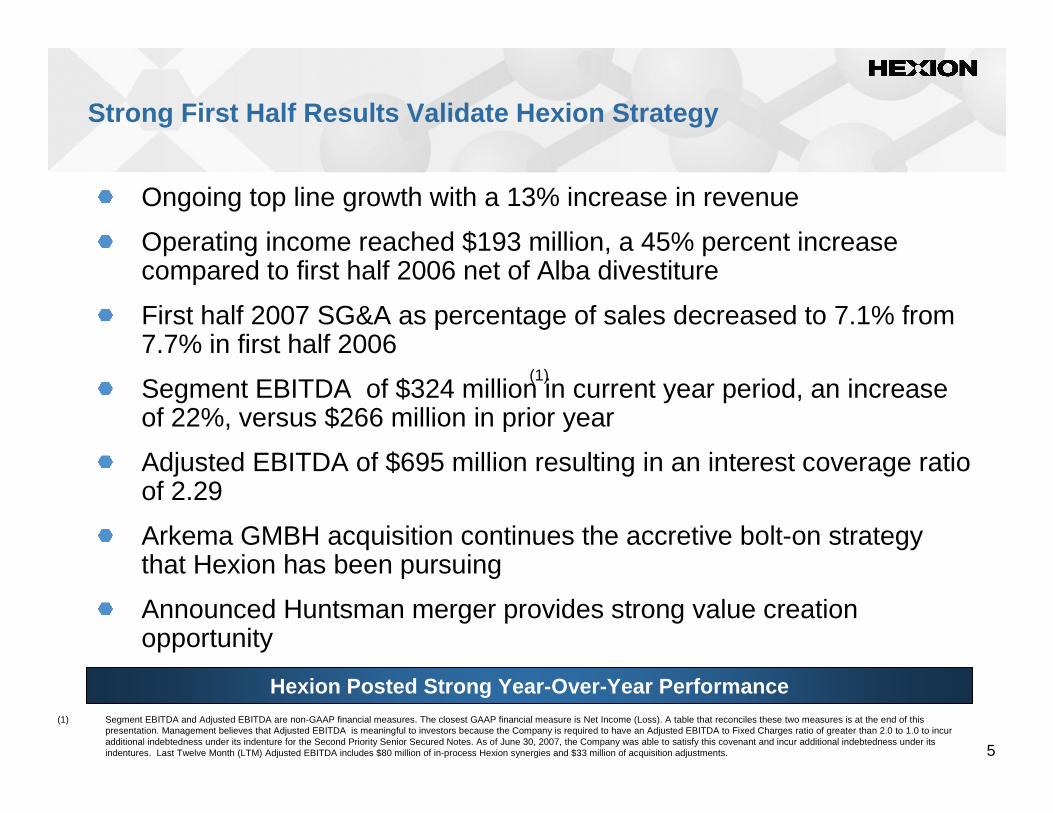
Strong First Half Results Validate Hexion Strategy
Ongoing top line growth with a 13% increase in revenue
Operating income reached $193 million, a 45% percent increase compared to first half 2006 net of Alba divestiture
First half 2007 SG&A as percentage of sales decreased to 7.1% from 7.7% in first half 2006
Segment EBITDA of $324 million in current year period, an increase of 22%, versus $266 million in prior year
Adjusted EBITDA of $695 million resulting in an interest coverage ratio of 2.29
Arkema GMBH acquisition continues the accretive bolt-on strategy that Hexion has been pursuing
Announced Huntsman merger provides strong value creation opportunity
Hexion Posted Strong Year-Over-Year Performance
(1)
(1) Segment EBITDA and Adjusted EBITDA are non-GAAP financial measures. The closest GAAP financial measure is Net Income (Loss). A table that reconciles these two measures is at the end of this presentation. Management believes that Adjusted EBITDA is meaningful to investors because the Company is required to have an Adjusted EBITDA to Fixed Charges ratio of greater than 2.0 to 1.0 to incur additional indebtedness under its indenture for the Second Priority Senior Secured Notes. As of June 30, 2007, the Company was able to satisfy this covenant and incur additional indebtedness under its indentures. Last Twelve Month (LTM) Adjusted EBITDA includes $80 million of in-process Hexion synergies and $33 million of acquisition adjustments.
6
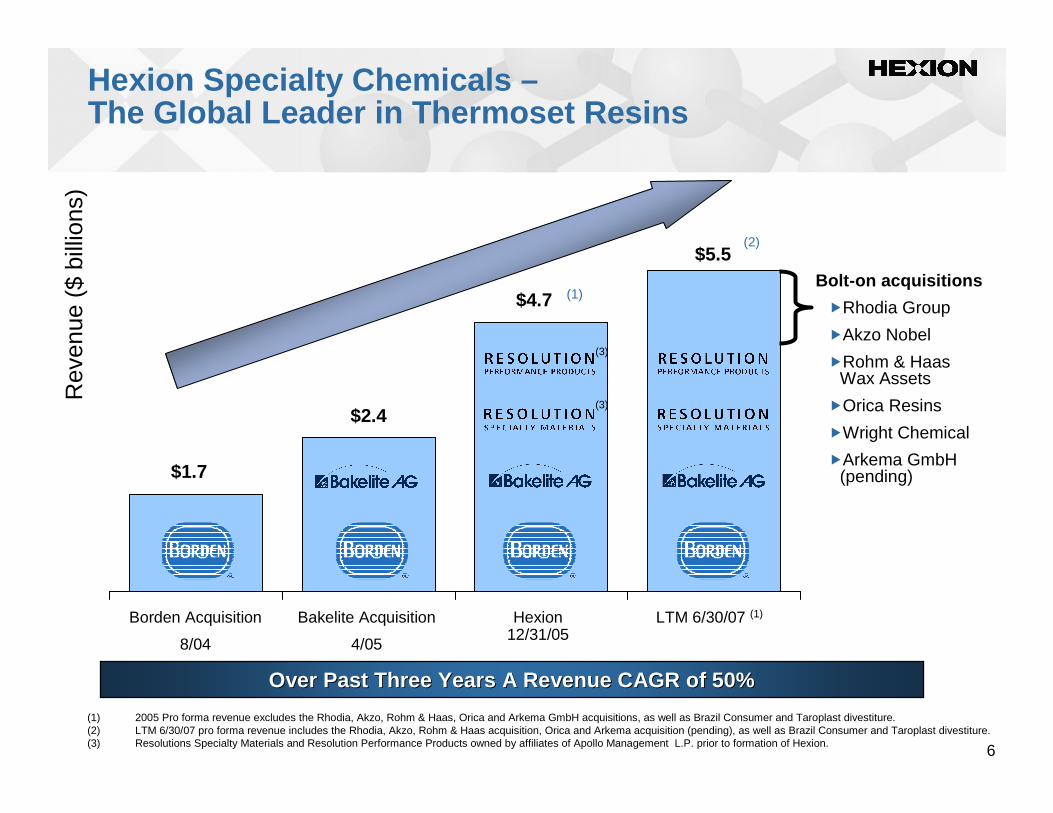
Hexion Specialty Chemicals –The Global Leader in Thermoset Resins
LTM 6/30/07 (1)Hexion 12/31/05
Bakelite Acquisition
4/05
Borden Acquisition
8/04
Rev
enue
($
billi
ons)
Over Past Three Years A Revenue CAGR of 50%Over Past Three Years A Revenue CAGR of 50%
Bolt-on acquisitions
�Rhodia Group
�Akzo Nobel
�Rohm & HaasWax Assets
�Orica Resins
�Wright Chemical
�Arkema GmbH (pending)
(1) 2005 Pro forma revenue excludes the Rhodia, Akzo, Rohm & Haas, Orica and Arkema GmbH acquisitions, as well as Brazil Consumer and Taroplast divestiture.(2) LTM 6/30/07 pro forma revenue includes the Rhodia, Akzo, Rohm & Haas acquisition, Orica and Arkema acquisition (pending), as well as Brazil Consumer and Taroplast divestiture.(3) Resolutions Specialty Materials and Resolution Performance Products owned by affiliates of Apollo Management L.P. prior to formation of Hexion.
$4.7
$5.5
(1)
(2)
$2.4
$1.7
(3)
(3)
7
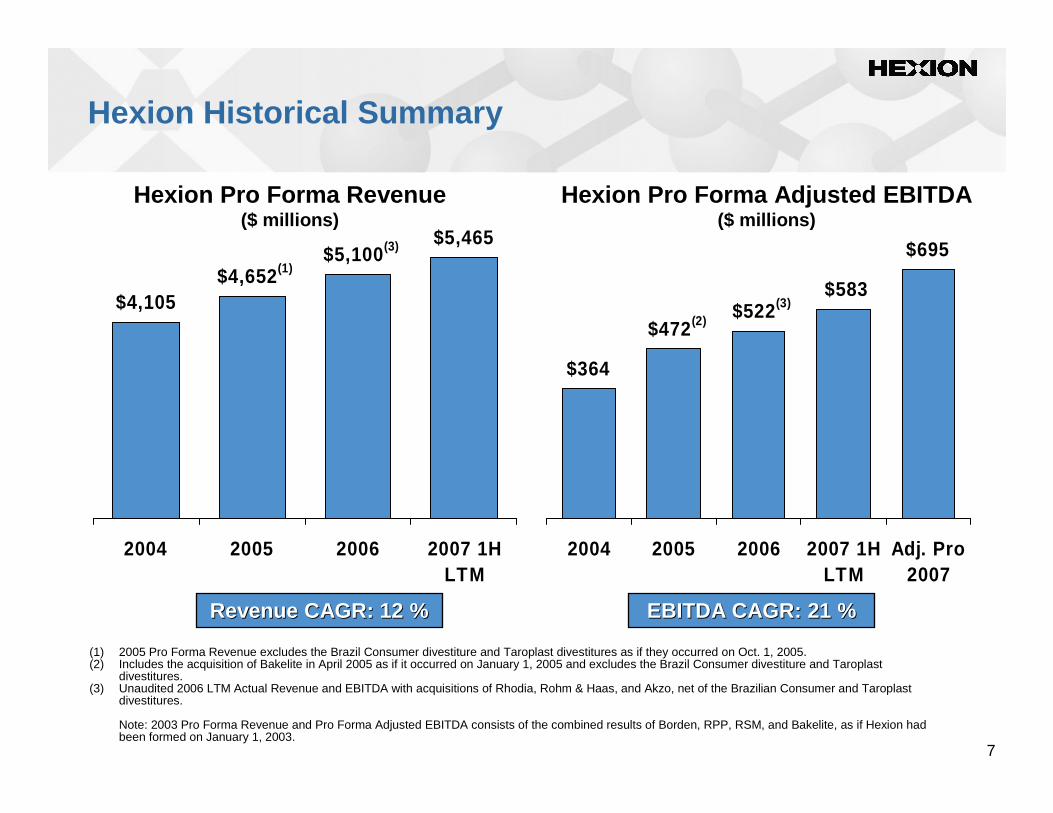
Hexion Historical Summary
$4,105
$5,465 $5,100(3)
$4,652(1)
2004 2005 2006 2007 1HLTM
Hexion Pro Forma Revenue($ millions)
Hexion Pro Forma Adjusted EBITDA($ millions)
(1) 2005 Pro Forma Revenue excludes the Brazil Consumer divestiture and Taroplast divestitures as if they occurred on Oct. 1, 2005.(2) Includes the acquisition of Bakelite in April 2005 as if it occurred on January 1, 2005 and excludes the Brazil Consumer divestiture and Taroplast
divestitures.(3) Unaudited 2006 LTM Actual Revenue and EBITDA with acquisitions of Rhodia, Rohm & Haas, and Akzo, net of the Brazilian Consumer and Taroplast
divestitures.
Note: 2003 Pro Forma Revenue and Pro Forma Adjusted EBITDA consists of the combined results of Borden, RPP, RSM, and Bakelite, as if Hexion had been formed on January 1, 2003.
$364
$695
$472(2) $522(3) $583
2004 2005 2006 2007 1HLTM
Adj. Pro2007
Revenue CAGR: 12 %Revenue CAGR: 12 % EBITDA CAGR: 21 %EBITDA CAGR: 21 %
8
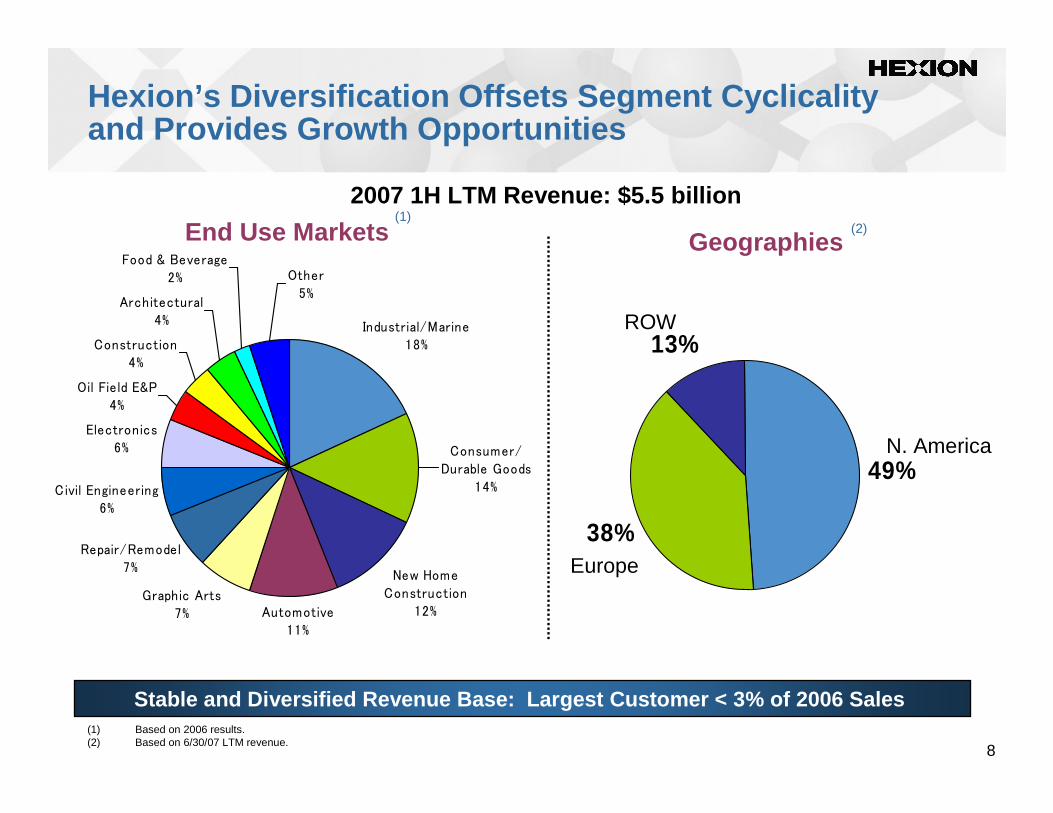
13%
49%
38%
Industrial/Marine18%
New Home Construction
12%Automotive11%
Graphic Arts7%
Civil Engineering6%
Electronics6%
Oil Field E&P4%
Construction4%
Architectural4%
Food & Beverage2%
Repair/Remodel7%
Consumer/Durable Goods
14%
Other5%
Hexion’s Diversification Offsets Segment Cyclicalit y and Provides Growth Opportunities
Stable and Diversified Revenue Base: Largest Custo mer < 3% of 2006 Sales
N. America
End Use Markets2007 1H LTM Revenue: $5.5 billion
Geographies(1)
(1) Based on 2006 results.(2) Based on 6/30/07 LTM revenue.
(2)
ROW
Europe
9
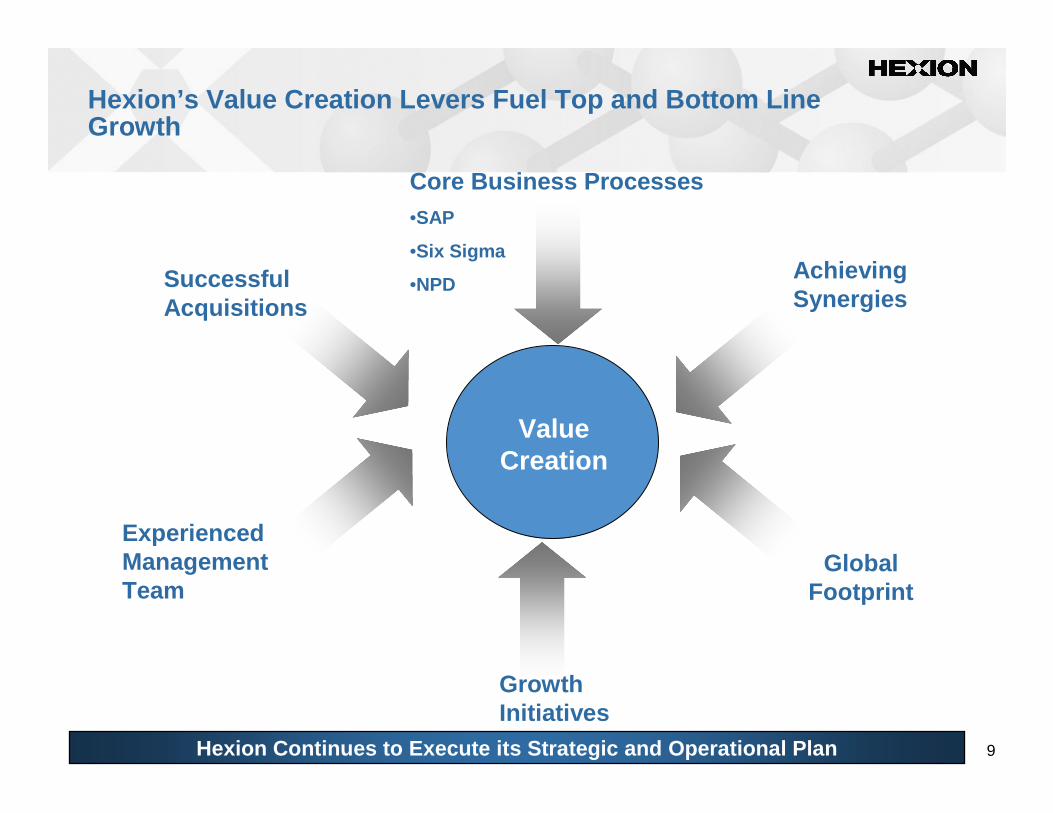
Hexion’s Value Creation Levers Fuel Top and Bottom Line Growth
Value Creation
Core Business Processes•SAP
•Six Sigma
•NPDAchieving Synergies
Hexion Continues to Execute its Strategic and Opera tional Plan
Global Footprint
GrowthInitiatives
ExperiencedManagementTeam
SuccessfulAcquisitions
10
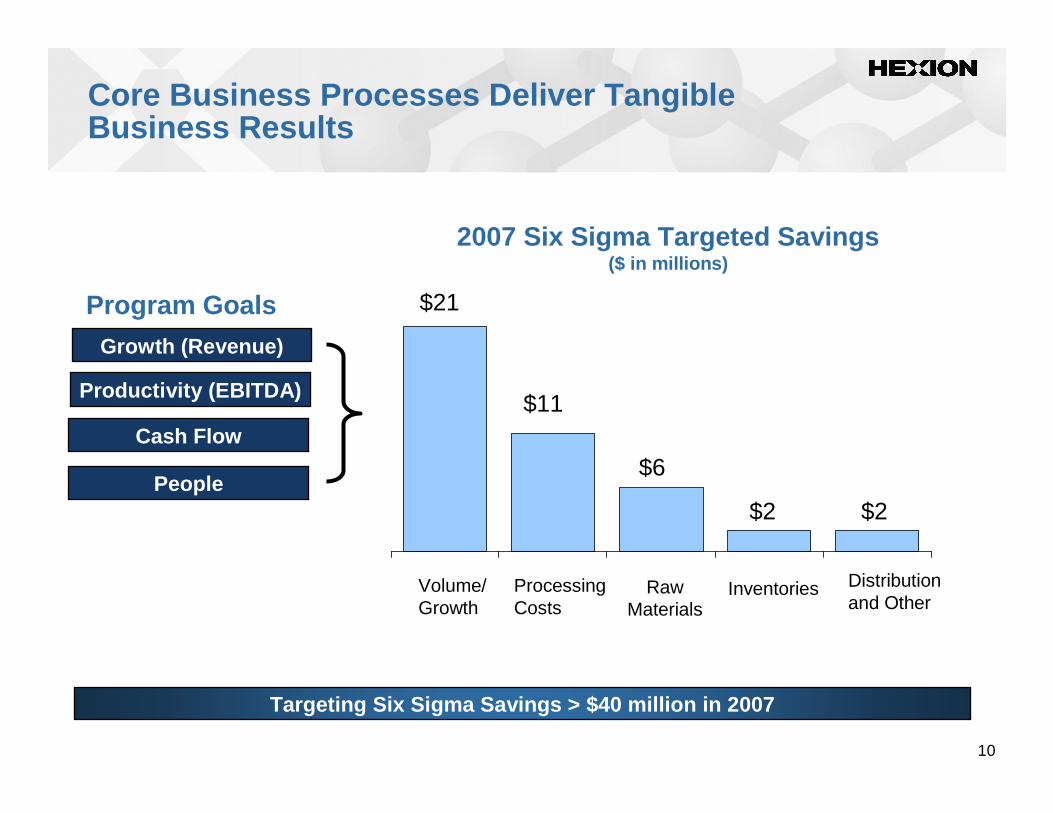
Growth (Revenue)
Productivity (EBITDA)
Cash Flow
Core Business Processes Deliver Tangible Business Results
2007 Six Sigma Targeted Savings ($ in millions)
Volume/Growth
Raw Materials
People
Program Goals
Targeting Six Sigma Savings > $40 million in 2007
Processing Costs
Distribution and Other
Inventories
$21
$11
$6
$2 $2
11
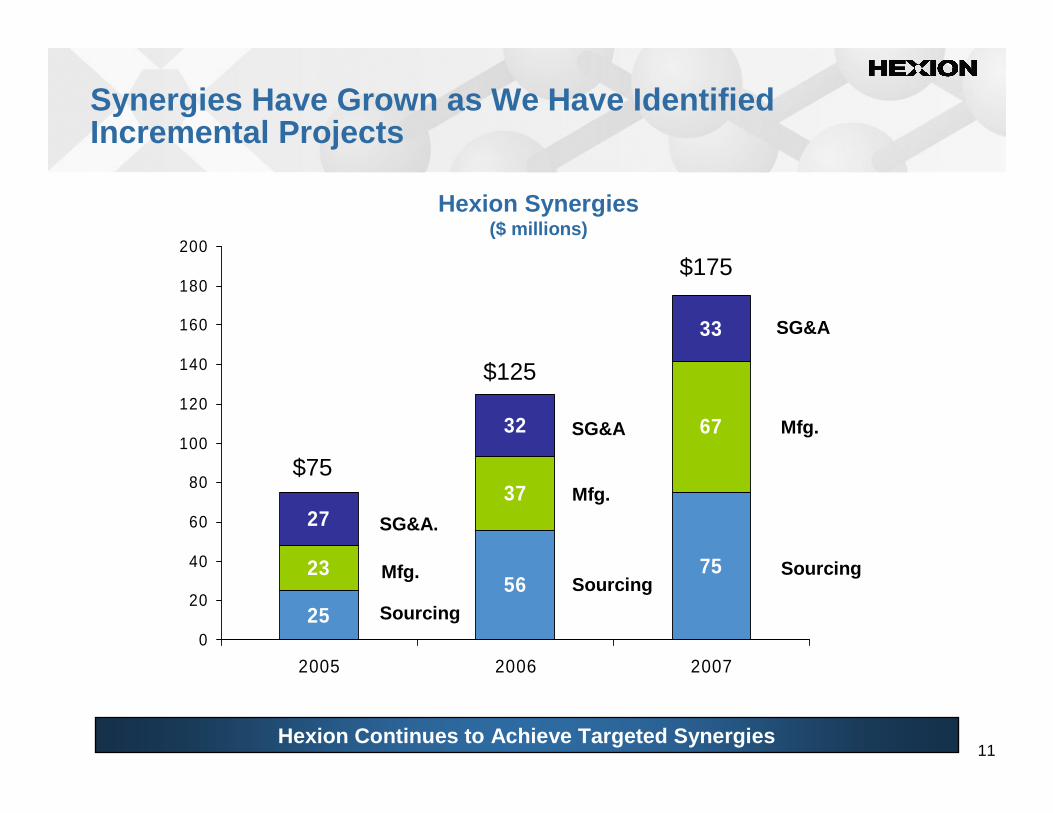
Synergies Have Grown as We Have Identified Incremental Projects
2556
7523
37
67
27
32
33
0
20
40
60
80
100
120
140
160
180
200
2005 2006 2007
$75
$125
$175
Hexion Synergies($ millions)
Sourcing
Mfg.
SG&A.
Sourcing
Mfg.
SG&A
Sourcing
Mfg.
SG&A
Hexion Continues to Achieve Targeted Synergies
12
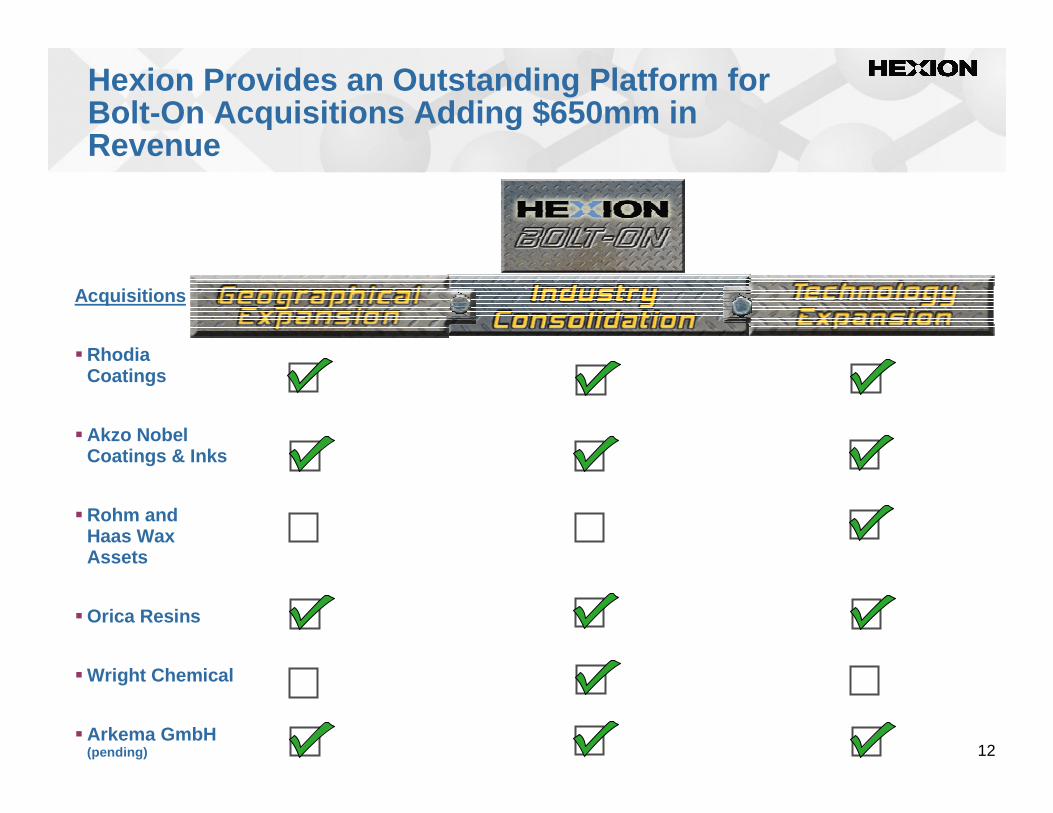
Hexion Provides an Outstanding Platform for Bolt-On Acquisitions Adding $650mm in Revenue
Acquisitions
� Rhodia Coatings
� Akzo Nobel Coatings & Inks
� Rohm andHaas Wax Assets
� Orica Resins
� Wright Chemical
� Arkema GmbH (pending)
13
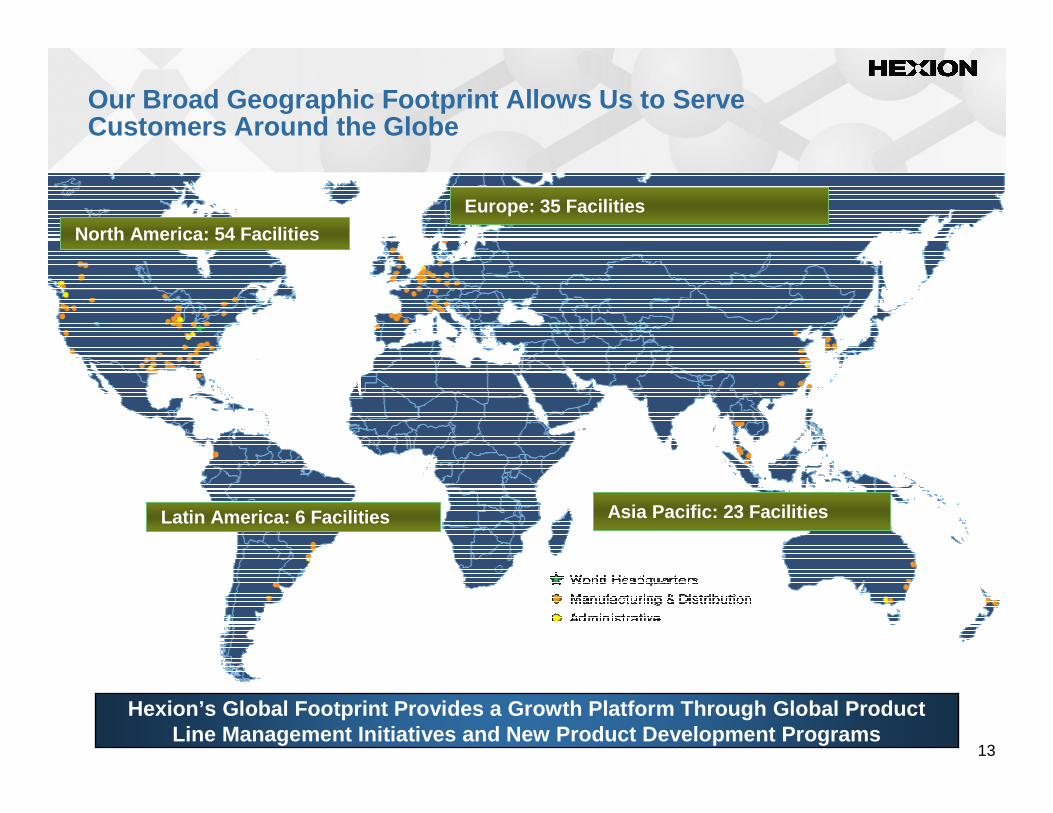
Asia Pacific: 23 Facilities
North America: 54 Facilities
Europe: 35 Facilities
Latin America: 6 Facilities
Our Broad Geographic Footprint Allows Us to Serve Customers Around the Globe
Hexion’s Global Footprint Provides a Growth Platfor m Through Global Product Line Management Initiatives and New Product Developm ent Programs
14
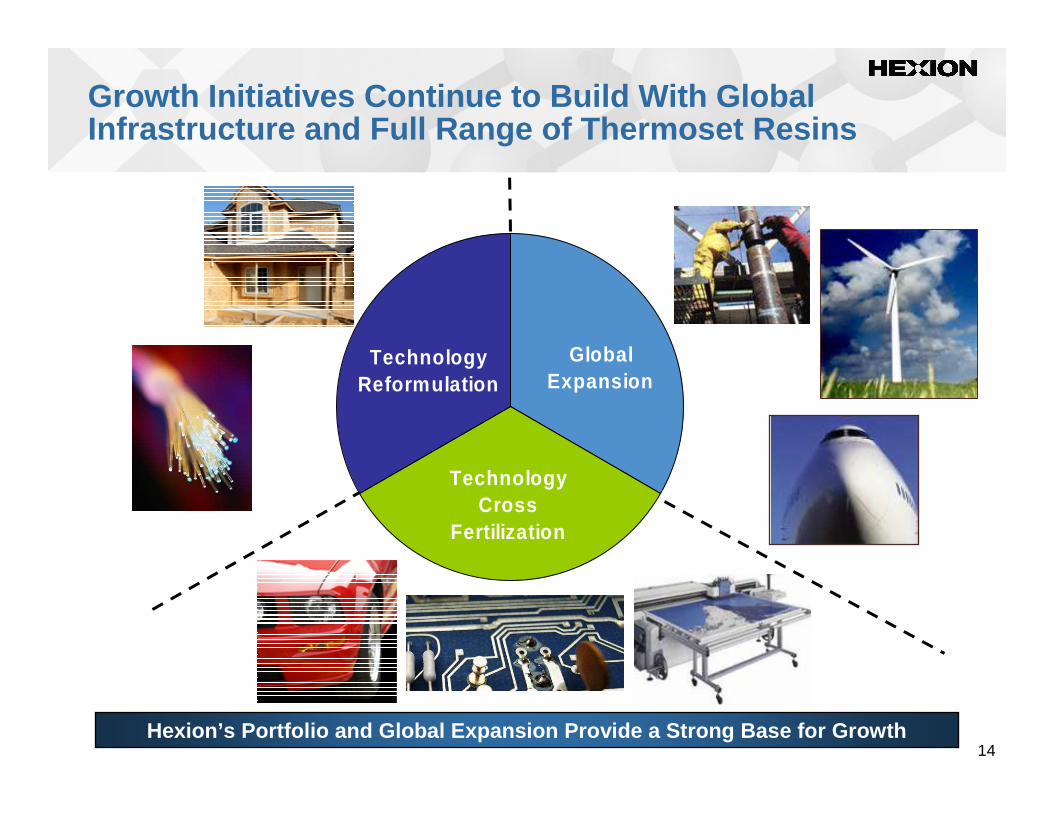
Technology Reformulation
Global Expansion
Technology Cross
Fertilization
Growth Initiatives Continue to Build With Global Infrastructure and Full Range of Thermoset Resins
Hexion’s Portfolio and Global Expansion Provide a S trong Base for Growth
15
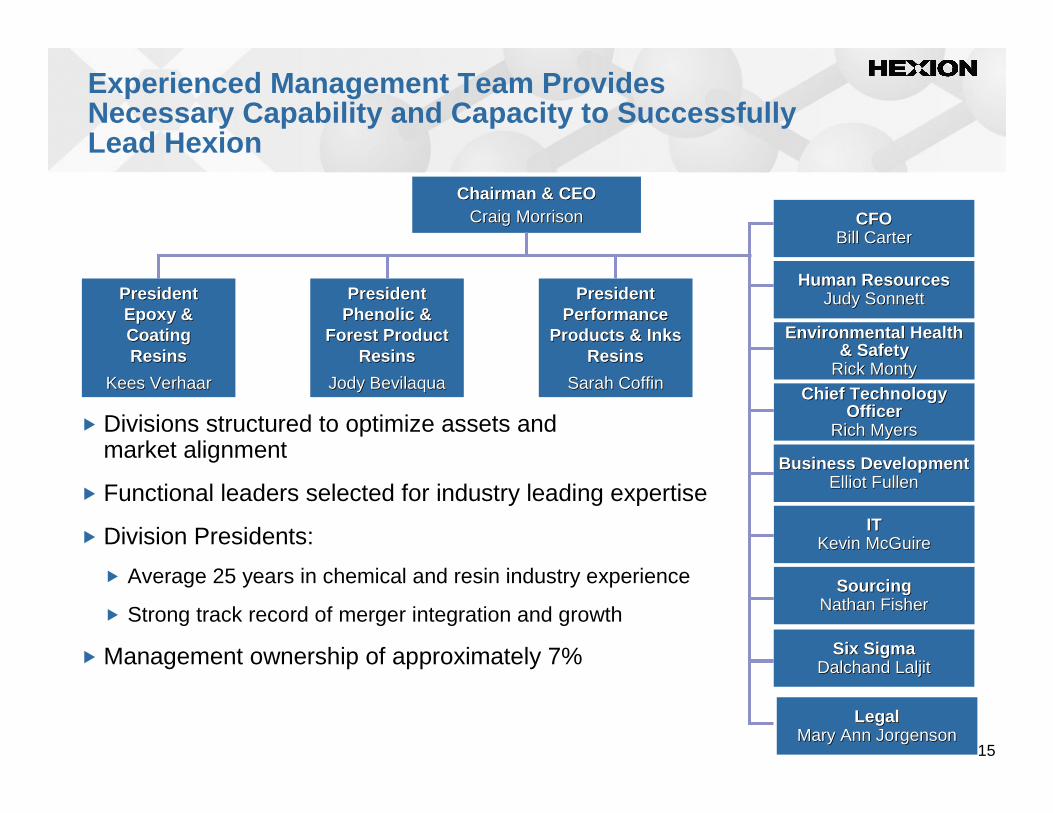
Experienced Management Team Provides Necessary Capability and Capacity to Successfully Lead Hexion
� Divisions structured to optimize assets and market alignment
� Functional leaders selected for industry leading expertise
� Division Presidents:
� Average 25 years in chemical and resin industry experience
� Strong track record of merger integration and growth
� Management ownership of approximately 7%
Chairman & CEOChairman & CEOCraig MorrisonCraig Morrison CFOCFO
Bill CarterBill Carter
Human ResourcesHuman ResourcesJudy Judy SonnettSonnett
ITITKevin McGuireKevin McGuire
SourcingSourcingNathan FisherNathan Fisher
Business DevelopmentBusiness DevelopmentElliot Elliot FullenFullen
Environmental Health Environmental Health & Safety& Safety
Rick MontyRick Monty
Chief Technology Chief Technology OfficerOfficer
Rich MyersRich Myers
President President Performance Performance
Products & Inks Products & Inks ResinsResins
Sarah CoffinSarah Coffin
President President Phenolic & Phenolic &
Forest Product Forest Product Resins Resins
Jody BevilaquaJody Bevilaqua
PresidentPresidentEpoxy & Epoxy & Coating Coating ResinsResins
Kees VerhaarKees Verhaar
Six SigmaSix SigmaDalchandDalchand LaljitLaljit
LegalLegalMary Ann JorgensonMary Ann Jorgenson
16
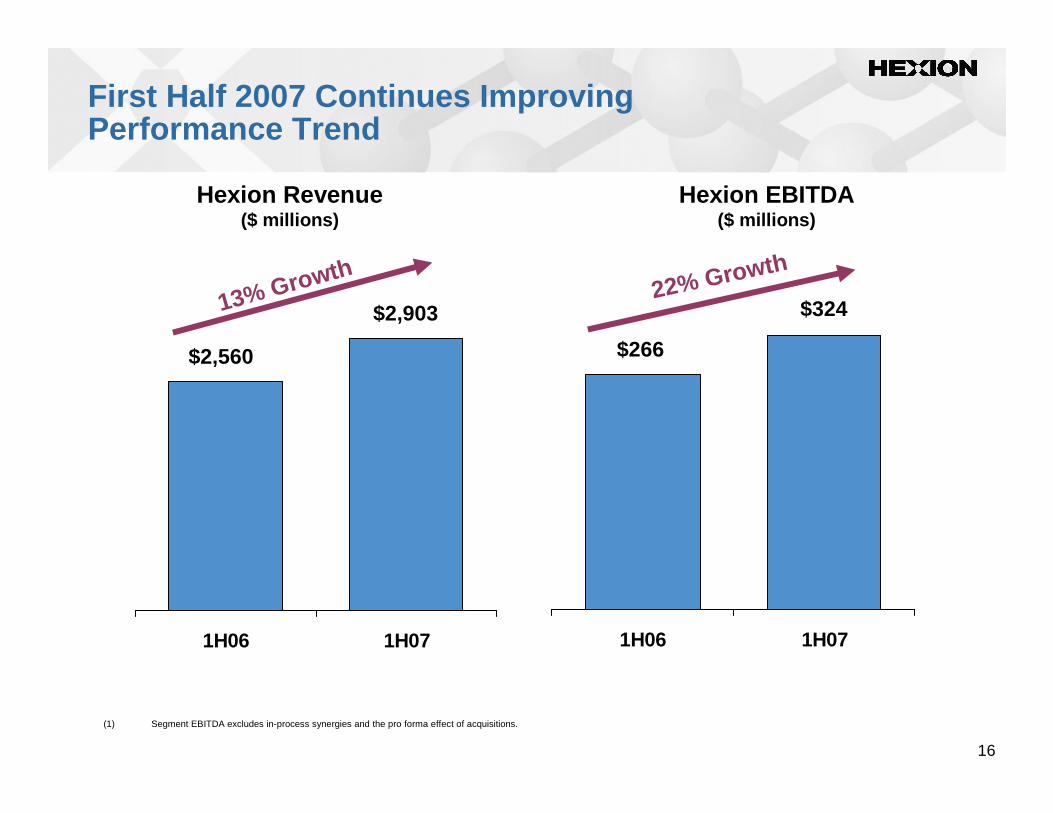
First Half 2007 Continues Improving Performance Trend
1H06 1H07 1H06 1H07
(1) Segment EBITDA excludes in-process synergies and the pro forma effect of acquisitions.
13% Growth22% Growth
$2,560
$324
$266
$2,903
Hexion Revenue($ millions)
Hexion EBITDA($ millions)
17
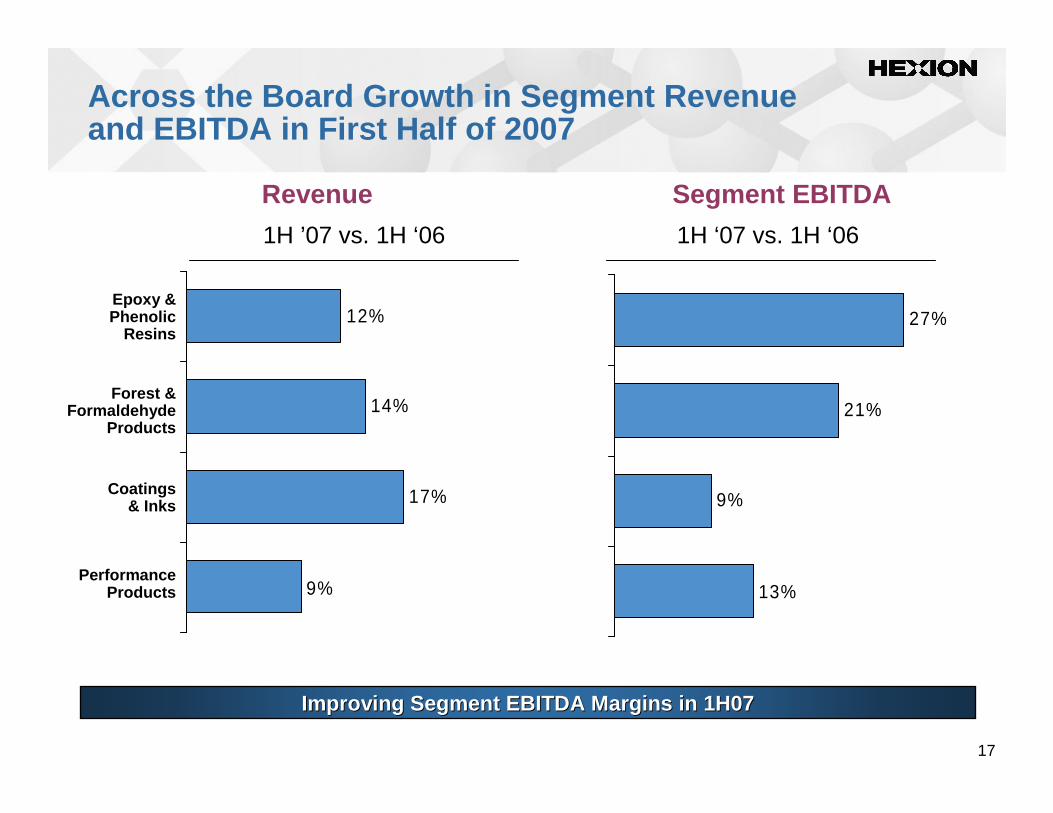
13%
27%
9%
21%14%
17%
12%
9%
Across the Board Growth in Segment Revenue and EBITDA in First Half of 2007
Segment EBITDA
1H ’07 vs. 1H ‘06 1H ‘07 vs. 1H ‘06
Improving Segment EBITDA Margins in 1H07Improving Segment EBITDA Margins in 1H07
Revenue
Performance Products
Coatings& Inks
Forest & Formaldehyde
Products
Epoxy & Phenolic
Resins
Financial Review
William CarterExecutive Vice President & Chief Financial Officer
19
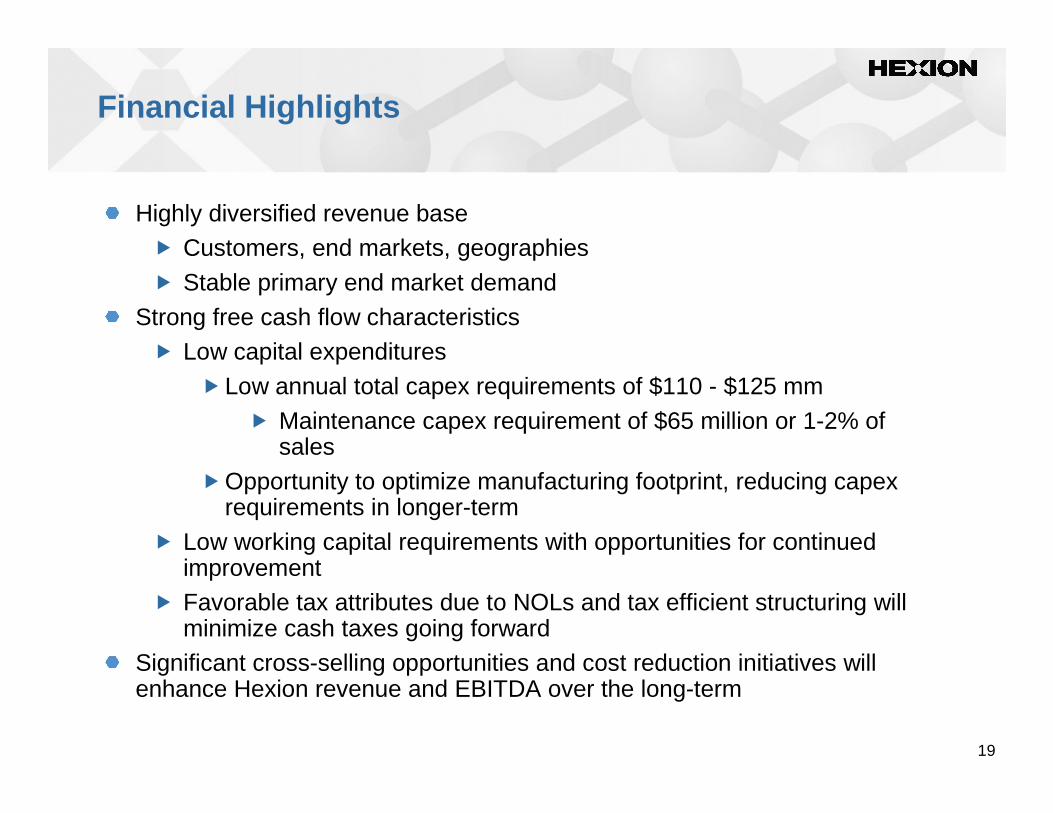
Financial Highlights
Highly diversified revenue base� Customers, end markets, geographies
� Stable primary end market demand
Strong free cash flow characteristics� Low capital expenditures
�Low annual total capex requirements of $110 - $125 mm
� Maintenance capex requirement of $65 million or 1-2% of sales
�Opportunity to optimize manufacturing footprint, reducing capex requirements in longer-term
� Low working capital requirements with opportunities for continued improvement
� Favorable tax attributes due to NOLs and tax efficient structuring will minimize cash taxes going forward
Significant cross-selling opportunities and cost reduction initiatives will enhance Hexion revenue and EBITDA over the long-term
20
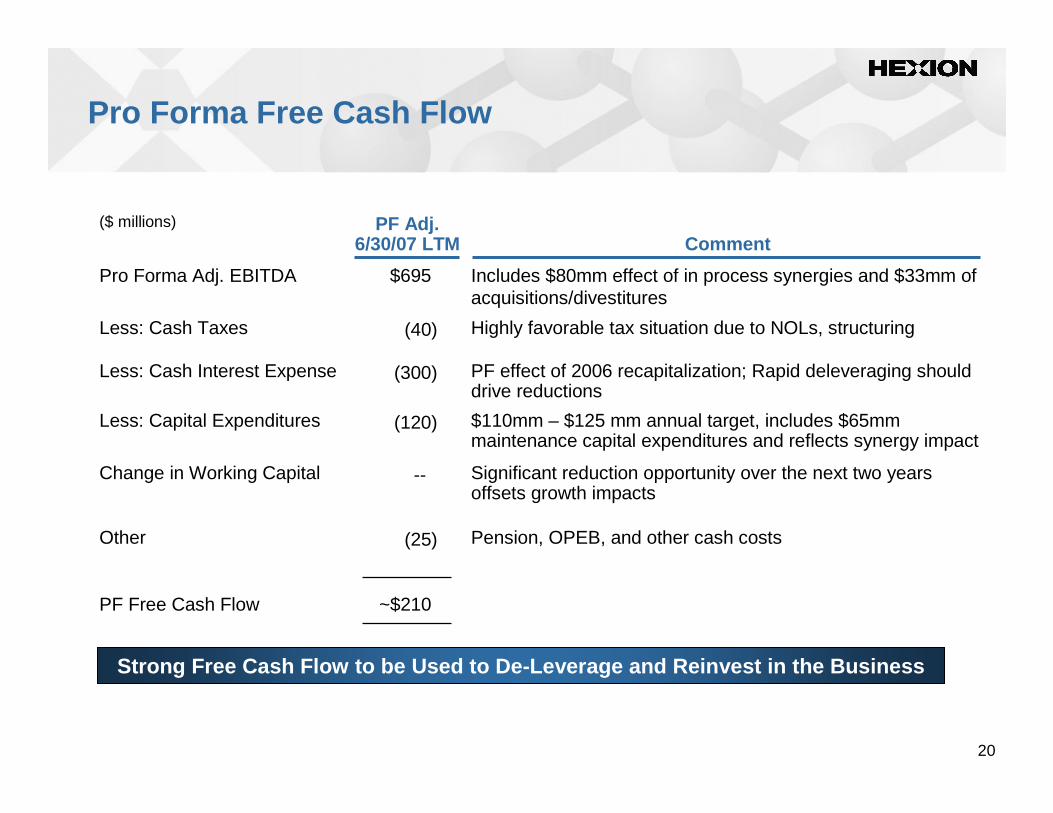
Pro Forma Free Cash Flow
Strong Free Cash Flow to be Used to De-Leverage and Reinvest in the Business
CommentPF Adj.
6/30/07 LTM($ millions)
~$210 PF Free Cash Flow
Pension, OPEB, and other cash costs(25)Other
Significant reduction opportunity over the next two years offsets growth impacts
--Change in Working Capital
$110mm – $125 mm annual target, includes $65mm maintenance capital expenditures and reflects synergy impact
(120)Less: Capital Expenditures
PF effect of 2006 recapitalization; Rapid deleveraging should drive reductions
(300)Less: Cash Interest Expense
Highly favorable tax situation due to NOLs, structuring(40)Less: Cash Taxes
Includes $80mm effect of in process synergies and $33mm of acquisitions/divestitures
$695Pro Forma Adj. EBITDA
21
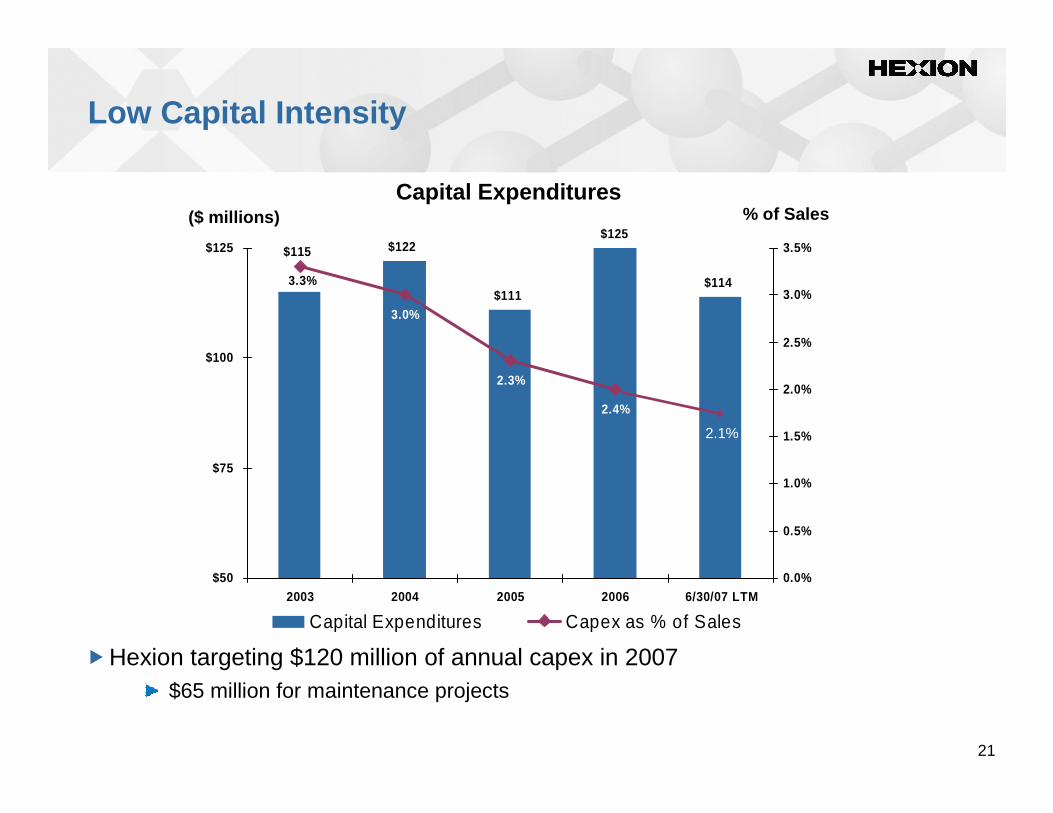
Low Capital Intensity
�Hexion targeting $120 million of annual capex in 2007$65 million for maintenance projects
Capital Expenditures
$122
$114$111
$115$125
2.4%
3.3%
2.3%
3.0%
$50
$75
$100
$125
2003 2004 2005 2006 6/30/07 LTM0.0%
0.5%
1.0%
1.5%
2.0%
2.5%
3.0%
3.5%
Capital Expenditures Capex as % of Sales
($ millions) % of Sales
2.1%
22
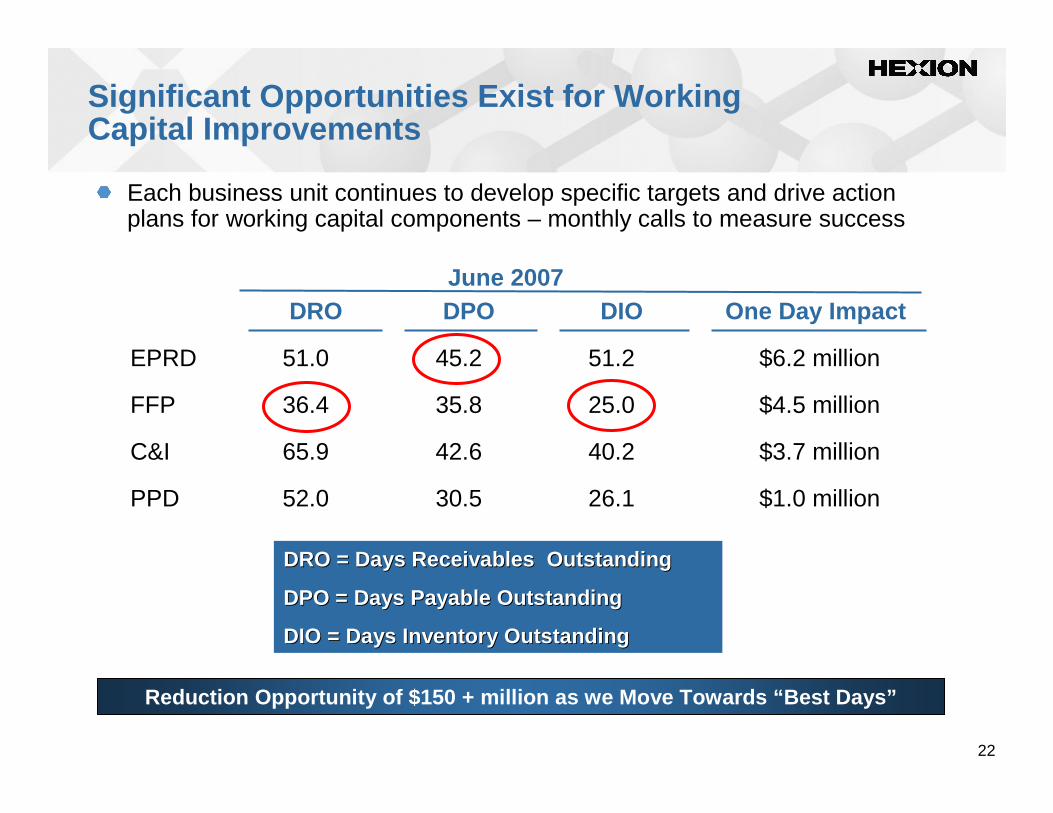
DRO = Days Receivables OutstandingDRO = Days Receivables Outstanding
DPO = Days Payable OutstandingDPO = Days Payable Outstanding
DIO = Days Inventory OutstandingDIO = Days Inventory Outstanding
Significant Opportunities Exist for Working Capital Improvements
$1.0 million26.130.552.0PPD
$3.7 million40.242.665.9C&I
$4.5 million25.035.836.4FFP
$6.2 million51.245.251.0EPRD
One Day ImpactDIODPODROJune 2007
Reduction Opportunity of $150 + million as we Move T owards “Best Days”
Each business unit continues to develop specific targets and drive action plans for working capital components – monthly calls to measure success
23
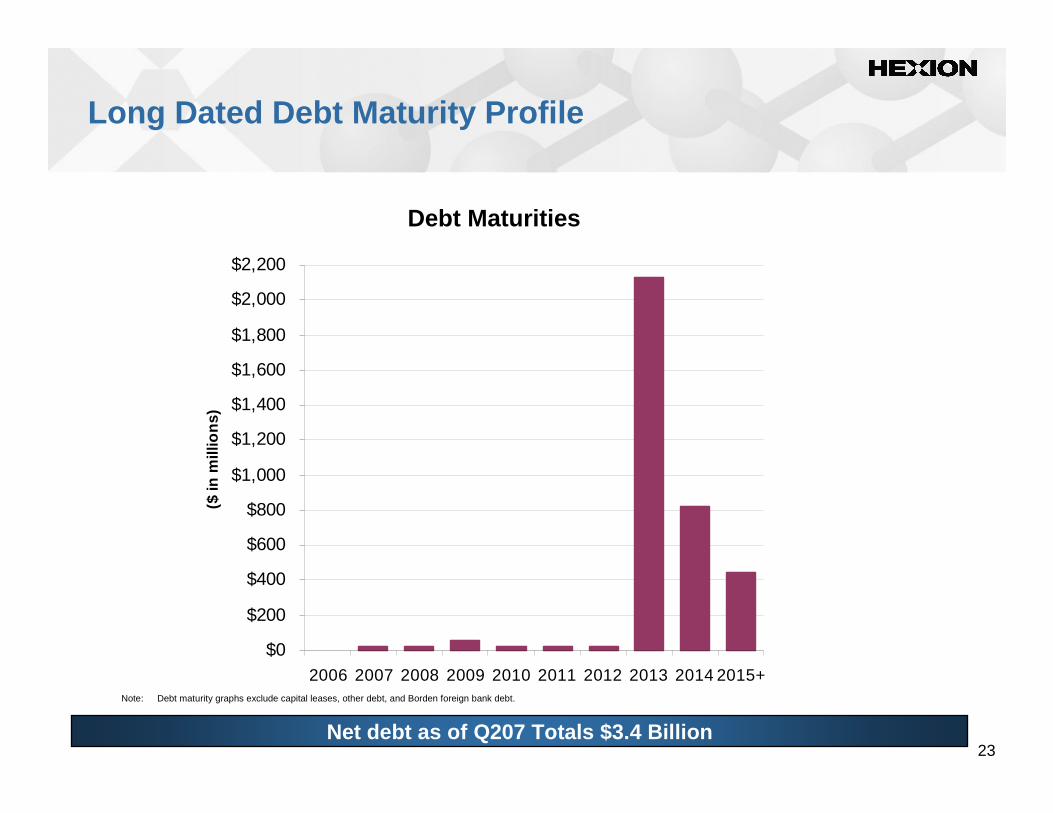
Long Dated Debt Maturity Profile
Debt Maturities
Note: Debt maturity graphs exclude capital leases, other debt, and Borden foreign bank debt.
Net debt as of Q207 Totals $3.4 Billion
$0
$200
$400
$600
$800
$1,000
$1,200
$1,400
$1,600
$1,800
$2,000
$2,200
2006 2007 2008 2009 2010 2011 2012 2013 2014 2015+
($ in
mill
ions
)
24
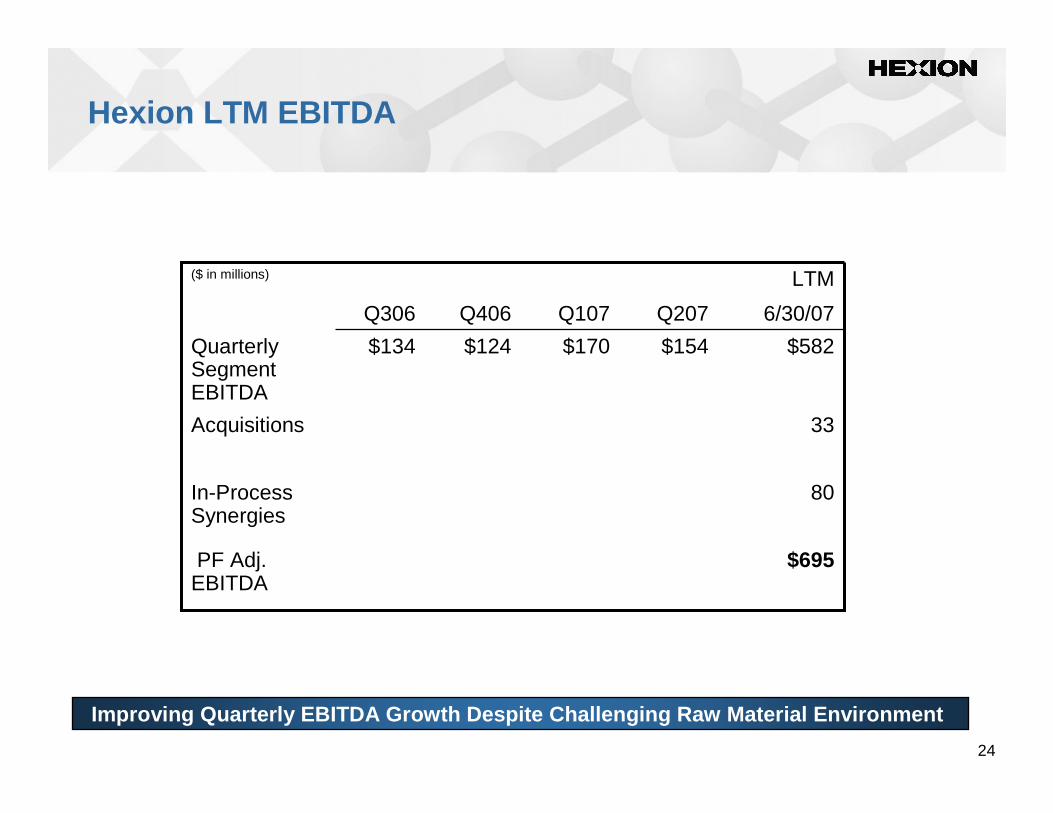
Hexion LTM EBITDA
33Acquisitions
80In-Process Synergies
$170
Q107
$695PF Adj. EBITDA
Quarterly Segment EBITDA
($ in millions)
$582$154$124$134
6/30/07Q207Q406Q306
LTM
Improving Quarterly EBITDA Growth Despite Challengi ng Raw Material Environment
25
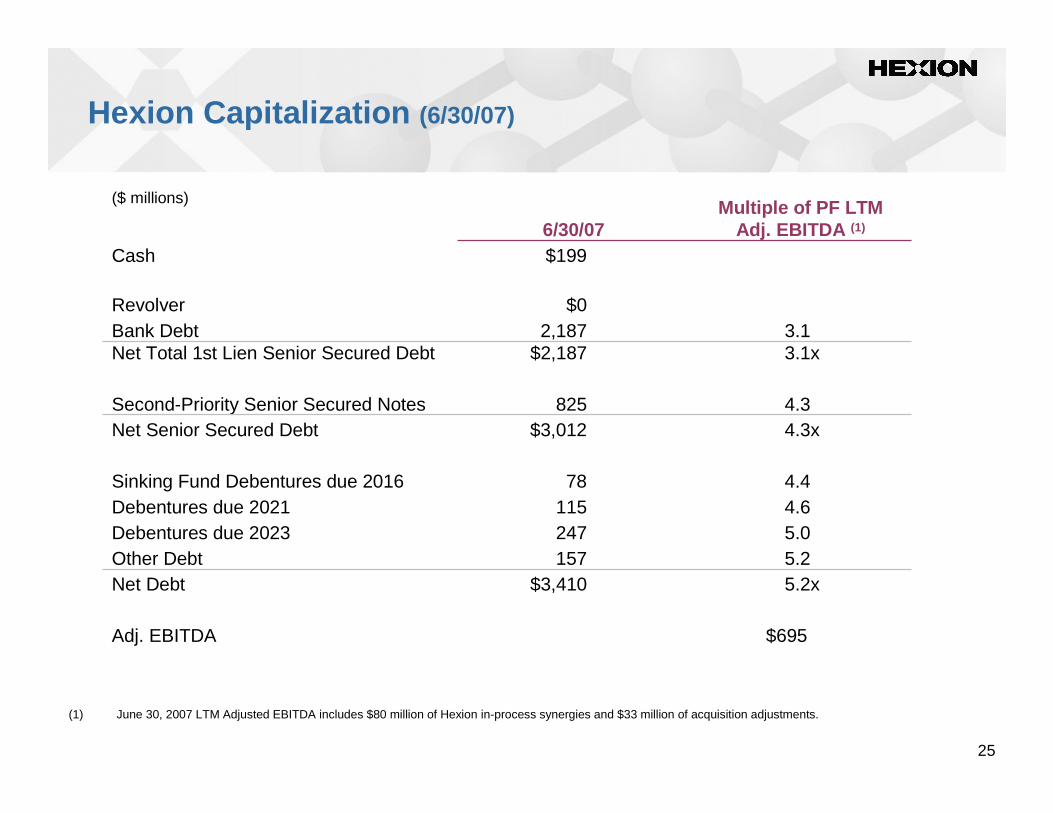
Hexion Capitalization (6/30/07)
$695Adj. EBITDA
5.2x $3,410 Net Debt5.2157Other Debt5.0247Debentures due 20234.6115Debentures due 20214.478Sinking Fund Debentures due 2016
4.3x $3,012Net Senior Secured Debt4.3825Second-Priority Senior Secured Notes
3.1x$2,187 Net Total 1st Lien Senior Secured Debt3.12,187Bank Debt
$0 Revolver
$199 Cash
Multiple of PF LTMAdj. EBITDA (1)6/30/07
($ millions)
(1) June 30, 2007 LTM Adjusted EBITDA includes $80 million of Hexion in-process synergies and $33 million of acquisition adjustments.
Transaction Update
Craig O. Morrison
27
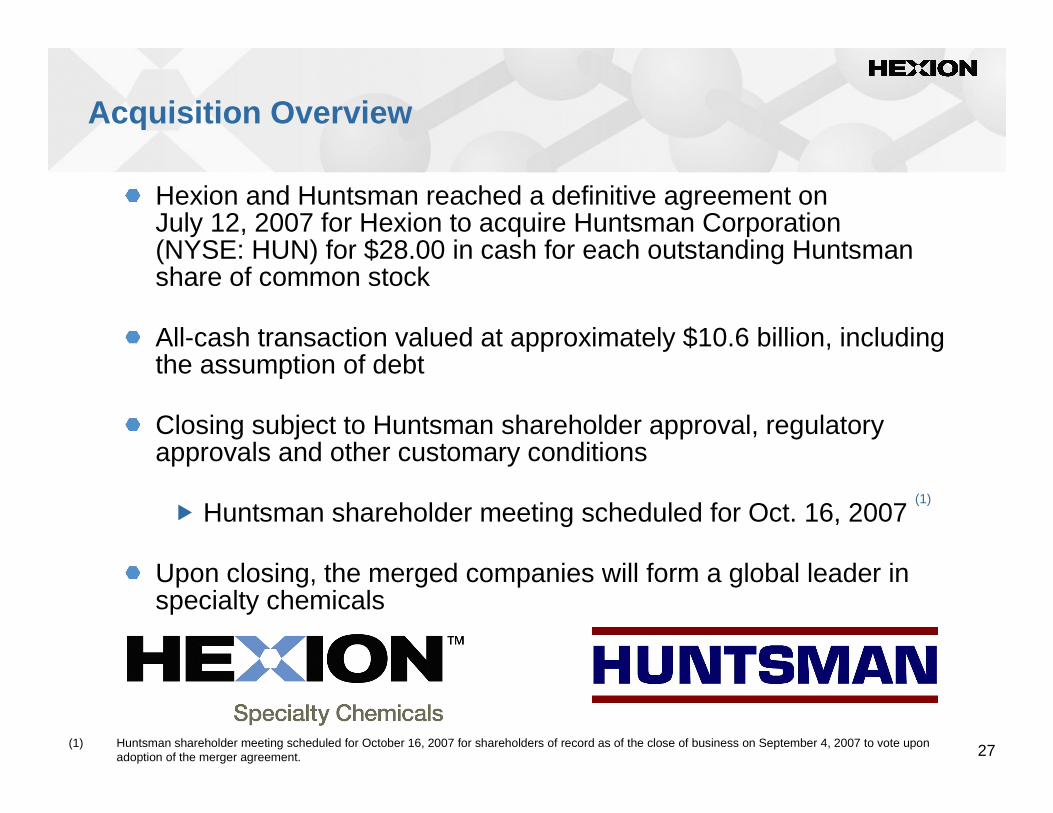
Acquisition Overview
Hexion and Huntsman reached a definitive agreement on July 12, 2007 for Hexion to acquire Huntsman Corporation (NYSE: HUN) for $28.00 in cash for each outstanding Huntsman share of common stock
All-cash transaction valued at approximately $10.6 billion, including the assumption of debt
Closing subject to Huntsman shareholder approval, regulatory approvals and other customary conditions
� Huntsman shareholder meeting scheduled for Oct. 16, 2007
Upon closing, the merged companies will form a global leader in specialty chemicals
(1) Huntsman shareholder meeting scheduled for October 16, 2007 for shareholders of record as of the close of business on September 4, 2007 to vote upon adoption of the merger agreement.
(1)
28
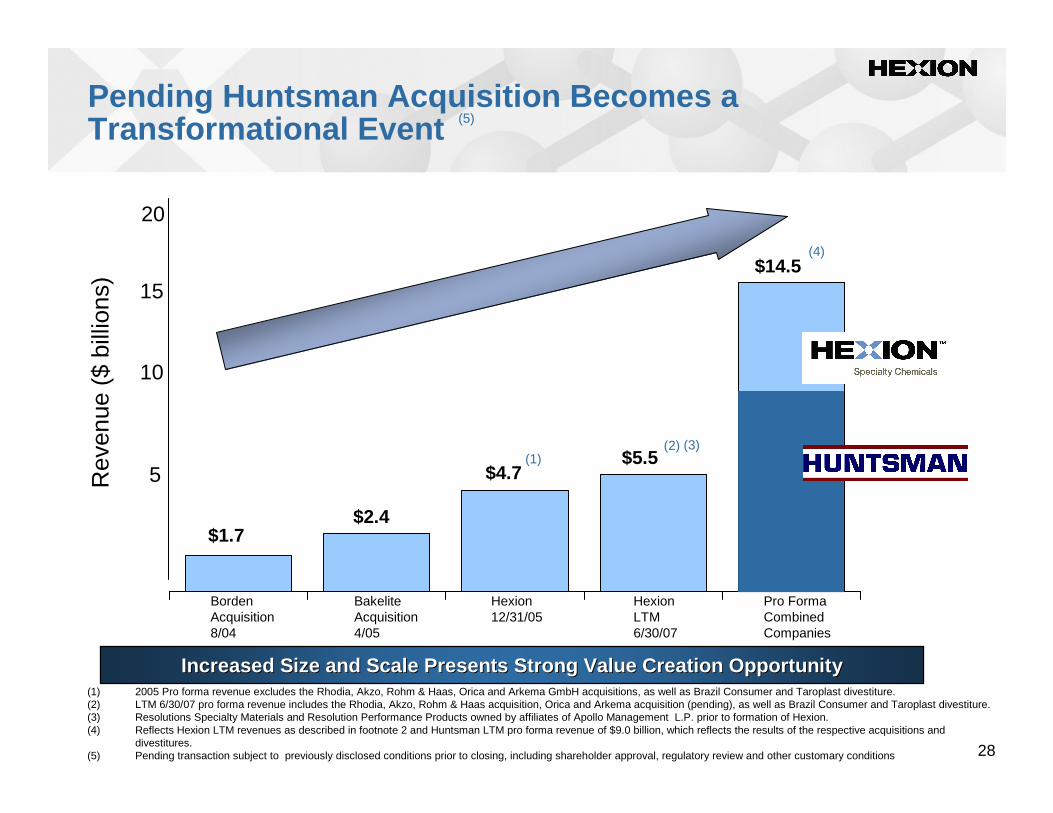
Pending Huntsman Acquisition Becomes a Transformational Event
Rev
enue
($
billi
ons)
Increased Size and Scale Presents Strong Value Crea tion OpportunIncreased Size and Scale Presents Strong Value Crea tion Opportun ityity(1) 2005 Pro forma revenue excludes the Rhodia, Akzo, Rohm & Haas, Orica and Arkema GmbH acquisitions, as well as Brazil Consumer and Taroplast divestiture.(2) LTM 6/30/07 pro forma revenue includes the Rhodia, Akzo, Rohm & Haas acquisition, Orica and Arkema acquisition (pending), as well as Brazil Consumer and Taroplast divestiture.(3) Resolutions Specialty Materials and Resolution Performance Products owned by affiliates of Apollo Management L.P. prior to formation of Hexion.(4) Reflects Hexion LTM revenues as described in footnote 2 and Huntsman LTM pro forma revenue of $9.0 billion, which reflects the results of the respective acquisitions and
divestitures.(5) Pending transaction subject to previously disclosed conditions prior to closing, including shareholder approval, regulatory review and other customary conditions
$4.7$5.5(1)
(2)
$2.4$1.7
$14.5 (4)
a
Aaa
Aa
20
10
Borden Acquisition8/04
Bakelite Acquisition4/05
Hexion12/31/05
HexionLTM6/30/07
Pro FormaCombinedCompanies
5
15
(5)
(3)
29
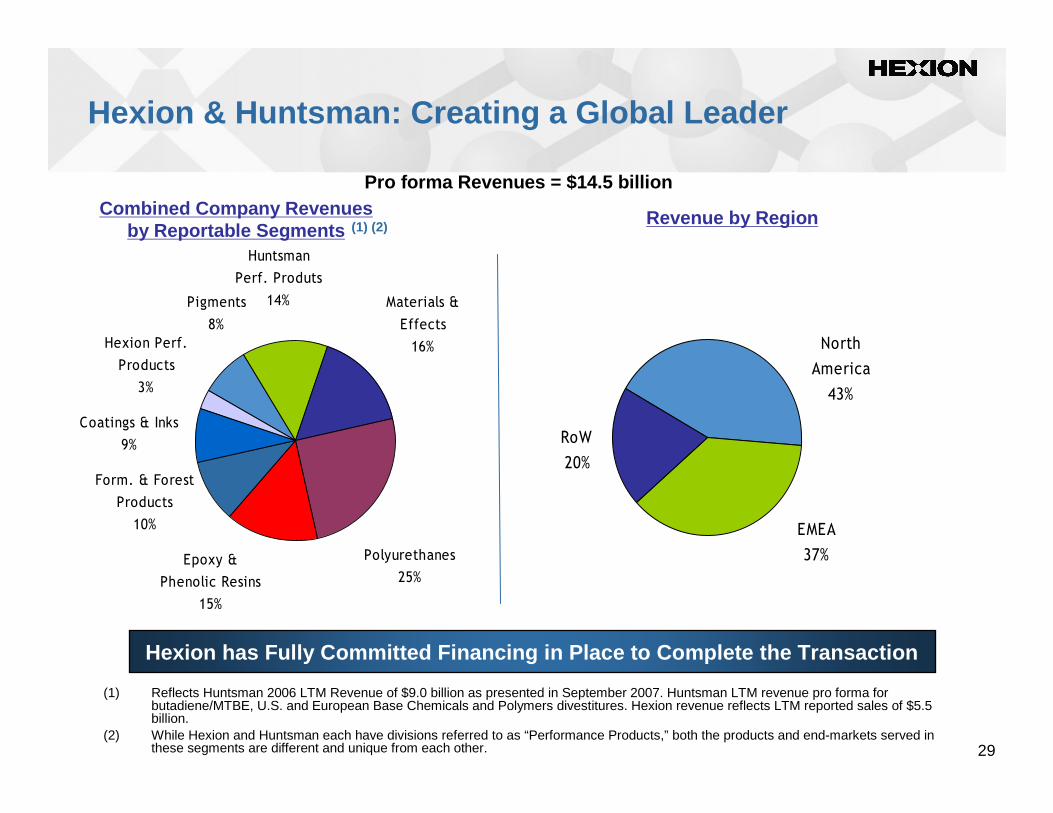
Epoxy &
Phenolic Resins
15%
Form. & Forest
Products
10%
Coatings & Inks
9%
Hexion Perf.
Products
3%
Pigments
8%
Huntsman
Perf. Produts
14% Materials &
Effects
16%
Polyurethanes
25%
Hexion & Huntsman: Creating a Global Leader
EMEA
37%
North
America
43%
RoW
20%
Pro forma Revenues = $14.5 billion
Revenue by Region
Hexion has Fully Committed Financing in Place to Co mplete the Transaction
(1) Reflects Huntsman 2006 LTM Revenue of $9.0 billion as presented in September 2007. Huntsman LTM revenue pro forma for butadiene/MTBE, U.S. and European Base Chemicals and Polymers divestitures. Hexion revenue reflects LTM reported sales of $5.5 billion.
(2) While Hexion and Huntsman each have divisions referred to as “Performance Products,” both the products and end-markets served in these segments are different and unique from each other.
Combined Company Revenues by Reportable Segments (1) (2)
30
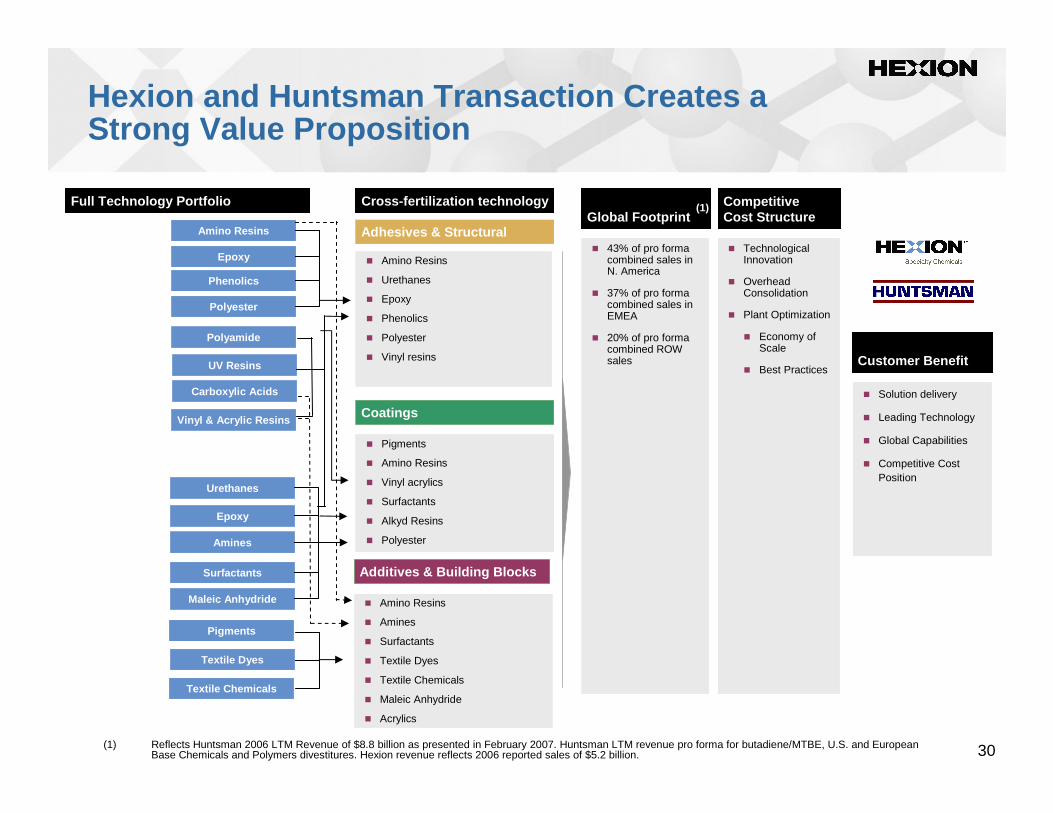
Hexion and Huntsman Transaction Creates a Strong Value Proposition
Adhesives & StructuralAdhesives & Structural
Cross-fertilization technologyCross-fertilization technology
Global FootprintGlobal Footprint
� 43% of pro forma combined sales in N. America
� 37% of pro forma combined sales in EMEA
� 20% of pro forma combined ROW sales
� Amino Resins
� Urethanes
� Epoxy
� Phenolics
� Polyester
� Vinyl resins
CoatingsCoatings
Full Technology PortfolioFull Technology Portfolio
� Pigments
� Amino Resins
� Vinyl acrylics
� Surfactants
� Alkyd Resins
� Polyester
Polyamide
UV Resins
Carboxylic Acids
Maleic Anhydride
Surfactants
Amines
Epoxy
Urethanes
Amino Resins
Epoxy
Phenolics
Polyester
Customer BenefitCustomer Benefit
� Solution delivery
� Leading Technology
� Global Capabilities
� Competitive Cost Position
Competitive Cost Structure
Competitive Cost Structure
� Technological Innovation
� Overhead Consolidation
� Plant Optimization
� Economy of Scale
� Best Practices
(1)
Pigments
Textile Dyes
Textile Chemicals
Vinyl & Acrylic Resins
Additives & Building BlocksAdditives & Building Blocks
� Amino Resins
� Amines
� Surfactants
� Textile Dyes
� Textile Chemicals
� Maleic Anhydride
� Acrylics
(1) Reflects Huntsman 2006 LTM Revenue of $8.8 billion as presented in February 2007. Huntsman LTM revenue pro forma for butadiene/MTBE, U.S. and European Base Chemicals and Polymers divestitures. Hexion revenue reflects 2006 reported sales of $5.2 billion.
31
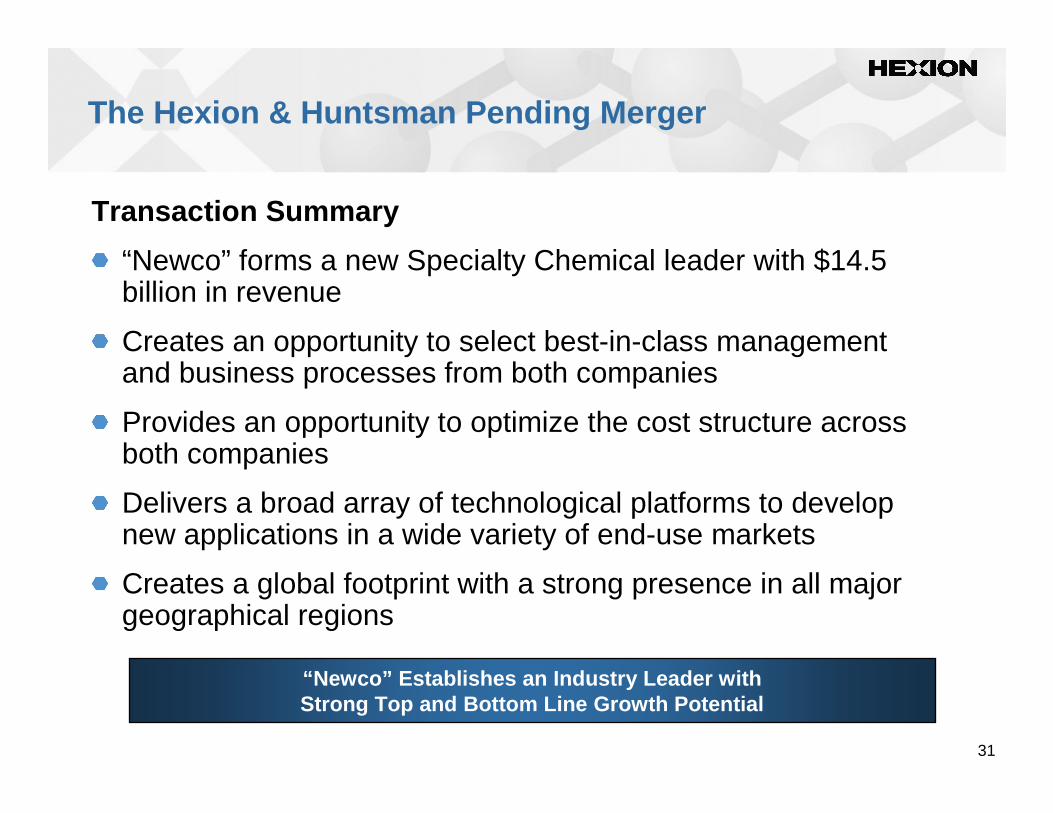
The Hexion & Huntsman Pending Merger
Transaction Summary
“Newco” forms a new Specialty Chemical leader with $14.5 billion in revenue
Creates an opportunity to select best-in-class management and business processes from both companies
Provides an opportunity to optimize the cost structure across both companies
Delivers a broad array of technological platforms to develop new applications in a wide variety of end-use markets
Creates a global footprint with a strong presence in all major geographical regions
“Newco” Establishes an Industry Leader with Strong Top and Bottom Line Growth Potential
Summary
Craig O. Morrison
33
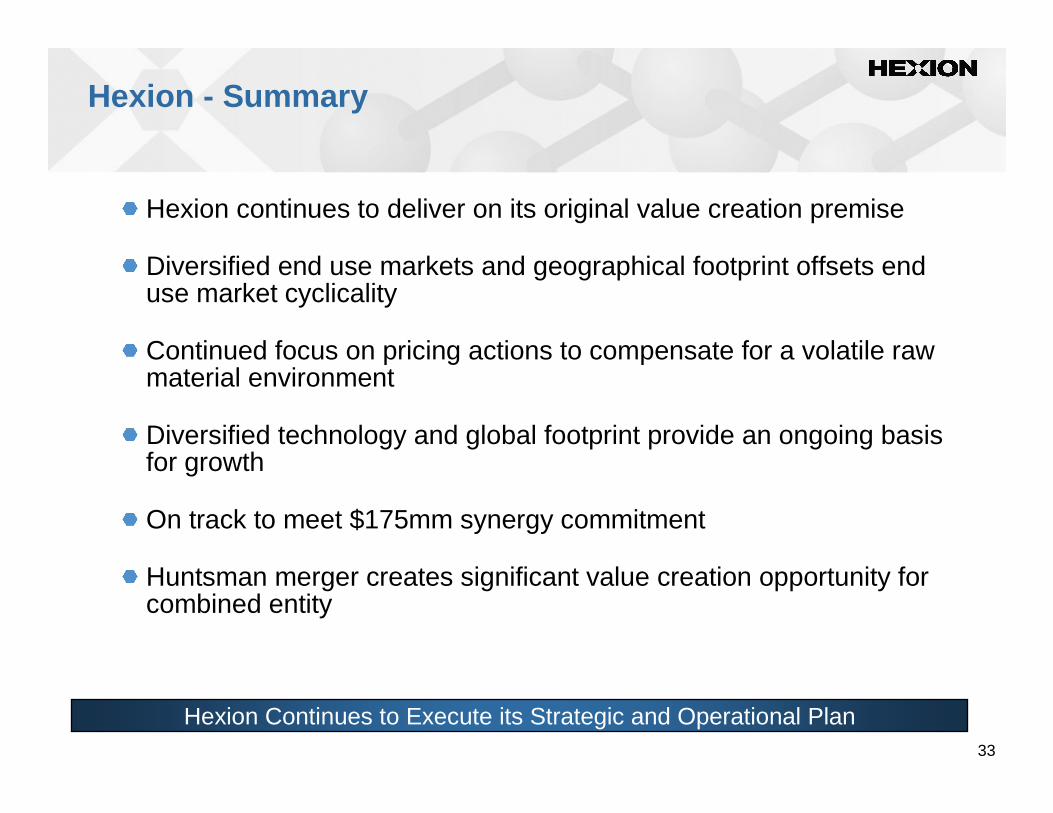
Hexion - Summary
Hexion continues to deliver on its original value creation premise
Diversified end use markets and geographical footprint offsets end use market cyclicality
Continued focus on pricing actions to compensate for a volatile raw material environment
Diversified technology and global footprint provide an ongoing basis for growth
On track to meet $175mm synergy commitment
Huntsman merger creates significant value creation opportunity for combined entity
Hexion Continues to Execute its Strategic and Operational Plan
Appendices
35
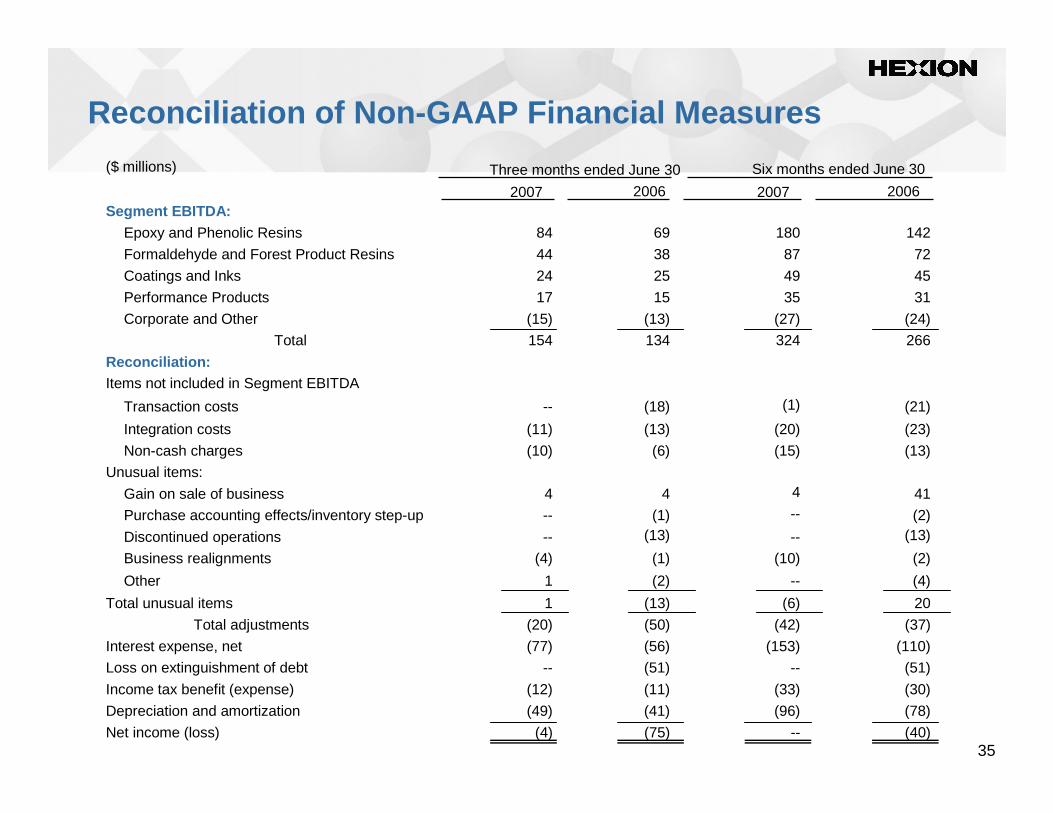
Reconciliation of Non-GAAP Financial Measures
(51)--(51)--Loss on extinguishment of debt
(2)(10)(1)(4)Business realignments
--
4
--
(40) --(75) (4) Net income (loss)
(78)(96)(41)(49)Depreciation and amortization
(30)(33)(11)(12)Income tax benefit (expense)
(110)(153)(56)(77)Interest expense, net
(37) (42)(50) (20)Total adjustments
20 (6)(13) 1Total unusual items
(4)--(2)1Other
(13)--(13)--Discontinued operations
(2)--(1)Purchase accounting effects/inventory step-up
41 44 Gain on sale of business
Unusual items:
(13)(15)(6)(10)Non-cash charges
(23)(20)(13)(11)Integration costs
(21)(1)(18)Transaction costs
Items not included in Segment EBITDA
Reconciliation:266 324 134 154 Total
(24)(27)(13)(15)Corporate and Other
3135 15 17 Performance Products
45 49 25 24 Coatings and Inks
72 87 38 44 Formaldehyde and Forest Product Resins
142 180 69 84 Epoxy and Phenolic Resins
Segment EBITDA:2006200720062007
Six months ended June 30Three months ended June 30($ millions)
36
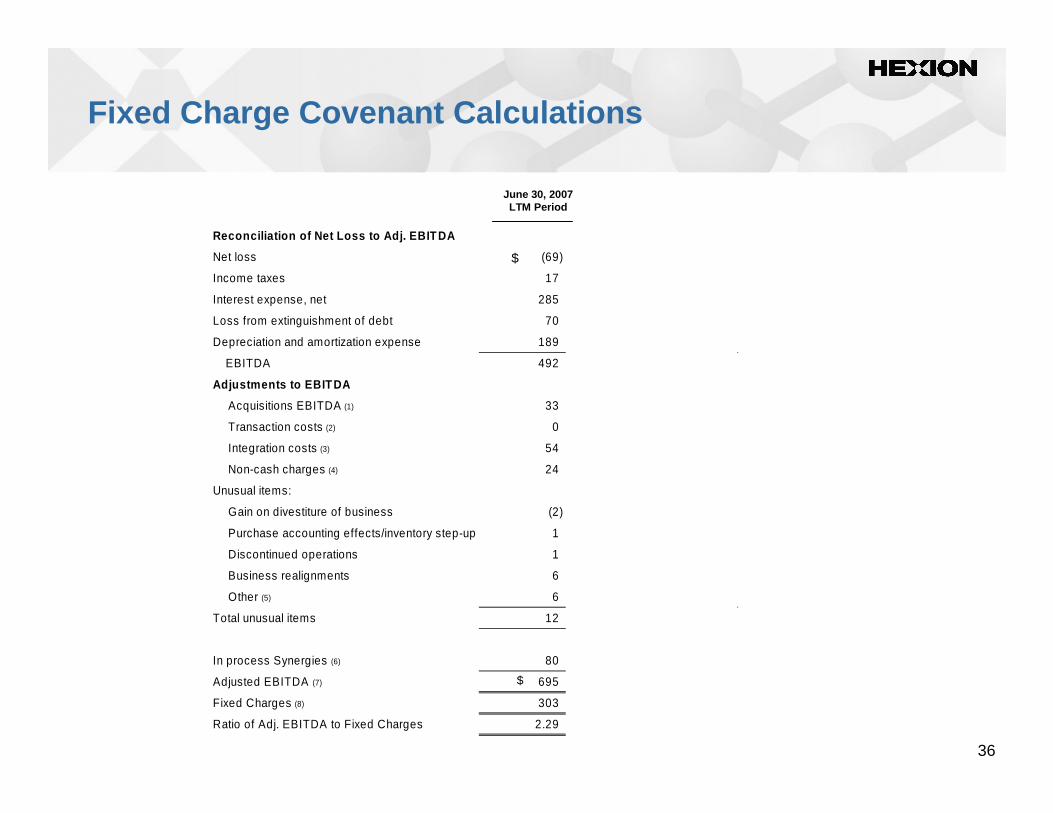
Reconciliation of Net Loss to Adj. EBIT DA
Net loss (69)
Income taxes 17
Interest expense, net 285
Loss from extinguishment of debt 70
Depreciation and amortization expense 189
EBITDA 492
Adjustments to EBIT DA
Acquisitions EBITDA (1) 33
Transaction costs (2) 0
Integration costs (3) 54
Non-cash charges (4) 24
Unusual items:
Gain on divestiture of business (2)
Purchase accounting effects/inventory step-up 1
Discontinued operations 1
Business realignments 6
Other (5) 6
Total unusual items 12
In process Synergies (6) 80
Adjusted EBITDA (7) 695
Fixed Charges (8) 303
Ratio of Adj. EBITDA to Fixed Charges 2.29
$
Fixed Charge Covenant Calculations
June 30, 2007LTM Period
$
37
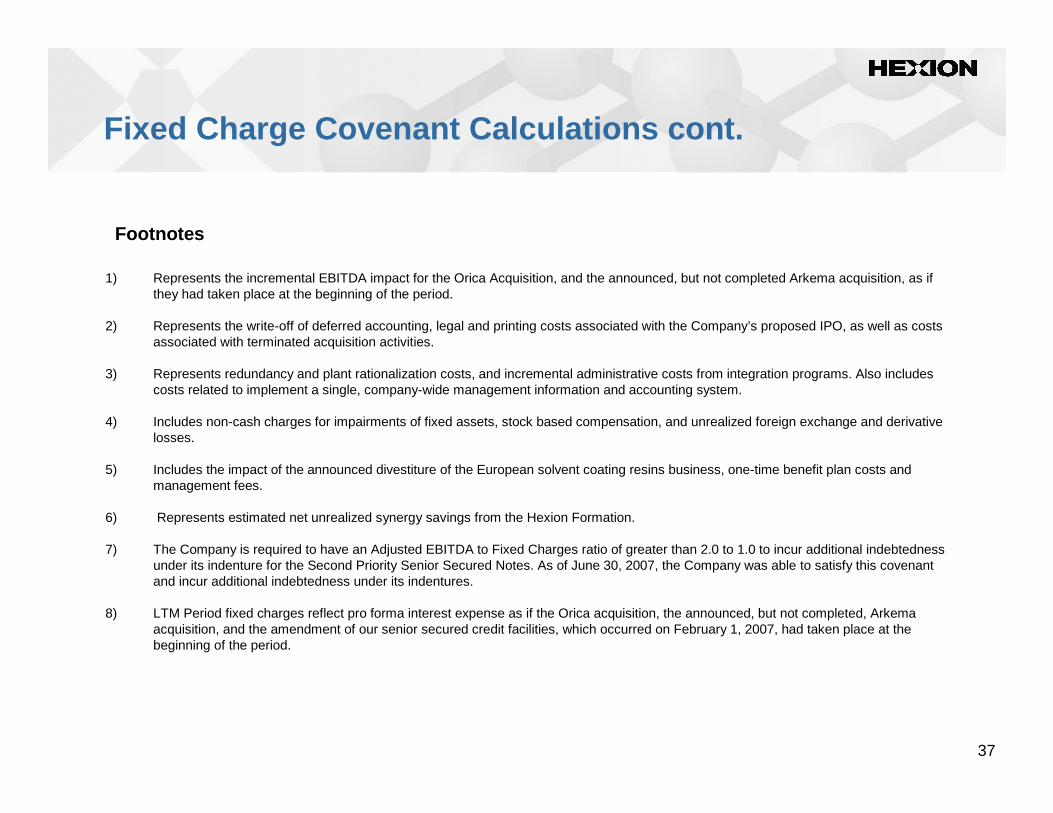
Fixed Charge Covenant Calculations cont.
Footnotes
1) Represents the incremental EBITDA impact for the Orica Acquisition, and the announced, but not completed Arkema acquisition, as if they had taken place at the beginning of the period.
2) Represents the write-off of deferred accounting, legal and printing costs associated with the Company’s proposed IPO, as well as costs associated with terminated acquisition activities.
3) Represents redundancy and plant rationalization costs, and incremental administrative costs from integration programs. Also includes costs related to implement a single, company-wide management information and accounting system.
4) Includes non-cash charges for impairments of fixed assets, stock based compensation, and unrealized foreign exchange and derivative losses.
5) Includes the impact of the announced divestiture of the European solvent coating resins business, one-time benefit plan costs and management fees.
6) Represents estimated net unrealized synergy savings from the Hexion Formation.
7) The Company is required to have an Adjusted EBITDA to Fixed Charges ratio of greater than 2.0 to 1.0 to incur additional indebtedness under its indenture for the Second Priority Senior Secured Notes. As of June 30, 2007, the Company was able to satisfy this covenant and incur additional indebtedness under its indentures.
8) LTM Period fixed charges reflect pro forma interest expense as if the Orica acquisition, the announced, but not completed, Arkemaacquisition, and the amendment of our senior secured credit facilities, which occurred on February 1, 2007, had taken place at the beginning of the period.
38
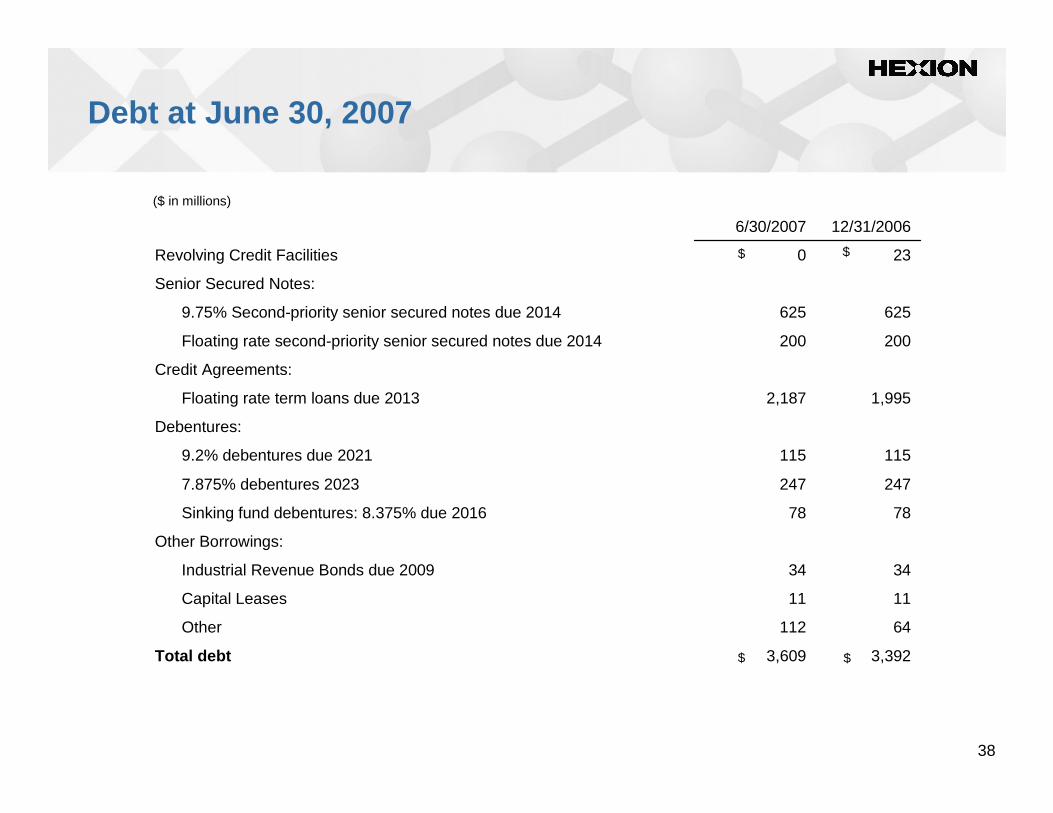
Debt at June 30, 2007
6256259.75% Second-priority senior secured notes due 2014
200200Floating rate second-priority senior secured notes due 2014
3,609
112
11
34
78
247
115
2,187
0
6/30/2007
3,392Total debt
64Other
11Capital Leases
34Industrial Revenue Bonds due 2009
Other Borrowings:
78Sinking fund debentures: 8.375% due 2016
2477.875% debentures 2023
1159.2% debentures due 2021
Debentures:
1,995Floating rate term loans due 2013
Credit Agreements:
Senior Secured Notes:
23Revolving Credit Facilities
12/31/2006
($ in millions)
$ $
$ $