Embed Size (px)
Citation preview
1
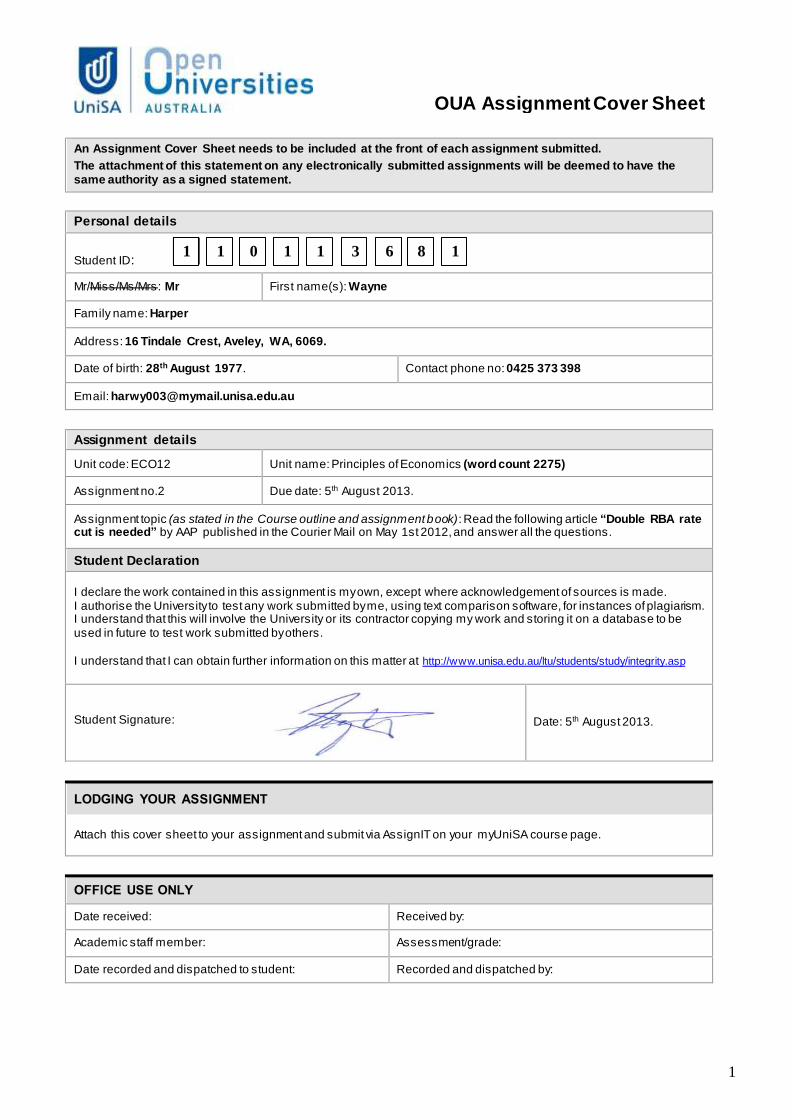
OUA Assignment Cover Sheet
An Assignment Cover Sheet needs to be included at the front of each assignment submitted.
The attachment of this statement on any electronically submitted assignments will be deemed to have the same authority as a signed statement.
Personal details
Student ID:
Mr/Miss/Ms/Mrs: Mr First name(s): Wayne
Family name: Harper
Address: 16 Tindale Crest, Aveley, WA, 6069.
Date of birth: 28th August 1977. Contact phone no: 0425 373 398
Email: [email protected]
Assignment details
Unit code: ECO12 Unit name: Principles of Economics (word count 2275)
Assignment no.2 Due date: 5th August 2013.
Assignment topic (as stated in the Course outline and assignment book): Read the following article “Double RBA rate cut is needed” by AAP published in the Courier Mail on May 1st 2012, and answer all the questions.
Student Declaration
I declare the work contained in this assignment is my own, except where acknowledgement of sources is made. I authorise the University to test any work submitted by me, using text comparison software, for instances of plagiarism. I understand that this will involve the University or its contractor copying my work and storing it on a database to be used in future to test work submitted by others. I understand that I can obtain further information on this matter at http://www.unisa.edu.au/ltu/students/study/integrity.asp
Student Signature: Date: 5th August 2013.
LODGING YOUR ASSIGNMENT
Attach this cover sheet to your assignment and submit via AssignIT on your myUniSA course page.
OFFICE USE ONLY
Date received: Received by:
Academic staff member: Assessment/grade:
Date recorded and dispatched to student: Recorded and dispatched by:
1
1 0 1 1 3 6 8 1
2
Assessment feedback form
ECO12 — Macroeconomics 1 (2013)
Assignment 2 Name: Wayne Harper Unisa ID Number: 110113681
Key components of this assignment Performance on this component Comment
Excell-ent
Good Fair Poor Very Poor
Demonstrate effective use of some of the fundamental methods and tools of economics.
Apply elementary microeconomics and models in a new context.
Effective communication using appropriate economics terminology and models (usually in the form of diagrams), which are incorporated into your discussion.
Presentation and structure.
Summary comment
Assignment grade/mark
This form meets the 2013 requirements of UniSA’s Code of Good Practice: Student Assessment
3
‘Double RBA rate cut is needed’ Staff writers, AAP, 1st May 2012
A RETAILERS lobby group is pleading with the Reserve Bank of Australia (RBA) for a double
rate cut on Tuesday to help revive the industry.
The RBA is due to meet on Tuesday to decide whether to alter the 4.25 official cash rate, which it left
unchanged last month. The National Retail Association (NRA) said the battered retail sector needed the shock treatment of a
double rate cut to boost consumer spending.
"Most commentators seem to expect the RBA board will move to cut rates by at least 25 points,'' NRA executive director Gary Black said in a statement.
"What concerns the NRA is that the markets, commentators and even consumers will have factored this cut into their thinking already, and the official announcement will have little, if any, impact on
discretionary spending.
"This is compounded by doubts about whether banks will pass on a small cut in full, or at all. "If the RBA genuinely wants to stimulate activity in the economy by cutting rates, they should move
decisively and cut hard.''
Mr Black said household goods, clothing and footwear and department stores are struggling to get out of negative growth and trading conditions remain extremely difficult.
"There's no point sugar-coating the situation,'' he said. "Many retailers small and large have already disappeared and more will follow if the RBA doesn't
immediately relieve the stress on the retail sector.''
Q.1:
Two points are raised here. The first is – ‘What evidence is there..’ for the RBA to consider an interest rate fall? Referring to the article above, the NRA executive director Mr Gary Black raises
concerns by suggesting that “..household goods, clothing and footwear and department stores are struggling to get out of negative growth and trading conditions remain extremely difficult.”; and that there is little to no demand in the retail sector to the point that “Many retailers small and large
have already disappeared and more will follow..” (AAP 2012).
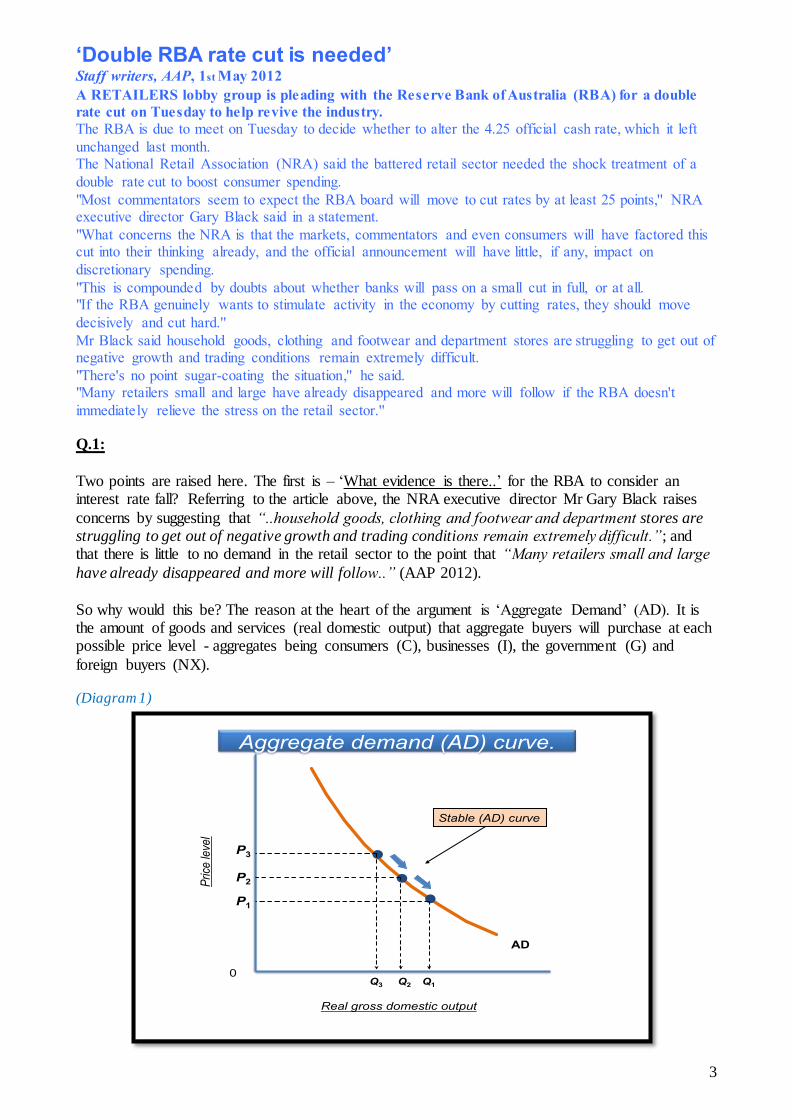
So why would this be? The reason at the heart of the argument is ‘Aggregate Demand’ (AD). It is the amount of goods and services (real domestic output) that aggregate buyers will purchase at each possible price level - aggregates being consumers (C), businesses (I), the government (G) and
foreign buyers (NX). (Diagram 1)
Aggregate demand (AD) curve.
0
Price
leve
l
Real gross domestic output
AD
P3
P2
P1
Q3 Q2 Q1
Stable (AD) curve
4
There are two reasons behind any change in output. Reason one is a direct effect on the price level,
which changes the quantity of real output demanded along a stable (AD) curve – as shown in Diagram 1. It assumes ‘all other things being equal’ or ‘cet par’. If price levels dropped from P3 to
P2, quantity demanded would increases from Q3 to Q2, improving GDP. Reason two is ‘Determinants of (AD)’. It removes the ‘cet par’ assumption. These ‘other things’ such as consumer wealth, expectations and indebtedness are non-price-level factors, which effect spending habits.
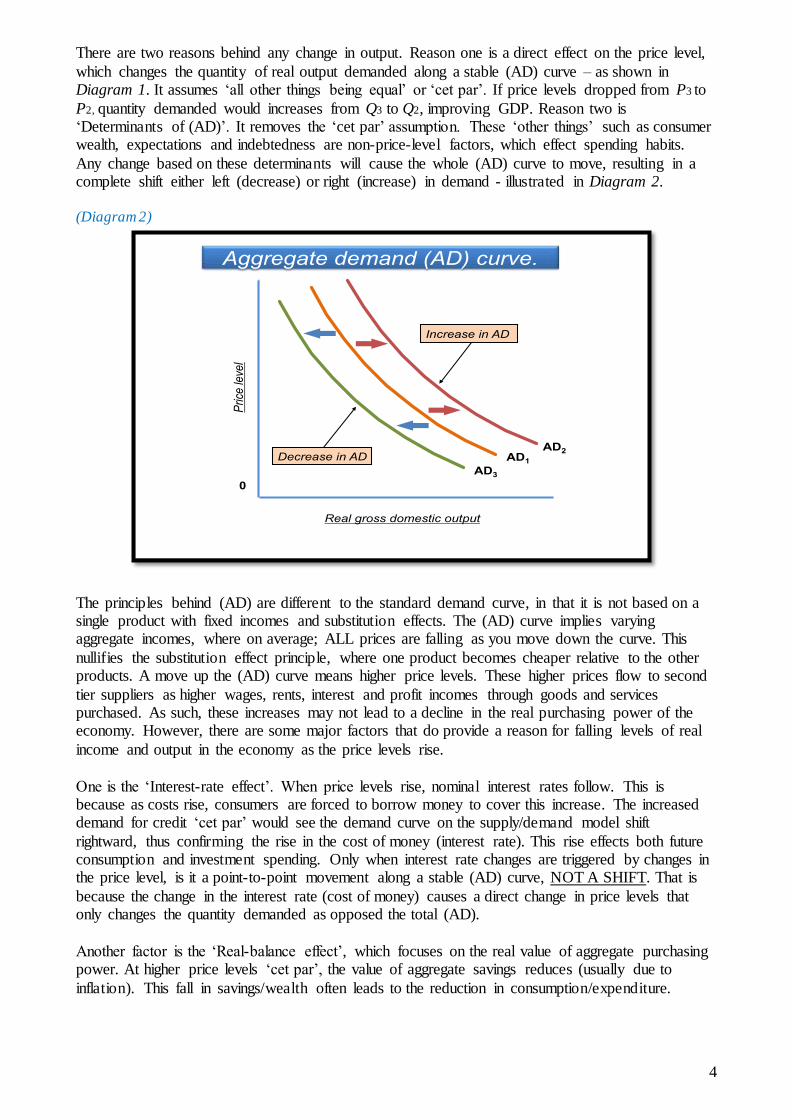
Any change based on these determinants will cause the whole (AD) curve to move, resulting in a complete shift either left (decrease) or right (increase) in demand - illustrated in Diagram 2.
(Diagram 2)
The principles behind (AD) are different to the standard demand curve, in that it is not based on a single product with fixed incomes and substitution effects. The (AD) curve implies varying aggregate incomes, where on average; ALL prices are falling as you move down the curve. This
nullifies the substitution effect principle, where one product becomes cheaper relative to the other products. A move up the (AD) curve means higher price levels. These higher prices flow to second
tier suppliers as higher wages, rents, interest and profit incomes through goods and services purchased. As such, these increases may not lead to a decline in the real purchasing power of the economy. However, there are some major factors that do provide a reason for falling levels of real
income and output in the economy as the price levels rise.
One is the ‘Interest-rate effect’. When price levels rise, nominal interest rates follow. This is because as costs rise, consumers are forced to borrow money to cover this increase. The increased demand for credit ‘cet par’ would see the demand curve on the supply/demand model shift
rightward, thus confirming the rise in the cost of money (interest rate). This rise effects both future consumption and investment spending. Only when interest rate changes are triggered by changes in the price level, is it a point-to-point movement along a stable (AD) curve, NOT A SHIFT. That is
because the change in the interest rate (cost of money) causes a direct change in price levels that only changes the quantity demanded as opposed the total (AD).
Another factor is the ‘Real-balance effect’, which focuses on the real value of aggregate purchasing power. At higher price levels ‘cet par’, the value of aggregate savings reduces (usually due to
inflation). This fall in savings/wealth often leads to the reduction in consumption/expenditure.
7-2
Aggregate demand (AD) curve.
0
Pri
ce le
vel
Real gross domestic output
AD2
Increase in AD
Decrease in AD AD1
AD3
5
The third factor is called the ‘Foreign-purchases effect’. Any changes to price levels (domestic and
overseas) can influence both import and export purchases. Put another way, a rise in our domestic price level ‘cet par’ leads to increased imports and fewer exports (and vice-versa).
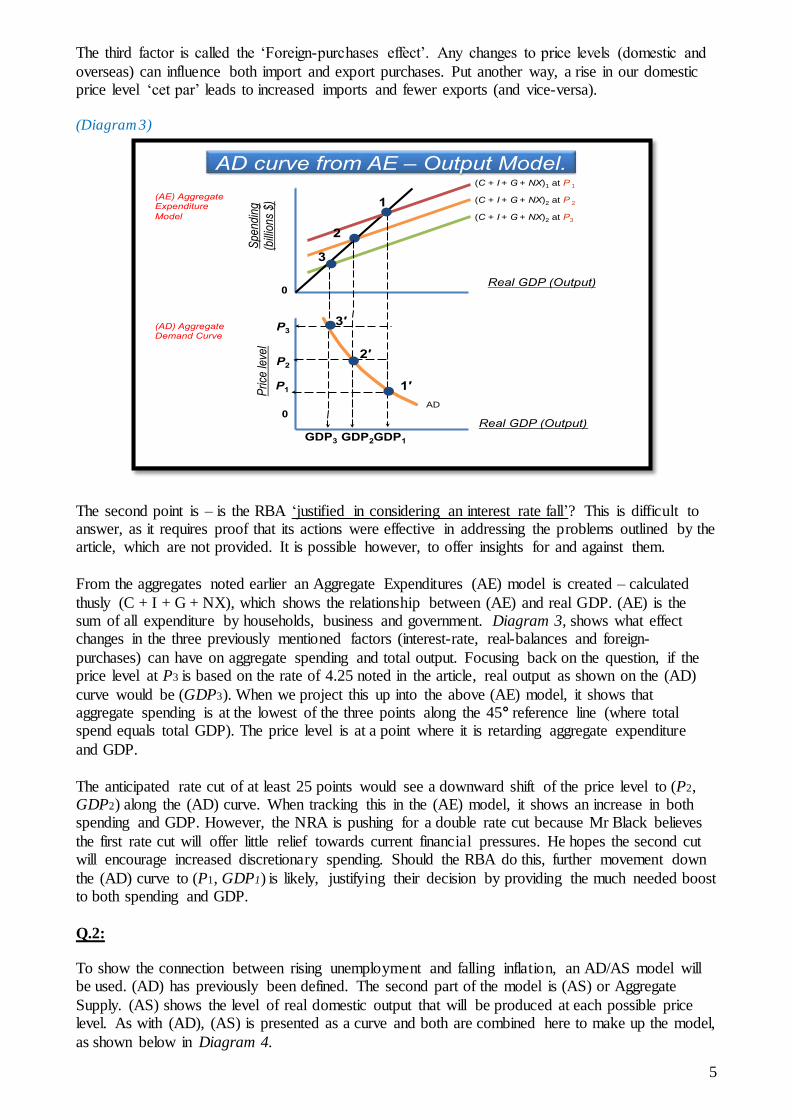
(Diagram 3)
The second point is – is the RBA ‘justified in considering an interest rate fall’? This is difficult to answer, as it requires proof that its actions were effective in addressing the problems outlined by the article, which are not provided. It is possible however, to offer insights for and against them.
From the aggregates noted earlier an Aggregate Expenditures (AE) model is created – calculated
thusly (C + I + G + NX), which shows the relationship between (AE) and real GDP. (AE) is the sum of all expenditure by households, business and government. Diagram 3, shows what effect changes in the three previously mentioned factors (interest-rate, real-balances and foreign-
purchases) can have on aggregate spending and total output. Focusing back on the question, if the price level at P3 is based on the rate of 4.25 noted in the article, real output as shown on the (AD)
curve would be (GDP3). When we project this up into the above (AE) model, it shows that aggregate spending is at the lowest of the three points along the 45° reference line (where total spend equals total GDP). The price level is at a point where it is retarding aggregate expenditure
and GDP.
The anticipated rate cut of at least 25 points would see a downward shift of the price level to (P2, GDP2) along the (AD) curve. When tracking this in the (AE) model, it shows an increase in both spending and GDP. However, the NRA is pushing for a double rate cut because Mr Black believes
the first rate cut will offer little relief towards current financial pressures. He hopes the second cut will encourage increased discretionary spending. Should the RBA do this, further movement down
the (AD) curve to (P1, GDP1) is likely, justifying their decision by providing the much needed boost to both spending and GDP.
Q.2:
To show the connection between rising unemployment and falling inflation, an AD/AS model will be used. (AD) has previously been defined. The second part of the model is (AS) or Aggregate
Supply. (AS) shows the level of real domestic output that will be produced at each possible price level. As with (AD), (AS) is presented as a curve and both are combined here to make up the model,
as shown below in Diagram 4.
7-2
(C + I + G + NX)2 at P 2
(C + I + G + NX)2 at P3
AD curve from AE – Output Model.
Spe
ndi
ng
(bill
ion
s $
)
0
0
Price
leve
l
Real GDP (Output)
Real GDP (Output)
P1
(C + I + G + NX)1 at P 1
1′
1
GDP1
P2
GDP2
2
2′
3
P3
GDP3
3′
AD
(AE) Aggregate Expenditure
Model
(AD) Aggregate Demand Curve
6
(Diagram 4)
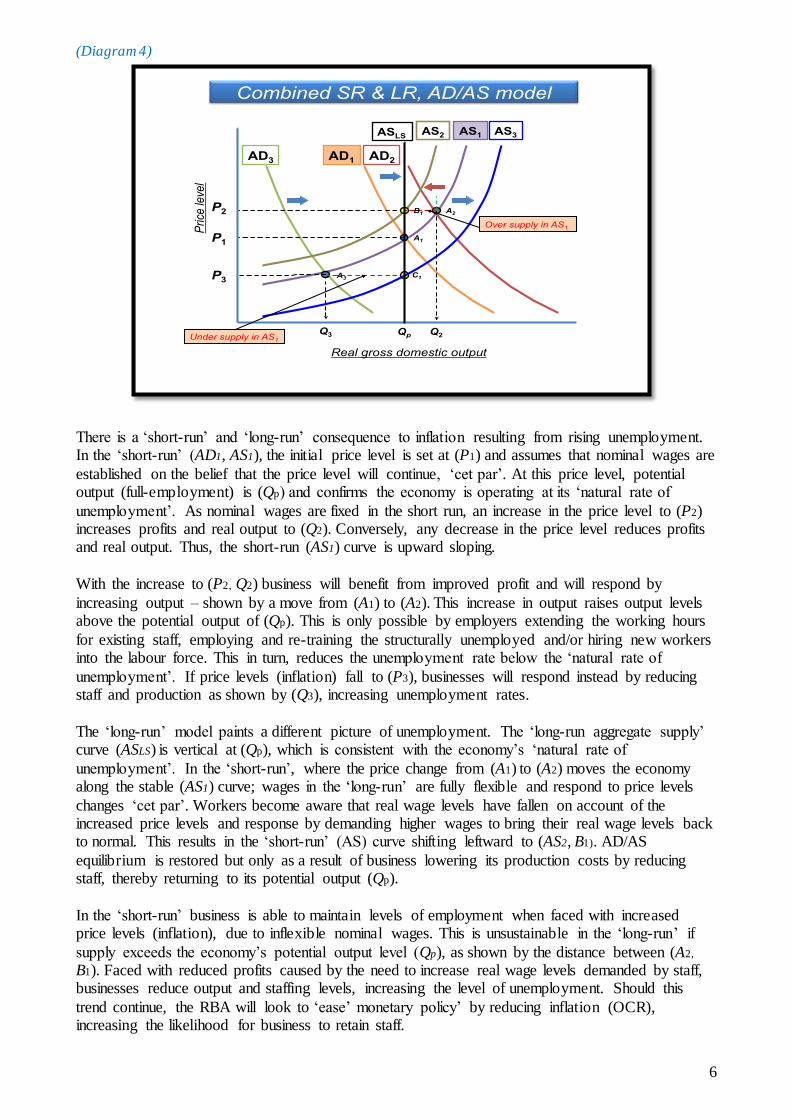
There is a ‘short-run’ and ‘long-run’ consequence to inflation resulting from rising unemployment. In the ‘short-run’ (AD1, AS1), the initial price level is set at (P1) and assumes that nominal wages are
established on the belief that the price level will continue, ‘cet par’. At this price level, potential output (full-employment) is (Qp) and confirms the economy is operating at its ‘natural rate of
unemployment’. As nominal wages are fixed in the short run, an increase in the price level to (P2) increases profits and real output to (Q2). Conversely, any decrease in the price level reduces profits and real output. Thus, the short-run (AS1) curve is upward sloping.
With the increase to (P2, Q2) business will benefit from improved profit and will respond by
increasing output – shown by a move from (A1) to (A2). This increase in output raises output levels above the potential output of (Qp). This is only possible by employers extending the working hours
for existing staff, employing and re-training the structurally unemployed and/or hiring new workers into the labour force. This in turn, reduces the unemployment rate below the ‘natural rate of
unemployment’. If price levels (inflation) fall to (P3), businesses will respond instead by reducing staff and production as shown by (Q3), increasing unemployment rates.
The ‘long-run’ model paints a different picture of unemployment. The ‘long-run aggregate supply’ curve (ASLS) is vertical at (Qp), which is consistent with the economy’s ‘natural rate of
unemployment’. In the ‘short-run’, where the price change from (A1) to (A2) moves the economy along the stable (AS1) curve; wages in the ‘long-run’ are fully flexible and respond to price levels
changes ‘cet par’. Workers become aware that real wage levels have fallen on account of the increased price levels and response by demanding higher wages to bring their real wage levels back to normal. This results in the ‘short-run’ (AS) curve shifting leftward to (AS2, B1). AD/AS
equilibrium is restored but only as a result of business lowering its production costs by reducing staff, thereby returning to its potential output (Qp).
In the ‘short-run’ business is able to maintain levels of employment when faced with increased price levels (inflation), due to inflexible nominal wages. This is unsustainable in the ‘long-run’ if
supply exceeds the economy’s potential output level (Qp), as shown by the distance between (A2, B1). Faced with reduced profits caused by the need to increase real wage levels demanded by staff, businesses reduce output and staffing levels, increasing the level of unemployment. Should this
trend continue, the RBA will look to ‘ease’ monetary policy’ by reducing inflation (OCR), increasing the likelihood for business to retain staff.
Combined SR & LR, AD/AS model
AD2 AD3
ASLS
Qp
AD1
AS1
Q2
Real gross domestic output
Q3
P3
Price
leve
l
P1
P2
AS2 AS3
A1
A2
A3
B1
C1
Over supply in AS1
Under supply in AS1
7
Q.3:
The Reserve Bank of Australia (RBA) has the responsibility of managing the country’s monetary
policy. Monetary policies are actions taken by the RBA designed to influence the economy’s interest rates (along with credit availability) to help stabilise real GDP, employment and the price level.
The interest rate set by the RBA is also called the ‘official cash rate’ (OCR). It is basically the
amount each registered bank is charged for the use of exchange settlement accounts (ESA) they hold with the RBA. When one banks customer transacts with the recipients’ bank; e.g. when paying a bill via EFTPOS - the money is paid by your bank to the bank of the recipient via (ESA’s). Most
banks hold (ESA’s) for this purpose and are charged interest on these accordingly. In-turn, the (OCR) influences how much interest the banks charge everyday lenders for credit.
When the economy is faced with rising unemployment and falling inflation (deflation), the RBA will announce a reduction to the ‘target rate’ or (OCR). This reduction represents an ‘easing’ of
monetary policy. On completing this first step, the RBA will then look to bring back and maintain equilibrium in the (ESA) funds market at the new target rate set. This is mostly done through ‘open-
market operations’ or (OMO’s). These are the buying and selling of government securities by the RBA into the cash or short-term money market. As a ‘monopoly’ supplier of (ESA) funds, the RBA can ensure with some accuracy that demand and supply for these funds by banks are kept balanced
at the (OCR). All (OCR) announcements by the RBA are broadcast via media release and published on the their
website at 2:30pm the first Tuesday of every month (except January). Any change in the rate takes effect the very next day.
(Diagram 5)
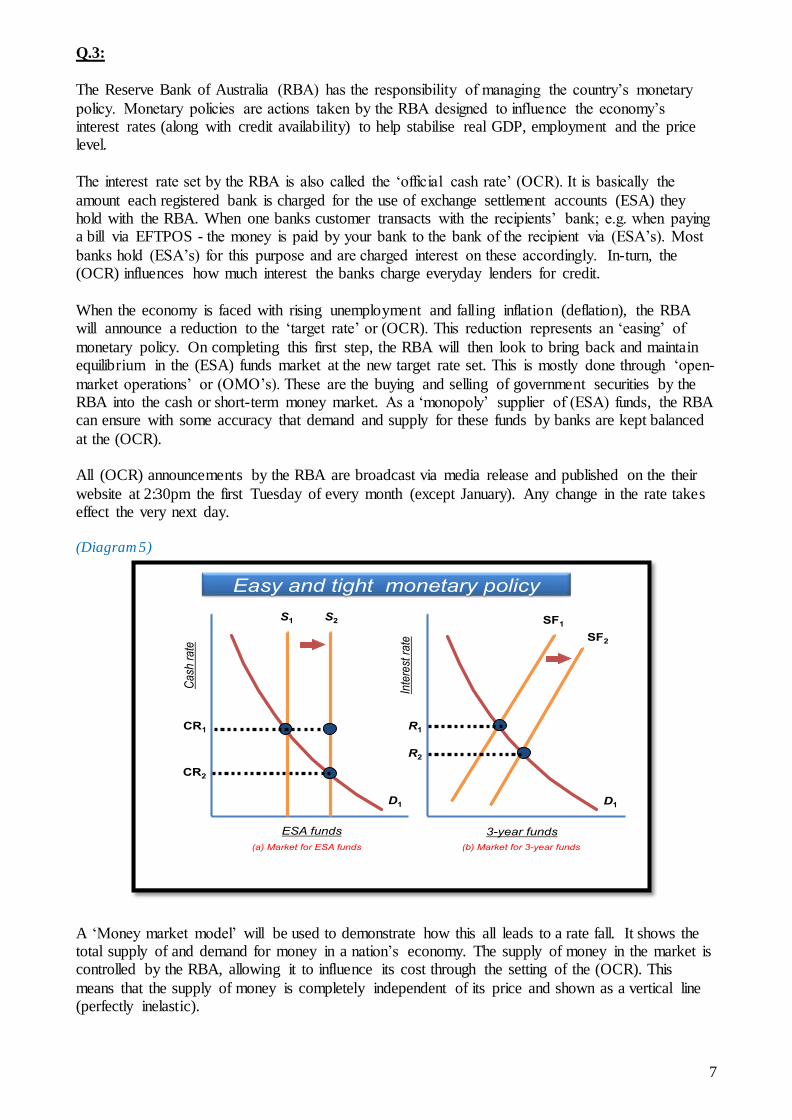
A ‘Money market model’ will be used to demonstrate how this all leads to a rate fall. It shows the total supply of and demand for money in a nation’s economy. The supply of money in the market is controlled by the RBA, allowing it to influence its cost through the setting of the (OCR). This
means that the supply of money is completely independent of its price and shown as a vertical line (perfectly inelastic).
11- 5
Easy and tight monetary policy
Ca
sh r
ate
ESA funds
S1
D1
Inte
rest
rate
3-year funds
CR1
S2
CR2
SF1
D1
R1
SF2
R2
(a) Market for ESA funds (b) Market for 3-year funds
8
When the RBA reduces the (OCR) by moving it from (CR1) to (CR2) – to help maintain market
equilibrium it must supply additional (ESA) funds – as shown by the shift right of the supply curve from (S1) to (S2) in Diagram 5 (a). By reducing the (OCR) in the short-term, the (RBA) will cause a
fall in all other longer-term financial assets – as shown in Diagram 5 (b). A lowering of the equilibrium interest rates from (R1) to (R2) leads to a downward shift of the supply curve of the 3-year funds from (SF1) to (SF2). In each funds market, as with all markets, where the supply and
demand curves cross is where the equilibrium rate is established.
Q.4:
Australia has several ‘macroeconomic’ objectives that focus on economic growth and ‘macroeconomic stability’ (which comprises full employment, price-level stability and external
balance). The (RBA) state on their website (Reserve Bank of Australia 2013) that their objectives under the ‘Reserve Bank Act 1959’ are; a) the stability of the currency of Australia; b) maintenance of full-employment in Australia; and c) the economic prosperity and welfare of the people of
Australia. So how do lower interest rates or (OCR), impact on these objectives? To assist the AD/AS model in Q.2 will again be used.
Assuming that ‘all other things are equal’, a reduction in interest rates will see the cost of money/credit reduce. With households affording to borrow more, this will lead to increased
spending. Looking at Diagram 4, the increase in spending drives overall (AD) upward from (AD3 to AD1) and ‘cet par’ is an example of ‘demand-pull inflation’ along the (AS1) curve from (A3) to
(A1). In the short-term this outcome is great for economic growth as GDP increases from (A3, Q3) to (A1, Qp).
However, if the economy is already at ‘full-employment’ businesses may experience difficulty in finding labour to meet the growing demand. Any shortage can lead to increases in prices. In the face
of increasing demand, suppliers will increase investment in order to increase supply. Business will be forced to pay more for labour and are likely to pass those costs on, further increasing the price of their goods from (P1) to (P2) – as shown by the move from (AS1, A1) to (AS1, A2) in the short-run.
This increase in input costs is a form of ‘cost-push inflation’ called ‘supply-side shock’. In the ‘long-run’, demand cannot be sustained at the new price level of (A2), reducing the amount of real
output to (AD1) and increasing unemployment to (Qp) due to the equilibrating process. The key point here is ‘stability’. Recurrent changes by both ‘demand-pull inflation’ and ‘cost-push
inflation’ effect GDP, employment and price level. The RBA therefore, will base its decision making on ensuring continued economic stability in line with Australia’s macroeconomic
objectives. Although it is more a medium-term average than a fixed rate, it looks to target annual inflation rates of between “2-3 per cent, on average, over the [business] cycle” (Reserve Bank of Australia 2013).
9
Reference List:
Jackson, J, McIver, R, Wilson, E 2011, Macroeconomics, 9th edn, McGraw Hill, North Ryde, Australia. AAP 2012, ‘Double RBA rate cut is needed’, Courier Mail, 1 May, viewed 6 July 2013, <http://www.couriermail.com.au/ipad/double-rba-rate-cut-is-needed/story- fn6ck4a4-1226342574477>. Pettinger, T 2013, ‘Inflation Unemployment Relationship’ blog post, Economics Help, 24 November, viewed 20 July 2013, <http://www.economicshelp.org/blog/989/economics/inflation-unemployment-relationship/>. Reserve Bank of Australia 2013, Monetary Policy, Reserve Bank of Australia 2013, viewed 23 July 2013, <http://www.rba.gov.au/education/monetary-policy.html/>.
Appendices/Enclosures: Bredon, G 2011, PowerPoint Slides ECO12 - Microeconomics, University of South Australia. Bredon, G 2011, Study Guide to Accompany - Macroeconomics, 9th edn, McGraw Hill, North Ryde, Australia. Jarrett, M 2001, ‘Falling Interest Rates and the Exchange Rate’, list server, Interactive Economics, viewed 21 July 2013, <http://users.chariot.net.au/~mjarrett/Devel/Demand/Defex12d.htm>. Wikipedia 2013, viewed 11 July 2013, <http://en.wikipedia.org/wiki/Official_cash_rate>.