DARDEN
CLASSES OF 2016 & 2017MBA EMPLOYMENT REPORT
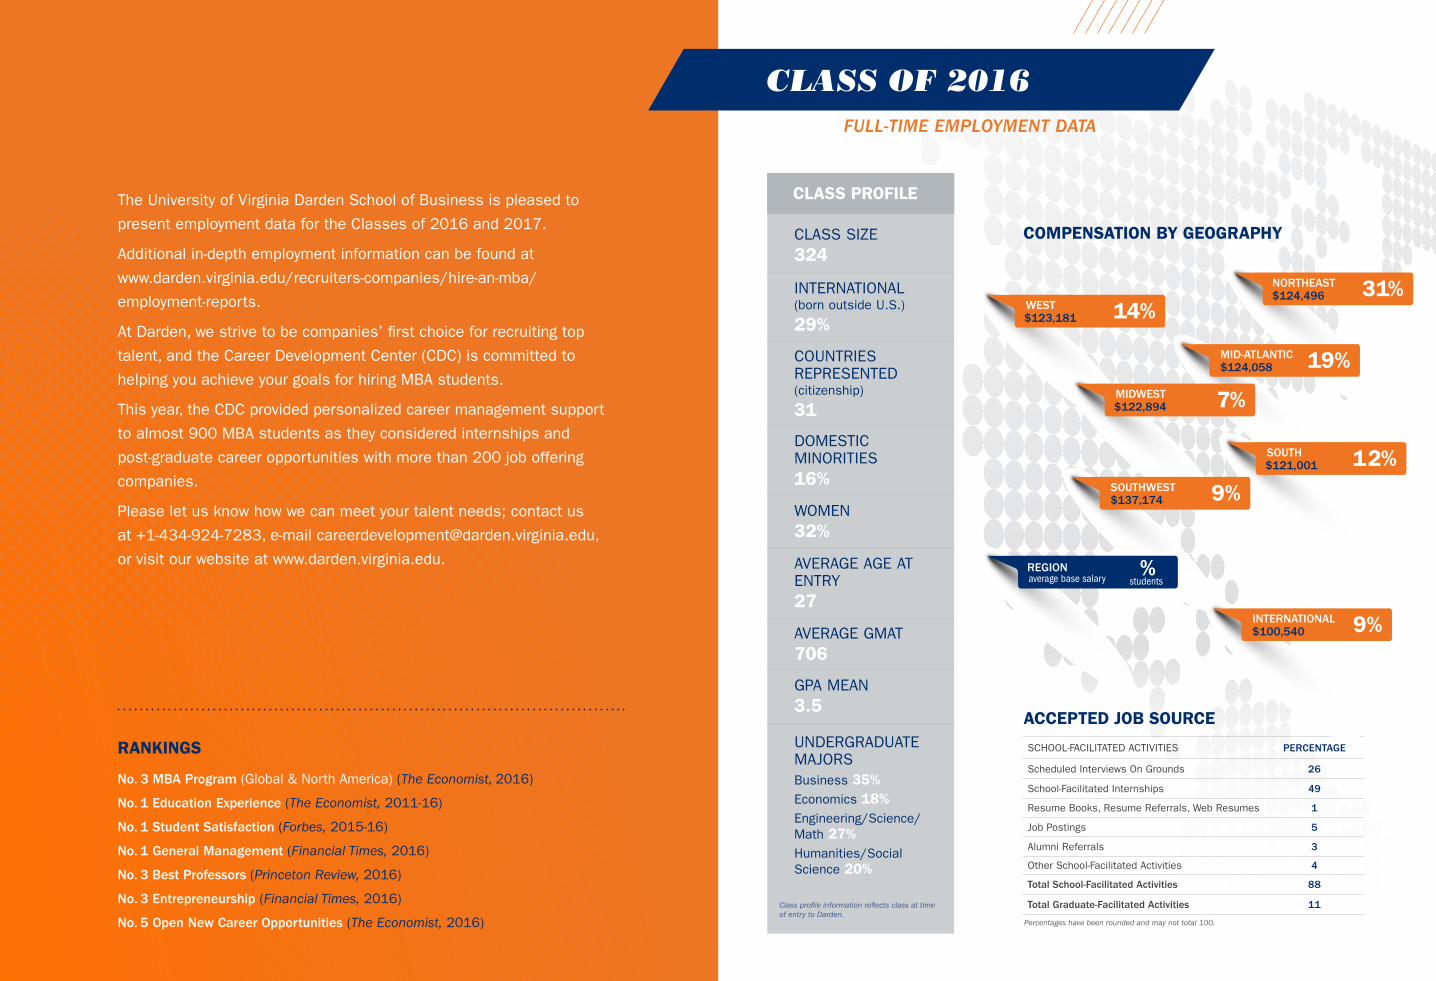
CLASS OF 2016FULL-TIME EMPLOYMENT DATA
ACCEPTED JOB SOURCE
SCHOOL-FACILITATED ACTIVITIES PERCENTAGE
Scheduled Interviews On Grounds 26
School-Facilitated Internships 49
Resume Books, Resume Referrals, Web Resumes 1
Job Postings 5
Alumni Referrals 3
Other School-Facilitated Activities 4
Total School-Facilitated Activities 88
Total Graduate-Facilitated Activities 11
COMPENSATION BY GEOGRAPHY
The University of Virginia Darden School of Business is pleased to
present employment data for the Classes of 2016 and 2017.
Additional in-depth employment information can be found at
www.darden.virginia.edu/recruiters-companies/hire-an-mba/
employment-reports.
At Darden, we strive to be companies’ first choice for recruiting top
talent, and the Career Development Center (CDC) is committed to
helping you achieve your goals for hiring MBA students.
This year, the CDC provided personalized career management support
to almost 900 MBA students as they considered internships and
post-graduate career opportunities with more than 200 job offering
companies.
Please let us know how we can meet your talent needs; contact us
at +1-434-924-7283, e-mail [email protected],
or visit our website at www.darden.virginia.edu.
WEST 14%$123,181
NORTHEAST 31%$124,496
MID-ATLANTIC 19%$124,058
MIDWEST 7%$122,894
SOUTH 12%$121,001
SOUTHWEST 9%$137,174
INTERNATIONAL 9%$100,540
REGION %average base salary students
RANKINGS
No. 3 MBA Program (Global & North America) (The Economist, 2016)
No. 1 Education Experience (The Economist, 2011-16)
No. 1 Student Satisfaction (Forbes, 2015-16)
No. 1 General Management (Financial Times, 2016)
No. 3 Best Professors (Princeton Review, 2016)
No. 3 Entrepreneurship (Financial Times, 2016)
No. 5 Open New Career Opportunities (The Economist, 2016) Percentages have been rounded and may not total 100.
CLASS SIZE324
WOMEN32%
DOMESTIC MINORITIES16%
AVERAGE AGE AT ENTRY27
AVERAGE GMAT706
UNDERGRADUATE MAJORSBusiness 35%Economics 18%Engineering/Science/Math 27%Humanities/Social Science 20%
GPA MEAN3.5
INTERNATIONAL (born outside U.S.)
29%
COUNTRIES REPRESENTED(citizenship)
31
Class profile information reflects class at time of entry to Darden.
CLASS PROFILE

CLASS OF 2016
First Offerby
Graduation
Accept by
Graduation
First Offer Between
Graduation and 3 Months out
Accept Between
Graduation and 3 Months out
Total Offers
Total Accepts
PERCENTAGE PERCENTAGE PERCENTAGE PERCENTAGE PERCENTAGE PERCENTAGE
Permanent Work Authorization 88 82 7 9 94 92
Non-Permanent Work Authorization 81 76 9 10 90 86
Total Graduates Seeking Employment
86 81 7 10 93 90
TIMING OF JOB OFFERS
Class of 2016: Statistics for full-time positions received during the 2015–16 academic year, reported in U.S. dollar equivalents and based on data provided by the students. Data are complete as of 30 September 2016. This report conforms to the MBA Career Services Council Standards for Reporting MBA Employment Statistics.Base Salary: Figures based on reported job acceptances not including bonuses, overtime or any other forms of compensation.
INDUSTRY PERCENTAGE AVERAGE BASE SALARY
AVERAGE SIGNING BONUS
Consulting 38 $135,771 $26,927
Consumer Packaged Goods 5 102,992 27,727
Financial Services 27 121,546 42,223
Investment Banking 18 125,938 48,177
Investment Mgmt/Portfolio Mgmt 4 120,200 24,167
Other Financial Services 6 108,392 27,433
Manufacturing 4 110,010 23,500
Nonprofit/Education 2 82,340 N/A
Pharma/Biotech/Health Care 3 113,571 26,786
Real Estate 2 96,375 N/A
Technology 17 114,722 29,472
Transportation 1 96,680 20,000
Other 2 131,000 N/A
TOTAL 100%* $122,806 $31,370
COMPENSATION BY INDUSTRY
* Percentages have been rounded and may not total 100.
Darden students’ interest in consulting continues to grow, with 38% of accepted post-MBA jobs for the class of 2016 coming from the consulting industry.
38%
COMPENSATION BY JOB FUNCTION
JOB FUNCTION PERCENTAGE AVERAGE
BASE SALARYAVERAGE
SIGNING BONUS
Consulting (includes internal) 39 $134,770 $26,930
Finance 30 119,584 41,863
Corporate Finance 9 110,582 31,683
Investment Banking 15 126,960 48,938
Investment Management 5 114,321 29,167
Other Financial Services 2 113,750 N/A
General Management 20 109,685 24,430
Business Development/ Strategic Planning 6 112,235 17,917
Executive Development/ Leadership Program 8 108,571 29,300
Other General Management 6 108,438 22,833
Marketing 9 108,793 31,652
Other 2 164,000 N/A
TOTAL 100%* $122,806 $31,370
* Percentages have been rounded and may not total 100.
Percentages have been rounded and may not total 100.
Consulting$134,770
Marketing/Sales$108,793
Other$164,000
2% ACCEPTED OFFERS
Finance/Accounting$119,584
General Management$109,685
39%ACCEPTED OFFERS
30%ACCEPTED OFFERS
20%ACCEPTED OFFERS
9%ACCEPTED OFFERS
POST-MBA JOB FUNCTION
Based on the Class of 2016
Consulting remains a top choice

CLASS OF 2017INTERNSHIP EMPLOYMENT DATA
20%
Our students are increasingly drawn to the tech industry.
20% of internships for the Class of 2017 were in the technology sector, continuing a steady increase over the past several years.
49%
Summer internships can give your company a head start.
49% of the accepted offers reported by the Class of 2016 were secured through summer internships.
INDUSTRY PERCENTAGE AVERAGE WEEKLY INCOME
Consulting 27 $2,495
Consumer Packaged Goods 6 1,641
Energy 2 1,626
Financial Services 28 2,060
Hedge/Mutual Fund 1 2,038
Investment Banking 18 2,412
Investment Mgmt/Portfolio Mgmt 3 1,523
Venture Cap/Private Equity 2 773
Other Financial Services 5 1,502
Manufacturing 5 1,440
Media/Entertainment 2 714
Nonprofit/Education 4 650
Pharma/Biotech/Health Care 4 1,526
Technology 20 1,736
Other 3 1,392
TOTAL 100%* $1,947
INTERNSHIP COMPENSATION BY INDUSTRY
Class of 2017: Statistics for internship positions received during the 2015–16 academic year, reported in U.S. dollar equivalents and based on data provided by the students. Data are complete as of 30 September 2016. This report conforms to the MBA Career Services Council Standards for Reporting MBA Employment Statistics.Average Weekly Income: Figures based on reported internship acceptances not including bonuses, overtime or any other forms of compensation.
* Percentages have been rounded and may not total 100.
JOB FUNCTION PERCENTAGE AVERAGE WEEKLY INCOME
Consulting (includes internal) 28 $2,428
Finance 30 2,024
Corporate Finance 7 1,647
Investment Banking 15 2,408
Investment Management 2 1,181
Other Financial Services 6 1,711
General Management 24 1,615
Business Development/Strategic Planning 5 1,256
Executive Development/Leadership Program 12 1,821
Operations 2 2,106
Other General Management 6 1,261
Marketing 14 1,472
Other 4 1,236
TOTAL 100%* $1,947
INTERNSHIP COMPENSATION BY JOB FUNCTION
* Percentages have been rounded and may not total 100.
CLASS PROFILE
CLASS SIZE334
WOMEN35%
DOMESTIC MINORITIES17%
AVERAGE AGE AT ENTRY27
AVERAGE GMAT706
UNDERGRADUATE MAJORSBusiness 27%Economics 18%Engineering/Science/Math 18%Humanities/Social Science 30%Other 7%
GPA MEAN3.5
INTERNATIONAL (born outside U.S.)
38%
COUNTRIES REPRESENTED(citizenship)
37
Class profile information reflects class at time of entry to Darden.

Mailing Address
Career Development CenterUniversity of Virginia Darden School of BusinessP. O. Box 6550Charlottesville, Virginia 22906-6550USA
Shipping Address
100 Darden BoulevardCharlottesville, Virginia 22903-1760USA
Contact
Career Development Center +1-434-924-7283Fax +1-434-924-7363Darden School General Information +1-434-924-3900
[email protected]/recruiters-companiesJoin our LinkedIn group Darden MBA RecruitingFollow us on Twitter https://twitter.com/DardenMBA
Recommended