Embed Size (px)
Citation preview
Employment tax incentive descriptive report
PRETORIA • AUGUST 2016
Enquiries: Aroop Chatterjee 012 315 5961
[email protected] Catherine MacLeod 012 315 5505
2
EXECUTIVE SUMMARY
1. The analysis in this report is based on individual employee tax certificate data, which allows
for an analysis of trends in ETI take up across sectors and employees. The data is only available
for the 2013/14 and 2014/15 tax years, due to the lags in tax data reporting. The dataset
cleaning procedures are outlined in detail in the document.
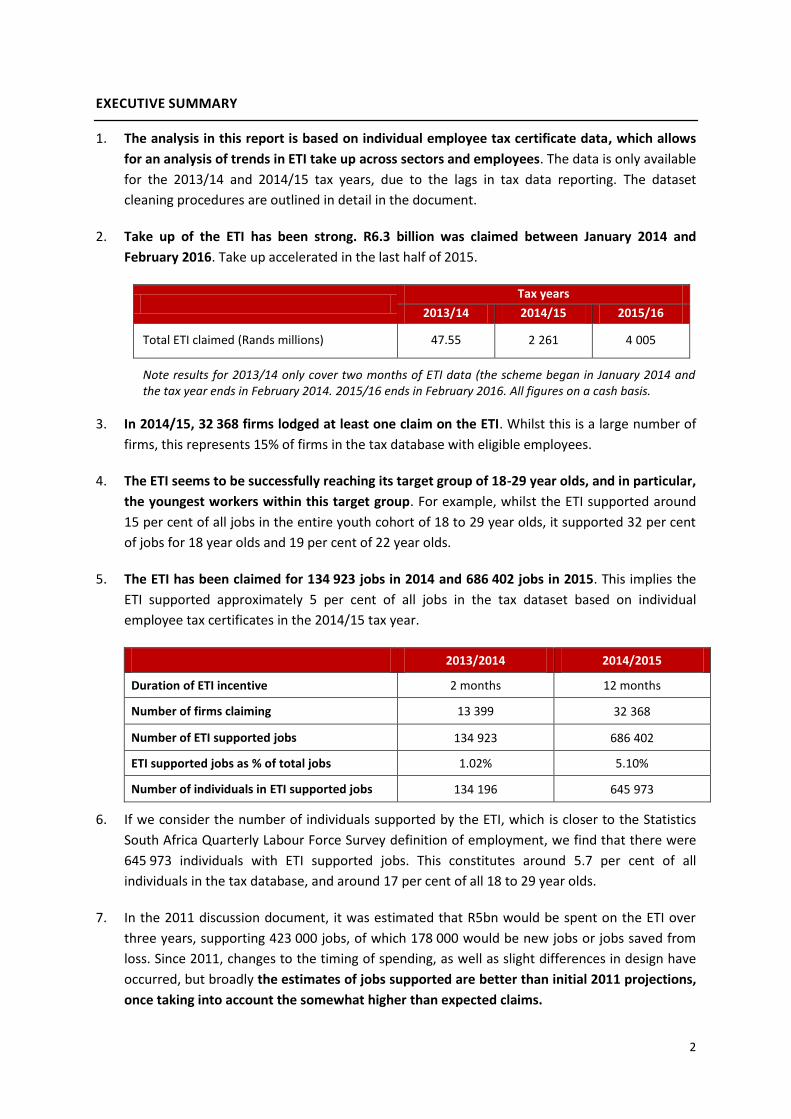
2. Take up of the ETI has been strong. R6.3 billion was claimed between January 2014 and
February 2016. Take up accelerated in the last half of 2015.
Tax years
2013/14 2014/15 2015/16
Total ETI claimed (Rands millions) 47.55 2 261 4 005
Note results for 2013/14 only cover two months of ETI data (the scheme began in January 2014 and the tax year ends in February 2014. 2015/16 ends in February 2016. All figures on a cash basis.
3. In 2014/15, 32 368 firms lodged at least one claim on the ETI. Whilst this is a large number of
firms, this represents 15% of firms in the tax database with eligible employees.
4. The ETI seems to be successfully reaching its target group of 18-29 year olds, and in particular,
the youngest workers within this target group. For example, whilst the ETI supported around
15 per cent of all jobs in the entire youth cohort of 18 to 29 year olds, it supported 32 per cent
of jobs for 18 year olds and 19 per cent of 22 year olds.
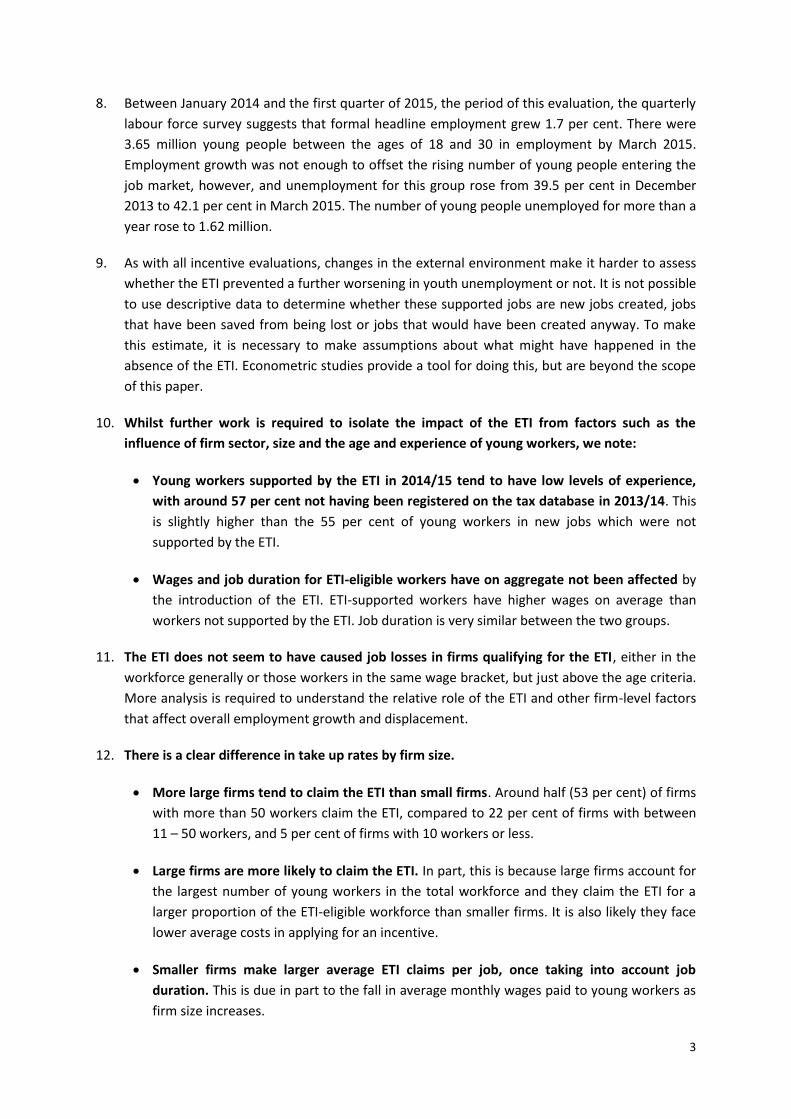
5. The ETI has been claimed for 134 923 jobs in 2014 and 686 402 jobs in 2015. This implies the
ETI supported approximately 5 per cent of all jobs in the tax dataset based on individual
employee tax certificates in the 2014/15 tax year.
2013/2014 2014/2015
Duration of ETI incentive 2 months 12 months
Number of firms claiming 13 399 32 368
Number of ETI supported jobs 134 923 686 402
ETI supported jobs as % of total jobs 1.02% 5.10%
Number of individuals in ETI supported jobs 134 196 645 973
6. If we consider the number of individuals supported by the ETI, which is closer to the Statistics
South Africa Quarterly Labour Force Survey definition of employment, we find that there were
645 973 individuals with ETI supported jobs. This constitutes around 5.7 per cent of all
individuals in the tax database, and around 17 per cent of all 18 to 29 year olds.
7. In the 2011 discussion document, it was estimated that R5bn would be spent on the ETI over
three years, supporting 423 000 jobs, of which 178 000 would be new jobs or jobs saved from
loss. Since 2011, changes to the timing of spending, as well as slight differences in design have
occurred, but broadly the estimates of jobs supported are better than initial 2011 projections,
once taking into account the somewhat higher than expected claims.
3
8. Between January 2014 and the first quarter of 2015, the period of this evaluation, the quarterly
labour force survey suggests that formal headline employment grew 1.7 per cent. There were
3.65 million young people between the ages of 18 and 30 in employment by March 2015.
Employment growth was not enough to offset the rising number of young people entering the
job market, however, and unemployment for this group rose from 39.5 per cent in December
2013 to 42.1 per cent in March 2015. The number of young people unemployed for more than a
year rose to 1.62 million.
9. As with all incentive evaluations, changes in the external environment make it harder to assess
whether the ETI prevented a further worsening in youth unemployment or not. It is not possible
to use descriptive data to determine whether these supported jobs are new jobs created, jobs
that have been saved from being lost or jobs that would have been created anyway. To make
this estimate, it is necessary to make assumptions about what might have happened in the
absence of the ETI. Econometric studies provide a tool for doing this, but are beyond the scope
of this paper.
10. Whilst further work is required to isolate the impact of the ETI from factors such as the
influence of firm sector, size and the age and experience of young workers, we note:
Young workers supported by the ETI in 2014/15 tend to have low levels of experience,
with around 57 per cent not having been registered on the tax database in 2013/14. This
is slightly higher than the 55 per cent of young workers in new jobs which were not
supported by the ETI.
Wages and job duration for ETI-eligible workers have on aggregate not been affected by
the introduction of the ETI. ETI-supported workers have higher wages on average than
workers not supported by the ETI. Job duration is very similar between the two groups.
11. The ETI does not seem to have caused job losses in firms qualifying for the ETI, either in the
workforce generally or those workers in the same wage bracket, but just above the age criteria.
More analysis is required to understand the relative role of the ETI and other firm-level factors
that affect overall employment growth and displacement.
12. There is a clear difference in take up rates by firm size.
More large firms tend to claim the ETI than small firms. Around half (53 per cent) of firms
with more than 50 workers claim the ETI, compared to 22 per cent of firms with between
11 – 50 workers, and 5 per cent of firms with 10 workers or less.
Large firms are more likely to claim the ETI. In part, this is because large firms account for
the largest number of young workers in the total workforce and they claim the ETI for a
larger proportion of the ETI-eligible workforce than smaller firms. It is also likely they face
lower average costs in applying for an incentive.
Smaller firms make larger average ETI claims per job, once taking into account job
duration. This is due in part to the fall in average monthly wages paid to young workers as
firm size increases.
4
13. When analysing firm results by sector, we see that take up is greatest in trade and financial
and business services. ETI take-up is linked to the number of eligible workers in the sector, how
many of those workers the ETI is claimed against and average wages.
There are more manufacturing firms claiming the ETI than any other grouping.
Smaller firms are especially important in manufacturing and financial and business
services: almost 64 per cent of ETI claiming firms in manufacturing had less than 50
employees, while in in financial and business services, these firms comprised 70 per cent of
all ETI claiming firms in the sector.
14. Labour brokers are important, but not the main factor behind ETI claims. Labour brokers made
up 11 per cent of the ETI eligible jobs in the individual employee certificates dataset, but 9 per
cent of the total ETI claim amount. There appears to be wide variation in how different labour
brokers are utilising the ETI.
5
1. INTRODUCTION
1.1. Unemployment remains South Africa’s largest policy challenge, and together with low
growth and high inequality are the Government’s key policy priorities.
1.2. Youth employment is a critical component of the overall unemployment challenge.
Unemployment is higher amongst the youth than in any other age group. According to the
latest statistics1, 18-29 year olds make up just under 35 per cent of the total working-age
population. Of these 12 million individuals, 43 per cent are not in employment, education or
training.
1.3. Worryingly, unemployment today reduces the probability of finding a job in the future.
The longer a young person remains unemployed, the lower the probability of finding a job in
the future, as the experience gap between an employed person and unemployed person
widens2.
1.4. The burden of unemployment falls heaviest on the poorest in society. The probability of
getting a job in South Africa is highly linked to education, which is in turn very heavily
influenced by the income of parents. In addition, knowing someone who is in employment is
a critical predictor of being able to get work in the future. Individuals who grow up in poor
households are less likely to be educated and less likely to know the people who can get
them a job.
1.5. This raises severe consequences for both the youth and the economy. Higher employment
is critical for helping move out of the poverty trap. For the country, high levels of
unemployment place the country on a lower growth path, as lost human potential is not
translated into faster growth. The National Development Plan notes that a frustrating and
destabilising environment where young people cannot get work can contribute to violence,
crime, alcohol abuse and other social ills. Unemployment is associated with social problems
such as poverty, crime, violence, a loss of morale, social degradation and political
disengagement.
1.6. Over the period of this evaluation, youth employment outcomes did not improve
significantly. There were 2.83 million young people between the ages of 18 and 30 in formal
employment by March 2015, up from 2.78 million in December 2013. But this 1.7 per cent
growth in employment was not enough to offset the rising number of young people entering
the job market, and unemployment for this group rose from 39.5 per cent in December 2013
to 42.1 per cent in March 2015. The number of young people unemployed for more than a
year rose to 1.62 million by March 2015, from 1.56 million in December 2013.
ETI Policy Rationale
1.7. The Employment Tax Incentive was introduced by Government as part of a package of
programs to address the social and economic problem of youth unemployment.
1.8. Although the causes of youth unemployment are varied, research highlights in particular:
1 Quarterly Labour Force Survey, Q2 2015
2 For a longer discussion on Youth Unemployment see OECD, 2012 “African Economic Outlook” available at
http://dx.doi.org/10.1787/aeo-2012-en

6
o Young workers are often inexperienced and even after education may not be “job
ready”. Inexperienced workers require training which firms are ill-equipped to provide,
as they may lack the skilled staff to undertake the training or the training costs may be
prohibitively high.
o Perceptions of difficult labour relations and regulations make firms reluctant to hire
“untested” workers, since there is a fear that these untested workers could impose a
heavy burden on the firm.
1.9. The ETI aims to stimulate employment of 18-29 year olds in the formal sector by reducing
the risks and costs associated with hiring younger workers, who tend to be inexperienced.
1.10. It targeted formal sector employers, by using a tax incentive. The Quarterly Labour Force
Survey shows that the formal sector accounts for three quarters of young people’s jobs.
1.11. It sought to encourage new jobs by only being eligible to workers who were hired after 1
October 2013, and by limiting the incentive to two years, by which time the worker will have
received more skills
1.12. It sought to lower the cost of hiring an additional worker as an offset to the costs and risks
described above
1.13. It sought to prevent abuse by legislating that claims had to be linked to minimum wages and
imposing heavy penalties on transgressors
1.14. It sought to avoid subsidising higher earning young workers by lowering the amount that
could be claimed beyond a certain point
1.15. It sought to prevent displacement of older workers by imposing heavy penalties for those
who replaced older workers to access the incentive and possible disqualification by the
Minister of Finance
1.16. It sought to extend the incentive to all workers under special economic zones
ETI Policy Design
1.17. The incentive encourages employers to hire workers between the ages of 18 to 29 years,
who earn less than R6 000 per month.
o These employers must be registered for employees’ tax (PAYE), and must be tax
compliant.
o Public sector employers and domestic workers are not eligible.
o Employees must have a valid ID and cannot be connected or related to the
employer.
o Workers must earn at least the minimum wage, where applicable and as prescribed
by the applicable wage regulating measure, and newly employed on or after 1
October 2013.
O Workers are eligible for 24 monthly claims.
7
1.18. An employer claims the incentive by reducing PAYE payments for every qualifying employee.
o Employers submit monthly reconciliation forms (“EMP201s”) to indicate total PAYE
withheld from employees and transferred to SARS. The ETI is offset against this cash
flow.
o Employers submit annual individual employee tax certificate information (“IRP5s”),
to reconcile their monthly submissions to individual payroll data.
o Employers who have insufficient PAYE liability can claim the ETI as a cash refund. The
cash refunds are not captured in the data set that we analyse.
1.19. The value of the incentive differs according to the employee’s monthly salary. Although
employees qualify for two years of support via the ETI, the support halves in the second
year.
Table 1: ETI monthly incentive value by monthly wage of eligible worker
Monthly remuneration (R)
1 000 1 500 2 000 2 500 3 000 3 500 4 000 4 500 5 000 6 000
Monthly value of incentive (R) in first year
500 750 1 000 1 000 1 000 1 000 1 000 750 500 0
Monthly value of incentive (R) in second year
250 375 500 500 500 500 500 375 250 0
2. EVALUATION OF INCENTIVES
2.1. The evaluation of an incentive requires a consideration of:
2.2. Incidence of the incentive. Who was claiming the incentive, and which workers it was
claimed against; was the incentive claimed by those who were originally targeted
2.3. Positive effects relative to the intended outcome. In this instance, how many jobs were
supported, what were the impacts on beneficiaries
2.4. Negative effects. In the case of the ETI a key question is if there was displacement of other
workers? Did the ETI lower wages of the workers it was claimed against?
2.5. Fiscal effects. How does the ETI compare to other incentives? How large were the
deadweight losses (i.e. how many jobs were new?)
2.6. Administration considerations. How easy was the incentive to use? What constraints does
administration place on incentive design?
2.7. It is important to recognise that all incentive evaluations are to some degree imprecise. In
an ideal world, we would hold all external conditions constant, as is done in the natural
sciences, in order to isolate the impact of the policy change. However, in reality, policy
changes occur in real time, with a constantly changing global and local environment. As a
result we find:
2.8. It can be difficult to isolate the effect of a policy. Outcomes in the dataset such as
employment can be due to changing economic circumstances, rather than the introduction
8
of an incentive. Equally, key areas we are concerned about such as wages or employment
duration are affected by the skills levels of workers and their work experience, which are not
readily observable from administrative data. To identify the impact of the incentive, it is
necessary to decompose any changes observed into an existing trend and the impact of
policy. However, identifying the trend can be challenging, and the methodology used can
influence results.
2.9. Incentives take time to affect behavior. Very few people respond immediately to policy
announcements, and it takes time for awareness to filter into decision making. A short
period of time is unlikely to be sufficient to investigate the full impact of the incentive.
Equally, however, as time passes and awareness increases, it becomes more difficult to
disentangle the effects of the policy and other factors, such as economic performance.
2.10. The different sources of information to evaluate an incentive each suffer from drawbacks.
2.11. Quantitative data are open to interpretation. Assumptions are made in any data analysis,
which can affect results. This is why these need to be laid out in a systematic fashion and the
dataset interrogated for potential bias. Analysis should use different assumptions where bias
is suspected in order to monitor the impact of these assumptions on the final outputs.
2.12. Qualitative data such as consultations are open to interpretation. Often, interested
individuals are more likely to respond than those who are ambivalent, potentially skewing
the results. It is not always possible to be certain that you are consulting actual decision
makers, and responses from those questioned may be based on perception rather than
actual behavior. It is hard to check the strength or impact of these assumptions.
2.13. A descriptive report such as this does not enable us to answer all these questions. However,
it does provide the opportunity to consider the incidence of the incentive, as well as some
preliminary analysis on the positive and negative effects. Econometric studies attempt to
understand causal links and more difficult questions such as whether the jobs supported by
the ETI are “new”, or are jobs that would otherwise have been lost. This is an important
compliment to any analysis of the ETI.
3. DATA
3.1. This report makes use of a unique dataset made available to National Treasury by SARS for
the purposes of policy evaluation. This dataset has not been used in this manner for detailed
policy evaluation before, and as a result, significant attention is devoted to explaining the
dataset, in order to inform policy makers, social partners and interested members of the
public.
Tax data available on the ETI
3.2. Tax data allows monitoring of the ETI through two types of submissions:
o Monthly employer reconciliations (EMP201) and bi-annual employer reconciliations
(EMP501) summarise the rand amount claimed by firms for the ETI and allow for an
analysis of the types of firms who are claiming the ETI.
9
o The individual employee certificates (IRP5 and IT3) provide detail on the individual
employees the ETI is claimed against, as well as the types of firms employing the
individuals.
3.3. Announcements on the amount of money claimed for the ETI are based on the monthly
employer reconciliations (EMP201s), because they are available in “real time” (with a one
month lag).
3.4. However, since this form only contains estimates on rand amounts claimed per firm, and
does not contain any information on individuals, it cannot estimate the number of
beneficiaries or be used for a review of the effectiveness of the ETI.
3.5. The more detailed individual employee certificates (IRP5 and IT3) are used as the basis of
this report. SARS released this information to National Treasury as part of an anonymised
tax database3 for the 2013/14 and 2014/15 tax years, with a subset of the variables.
3.6. The individual employee tax certificate data are only available with a significant time lag of
between 12 and 18 months, since they are only filed once a year, in May.
The individual employee tax certificate dataset (IRP5 / IT3)
3.7. The individual employee tax certificate dataset supplied by SARS contains information on
each registered employee, drawn from each IRP5 / IT3 certificate submitted by a firm. These
IRP5 / IT3 certificates contain information such as the date of birth of the worker; the period
the individual was employed from and to; the income earned by the individual at the firm
over the period according to different types of income codes; an encrypted South African ID
number; an encrypted employer PAYE reference number; whether the firm claimed the ETI
for the individual; and if so, the amount claimed.
3.8. This dataset includes ALL firms4 which have submitted IRP5 / IT3 certificates. The data set
captures the entire population of formal sector firms who could claim the ETI and those that
do. Econometric studies based on this dataset will therefore not be subject to sampling bias.
3.9. While this is the most complete data set on formal employment, it is still limited to the
information contained in tax forms. This limits the complexity of the analysis of individuals’
and firms’ characteristics. In addition, there may still be potential sources of uncertainty
and error in the results presented in this paper. Sources of this could be:
o Certain types of firms may not submit these returns, or certain type of jobs or
individuals may be excluded from these submissions. An IRP5 certificate is issued for
an employee if remuneration is paid and tax on that remuneration has been
deducted. If no tax has been deducted, and the employee remuneration is equal or
greater than R2 000 per year, then an IT3 certificate is issued. Firms with workers
that only earn below the R2 000 per year will not be captured in the database.
o There may be data entry errors that occur when firms (or the representative of the
firm responsible) enter certificate fields. While we do statistical checks, we cannot
be certain all errors have been identified.
3 All identifying information of taxpayers was anonymised and encrypted, so that sensitive information, such as earnings,
age, ID numbers and PAYE reference numbers cannot be traced by an individual or firm. 4 We formally define what we mean by a ‘firm’ in the definitions section of the report.
10
o The dataset does not contain any confidential information, including ID numbers. As
a result, certain variables such as age are based on a separate entry on the IRP5 /
IT3 form, which are often incorrectly filled in. This introduces a margin of error and
could cause a difference in this paper’s results and published SARS data.
o The dataset is drawn at a point of time, and does not capture submissions or
revisions to the data made after that point on firm tax form submissions.
Furthermore, if a PAYE liability is incorrectly stated in the IRP5 forms, any
adjustments (such as a further payment to or refund from SARS) will not reflect in
future individual PAYE statements.
Procedures for cleaning tax data
3.10. The individual employee certificate data has not been used before in the evaluation of an
incentive, and required cleaning to make it suitable for policy analysis. The section below
details the choices in this data cleaning in order to promote transparency. The full impact on
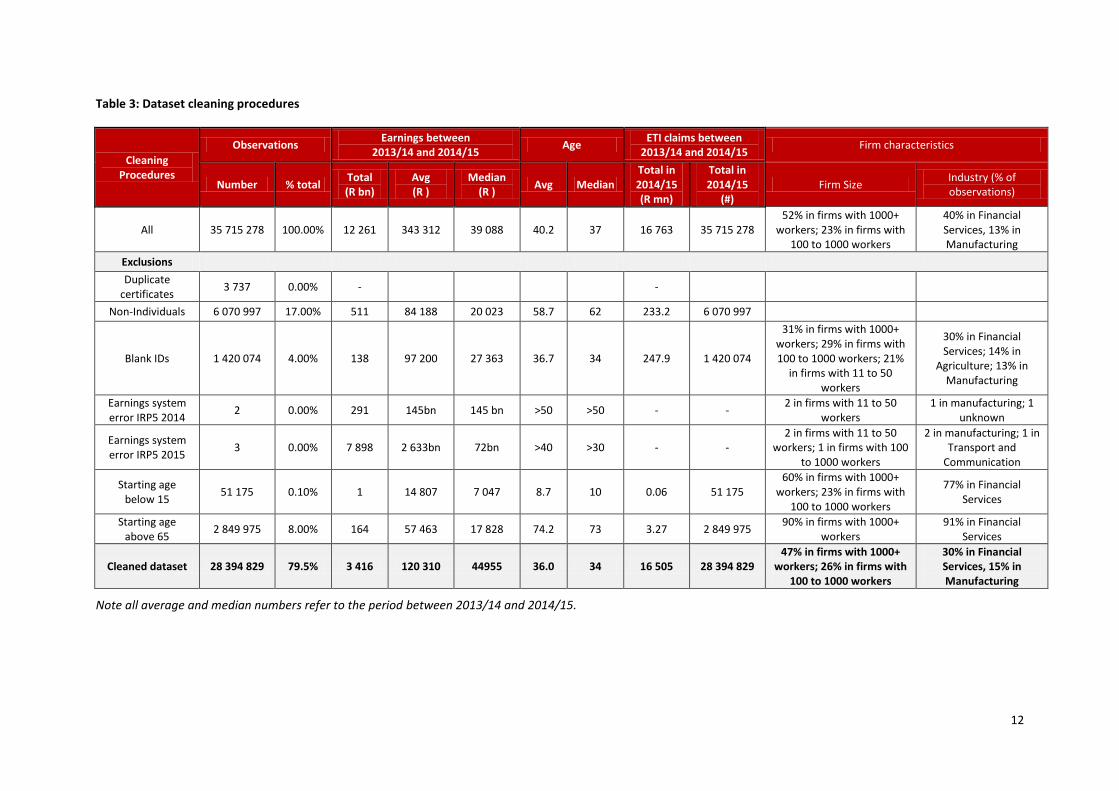
the dataset is outlined in more detail in Table 3.
3.11. Multiple versions of the same certificate were dropped. A number of individuals have
multiple certificates with the same firm for the same tax year, but only one is actually
submitted on the basis of tax liabilities.5 These represented less than 0.02% of all
observations. Unfortunately, it is not possible to identify which of the duplicate IRP5
certificates were the most recent. Only the first record (in other words, the record first
lodged with SARS) was kept, on the assumption that data extraction was consistent and the
first record would be the most accurate.
3.12. Any IRP5 certificates issued to non-individuals, such as partnerships, were dropped. These
were identified by the field entitled “Nature of Person Description”. This constituted 17 per
cent of the original individual employee certificates. It is necessary to exclude these
observations so that our analysis is of actual worker and firm relationships.
3.13. Entries with no ID numbers were dropped to facilitate comparisons of worker employment
histories over time. As a result, the analysis excludes foreign workers, asylum seekers and
those whose ID numbers were incorrectly completed in the PAYE form. This amounted to 4%
of observations. The impact on the results should be small: individuals without ID numbers
average ETI claim was R175. The median age of individuals without an ID is 34 years, and
median earnings are R27 363, almost five times the monthly rate workers eligible for the ETI
earn.
3.14. Obvious errors in earnings were removed. Five observations were removed, as annual
earnings were higher than R145 billion in IRP5 2014 dataset and R13.5 billion in the IRP5
2015 dataset, likely caused by incorrect data entry. The small number of observations is
unlikely to affect the results.
3.15. Those below 15 and over 65 years old were removed to be consistent with the generally
accepted age range of the labour market. This is unlikely to affect the analysis of the ETI: the
median age of those under 15 was 9 and total ETI claims over 14 months was less than
5 This could be as a result of firms issuing a new certificate in the event of mistakes or changes to employment duration
11
R60 0006. The average ETI claim per worker over 65 was R1.15, and median earnings were
well above that of the ETI.7
3.16. Individuals are defined as those with individual employee certificate and a unique encrypted
South African ID number.
3.17. Firms are identified as employer entities with a unique (anonymised) firm PAYE reference
number. This is not exactly the same as the most commonly used description of a firm, since
a large business entity could run multiple payrolls. As a result, there may be some double-
counting in job movement, as a company may have multiple tax reference numbers and
individuals may shift between these tax reference numbers – particularly if the firms make
use of decentralised payrolls.
3.18. The main unit of analysis in the dataset is the “job”: a unique individual (using encrypted ID
number) and a unique firm (using PAYE Reference number) combination. In 2013/14 there
were 13 187 230 jobs and there were 13 467 902 jobs in 2014/15.
3.19. A job spell is the length of time an individual works for a firm over an uninterrupted
period, and is indicated by the presence of a unique IRP5 certificate. Analysis of ‘job spell’
helps us understand the nature of the employment contract. In our dataset there were
14 644 822 job spells in 2013/14 and 15 015 996 in 2014/15.
3.20. One person working for the same firm for multiple job spells would still be counted as a
single job. Individuals with multiple job spells in the same company make up approximately
5% of the total dataset. Analysis of ‘jobs’ helps us understand the impact of the ETI on the
willingness to hire. In 2013/14, there were 13 187 230 jobs and there were 13 467 902 jobs
in 2014/15.
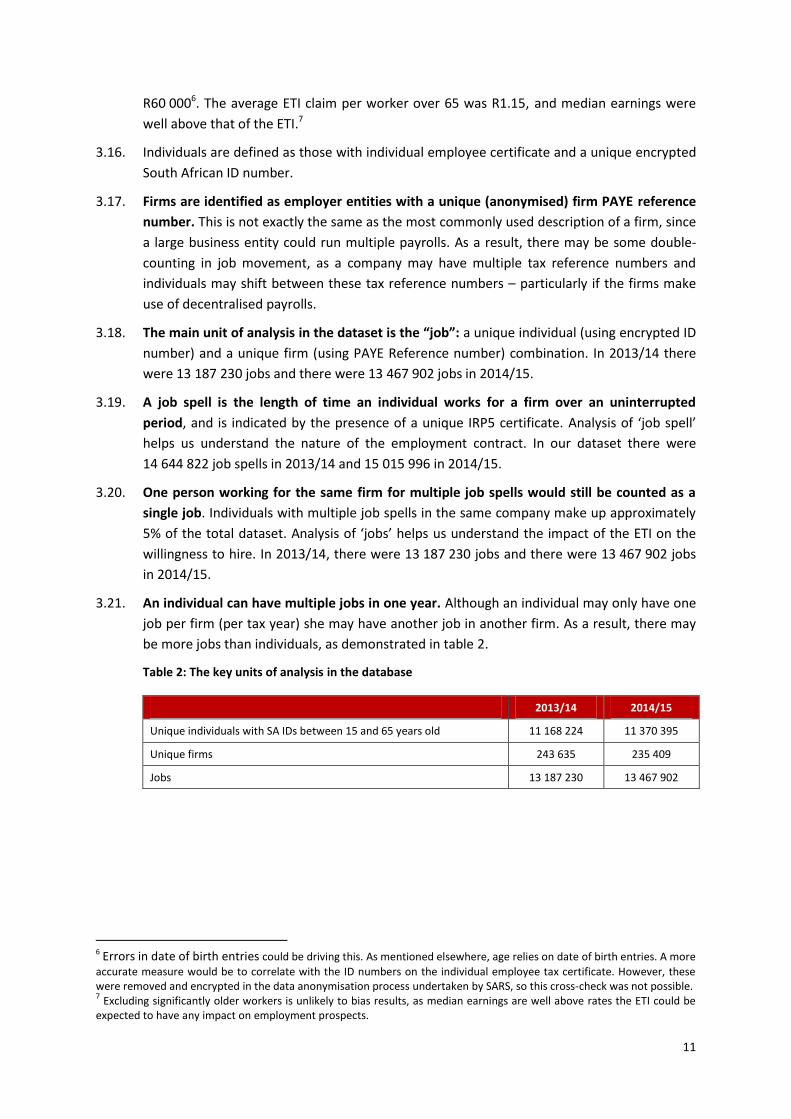
3.21. An individual can have multiple jobs in one year. Although an individual may only have one
job per firm (per tax year) she may have another job in another firm. As a result, there may
be more jobs than individuals, as demonstrated in table 2.
Table 2: The key units of analysis in the database
2013/14 2014/15
Unique individuals with SA IDs between 15 and 65 years old 11 168 224 11 370 395
Unique firms 243 635 235 409
Jobs 13 187 230 13 467 902
6 Errors in date of birth entries could be driving this. As mentioned elsewhere, age relies on date of birth entries. A more
accurate measure would be to correlate with the ID numbers on the individual employee tax certificate. However, these were removed and encrypted in the data anonymisation process undertaken by SARS, so this cross-check was not possible. 7 Excluding significantly older workers is unlikely to bias results, as median earnings are well above rates the ETI could be
expected to have any impact on employment prospects.
12
Table 3: Dataset cleaning procedures
Cleaning Procedures
Observations Earnings between
2013/14 and 2014/15 Age
ETI claims between 2013/14 and 2014/15
Firm characteristics
Number % total Total (R bn)
Avg (R )
Median (R )
Avg Median Total in 2014/15 (R mn)
Total in 2014/15
(#) Firm Size
Industry (% of observations)
All 35 715 278 100.00% 12 261 343 312 39 088 40.2 37 16 763 35 715 278 52% in firms with 1000+
workers; 23% in firms with 100 to 1000 workers
40% in Financial Services, 13% in Manufacturing
Exclusions
Duplicate certificates
3 737 0.00% -
-
Non-Individuals 6 070 997 17.00% 511 84 188 20 023 58.7 62 233.2 6 070 997
Blank IDs 1 420 074 4.00% 138 97 200 27 363 36.7 34 247.9 1 420 074
31% in firms with 1000+ workers; 29% in firms with 100 to 1000 workers; 21%
in firms with 11 to 50 workers
30% in Financial Services; 14% in
Agriculture; 13% in Manufacturing
Earnings system error IRP5 2014
2 0.00% 291 145bn 145 bn >50 >50 - - 2 in firms with 11 to 50
workers 1 in manufacturing; 1
unknown
Earnings system error IRP5 2015
3 0.00% 7 898 2 633bn 72bn >40 >30 - - 2 in firms with 11 to 50
workers; 1 in firms with 100 to 1000 workers
2 in manufacturing; 1 in Transport and
Communication
Starting age below 15
51 175 0.10% 1 14 807 7 047 8.7 10 0.06 51 175 60% in firms with 1000+
workers; 23% in firms with 100 to 1000 workers
77% in Financial Services
Starting age above 65
2 849 975 8.00% 164 57 463 17 828 74.2 73 3.27 2 849 975 90% in firms with 1000+
workers 91% in Financial
Services
Cleaned dataset 28 394 829 79.5% 3 416 120 310 44955 36.0 34 16 505 28 394 829 47% in firms with 1000+
workers; 26% in firms with 100 to 1000 workers
30% in Financial Services, 15% in Manufacturing
Note all average and median numbers refer to the period between 2013/14 and 2014/15.
Construction of key variables from the dataset
3.22. The individual employee certificates are compiled for tax purposes. It is necessary to make
adjustments to the data in order to derive economically meaningful variables.
3.23. Starting Age is defined in this case as the age when the individual started the job. It is
calculated using the date of birth and the date provided for the start of the employment
period.
o This definition of age is advantageous as it enables us to check for eligibility at the
time of employment under the ETI. One disadvantage of calculating age this way is
that we are not able to check eligibility if an individual remains in the same ETI-
supported job and turns 30 within the same tax year.
o The accuracy of this variable is largely dependent on the accuracy of data entry for
the date of birth and start date fields. It is not possible to check the accuracy of
these estimates with ID numbers as these were encrypted and anonymised.
3.24. Duration of employment within the tax year is calculated as the difference between the end
and start date of the period of employment as specified on the IRP5 certificate. There are a
number of factors which may affect the accuracy of this estimate.
o As this is not a compulsory field, employers may not have paid much attention to the
accuracy of these numbers. If end and start dates may not accurately reflect the
actual dates the employee started or ended the period of employment, estimates of
duration of employment or eligibility for ETI may be incorrectly calculated. It is
impossible to know the magnitude or in which direction this will affect the results.
o Obviously incorrectly completed forms result in errors such that end dates precede
start dates, which occurs in less than 1 per cent of observations. Less than 0.1% of
observations have missing values in either the job start date and job end date.
Measurement error of this nature is likely to be randomly distributed and therefore
unlikely to affect results.
3.25. Previous work experience in the 2014/15 tax year is represented as a dummy/binary
variable which indicates whether the individual (as identified by their unique encrypted ID
number) was present in the dataset for the 2013/14 tax year
3.26. Earnings are calculated as the sum of gross non-taxable income amount, gross retirement
fund income amount and gross non-retirement fund income account. This is the amount
earned in that job over the tax year.
3.27. Monthly earnings are calculated by dividing the earnings amount by the period worked
(converted into months). Monthly earnings are required as ETI eligibility is based on monthly
earnings.
o This variable is dependent on the reliability of the job duration variable.
o Furthermore, as there is no information on the hours worked, the monthly
earnings variable could be affected. Those individuals who work more hours (for
example through overtime, or if their work period is inaccurately captured) will have
calculated monthly incomes higher than their actual monthly income; those who
14
work fewer hours will have calculated monthly incomes lower than their actual
incomes. It is impossible to know the magnitude or in which direction this would
affect the results.
o Errors in monthly earnings estimates could also impact our assessment of the
eligibility of claims. Provided there is not a systematic difference in hours worked
across different age groups, this should not affect the results of this study in terms of
the relative impact on the youth and other age groups. If there is a systematic
difference in hours worked across industries, it would affect how to interpret trends
across industries.
3.28. Firm-level employment is calculated as the weighted sum of full-time yearly equivalent
employment within that establishment. Thus a worker who worked only half a year would
count as 0.5, compared to a worker employed for the full 12 months, who would count as 1.
As it is reliant on an assumption on job duration, it suffers from the same problems as
outlined in 3.26.
3.29. The industry/sector of employment is based on the sectors reported in the IRP5 / IT3 and is
aggregated to firm level through taking the mode (the most common) sector of employment
reported.
o The industry classification used here is a self-reported measure, and is not strictly
comparable to SIC classifications used by Stats SA.
o There are 12 533 firms that could not be classified by sector in IRP5 / IT3 2015 data.
This amounts to 5% of firms. This means analysis of sector trends in relation to other
data sets should be treated with some caution.
3.30. There are a number of individual characteristics which cannot be determined from the
anonymised data currently available to National Treasury, and are thus not used in the
analysis, including :
o Gender;
o Education;
o Race;
o Location.
Adjusting the data set for compliance
3.31. With any incentive, there will be ineligible claims. SARS undertakes regular audits in order
to ensure that ineligible claims are investigated and the monies returned. However, the
dataset available to National Treasury does not incorporate revisions to incorrect claims, so
it is necessary to exclude these invalid claims in order to ensure we are able to measure the
impact of the ETI as it is being applied in reality.
3.32. This section highlights what steps were taken to determine whether or not an ETI claim is
recognised as compliant. If an ETI claim is considered non-compliant according to the criteria
defined below, the information relating to the individual worker will remain, but the ETI
claim will not be recognised.
15
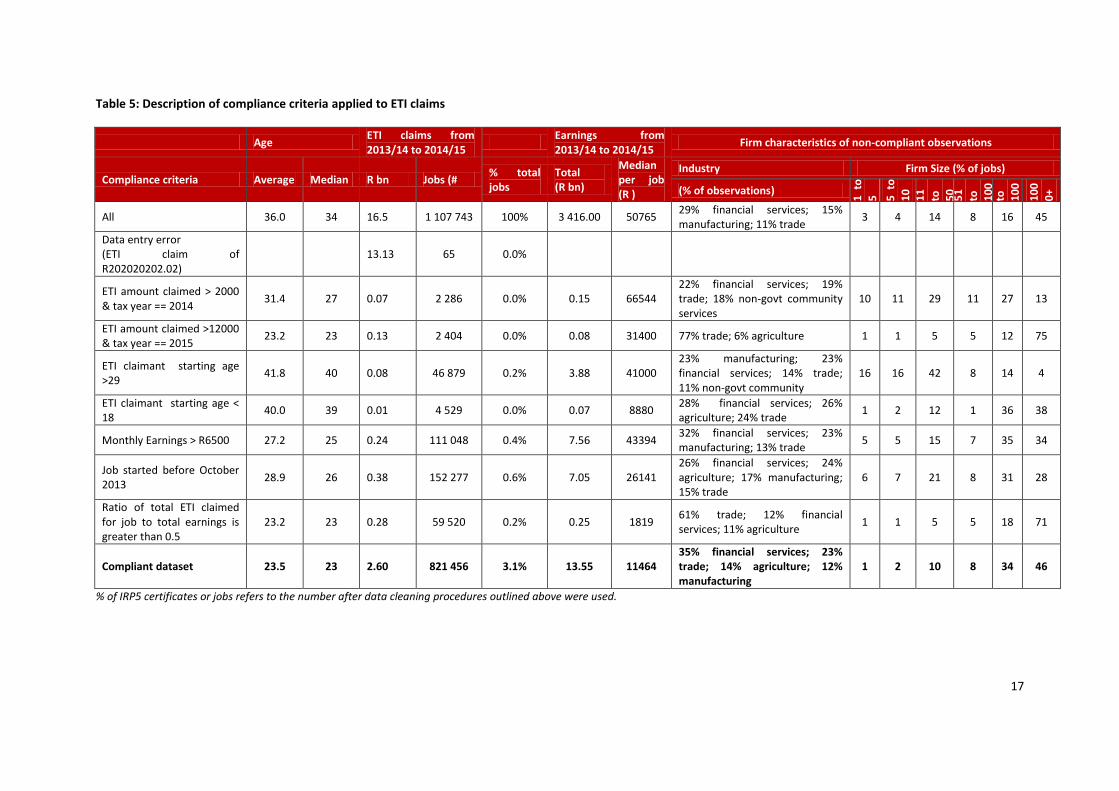
3.33. The individual employee certificate dataset has an initial estimate of R16.8bn in ETI claims in
2013/14 and 2014/15, well above the estimates for monthly employer reconciliations of
R2.5bn over this same period.8 R13.1bn of this is due to 65 entries in 2013/14 which have an
identical claim of R202 020 202.02 in the individual employee certificates.
3.34. When we exclude these entries, the individual employee certificate dataset is much closer to
the monthly employer reconciliations, although we still perform further compliance checks,
the full details of which can be found in Table 5.
3.35. The two critical variables to check for compliance are the age of the person when starting
the job, and the monthly income earned by the individual. Both of these variables are
derived from the data available in the dataset.
3.36. The starting age of a worker is derived by subtracting the job start date and the date of
birth. It is important to note that since neither of these date fields has previously been used
in tax compliance, there may be substantial errors in both data fields.
3.37. The monthly income is calculated by dividing total gross earnings by job duration (giving
daily earnings) and assuming a 22.75 day month.
3.38. We exclude observations where the amount of ETI claimed was above the maximum
allowable amount that can be claimed. Any ETI claims by a firm for a given individual more
than R2 000 for 2014/15 and R12 000 in 2014/15 were excluded, based on the maximum of
R1 000 per month that can be claimed for an individual in the first year of the ETI.9
3.39. We exclude observations where the average monthly earnings of individuals in ETI
supported jobs were above R6500, in a given tax year. ETI legislation only allows claims for
individuals earning monthly income of up to R6000 per month. However, it is conceivable
that employees receive commission or a bonus in one month that may push them above the
ETI limit in that month, before falling back on their basic gross salary in other months. It
would therefore not be desirable to exclude all ETI related information on individuals who
may for a limited time exceed the R6 000 monthly limit.
3.40. We exclude claims where the starting age in ETI supported jobs were outside the eligible age
range of 18 years old to 29 years old. We do not exclude individuals who turn 30 during the
course of the tax year, and who may have become ineligible over the course of the tax year.
3.41. We exclude observations where the ETI supported job existed before 1st October 2013.
The ETI act aimed to support jobs not yet created, but the Act does allow those who started
new jobs from the 1st October to be claimed for from January. This was designed to prevent
employers firing recently hired employees and re-hiring the same employees to take
advantage of the incentive. There are 152 277 of these observations; the average ETI claim
for these observations over two years is R2 526.
8 Based on cash data for tax years, as reported in monthly employer reconciliation data.
9 The maximum amounts differ since the IRP5 2014 dataset contains only 2 months of potential employment through the
ETI, and IRP5 2015 a full 12 months. These calculations are based on a maximum of R1000 per month in the first year of claiming the ETI.
16
3.42. We also exclude all observations where the ratio between ETI claimed in the year and the
annual earnings of the individual was over 0.5, implying calculation or system error. This
accounted for 59 520 observations, with an average annual ETI claim amount of R4 672.
3.43. We could not exclude those non-compliant with minimum wage legislation. Compliance to
minimum wage legislation is a legislative requirement to be eligible for the ETI, but minimum
wages are not reported in the tax certificates. We are unable to estimate with any precision
which legislated minimum wage applies to each worker, since these are set through a
combination of sectoral determinations, bargaining council agreements (some extended)
and firm-level agreements.
3.44. The outcome of these exclusions yields results broadly consistent with SARS’ estimates of
compliance. We therefore are reasonably confident that these numbers accurately reflect
actual claims, although there will naturally be some measurement error. SARS investigations
into non-compliance continue, in order to ensure that ineligible amounts are reclaimed.
Summary of data cleaning procedures on individual employee certificate data
3.45. In summary, National Treasury analysis of the IRP5 / IT3 data excludes all individuals who do
not have a South African ID, or those whose age or monthly income would make them
ineligible to receive the ETI. It also excludes all obvious data entry errors.
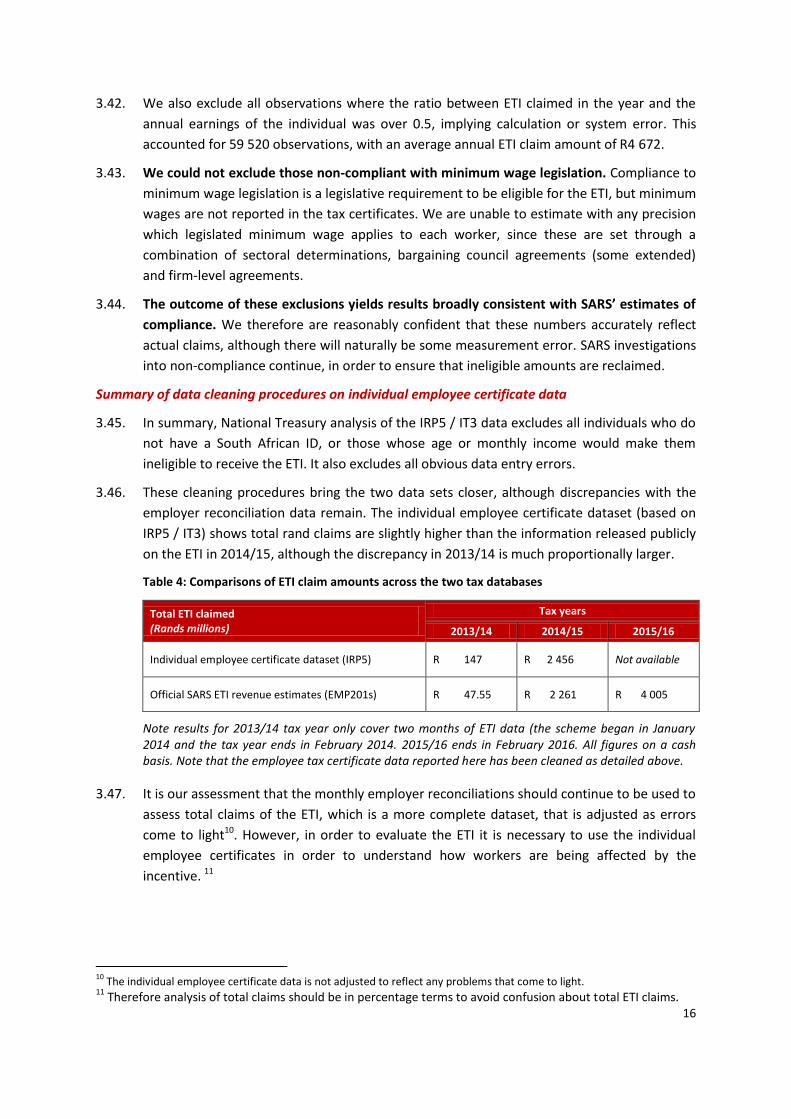
3.46. These cleaning procedures bring the two data sets closer, although discrepancies with the
employer reconciliation data remain. The individual employee certificate dataset (based on
IRP5 / IT3) shows total rand claims are slightly higher than the information released publicly
on the ETI in 2014/15, although the discrepancy in 2013/14 is much proportionally larger.
Table 4: Comparisons of ETI claim amounts across the two tax databases
Total ETI claimed (Rands millions)
Tax years
2013/14 2014/15 2015/16
Individual employee certificate dataset (IRP5) R 147 R 2 456 Not available
Official SARS ETI revenue estimates (EMP201s) R 47.55 R 2 261 R 4 005
Note results for 2013/14 tax year only cover two months of ETI data (the scheme began in January 2014 and the tax year ends in February 2014. 2015/16 ends in February 2016. All figures on a cash basis. Note that the employee tax certificate data reported here has been cleaned as detailed above.
3.47. It is our assessment that the monthly employer reconciliations should continue to be used to
assess total claims of the ETI, which is a more complete dataset, that is adjusted as errors
come to light10. However, in order to evaluate the ETI it is necessary to use the individual
employee certificates in order to understand how workers are being affected by the
incentive. 11
10
The individual employee certificate data is not adjusted to reflect any problems that come to light. 11
Therefore analysis of total claims should be in percentage terms to avoid confusion about total ETI claims.
17
Table 5: Description of compliance criteria applied to ETI claims
Age ETI claims from 2013/14 to 2014/15
Earnings from 2013/14 to 2014/15
Firm characteristics of non-compliant observations
Compliance criteria Average Median R bn Jobs (# % total jobs
Total (R bn)
Median per job (R )
Industry Firm Size (% of jobs)
(% of observations)
1 t
o
5
5 t
o
10
1
1
to
50
5
1
to
10
0
10
0
to
10
0
0
10
0
0+
All 36.0 34 16.5 1 107 743 100% 3 416.00 50765 29% financial services; 15% manufacturing; 11% trade
3 4 14 8 16 45
Data entry error (ETI claim of R202020202.02)
13.13 65 0.0%
ETI amount claimed > 2000 & tax year == 2014
31.4 27 0.07 2 286 0.0% 0.15 66544 22% financial services; 19% trade; 18% non-govt community services
10 11 29 11 27 13
ETI amount claimed >12000 & tax year == 2015
23.2 23 0.13 2 404 0.0% 0.08 31400 77% trade; 6% agriculture 1 1 5 5 12 75
ETI claimant starting age >29
41.8 40 0.08 46 879 0.2% 3.88 41000 23% manufacturing; 23% financial services; 14% trade; 11% non-govt community
16 16 42 8 14 4
ETI claimant starting age < 18
40.0 39 0.01 4 529 0.0% 0.07 8880 28% financial services; 26% agriculture; 24% trade
1 2 12 1 36 38
Monthly Earnings > R6500 27.2 25 0.24 111 048 0.4% 7.56 43394 32% financial services; 23% manufacturing; 13% trade
5 5 15 7 35 34
Job started before October 2013
28.9 26 0.38 152 277 0.6% 7.05 26141 26% financial services; 24% agriculture; 17% manufacturing; 15% trade
6 7 21 8 31 28
Ratio of total ETI claimed for job to total earnings is greater than 0.5
23.2 23 0.28 59 520 0.2% 0.25 1819 61% trade; 12% financial services; 11% agriculture
1 1 5 5 18 71
Compliant dataset 23.5 23 2.60 821 456 3.1% 13.55 11464 35% financial services; 23% trade; 14% agriculture; 12% manufacturing
1 2 10 8 34 46
% of IRP5 certificates or jobs refers to the number after data cleaning procedures outlined above were used.
18
4. DESCRIPTIVE STATISTICS OF EMPLOYMENT TAX INCENTIVE
4.1. All data used in this section is based on the 2013/14 and 2014/15 individual employee tax
certificates, cleaned as per the sections outlined above.
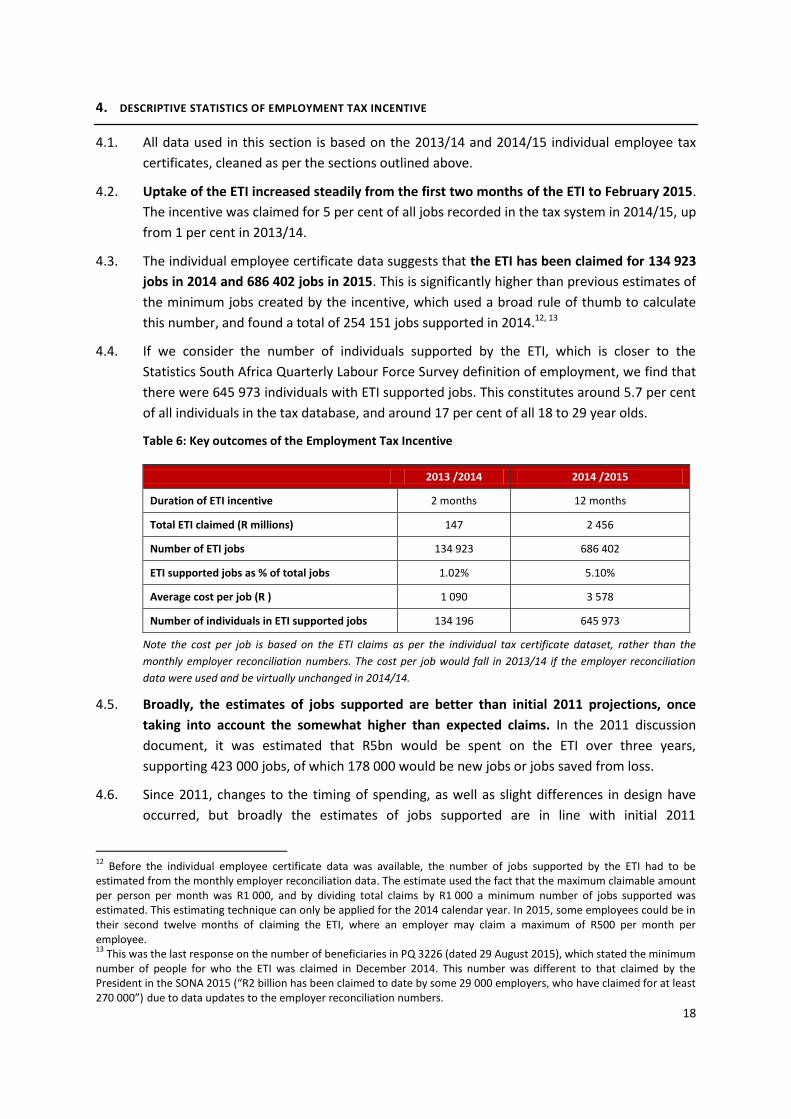
4.2. Uptake of the ETI increased steadily from the first two months of the ETI to February 2015.
The incentive was claimed for 5 per cent of all jobs recorded in the tax system in 2014/15, up
from 1 per cent in 2013/14.
4.3. The individual employee certificate data suggests that the ETI has been claimed for 134 923
jobs in 2014 and 686 402 jobs in 2015. This is significantly higher than previous estimates of
the minimum jobs created by the incentive, which used a broad rule of thumb to calculate
this number, and found a total of 254 151 jobs supported in 2014.12, 13
4.4. If we consider the number of individuals supported by the ETI, which is closer to the
Statistics South Africa Quarterly Labour Force Survey definition of employment, we find that
there were 645 973 individuals with ETI supported jobs. This constitutes around 5.7 per cent
of all individuals in the tax database, and around 17 per cent of all 18 to 29 year olds.
Table 6: Key outcomes of the Employment Tax Incentive
2013 /2014 2014 /2015
Duration of ETI incentive 2 months 12 months
Total ETI claimed (R millions) 147 2 456
Number of ETI jobs
134 923 686 402
ETI supported jobs as % of total jobs 1.02% 5.10%
Average cost per job (R ) 1 090 3 578
Number of individuals in ETI supported jobs 134 196 645 973
Note the cost per job is based on the ETI claims as per the individual tax certificate dataset, rather than the
monthly employer reconciliation numbers. The cost per job would fall in 2013/14 if the employer reconciliation
data were used and be virtually unchanged in 2014/14.
4.5. Broadly, the estimates of jobs supported are better than initial 2011 projections, once
taking into account the somewhat higher than expected claims. In the 2011 discussion
document, it was estimated that R5bn would be spent on the ETI over three years,
supporting 423 000 jobs, of which 178 000 would be new jobs or jobs saved from loss.
4.6. Since 2011, changes to the timing of spending, as well as slight differences in design have
occurred, but broadly the estimates of jobs supported are in line with initial 2011
12
Before the individual employee certificate data was available, the number of jobs supported by the ETI had to be estimated from the monthly employer reconciliation data. The estimate used the fact that the maximum claimable amount per person per month was R1 000, and by dividing total claims by R1 000 a minimum number of jobs supported was estimated. This estimating technique can only be applied for the 2014 calendar year. In 2015, some employees could be in their second twelve months of claiming the ETI, where an employer may claim a maximum of R500 per month per employee. 13
This was the last response on the number of beneficiaries in PQ 3226 (dated 29 August 2015), which stated the minimum number of people for who the ETI was claimed in December 2014. This number was different to that claimed by the President in the SONA 2015 (“R2 billion has been claimed to date by some 29 000 employers, who have claimed for at least 270 000”) due to data updates to the employer reconciliation numbers.
19
projections, once taking into account the somewhat higher than expected claims. For
example, in the original survey design, it was envisaged that the ETI would be open to new
jobs for 18 to 29 year olds earning R5 000 a month or less, as well as existing jobs for 18 to
24 year olds earning less than R5 000 a month or less. Following consultations, the wage
eligibility was increased to R6 000 a month, but eligibility was restricted to new jobs, as
defined as those created on or after 1st October 2013.
4.7. It is not possible to use descriptive data to determine whether these supported jobs are new
jobs created, jobs that have been saved from being lost or jobs that would have been
created anyway. To make this estimate, it is necessary to make assumptions about what
might have happened in the absence of the ETI. Econometric studies provide a tool for doing
this.
4.8. Based on these costs, we estimate the cost per job to be around R3 578. This will vary
according to firm and employee type.
Which workers are firms claiming for?
4.9. The ETI seems to be successfully reaching the target group of 18-29 year olds, in particular
the younger cohort of this age group. The majority of the jobs supported by the ETI in the
tax year 2014/2015 are for those between 21 and 25 years of age (Figure 1). The ETI
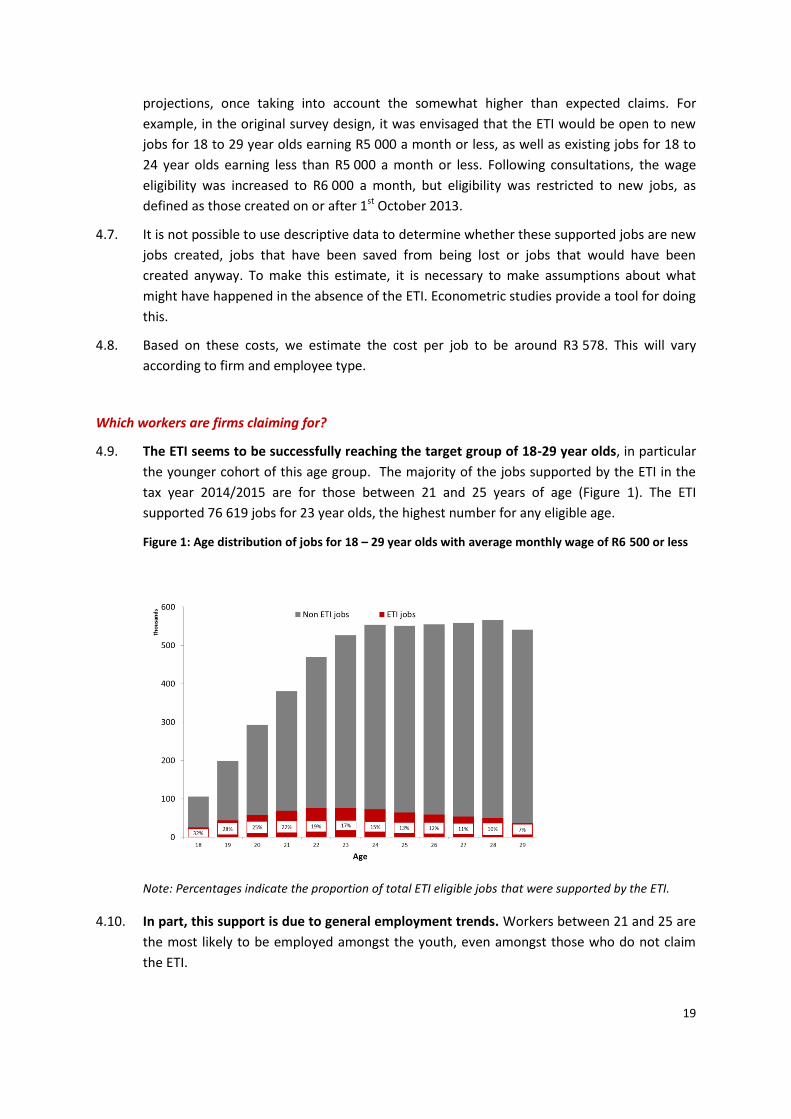
supported 76 619 jobs for 23 year olds, the highest number for any eligible age.
Figure 1: Age distribution of jobs for 18 – 29 year olds with average monthly wage of R6 500 or less
Note: Percentages indicate the proportion of total ETI eligible jobs that were supported by the ETI.
4.10. In part, this support is due to general employment trends. Workers between 21 and 25 are
the most likely to be employed amongst the youth, even amongst those who do not claim
the ETI.
20
4.11. The ETI seems to be providing the most support to the youngest youth workers. Although
the ETI supported around 15 per cent of all jobs across the entire youth cohort, it supported
32 per cent of jobs for those who are 18 years old and 19 per cent of those who are 22 years
old, compared to just 10 per cent of those who are 28 years old. This may be because
younger workers in the ETI group are more likely to be in ‘new’ jobs.
4.12. The difference in age composition between those claiming the ETI and those not claiming
the ETI is likely to have a bearing on other employment outcomes such as wages and job
duration. Therefore care should be taken in making direct comparisons between these
groups, particularly since it is not possible to control for other critical factors such as
education and work experience.
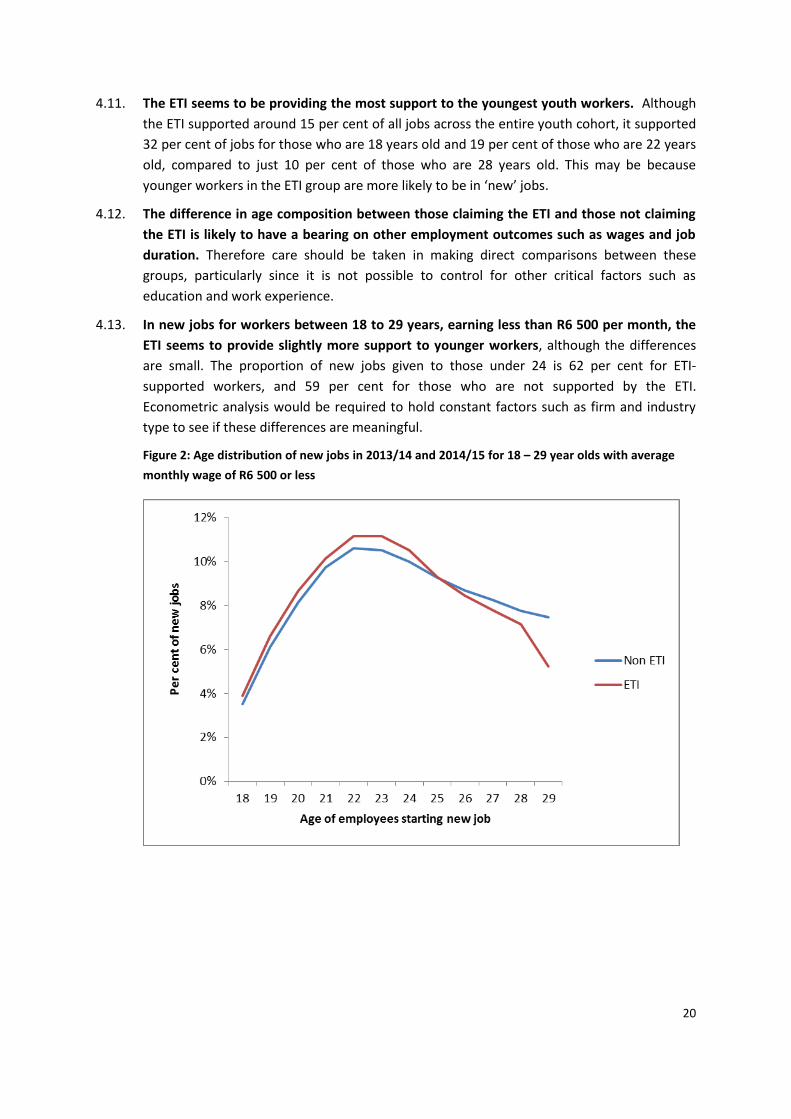
4.13. In new jobs for workers between 18 to 29 years, earning less than R6 500 per month, the
ETI seems to provide slightly more support to younger workers, although the differences
are small. The proportion of new jobs given to those under 24 is 62 per cent for ETI-
supported workers, and 59 per cent for those who are not supported by the ETI.
Econometric analysis would be required to hold constant factors such as firm and industry
type to see if these differences are meaningful.
Figure 2: Age distribution of new jobs in 2013/14 and 2014/15 for 18 – 29 year olds with average
monthly wage of R6 500 or less
21
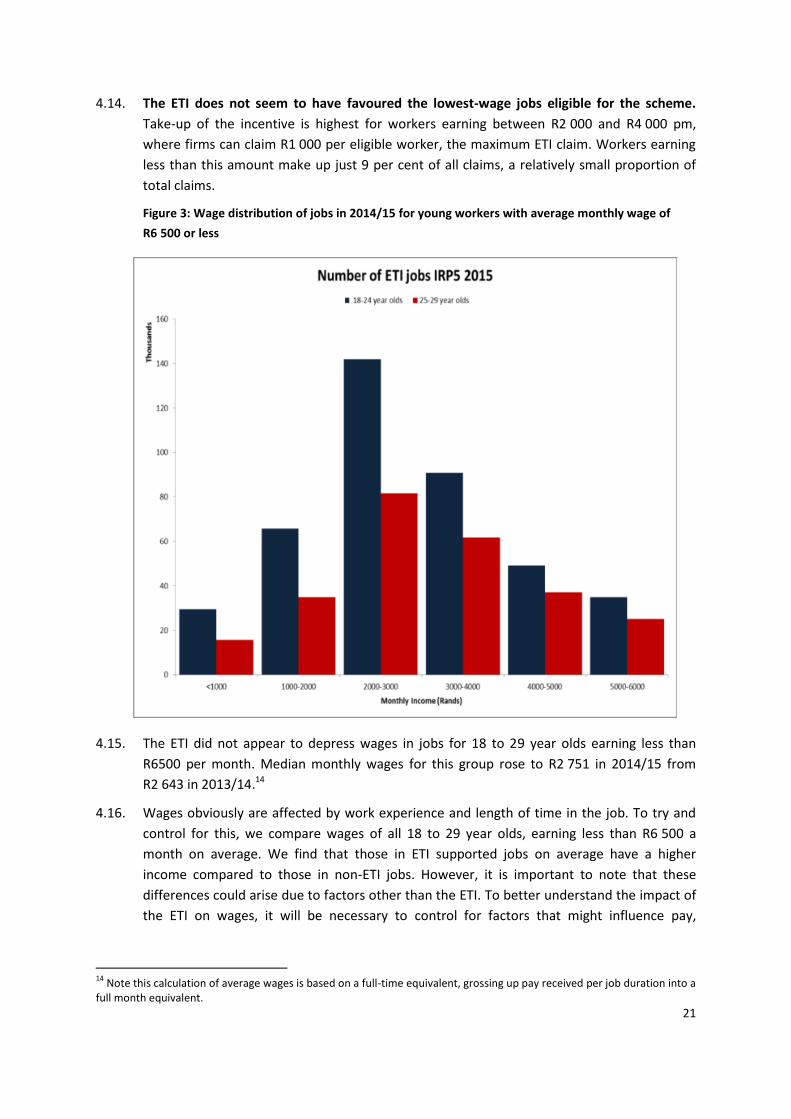
4.14. The ETI does not seem to have favoured the lowest-wage jobs eligible for the scheme.
Take-up of the incentive is highest for workers earning between R2 000 and R4 000 pm,
where firms can claim R1 000 per eligible worker, the maximum ETI claim. Workers earning
less than this amount make up just 9 per cent of all claims, a relatively small proportion of
total claims.
Figure 3: Wage distribution of jobs in 2014/15 for young workers with average monthly wage of
R6 500 or less
4.15. The ETI did not appear to depress wages in jobs for 18 to 29 year olds earning less than
R6500 per month. Median monthly wages for this group rose to R2 751 in 2014/15 from
R2 643 in 2013/14.14
4.16. Wages obviously are affected by work experience and length of time in the job. To try and
control for this, we compare wages of all 18 to 29 year olds, earning less than R6 500 a
month on average. We find that those in ETI supported jobs on average have a higher
income compared to those in non-ETI jobs. However, it is important to note that these
differences could arise due to factors other than the ETI. To better understand the impact of
the ETI on wages, it will be necessary to control for factors that might influence pay,
14
Note this calculation of average wages is based on a full-time equivalent, grossing up pay received per job duration into a full month equivalent.
22
including the sectors in which jobs are created, the pay of ETI claiming firms versus non ETI
claiming firms.
Table 7 Monthly wages of all new jobs in 2014/15 for 18 – 29 year olds with average monthly wage
of R6 500 or less
Average monthly wage Median monthly wage
Non ETI supported job 2 340 2 122
ETI supported job 2 980 2 809
All new jobs within age and monthly wage range 2 560 2 429
Note that all monthly wage calculations have been adjusted to full time monthly equivalent, which accounts for differences in job duration.
4.17. Job duration does not seem to have been adversely affected by the introduction of the ETI,
with median job duration for workers between 18 and 29 earning less than R6 500 per
month on average remaining virtually unchanged at 241 days in 2014/15 from 243 days in
2013/14.
4.18. Since job duration is likely to be heavily influenced by whether the job is new or not, it is
important to compare outcomes from ETI supported and non-ETI supported for new jobs for
18 to 29 year olds, earning less than an average of R6500 per month. The table below shows
that job duration is very similar for these types of jobs.
Table 8: Job duration of all new jobs in 2014/15 for 18 – 29 year olds with average monthly wage of
R6500 or less
Average duration (days) Median duration (days)
Non ETI supported job 170 143
ETI supported job 164 144
All new jobs within age and monthly wage range 168 144
4.19. However, further investigation into the impact of the ETI on job duration is required, as
changes in the composition of employment growth by different firms, sectors and worker
ages may influence the headline result and mask the impact of the ETI. Econometric
techniques will need to be used to ascertain the relative contribution of these compositional
forces and the ETI.
4.20. Although the ETI provides the same rand amount of support to workers earning between
R2 000 and R4 000 a month, the average ETI claim amount per job is highest for those
workers earning between R3 000 to R3 999 per month. The average ETI claim per job is
R4 630 for 18 to 24 year olds earning between R3 000 and R4 000 pm, and R4 144 for the
same age group earning between R2 000 and R3 000.
4.21. The difference in total claim amounts is linked to job duration – jobs for young workers
earning between R3 000 to R3 999 per month tend to last the longest – although there are
also important variations by age. The average job duration per job in the R3 000 to R4 000
monthly income category is 184 days for 18 to 24 year olds, compared to 175 days in the
R2 000 to R3 000 category. For 25 to 29 year olds, those earning between R3 000 and R4 000
work for 193 days compared to 182 days in the R2 000 to R3 000 category.
23
What types of firms are claiming the ETI?
4.22. In the two months in the 2013/14 tax year, 13 399 firms lodged at least one claim for the
incentive. In the following tax year. 2014/2015, 32 368 firms lodged at least one claim.
4.23. A range of descriptive measures are outlined below. It is important to bear in mind that the
reasons certain types of firms claim the ETI or do not claim the ETI will depend on the
composition of the workforce, both existing and new hires, the fortunes of the sector as well
as the individual firm, and the result of past decisions. As a result, care must be taken in
making comparisons. In order to determine the relative importance of the ETI, econometric
analysis is required to attempt to discern the relative importance of these factors.
Analysis by firm size
4.24. Large firms dominate ETI claims, both by number of workers and rand amounts claimed.
Table 9: Analysis of ETI claims by firm size in 2014/15
Firm Size (by size of workforce)
Number of firms claiming ETI
Number of employees ETI is claimed for across all firms
Average # ETI supported employees per firm
Per cent of all ETI worker claims
Total ETI claim(R'm) across all firms
Per cent of all ETI rand claims
1 to 5 workers 3 560 5 695 1.60 1% 21 1%
5 to 10 workers 4 369 9 905 2.27 1% 39 2%
11 to 50 workers 13 839 67 430 4.87 10% 255 10%
51 to 100 workers 4 587 54 257 11.8 8% 192 8%
100 to 1000 workers
5 485 231 900 42.3 34% 742 30%
1000+ workers 528 317 231 601 46% 1 207 49%
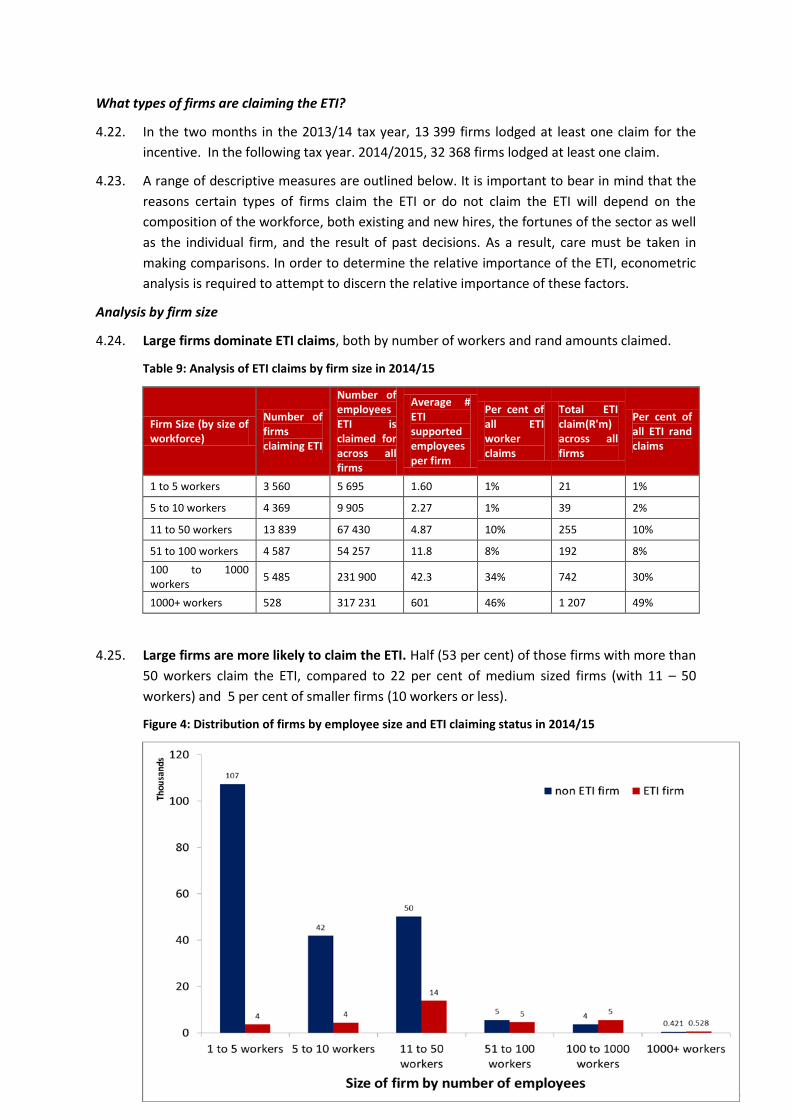
4.25. Large firms are more likely to claim the ETI. Half (53 per cent) of those firms with more than
50 workers claim the ETI, compared to 22 per cent of medium sized firms (with 11 – 50
workers) and 5 per cent of smaller firms (10 workers or less).
Figure 4: Distribution of firms by employee size and ETI claiming status in 2014/15
24
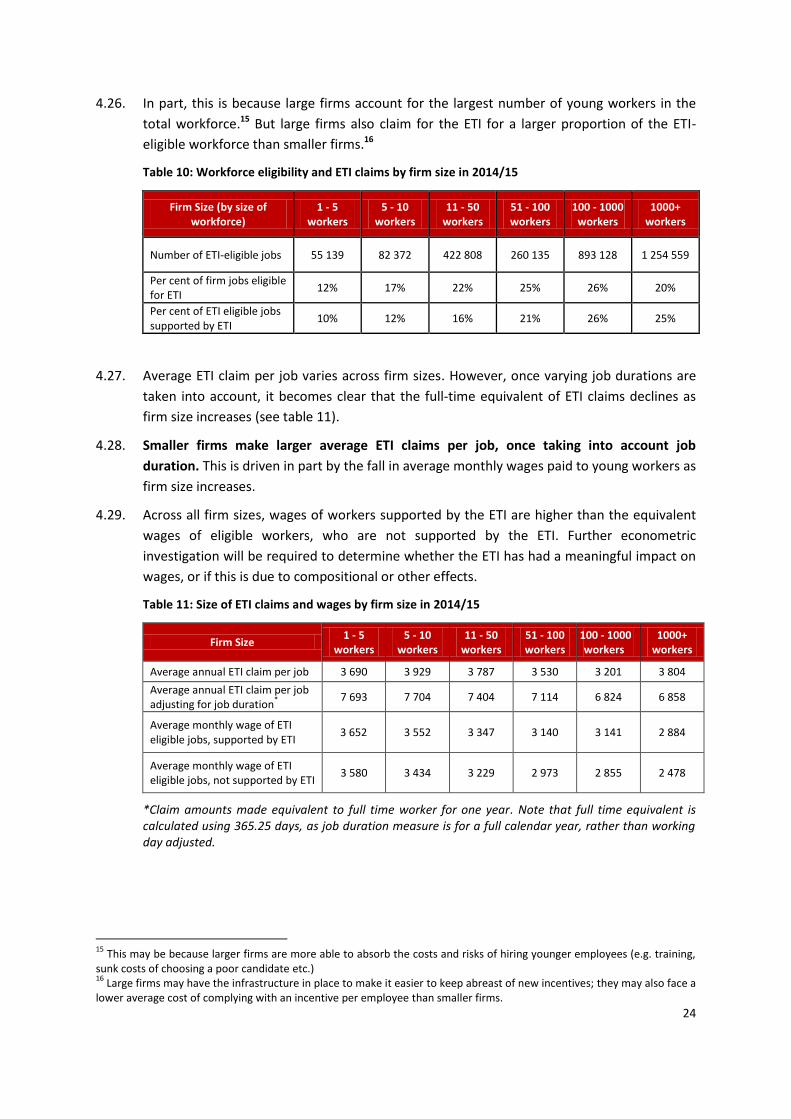
4.26. In part, this is because large firms account for the largest number of young workers in the
total workforce.15 But large firms also claim for the ETI for a larger proportion of the ETI-
eligible workforce than smaller firms.16
Table 10: Workforce eligibility and ETI claims by firm size in 2014/15
Firm Size (by size of workforce)
1 - 5 workers
5 - 10 workers
11 - 50 workers
51 - 100 workers
100 - 1000 workers
1000+ workers
Number of ETI-eligible jobs 55 139 82 372 422 808 260 135 893 128 1 254 559
Per cent of firm jobs eligible for ETI
12% 17% 22% 25% 26% 20%
Per cent of ETI eligible jobs supported by ETI
10% 12% 16% 21% 26% 25%
4.27. Average ETI claim per job varies across firm sizes. However, once varying job durations are
taken into account, it becomes clear that the full-time equivalent of ETI claims declines as
firm size increases (see table 11).
4.28. Smaller firms make larger average ETI claims per job, once taking into account job
duration. This is driven in part by the fall in average monthly wages paid to young workers as
firm size increases.
4.29. Across all firm sizes, wages of workers supported by the ETI are higher than the equivalent
wages of eligible workers, who are not supported by the ETI. Further econometric
investigation will be required to determine whether the ETI has had a meaningful impact on
wages, or if this is due to compositional or other effects.
Table 11: Size of ETI claims and wages by firm size in 2014/15
Firm Size 1 - 5
workers 5 - 10
workers 11 - 50
workers 51 - 100 workers
100 - 1000 workers
1000+ workers
Average annual ETI claim per job 3 690 3 929 3 787 3 530 3 201 3 804
Average annual ETI claim per job adjusting for job duration
* 7 693 7 704 7 404 7 114 6 824 6 858
Average monthly wage of ETI eligible jobs, supported by ETI
3 652 3 552 3 347 3 140 3 141 2 884
Average monthly wage of ETI eligible jobs, not supported by ETI
3 580 3 434 3 229 2 973 2 855 2 478
*Claim amounts made equivalent to full time worker for one year. Note that full time equivalent is calculated using 365.25 days, as job duration measure is for a full calendar year, rather than working day adjusted.
15
This may be because larger firms are more able to absorb the costs and risks of hiring younger employees (e.g. training, sunk costs of choosing a poor candidate etc.) 16
Large firms may have the infrastructure in place to make it easier to keep abreast of new incentives; they may also face a lower average cost of complying with an incentive per employee than smaller firms.
25
Analysis by Industry
4.30. Note that industry classifications are not necessarily identical to Statistics SA definitions, as
discussed earlier.
4.31. ETI take-up is linked to the number of eligible workers in the sector, how many of those
workers the ETI is claimed against and average wages.
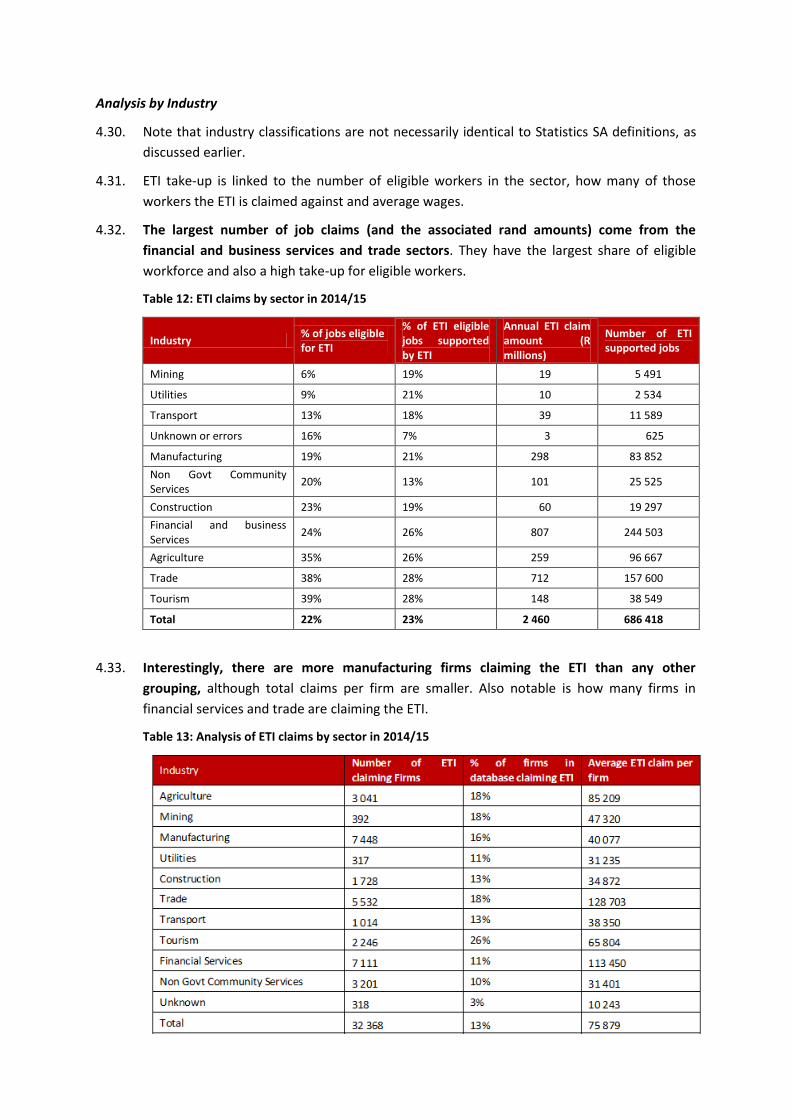
4.32. The largest number of job claims (and the associated rand amounts) come from the
financial and business services and trade sectors. They have the largest share of eligible
workforce and also a high take-up for eligible workers.
Table 12: ETI claims by sector in 2014/15
Industry % of jobs eligible for ETI
% of ETI eligible jobs supported by ETI
Annual ETI claim amount (R millions)
Number of ETI supported jobs
Mining 6% 19% 19 5 491
Utilities 9% 21% 10 2 534
Transport 13% 18% 39 11 589
Unknown or errors 16% 7% 3 625
Manufacturing 19% 21% 298 83 852
Non Govt Community Services
20% 13% 101 25 525
Construction 23% 19% 60 19 297
Financial and business Services
24% 26% 807 244 503
Agriculture 35% 26% 259 96 667
Trade 38% 28% 712 157 600
Tourism 39% 28% 148 38 549
Total 22% 23% 2 460 686 418
4.33. Interestingly, there are more manufacturing firms claiming the ETI than any other
grouping, although total claims per firm are smaller. Also notable is how many firms in
financial services and trade are claiming the ETI.
Table 13: Analysis of ETI claims by sector in 2014/15
26
4.34. This seems to be due to:
o The number of firms in these sectors. Financial and other services sector accounts
for 57 per cent of all firms, whereas manufacturing firms for almost 20 per cent.
o Active small and medium sized firms in manufacturing. Almost 64 per cent of ETI
claiming firms in manufacturing had less than 50 employees. Equally, in financial and
other services, 94 per cent of firms employ less than 50 employees, and these firms
comprised 70 per cent of all ETI claiming firms in the sector.
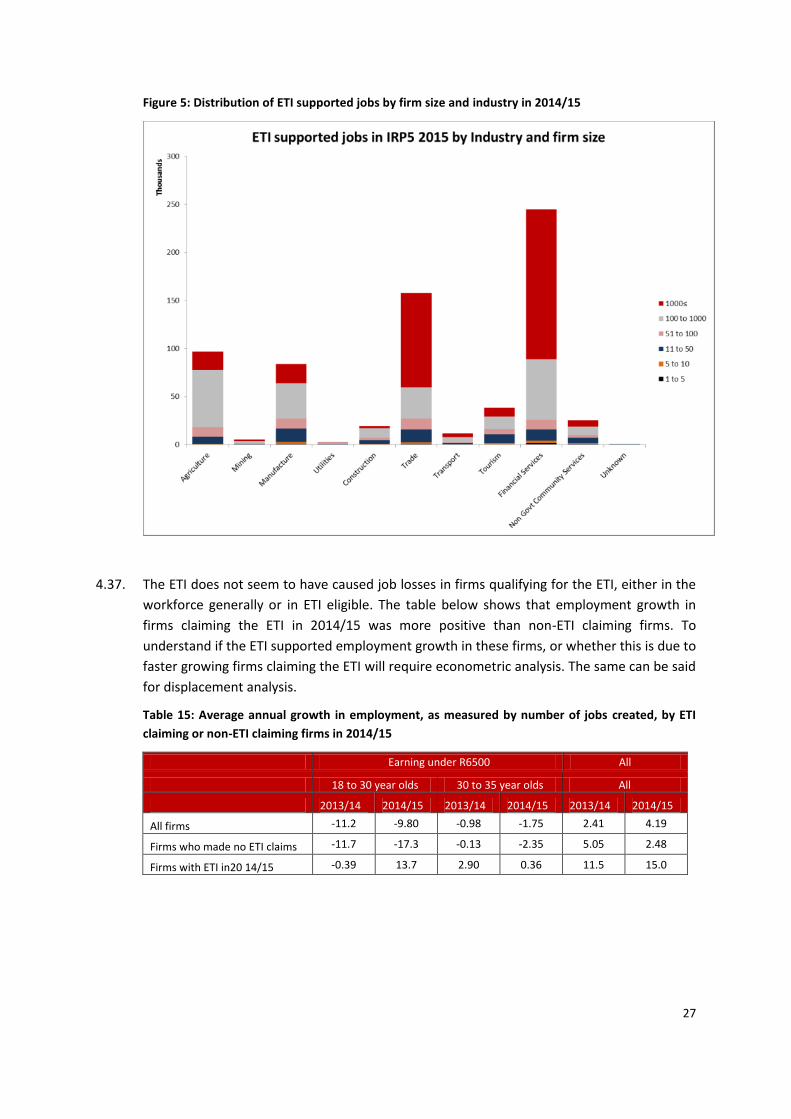
Analysis by Industry and firm size
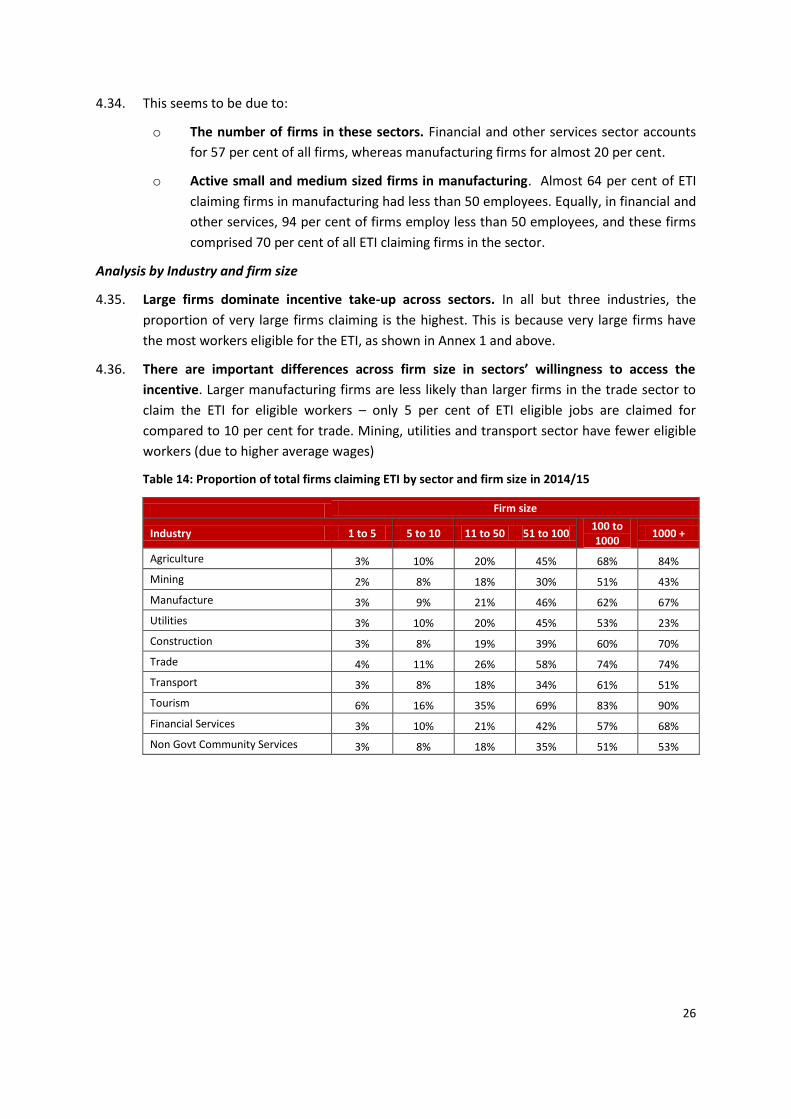
4.35. Large firms dominate incentive take-up across sectors. In all but three industries, the
proportion of very large firms claiming is the highest. This is because very large firms have
the most workers eligible for the ETI, as shown in Annex 1 and above.
4.36. There are important differences across firm size in sectors’ willingness to access the
incentive. Larger manufacturing firms are less likely than larger firms in the trade sector to
claim the ETI for eligible workers – only 5 per cent of ETI eligible jobs are claimed for
compared to 10 per cent for trade. Mining, utilities and transport sector have fewer eligible
workers (due to higher average wages)
Table 14: Proportion of total firms claiming ETI by sector and firm size in 2014/15
Firm size
Industry 1 to 5 5 to 10 11 to 50 51 to 100 100 to 1000
1000 +
Agriculture 3% 10% 20% 45% 68% 84%
Mining 2% 8% 18% 30% 51% 43%
Manufacture 3% 9% 21% 46% 62% 67%
Utilities 3% 10% 20% 45% 53% 23%
Construction 3% 8% 19% 39% 60% 70%
Trade 4% 11% 26% 58% 74% 74%
Transport 3% 8% 18% 34% 61% 51%
Tourism 6% 16% 35% 69% 83% 90%
Financial Services 3% 10% 21% 42% 57% 68%
Non Govt Community Services 3% 8% 18% 35% 51% 53%
27
Figure 5: Distribution of ETI supported jobs by firm size and industry in 2014/15
4.37. The ETI does not seem to have caused job losses in firms qualifying for the ETI, either in the
workforce generally or in ETI eligible. The table below shows that employment growth in
firms claiming the ETI in 2014/15 was more positive than non-ETI claiming firms. To
understand if the ETI supported employment growth in these firms, or whether this is due to
faster growing firms claiming the ETI will require econometric analysis. The same can be said
for displacement analysis.
Table 15: Average annual growth in employment, as measured by number of jobs created, by ETI
claiming or non-ETI claiming firms in 2014/15
Earning under R6500 All
18 to 30 year olds 30 to 35 year olds All
2013/14 2014/15 2013/14 2014/15 2013/14 2014/15
All firms -11.2 -9.80 -0.98 -1.75 2.41 4.19
Firms who made no ETI claims -11.7 -17.3 -0.13 -2.35 5.05 2.48
Firms with ETI in20 14/15 -0.39 13.7 2.90 0.36 11.5 15.0
28
Labour brokers
4.38. A key concern raised in the original design of the ETI was the role that labour brokers might
play. Recent amendments to the Labour Relations Act have reduced the differences between
labour brokers and regular employers. However, the concerns raised merit separate
consideration.
4.39. The analysis below is based on a classification system from Statistics SA. Unlike other sector
classifications, where employers self-classify, the labour broker designation is assigned.
There may well be under-counting of these labour brokers.
4.40. According to this indicator, there are approximately 626 labour brokers, of which 257 have
claimed the ETI in 2014/15.
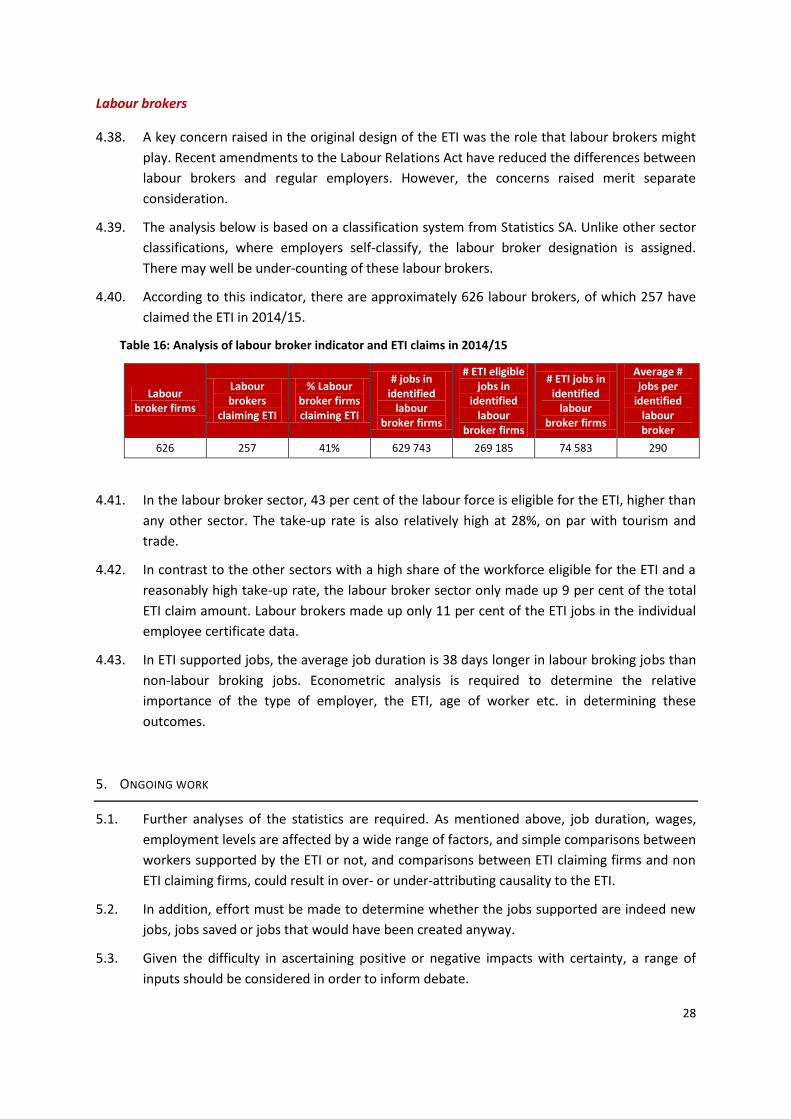
Table 16: Analysis of labour broker indicator and ETI claims in 2014/15
Labour broker firms
Labour brokers
claiming ETI
% Labour broker firms claiming ETI
# jobs in identified
labour broker firms
# ETI eligible jobs in
identified labour
broker firms
# ETI jobs in identified
labour broker firms
Average # jobs per
identified labour broker
626 257 41% 629 743 269 185 74 583 290
4.41. In the labour broker sector, 43 per cent of the labour force is eligible for the ETI, higher than
any other sector. The take-up rate is also relatively high at 28%, on par with tourism and
trade.
4.42. In contrast to the other sectors with a high share of the workforce eligible for the ETI and a
reasonably high take-up rate, the labour broker sector only made up 9 per cent of the total
ETI claim amount. Labour brokers made up only 11 per cent of the ETI jobs in the individual
employee certificate data.
4.43. In ETI supported jobs, the average job duration is 38 days longer in labour broking jobs than
non-labour broking jobs. Econometric analysis is required to determine the relative
importance of the type of employer, the ETI, age of worker etc. in determining these
outcomes.
5. ONGOING WORK
5.1. Further analyses of the statistics are required. As mentioned above, job duration, wages,
employment levels are affected by a wide range of factors, and simple comparisons between
workers supported by the ETI or not, and comparisons between ETI claiming firms and non
ETI claiming firms, could result in over- or under-attributing causality to the ETI.
5.2. In addition, effort must be made to determine whether the jobs supported are indeed new
jobs, jobs saved or jobs that would have been created anyway.
5.3. Given the difficulty in ascertaining positive or negative impacts with certainty, a range of
inputs should be considered in order to inform debate.