January–March 2017 Interim Report for Sparbanken Skåne AB (publ)Lund, 26 April 2017
Sparbanken Skåne reported a profit excluding goodwill amortisation and before tax of SEK 157m for the first quarter of 2017. The bank’s transaction volume increased by 2 percent during the period and net interest income gained strength. The Swedish Financial Supervisory Authority approved the bank’s application to issue covered bonds.
2
SPARBANKEN SKÅNE AB (PUBL) COMPANY REG. NO. 516401-0091 – JANUARY–MARCH 2017 INTERIM REPORT
Q1 financial summary, January–March 2017
• The bank's operating profit for the quarter came in at SEK 50m (39)
• Operating profit excluding goodwill amortisation for the January–March period reached SEK 157m (146)
• Net interest income increased by 1%, coming in at SEK 208m (206)
• Net fee and commission income decreased by 8%, totalling SEK 140m (152)
• The bank’s expenses were down 3% in the quarter, amounting to SEK 312m (322)
• Credit losses totalled SEK +5m (SEK 12m)
• The transaction volume was up 2%, coming in at SEK 187bn (184)
• The total capital ratio was 19.2% (18.9)
• The LCR amounted to 181% (186)
(Comparative figures in parentheses refer to Q4, October–December 2016)
Key events in Q1 2017
• Profit improved in the quarter. The strong performance of net interest income and continuing low credit losses are the main reasons for this improvement.
• The transaction volume increased by 2 percent in the quarter driven by a strong stock market trend along with growth in the bank’s lending.
• In late March, the bank received authorisation from the Swedish Financial Supervisory Authority to issue covered bonds. The plan is to conduct the first issue by the end of September.
• The bank issued SEK 1bn under our ongoing MTN programme with senior bonds.
• Several new features of our new Internet Bank were presented during the quarter. One new feature is that customers can directly apply for consumer loans online.
• Sparbanken Skåne’s three foundation owners, Sparbanksstiftelsen Färs & Frosta, Sparbanksstiftelsen 1826 and Sparbanksstiftelsen Finn, received project grant applications during the period. The foundations award grants for development projects in the bank’s geographic area of operation twice a year.
Financial summary, January–March 2017
• The bank's operating profit for January–March 2017 reached SEK 50m (0)
• Operating profit excluding goodwill amortisation for the period totalled SEK 157m (107)
• The transaction volume at 31 March 2017 was SEK 187bn (174)
• The total capital ratio was 19.2% (18.5)
• The CET1 capital ratio equalled 17.4% (16.7)
• The leverage ratio reached 7.7% (7.4)
• The LCR amounted to 181% (345)
(Comparative figures in parentheses refer to Q1, January–March 2016)
3
SPARBANKEN SKÅNE AB (PUBL) COMPANY REG. NO. 516401-0091 – JANUARY–MARCH 2017 INTERIM REPORT
Solid profit and key progress
Sparbanken Skåne continues to perform well. In the first quarter of 2017, the bank reported a profit (excluding goodwill amortisation and before tax) of SEK 157m, a 46 percent year-on-year increase.
The bank’s profit was driven both by strong new sales of products and services and by an improvement in net interest income, which we achieved despite the current extremely low interest rate environment. Credit losses remain at a low level, and the bank reported an operating profit before tax for the first quarter of SEK 50m.
Strong financial position The goodwill item from when Sparbanken Skåne was founded in 2014 is amortised over a period of five years. Goodwill amortisation was charged to profit or loss for the quarter in the amount of SEK 107m.
The bank's capital situation is continuously improving. At the end of the period, the total capital ratio was 19.2 percent, the leverage ratio was 7.7 percent and the LCR was 181 percent.
In late March, Sparbanken Skåne received authorisation from the Swedish Financial Supervisory Authority to issue covered bonds. We can maintain a low level of risk in terms of liabilities by raising our presence on the capital market and diversifying our borrowing. Low borrowing costs are a key competitive factor for creating attractive customer offerings. The bank plans to conduct its first issue of covered bonds by the end of September.
Despite a certain degree of international macroeconomic uncertainty, the stock market posted strong gains early in the year. When combined with growth in the bank's lending, this contributed to two percent growth in the transaction volume, which amounted to SEK 187bn at 31 March.
Record-low interest rates pose challengesThe private market trend is stable. Interest rates are historically low, which means it is cheap to borrow money but increasingly difficult to find interest-bearing savings solutions with any actual yield.
The situation poses major challenges for the bank’s advisory services. Residential mortgage borrowers are now recommended to lock in the interest rate for at least half of the mortgage to prepare for the future higher interest rates we know are coming. With regard to savings, it is important that customers do not take too great risks with their investments in search of yields.
The first months of the year also resulted in an increased focus on ensuring that the bank is fully compliant with the Know Your Customer (KYC) requirements of government agencies. This involves everything from internal work in the boardroom to practical procedures focusing on customers.
Specifically, this means that the bank routinely asks both private and corporate customers questions about money, accounts and exposure. This is an important effort on our part to combat money laundering and other illegal activities, which is being met with great understanding from the public.
Positive signs in agricultureWe see a somewhat cautious market in the corporate segment. We now operate as a complete full-service bank with specialists in all areas from financing and insurance to capital placement and international transactions.
Customer activity is relatively high in housing construction. We have also observed a positive trend in the agricultural sector,
where profitability is clearly on the rise. This is especially demonstrated by the Agricultural Barometer (Lantbruksbarometern), a survey measuring economic conditions presented by the bank in late March in collaboration with Swedbank and LRF Konsult. Farmers in southern Sweden in particular showed increasing confidence in the future in the past year.
A more effective societyAdvancements in technology are driving us ever faster toward a digital and cash-free society. In general, digitalisation makes the distribution of products and services easier, cheaper and more environmentally friendly. In the banking industry, this also provides greater security for both employees and customers by reducing the volume of cash handled.
Increasingly more people use digital banking services, and today only a small number of customers regularly use manual cash handling services over the counter. We can report that our partnership with UtbildningsForum has further lowered the threshold for getting started with digital services. UtbildningsForum holds free courses on how to use services such as the Internet Bank (Internetbanken), Mobile Bank (Mobilbanken) and digital security.
To increase the availability of digital payment services, Sparbanken Skåne is extending an offer to all non-profit associations that are full-service customers to try Swish for six months free of charge.
Several new features of our new Internet Bank were presented during the first quarter as well. The new Internet Bank opened in a beta version last year and has been available alongside the previous interface. One new feature is that customers can directly apply for consumer loans online in the Internet Bank.
The modern savings bank conceptSparbanken Skåne’s three foundation owners, Sparbanksstiftelsen Färs & Frosta, Sparbanksstiftelsen 1826 and Sparbanksstiftelsen Finn, received grant applications during the period. The foundations award grants for development projects in the bank’s local area twice a year.
The foundations have also received the nominations for this year’s amateur sports leader grant recipients in Skåne. In addition, the foundations contributed financially to the Missing People organisation, which is now able to fund its very first locally stationed liaison vehicle for search missions. Furthermore, a new school project was launched in collaboration with Friends, where middle schools in the bank’s area of operation get free access to an anti-cyberbullying training package.
The foundation owners receive dividends from the bank and use the money for local community development. This is a unique model where our role as a savings bank allows us to make a difference alongside our everyday banking services.
Bo BengtssonCEO
4
SPARBANKEN SKÅNE AB (PUBL) COMPANY REG. NO. 516401-0091 – JANUARY–MARCH 2017 INTERIM REPORT
At Sparbanken Skåne we have a clear philosophy – To be there for the people, businesses and communities of our customers. With this clear goal driving us, we created our new bank by bringing together the best of Sparbanken 1826, Färs & Frosta Sparbank and parts of Sparbanken Öresund.
Ownership structureSparbanken Skåne AB (publ)’s company registration number is 516401-0091. The ownership structure of Sparbanken Skåne AB is shown below:Sparbanksstiftelsen Färs & Frosta 26%Sparbanksstiftelsen 1826 26%Sparbanksstiftelsen Finn 26%Swedbank AB (publ) 22%The board is headquartered in Lund. The administrative centre is based in Kristianstad.
Transaction volumeThe comparative figures are for the volume at 31 December 2016.
The bank’s total transaction volume at 31 March 2017 was SEK 187,339m (183,966). The transaction volume increased by 1.8 percent for the period from January to March.
Deposits from the general public were down slightly in the first quarter of 2017 (SEK -63m). Deposits from the general public at 31 March 2017 totalled SEK 45,608m (45,671).
The market value of total brokered fund and insurance volumes was SEK 40,817m (38,491). The stock market performed well in the first quarter of 2017. Along with positive net savings in both funds and insurance, this had a positive effect on volumes.
The positive performance of loans to the general public for the entirety of 2016 continued throughout the first quarter of 2017. Deposits from the general public at 31 March 2017 totalled SEK 52,774m (51,058). This increase is the result of moving residential mortgages from brokered volumes to the bank’s loans to the general public and of issuing new loans to both private and corporate customers. The bank's loans continue to maintain excellent credit quality.
The total loan portfolio brokered to Swedbank Hypotek at 31 March 2017 amounted to SEK 27,894m (28,878).
Borrowing and liquidity The bank’s liquidity is solid. The bank’s main source of funding is deposits. To diversify its funding, the bank has a medium term note (MTN) borrowing programme for long-term funding and a certificate of deposit programme for short-term funding. The bonds are listed on the Nasdaq OMX Nordic Stockholm. More information about the MTN programme can be found at www.sparbankenskane.se.
The bank filed an application with the Swedish Financial Supervisory Authority in early October 2016 for authorisation to issue covered bonds as a further step in our efforts to strengthen our position on Skåne's residential mortgage market. This authorisation was approved on 24 March. The bank expects to commence the bond programme within 6 months.
The bank’s issued bonds at 31 March 2017 totalled SEK 6,700m (total programme of SEK 10,000m), and its issued certificates of deposit amounted to SEK 1,550m (total programme
SEK 4,000m) The bank issued SEK 1,000m in bonds during the quarter. Outstanding certificates of deposit increased by SEK 600m during the quarter.
Subordinated liabilities, in the form of fixed-term subordinated loans, totalled SEK 500m at 31 March 2017.
The bank’s liquidity reserves at 31 March 2017 amounted to SEK 6,635m (6,031). The liquidity reserves consist of assets that can generate liquidity quickly at predictable values and meet the Liquidity Coverage Ratio (LCR) eligibility requirements of the Swedish Financial Supervisory Authority (FFFS 2012:6). These assets include short-term loans to credit institutions, funds deposited in tax accounts and interest-bearing securities. The liquidity reserves combined with agreed borrowing limits give the bank excellent payment readiness.
The loan-to-deposit ratio at 31 March 2017 came in at 116 percent (112 percent at year-end 2016).
More information about liquidity reserves and liquidity management is provided in periodic disclosures at www.sparbankenskane.se/om-sparbanken-skane/finansiell-information/likviditet.
RatingSparbanken Skåne is rated A- with a negative outlook by credit rating agency S&P Global.
Profit The comparative figures refer to the January–March 2016 period.
Operating profit for the first quarter of 2017 reached SEK 50m (0). Goodwill amortisation continues to impact profit in the amount of SEK 107m per quarter, and profit is in line with expectations.
Goodwill arising on the merger of the three banks in 2014 resulted in a goodwill item of SEK 2,140m. The bank prepares its financial statements in accordance with IFRS subject to restrictions under Swedish law (lagbegränsad IFRS). Under these restrictions, goodwill is amortised over a period of five years. The goodwill item thus impacts profit in the amount of SEK 428m per year.
Net interest income improved by 14 percent in the first quarter of 2017, reaching SEK 208m (183). The lending volume gains have had a positive impact on net interest income during the quarter, while the historically low interest rates have negatively affected net interest income, with a lower liquidity reserve yield and lower margins on deposits.
The resolution fee and deposit insurance were charged to net interest income in the amount of SEK 16m (12).
Net fee and commission income for the period came in at SEK 140m (123). Loan commissions amounted to SEK 46m (46) and are mainly attributable to commissions from Swedbank Hypotek. Securities fees came in at SEK 54m (47). We saw positive net savings in our funds in the first quarter of 2017.
Other fee and commission income reached SEK 55m (49). Fee and commission expenses totalled SEK -15m (-19).
Other income amounted to SEK 1m (4). General administrative expenses for the first quarter of 2017
were up 5% year-on-year, totalling SEK 182m (173). Higher IT expenses were mainly responsible for this increase. Personnel
Financial information
5
SPARBANKEN SKÅNE AB (PUBL) COMPANY REG. NO. 516401-0091 – JANUARY–MARCH 2017 INTERIM REPORT
The total capital ratio was thus 19.2 percent at 31 March 2017 (18.9) and the CET1 capital ratio was 17.4 percent (17.1).
The bank's capital situation thus gained strength during the quarter.
The leverage ratio reached 7.7 percent (7.8) at 31 March 2017.For more information about capital adequacy calculations, see
Note 13, Capital adequacy analysis.
Risks and uncertaintiesThe bank's business is exposed to various risks such as credit risk, market risk, liquidity risk and operational risk. The bank's board, which has ultimate responsibility for the bank’s internal controls, has put policies and instructions in place for the bank’s business to limit and monitor risk-taking in its operations. The bank’s level of risk-taking should be low and limited to what is financially sustainable in relation to the bank's capital buffer and long-term capital targets. The board has adopted a separate policy which describes the risk appetite which will shape the bank's activities and the risk limits applicable in each risk area. The bank's direct losses attributable to operational risk remained low in the first quarter of 2017. The bank commands a satisfactory level of capital, which is suited to the risks posed by the bank's activities and which exceeds the minimum statutory requirements. The bank’s covered bond launch plans are progressing, and on 24 March, we received approval from the Swedish Financial Supervisory Authority to conduct these types of operations within Sparbanken Skåne. The bank has begun adapting its internal rules and has set a number of risk appetites for covered bond operations.
Events after the reporting periodNo events of material significance have taken place after the end of the reporting period.
expenses amounted to SEK 111m (113), and IT expenses were SEK 44m (34).
The total amount for both depreciation of tangible assets and for impairment of intangible assets was SEK 114m (114), and amortisation of intangible assets (goodwill) accounted for SEK 107m (107) of this item.
Credit losses for the first quarter resulted in revenue of SEK 5m (+2). See Note 7, Net credit losses, for more information.
Profit/loss for the period after appropriations and tax came in at SEK 36m (-3).
Capital ratio The bank strengthened its capital base by adding SEK 100m during the quarter, resulting in the total value of the capital base reaching SEK 5,355m (5,255) at 31 March 2017. Goodwill is deducted from the bank's capital base. Fixed-term subordinated loans totalled SEK 500m and are included in Tier 2 capital.
Common Equity Tier 1 (CET1) capital was bolstered during the quarter via a lower deduction for goodwill.
The Risk Exposure Amount (REA) was SEK 27,827m (27,761). The REA for exposures secured by mortgages on immovable property increased during the quarter as residential mortgages were transferred from brokered loans to loans in the bank's own portfolio. The REA for institutions increased during the quarter due to higher excess liquidity.
The REA for credit risk at 31 March 2017 totalled SEK 25,688m. SEK 9,347m of this item was calculated using the Internal Ratings-Based (IRB) approach to credit risk and SEK 16,341m was calculated using the standardised approach to credit risk.
The REA for operational risk at 31 March was SEK 2,132m (2,325) and the REA for credit valuation adjustment was equal to SEK 7m (2).
6
SPARBANKEN SKÅNE AB (PUBL) COMPANY REG. NO. 516401-0091 – JANUARY–MARCH 2017 INTERIM REPORT
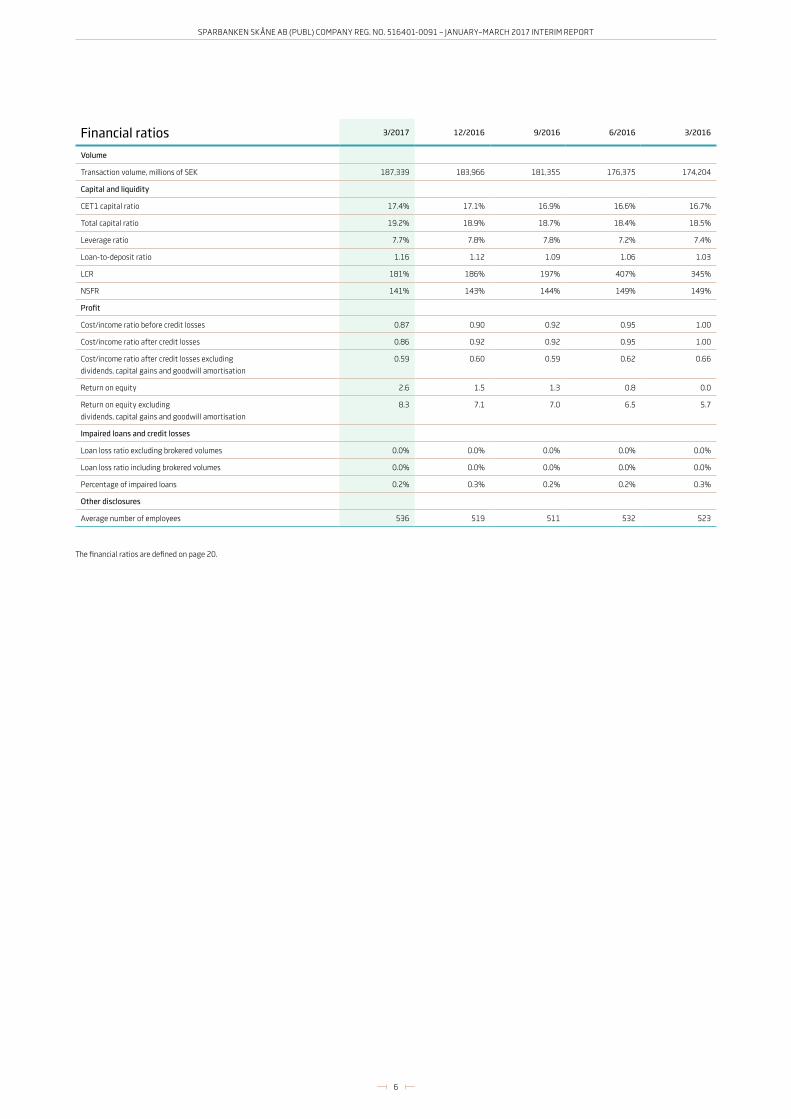
Financial ratios 3/2017 12/2016 9/2016 6/2016 3/2016
Volume
Transaction volume, millions of SEK 187,339 183,966 181,355 176,375 174,204
Capital and liquidity
CET1 capital ratio 17.4% 17.1% 16.9% 16.6% 16.7%
Total capital ratio 19.2% 18.9% 18.7% 18.4% 18.5%
Leverage ratio 7.7% 7.8% 7.8% 7.2% 7.4%
Loan-to-deposit ratio 1.16 1.12 1.09 1.06 1.03
LCR 181% 186% 197% 407% 345%
NSFR 141% 143% 144% 149% 149%
Profit
Cost/income ratio before credit losses 0.87 0.90 0.92 0.95 1.00
Cost/income ratio after credit losses 0.86 0.92 0.92 0.95 1.00
Cost/income ratio after credit losses excluding
dividends, capital gains and goodwill amortisation
0.59 0.60 0.59 0.62 0.66
Return on equity 2.6 1.5 1.3 0.8 0.0
Return on equity excluding
dividends, capital gains and goodwill amortisation
8.3 7.1 7.0 6.5 5.7
Impaired loans and credit losses
Loan loss ratio excluding brokered volumes 0.0% 0.0% 0.0% 0.0% 0.0%
Loan loss ratio including brokered volumes 0.0% 0.0% 0.0% 0.0% 0.0%
Percentage of impaired loans 0.2% 0.3% 0.2% 0.2% 0.3%
Other disclosures
Average number of employees 536 519 511 532 523
The financial ratios are defined on page 20.
7
SPARBANKEN SKÅNE AB (PUBL) COMPANY REG. NO. 516401-0091 – JANUARY–MARCH 2017 INTERIM REPORT
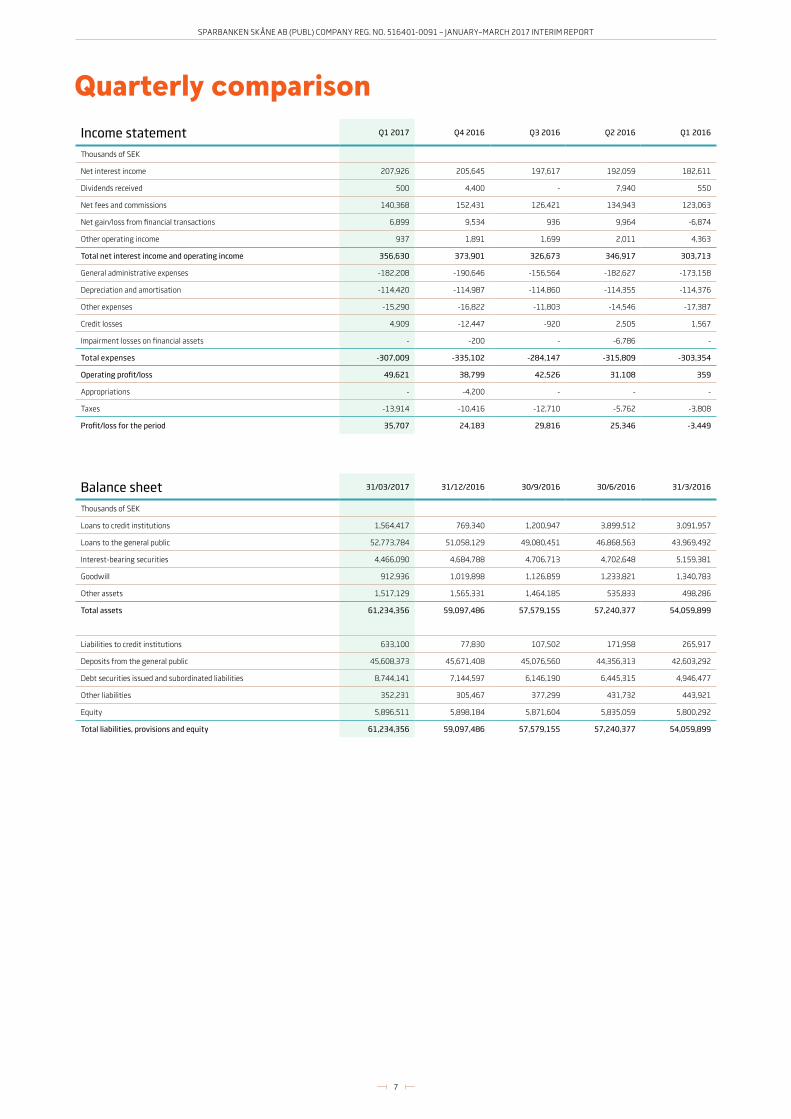
Quarterly comparisonIncome statement Q1 2017 Q4 2016 Q3 2016 Q2 2016 Q1 2016
Thousands of SEK
Net interest income 207,926 205,645 197,617 192,059 182,611
Dividends received 500 4,400 - 7,940 550
Net fees and commissions 140,368 152,431 126,421 134,943 123,063
Net gain/loss from financial transactions 6,899 9,534 936 9,964 -6,874
Other operating income 937 1,891 1,699 2,011 4,363
Total net interest income and operating income 356,630 373,901 326,673 346,917 303,713
General administrative expenses -182,208 -190,646 -156,564 -182,627 -173,158
Depreciation and amortisation -114,420 -114,987 -114,860 -114,355 -114,376
Other expenses -15,290 -16,822 -11,803 -14,546 -17,387
Credit losses 4,909 -12,447 -920 2,505 1,567
Impairment losses on financial assets - -200 - -6,786 -
Total expenses -307,009 -335,102 -284,147 -315,809 -303,354
Operating profit/loss 49,621 38,799 42,526 31,108 359
Appropriations - -4,200 - - -
Taxes -13,914 -10,416 -12,710 -5,762 -3,808
Profit/loss for the period 35,707 24,183 29,816 25,346 -3,449
Balance sheet 31/03/2017 31/12/2016 30/9/2016 30/6/2016 31/3/2016
Thousands of SEK
Loans to credit institutions 1,564,417 769,340 1,200,947 3,899,512 3,091,957
Loans to the general public 52,773,784 51,058,129 49,080,451 46,868,563 43,969,492
Interest-bearing securities 4,466,090 4,684,788 4,706,713 4,702,648 5,159,381
Goodwill 912,936 1,019,898 1,126,859 1,233,821 1,340,783
Other assets 1,517,129 1,565,331 1,464,185 535,833 498,286
Total assets 61,234,356 59,097,486 57,579,155 57,240,377 54,059,899
Liabilities to credit institutions 633,100 77,830 107,502 171,958 265,917
Deposits from the general public 45,608,373 45,671,408 45,076,560 44,356,313 42,603,292
Debt securities issued and subordinated liabilities 8,744,141 7,144,597 6,146,190 6,445,315 4,946,477
Other liabilities 352,231 305,467 377,299 431,732 443,921
Equity 5,896,511 5,898,184 5,871,604 5,835,059 5,800,292
Total liabilities, provisions and equity 61,234,356 59,097,486 57,579,155 57,240,377 54,059,899
8
SPARBANKEN SKÅNE AB (PUBL) COMPANY REG. NO. 516401-0091 – JANUARY–MARCH 2017 INTERIM REPORT
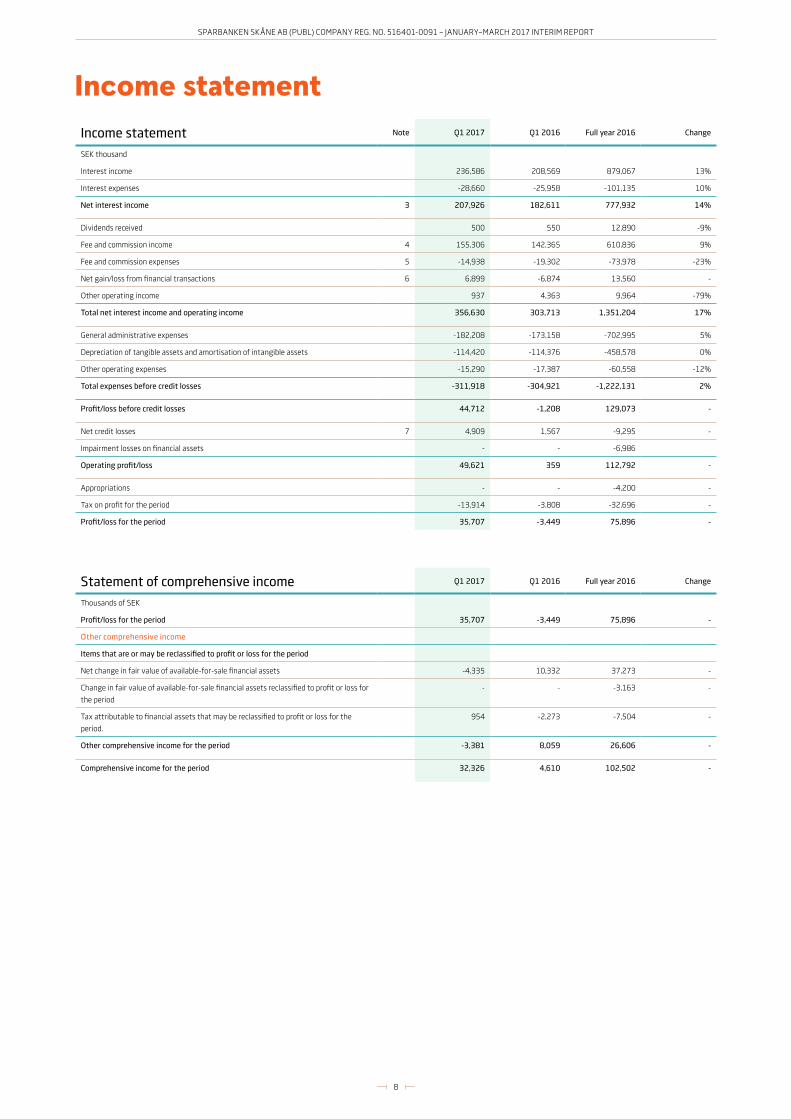
Income statement Note Q1 2017 Q1 2016 Full year 2016 Change
SEK thousand
Interest income 236,586 208,569 879,067 13%
Interest expenses -28,660 -25,958 -101,135 10%
Net interest income 3 207,926 182,611 777,932 14%
Dividends received 500 550 12,890 -9%
Fee and commission income 4 155,306 142,365 610,836 9%
Fee and commission expenses 5 -14,938 -19,302 -73,978 -23%
Net gain/loss from financial transactions 6 6,899 -6,874 13,560 -
Other operating income 937 4,363 9,964 -79%
Total net interest income and operating income 356,630 303,713 1,351,204 17%
General administrative expenses -182,208 -173,158 -702,995 5%
Depreciation of tangible assets and amortisation of intangible assets -114,420 -114,376 -458,578 0%
Other operating expenses -15,290 -17,387 -60,558 -12%
Total expenses before credit losses -311,918 -304,921 -1,222,131 2%
Profit/loss before credit losses 44,712 -1,208 129,073 -
Net credit losses 7 4,909 1,567 -9,295 -
Impairment losses on financial assets - - -6,986
Operating profit/loss 49,621 359 112,792 -
Appropriations - - -4,200 -
Tax on profit for the period -13,914 -3,808 -32,696 -
Profit/loss for the period 35,707 -3,449 75,896 -
Income statement
Statement of comprehensive income Q1 2017 Q1 2016 Full year 2016 Change
Thousands of SEK
Profit/loss for the period 35,707 -3,449 75,896 -
Other comprehensive income
Items that are or may be reclassified to profit or loss for the period
Net change in fair value of available-for-sale financial assets -4,335 10,332 37,273 -
Change in fair value of available-for-sale financial assets reclassified to profit or loss for
the period
- - -3,163 -
Tax attributable to financial assets that may be reclassified to profit or loss for the
period.
954 -2,273 -7,504 -
Other comprehensive income for the period -3,381 8,059 26,606 -
Comprehensive income for the period 32,326 4,610 102,502 -
9
SPARBANKEN SKÅNE AB (PUBL) COMPANY REG. NO. 516401-0091 – JANUARY–MARCH 2017 INTERIM REPORT
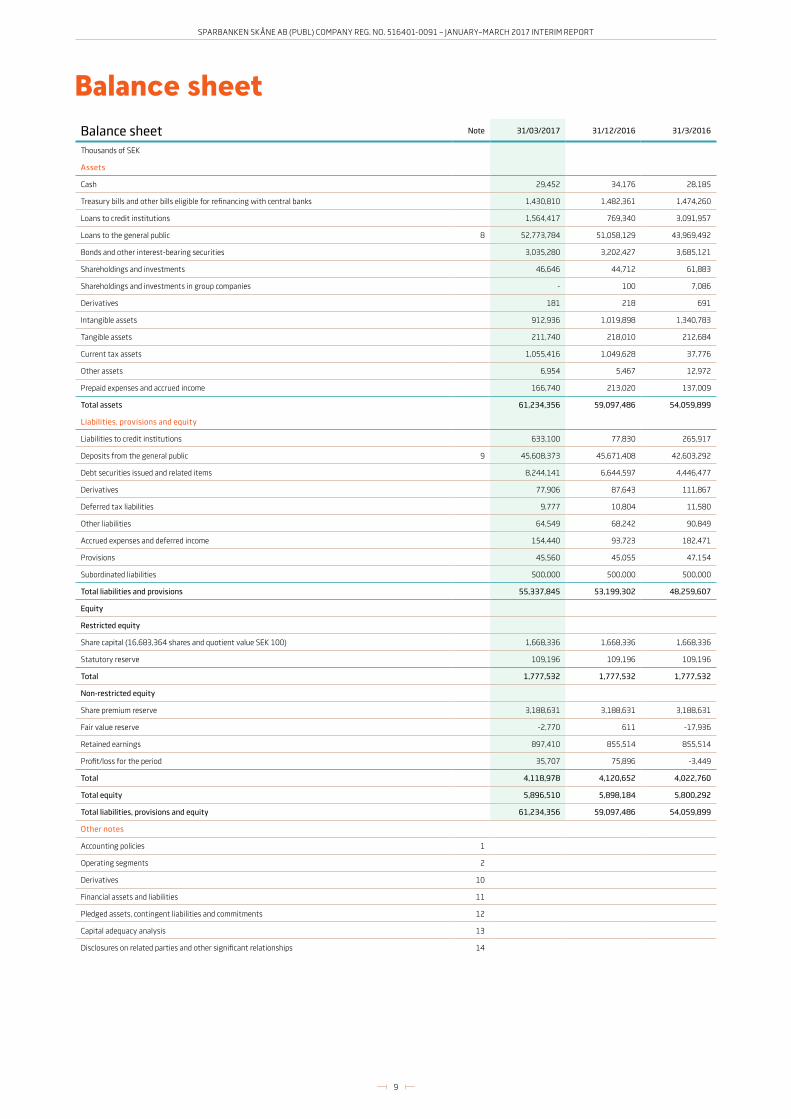
Balance sheetBalance sheet Note 31/03/2017 31/12/2016 31/3/2016
Thousands of SEK
Assets
Cash 29,452 34,176 28,185
Treasury bills and other bills eligible for refinancing with central banks 1,430,810 1,482,361 1,474,260
Loans to credit institutions 1,564,417 769,340 3,091,957
Loans to the general public 8 52,773,784 51,058,129 43,969,492
Bonds and other interest-bearing securities 3,035,280 3,202,427 3,685,121
Shareholdings and investments 46,646 44,712 61,883
Shareholdings and investments in group companies - 100 7,086
Derivatives 181 218 691
Intangible assets 912,936 1,019,898 1,340,783
Tangible assets 211,740 218,010 212,684
Current tax assets 1,055,416 1,049,628 37,776
Other assets 6,954 5,467 12,972
Prepaid expenses and accrued income 166,740 213,020 137,009
Total assets 61,234,356 59,097,486 54,059,899
Liabilities, provisions and equity
Liabilities to credit institutions 633,100 77,830 265,917
Deposits from the general public 9 45,608,373 45,671,408 42,603,292
Debt securities issued and related items 8,244,141 6,644,597 4,446,477
Derivatives 77,906 87,643 111,867
Deferred tax liabilities 9,777 10,804 11,580
Other liabilities 64,549 68,242 90,849
Accrued expenses and deferred income 154,440 93,723 182,471
Provisions 45,560 45,055 47,154
Subordinated liabilities 500,000 500,000 500,000
Total liabilities and provisions 55,337,845 53,199,302 48,259,607
Equity
Restricted equity
Share capital (16,683,364 shares and quotient value SEK 100) 1,668,336 1,668,336 1,668,336
Statutory reserve 109,196 109,196 109,196
Total 1,777,532 1,777,532 1,777,532
Non-restricted equity
Share premium reserve 3,188,631 3,188,631 3,188,631
Fair value reserve -2,770 611 -17,936
Retained earnings 897,410 855,514 855,514
Profit/loss for the period 35,707 75,896 -3,449
Total 4,118,978 4,120,652 4,022,760
Total equity 5,896,510 5,898,184 5,800,292
Total liabilities, provisions and equity 61,234,356 59,097,486 54,059,899
Other notes
Accounting policies 1
Operating segments 2
Derivatives 10
Financial assets and liabilities 11
Pledged assets, contingent liabilities and commitments 12
Capital adequacy analysis 13
Disclosures on related parties and other significant relationships 14
10
SPARBANKEN SKÅNE AB (PUBL) COMPANY REG. NO. 516401-0091 – JANUARY–MARCH 2017 INTERIM REPORT
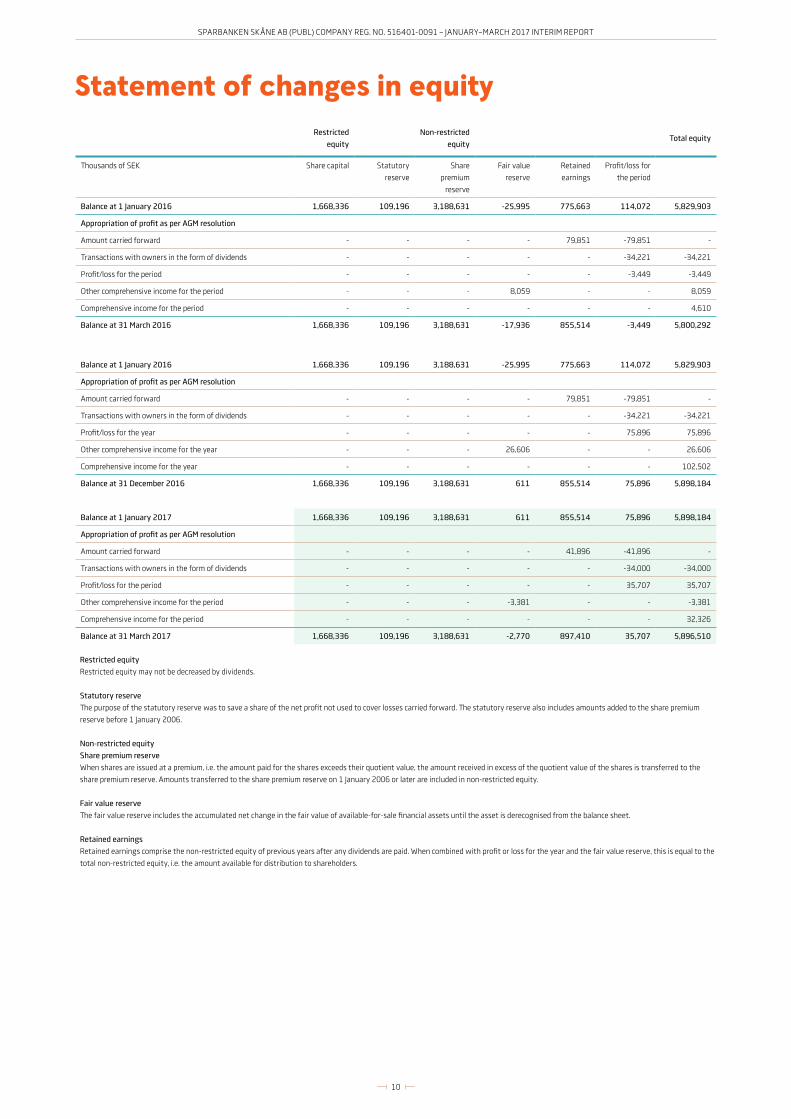
Statement of changes in equityRestricted
equity
Non-restricted
equityTotal equity
Thousands of SEK Share capital Statutory
reserve
Share
premium
reserve
Fair value
reserve
Retained
earnings
Profit/loss for
the period
Balance at 1 January 2016 1,668,336 109,196 3,188,631 -25,995 775,663 114,072 5,829,903
Appropriation of profit as per AGM resolution
Amount carried forward - - - - 79,851 -79,851 -
Transactions with owners in the form of dividends - - - - - -34,221 -34,221
Profit/loss for the period - - - - - -3,449 -3,449
Other comprehensive income for the period - - - 8,059 - - 8,059
Comprehensive income for the period - - - - - - 4,610
Balance at 31 March 2016 1,668,336 109,196 3,188,631 -17,936 855,514 -3,449 5,800,292
Balance at 1 January 2016 1,668,336 109,196 3,188,631 -25,995 775,663 114,072 5,829,903
Appropriation of profit as per AGM resolution
Amount carried forward - - - - 79,851 -79,851 -
Transactions with owners in the form of dividends - - - - - -34,221 -34,221
Profit/loss for the year - - - - - 75,896 75,896
Other comprehensive income for the year - - - 26,606 - - 26,606
Comprehensive income for the year - - - - - - 102,502
Balance at 31 December 2016 1,668,336 109,196 3,188,631 611 855,514 75,896 5,898,184
Balance at 1 January 2017 1,668,336 109,196 3,188,631 611 855,514 75,896 5,898,184
Appropriation of profit as per AGM resolution
Amount carried forward - - - - 41,896 -41,896 -
Transactions with owners in the form of dividends - - - - - -34,000 -34,000
Profit/loss for the period - - - - - 35,707 35,707
Other comprehensive income for the period - - - -3,381 - - -3,381
Comprehensive income for the period - - - - - - 32,326
Balance at 31 March 2017 1,668,336 109,196 3,188,631 -2,770 897,410 35,707 5,896,510
Restricted equity
Restricted equity may not be decreased by dividends.
Statutory reserve
The purpose of the statutory reserve was to save a share of the net profit not used to cover losses carried forward. The statutory reserve also includes amounts added to the share premium
reserve before 1 January 2006.
Non-restricted equity
Share premium reserve
When shares are issued at a premium, i.e. the amount paid for the shares exceeds their quotient value, the amount received in excess of the quotient value of the shares is transferred to the
share premium reserve. Amounts transferred to the share premium reserve on 1 January 2006 or later are included in non-restricted equity.
Fair value reserve
The fair value reserve includes the accumulated net change in the fair value of available-for-sale financial assets until the asset is derecognised from the balance sheet.
Retained earnings
Retained earnings comprise the non-restricted equity of previous years after any dividends are paid. When combined with profit or loss for the year and the fair value reserve, this is equal to the
total non-restricted equity, i.e. the amount available for distribution to shareholders.
11
SPARBANKEN SKÅNE AB (PUBL) COMPANY REG. NO. 516401-0091 – JANUARY–MARCH 2017 INTERIM REPORT
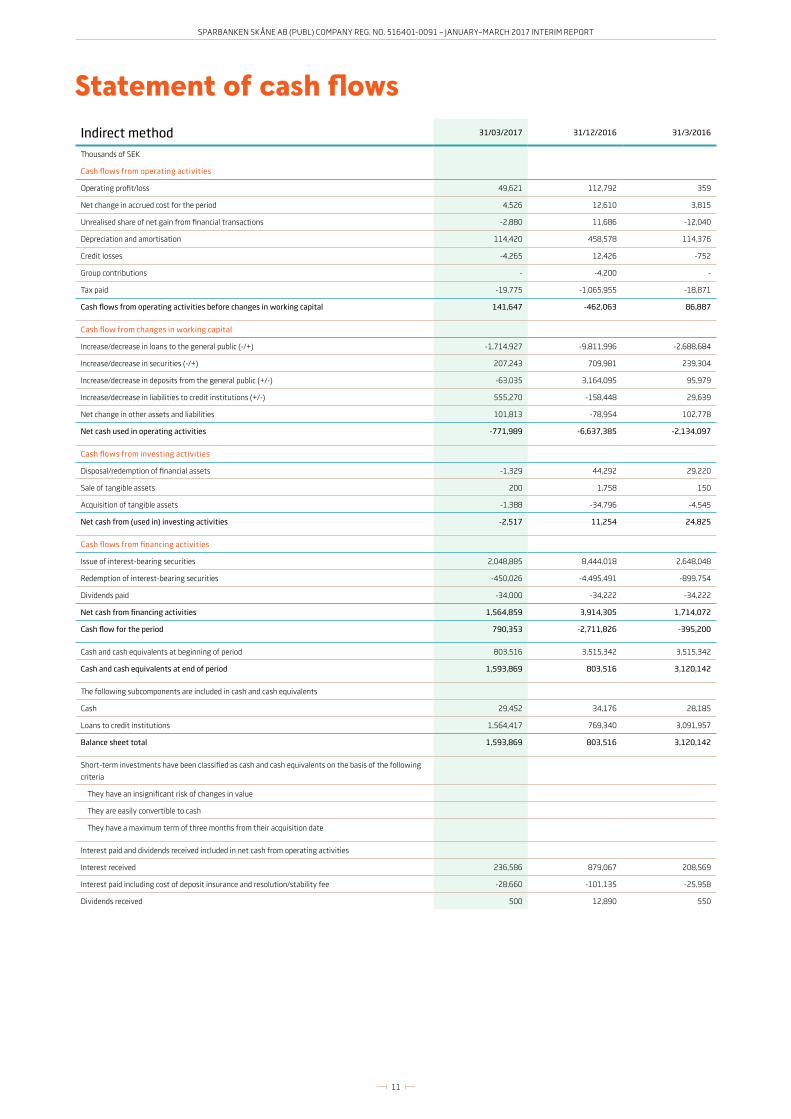
Statement of cash flowsIndirect method 31/03/2017 31/12/2016 31/3/2016
Thousands of SEK
Cash flows from operating activities
Operating profit/loss 49,621 112,792 359
Net change in accrued cost for the period 4,526 12,610 3,815
Unrealised share of net gain from financial transactions -2,880 11,686 -12,040
Depreciation and amortisation 114,420 458,578 114,376
Credit losses -4,265 12,426 -752
Group contributions - -4,200 -
Tax paid -19,775 -1,065,955 -18,871
Cash flows from operating activities before changes in working capital 141,647 -462,063 86,887
Cash flow from changes in working capital
Increase/decrease in loans to the general public (-/+) -1,714,927 -9,811,996 -2,688,684
Increase/decrease in securities (-/+) 207,243 709,981 239,304
Increase/decrease in deposits from the general public (+/-) -63,035 3,164,095 95,979
Increase/decrease in liabilities to credit institutions (+/-) 555,270 -158,448 29,639
Net change in other assets and liabilities 101,813 -78,954 102,778
Net cash used in operating activities -771,989 -6,637,385 -2,134,097
Cash flows from investing activities
Disposal/redemption of financial assets -1,329 44,292 29,220
Sale of tangible assets 200 1,758 150
Acquisition of tangible assets -1,388 -34,796 -4,545
Net cash from (used in) investing activities -2,517 11,254 24,825
Cash flows from financing activities
Issue of interest-bearing securities 2,048,885 8,444,018 2,648,048
Redemption of interest-bearing securities -450,026 -4,495,491 -899,754
Dividends paid -34,000 -34,222 -34,222
Net cash from financing activities 1,564,859 3,914,305 1,714,072
Cash flow for the period 790,353 -2,711,826 -395,200
Cash and cash equivalents at beginning of period 803,516 3,515,342 3,515,342
Cash and cash equivalents at end of period 1,593,869 803,516 3,120,142
The following subcomponents are included in cash and cash equivalents
Cash 29,452 34,176 28,185
Loans to credit institutions 1,564,417 769,340 3,091,957
Balance sheet total 1,593,869 803,516 3,120,142
Short-term investments have been classified as cash and cash equivalents on the basis of the following
criteria
They have an insignificant risk of changes in value
They are easily convertible to cash
They have a maximum term of three months from their acquisition date
Interest paid and dividends received included in net cash from operating activities
Interest received 236,586 879,067 208,569
Interest paid including cost of deposit insurance and resolution/stability fee -28,660 -101,135 -25,958
Dividends received 500 12,890 550
12
SPARBANKEN SKÅNE AB (PUBL) COMPANY REG. NO. 516401-0091 – JANUARY–MARCH 2017 INTERIM REPORT
Thousands of SEK
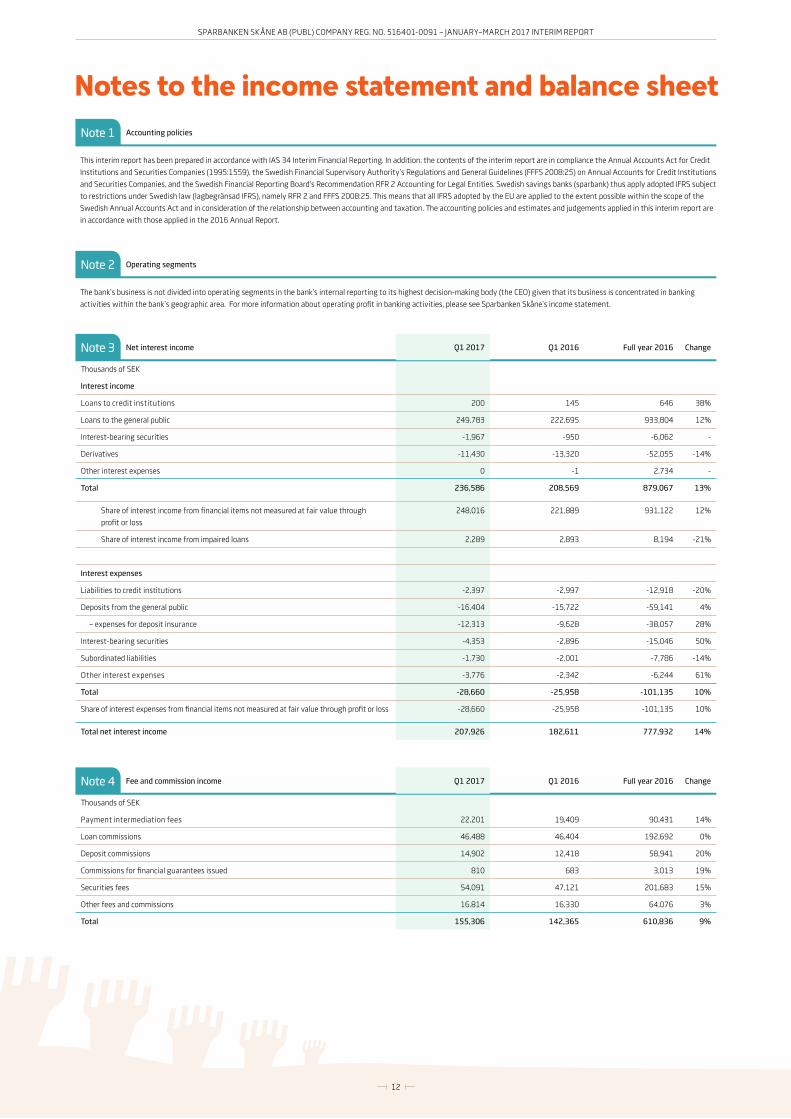
Payment intermediation fees 22,201 19,409 90,431 14%
Loan commissions 46,488 46,404 192,692 0%
Deposit commissions 14,902 12,418 58,941 20%
Commissions for financial guarantees issued 810 683 3,013 19%
Securities fees 54,091 47,121 201,683 15%
Other fees and commissions 16,814 16,330 64,076 3%
Total 155,306 142,365 610,836 9%
Notes to the income statement and balance sheetNote 1 Accounting policies
This interim report has been prepared in accordance with IAS 34 Interim Financial Reporting. In addition, the contents of the interim report are in compliance the Annual Accounts Act for Credit
Institutions and Securities Companies (1995:1559), the Swedish Financial Supervisory Authority’s Regulations and General Guidelines (FFFS 2008:25) on Annual Accounts for Credit Institutions
and Securities Companies, and the Swedish Financial Reporting Board's Recommendation RFR 2 Accounting for Legal Entities. Swedish savings banks (sparbank) thus apply adopted IFRS subject
to restrictions under Swedish law (lagbegränsad IFRS), namely RFR 2 and FFFS 2008:25. This means that all IFRS adopted by the EU are applied to the extent possible within the scope of the
Swedish Annual Accounts Act and in consideration of the relationship between accounting and taxation. The accounting policies and estimates and judgements applied in this interim report are
in accordance with those applied in the 2016 Annual Report.
Note 2 Operating segments
The bank’s business is not divided into operating segments in the bank’s internal reporting to its highest decision-making body (the CEO) given that its business is concentrated in banking
activities within the bank’s geographic area. For more information about operating profit in banking activities, please see Sparbanken Skåne’s income statement.
Thousands of SEK
Interest income
Loans to credit institutions 200 145 646 38%
Loans to the general public 249,783 222,695 933,804 12%
Interest-bearing securities -1,967 -950 -6,062 -
Derivatives -11,430 -13,320 -52,055 -14%
Other interest expenses 0 -1 2,734 -
Total 236,586 208,569 879,067 13%
Share of interest income from financial items not measured at fair value through
profit or loss
248,016 221,889 931,122 12%
Share of interest income from impaired loans 2,289 2,893 8,194 -21%
Interest expenses
Liabilities to credit institutions -2,397 -2,997 -12,918 -20%
Deposits from the general public -16,404 -15,722 -59,141 4%
– expenses for deposit insurance -12,313 -9,628 -38,057 28%
Interest-bearing securities -4,353 -2,896 -15,046 50%
Subordinated liabilities -1,730 -2,001 -7,786 -14%
Other interest expenses -3,776 -2,342 -6,244 61%
Total -28,660 -25,958 -101,135 10%
Share of interest expenses from financial items not measured at fair value through profit or loss -28,660 -25,958 -101,135 10%
Total net interest income 207,926 182,611 777,932 14%
Fee and commission income Q1 2017 Q1 2016 Full year 2016 Change
Net interest income Q1 2017 Q1 2016 Full year 2016 ChangeNote 3
Note 4

13
SPARBANKEN SKÅNE AB (PUBL) COMPANY REG. NO. 516401-0091 – JANUARY–MARCH 2017 INTERIM REPORT
Thousands of SEK
Specific impairment, individually assessed loans
Write-off of realised credit losses for the period -3,847 -11,126 -60,181 -65%
Reversal of previous impairment of credit losses recognised as realised losses in the financial
statements for the period
3,544 10,654 48,305 -67%
Impairment of credit losses for the period -1,881 -15,189 -82,945 -88%
Amount received for previously realised credit losses 528 760 2,888 -31%
Reversal of impairment of credit losses no longer necessary 5,457 14,276 80,989 -62%
Net cost for the period for individually assessed loans 3,801 -625 -10,944 -
Homogeneous groups of loans assessed in groups with a limited value and similar
credit risk
Write-off of realised credit losses for the period -687 -1,070 -4,508 -36%
Amount received for previously realised credit losses 116 55 243 -
Allocation to/release of credit loss reserve 488 840 866 -42%
Net cost for the period for homogenous loans assessed in groups -83 -175 -3,399 -53%
Contingent liabilities
Net cost for the period for settlement of guarantees and other contingent liabilities 1,191 2,367 5,048 -50%
Net cost for the period for credit losses 4,909 1,567 -9,295 -
Thousands of SEK
Shareholdings/investments 34 -1,360 -4,672 -
Interest-bearing securities -1,227 -2 18,503 -
Other financial instruments 6,907 -6,337 -3,424 -
Exchange rate fluctuations 1,185 825 3,153 44%
Total 6,899 -6,874 13,560 -
Thousands of SEK
Payment intermediation fees -7,536 -8,576 -39,408 -12%
Securities fees -6,301 -5,086 -21,853 24%
Other fees and commissions -1,101 -5,640 -12,717 -80%
Total -14,938 -19,302 -73,978 -23%
Notes to the income statement and balance sheet
Fee and commission income Q1 2017 Q1 2016 Full year 2016 Change
Fee and commission expenses Q1 2017 Q1 2016 Full year 2016 Change
Net gain/loss from financial transactions Q1 2017 Q1 2016 Full year 2016 Change
Net gain/net loss by valuation category
Financial assets at fair value through profit or loss -1,227 -1,360 10,668 -10%
Capital gain on available-for-sale financial assets 34 -2 3,163 -
Ineffective portion of fair value hedge 244 - 902 -
Derivatives intended for risk management, no hedge accounting 6,663 -6,337 -4,326 -
Change in fair value of derivatives used as hedging instruments in a fair value hedge 3,537 -4,092 17,405 -14%
Change in fair value of hedged item attributable to the hedged risk in fair value hedges -3,537 4,092 -17,405 -14%
Exchange rate fluctuations 1,185 825 3,153 44%
Total 6,899 -6,874 13,560 -
Q1 2017 Q1 2016 Full year 2016 Change
Net credit losses Q1 2017 Q1 2016 Full year 2016 Change
Net interest income Q1 2017 Q1 2016 Full year 2016 Change
Note 5
Note 6
Note 7
14
SPARBANKEN SKÅNE AB (PUBL) COMPANY REG. NO. 516401-0091 – JANUARY–MARCH 2017 INTERIM REPORT
Thousands of SEK
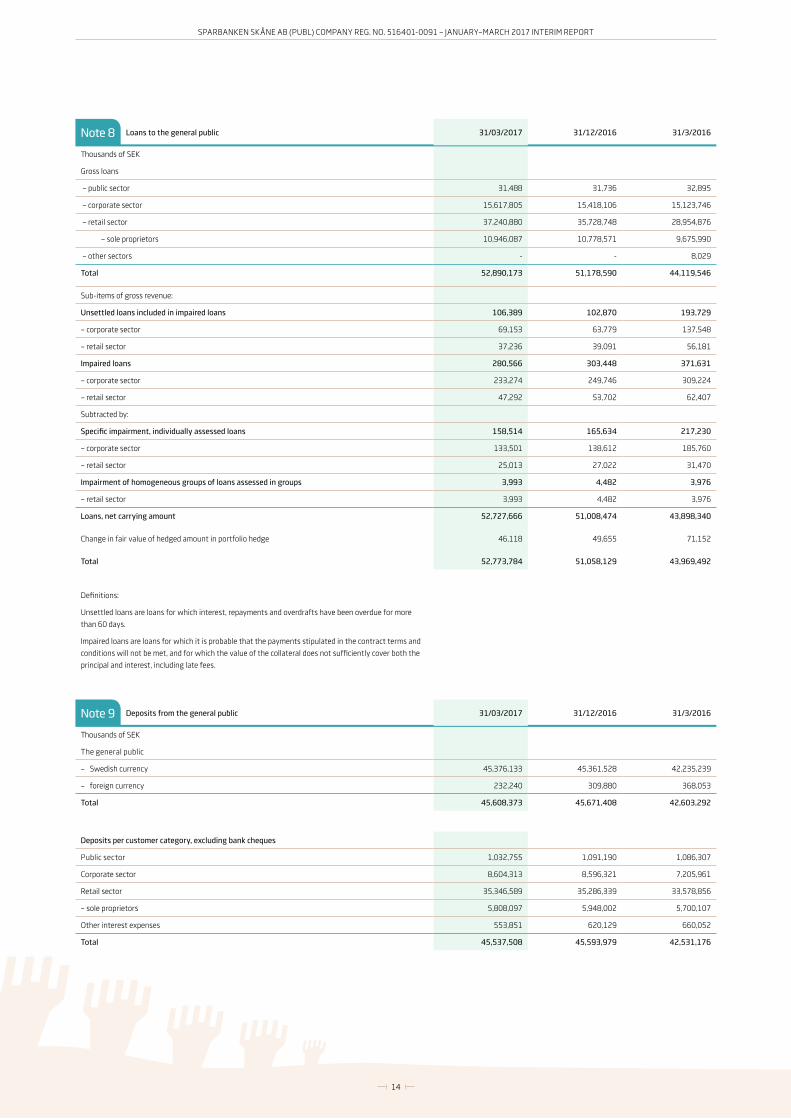
The general public
– Swedish currency 45,376,133 45,361,528 42,235,239
– foreign currency 232,240 309,880 368,053
Total 45,608,373 45,671,408 42,603,292
Thousands of SEK
Gross loans
– public sector 31,488 31,736 32,895
– corporate sector 15,617,805 15,418,106 15,123,746
– retail sector 37,240,880 35,728,748 28,954,876
– sole proprietors 10,946,087 10,778,571 9,675,990
– other sectors - - 8,029
Total 52,890,173 51,178,590 44,119,546
Sub-items of gross revenue:
Unsettled loans included in impaired loans 106,389 102,870 193,729
– corporate sector 69,153 63,779 137,548
– retail sector 37,236 39,091 56,181
Impaired loans 280,566 303,448 371,631
– corporate sector 233,274 249,746 309,224
– retail sector 47,292 53,702 62,407
Subtracted by:
Specific impairment, individually assessed loans 158,514 165,634 217,230
– corporate sector 133,501 138,612 185,760
– retail sector 25,013 27,022 31,470
Impairment of homogeneous groups of loans assessed in groups 3,993 4,482 3,976
– retail sector 3,993 4,482 3,976
Loans, net carrying amount 52,727,666 51,008,474 43,898,340
Change in fair value of hedged amount in portfolio hedge 46,118 49,655 71,152
Total 52,773,784 51,058,129 43,969,492
Definitions:
Unsettled loans are loans for which interest, repayments and overdrafts have been overdue for more
than 60 days.
Impaired loans are loans for which it is probable that the payments stipulated in the contract terms and
conditions will not be met, and for which the value of the collateral does not sufficiently cover both the
principal and interest, including late fees.
Loans to the general public 31/03/2017 31/12/2016 31/3/2016
Deposits per customer category, excluding bank cheques
Public sector 1,032,755 1,091,190 1,086,307
Corporate sector 8,604,313 8,596,321 7,205,961
Retail sector 35,346,589 35,286,339 33,578,856
– sole proprietors 5,808,097 5,948,002 5,700,107
Other interest expenses 553,851 620,129 660,052
Total 45,537,508 45,593,979 42,531,176
Deposits from the general public 31/03/2017 31/12/2016 31/3/2016
Note 8
Note 9
15
SPARBANKEN SKÅNE AB (PUBL) COMPANY REG. NO. 516401-0091 – JANUARY–MARCH 2017 INTERIM REPORT
Thousands of SEK Fair value Carrying
amount
Difference Fair value Carrying
amount
Difference
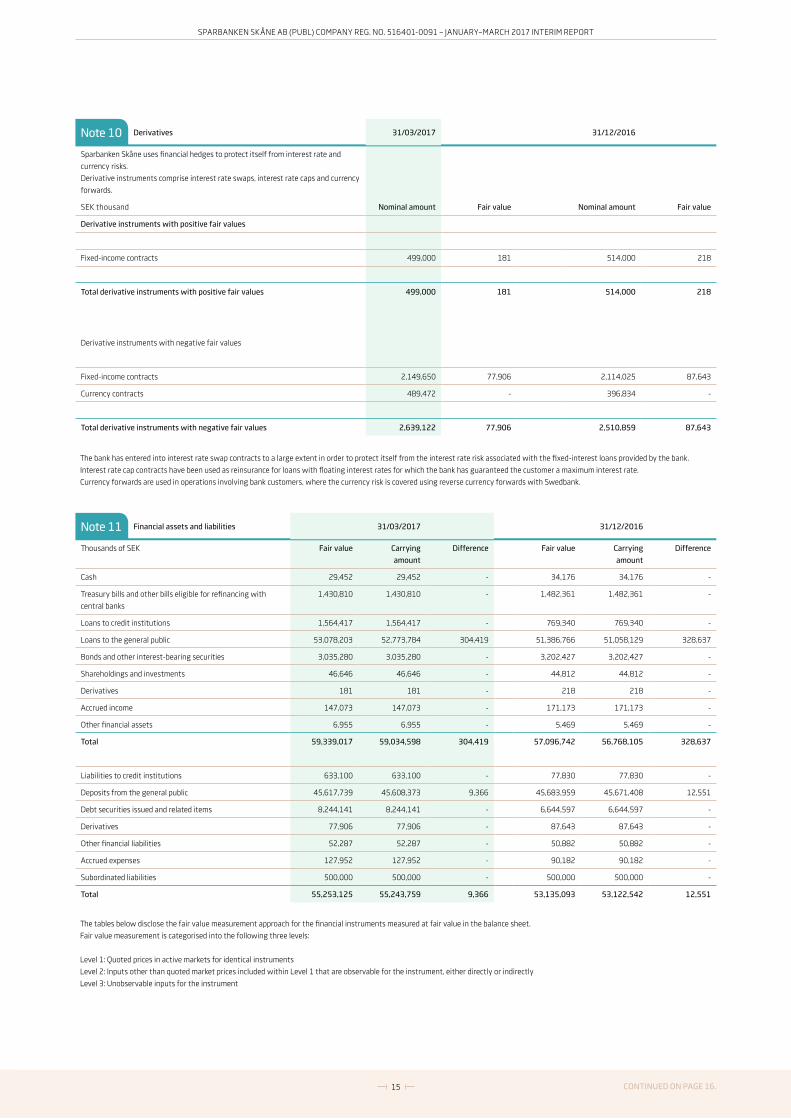
Cash 29,452 29,452 - 34,176 34,176 -
Treasury bills and other bills eligible for refinancing with
central banks
1,430,810 1,430,810 - 1,482,361 1,482,361 -
Loans to credit institutions 1,564,417 1,564,417 - 769,340 769,340 -
Loans to the general public 53,078,203 52,773,784 304,419 51,386,766 51,058,129 328,637
Bonds and other interest-bearing securities 3,035,280 3,035,280 - 3,202,427 3,202,427 -
Shareholdings and investments 46,646 46,646 - 44,812 44,812 -
Derivatives 181 181 - 218 218 -
Accrued income 147,073 147,073 - 171,173 171,173 -
Other financial assets 6,955 6,955 - 5,469 5,469 -
Total 59,339,017 59,034,598 304,419 57,096,742 56,768,105 328,637
Liabilities to credit institutions 633,100 633,100 - 77,830 77,830 -
Deposits from the general public 45,617,739 45,608,373 9,366 45,683,959 45,671,408 12,551
Debt securities issued and related items 8,244,141 8,244,141 - 6,644,597 6,644,597 -
Derivatives 77,906 77,906 - 87,643 87,643 -
Other financial liabilities 52,287 52,287 - 50,882 50,882 -
Accrued expenses 127,952 127,952 - 90,182 90,182 -
Subordinated liabilities 500,000 500,000 - 500,000 500,000 -
Total 55,253,125 55,243,759 9,366 53,135,093 53,122,542 12,551
Sparbanken Skåne uses financial hedges to protect itself from interest rate and
currency risks.
Derivative instruments comprise interest rate swaps, interest rate caps and currency
forwards.
SEK thousand Nominal amount Fair value Nominal amount Fair value
Derivative instruments with positive fair values
Fixed-income contracts 499,000 181 514,000 218
Total derivative instruments with positive fair values 499,000 181 514,000 218
Derivative instruments with negative fair values
Fixed-income contracts 2,149,650 77,906 2,114,025 87,643
Currency contracts 489,472 - 396,834 -
Total derivative instruments with negative fair values 2,639,122 77,906 2,510,859 87,643
Loans to the general public 31/03/2017 31/12/2016 31/3/2016
Deposits from the general public 31/03/2017 31/12/2016 31/3/2016
The bank has entered into interest rate swap contracts to a large extent in order to protect itself from the interest rate risk associated with the fixed-interest loans provided by the bank.
Interest rate cap contracts have been used as reinsurance for loans with floating interest rates for which the bank has guaranteed the customer a maximum interest rate.
Currency forwards are used in operations involving bank customers, where the currency risk is covered using reverse currency forwards with Swedbank.
Derivatives 31/03/2017 31/12/2016
The tables below disclose the fair value measurement approach for the financial instruments measured at fair value in the balance sheet.
Fair value measurement is categorised into the following three levels:
Level 1: Quoted prices in active markets for identical instruments
Level 2: Inputs other than quoted market prices included within Level 1 that are observable for the instrument, either directly or indirectly
Level 3: Unobservable inputs for the instrument
Financial assets and liabilities 31/03/2017 31/12/2016
CONTINUED ON PAGE 16.
Note 10
Note 11
16
SPARBANKEN SKÅNE AB (PUBL) COMPANY REG. NO. 516401-0091 – JANUARY–MARCH 2017 INTERIM REPORT
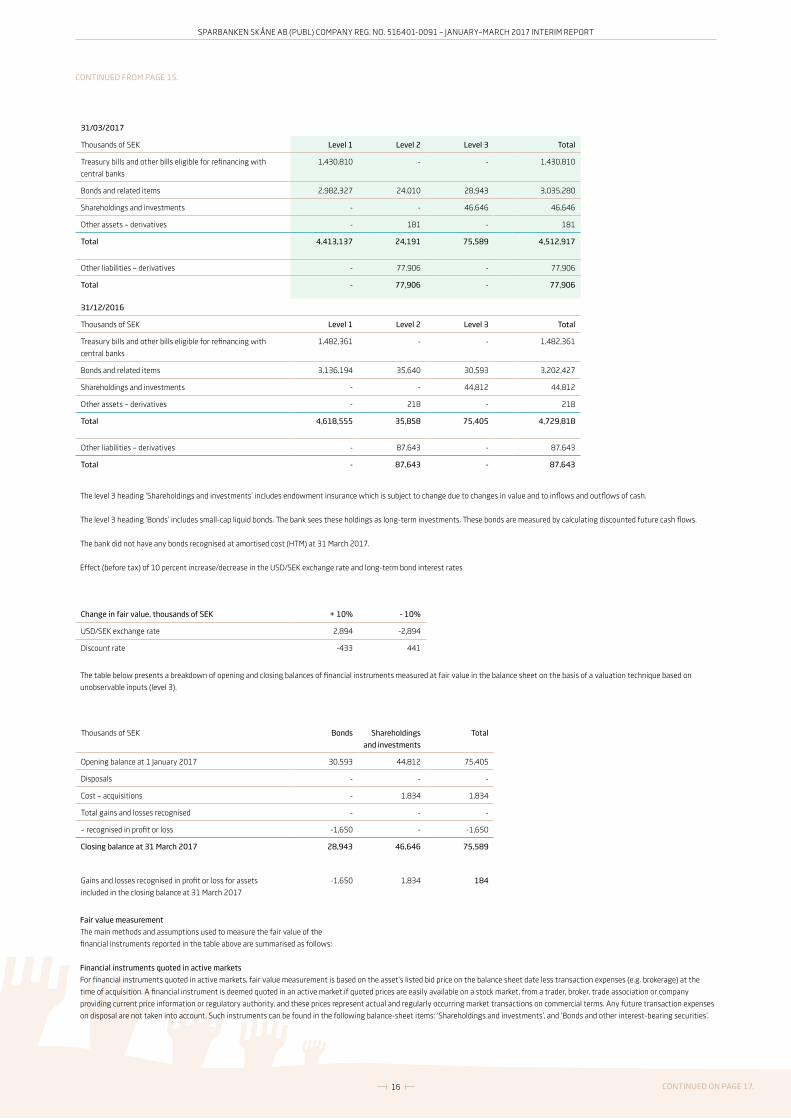
The level 3 heading ‘Shareholdings and investments’ includes endowment insurance which is subject to change due to changes in value and to inflows and outflows of cash.
The level 3 heading ‘Bonds’ includes small-cap liquid bonds. The bank sees these holdings as long-term investments. These bonds are measured by calculating discounted future cash flows.
The bank did not have any bonds recognised at amortised cost (HTM) at 31 March 2017.
Effect (before tax) of 10 percent increase/decrease in the USD/SEK exchange rate and long-term bond interest rates
The table below presents a breakdown of opening and closing balances of financial instruments measured at fair value in the balance sheet on the basis of a valuation technique based on
unobservable inputs (level 3).
Thousands of SEK Bonds Shareholdings
and investments
Total
Opening balance at 1 January 2017 30,593 44,812 75,405
Disposals - - -
Cost – acquisitions - 1,834 1,834
Total gains and losses recognised - - -
– recognised in profit or loss -1,650 - -1,650
Closing balance at 31 March 2017 28,943 46,646 75,589
Gains and losses recognised in profit or loss for assets
included in the closing balance at 31 March 2017
-1,650 1,834 184
CONTINUED FROM PAGE 15.
31/03/2017
Thousands of SEK Level 1 Level 2 Level 3 Total
Treasury bills and other bills eligible for refinancing with
central banks
1,430,810 - - 1,430,810
Bonds and related items 2,982,327 24,010 28,943 3,035,280
Shareholdings and investments - - 46,646 46,646
Other assets – derivatives - 181 - 181
Total 4,413,137 24,191 75,589 4,512,917
Other liabilities – derivatives - 77,906 - 77,906
Total - 77,906 - 77,906
31/12/2016
Thousands of SEK Level 1 Level 2 Level 3 Total
Treasury bills and other bills eligible for refinancing with
central banks
1,482,361 - - 1,482,361
Bonds and related items 3,136,194 35,640 30,593 3,202,427
Shareholdings and investments - - 44,812 44,812
Other assets – derivatives - 218 - 218
Total 4,618,555 35,858 75,405 4,729,818
Other liabilities – derivatives - 87,643 - 87,643
Total - 87,643 - 87,643
Fair value measurement
The main methods and assumptions used to measure the fair value of the
financial instruments reported in the table above are summarised as follows:
Financial instruments quoted in active markets
For financial instruments quoted in active markets, fair value measurement is based on the asset’s listed bid price on the balance sheet date less transaction expenses (e.g. brokerage) at the
time of acquisition. A financial instrument is deemed quoted in an active market if quoted prices are easily available on a stock market, from a trader, broker, trade association or company
providing current price information or regulatory authority, and these prices represent actual and regularly occurring market transactions on commercial terms. Any future transaction expenses
on disposal are not taken into account. Such instruments can be found in the following balance-sheet items: ‘Shareholdings and investments’, and ‘Bonds and other interest-bearing securities’.
Change in fair value, thousands of SEK + 10% - 10%
USD/SEK exchange rate 2,894 -2,894
Discount rate -433 441
CONTINUED ON PAGE 17.
17
SPARBANKEN SKÅNE AB (PUBL) COMPANY REG. NO. 516401-0091 – JANUARY–MARCH 2017 INTERIM REPORT
Thousands of SEK
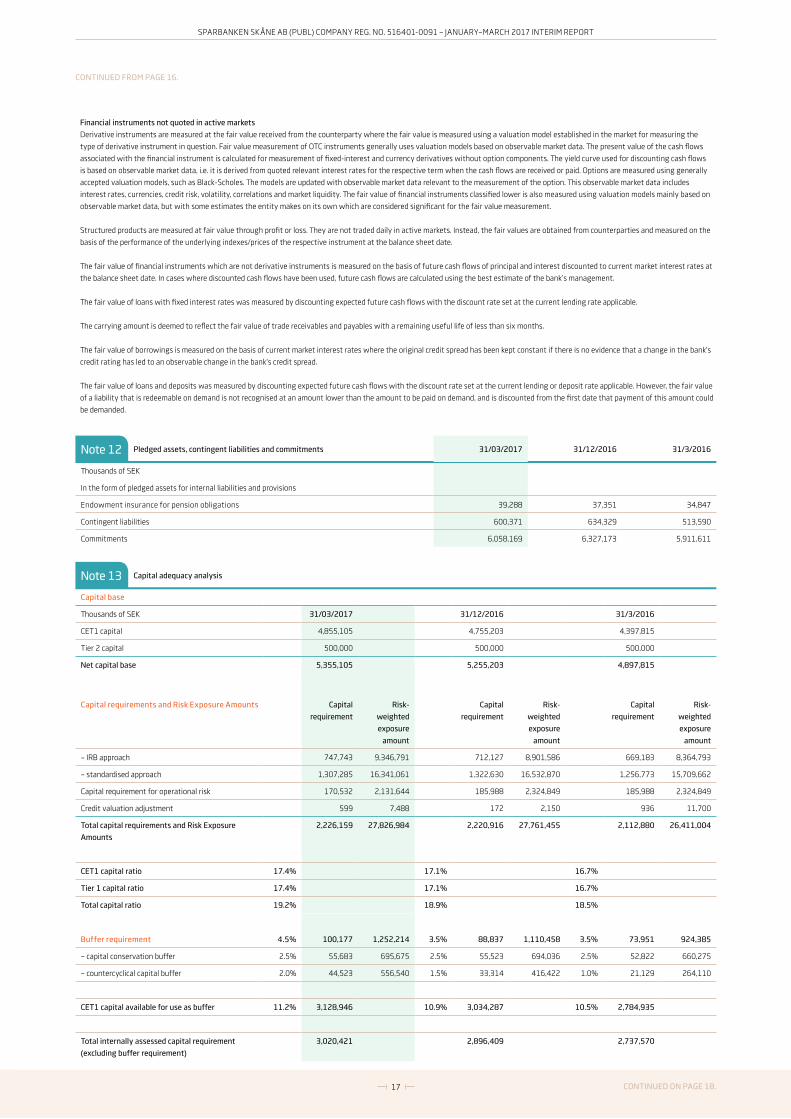
In the form of pledged assets for internal liabilities and provisions
Endowment insurance for pension obligations 39,288 37,351 34,847
Contingent liabilities 600,371 634,329 513,590
Commitments 6,058,169 6,327,173 5,911,611
Financial instruments not quoted in active markets
Derivative instruments are measured at the fair value received from the counterparty where the fair value is measured using a valuation model established in the market for measuring the
type of derivative instrument in question. Fair value measurement of OTC instruments generally uses valuation models based on observable market data. The present value of the cash flows
associated with the financial instrument is calculated for measurement of fixed-interest and currency derivatives without option components. The yield curve used for discounting cash flows
is based on observable market data, i.e. it is derived from quoted relevant interest rates for the respective term when the cash flows are received or paid. Options are measured using generally
accepted valuation models, such as Black-Scholes. The models are updated with observable market data relevant to the measurement of the option. This observable market data includes
interest rates, currencies, credit risk, volatility, correlations and market liquidity. The fair value of financial instruments classified lower is also measured using valuation models mainly based on
observable market data, but with some estimates the entity makes on its own which are considered significant for the fair value measurement.
Structured products are measured at fair value through profit or loss. They are not traded daily in active markets. Instead, the fair values are obtained from counterparties and measured on the
basis of the performance of the underlying indexes/prices of the respective instrument at the balance sheet date.
The fair value of financial instruments which are not derivative instruments is measured on the basis of future cash flows of principal and interest discounted to current market interest rates at
the balance sheet date. In cases where discounted cash flows have been used, future cash flows are calculated using the best estimate of the bank’s management.
The fair value of loans with fixed interest rates was measured by discounting expected future cash flows with the discount rate set at the current lending rate applicable.
The carrying amount is deemed to reflect the fair value of trade receivables and payables with a remaining useful life of less than six months.
The fair value of borrowings is measured on the basis of current market interest rates where the original credit spread has been kept constant if there is no evidence that a change in the bank's
credit rating has led to an observable change in the bank's credit spread.
The fair value of loans and deposits was measured by discounting expected future cash flows with the discount rate set at the current lending or deposit rate applicable. However, the fair value
of a liability that is redeemable on demand is not recognised at an amount lower than the amount to be paid on demand, and is discounted from the first date that payment of this amount could
be demanded.
CONTINUED FROM PAGE 16.
Pledged assets, contingent liabilities and commitments 31/03/2017 31/12/2016 31/3/2016
Capital requirements and Risk Exposure Amounts Capital
requirement
Risk-
weighted
exposure
amount
Capital
requirement
Risk-
weighted
exposure
amount
Capital
requirement
Risk-
weighted
exposure
amount
– IRB approach 747,743 9,346,791 712,127 8,901,586 669,183 8,364,793
– standardised approach 1,307,285 16,341,061 1,322,630 16,532,870 1,256,773 15,709,662
Capital requirement for operational risk 170,532 2,131,644 185,988 2,324,849 185,988 2,324,849
Credit valuation adjustment 599 7,488 172 2,150 936 11,700
Total capital requirements and Risk Exposure
Amounts
2,226,159 27,826,984 2,220,916 27,761,455 2,112,880 26,411,004
CET1 capital ratio 17.4% 17.1% 16.7%
Tier 1 capital ratio 17.4% 17.1% 16.7%
Total capital ratio 19.2% 18.9% 18.5%
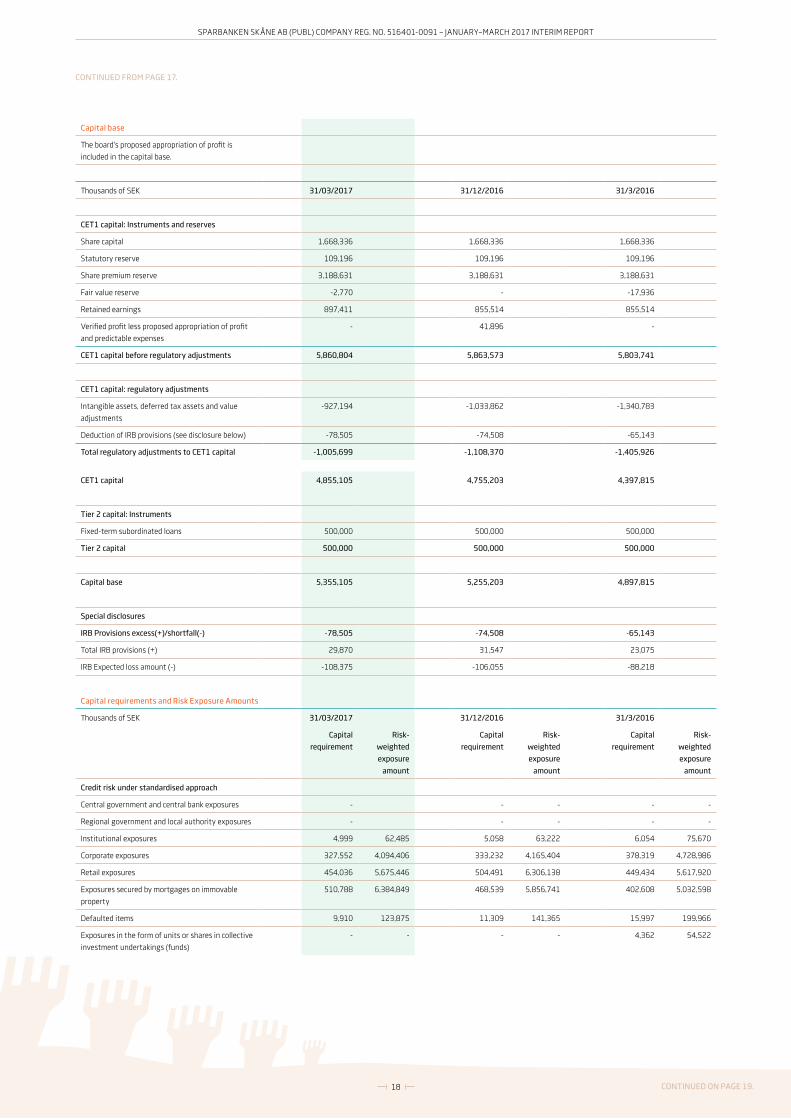
Note 13 Capital adequacy analysis
Capital base
Thousands of SEK 31/03/2017 31/12/2016 31/3/2016
CET1 capital 4,855,105 4,755,203 4,397,815
Tier 2 capital 500,000 500,000 500,000
Net capital base 5,355,105 5,255,203 4,897,815
Buffer requirement 4.5% 100,177 1,252,214 3.5% 88,837 1,110,458 3.5% 73,951 924,385
– capital conservation buffer 2.5% 55,683 695,675 2.5% 55,523 694,036 2.5% 52,822 660,275
– countercyclical capital buffer 2.0% 44,523 556,540 1.5% 33,314 416,422 1.0% 21,129 264,110
CET1 capital available for use as buffer 11.2% 3,128,946 10.9% 3,034,287 10.5% 2,784,935
Total internally assessed capital requirement
(excluding buffer requirement)
3,020,421 2,896,409 2,737,570
CONTINUED ON PAGE 18.
Note 12
18
SPARBANKEN SKÅNE AB (PUBL) COMPANY REG. NO. 516401-0091 – JANUARY–MARCH 2017 INTERIM REPORT
CET1 capital 4,855,105 4,755,203 4,397,815
Tier 2 capital: Instruments
Fixed-term subordinated loans 500,000 500,000 500,000
Tier 2 capital 500,000 500,000 500,000
Capital base 5,355,105 5,255,203 4,897,815
Special disclosures
IRB Provisions excess(+)/shortfall(-) -78,505 -74,508 -65,143
Total IRB provisions (+) 29,870 31,547 23,075
IRB Expected loss amount (-) -108,375 -106,055 -88,218
Capital requirements and Risk Exposure Amounts
Thousands of SEK 31/03/2017 31/12/2016 31/3/2016
Capital
requirement
Risk-
weighted
exposure
amount
Capital
requirement
Risk-
weighted
exposure
amount
Capital
requirement
Risk-
weighted
exposure
amount
Credit risk under standardised approach
Central government and central bank exposures - - - - -
Regional government and local authority exposures - - - - -
Institutional exposures 4,999 62,485 5,058 63,222 6,054 75,670
Corporate exposures 327,552 4,094,406 333,232 4,165,404 378,319 4,728,986
Retail exposures 454,036 5,675,446 504,491 6,306,138 449,434 5,617,920
Exposures secured by mortgages on immovable
property
510,788 6,384,849 468,539 5,856,741 402,608 5,032,598
Defaulted items 9,910 123,875 11,309 141,365 15,997 199,966
Exposures in the form of units or shares in collective
investment undertakings (funds)
- - - - 4,362 54,522
Capital base
The board's proposed appropriation of profit is
included in the capital base.
Thousands of SEK 31/03/2017 31/12/2016 31/3/2016
CET1 capital: Instruments and reserves
Share capital 1,668,336 1,668,336 1,668,336
Statutory reserve 109,196 109,196 109,196
Share premium reserve 3,188,631 3,188,631 3,188,631
Fair value reserve -2,770 - -17,936
Retained earnings 897,411 855,514 855,514
Verified profit less proposed appropriation of profit
and predictable expenses
- 41,896 -
CET1 capital before regulatory adjustments 5,860,804 5,863,573 5,803,741
CET1 capital: regulatory adjustments
Intangible assets, deferred tax assets and value
adjustments
-927,194 -1,033,862 -1,340,783
Deduction of IRB provisions (see disclosure below) -78,505 -74,508 -65,143
Total regulatory adjustments to CET1 capital -1,005,699 -1,108,370 -1,405,926
CONTINUED FROM PAGE 17.
CONTINUED ON PAGE 19.
19
SPARBANKEN SKÅNE AB (PUBL) COMPANY REG. NO. 516401-0091 – JANUARY–MARCH 2017 INTERIM REPORT
Capital
requirement
Risk-
weighted
exposure
amount
Capital
requirement
Risk-
weighted
exposure
amount
Capital
requirement
Risk-
weighted
exposure
amount
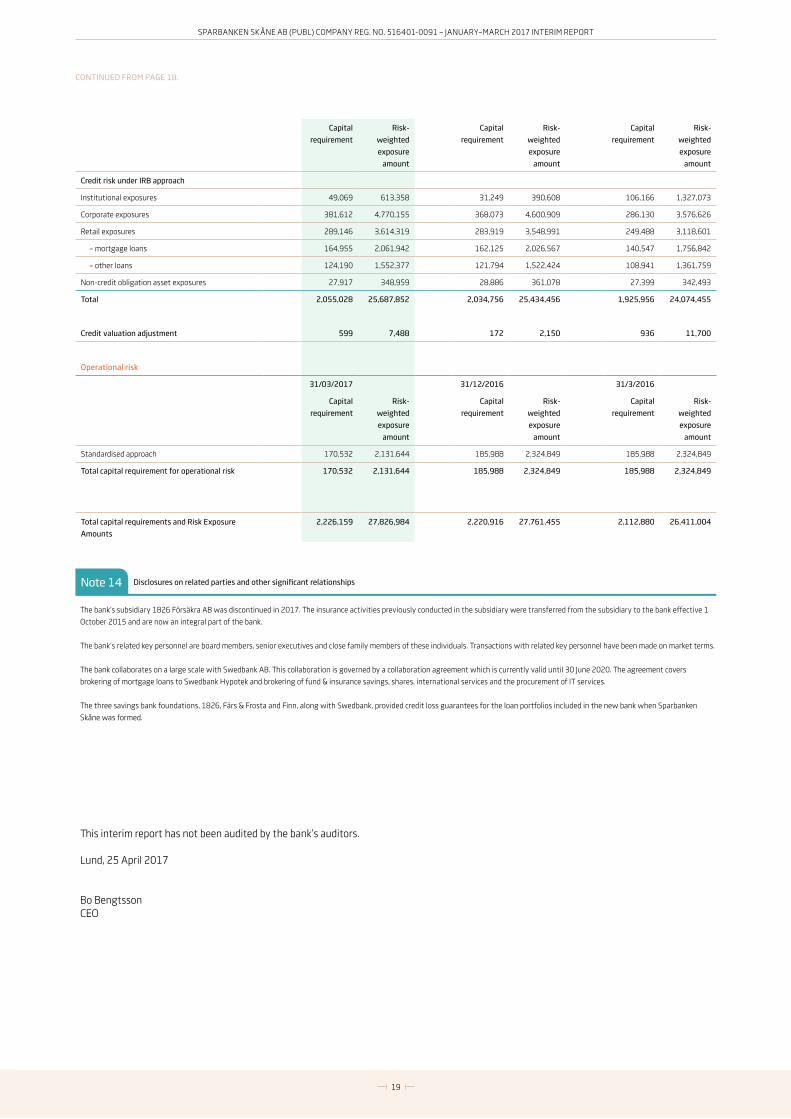
Credit risk under IRB approach
Institutional exposures 49,069 613,358 31,249 390,608 106,166 1,327,073
Corporate exposures 381,612 4,770,155 368,073 4,600,909 286,130 3,576,626
Retail exposures 289,146 3,614,319 283,919 3,548,991 249,488 3,118,601
– mortgage loans 164,955 2,061,942 162,125 2,026,567 140,547 1,756,842
– other loans 124,190 1,552,377 121,794 1,522,424 108,941 1,361,759
Non-credit obligation asset exposures 27,917 348,959 28,886 361,078 27,399 342,493
Total 2,055,028 25,687,852 2,034,756 25,434,456 1,925,956 24,074,455
Credit valuation adjustment 599 7,488 172 2,150 936 11,700
Operational risk
31/03/2017 31/12/2016 31/3/2016
Capital
requirement
Risk-
weighted
exposure
amount
Capital
requirement
Risk-
weighted
exposure
amount
Capital
requirement
Risk-
weighted
exposure
amount
Standardised approach 170,532 2,131,644 185,988 2,324,849 185,988 2,324,849
Total capital requirement for operational risk 170,532 2,131,644 185,988 2,324,849 185,988 2,324,849
Total capital requirements and Risk Exposure
Amounts
2,226,159 27,826,984 2,220,916 27,761,455 2,112,880 26,411,004
Note 14 Disclosures on related parties and other significant relationships
The bank’s subsidiary 1826 Försäkra AB was discontinued in 2017. The insurance activities previously conducted in the subsidiary were transferred from the subsidiary to the bank effective 1
October 2015 and are now an integral part of the bank.
The bank’s related key personnel are board members, senior executives and close family members of these individuals. Transactions with related key personnel have been made on market terms.
The bank collaborates on a large scale with Swedbank AB. This collaboration is governed by a collaboration agreement which is currently valid until 30 June 2020. The agreement covers
brokering of mortgage loans to Swedbank Hypotek and brokering of fund & insurance savings, shares, international services and the procurement of IT services.
The three savings bank foundations, 1826, Färs & Frosta and Finn, along with Swedbank, provided credit loss guarantees for the loan portfolios included in the new bank when Sparbanken
Skåne was formed.
This interim report has not been audited by the bank’s auditors.
Lund, 25 April 2017
Bo BengtssonCEO
CONTINUED FROM PAGE 18.
20
SPARBANKEN SKÅNE AB (PUBL) COMPANY REG. NO. 516401-0091 – JANUARY–MARCH 2017 INTERIM REPORT
Definitions
Transaction volumeThe bank’s transaction volume mainly consists of loans to the general public, brokered loans and credit that has been granted but not yet utilised. Transaction volume also includes savings volumes in the form of deposits from the general public, brokered funds & insurance and customer custody accounts.
CET1 capital ratioThe bank’s Common Equity Tier 1 (CET1) capital ratio is the CET1 capital of the bank expressed as a percentage of the Risk Exposure Amount (REA).
The CET1 capital is equal to the bank’s equity less goodwill and IRB provisions.
Total capital ratioThe bank’s total capital ratio is the capital base of the bank expressed as a percentage of the REA.
The capital base comprises the CET1 capital and subordinated liabilities. The regulatory requirement including capital conservation and countercyclical buffers for 2017 is 12.5%.
Leverage ratioThe bank’s leverage ratio is the CET1 capital of the bank expressed as a percentage of the bank’s total assets, pledged assets and contingent liabilities. As opposed to the CET1 capital ratio and the total capital ratio, risk weighting of certain assets and memorandum items is not taken into consideration. Instead, all exposures are recognised at their nominal amounts.
Loan-to-deposit ratioLoans to the general public expressed as a percentage of deposits from the general public.
LCRThe Liquidity Coverage Ratio (LCR) is calculated according to the Capital Requirements Regulation (CRR) and Directive (CRD IV). The regulatory requirement for 2017 is 80%, but it is being increased gradually and will be 100% starting in 2018. The LCR measures the bank’s unencumbered high-quality liquid assets (liquidity reserves) expressed as a percentage of the bank’s estimated liquidity needs in a 30-calendar day liquidity stress scenario.
NSFRThe Net Stable Funding Ratio (NSFR) assigns a weight to the bank’s assets and funding based on their maturity. Less liquid assets have a more negative impact on the ratio than those that are more liquid. Funding with a longer maturity has a more positive effect on the ratio than funding with a shorter maturity. The main aim of the ratio is to measure the bank’s ability to cope with a stress scenario over a one-year time horizon. If the ratio is over 100%, it means that long-term less liquid assets are funded satisfactorily with stable long-term borrowing.
Cost/income ratio before credit lossesThe bank’s costs (excluding credit losses) expressed as a percentage of the bank’s income.
Cost/income ratio after credit lossesThe bank’s costs (including credit losses) expressed as a percentage of the bank’s income.
Cost/income ratio after credit losses excluding dividends, capital gains, impairment losses and goodwill amortisationThe bank’s costs excluding impairment losses on financial assets and goodwill amortisation expressed as a percentage of the bank’s income excluding dividends and capital gains on disposal of branch offices.
Return on equityOperating profit net of tax (22%) expressed as a percentage of average equity.
Return on equity excluding dividends, capital gains, impair-ment losses and goodwill amortisationThe bank’s operating profit net of tax (22%), excluding dividends, capital gains on the disposal of branch offices, impairment losses on financial assets and goodwill amortisation, expressed as a percentage of average equity.
Loan loss ratio excluding brokered volumesCredit losses as a percentage of the opening balance of loans to the general public.
Loan loss ratio including brokered volumesCredit losses as a percentage of the opening balance of loans to the general public and brokered volumes.
Percentage of impaired loansNet impaired loans (i.e. taking into account provisions recognised as expenses) as a percentage of loans to the general public.
Average number of employeesThe average number of employees (1,730 hours per employee) has been calculated on the basis of the number of hours worked for the bank.

21
SPARBANKEN SKÅNE AB (PUBL) COMPANY REG. NO. 516401-0091 – JANUARY–MARCH 2017 INTERIM REPORT

22
SPARBANKEN SKÅNE AB (PUBL) COMPANY REG. NO. 516401-0091 – JANUARY–MARCH 2017 INTERIM REPORT
Sparbanken Skåne AB (publ) Box 204 221 00 Lund Phone: +46 (0)771-12 20 00 sparbankenskane.se
Recommended