1 Larissa Taylor Nuffield Project Summer 2013
Fuel Spray and Mixture Preparation in Split-Cycle Engine
A Nuffield Project with STEM Sussex
Larissa R Taylor
Park College Sussex Downs
Eastbourne
Supervisors;
Dr Steve Begg
Dr Oyuna Rybdylova
Dr Elena Sazhina
Sir Harry Ricardo Laboratories
Centre for Automotive Engineering
University of Brighton
2013

2 Larissa Taylor Nuffield Project Summer 2013
Fuel Spray and Mixture Preparation in Split-Cycle Engine
A Nuffield Project with STEM Sussex
Abstract
A new type of engine is being designed that is aimed to be more efficient by employing the
split-cycle engine concept. The engine operates as a two-stroke by dividing the conventional
four-strokes (the induction, compression, expansion and exhaust strokes) between two
separate cylinders; air at high pressure is fed into the combustor cylinder from the compressor
cylinder via a cross-over passage and valve. Feasibility studies of mixture preparation for a
given mass flow rate of air and fuel injection into the combustion chamber of a split-cycle
engine have been performed by numerical simulation. Fuel spray evaporation, vapour mixing
with air and the onset of combustion are key factors that influence the efficiency of an
engine. If the spray is placed in the right position then the gaseous cloud of fuel will be
formed near the spark plug when the fuel evaporates in the chamber. It is essential that the
fuel evaporates in the chamber in the correct position for complete and stable combustion.
The aim of research is to use a numerical CFD modelling program, ANSYS FLUENT, to test
where the vapour cloud of fuel will end up for ignition. By setting up the desired spray
parameters for realistic engine geometry and operating conditions, it can be determined
where the fuel droplets will end up inside the engine. Three injector locations were
considered, and three spray breakup cases were compared, namely; no breakup model, TAB
and WAVE breakup models. Interaction of spray and in-cylinder flow pattern has revealed
results that can be used for further design improvements to the new engine under the EU
INTERREG CEREEV project. The fuel droplets were considered as a multicomponent
liquid; 95% of iso-octane C8H18 and 5% of n-heptane C7H16 by mass. The study of the
evaporation process of multicomponent fuel droplets is relevant to the EU INTERREG E3C3
project, focusing on biofuels. The rate of evaporation as predicted by ANSYS FLUENT, is
monitored for both the C7H16 and C8H18 components. It is observed that n-heptane evaporates
faster than iso-octane as it can be expected. The results have shown that the optimum location
of the injector and ignition for a combustible mixture is close-spaced and central in the
chamber. The current project has provided a feasibility study of conventional CFD
capabilities for multicomponent fuel droplets. Thus, it lays foundation for CFD
implementation of the newly developed spray models at SHRL. As the SHRL experimental
and modelling work grows in sophistication and depth, newly developed spray models take
into account temperature gradients and species diffusion inside a multicomponent droplet.
Further research on validation of the CFD results against available experimental data is
needed.

3 Larissa Taylor Nuffield Project Summer 2013
Acknowledgements
I would like to thank the members of the Sir Harry Ricardo Labs at the University of
Brighton for their help and support and also the staff members at Park College Sussex Downs
for their support.
I would also like to give special thanks to STEM Sussex staff, in particular, Daniel Hawkins,
Bronagh Liddicoat and Patricia Harwood, and gratefully acknowledge the financial help of
the Nuffield Research Placement grant (http://www.stemsussex.co.uk/index.php/secondary-
fe/school-activities/nuffield-science-bursaries/).

4 Larissa Taylor Nuffield Project Summer 2013
List of Figures
Figure 1 Four stroke spark ignition engine
Figure 2 Four Stroke Petrol Engine and Definition of TDC and BDC
Figure 3 Four Stroke Diesel Engine
Figure 4 Two Stroke Engine
Figure 5 Scuderi Split Cycle Engine
Figure 6 Principal Elements of Split Cycle Engine
Figure 7 Mesh Components for CFDs
Figure 8 TAB break up activated in FLUENT.
Figure 9 Wave break up activated in FLUENT.
Figure 10 Mesh and Initial Conditions
Figure 11 Mesh and fuel injector positioned near inlet valve injector
Figure 12 Mesh and fuel injector positioned near exhaust duct
Figure 13 Mesh and fuel injector positioned near spark plug
Figure 14 Mesh and all fuel injector positions
Figure 15 Percentage of octane in the fuel vapour by mass for no-break up model
Figure 16 Percentage of octane in the fuel vapour by mass for TAB breakup model
Figure 17 Percentage of octane in the fuel vapour by mass for Wave breakup model
Figure 18 In-cylinder mass of octane vapour for TAB breakup model
Figure 19 Mass of octane vapour for TAB and no-breakup models
Figure 20 Mass fraction of octane at 2ms for no-breakup model for near-inlet injector
Figure 21 Mass fraction of octane at 2ms for TAB model for near-inlet injector
Figure 22 Mass fraction of octane at 2ms for Wave model for near-inlet injector
Figure 23 Initial velocities of droplets for injector positioned by the exhaust duct
Figure 24 Initial velocities of droplets for group injectors positioned by the exhaust duct
Figure 25 Velocity magnitude contours for in-cylinder flow for group injectors positioned
by the exhaust duct; no-breakup model for spray
Figure 26 Mass fraction of octane vapour for group injectors positioned by the exhaust
duct; no-breakup spray model
Figure 27 Mass fraction of octane vapour of group injectors by the exhaust duct for Wave
breakup model
Figure 28 Initial velocities of droplets for the single injector positioned by spark plug
Figure 29 Mass fraction of octane vapour for no-breakup model for the spark-plug
location of the injector
Figure 30 Mass fraction of octane vapour for Wave breakup model for the spark-plug
location of the injector
Figure 31 Ratio of octane in fuel vapour by mass for the spark-plug location of the
injector for the injection velocity of 50 m/s; Wave spray breakup model.

5 Larissa Taylor Nuffield Project Summer 2013
Glossary
BDC Bottom dead centre
CA BTDC Crank angle before top dead centre
CFD Computational fluid dynamics
ICE Internal combustion engines
MFR Mass flow rate
SHRL Sir Harry Ricardo Laboratory
SI Spark ignition
SSC Scuderi Split Cycle
TDC Top dead centre

6 Larissa Taylor Nuffield Project Summer 2013
Fuel Spray and Mixture Preparation in Split-Cycle Engine
1. Background
An engine is a machine designed to convert chemical energy of fuel into useful mechanical
energy. Heat engines such as internal combustion engines (ICE) in cars and external
combustion engines such as steam engines burn fuel releasing heat in the process, which then
creates motion (Engine 2013).
The fuel in ICE is normally a fossil fuel (hydrocarbons) and the combustion of the fuel occur
using oxygen in air as the oxidizer. An example of a fuel combustion equation for octane is:
C8H18 + 12 ½ O2 9H2O + 8CO2
Improvements in engine design address both better fuel efficiency and less pollution
simultaneously. Fossil fuel is a non-renewable resource and its cost is rising. The product of
combustion is carbon dioxide, a green house gas associated with global warming (Gent
2007). An alternative could be using biofuels, such a biodiesel, which are renewable.
At the Sir Harry Ricardo Laboratory (SHRL) at the University of Brighton, a team of
theoretical and experimental researchers are investigating different engine designs and fuel
injection capabilities for engine efficiency and emissions reduction (SHRL 2013). The
University is actively involved in several research programmes in this field.
Upon arriving at the University of Brighton I met with some of my project supervisors, Dr
Elena Sazhina and Dr Steve Begg. Dr Begg gave me a tour of the SHRL experimental
facilities. The SHRL has a variety of engine test beds and they talked me through some of the
research being carried out at the laboratory. I also met some of the postgraduate students, in
particular K. CK, MSc student.
My supervisors were keen that I should get a university experience. I had an opportunity to
attend a doctoral conference in July (Research Student Conference 2013). I attended the key
note speech on Stem Cell research and even though it was not relevant to my project I found
it very interesting. After that I attended the second stream at the doctoral conference which
was mostly about engines. It was very interesting to see the projects that the PhD students
were doing and how it related not just to my project but to the problems of the current world.
Angad Panesar presented his findings on “fuel consumption improvement by waste heat
recovery for automotive application” which was interesting to me as it showed how making
engines more efficient is a very important subject at the moment, especially with the
regulations regarding emissions This is why the split cycle engine will be very useful as it
will be very efficient. Where the current ICE is maybe only about 40% efficient, the split

7 Larissa Taylor Nuffield Project Summer 2013
cycle engine will be 60% meaning that extra processes to make it more efficient will not be
needed.
After the conference I was given a tour of the Vetronics lab by Dr Panagiotis Oikonomidis
(Vetronics, 2013). I saw the Vetronics laboratory room where they test the control box of a
car and the small systems used for it. What really caught my attention was the car they had
built. They had designed it and built it from scratch. It had this system where the steering
wheel was not directly attached to the wheels but to a control box which was connected to the
wheels. The control box sensed the direction the steering wheel had been turned to and so
made the wheel turn too. This is useful in that sensors on the control box could be used to
make driving safer. The use of the control box also means that the car can be steered using a
joy stick too and because it is not connected directly to the wheels it can be steered from
places like behind the car.
I was also shown a quick tutorial on how to use SolidWorks by Dr Manzanares, a commercial
graphics computer program used by students and researchers for design and development.
In early August I was shown how to use ANSYS FLUENT, a numerical modelling program
that would assist me in calculations for this project.
I also attended an Automotive Engineering research workshop in August on modelling of
droplet and spray dynamics, heating and evaporation. Everyone participating had some really
good ideas and had clearly thought hard about how to solve their problems. Heated
discussion on each presentation showed the interest and the level of quality of work from
everyone involved; it was a learning experience for me. It highlighted how research
collaborations work (Automotive Engineering 2013).
My supervisors have given me the background I needed to carry out a project related to on-
going studies at SHRL. The project focused on numerical simulation studies on the feasibility
of mixture preparation for given mass flow rate of fuel injection into a split-cycle engine.
Fuel spray and mixture preparation for combustion are key factors in the efficiency of an
engine. A numerical modelling program, ANSYS FLUENT, has been used to carry out this
study. FLUENT is a computational fluid dynamics (CFD) software package. A brief
description of CFD is given in Section 2. The outcome of the calculations guides future
design considerations or used by researchers at SHRL as experimental parameters.In what

8 Larissa Taylor Nuffield Project Summer 2013
follows, literature review will be followed by original results of the CFD simulations and
analysis of the results.
Four stroke engines
A four stroke engine has four main stages: intake, compression, power and exhaust (see
Figure 1). The most common ICE engine is the piston-type reciprocating engine where the
crankshaft is turned by piston moving up and down in a cylinder (Heywood 1988). The stroke
refers to the movement of the piston. A four-stroke engine completes a cycle in four strokes
and two crankshaft revolutions.
Figure 1. Four stroke spark ignition engine (reproduced from Internal Combustion Engine
http://authors.library.caltech.edu/25069/6/AirPollution88-Ch4.pdf uploaded August 2013)
Gasoline direct-injection engines
The piston rests at top dead centre (TDC) – stroke position 1 (up). As the piston moves down,
air is forced into the cylinder due to pressure difference. The piston descends down the
cylinder to bottom dead centre (BDC) – stroke position 2 (down). The piston is then pushed
back up to TDC compressing the air – stroke position 3 (up). For direct-injection engines,
fuel spray is injected into cylinder well before TDC. It takes time to evaporate and mix with
air before the combustible gaseous mixture is ignited with a spark plug. Rapid combustion of
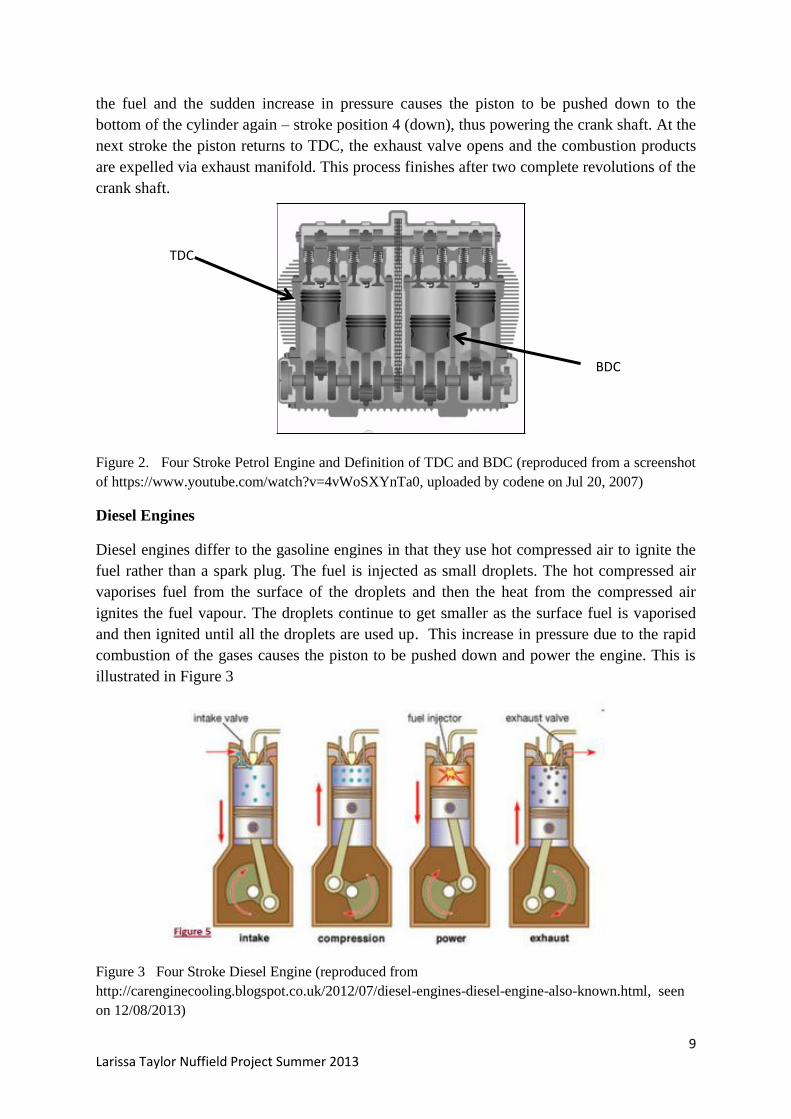
9 Larissa Taylor Nuffield Project Summer 2013
the fuel and the sudden increase in pressure causes the piston to be pushed down to the
bottom of the cylinder again – stroke position 4 (down), thus powering the crank shaft. At the
next stroke the piston returns to TDC, the exhaust valve opens and the combustion products
are expelled via exhaust manifold. This process finishes after two complete revolutions of the
crank shaft.
Figure 2. Four Stroke Petrol Engine and Definition of TDC and BDC (reproduced from a screenshot
of https://www.youtube.com/watch?v=4vWoSXYnTa0, uploaded by codene on Jul 20, 2007)
Diesel Engines
Diesel engines differ to the gasoline engines in that they use hot compressed air to ignite the
fuel rather than a spark plug. The fuel is injected as small droplets. The hot compressed air
vaporises fuel from the surface of the droplets and then the heat from the compressed air
ignites the fuel vapour. The droplets continue to get smaller as the surface fuel is vaporised
and then ignited until all the droplets are used up. This increase in pressure due to the rapid
combustion of the gases causes the piston to be pushed down and power the engine. This is
illustrated in Figure 3
Figure 3 Four Stroke Diesel Engine (reproduced from
http://carenginecooling.blogspot.co.uk/2012/07/diesel-engines-diesel-engine-also-known.html, seen
on 12/08/2013)
TDC
BDC

10 Larissa Taylor Nuffield Project Summer 2013
A four-stroke engine completes a power cycle in four strokes, this means that it requires 2
revolutions of the crankshaft to complete the process. Another engine has been designed to
only need one crankshaft revolution to complete the power cycle. It is a two-stroke engine. It
only requires two strokes, or up and down movement, of the piston to fully complete to
process.
Two Stroke Engines
Two stroke engines complete the power cycle in just one crankshaft revolution. It does this
by having the end of the combustion stroke happen simultaneously with the start of the
compression stroke, and having exhaust and intake (otherwise known as scavenging) happen
at the same time too.
Figure 4 Two Stroke Engine (reproduced from
http://en.wikipedia.org/wiki/Two-stroke_engine seen on August 2013))
The disadvantage of two stroke engines is that some fuel is lost to the exhaust duct when it
enters the chamber and so can cause pollution when it leaks out of the exhaust. Two stroke
engines are also not very fuel efficient. (How Stuff Works 2013)
Scuderi Split-cycle Engine
The Scuderi Split Cycle (SSC) engine is designed so that it is more efficient. It is similar to
the gasoline cycle in that it uses a spark plug not hot compressed air. It is different in that it
does intake and compression in one cylinder, known as the compression cylinder and then
expansion and exhaust in another, known as the power cylinder. The two cylinders are
connected by a “crossover port”, through which high pressure gas is transferred from the
compressor cylinder to the expander cylinder between the compression and power strokes.
(Philips et al 2011) This means that it only requires one complete revolution of the crank
shaft for the process to be completed. A normal 4 stroke engine would have to do two
complete crankshaft revolutions, as shown in Fig. 1, to match the power of the Scuderi
engine. The use of a turbocharger (a device with a turbine powered by the kinetic energy of
the exhaust to improve volumetric efficiency) with this Scuderi engine also comes in useful
as it allows one compression cylinder to provide air flow to multiple power cylinders.
Intake
Exhaust

11 Larissa Taylor Nuffield Project Summer 2013
(Scuderi 2013; Meldolesi 2012) High turbulence in the engine means that the fuel and air
mixes quickly and this prevents knock, giving successful combustion.
Figure 5a and 5b. Scuderi Split Cycle Engine (reproduced from
http://www.scuderigroup.com/technology/ SCUDERI™ Group, Inc 2013)
EU INTERREG project CEREEV
The EU INTERREG project CEREEV (CEREEV, 2012) establishes collaboration between
University of Brighton, IRSEEM (Institut de Recherche de l’ESIGELEC), and Jules Verne
University of Picardie. The research under the CEREEV aims to overcome problems of
volumetric efficiency and combustion phasing. A major functional benefit of the split cycle
engine is the separation of the compression and power cylinders. This allows optimum
conditions for each can be achieved (Meldolesi 2012). Figure 6 shows a schematic
representation of the cylinders in split cycle engine.
Figure 6 Schematic of Split Cycle Engine (reproduced from Meldolesi and Badain, 2012)
The CEREEV project aims to develop a new type of split-cycle engine when intake and
compression are done in a separate cylinder. The proposed two-stroke process requires rapid
filling in the power cylinder, where combustion will take place, while simultaneously
injecting fuel and air from different places.

12 Larissa Taylor Nuffield Project Summer 2013
2. Computational Fluid Dynamics (CFD)
Computational Fluid Dynamics (CFD) is the term used to describe numerical codes that can
calculate the properties of a fluid, such as temperature, velocity, chemical composition
throughout a region of space (ANSYS 2013).
CFD breaks down geometries into cells that make up a mesh, and algorithms based on
conservation of energy, mass and momentum are applied to each individual cell to compute
the fluid flow, species and temperature (Fig. 7). Boundary conditions are set by the user.
Partial differential equations that describe the flow are converted into simultaneous algebraic
equations which are set up for each cell. These equations are solved using numerical methods
and when the answers found for each cell coincide with the specified tolerance then they
converge and the solution is found. (ANSYS 2013)
Figure 7. Mesh Components for CFDs (reproduced from
http://willem.engen.nl/uni/fluent/documents/external/fluent-overview.ppt)
ANSYS FLUENT
ANSYS FLUENT is a CFD code. It is a numerical simulation program that allows the user to
model flow, chemical species and temperature for complex geometries; the calculation starts
by reading a mesh from its case and data file or from creating one in the program itself. By
setting the properties, boundary conditions and any desired conditions to be tracked,
FLUENT can calculate a solution for the given parameters and give a variety of data outputs.
FLUENT also allows you to see pictures showing things like fluid flow, giving the user a
wide variety of results to see from the calculated solution. (ANSYS 2013).

13 Larissa Taylor Nuffield Project Summer 2013
Breakup models
Within FLUENT, the user can choose to activate atomization models for their run. The term
breakup refers to fragmentation and splitting of the droplets injected.
If each individual droplet is broken up into smaller droplets then this will create more surface
area for the same amount of fuel and so it should evaporate quicker. The idea of breakup is
similar to what actually happens in an engine so is a helpful tool for realistic modelling.
There are different models of breakup:
Taylor analogy breakup (TAB) model.
This model uses oscillations of certain amplitude to break up the droplet. External forces
acting on the droplet are caused by the motion of it.
The droplet has both surface tension, which stops it from
falling apart, and a damping force, which stops the
oscillations from getting too big (Turner 2012).
The droplet will break up if the distortion reaches a critical
level. The distortion should to be equal to half the radius of
the droplet in order for breakup to succeed. The child
droplets are assumed to be neither oscillating nor distorted.
(ANSYS 2013).
From Fig. 8, you can see that the number of breakup parcels
is 2 meaning that the parent droplet will breakup into 2
similar child droplets.
Wave break up.
Otherwise known as stripping breakup, it relies on the
relative velocity between the liquid and gas phases.
The Kelvin–Helmholtz instability occurs when there is a
velocity difference across the interface between liquid fuel
and gas; instability of the fuel jet phase causes ‘child
droplets’ to be stripped from liquid core of the jet, resulting
in the gradual decrease in size of the injected fuel. The flow
travelling in the opposite direction to the fuel spray can also
help with the stripping of the core liquid (ANSYS 2013).
The CFD code provides a breakup constant for the value of
stable droplet sizes. This constant will depend on the type of
injector used (Turner 2012)
Figure 9 Wave breakup model
activated in FLUENT.
Figure 8 TAB breakup model
activated in FLUENT.

14 Larissa Taylor Nuffield Project Summer 2013
3. Aims and Objectives
It has been decided to focus research on optimization of injector location for a good mixture
preparation in this study. The objectives are:
To setup CFD simulation for a realistic engine geometry and boundary conditions
To explore spray tracking for several injector locations
To assess mixture preparation for each case
To formulate recommendations for the engine design
For my study, a mesh of the engine to work with was taken from 2-ACE project. An EPSRC
project, “A Fundamental Study of the Novel Poppet Valve 2-stroke Auto-ignition
Combustion Engine” has been carried out at SHRL. As part of the EPSRC study, a CFD
simulation using FLUENT was set and explored for a realistic engine geometry (2-ACE
2012).
The focus of my study is to set the injector position and run cases for different breakup
models to test where the vapour cloud of fuel will end up for ignition. Three injector
positions (Fig. 14) were investigated, namely:
fuel injection by the inlet valve;
fuel injection by the outlet valve
fuel injection near the spark plug.
Three injector types:
flat fan
single injection
group injections
were modelled. Three breakup models were explored, namely: no breakup, TAB and Wave.
An accompanying study by CK, 2013 is focusing on volumetric efficiency for a range of inlet
pressures. This facilitates team work for my research.

15 Larissa Taylor Nuffield Project Summer 2013
4. Methodology
Input parameters. Each CFD case had the same base parameters set, whilst varying the
position of the fuel injector and its type (single, group, flat-fan). The following base input
parameters for each CFD case were used:
Inlet Pressure = 10bar at T= 400°K (1 bar = 100 kilopascals)
Initial in-cylinder
condition
Pressure = 1bar at T= 300°K
In-cylinder initial air
composition
Taken as mixture of nitrogen and to 0.23 of oxygen by mass
Liquid fuel Multicomponent fuel consisting of 95% octane (C8H18) and
5% heptane (C7H16) by mass.
Injector flowrate 0.0076 kg/s
The inlet duct pressure was set to about 9.9 bar as initial condition. Figure 10 shows the mesh
and initial conditions. For the first CFD case, the injector used was a flat-fan-atomizer that
had 80 streams of multicomponent droplets. The width of the orifice was 0.147mm. The
droplets had an initial speed of 200m/s. After evaporation, the in-cylinder charge shall be a
combustible mixture of air with fuel, namely iso-octane and n-heptane vapours. The ANSYS
FLUENT model was set to “Discrete Phase – On” for spray calculation, and interaction of
gas with droplets was activated to make it more realistic. Mass flow rate was 0.0076 kg/s.
This is a historical value taken from the 2-ACE project. This means that stoichiometric ratio
will be achieved at about 4ms for in-cylinder mass of 0.4g. This corresponds to the volume of
around 5.05e-05m3 at 40 CA BTDC (crank angle before top dead centre) and in-cylinder
pressure of 10 bar at T = 400°K. The CFD run was set to monitor pressure, temperature,
speed, cylinder mass, cylinder volume, temperature, density, mass fraction of octane, mass
fraction of heptane averaged over in-cylinder volume, thus giving a large amount of output
data files.
Figure 10 Mesh and Initial Conditions (reproduced from 2-ACE EPSRC project, 2012)
10bar
In-cylinder air composition 23% O2
9.9 bar
1bar
16 Larissa Taylor Nuffield Project Summer 2013
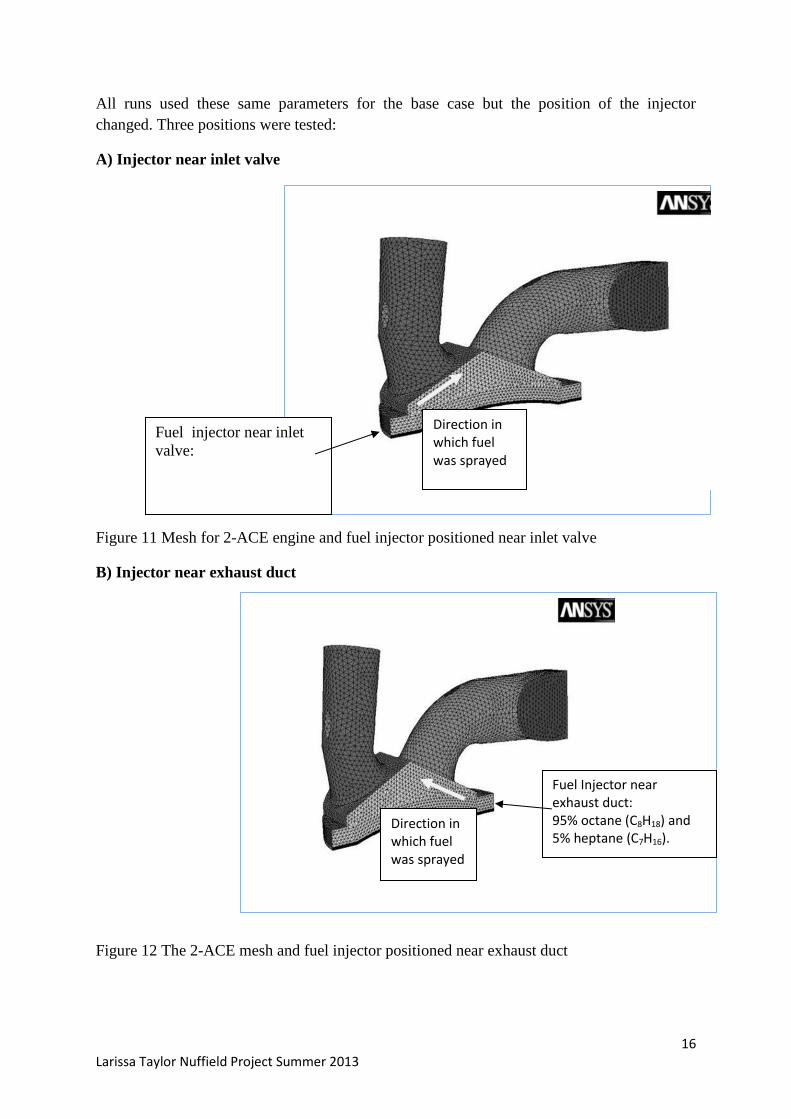
All runs used these same parameters for the base case but the position of the injector
changed. Three positions were tested:
A) Injector near inlet valve
Figure 11 Mesh for 2-ACE engine and fuel injector positioned near inlet valve
B) Injector near exhaust duct
Figure 12 The 2-ACE mesh and fuel injector positioned near exhaust duct
Fuel injector near inlet
valve:
Direction in which fuel was sprayed
Direction in which fuel was sprayed
Fuel Injector near exhaust duct: 95% octane (C8H18) and 5% heptane (C7H16).

17 Larissa Taylor Nuffield Project Summer 2013
C) Near spark plug
Figure 13 The 2-ACE mesh and fuel injector positioned near spark plug
Three different atomization models: no-breakup, TAB breakup and Wave breakup were
tested on the three different injector positions; near the inlet valve, near the exhaust and by
the spark plug (see Fig. 14). The runs were performed for 800 times steps (8ms).
Figure 14 Mesh and all fuel injector positions (reproduced from 2-ACE Project, School of
CEM. University of Brighton, Brighton, 2012)
Direction in which fuel was sprayed
Fuel Injector near spark plug: 95% octane (C8H18) and % heptane (C7H16).
Near inlet
valve
Near exhaust duct
Near spark
plug

18 Larissa Taylor Nuffield Project Summer 2013
As described in the previous section, each case for each injector had been set up first before
any calculations were made. This case and data files with the desired parameters then had to
be read into FLUENT. The time step size has been set as 0.01ms.
On convergence, for post-processing of the results, FLUENT allows the user to create and
view velocity vectors and contours of scalar variables. The output data files created from the
monitors set. The breakup models for each injector were tested consecutively with the data
being gathered and analysed after each individual run.
No-breakup atomization model did not require any change to the set up. So after checking
that all the parameters were correct, the only thing needed to be done was to initialise, patch
and then calculate the solution. No-breakup calculation ran until 300 time steps (3ms) where
it was stopped due to length it was taking but still provided sufficient data for analysis.
TAB breakup required TAB breakup menu option to be turned on from the Models menu of
FLUENT. Figure 8 (in Breakup Models section) shows the set-up of the “Discrete Phase –
On” editing menu where breakup can be turned on. Once changed to TAB breakup on, it is
initialised by patching initial conditions, and then transient run is launched to calculate the
solution. The TAB breakup run was calculated for 800 time steps (8ms).
Wave breakup needed the Wave breakup menu option to be turned on. The same process as
TAB break up was used to do this; in the Models menu with “Discrete Phase – On” , go to
“Edit” and click on the “Physical Models” tab. At the bottom of the menu is the breakup
options. Figure 9 (in Breakup Models section) shows the activation setup for Wave breakup.
Wave breakup calculation also ran to 800 times steps (8ms).
After each calculation was finished the data were post-processed. FLUENT allows images of
filled contours to be made, showing the output of the calculation on any part of the mesh and
can be easily adjusted to the desired needs. Images of mass fraction of octane and heptane
vapour, and vectors of velocity were useful in showing where the vapour cloud ended up.
There are images that show tracks of fuel droplets making it useful to see what has actually
happened with the spray inside the chamber.
Due to setting up monitors, output files are generated by FLUENT. This data was
transferrable to Microsoft Excel and was manipulated to give lots of graphical representation
of the data. This makes all three models easier to compare quantitatively.
19 Larissa Taylor Nuffield Project Summer 2013
5. Results:
Injector near Inlet Valve:
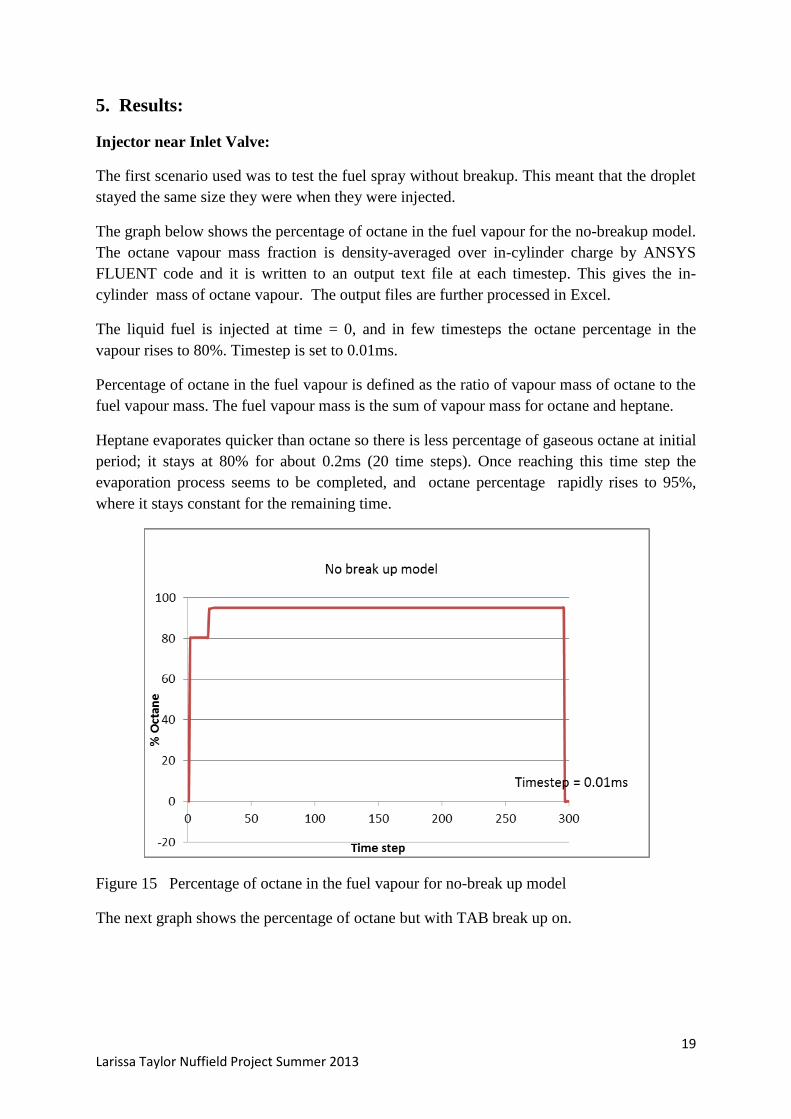
The first scenario used was to test the fuel spray without breakup. This meant that the droplet
stayed the same size they were when they were injected.
The graph below shows the percentage of octane in the fuel vapour for the no-breakup model.
The octane vapour mass fraction is density-averaged over in-cylinder charge by ANSYS
FLUENT code and it is written to an output text file at each timestep. This gives the in-
cylinder mass of octane vapour. The output files are further processed in Excel.
The liquid fuel is injected at time = 0, and in few timesteps the octane percentage in the
vapour rises to 80%. Timestep is set to 0.01ms.
Percentage of octane in the fuel vapour is defined as the ratio of vapour mass of octane to the
fuel vapour mass. The fuel vapour mass is the sum of vapour mass for octane and heptane.
Heptane evaporates quicker than octane so there is less percentage of gaseous octane at initial
period; it stays at 80% for about 0.2ms (20 time steps). Once reaching this time step the
evaporation process seems to be completed, and octane percentage rapidly rises to 95%,
where it stays constant for the remaining time.
Figure 15 Percentage of octane in the fuel vapour for no-break up model
The next graph shows the percentage of octane but with TAB break up on.

20 Larissa Taylor Nuffield Project Summer 2013
Figure 16 Percentage of octane in the fuel for TAB breakup.
Figure 16 shows that initially it rises to 80% due to the liquid fuel evaporation. But instead of
staying constant like the breakup model did, it continues to rise unsteadily until about 0.4ms
(40 time steps), showing how gradually it evaporates. It reaches the 95% level for mass
fraction of octane in fuel vapour, and remains there for the rest of the time. This shows that
evaporation started almost instantly upon injection but did not develop as rapidly as without
break-up.
The next graph shows the octane percentage for the Wave break up model.
Figure 17 Percentage of octane in the fuel for Wave breakup

21 Larissa Taylor Nuffield Project Summer 2013
Figure 17 is similar to the no-break up model. When the liquid fuel is injected the percentage
increases to 80% after one time step. It then gradually increases very slightly for about the
next 0.1ms (10 time steps) perhaps showing some slight evaporation before rapidly
increasing to 95%. The Wave break up model reaches a constant of 95% octane faster than
the other models. The plots above have shown percentage of octane in fuel vapour by mass.
The next figure shows transient behaviour of in-cylinder octane vapour mass.
Figure 18. In-cylinder mass of octane vapour (kg) for all breakup model upto 8ms
Figure 19. In-cylinder mass of octane vapour: magnified view
In Fig 18, the oscillations in mass of octane vapour are observed that settle down with time.
The mass of octane vapour varies with in-cylinder mass. The variations of in-cylinder mass

22 Larissa Taylor Nuffield Project Summer 2013
are ascribed to reflected pressure waves causing backflow of in-cylinder charge into inlet
manifold.
As you can see from Figure 19 the evaporation of fuel for TAB model begins almost
immediately and slowly increasing. After a certain delay, evaporation for Wave and no-
breakup model rises steeply reaching up to just under 1.80E-08 kg. During the first 0.1ms, the
octane mass fraction for the TAB model is still increasing. It reaches a maximum of around
1.7E-08kg, then vapour mass start decreasing for all breakup models, as in-cylinder charge
mass is decreasing due to the flow up the inlet duct because of reflected pressure waves.
These oscillations are believed to be caused by pressure waves inside the cylinder; they are
slowly damping with time as can be seen on Figure 18.
The following images show fuel vapour distribution as predicted by FLUENT.
No-breakup model, mass fraction of octane at 2ms
Figure 20 Mass fraction of octane vapour at 2ms for near-inlet valve injector; no-breakup
The bulk of the evaporated fuel remains by the injector. Some of it goes up the inlet duct,
meaning that fuel is wasted; the ignition will be hard as the bulk of the fuel is far from the
spark plug.

23 Larissa Taylor Nuffield Project Summer 2013
Although the maximum is almost 4 times smaller than the Wave model (see Fig. 22), a larger
portion of fuel has ended up spread around the chamber. The mass fraction near spark plug is
about 4e-05 with the highest points being around 5e-05.
With TAB model, you can see that the fuel particles did not travel very far as the whole
section around the injector contains most of the evaporated fuel. Again some escapes up the
inlet valve. Lower values of mass fractions of octane get around the chamber but like the
Wave model, it is quite close to zero.
TAB model mass fraction of Octane shows at 2 ms:
Figure 21 Mass fraction of octane vapour at 2ms for TAB model for near-inlet valve injector
Wave breakup model mass fraction of Octane for 2ms:
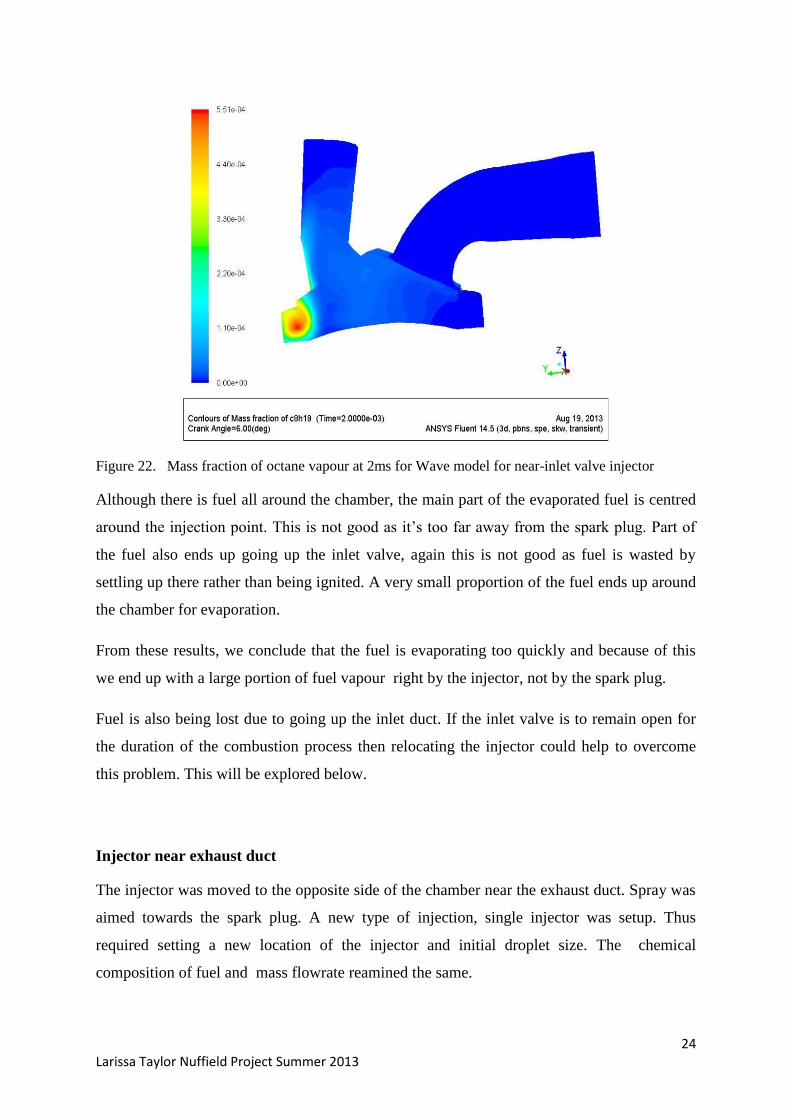
24 Larissa Taylor Nuffield Project Summer 2013
Figure 22. Mass fraction of octane vapour at 2ms for Wave model for near-inlet valve injector
Although there is fuel all around the chamber, the main part of the evaporated fuel is centred
around the injection point. This is not good as it’s too far away from the spark plug. Part of
the fuel also ends up going up the inlet valve, again this is not good as fuel is wasted by
settling up there rather than being ignited. A very small proportion of the fuel ends up around
the chamber for evaporation.
From these results, we conclude that the fuel is evaporating too quickly and because of this
we end up with a large portion of fuel vapour right by the injector, not by the spark plug.
Fuel is also being lost due to going up the inlet duct. If the inlet valve is to remain open for
the duration of the combustion process then relocating the injector could help to overcome
this problem. This will be explored below.
Injector near exhaust duct
The injector was moved to the opposite side of the chamber near the exhaust duct. Spray was
aimed towards the spark plug. A new type of injection, single injector was setup. Thus
required setting a new location of the injector and initial droplet size. The chemical
composition of fuel and mass flowrate reamined the same.

25 Larissa Taylor Nuffield Project Summer 2013
Figure 23 Initial velocities of droplets for single injector positioned by the exhaust duct
This test unfortunately diverged so instead a group injection of 10 injectors was tested,
without breakup activated. The mass flow rate (MFR) was decreased to 10% of the original
for each injector to provide the same overall mass injected. Thus, each injector had a MFR of
0.0007642 kg/s.
Figure 24 Initial velocities of droplets for group injectors positioned by the exhaust duct
New position of injector

26 Larissa Taylor Nuffield Project Summer 2013
Figure 25 Velocity magnitude contours for in-cylinder flow for group injectors positioned by
the exhaust duct; no-break up model for spray
The results from the group injector (no breakup) show that the fuel vapour overshoots the
spark plug and ends up going into the inlet duct. The point at which the fuel vapour is fastest
is already past the optimum position near the spark plug for successful combustion. Thus
indicates that the gas cloud of fuel will continue to travel further and end up quite far away
from the spark plug. The Fig 25 shows the fastest point to be quite near the inlet duct. From
this point the fuel vapour could either continue to the other side of the chamber or go up the
inlet valve like before. Neither of these options is good as both positions will be too far from
the spark plug. Next Figure shows that the vapour does in fact go up the inlet valve again.

27 Larissa Taylor Nuffield Project Summer 2013
Figure 26 Mass fraction of octane at 1.6ms for the group injectors positioned by the exhaust
duct; no-break up spray model
All the fuel vapour is accumulated near the inlet valve. This causes the same problem as
before; not enough fuel vapour by the spark plug and it will mean that there won’t be a
successful combustion.
Figure 27 Mass fraction of octane at 0.5ms for the group injectors by the exhaust duct for
WAVE break up model
For Wave breakup model, the results for the first steps after fuel injection have shown that
the fuel evaporated far too quickly (Fig. 27). Though vapour was not lost to the inlet valve it
was still too far away from the spark plug. Another location of the injector was to be tested to
try to solve this problem.
28 Larissa Taylor Nuffield Project Summer 2013
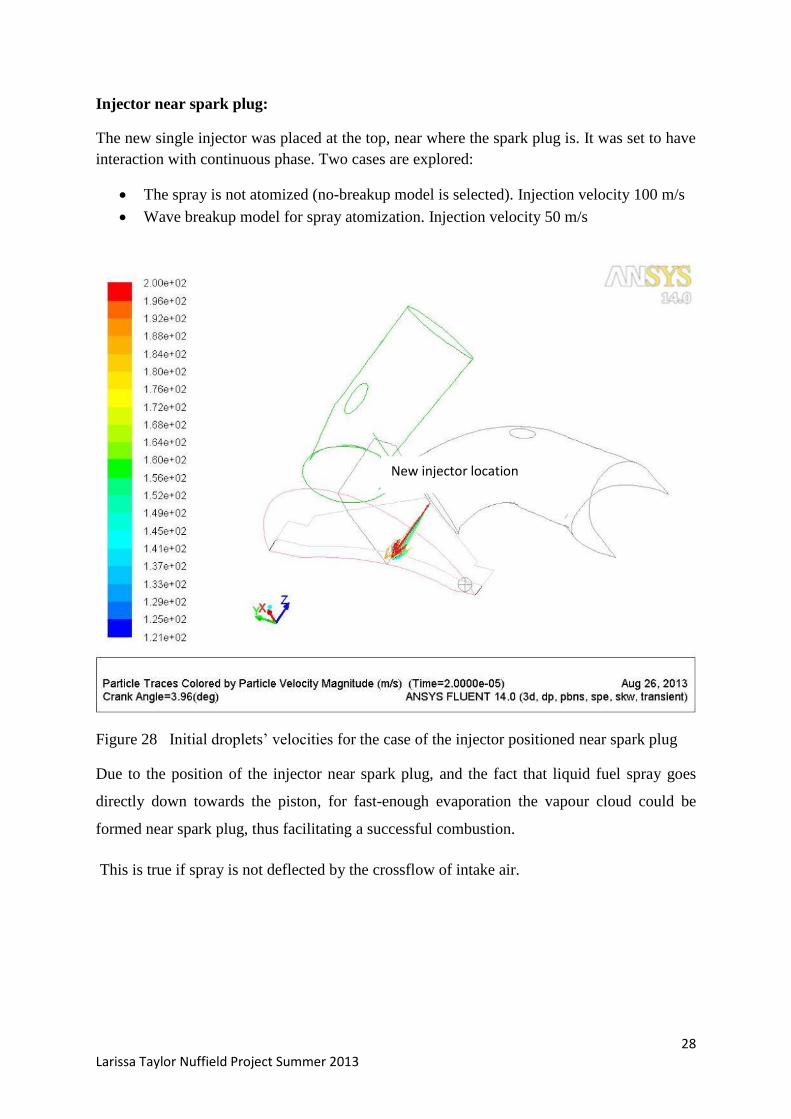
Injector near spark plug:
The new single injector was placed at the top, near where the spark plug is. It was set to have
interaction with continuous phase. Two cases are explored:
The spray is not atomized (no-breakup model is selected). Injection velocity 100 m/s
Wave breakup model for spray atomization. Injection velocity 50 m/s
Figure 28 Initial droplets’ velocities for the case of the injector positioned near spark plug
Due to the position of the injector near spark plug, and the fact that liquid fuel spray goes
directly down towards the piston, for fast-enough evaporation the vapour cloud could be
formed near spark plug, thus facilitating a successful combustion.
This is true if spray is not deflected by the crossflow of intake air.
New injector location

29 Larissa Taylor Nuffield Project Summer 2013
Figure 29 Mass fraction of octane vapour for no-breakup model. The injector is near spark plug
For no-breakup option, the vapour cloud overshoots and is formed on the surface of the
piston. This is clearly undesirable as fuel film on the piston does not evaporate quickly and it
is still far from the spark plug.
Figure 30. Mass fraction of octane vapour for Wave breakup model. The injector is near spark plug
For Wave breakup, the fuel evaporates quickly and thus ends up around the spark plug due to
the position of the injector. This is the optimum place for the vapour cloud to be and hence
this is the best place to position the injector. It shall be observed though that the fuel cloud is
significantly deflected towards the wall by the inlet air flow

30 Larissa Taylor Nuffield Project Summer 2013
6. Discussion
For the injectors near the inlet valve and near the exhaust duct, all models showed that whilst
the injector was directed towards the spark plug, the flow pattern was not appropriate to
create a fuel vapour cloud under the spark plug. Fuel vapour either remains mostly around the
injector or is lost up the inlet valve. To overcome this loss of fuel, a solution could be to keep
the inlet valve closed during fuel injection, ensuring that all the fuel remains in the chamber.
Some fuel might be lost due to impinging on a cylinder wall and piston.
The injector near the spark plug was directed towards the piston. The no-break up model
shows that the spray overshoots impinging on the piston, and the vapour cloud was too far
from the spark plug.
Wave breakup models gave the desired outcome for the case under consideration; the fuel
evaporated almost immediately and so the vapour cloud was adjacent to the spark plug,
though it was deflected to the wall of the cylinder head by strong crossflow of inlet air.
The injector near the spark plug with Wave breakup model was losing fuel to the inlet duct
after 1.8ms. This shows the complexity of the interaction between fuel spray and air jet.
Guiding the flow so that the fuel vapour ends up under the spark plug could help solve this
problem and give a successful combustion. Methods on how to guide the flow should be
further investigated.
Dissemination of knowledge and recommendations for further research
CEREEV workshop
I gave a presentation of my findings to the CEREEV group on 12th
September 2013 at the
University Brighton (CEREEV, 2012). The title of the workshop was: CEREEV Researcher
exchange, technical workshop and project review (Appendix 1). The minutes of the meeting
relevant to this project, read: ‘CFD: Simulations by E. Sazhina, O. Rybdylova and L. Taylor
showed that high-pressure intake conditions produced choked sonic flows conditions in the
poppet valve inner seat area. Tests were carried out with three spray options: no breakup
model, TAB and WAVE breakup. Comparisons of spray velocity and fuel mass distributions
in the cylinder were made between three injector locations; central, inlet and exhaust. The
central position was considered the preferred solution however further work will need to be
undertaken to investigate the pressure waves generated across the chamber.’

31 Larissa Taylor Nuffield Project Summer 2013
From the feedback I received, I got some insight into the direction of further research for the
split-cycle engine. The meeting gave much motivation; it was great to meet the people my
project had actually been helping, and talking with the team was a real joy.
Contribution to the E3C3 EU INTERREG project
The study of evaporation process of multicomponent droplets is relevant for the EU
INTERREG E3C3 project (E3C3, 2013). One of the tasks set in the E3C3 project focuses on
evaporation of biofuels containing many hydrocarbon components. Hence the investigation
of heating and evaporation of multicomponent fuel droplets is relevant for feasibility studies
of CFD capabilities in this area.
The rate of evaporation as predicted by ANSYS FLUENT, is monitored for both C7H16 and
C8H18 components. It is observed that, as expected, at the initial stage n-heptane evaporates
faster than iso-octane. This can be seen from Fig. 31 showing the transient behaviour of
octane concentration in fuel vapour (on mass basis). In other words, the plot shows the ratio
of mass fraction of octane vapour, to the mass fraction of fuel vapour. It is less than the value
of 0.95 until 0.5ms. This demonstrates faster evaporation rate of n-heptane, as it can be
expected based on physical properties.
Figure 31. Ratio of octane vapour to fuel vapour by mass, for the spark-plug location of the
injector with injection velocity of 50 m/s; Wave spray breakup model.
7.50E-01
8.00E-01
8.50E-01
9.00E-01
9.50E-01
1.00E+00
0 0.2 0.4 0.6 0.8 1
Ratio of octane in fuel vapour by mass
32 Larissa Taylor Nuffield Project Summer 2013
The results of the CFD simulations are used as a feasibility studies for multicomponent spray
modelling under the E3C3 EU INTERREG research. The newly developed CFD spray
models will take into account temperature gradients and species diffusion inside a
multicomponent droplet. Whilst current project lays foundation for CFD implementation of
the newly developed spray models at SHRL, further research on validation of the CFD results
against available experimental data is needed.
Conclusions
The project focused on modelling of spray injection and fuel evaporation for studies of
mixture preparation in a split-cycle engine. The modelling has been performed by numerical
simulation using CFD code ANSYS FLUENT. The fuel droplets were set as multicomponent
liquid, 95% of iso-octane C8H18 and 5% of n-heptane C7H16 by mass.
Fuel spray evaporation and vapour mixing with air is calculated by the CFD code, and it can
be monitored by post-processing of the results. CFD runs for three injector locations and
various spray atomization options: No-Breakup, Wave and TAB breakup models, have been
performed for realistic engine conditions. This has a direct relevance to EU INTERREG
CEREEV project (CEREEV, 2012).
The study of evaporation process of multicomponent droplets is relevant for the EU
INTERREG E3C3 project (E3C3, 2013). One of the tasks set under the E3C3 project, focuses
on biofuels containing many hydrocarbon components. Hence the investigation of heating
and evaporation of multicomponent fuel droplets is relevant for feasibility studies of CFD
capabilities in this area. The rate of evaporation as predicted by ANSYS FLUENT, is
monitored for both C7H16 and C8H18 components.
From my work and all the results I got, my conclusion would be that further research is
needed to explore realistic flow patterns and injection strategies. Evaporation process for
multicomponent droplets must be further explored. Engine data obtained by experimental
methods shall be compared with CFD predictions. As a summary of current project, at this
stage of development the recommended position for the injector would be by the spark plug.

33 Larissa Taylor Nuffield Project Summer 2013
References
ANSYS (2013) Theory Guide,
http://www.ansys.com/Products/Simulation+Technology/Fluid+Dynamics/Fluid+Dynamics+
Products/ANSYS+Fluent as seen on 01/08/2013.
Automotive Engineering (2013) Modelling of droplet and spray dynamics, heating and
evaporation, Research Workshop, Centre for Automotive Engineering, Watts Bldg,
University of Brighton, 16th
August 2013 .
CEEREV (2012) http://www.interreg4a-
manche.eu/index.php?option=com_sobi2&sobi2Task=sobi2Details&catid=3&sobi2Id=3110
&Itemid=&lang=en
E3C3 (2013), Energy Efficiency and Environment: a Cross-Channel Cluster
http://www.brighton.ac.uk/shrl/projects/E3C3/
Engine (2013) Definition of engine, http://en.wikipedia.org/wiki/Engine as seen on
01/08/2013.
FLUENT (2013) http://willem.engen.nl/uni/fluent/documents/external/fluent-overview.ppt
as seen on August 2013.
Gent (2007) Gent, D. and Ritchie, R. OCR AS Chemistry, Heinemann, Essex UK , 2007
How Stuff Works (2013) http://science.howstuffworks.com/transport/engines-
equipment/two-stroke1.htm as seen on August 2013
Nuffield (2013) http://www.nuffieldfoundation.org/nuffield-research-placements#1
Research Student Conference (2013) Science Accessible, Huxley Building, The Faculty of
Science and Engineering Doctoral College, The University of Brighton, July 8 - 9 2013
Heywood (1988) Heywood, J.B., Internal Combustion Engine Fundamentals, McGraw-Hill
Book Company, Singapore, 1988.

34 Larissa Taylor Nuffield Project Summer 2013
ICE (2013) Internal Combustion Engine,
http://authors.library.caltech.edu/25069/6/AirPollution88-Ch4.pdf as seen on August 2013.
Meldolesi (2012), Meldolesi, R., and Badain,N. 2012, Scuderi Split Cycle Engine: Air Hybrid
Vehicle, SAE 2012-01-1013, doi: 10.4271/2012-01-1013
2-ACE (2012), A fundamental study of the novel poppet valve 2-stroke auto ignition
combustion engine (2-ACE), http://www.brighton.ac.uk/shrl/projects/2-ace.php and
http://gow.epsrc.ac.uk/ViewGrant.aspx?GrantRef= EP/F058276/1 seen on 12/07/2013
Scuderi (2013) SCUDERI™ Group, Inc http://www.scuderigroup.com/technology/ as seen
in August 2013.
Philips et al (2013), Phillips, F., Gilbert, I., Pirault, J., and Megel, M., Scuderi
Split Cycle Research Engine: Overview, Architecture and Operation,
SAE Int. J. Engines 4(1):450-466, 2011, doi:10.4271/2011-01-0403.
SHRL (2013) http://www.brighton.ac.uk/shrl/ seen on 01/07/2013
Turner (2012), M. R., Sazhin, S.S., Healey, J.J., Crua, C. and Martynov, S.B. A breakup
model for transient Diesel fuel sprays Fuel, 97 , pp. 288-305. ISSN 0016-2361
Vetronics (2013), http://www.brighton.ac.uk/cem/research/groups/vetronics.php) as seen in
August 2013.
35 Larissa Taylor Nuffield Project Summer 2013
Appendix 1:
Attendance of research workshops and laboratory tours
Sir Harry Ricardo Laboratories
July 2013, Dr Steve Begg
http://www.brighton.ac.uk/shrl/
‘The University of Brighton and Ricardo UK jointly opened the Sir Harry Ricardo
Laboratories on 14 November 2006.
The SHRL are one of the largest UK research teams dedicated to internal combustion
engines, the development of laser-based measurement techniques, fundamental modelling
and computational simulation. It is regarded as one of the foremost centres for automotive
engine research in Europe. The group's international esteem is demonstrated by its breadth of
collaboration with over 40 academic institutions and industrial partners across the world.’
Tour of Vetronics laboratories
July 2013, Professor E. Stipidis and Dr Panagiotis Oikonomidis
http://www.brighton.ac.uk/cem/research/groups/vetronics.php as seen on 12/09/2013
‘The Vetronics Research Centre (VRC) is the only Academic Centre of Excellence in the
UK conducting research and training in the subject area of Vetronics (Vehicle Electronics),
sponsored by the UK Ministry of Defence (MOD) and supported by Defence Science
Technology Laboratory (DSTL) and Defence Equipment and Support (DE&S).
We focus on specialised and targeted research to investigate new technologies and
methodologies that can be applied in the immediate and near future. Almost all of our
research programmes include a functional demonstrator deliverable that can give a practical
hands-on experience of the output. These systems are designed in a modular fashion to make
them re-usable for an extension of the programme or even in other related applications,
allowing us to keep re-development costs down and have access to an ever increasing set of
testing environments.’
36 Larissa Taylor Nuffield Project Summer 2013
SHRL Research workshop, 16 August 2013:
Modelling of droplet and spray dynamics, heating and evaporation
Centre for Automotive Engineering
Research Workshop
Friday, 16th
August, 2013
Room W623, Watts Building, University of Brighton
Modelling of droplet and spray dynamics, heating and evaporation
14.00: Dr Natalia Lebedeva and Prof Alexander Osiptsov
Application of the full Lagrangian and viscous-vortex methods to modelling of impulse two-phase jets
14.45: Dr Oyuna Rybdylova
Numerical modelling of two-phase vortex ring flow
15.10 Prof Vlad Gun’ko
Quantum chemical approach to study evaporation of Diesel fuel droplets
15.55: Dr Rasoul Nasiri
Quantum chemical studies on n-alkane droplets
16.15: Mansour al Qubeissi
Biodiesel fuel droplets: modelling of heating and evaporation processes

37 Larissa Taylor Nuffield Project Summer 2013
CEREEV Researcher exchange, technical workshop and project
review
12 September 2013
i) Minutes
ii) The presentation by the author
Recommended