Embed Size (px)
Citation preview

The investigation of the mixture formation upon fuel injection into high-temperature gas lows 121
The investigation of the mixture formation upon fuel injection into high-temperature gas lows
Anna Maiorova, Aleksandr Sviridenkov and Valentin Tretyakov
X
The investigation of the mixture formation upon fuel injection into high-temperature gas flows
Anna Maiorova, Aleksandr Sviridenkov and Valentin Tretyakov
Central Institute of Aviation Motors named after P.I. Baranov Russia
1. Introduction
Combustion of a fuel in the combustion chambers of a gas-turbine engine and a gas-turbine plant is closely connected with the processes of mixing (Lefebvre, 1985). Investigations of these processes carried out by both experimental and computational methods have recently become especially crucial because of the necessity of solving ecological problems. One of the most pressing problems at present is account for the influence of droplets on an air flow. In some of the regimes of chamber operation this may lead to a substantial, almost twofold, change in the long range of a fuel spray and, consequently, to corresponding changes in the distributions of the concentrations of fuel phases. In this chapter physical models of the processes of interphase heat and mass transfer and computational techniques based on them are suggested. The present work is a continuation of research by Maiorova & Tretyakov, 2008. We set out to calculate the fields of air velocity and temperature as well as of the distribution of a liquid fuel in module combustion chambers with account for the processes of heating and evaporation of droplets in those regimes typical of combustion chambers in which there is a substantial interphase exchange. It is clear that when a "cold" fuel is supplied into a "hot" air flow, the droplets are heated and the air surrounding them is cooled. It is evident that at small flow rates of the fuel this cooling can be neglected. The aim of this work is to answer two questions: how much the air flow is cooled by fuel in the range of parameters typical of real combustion chambers, and how far the region of flow cooling extends. Moreover, the dependence of the flow characteristics on the means of fuel spraying (pressure atomizer, jetty or pneumatic) and also on the spraying air temperature is investigated.
2. Statement of the Problem
Schemes of calculated areas are presented on fig. 1. Calculations were carried out for the velocity and temperature of the main air flow U0 = 20 m s and T0 = 900 K, fuel velocity Vf = 8 m/s, fuel temperature Tf = 300 K. The gas pressure at the channel inlet was equal to 100 kPa. The first model selected for investigation (fig. 1-a) is a straight channel of rectangular cross section 150 mm long into which air is supplied at a velocity U0 and temperature T0. It was
7
www.intechopen.com

Fuel Injection122
assumed that the stalling air flow at the inlet had a developed turbulent profile and that the spraying air had a uniform profile. Injection of a fuel with a temperature Tf into the channel at a velocity Vf is made through a hole in the upper wall of the channel with the aid of an injector installed along the normal to the longitudinal axis of the channel halfway between the side walls. In modeling the pneumatic injector it is considered that, coaxially with the fuel supply, the spraying air is fed at a velocity U1 and temperature T1 into the channel through a rectangular hole of size 4.5 ×3.75 mm. In modeling a jetty injector, we assume that the spraying air is absent.
(a)
(b) Fig. 1. Schemes of calculated areas
U1, T1, 1,
Vf
U0, T0
0
R1
R0
The variable parameters of the calculation were the velocity and temperature of the spraying air: U1 = 0–20 ms and T1 = 300–900 K, as well as the summed coefficient of air excess through the module α = 1.35–5.4. The values of the regime parameters are presented in Table 1. Regime 1 corresponds to jet spraying of a fuel, regime 2 — to pneumatic spraying of a fuel by a cold air jet; and regime 3 — to pneumatic spraying by a hot air jet in the limiting case of equality between the temperatures of the spraying air and main flow.
Variant α Regime 1 Regime 2 Regime 3
U1, m/s U1, m/s T1, K U1, m/s T1, K
1 5.4 0 20 300 20 900
2 2.7 0 20 300 20 900
3 1.35 0 20 300 20 900
Table 1. Operating Parameters for the flow in a straight channel. The second model (fig. 1-b) is the flow behind two coaxial tubes in radius of 5 and 40 mm, tube length is 240 mm. Heat-mass transfer of drop-forming fuel with the co-swirling two-phase turbulent gas flows is calculated. In this case injection of a fuel is made through a pressure or pneumatic atomizer along the longitudinal axis. Regime parameters corresponds regimes 2 and 3 from table 1 and α = 3.3. Inlet conditions were constant axial velocity, turbulent intensity and length. Axial swirlers are set in inlet sections. The tangential velocity set constant in the outer channel. The flow in the central tube exit section corresponded to solid body rotation law. The wane angles in inner and outer channels (1
and 0) varied from 0 to 65.
3. Calculation Technique
Calculations of the flow of a gas phase are based on numerical integration of the full system of stationary Reynolds equations and total enthalpy conservation equations written in Euler variables. The technique of allowing for the influence of droplets on a gas flow is based on the assumption that such an allowance can be made by introducing additional summands into the source terms of the mass, momentum, and energy conservation equations. The transfer equations were written in the following conservative form:
div�ρ�U����� � �����d�� � S� � S���� (1)
Here S���� is the interphase source term that describes the influence of droplets on the corresponding characteristics of flow. The density and pressure are ensemble-averaged (according to Reynolds) and all the remaining dependent variables — according to Favre, i.e., with the use of density as a weight coefficient. Written in the form of Eq. (1), the system of equations of continuity ( 1, Γ 0, S 0), motion (= Ugi, i = 1, 2, 3), and of total enthalpy conservation h (Sh 0) is solved by the Simple finite-difference iteration method (Patankar, 1980). The walls were considered
www.intechopen.com

The investigation of the mixture formation upon fuel injection into high-temperature gas lows 123
assumed that the stalling air flow at the inlet had a developed turbulent profile and that the spraying air had a uniform profile. Injection of a fuel with a temperature Tf into the channel at a velocity Vf is made through a hole in the upper wall of the channel with the aid of an injector installed along the normal to the longitudinal axis of the channel halfway between the side walls. In modeling the pneumatic injector it is considered that, coaxially with the fuel supply, the spraying air is fed at a velocity U1 and temperature T1 into the channel through a rectangular hole of size 4.5 ×3.75 mm. In modeling a jetty injector, we assume that the spraying air is absent.
(a)
(b) Fig. 1. Schemes of calculated areas
U1, T1, 1,
Vf
U0, T0
0
R1
R0
The variable parameters of the calculation were the velocity and temperature of the spraying air: U1 = 0–20 ms and T1 = 300–900 K, as well as the summed coefficient of air excess through the module α = 1.35–5.4. The values of the regime parameters are presented in Table 1. Regime 1 corresponds to jet spraying of a fuel, regime 2 — to pneumatic spraying of a fuel by a cold air jet; and regime 3 — to pneumatic spraying by a hot air jet in the limiting case of equality between the temperatures of the spraying air and main flow.
Variant α Regime 1 Regime 2 Regime 3
U1, m/s U1, m/s T1, K U1, m/s T1, K
1 5.4 0 20 300 20 900
2 2.7 0 20 300 20 900
3 1.35 0 20 300 20 900
Table 1. Operating Parameters for the flow in a straight channel. The second model (fig. 1-b) is the flow behind two coaxial tubes in radius of 5 and 40 mm, tube length is 240 mm. Heat-mass transfer of drop-forming fuel with the co-swirling two-phase turbulent gas flows is calculated. In this case injection of a fuel is made through a pressure or pneumatic atomizer along the longitudinal axis. Regime parameters corresponds regimes 2 and 3 from table 1 and α = 3.3. Inlet conditions were constant axial velocity, turbulent intensity and length. Axial swirlers are set in inlet sections. The tangential velocity set constant in the outer channel. The flow in the central tube exit section corresponded to solid body rotation law. The wane angles in inner and outer channels (1
and 0) varied from 0 to 65.
3. Calculation Technique
Calculations of the flow of a gas phase are based on numerical integration of the full system of stationary Reynolds equations and total enthalpy conservation equations written in Euler variables. The technique of allowing for the influence of droplets on a gas flow is based on the assumption that such an allowance can be made by introducing additional summands into the source terms of the mass, momentum, and energy conservation equations. The transfer equations were written in the following conservative form:
div�ρ�U����� � �����d�� � S� � S���� (1)
Here S���� is the interphase source term that describes the influence of droplets on the corresponding characteristics of flow. The density and pressure are ensemble-averaged (according to Reynolds) and all the remaining dependent variables — according to Favre, i.e., with the use of density as a weight coefficient. Written in the form of Eq. (1), the system of equations of continuity ( 1, Γ 0, S 0), motion (= Ugi, i = 1, 2, 3), and of total enthalpy conservation h (Sh 0) is solved by the Simple finite-difference iteration method (Patankar, 1980). The walls were considered
www.intechopen.com
Fuel Injection124
thermally insulated. To find the coefficients of turbulent diffusion, use is made of the Boussinesq hypothesis on the linear dependence of the components of the tensor of turbulent stresses on the components of the tensor of deformation rates of average motion and two equations of transfer of turbulence characteristics (k–ε) in the modification that takes into account the influence of flow turbulence Reynolds numbers on the turbulent characteristics of flow (Chien, 1982). Here, the boundary conditions of zero velocity are imposed on the solid walls. For swirl flows calculations the model was modernized to take into account the swirl effect in turbulence structure (Koosinlin at al., 1974). In the absence of chemical reactions the gas mixture is considered to consist of two components: kerosene vapors (with a molecular weight of 0.168 kg mole) and air (with a conventional molecular weight of 0.029 kg mole). For the mass fraction of kerosene vapors mf the equation of transfer of the type (1) is solved, and the mass fraction of air is determined from the condition under which the sums of the mass fractions of all the components are equal to unity. The calculations of the distribution of fuel are based on the solution of a system of equations of motion, heating, and evaporation of individual droplets written in the Lagrange variables. The influence of turbulent pulsations onto the motion of droplets and on the change in their shape in the process of their motion is considered to be negligibly small. Then the equations that describe the processes of motion, heating, and evaporation have the following form: m� dV����dt � R��� (2) d��dt � �λ��1 � ���R���� P����� �� � ��ρ�D���� (3) dD�dt � 8λ�2Dρ���� �n �1 � ���L ��� � ��� �1 � ��23R����� (4)
We consider that the law of the resistance of droplets is the same as that of the resistance of solid spherical particles of diameter Dd
R��� =0.5CRSρgWW���� , CR = 24Re−1 + 4.4Re−0.5 +0.32 , S = Dd2 4 (5)
In modeling a fuel spray it was assumed that it had a polydisperse structure with the size distribution of droplets obeying the Rosin–Rammler law (Dityakin at al., 1977) with exponent 3 and mean-median diameter 50 µm. The range of the sizes of droplets was divided into 14 intervals. The angle distribution of droplets was taken to be uniform, and the working fuel was TS-1 kerosene. The interphase source terms are calculated together with the distribution of the liquid fuel from the conditions of the fulfillment of the laws of conservation of momentum, mass, and heat of the gas–droplet system. It is considered that the corresponding terms in the equations for the turbulence characteristics can be neglected. Since physically the source term S���� in the continuity equation, just as the source term in the equation of transfer of mf, S�����, is the increase in the concentration of the fuel vapor per unit time equal to the rate of liquid evaporation, then
S���� � S����� � �� v = � �C��� (6) where �� v is the rate of change of Cv due to the interphase exchange. The interphase source terms in the equations of conservation of momentum components are the components of the vector of the rate of change in the gas momentum due to the exchange with droplets in a unit volume S������. These quantities are determined from the equation of conservation of momentum for the gas–droplet system:
∆(mdV���d)+∆(mgU���g)= 0 (7) where mg is the mass of the isolated element of the gas volume ∆v. Here and below, it is assumed that the volume of fuel droplets is negligibly small as compared to the volume occupied by the gas. Assuming ∆td (the residence time of a droplet in the volume element ∆v) to be small enough, we may replace the second term in (7) by S������∆v∆td. This gives us an approximate expression to determine S�������: S��������� � � ∆���U�����∆�∆���� � � ����∆� ∆V������∆���� � V������ ∆C���∆���� (8)
where ∆Vd is a change in the droplet velocity during its residence in the elementary volume, i means individual droplet. The last term in relation (8) describes the gas momentum increment at the expense of the vapor fuel phase momentum related to the elementary volume ∆v and the time of droplet evaporation in this volume, since ∆Cv = −∆Cf. It is assumed that the fuel vapor and air in the volume ∆v mix instantaneously. When ∆v → 0, ∆td →0, we obtain an exact expression for S�������in a differential form: S��������� � � ���� �V�������� � V������ �C����� (9)
Here Cf,i denotes a fraction of the ith droplet in the volumetric concentration of liquid. The summed value of the rate of change in the momentum of a unit volume of gas is equal to S������� � � S���������� (10)
where summation is carried out over all the droplets. The interphase source term in the transfer equation of the variable Uφr, S��� is determined from the equation of conservation of angular momentum for the gas–droplet system. This team has the folowing form: S��� � �� ����� �V������ � V���� �C����� � (11)
www.intechopen.com
The investigation of the mixture formation upon fuel injection into high-temperature gas lows 125
thermally insulated. To find the coefficients of turbulent diffusion, use is made of the Boussinesq hypothesis on the linear dependence of the components of the tensor of turbulent stresses on the components of the tensor of deformation rates of average motion and two equations of transfer of turbulence characteristics (k–ε) in the modification that takes into account the influence of flow turbulence Reynolds numbers on the turbulent characteristics of flow (Chien, 1982). Here, the boundary conditions of zero velocity are imposed on the solid walls. For swirl flows calculations the model was modernized to take into account the swirl effect in turbulence structure (Koosinlin at al., 1974). In the absence of chemical reactions the gas mixture is considered to consist of two components: kerosene vapors (with a molecular weight of 0.168 kg mole) and air (with a conventional molecular weight of 0.029 kg mole). For the mass fraction of kerosene vapors mf the equation of transfer of the type (1) is solved, and the mass fraction of air is determined from the condition under which the sums of the mass fractions of all the components are equal to unity. The calculations of the distribution of fuel are based on the solution of a system of equations of motion, heating, and evaporation of individual droplets written in the Lagrange variables. The influence of turbulent pulsations onto the motion of droplets and on the change in their shape in the process of their motion is considered to be negligibly small. Then the equations that describe the processes of motion, heating, and evaporation have the following form: m� dV����dt � R��� (2) d��dt � �λ��1 � ���R���� P����� �� � ��ρ�D���� (3) dD�dt � 8λ�2Dρ���� �n �1 � ���L ��� � ��� �1 � ��23R����� (4)
We consider that the law of the resistance of droplets is the same as that of the resistance of solid spherical particles of diameter Dd
R��� =0.5CRSρgWW���� , CR = 24Re−1 + 4.4Re−0.5 +0.32 , S = Dd2 4 (5)
In modeling a fuel spray it was assumed that it had a polydisperse structure with the size distribution of droplets obeying the Rosin–Rammler law (Dityakin at al., 1977) with exponent 3 and mean-median diameter 50 µm. The range of the sizes of droplets was divided into 14 intervals. The angle distribution of droplets was taken to be uniform, and the working fuel was TS-1 kerosene. The interphase source terms are calculated together with the distribution of the liquid fuel from the conditions of the fulfillment of the laws of conservation of momentum, mass, and heat of the gas–droplet system. It is considered that the corresponding terms in the equations for the turbulence characteristics can be neglected. Since physically the source term S���� in the continuity equation, just as the source term in the equation of transfer of mf, S�����, is the increase in the concentration of the fuel vapor per unit time equal to the rate of liquid evaporation, then
S���� � S����� � �� v = � �C��� (6) where �� v is the rate of change of Cv due to the interphase exchange. The interphase source terms in the equations of conservation of momentum components are the components of the vector of the rate of change in the gas momentum due to the exchange with droplets in a unit volume S������. These quantities are determined from the equation of conservation of momentum for the gas–droplet system:
∆(mdV���d)+∆(mgU���g)= 0 (7) where mg is the mass of the isolated element of the gas volume ∆v. Here and below, it is assumed that the volume of fuel droplets is negligibly small as compared to the volume occupied by the gas. Assuming ∆td (the residence time of a droplet in the volume element ∆v) to be small enough, we may replace the second term in (7) by S������∆v∆td. This gives us an approximate expression to determine S�������: S��������� � � ∆���U�����∆�∆���� � � ����∆� ∆V������∆���� � V������ ∆C���∆���� (8)
where ∆Vd is a change in the droplet velocity during its residence in the elementary volume, i means individual droplet. The last term in relation (8) describes the gas momentum increment at the expense of the vapor fuel phase momentum related to the elementary volume ∆v and the time of droplet evaporation in this volume, since ∆Cv = −∆Cf. It is assumed that the fuel vapor and air in the volume ∆v mix instantaneously. When ∆v → 0, ∆td →0, we obtain an exact expression for S�������in a differential form: S��������� � � ���� �V�������� � V������ �C����� (9)
Here Cf,i denotes a fraction of the ith droplet in the volumetric concentration of liquid. The summed value of the rate of change in the momentum of a unit volume of gas is equal to S������� � � S���������� (10)
where summation is carried out over all the droplets. The interphase source term in the transfer equation of the variable Uφr, S��� is determined from the equation of conservation of angular momentum for the gas–droplet system. This team has the folowing form: S��� � �� ����� �V������ � V���� �C����� � (11)
www.intechopen.com
Fuel Injection126
The interphase source term in the equation for enthalpy S���� that describes heat exchange between droplets and the gas flow is determined from the equation of conservation of the total enthalpy of the gas–droplet system, which has the form
∆(m�h��+∆(m� h�)= -L∆ mg (12) The expression on the right-hand side of equality (12) determines the energy spent on the transition of the droplet liquid of mass ∆md = −∆mg into the gaseous state, and ∆hd and ∆md
are changes in the enthalpy and mass of the droplet during its residence in the volume ∆v. Assuming the time ∆td to be small enough, we replace the second term in expression (12) by S����∆v∆td. Then the approximate expression for determining S������ S������ � ∆��� ���∆�∆���� � � ∆����� �����∆�∆���� +L ∆����∆�∆���� (13) Using the definition of the enthalpy hd = cfT, we will rewrite (13) in the form S������ � L∆C���∆���� � ���� ��� ∆T���∆���� � ���� ∆����∆����� (14)
When ∆v → 0, ∆td →0, we obtain an expression for S������ in a differential form: S������ � L�C����� � ���� ��� �T����� � ���� ������� � (15) The summed value of S���� (inflow of heat from the liquid phase to the unit volume of gas) is equal to S���� � � S������� (16)
where summation is carried out over all the droplets. The values ∆V���d,i ∆td,i, ∆Td,i ∆td,i and ∆Cf,i ∆tdi or dV���d,i dt,, dTd,i dt and dCf,i dt are taken from the solution of the equation of motion and heating of an individual droplet. The technique of calculation of a two-phase flow is based on the solution of a conjugate problem of flow of the gas and liquid media and heat exchange between them. First the problem of the motion of a gas is solved without account for the influence of the motion of droplets on the flow and then, based on the velocity and temperature fields obtained, the distribution of the liquid fuel is calculated as well as the interphase source terms. At the second stage, the gasdynamic and temperature fields are recalculated with account for the interphase sources (the results of the first stage are used as the initial conditions). When needed, the process is repeated several times. The convergence criteria of the iteration process are considered to be the absence of changes in the velocity and temperature fields from iteration to iteration for the gas flow and stabilization over the iterations of the coordinate of the maximum value of the concentration of droplets at the outlet of the model within the limits of one mesh of the finite-difference grid.
4. Testing of the Calculation Technique
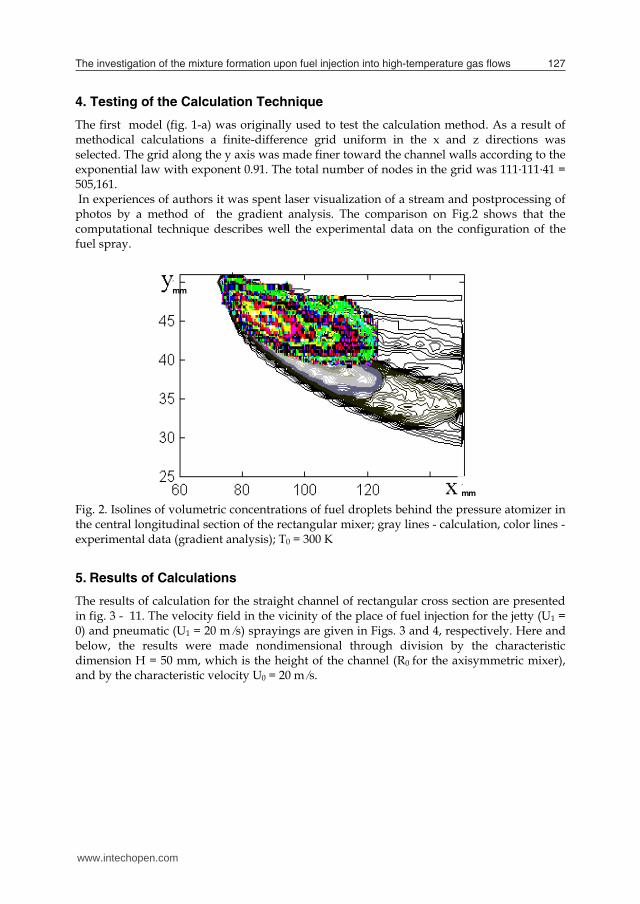
The first model (fig. 1-a) was originally used to test the calculation method. As a result of methodical calculations a finite-difference grid uniform in the x and z directions was selected. The grid along the y axis was made finer toward the channel walls according to the exponential law with exponent 0.91. The total number of nodes in the grid was 111筏111�41 = 505,161. In experiences of authors it was spent laser visualization of a stream and postprocessing of photos by a method of the gradient analysis. The comparison on Fig.2 shows that the computational technique describes well the experimental data on the configuration of the fuel spray.
Fig. 2. Isolines of volumetric concentrations of fuel droplets behind the pressure atomizer in the central longitudinal section of the rectangular mixer; gray lines - calculation, color lines - experimental data (gradient analysis); T0 = 300 K
5. Results of Calculations
The results of calculation for the straight channel of rectangular cross section are presented in fig. 3 - 11. The velocity field in the vicinity of the place of fuel injection for the jetty (U1 = 0) and pneumatic (U1 = 20 m s) sprayings are given in Figs. 3 and 4, respectively. Here and below, the results were made nondimensional through division by the characteristic dimension H = 50 mm, which is the height of the channel (R0 for the axisymmetric mixer), and by the characteristic velocity U0 = 20 m s.
,
mm
,
mm
www.intechopen.com
The investigation of the mixture formation upon fuel injection into high-temperature gas lows 127
The interphase source term in the equation for enthalpy S���� that describes heat exchange between droplets and the gas flow is determined from the equation of conservation of the total enthalpy of the gas–droplet system, which has the form
∆(m�h��+∆(m� h�)= -L∆ mg (12) The expression on the right-hand side of equality (12) determines the energy spent on the transition of the droplet liquid of mass ∆md = −∆mg into the gaseous state, and ∆hd and ∆md
are changes in the enthalpy and mass of the droplet during its residence in the volume ∆v. Assuming the time ∆td to be small enough, we replace the second term in expression (12) by S����∆v∆td. Then the approximate expression for determining S������ S������ � ∆��� ���∆�∆���� � � ∆����� �����∆�∆���� +L ∆����∆�∆���� (13) Using the definition of the enthalpy hd = cfT, we will rewrite (13) in the form S������ � L∆C���∆���� � ���� ��� ∆T���∆���� � ���� ∆����∆����� (14)
When ∆v → 0, ∆td →0, we obtain an expression for S������ in a differential form: S������ � L�C����� � ���� ��� �T����� � ���� ������� � (15) The summed value of S���� (inflow of heat from the liquid phase to the unit volume of gas) is equal to S���� � � S������� (16)
where summation is carried out over all the droplets. The values ∆V���d,i ∆td,i, ∆Td,i ∆td,i and ∆Cf,i ∆tdi or dV���d,i dt,, dTd,i dt and dCf,i dt are taken from the solution of the equation of motion and heating of an individual droplet. The technique of calculation of a two-phase flow is based on the solution of a conjugate problem of flow of the gas and liquid media and heat exchange between them. First the problem of the motion of a gas is solved without account for the influence of the motion of droplets on the flow and then, based on the velocity and temperature fields obtained, the distribution of the liquid fuel is calculated as well as the interphase source terms. At the second stage, the gasdynamic and temperature fields are recalculated with account for the interphase sources (the results of the first stage are used as the initial conditions). When needed, the process is repeated several times. The convergence criteria of the iteration process are considered to be the absence of changes in the velocity and temperature fields from iteration to iteration for the gas flow and stabilization over the iterations of the coordinate of the maximum value of the concentration of droplets at the outlet of the model within the limits of one mesh of the finite-difference grid.
4. Testing of the Calculation Technique
The first model (fig. 1-a) was originally used to test the calculation method. As a result of methodical calculations a finite-difference grid uniform in the x and z directions was selected. The grid along the y axis was made finer toward the channel walls according to the exponential law with exponent 0.91. The total number of nodes in the grid was 111筏111�41 = 505,161. In experiences of authors it was spent laser visualization of a stream and postprocessing of photos by a method of the gradient analysis. The comparison on Fig.2 shows that the computational technique describes well the experimental data on the configuration of the fuel spray.
Fig. 2. Isolines of volumetric concentrations of fuel droplets behind the pressure atomizer in the central longitudinal section of the rectangular mixer; gray lines - calculation, color lines - experimental data (gradient analysis); T0 = 300 K
5. Results of Calculations
The results of calculation for the straight channel of rectangular cross section are presented in fig. 3 - 11. The velocity field in the vicinity of the place of fuel injection for the jetty (U1 = 0) and pneumatic (U1 = 20 m s) sprayings are given in Figs. 3 and 4, respectively. Here and below, the results were made nondimensional through division by the characteristic dimension H = 50 mm, which is the height of the channel (R0 for the axisymmetric mixer), and by the characteristic velocity U0 = 20 m s.
,
mm
,
mm
www.intechopen.com
Fuel Injection128
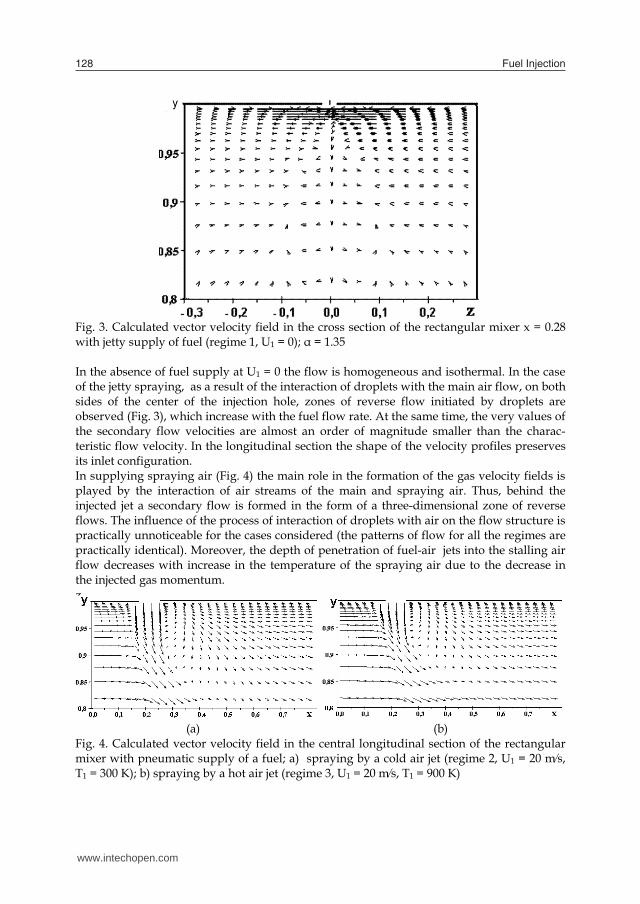
Fig. 3. Calculated vector velocity field in the cross section of the rectangular mixer x = 0.28 with jetty supply of fuel (regime 1, U1 = 0); α = 1.35 In the absence of fuel supply at U1 = 0 the flow is homogeneous and isothermal. In the case of the jetty spraying, as a result of the interaction of droplets with the main air flow, on both sides of the center of the injection hole, zones of reverse flow initiated by droplets are observed (Fig. 3), which increase with the fuel flow rate. At the same time, the very values of the secondary flow velocities are almost an order of magnitude smaller than the charac-teristic flow velocity. In the longitudinal section the shape of the velocity profiles preserves its inlet configuration. In supplying spraying air (Fig. 4) the main role in the formation of the gas velocity fields is played by the interaction of air streams of the main and spraying air. Thus, behind the injected jet a secondary flow is formed in the form of a three-dimensional zone of reverse flows. The influence of the process of interaction of droplets with air on the flow structure is practically unnoticeable for the cases considered (the patterns of flow for all the regimes are practically identical). Moreover, the depth of penetration of fuel-air jets into the stalling air flow decreases with increase in the temperature of the spraying air due to the decrease in the injected gas momentum. z (a) (b) Fig. 4. Calculated vector velocity field in the central longitudinal section of the rectangular mixer with pneumatic supply of a fuel; a) spraying by a cold air jet (regime 2, U1 = 20 ms, T1 = 300 K); b) spraying by a hot air jet (regime 3, U1 = 20 ms, T1 = 900 K)
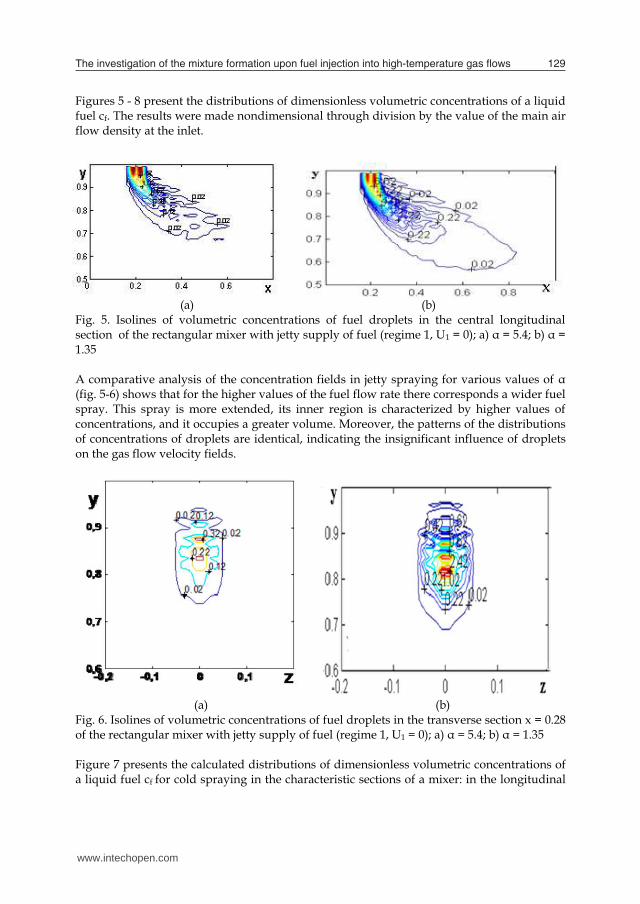
Figures 5 - 8 present the distributions of dimensionless volumetric concentrations of a liquid fuel cf. The results were made nondimensional through division by the value of the main air flow density at the inlet.
(a) (b) Fig. 5. Isolines of volumetric concentrations of fuel droplets in the central longitudinal section of the rectangular mixer with jetty supply of fuel (regime 1, U1 = 0); a) α = 5.4; b) α = 1.35 A comparative analysis of the concentration fields in jetty spraying for various values of α (fig. 5-6) shows that for the higher values of the fuel flow rate there corresponds a wider fuel spray. This spray is more extended, its inner region is characterized by higher values of concentrations, and it occupies a greater volume. Moreover, the patterns of the distributions of concentrations of droplets are identical, indicating the insignificant influence of droplets on the gas flow velocity fields.
(a) (b)
Fig. 6. Isolines of volumetric concentrations of fuel droplets in the transverse section x = 0.28 of the rectangular mixer with jetty supply of fuel (regime 1, U1 = 0); a) α = 5.4; b) α = 1.35 Figure 7 presents the calculated distributions of dimensionless volumetric concentrations of a liquid fuel cf for cold spraying in the characteristic sections of a mixer: in the longitudinal
www.intechopen.com
The investigation of the mixture formation upon fuel injection into high-temperature gas lows 129
Fig. 3. Calculated vector velocity field in the cross section of the rectangular mixer x = 0.28 with jetty supply of fuel (regime 1, U1 = 0); α = 1.35 In the absence of fuel supply at U1 = 0 the flow is homogeneous and isothermal. In the case of the jetty spraying, as a result of the interaction of droplets with the main air flow, on both sides of the center of the injection hole, zones of reverse flow initiated by droplets are observed (Fig. 3), which increase with the fuel flow rate. At the same time, the very values of the secondary flow velocities are almost an order of magnitude smaller than the charac-teristic flow velocity. In the longitudinal section the shape of the velocity profiles preserves its inlet configuration. In supplying spraying air (Fig. 4) the main role in the formation of the gas velocity fields is played by the interaction of air streams of the main and spraying air. Thus, behind the injected jet a secondary flow is formed in the form of a three-dimensional zone of reverse flows. The influence of the process of interaction of droplets with air on the flow structure is practically unnoticeable for the cases considered (the patterns of flow for all the regimes are practically identical). Moreover, the depth of penetration of fuel-air jets into the stalling air flow decreases with increase in the temperature of the spraying air due to the decrease in the injected gas momentum. z (a) (b) Fig. 4. Calculated vector velocity field in the central longitudinal section of the rectangular mixer with pneumatic supply of a fuel; a) spraying by a cold air jet (regime 2, U1 = 20 ms, T1 = 300 K); b) spraying by a hot air jet (regime 3, U1 = 20 ms, T1 = 900 K)
Figures 5 - 8 present the distributions of dimensionless volumetric concentrations of a liquid fuel cf. The results were made nondimensional through division by the value of the main air flow density at the inlet.
(a) (b) Fig. 5. Isolines of volumetric concentrations of fuel droplets in the central longitudinal section of the rectangular mixer with jetty supply of fuel (regime 1, U1 = 0); a) α = 5.4; b) α = 1.35 A comparative analysis of the concentration fields in jetty spraying for various values of α (fig. 5-6) shows that for the higher values of the fuel flow rate there corresponds a wider fuel spray. This spray is more extended, its inner region is characterized by higher values of concentrations, and it occupies a greater volume. Moreover, the patterns of the distributions of concentrations of droplets are identical, indicating the insignificant influence of droplets on the gas flow velocity fields.
(a) (b)
Fig. 6. Isolines of volumetric concentrations of fuel droplets in the transverse section x = 0.28 of the rectangular mixer with jetty supply of fuel (regime 1, U1 = 0); a) α = 5.4; b) α = 1.35 Figure 7 presents the calculated distributions of dimensionless volumetric concentrations of a liquid fuel cf for cold spraying in the characteristic sections of a mixer: in the longitudinal
www.intechopen.com
Fuel Injection130
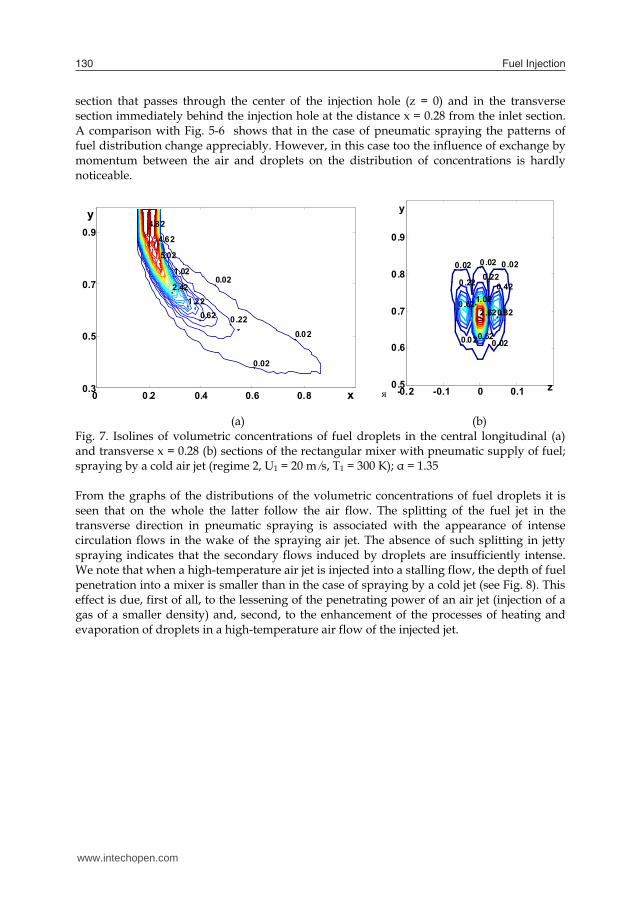
section that passes through the center of the injection hole (z = 0) and in the transverse section immediately behind the injection hole at the distance x = 0.28 from the inlet section. A comparison with Fig. 5-6 shows that in the case of pneumatic spraying the patterns of fuel distribution change appreciably. However, in this case too the influence of exchange by momentum between the air and droplets on the distribution of concentrations is hardly noticeable.
(a) (b) Fig. 7. Isolines of volumetric concentrations of fuel droplets in the central longitudinal (a) and transverse x = 0.28 (b) sections of the rectangular mixer with pneumatic supply of fuel; spraying by a cold air jet (regime 2, U1 = 20 m s, T1 = 300 K); α = 1.35 From the graphs of the distributions of the volumetric concentrations of fuel droplets it is seen that on the whole the latter follow the air flow. The splitting of the fuel jet in the transverse direction in pneumatic spraying is associated with the appearance of intense circulation flows in the wake of the spraying air jet. The absence of such splitting in jetty spraying indicates that the secondary flows induced by droplets are insufficiently intense. We note that when a high-temperature air jet is injected into a stalling flow, the depth of fuel penetration into a mixer is smaller than in the case of spraying by a cold jet (see Fig. 8). This effect is due, first of all, to the lessening of the penetrating power of an air jet (injection of a gas of a smaller density) and, second, to the enhancement of the processes of heating and evaporation of droplets in a high-temperature air flow of the injected jet.
я
0.02 0.02 0.02
0.22 0.22
1.022.62
0.42
0.82
0.020.62
0.62
0.02
z
y
-0.2 -0.1 0 0.10.5
0.6
0.7
0.8
0.94.82
4.62
5.02
1.02
2.421.22
0.62 0.22
0.02
0.02
0.02
x
y
0 0.2 0.4 0.6 0.80.3
0.5
0.7
0.9
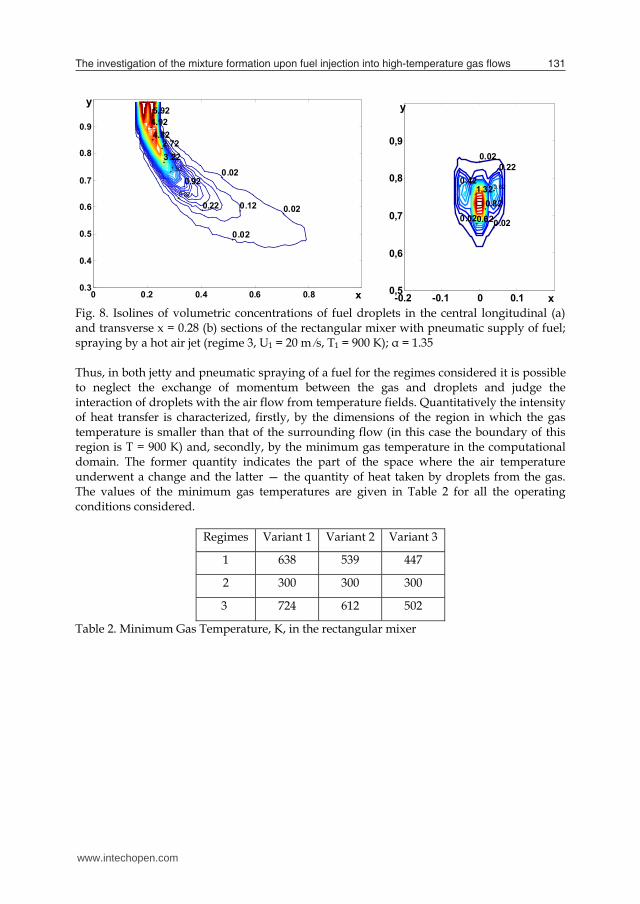
Fig. 8. Isolines of volumetric concentrations of fuel droplets in the central longitudinal (a) and transverse x = 0.28 (b) sections of the rectangular mixer with pneumatic supply of fuel; spraying by a hot air jet (regime 3, U1 = 20 m s, T1 = 900 K); α = 1.35 Thus, in both jetty and pneumatic spraying of a fuel for the regimes considered it is possible to neglect the exchange of momentum between the gas and droplets and judge the interaction of droplets with the air flow from temperature fields. Quantitatively the intensity of heat transfer is characterized, firstly, by the dimensions of the region in which the gas temperature is smaller than that of the surrounding flow (in this case the boundary of this region is T = 900 K) and, secondly, by the minimum gas temperature in the computational domain. The former quantity indicates the part of the space where the air temperature underwent a change and the latter — the quantity of heat taken by droplets from the gas. The values of the minimum gas temperatures are given in Table 2 for all the operating conditions considered.
Regimes Variant 1 Variant 2 Variant 3
1 638 539 447
2 300 300 300
3 724 612 502
Table 2. Minimum Gas Temperature, K, in the rectangular mixer
5.924.924.82
2.723.22
1.92
0.920.22
0.22 0.12 0.02
0.02
0.02
x
y
0 0.2 0.4 0.6 0.80.3
0.4
0.5
0.6
0.7
0.8
0.9
1.320.82
0.62
0.62
0.220.02
0.02
0.42
0.02
x
y
-0.2 -0.1 0 0.10,5
0,6
0,7
0,8
0,9
www.intechopen.com
The investigation of the mixture formation upon fuel injection into high-temperature gas lows 131
section that passes through the center of the injection hole (z = 0) and in the transverse section immediately behind the injection hole at the distance x = 0.28 from the inlet section. A comparison with Fig. 5-6 shows that in the case of pneumatic spraying the patterns of fuel distribution change appreciably. However, in this case too the influence of exchange by momentum between the air and droplets on the distribution of concentrations is hardly noticeable.
(a) (b) Fig. 7. Isolines of volumetric concentrations of fuel droplets in the central longitudinal (a) and transverse x = 0.28 (b) sections of the rectangular mixer with pneumatic supply of fuel; spraying by a cold air jet (regime 2, U1 = 20 m s, T1 = 300 K); α = 1.35 From the graphs of the distributions of the volumetric concentrations of fuel droplets it is seen that on the whole the latter follow the air flow. The splitting of the fuel jet in the transverse direction in pneumatic spraying is associated with the appearance of intense circulation flows in the wake of the spraying air jet. The absence of such splitting in jetty spraying indicates that the secondary flows induced by droplets are insufficiently intense. We note that when a high-temperature air jet is injected into a stalling flow, the depth of fuel penetration into a mixer is smaller than in the case of spraying by a cold jet (see Fig. 8). This effect is due, first of all, to the lessening of the penetrating power of an air jet (injection of a gas of a smaller density) and, second, to the enhancement of the processes of heating and evaporation of droplets in a high-temperature air flow of the injected jet.
я
0.02 0.02 0.02
0.22 0.22
1.022.62
0.42
0.82
0.020.62
0.62
0.02
z
y
-0.2 -0.1 0 0.10.5
0.6
0.7
0.8
0.94.82
4.62
5.02
1.02
2.421.22
0.62 0.22
0.02
0.02
0.02
x
y
0 0.2 0.4 0.6 0.80.3
0.5
0.7
0.9
Fig. 8. Isolines of volumetric concentrations of fuel droplets in the central longitudinal (a) and transverse x = 0.28 (b) sections of the rectangular mixer with pneumatic supply of fuel; spraying by a hot air jet (regime 3, U1 = 20 m s, T1 = 900 K); α = 1.35 Thus, in both jetty and pneumatic spraying of a fuel for the regimes considered it is possible to neglect the exchange of momentum between the gas and droplets and judge the interaction of droplets with the air flow from temperature fields. Quantitatively the intensity of heat transfer is characterized, firstly, by the dimensions of the region in which the gas temperature is smaller than that of the surrounding flow (in this case the boundary of this region is T = 900 K) and, secondly, by the minimum gas temperature in the computational domain. The former quantity indicates the part of the space where the air temperature underwent a change and the latter — the quantity of heat taken by droplets from the gas. The values of the minimum gas temperatures are given in Table 2 for all the operating conditions considered.
Regimes Variant 1 Variant 2 Variant 3
1 638 539 447
2 300 300 300
3 724 612 502
Table 2. Minimum Gas Temperature, K, in the rectangular mixer
5.924.924.82
2.723.22
1.92
0.920.22
0.22 0.12 0.02
0.02
0.02
x
y
0 0.2 0.4 0.6 0.80.3
0.4
0.5
0.6
0.7
0.8
0.9
1.320.82
0.62
0.62
0.220.02
0.02
0.42
0.02
x
y
-0.2 -0.1 0 0.10,5
0,6
0,7
0,8
0,9
www.intechopen.com
Fuel Injection132
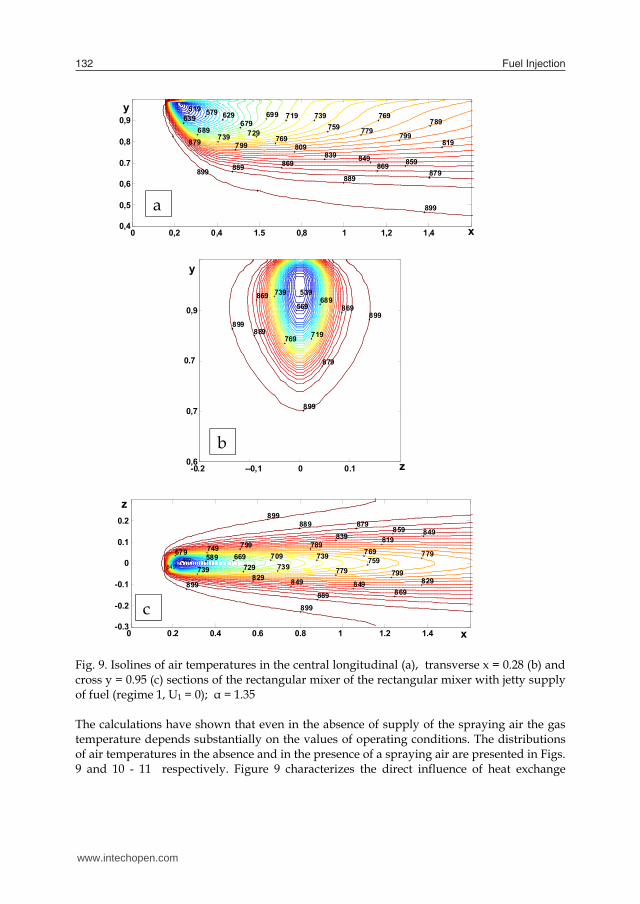
Fig. 9. Isolines of air temperatures in the central longitudinal (a), transverse x = 0.28 (b) and cross y = 0.95 (c) sections of the rectangular mixer of the rectangular mixer with jetty supply of fuel (regime 1, U1 = 0); α = 1.35 The calculations have shown that even in the absence of supply of the spraying air the gas temperature depends substantially on the values of operating conditions. The distributions of air temperatures in the absence and in the presence of a spraying air are presented in Figs. 9 and 10 - 11 respectively. Figure 9 characterizes the direct influence of heat exchange
519 579 629679
729769
809839 849 859
879869
889
899
889
639689
739799879
899869
799819
779759739719699 769
789
y
x0 0,2 0,4 1.5 0,8 1 1,2 1,40,4
0,5
0,6
0.7
0,8
0,9
539
569689
719769
739869
889899
899
879
869899
y
z
-0.2 --0,1 0 0.10,6
0,7
0.7
0,9
489 589 669 709 739 759769 779
789819
859879
899889
849839799749679
849 739 739729 779 799829849
869889899
899829 849
x
z
0 0.2 0.4 0.6 0.8 1 1.2 1.4-0.3
-0.2
-0.1
0
0.1
0.2
b
a
c
between the gas and droplets on temperature fields, since in the absence of this exchange air has the same initial temperature over the entire region of flow. From the distributions of temperatures in the longitudinal sections of the model it is seen that at α = 1.35 the region of heat transfer at x = 1.6 extends in the direction of the y axis to the distance ∆y = 0.55. As calculations showed, at α = 5.4 this distance is equal to ∆y = 0.42. The minimum temperatures that correspond to these variants are equal to 447 and 683 K (Table 2). For the variant α = 2.7 this quantity is equal to 539 K. Thus, on increase in the fuel flow rate through a jet injector the influence of droplets on temperature fields becomes more and more appreciable.
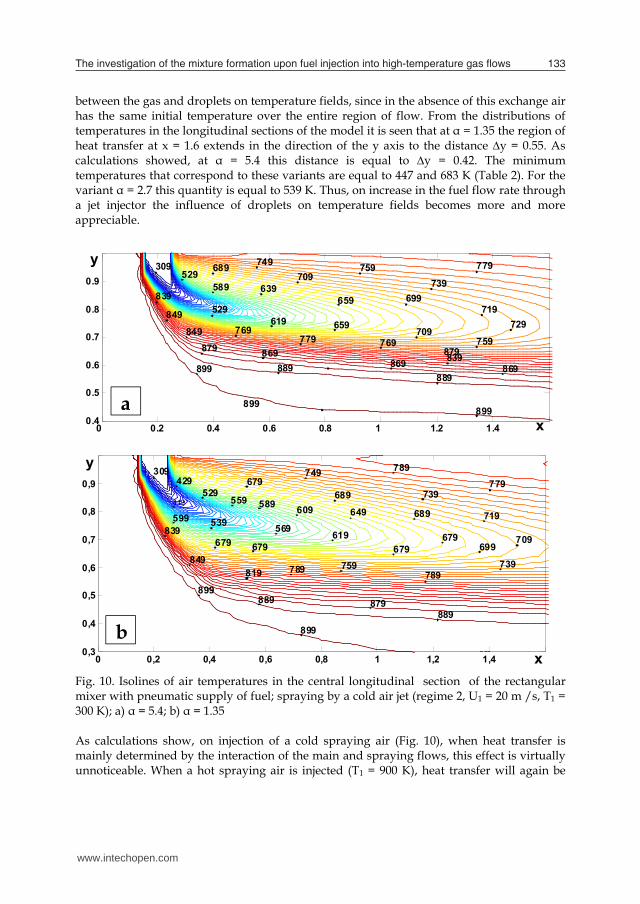
Fig. 10. Isolines of air temperatures in the central longitudinal section of the rectangular mixer with pneumatic supply of fuel; spraying by a cold air jet (regime 2, U1 = 20 m /s, T1 = 300 K); a) α = 5.4; b) α = 1.35 As calculations show, on injection of a cold spraying air (Fig. 10), when heat transfer is mainly determined by the interaction of the main and spraying flows, this effect is virtually unnoticeable. When a hot spraying air is injected (T1 = 900 K), heat transfer will again be
749 779759
739709
689309529
589 639659 699
719729
759709
659619529
839
849769
779 769839
869869869
849879 879
889889899
899899
x
y
0 0.2 0.4 0.6 0.8 1 1.2 1.40.4
0.5
0.6
0.7
0.8
0.9
309429
529559 589 609 649 689 719
739689679
749 789779
419
539 569619
679 699679 709
739789
759
679
599839
849789
879889
899
899
899889
819
679
x
y
0 0,2 0,4 0,6 0,8 1 1,2 1,40,3
0,4
0,5
0,6
0,7
0,8
0,9
a
b
www.intechopen.com
The investigation of the mixture formation upon fuel injection into high-temperature gas lows 133
Fig. 9. Isolines of air temperatures in the central longitudinal (a), transverse x = 0.28 (b) and cross y = 0.95 (c) sections of the rectangular mixer of the rectangular mixer with jetty supply of fuel (regime 1, U1 = 0); α = 1.35 The calculations have shown that even in the absence of supply of the spraying air the gas temperature depends substantially on the values of operating conditions. The distributions of air temperatures in the absence and in the presence of a spraying air are presented in Figs. 9 and 10 - 11 respectively. Figure 9 characterizes the direct influence of heat exchange
519 579 629679
729769
809839 849 859
879869
889
899
889
639689
739799879
899869
799819
779759739719699 769
789
y
x0 0,2 0,4 1.5 0,8 1 1,2 1,40,4
0,5
0,6
0.7
0,8
0,9
539
569689
719769
739869
889899
899
879
869899
y
z
-0.2 --0,1 0 0.10,6
0,7
0.7
0,9
489 589 669 709 739 759769 779
789819
859879
899889
849839799749679
849 739 739729 779 799829849
869889899
899829 849
x
z
0 0.2 0.4 0.6 0.8 1 1.2 1.4-0.3
-0.2
-0.1
0
0.1
0.2
b
a
c
between the gas and droplets on temperature fields, since in the absence of this exchange air has the same initial temperature over the entire region of flow. From the distributions of temperatures in the longitudinal sections of the model it is seen that at α = 1.35 the region of heat transfer at x = 1.6 extends in the direction of the y axis to the distance ∆y = 0.55. As calculations showed, at α = 5.4 this distance is equal to ∆y = 0.42. The minimum temperatures that correspond to these variants are equal to 447 and 683 K (Table 2). For the variant α = 2.7 this quantity is equal to 539 K. Thus, on increase in the fuel flow rate through a jet injector the influence of droplets on temperature fields becomes more and more appreciable.
Fig. 10. Isolines of air temperatures in the central longitudinal section of the rectangular mixer with pneumatic supply of fuel; spraying by a cold air jet (regime 2, U1 = 20 m /s, T1 = 300 K); a) α = 5.4; b) α = 1.35 As calculations show, on injection of a cold spraying air (Fig. 10), when heat transfer is mainly determined by the interaction of the main and spraying flows, this effect is virtually unnoticeable. When a hot spraying air is injected (T1 = 900 K), heat transfer will again be
749 779759
739709
689309529
589 639659 699
719729
759709
659619529
839
849769
779 769839
869869869
849879 879
889889899
899899
x
y
0 0.2 0.4 0.6 0.8 1 1.2 1.40.4
0.5
0.6
0.7
0.8
0.9
309429
529559 589 609 649 689 719
739689679
749 789779
419
539 569619
679 699679 709
739789
759
679
599839
849789
879889
899
899
899889
819
679
x
y
0 0,2 0,4 0,6 0,8 1 1,2 1,40,3
0,4
0,5
0,6
0,7
0,8
0,9
a
b
www.intechopen.com
Fuel Injection134
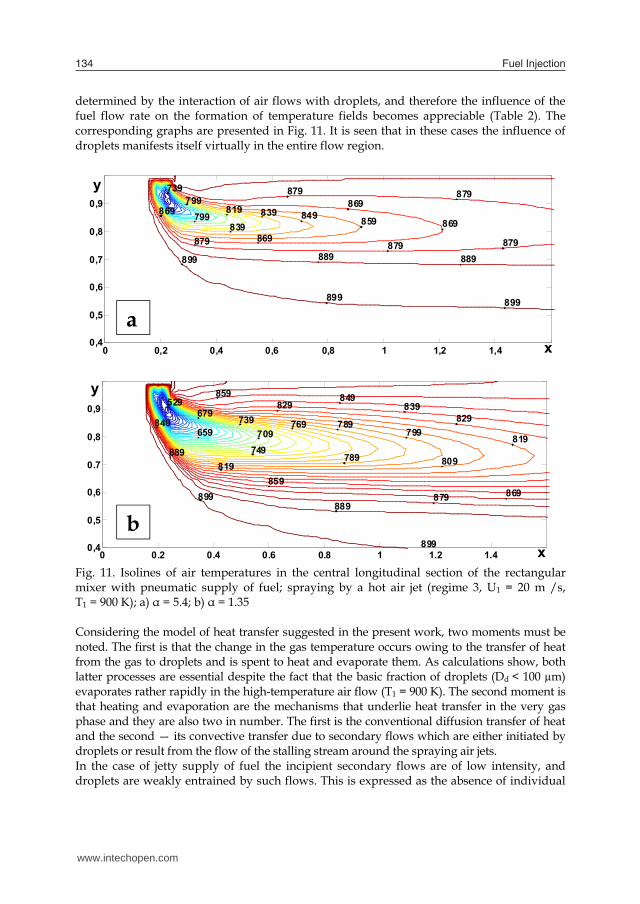
determined by the interaction of air flows with droplets, and therefore the influence of the fuel flow rate on the formation of temperature fields becomes appreciable (Table 2). The corresponding graphs are presented in Fig. 11. It is seen that in these cases the influence of droplets manifests itself virtually in the entire flow region.
Fig. 11. Isolines of air temperatures in the central longitudinal section of the rectangular mixer with pneumatic supply of fuel; spraying by a hot air jet (regime 3, U1 = 20 m /s, T1 = 900 K); a) α = 5.4; b) α = 1.35 Considering the model of heat transfer suggested in the present work, two moments must be noted. The first is that the change in the gas temperature occurs owing to the transfer of heat from the gas to droplets and is spent to heat and evaporate them. As calculations show, both latter processes are essential despite the fact that the basic fraction of droplets (Dd < 100 µm) evaporates rather rapidly in the high-temperature air flow (T1 = 900 K). The second moment is that heating and evaporation are the mechanisms that underlie heat transfer in the very gas phase and they are also two in number. The first is the conventional diffusion transfer of heat and the second — its convective transfer due to secondary flows which are either initiated by droplets or result from the flow of the stalling stream around the spraying air jets. In the case of jetty supply of fuel the incipient secondary flows are of low intensity, and droplets are weakly entrained by such flows. This is expressed as the absence of individual
899
899 899
889 889879879879 869
869
869879879
859849839839
819799
799739
869
x
y
0 0,2 0,4 0,6 0,8 1 1,2 1,40,4
0,5
0,6
0,7
0,8
0,9
529679 739659
849
889
899
899
889879 869
859819
749789 809
819799789769
709
829 839849859
829
x
y
0 0.2 0.4 0.6 0.8 1 1.2 1.40,4
0,5
0,6
0.7
0,8
0,9
a
b
vortex structures in the distributions of both concentrations and temperatures in the transverse sections of the module. The lowering of the gas temperature occurs exclusively at the expense of interphase exchange. Vortex structures are clearly seen in transverse sections with pneumatic spraying on the graphs of the distribution of fuel concentrations. A comparison between the distributions of temperatures and concentrations in these cases shows that the concentration profiles are much narrower than the corresponding temperature profiles in both longitudinal and transverse directions. This is associated with the intense diffusion heat fluxes, with the droplets mainly following the air flow. Attention is also drawn to the fact that the penetrating ability of a "cold" fuel-air jet is higher than that of a "hot" one due to the following two reasons: the great energy of the "cold" jet and the more intense process of heating and evaporation of droplets in the "hot" jet. A comparison of gas cooling in spraying of a fuel by a hot air jet and in jetty spraying shows that although the fuel is injected into flows with identical temperatures, in the second case the lowering of the gas temperature is more appreciable. This seems to be due to the fact that on injection of droplets into a stalling air flow the velocity of droplets relative to the gas is higher than in the case of injection into a cocurrent flow. The rate of the evaporation of droplets is also higher and, consequently, the complete evaporation of droplets occurs over smaller distances and in smaller volumes, thus leading to the effect noted. The total quantity of heat transferred from air to droplets is the same in both cases, but the differences observed allow one to make different fuel-air mixtures by supplying a fuel either into a cocurrent air flow or into a stalling one.
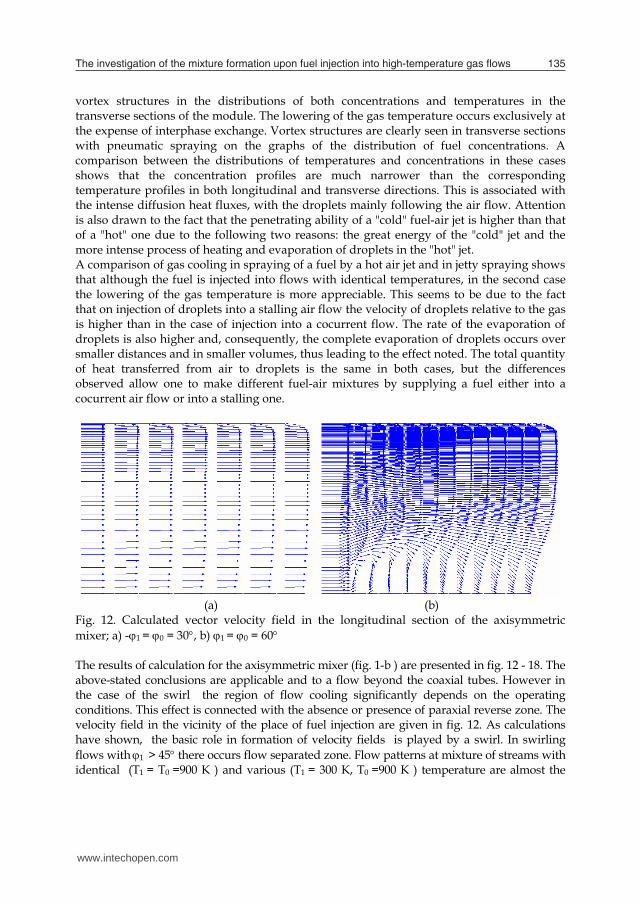
(a) (b) Fig. 12. Calculated vector velocity field in the longitudinal section of the axisymmetric mixer; a) -1 = 0 = 30, b) 1 = 0 = 60 The results of calculation for the axisymmetric mixer (fig. 1-b ) are presented in fig. 12 - 18. The above-stated conclusions are applicable and to a flow beyond the coaxial tubes. However in the case of the swirl the region of flow cooling significantly depends on the operating conditions. This effect is connected with the absence or presence of paraxial reverse zone. The velocity field in the vicinity of the place of fuel injection are given in fig. 12. As calculations have shown, the basic role in formation of velocity fields is played by a swirl. In swirling flows with 1 > 45 there occurs flow separated zone. Flow patterns at mixture of streams with identical (T1 = T0 =900 K ) and various (T1 = 300 K, T0 =900 K ) temperature are almost the
www.intechopen.com
The investigation of the mixture formation upon fuel injection into high-temperature gas lows 135
determined by the interaction of air flows with droplets, and therefore the influence of the fuel flow rate on the formation of temperature fields becomes appreciable (Table 2). The corresponding graphs are presented in Fig. 11. It is seen that in these cases the influence of droplets manifests itself virtually in the entire flow region.
Fig. 11. Isolines of air temperatures in the central longitudinal section of the rectangular mixer with pneumatic supply of fuel; spraying by a hot air jet (regime 3, U1 = 20 m /s, T1 = 900 K); a) α = 5.4; b) α = 1.35 Considering the model of heat transfer suggested in the present work, two moments must be noted. The first is that the change in the gas temperature occurs owing to the transfer of heat from the gas to droplets and is spent to heat and evaporate them. As calculations show, both latter processes are essential despite the fact that the basic fraction of droplets (Dd < 100 µm) evaporates rather rapidly in the high-temperature air flow (T1 = 900 K). The second moment is that heating and evaporation are the mechanisms that underlie heat transfer in the very gas phase and they are also two in number. The first is the conventional diffusion transfer of heat and the second — its convective transfer due to secondary flows which are either initiated by droplets or result from the flow of the stalling stream around the spraying air jets. In the case of jetty supply of fuel the incipient secondary flows are of low intensity, and droplets are weakly entrained by such flows. This is expressed as the absence of individual
899
899 899
889 889879879879 869
869
869879879
859849839839
819799
799739
869
x
y
0 0,2 0,4 0,6 0,8 1 1,2 1,40,4
0,5
0,6
0,7
0,8
0,9
529679 739659
849
889
899
899
889879 869
859819
749789 809
819799789769
709
829 839849859
829
x
y
0 0.2 0.4 0.6 0.8 1 1.2 1.40,4
0,5
0,6
0.7
0,8
0,9
a
b
vortex structures in the distributions of both concentrations and temperatures in the transverse sections of the module. The lowering of the gas temperature occurs exclusively at the expense of interphase exchange. Vortex structures are clearly seen in transverse sections with pneumatic spraying on the graphs of the distribution of fuel concentrations. A comparison between the distributions of temperatures and concentrations in these cases shows that the concentration profiles are much narrower than the corresponding temperature profiles in both longitudinal and transverse directions. This is associated with the intense diffusion heat fluxes, with the droplets mainly following the air flow. Attention is also drawn to the fact that the penetrating ability of a "cold" fuel-air jet is higher than that of a "hot" one due to the following two reasons: the great energy of the "cold" jet and the more intense process of heating and evaporation of droplets in the "hot" jet. A comparison of gas cooling in spraying of a fuel by a hot air jet and in jetty spraying shows that although the fuel is injected into flows with identical temperatures, in the second case the lowering of the gas temperature is more appreciable. This seems to be due to the fact that on injection of droplets into a stalling air flow the velocity of droplets relative to the gas is higher than in the case of injection into a cocurrent flow. The rate of the evaporation of droplets is also higher and, consequently, the complete evaporation of droplets occurs over smaller distances and in smaller volumes, thus leading to the effect noted. The total quantity of heat transferred from air to droplets is the same in both cases, but the differences observed allow one to make different fuel-air mixtures by supplying a fuel either into a cocurrent air flow or into a stalling one.
(a) (b) Fig. 12. Calculated vector velocity field in the longitudinal section of the axisymmetric mixer; a) -1 = 0 = 30, b) 1 = 0 = 60 The results of calculation for the axisymmetric mixer (fig. 1-b ) are presented in fig. 12 - 18. The above-stated conclusions are applicable and to a flow beyond the coaxial tubes. However in the case of the swirl the region of flow cooling significantly depends on the operating conditions. This effect is connected with the absence or presence of paraxial reverse zone. The velocity field in the vicinity of the place of fuel injection are given in fig. 12. As calculations have shown, the basic role in formation of velocity fields is played by a swirl. In swirling flows with 1 > 45 there occurs flow separated zone. Flow patterns at mixture of streams with identical (T1 = T0 =900 K ) and various (T1 = 300 K, T0 =900 K ) temperature are almost the
www.intechopen.com
Fuel Injection136
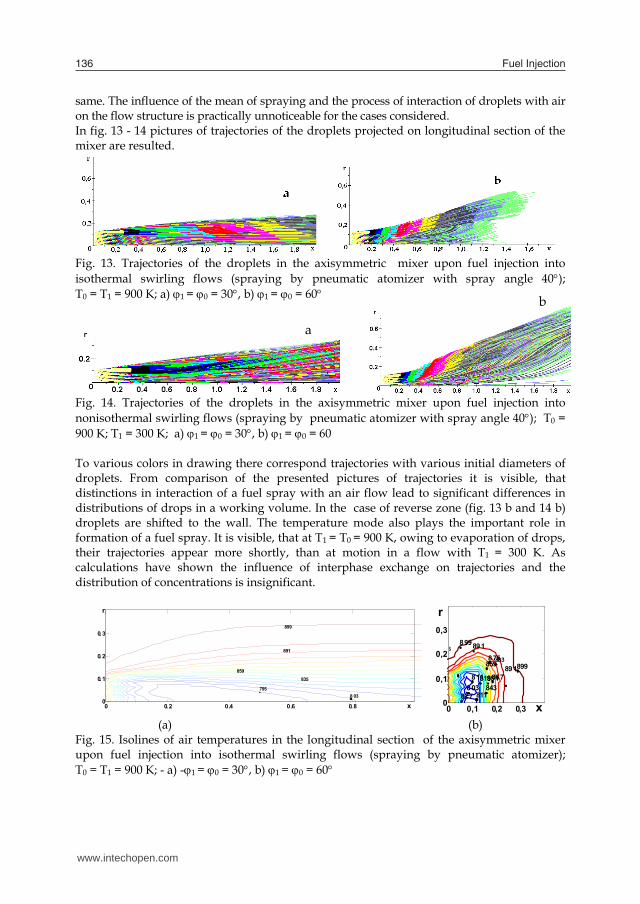
same. The influence of the mean of spraying and the process of interaction of droplets with air on the flow structure is practically unnoticeable for the cases considered. In fig. 13 - 14 pictures of trajectories of the droplets projected on longitudinal section of the mixer are resulted.
Fig. 13. Trajectories of the droplets in the axisymmetric mixer upon fuel injection into isothermal swirling flows (spraying by pneumatic atomizer with spray angle 40); T0 = T1 = 900 K; a) 1 = 0 = 30, b) 1 = 0 = 60
Fig. 14. Trajectories of the droplets in the axisymmetric mixer upon fuel injection into nonisothermal swirling flows (spraying by pneumatic atomizer with spray angle 40); T0 = 900 K; T1 = 300 K; a) 1 = 0 = 30, b) 1 = 0 = 60 To various colors in drawing there correspond trajectories with various initial diameters of droplets. From comparison of the presented pictures of trajectories it is visible, that distinctions in interaction of a fuel spray with an air flow lead to significant differences in distributions of drops in a working volume. In the case of reverse zone (fig. 13 b and 14 b) droplets are shifted to the wall. The temperature mode also plays the important role in formation of a fuel spray. It is visible, that at T1 = T0 = 900 K, owing to evaporation of drops, their trajectories appear more shortly, than at motion in a flow with T1 = 300 K. As calculations have shown the influence of interphase exchange on trajectories and the distribution of concentrations is insignificant.
(a) (b)
Fig. 15. Isolines of air temperatures in the longitudinal section of the axisymmetric mixer upon fuel injection into isothermal swirling flows (spraying by pneumatic atomizer); T0 = T1 = 900 K; - a) -1 = 0 = 30, b) 1 = 0 = 60
899
891
8 03795
859
835
x
r
0 0.2 0.4 0.6 0.80
0.1
0.2
0.3
r
803811819
811
899
899891
891
883875
867
859
851843
5
827
x0 0,1 0,2 0,30
0,1
0,2
0,3
a
b
So just as in the case of rectangular mixer it is possible to neglect the exchange of momentum between the gas and droplets and to judge the interaction of droplets with an air flow from temperature fields. It’s clear that the greatest cooling of a gas flow by droplets occurs on the maximum gas temperature. The distributions of air temperatures on injection of a hot spraying air are given in Fig. 15. That temperature fields to the full are determined by the interaction of air flows with droplets. From comparison of drawings in fig 15 a) and b) it is visible, that areas of influence of droplets on a gas flow are various also they are determined in the core by flow hydrodynamics. In a case 1 = 0 = 30, the flow is no separated and the area of cooling of gas is stretched along an axis. In a case 1 = 0 = 60 there exists the paraxial reverse zone. As result the last droplets are shifted to the wall together with cooled gas. Analogous isothermals of gas at fuel spraying from one source (supply by pressure atomizer) are resulted in fig. 16 a) and `16 b).
(a) (b) Fig. 16. Isolines of air temperatures in the longitudinal section of the axisymmetric mixer upon fuel injection into isothermal swirling flows (spraying by pressure atomizer ); T0 = T1 = 900 K; - a) 1 = 0 = 30, b) 1 = 0 = 60
a) (b) Fig. 17. Isolines of air temperatures in the longitudinal section of the axisymmetric mixer upon fuel injection into nonisothermal swirling flows (spraying by pneumatic atomizer); T0 = 900 K; T1 = 300 K; 1 = 0 = 30; a) - without an interphase exchange; b) - taking into account an interphase exchange
284
308
300
588652
852
884892
x
y
0 0.2 0.4 0.6 0.8 0
0.1
0.2
0.3
0.4
0.5
300 308
404 596692
892
860
348
x
y
0 0.2 0.4 0.6 0.8 0
0.1
0.2
0.3
0.4
0.5
r r
www.intechopen.com

The investigation of the mixture formation upon fuel injection into high-temperature gas lows 137
same. The influence of the mean of spraying and the process of interaction of droplets with air on the flow structure is practically unnoticeable for the cases considered. In fig. 13 - 14 pictures of trajectories of the droplets projected on longitudinal section of the mixer are resulted.
Fig. 13. Trajectories of the droplets in the axisymmetric mixer upon fuel injection into isothermal swirling flows (spraying by pneumatic atomizer with spray angle 40); T0 = T1 = 900 K; a) 1 = 0 = 30, b) 1 = 0 = 60
Fig. 14. Trajectories of the droplets in the axisymmetric mixer upon fuel injection into nonisothermal swirling flows (spraying by pneumatic atomizer with spray angle 40); T0 = 900 K; T1 = 300 K; a) 1 = 0 = 30, b) 1 = 0 = 60 To various colors in drawing there correspond trajectories with various initial diameters of droplets. From comparison of the presented pictures of trajectories it is visible, that distinctions in interaction of a fuel spray with an air flow lead to significant differences in distributions of drops in a working volume. In the case of reverse zone (fig. 13 b and 14 b) droplets are shifted to the wall. The temperature mode also plays the important role in formation of a fuel spray. It is visible, that at T1 = T0 = 900 K, owing to evaporation of drops, their trajectories appear more shortly, than at motion in a flow with T1 = 300 K. As calculations have shown the influence of interphase exchange on trajectories and the distribution of concentrations is insignificant.
(a) (b)
Fig. 15. Isolines of air temperatures in the longitudinal section of the axisymmetric mixer upon fuel injection into isothermal swirling flows (spraying by pneumatic atomizer); T0 = T1 = 900 K; - a) -1 = 0 = 30, b) 1 = 0 = 60
899
891
8 03795
859
835
x
r
0 0.2 0.4 0.6 0.80
0.1
0.2
0.3
r
803811819
811
899
899891
891
883875
867
859
851843
5
827
x0 0,1 0,2 0,30
0,1
0,2
0,3
a
b
So just as in the case of rectangular mixer it is possible to neglect the exchange of momentum between the gas and droplets and to judge the interaction of droplets with an air flow from temperature fields. It’s clear that the greatest cooling of a gas flow by droplets occurs on the maximum gas temperature. The distributions of air temperatures on injection of a hot spraying air are given in Fig. 15. That temperature fields to the full are determined by the interaction of air flows with droplets. From comparison of drawings in fig 15 a) and b) it is visible, that areas of influence of droplets on a gas flow are various also they are determined in the core by flow hydrodynamics. In a case 1 = 0 = 30, the flow is no separated and the area of cooling of gas is stretched along an axis. In a case 1 = 0 = 60 there exists the paraxial reverse zone. As result the last droplets are shifted to the wall together with cooled gas. Analogous isothermals of gas at fuel spraying from one source (supply by pressure atomizer) are resulted in fig. 16 a) and `16 b).
(a) (b) Fig. 16. Isolines of air temperatures in the longitudinal section of the axisymmetric mixer upon fuel injection into isothermal swirling flows (spraying by pressure atomizer ); T0 = T1 = 900 K; - a) 1 = 0 = 30, b) 1 = 0 = 60
a) (b) Fig. 17. Isolines of air temperatures in the longitudinal section of the axisymmetric mixer upon fuel injection into nonisothermal swirling flows (spraying by pneumatic atomizer); T0 = 900 K; T1 = 300 K; 1 = 0 = 30; a) - without an interphase exchange; b) - taking into account an interphase exchange
284
308
300
588652
852
884892
x
y
0 0.2 0.4 0.6 0.8 0
0.1
0.2
0.3
0.4
0.5
300 308
404 596692
892
860
348
x
y
0 0.2 0.4 0.6 0.8 0
0.1
0.2
0.3
0.4
0.5
r r
www.intechopen.com
Fuel Injection138
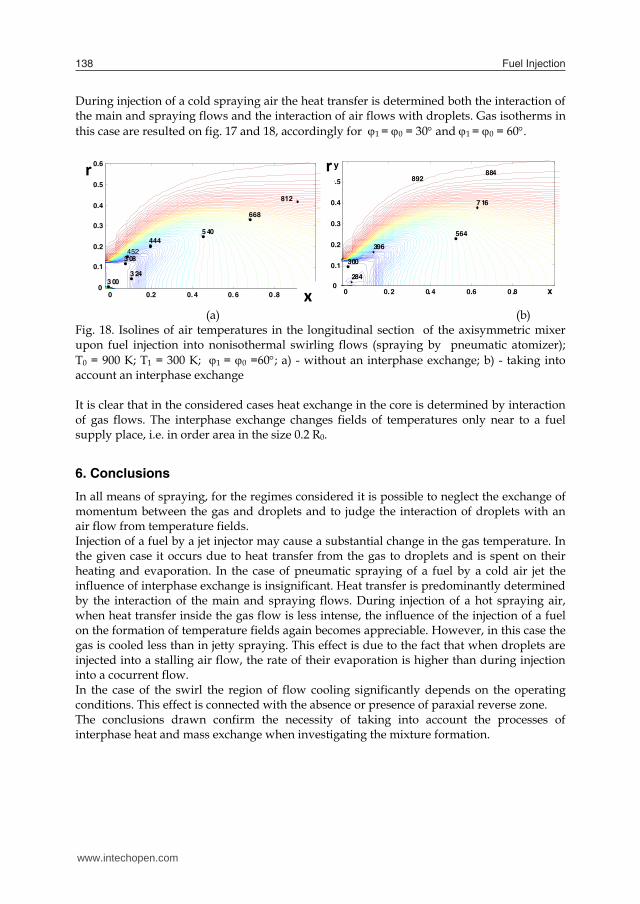
During injection of a cold spraying air the heat transfer is determined both the interaction of the main and spraying flows and the interaction of air flows with droplets. Gas isotherms in this case are resulted on fig. 17 and 18, accordingly for 1 = 0 = 30 and 1 = 0 = 60.
(a) (b) Fig. 18. Isolines of air temperatures in the longitudinal section of the axisymmetric mixer upon fuel injection into nonisothermal swirling flows (spraying by pneumatic atomizer); T0 = 900 K; T1 = 300 K; 1 = 0 =60; a) - without an interphase exchange; b) - taking into account an interphase exchange It is clear that in the considered cases heat exchange in the core is determined by interaction of gas flows. The interphase exchange changes fields of temperatures only near to a fuel supply place, i.e. in order area in the size 0.2 R0.
6. Conclusions
In all means of spraying, for the regimes considered it is possible to neglect the exchange of momentum between the gas and droplets and to judge the interaction of droplets with an air flow from temperature fields. Injection of a fuel by a jet injector may cause a substantial change in the gas temperature. In the given case it occurs due to heat transfer from the gas to droplets and is spent on their heating and evaporation. In the case of pneumatic spraying of a fuel by a cold air jet the influence of interphase exchange is insignificant. Heat transfer is predominantly determined by the interaction of the main and spraying flows. During injection of a hot spraying air, when heat transfer inside the gas flow is less intense, the influence of the injection of a fuel on the formation of temperature fields again becomes appreciable. However, in this case the gas is cooled less than in jetty spraying. This effect is due to the fact that when droplets are injected into a stalling air flow, the rate of their evaporation is higher than during injection into a cocurrent flow. In the case of the swirl the region of flow cooling significantly depends on the operating conditions. This effect is connected with the absence or presence of paraxial reverse zone. The conclusions drawn confirm the necessity of taking into account the processes of interphase heat and mass exchange when investigating the mixture formation.
rr
284
300
396
564
7 16
884892
x
y
0 0. 2 0. 4 0.6 0 .8 0
0.1
0.2
0.3
0.4
0.5
812
668
5 40444
4523 08
3 243 00
0 0.2 0. 4 0. 6 0 .8 10
0.1
0.2
0.3
0.4
0.5
0.6
x
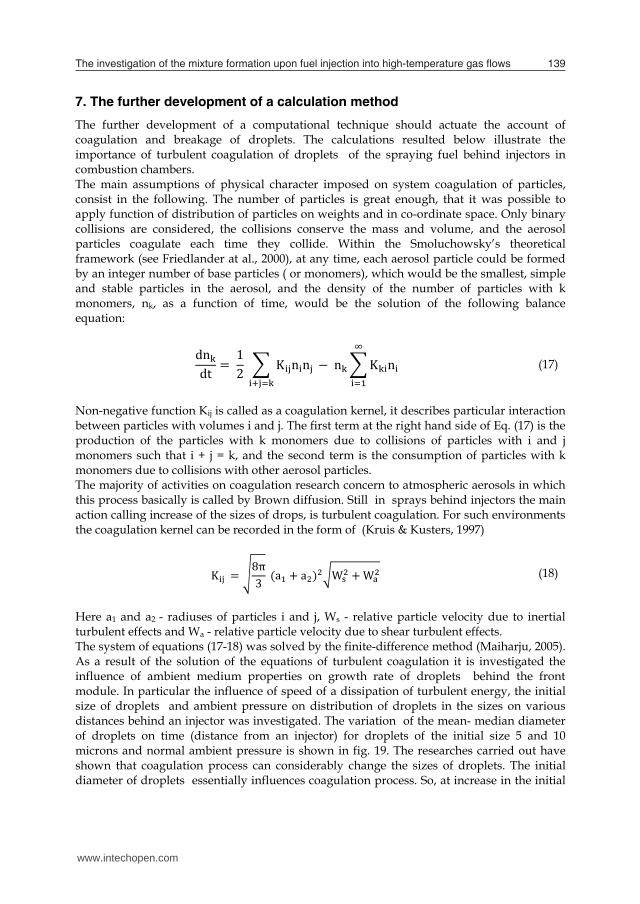
7. The further development of a calculation method
The further development of a computational technique should actuate the account of coagulation and breakage of droplets. The calculations resulted below illustrate the importance of turbulent coagulation of droplets of the spraying fuel behind injectors in combustion chambers. The main assumptions of physical character imposed on system coagulation of particles, consist in the following. The number of particles is great enough, that it was possible to apply function of distribution of particles on weights and in co-ordinate space. Only binary collisions are considered, the collisions conserve the mass and volume, and the aerosol particles coagulate each time they collide. Within the Smoluchowsky’s theoretical framework (see Friedlander at al., 2000), at any time, each aerosol particle could be formed by an integer number of base particles ( or monomers), which would be the smallest, simple and stable particles in the aerosol, and the density of the number of particles with k monomers, nk, as a function of time, would be the solution of the following balance equation: dn�dt � 12 � K��n�n������ � n� � K��n��
��� (17)
Non-negative function Kij is called as a coagulation kernel, it describes particular interaction between particles with volumes i and j. The first term at the right hand side of Eq. (17) is the production of the particles with k monomers due to collisions of particles with i and j monomers such that i + j = k, and the second term is the consumption of particles with k monomers due to collisions with other aerosol particles. The majority of activities on coagulation research concern to atmospheric aerosols in which this process basically is called by Brown diffusion. Still in sprays behind injectors the main action calling increase of the sizes of drops, is turbulent coagulation. For such environments the coagulation kernel can be recorded in the form of (Kruis & Kusters, 1997) K�� � �8π3 ��� � �����W�� � W�� (18)
Here a1 and a2 - radiuses of particles i and j, Ws - relative particle velocity due to inertial turbulent effects and Wa - relative particle velocity due to shear turbulent effects. The system of equations (17-18) was solved by the finite-difference method (Maiharju, 2005). As a result of the solution of the equations of turbulent coagulation it is investigated the influence of ambient medium properties on growth rate of droplets behind the front module. In particular the influence of speed of a dissipation of turbulent energy, the initial size of droplets and ambient pressure on distribution of droplets in the sizes on various distances behind an injector was investigated. The variation of the mean- median diameter of droplets on time (distance from an injector) for droplets of the initial size 5 and 10 microns and normal ambient pressure is shown in fig. 19. The researches carried out have shown that coagulation process can considerably change the sizes of droplets. The initial diameter of droplets essentially influences coagulation process. So, at increase in the initial
www.intechopen.com
The investigation of the mixture formation upon fuel injection into high-temperature gas lows 139
During injection of a cold spraying air the heat transfer is determined both the interaction of the main and spraying flows and the interaction of air flows with droplets. Gas isotherms in this case are resulted on fig. 17 and 18, accordingly for 1 = 0 = 30 and 1 = 0 = 60.
(a) (b) Fig. 18. Isolines of air temperatures in the longitudinal section of the axisymmetric mixer upon fuel injection into nonisothermal swirling flows (spraying by pneumatic atomizer); T0 = 900 K; T1 = 300 K; 1 = 0 =60; a) - without an interphase exchange; b) - taking into account an interphase exchange It is clear that in the considered cases heat exchange in the core is determined by interaction of gas flows. The interphase exchange changes fields of temperatures only near to a fuel supply place, i.e. in order area in the size 0.2 R0.
6. Conclusions
In all means of spraying, for the regimes considered it is possible to neglect the exchange of momentum between the gas and droplets and to judge the interaction of droplets with an air flow from temperature fields. Injection of a fuel by a jet injector may cause a substantial change in the gas temperature. In the given case it occurs due to heat transfer from the gas to droplets and is spent on their heating and evaporation. In the case of pneumatic spraying of a fuel by a cold air jet the influence of interphase exchange is insignificant. Heat transfer is predominantly determined by the interaction of the main and spraying flows. During injection of a hot spraying air, when heat transfer inside the gas flow is less intense, the influence of the injection of a fuel on the formation of temperature fields again becomes appreciable. However, in this case the gas is cooled less than in jetty spraying. This effect is due to the fact that when droplets are injected into a stalling air flow, the rate of their evaporation is higher than during injection into a cocurrent flow. In the case of the swirl the region of flow cooling significantly depends on the operating conditions. This effect is connected with the absence or presence of paraxial reverse zone. The conclusions drawn confirm the necessity of taking into account the processes of interphase heat and mass exchange when investigating the mixture formation.
rr
284
300
396
564
7 16
884892
x
y
0 0. 2 0. 4 0.6 0 .8 0
0.1
0.2
0.3
0.4
0.5
812
668
5 40444
4523 08
3 243 00
0 0.2 0. 4 0. 6 0 .8 10
0.1
0.2
0.3
0.4
0.5
0.6
x
7. The further development of a calculation method
The further development of a computational technique should actuate the account of coagulation and breakage of droplets. The calculations resulted below illustrate the importance of turbulent coagulation of droplets of the spraying fuel behind injectors in combustion chambers. The main assumptions of physical character imposed on system coagulation of particles, consist in the following. The number of particles is great enough, that it was possible to apply function of distribution of particles on weights and in co-ordinate space. Only binary collisions are considered, the collisions conserve the mass and volume, and the aerosol particles coagulate each time they collide. Within the Smoluchowsky’s theoretical framework (see Friedlander at al., 2000), at any time, each aerosol particle could be formed by an integer number of base particles ( or monomers), which would be the smallest, simple and stable particles in the aerosol, and the density of the number of particles with k monomers, nk, as a function of time, would be the solution of the following balance equation: dn�dt � 12 � K��n�n������ � n� � K��n��
��� (17)
Non-negative function Kij is called as a coagulation kernel, it describes particular interaction between particles with volumes i and j. The first term at the right hand side of Eq. (17) is the production of the particles with k monomers due to collisions of particles with i and j monomers such that i + j = k, and the second term is the consumption of particles with k monomers due to collisions with other aerosol particles. The majority of activities on coagulation research concern to atmospheric aerosols in which this process basically is called by Brown diffusion. Still in sprays behind injectors the main action calling increase of the sizes of drops, is turbulent coagulation. For such environments the coagulation kernel can be recorded in the form of (Kruis & Kusters, 1997) K�� � �8π3 ��� � �����W�� � W�� (18)
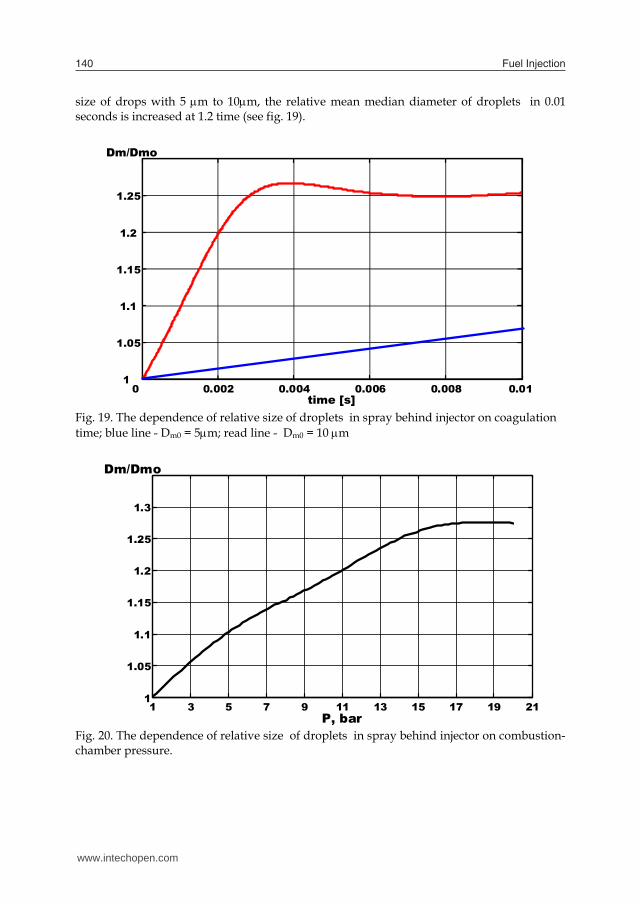
Here a1 and a2 - radiuses of particles i and j, Ws - relative particle velocity due to inertial turbulent effects and Wa - relative particle velocity due to shear turbulent effects. The system of equations (17-18) was solved by the finite-difference method (Maiharju, 2005). As a result of the solution of the equations of turbulent coagulation it is investigated the influence of ambient medium properties on growth rate of droplets behind the front module. In particular the influence of speed of a dissipation of turbulent energy, the initial size of droplets and ambient pressure on distribution of droplets in the sizes on various distances behind an injector was investigated. The variation of the mean- median diameter of droplets on time (distance from an injector) for droplets of the initial size 5 and 10 microns and normal ambient pressure is shown in fig. 19. The researches carried out have shown that coagulation process can considerably change the sizes of droplets. The initial diameter of droplets essentially influences coagulation process. So, at increase in the initial
www.intechopen.com
Fuel Injection140
size of drops with 5 m to 10m, the relative mean median diameter of droplets in 0.01 seconds is increased at 1.2 time (see fig. 19).
Fig. 19. The dependence of relative size of droplets in spray behind injector on coagulation time; blue line - Dm0 = 5m; read line - Dm0 = 10 m
Fig. 20. The dependence of relative size of droplets in spray behind injector on combustion-chamber pressure.
0 0.002 0.004 0.006 0.008 0.01 1
1.05
1.1
1.15
1.2
1.25
time [s]
Dm/Dmo
1 3 5 7 9 11 13 15 17 19 211
1.05
1.1
1.15
1.2
1.25
1.3
P, bar
Dm/Dmo
Fig. 21. The distribution of volumetric concentration on the sizes of droplets; blue lines - initial distribution; red lines - distribution in 0.01 seconds; a) - = 1m2/s3; b) = 100m2/s3 In fig. 20 data about influence of ambient pressure on coagulation of droplets of the kerosene spray are resulted. Calculations are executed at value of = 10m2/s3 and initial Dm = 5m. It's evidently from the plot at pressure variation from 1 to 25 bar the mean size of droplets as a result of coagulation for 0.01 seconds is increased approximately at 30 %. Rate of a dissipation of turbulent energy is the essential parameter determining a kernel of turbulent coagulation K (x, y). Estimations show, that behind front devices of combustion chambers the value of rate of a turbulent energy dissipation varies from 1 to 100 m2/s3. In drawings 21- a) and b) distributions of volumetric concentration Cf for two values of a rate of dissipation of turbulent energy are presented. The increase in dissipation leads to displacement of distribution of volumetric concentration in area of the big sizes.0 So the main fraction of drops of spraying liquid will fall to drops with sizes, 10 times magnitudes surpassing initial drops. Thus, ambient pressure, rate of dissipation of turbulence energy and the initial size of the droplets leaving an injector make essential impact on coagulation of droplets. It is necessary to note, that in disperse systems, except process of coagulation which conducts to integration of particles, there are cases when the integrated particle breaks up on small spontaneously or under the influence of external forces. Therefore coagulation process will be accompanied by atomization of drops as a result of aerodynamic effect of air. Thus as coagulation as breaking of droplets are desirable to take into account when calculating the mixture formation.
8. Acknowledgement
This work was supported by the Russian Foundation for Basic Research, project No. 08-08-00428.
10-6
10-4
10-2
0
1
2
3
4x 10
-3
Dm/2 [m]
Cf
a
10-6
10-4
10-2
0
1
2
3
4x 10
-3
Dm/2 [m]
Cf
b
www.intechopen.com
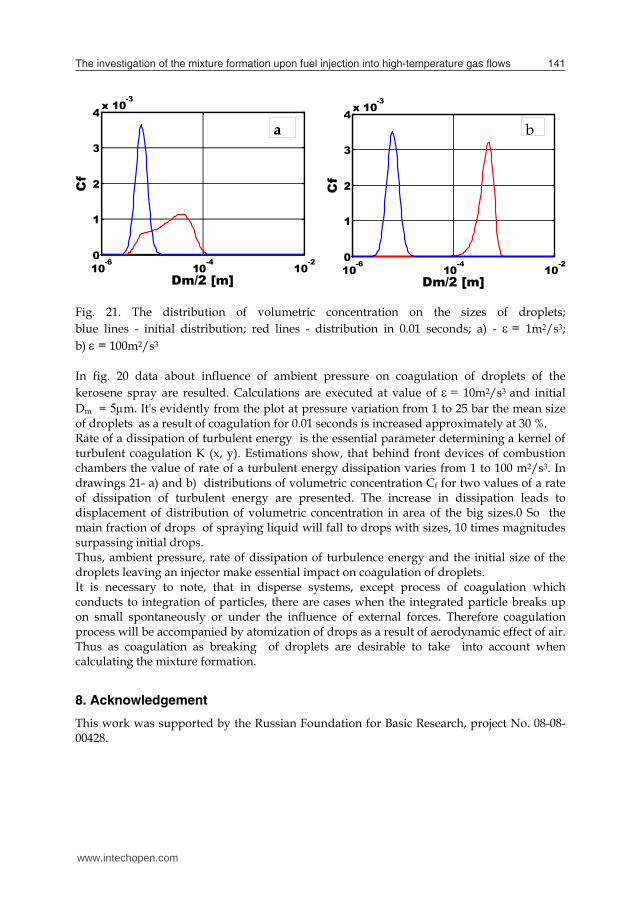
The investigation of the mixture formation upon fuel injection into high-temperature gas lows 141
size of drops with 5 m to 10m, the relative mean median diameter of droplets in 0.01 seconds is increased at 1.2 time (see fig. 19).
Fig. 19. The dependence of relative size of droplets in spray behind injector on coagulation time; blue line - Dm0 = 5m; read line - Dm0 = 10 m
Fig. 20. The dependence of relative size of droplets in spray behind injector on combustion-chamber pressure.
0 0.002 0.004 0.006 0.008 0.01 1
1.05
1.1
1.15
1.2
1.25
time [s]
Dm/Dmo
1 3 5 7 9 11 13 15 17 19 211
1.05
1.1
1.15
1.2
1.25
1.3
P, bar
Dm/Dmo
Fig. 21. The distribution of volumetric concentration on the sizes of droplets; blue lines - initial distribution; red lines - distribution in 0.01 seconds; a) - = 1m2/s3; b) = 100m2/s3 In fig. 20 data about influence of ambient pressure on coagulation of droplets of the kerosene spray are resulted. Calculations are executed at value of = 10m2/s3 and initial Dm = 5m. It's evidently from the plot at pressure variation from 1 to 25 bar the mean size of droplets as a result of coagulation for 0.01 seconds is increased approximately at 30 %. Rate of a dissipation of turbulent energy is the essential parameter determining a kernel of turbulent coagulation K (x, y). Estimations show, that behind front devices of combustion chambers the value of rate of a turbulent energy dissipation varies from 1 to 100 m2/s3. In drawings 21- a) and b) distributions of volumetric concentration Cf for two values of a rate of dissipation of turbulent energy are presented. The increase in dissipation leads to displacement of distribution of volumetric concentration in area of the big sizes.0 So the main fraction of drops of spraying liquid will fall to drops with sizes, 10 times magnitudes surpassing initial drops. Thus, ambient pressure, rate of dissipation of turbulence energy and the initial size of the droplets leaving an injector make essential impact on coagulation of droplets. It is necessary to note, that in disperse systems, except process of coagulation which conducts to integration of particles, there are cases when the integrated particle breaks up on small spontaneously or under the influence of external forces. Therefore coagulation process will be accompanied by atomization of drops as a result of aerodynamic effect of air. Thus as coagulation as breaking of droplets are desirable to take into account when calculating the mixture formation.
8. Acknowledgement
This work was supported by the Russian Foundation for Basic Research, project No. 08-08-00428.
10-6
10-4
10-2
0
1
2
3
4x 10
-3
Dm/2 [m]
Cf
a
10-6
10-4
10-2
0
1
2
3
4x 10
-3
Dm/2 [m]
Cf
b
www.intechopen.com
Fuel Injection142
9. Notation
Cf, volumetric concentration of a liquid fuel, kg m3; cf, coefficient of specific heat of liquid, J (kg�K); cpg, coefficient of specific heat of gas at constant pressure, J (kg�K); CR, coefficient of droplet resistance; Cv, concentration of fuel vapor per unit volume, kg m3; Dd, droplet diameter, m; Dm, droplet mean median diameter, m; H, channel height, m; h, specific total enthalpy, J kg; k, energy of turbulence per unit mass, m2 s 2; L, latent heat of evaporation, J kg; md, mass of a droplet, kg; mf, mass fraction of kerosene vapors; nk, density of the
number of particles with k monomers; Pr = µgcpg λg, Prandtl number; R���, force of aerodynamic resistance; Re = ρgDdW µg, Reynolds number of a droplet; S, internal source term in the equation of transfer of the variable ; T, temperature, K; t, time, s; U���g, vector of averaged gas velocity; Ugi (i = 1, 2, 3), components of the vector of averaged gas velocity, m /s; V���d, vector of droplet velocity; W����= V���d −U���g, vector of droplet velocity relative to gas; x, y, z, Cartesian coordinates; x, r, , cylindrical coordinates; α, summed coefficient of air excess; Γ, coefficient of diffusion transfer of variable ; ∆td, time of droplet residence in the volume element, s; ∆v, elementary volume, m3; ε, rate of dissipation of turbulence energy, m2 s 3; λg, thermal conductivity of gas, W (m�K); µg, coefficient of dynamic viscosity of gas, kg (m�s); ρ, density, kg m3; , dependent variable; 1, 0, wane angles of swirlers in inner and outer channels, °. Subscripts and superscripts: 0, main flow; 1, spraying air; g, gas; f, liquid fuel; d, droplet; int, interphase; v, vapor-like fuel; i, individual droplet.
10. References Chien K.J. (1982). Predictions of channel and boundary-layer flows with low-Reynolds-
number turbulence model. AIAA J., Vol. 20, 33–38. Dityakin Yu. F., Klyachko L. A., Novikov B. V. and V. I. Yagodkin. (1977). Spraying of Liquids
(in Russian), Mashinostroenie, Moscow. Friedlander, S. K. (2000). Smoke, Dust and Haze. Oxford Univ. Press, Oxford. Lefebvre A.H. (1985). Gas Turbine Combustion, Hemisphere Publishing corporation,
Washington, New York, London. Koosinlin M.L., Launder B.E., Sharma B.J. (1974). Prediction of momentum, heat and mass
transfer in swirling turbulent boundary layers. Trans. ASME, Ser. C., Vol. 96, No 2, 204.
Kruis F. E & Kusters K.A. (1997) The Collision Rate of Particles in Turbulent Flow, Chem. Eng. Comm. Vol. 158, 201-230.
Maiharju S.A (2005). Aerosol dynamics in a turbulent jet, A Thesis the Degree Master of Science in the Graduate School of The Ohio State University.
Maiorova A.I. & Tretyakov V.V. (2008). Characteristic features of the process of mixture formation upon fuel injection into a high-temperature air flow. Journal of Engineering Physics and Thermophysics, Vol. 81, No. 2, 264-273. ISSN: 1062-0125.
Patankar S. (1980). Numerical Heat Transfer and Fluid Flow, Hemisphere Publishing, New York.
www.intechopen.com

Fuel InjectionEdited by Daniela Siano
ISBN 978-953-307-116-9Hard cover, 254 pagesPublisher SciyoPublished online 17, August, 2010Published in print edition August, 2010
InTech EuropeUniversity Campus STeP Ri Slavka Krautzeka 83/A 51000 Rijeka, Croatia Phone: +385 (51) 770 447 Fax: +385 (51) 686 166www.intechopen.com
InTech ChinaUnit 405, Office Block, Hotel Equatorial Shanghai No.65, Yan An Road (West), Shanghai, 200040, China
Phone: +86-21-62489820 Fax: +86-21-62489821
Fuel Injection is a key process characterizing the combustion development within Internal Combustion Engines(ICEs) and in many other industrial applications. State of the art in the research and development of modernfuel injection systems are presented in this book. It consists of 12 chapters focused on both numerical andexperimental techniques, allowing its proper design and optimization.
How to referenceIn order to correctly reference this scholarly work, feel free to copy and paste the following:
Anna Maiorova, Aleksandr Sviridenkov and Valentin Tretyakov (2010). The Investigation of the MixtureFormation upon Fuel Injection into High-Temperature Gas Flows, Fuel Injection, Daniela Siano (Ed.), ISBN:978-953-307-116-9, InTech, Available from: http://www.intechopen.com/books/fuel-injection/the-investigation-of-the-mixture-formation-upon-fuel-injection-into-high-temperature-gas-flows

© 2010 The Author(s). Licensee IntechOpen. This chapter is distributedunder the terms of the Creative Commons Attribution-NonCommercial-ShareAlike-3.0 License, which permits use, distribution and reproduction fornon-commercial purposes, provided the original is properly cited andderivative works building on this content are distributed under the samelicense.


![Formation of Cyclic 1,/V2-Propanodeoxyguanosine Adducts in … · [CANCER RESEARCH 44, 990-995, March 1984] Formation of Cyclic 1,/V2-Propanodeoxyguanosine Adducts in DMA upon Reaction](https://img.pdfslide.us/doc/110x75/5e69aa3b87c67d520529bd8b/formation-of-cyclic-1v2-propanodeoxyguanosine-adducts-in-cancer-research-44.jpg)