Embed Size (px)
Citation preview

Fuel Injection and Spray Research Using X-Ray Diagnostics
Project ID ACE10
Christopher PowellAlan Kastengren, Jin Wang
2011 OVT Merit Review10 May 2011
Crystal City, VA
Team Leader: Gurpreet SinghThis presentation does not contain any proprietary, confidential, or
otherwise restricted information

Overview
2
Timeline
Budget
Barriers
Partners
FY2010: $830K FY2011: $835K
Sandia, Engine Combustion Network
Delphi Diesel, Bosch, Westport, Chrysler
“Inadequate understanding of the fundamentals of fuel injection”
“Inadequate capability to simulate this process”
“The capability to accurately model and simulate the complex fuel and air flows”
These barriers impact:• Low-Temperature Combustion• Thermal Efficiency• System Cost
Project Start: FY2000

Objectives
3
Overall Goals:
Serve industry by providing unique injector and spray diagnostics
Improve the fundamental understanding of fuel injection and sprays
Assist in development of improved spray models using unique quantitative measurements of sprays
FY2011:
Complete Vehicle Technologies X-Ray Beamline
Investigations studying multiple injection
Experiments supporting Argonne’s LTC research on the GM 1.9 platform
Spray and needle lift measurements for the Engine Combustion Network
Begin new collaboration with Delphi Diesel

Milestones, 2010 and 2011
4
Oct 2010: Complete fabrication of GM 1.9 fuel system
Nov 2010: Measurements of Main-Post injections
Feb 2011: Measurements of GM 1.9 sprays
Feb 2011: Complete hardware upgrades for Engine Combustion Network
March 2011: Needle lift measurements for Engine Combustion Network
April 2011: Spray measurements for Engine Combustion Network
May 2011: Measurements of Westport Natural Gas Injector
Aug 2011: Cavitation measurements
Sep 2011: New projects with Delphi Diesel, Chrysler underway

Technical Approach – X-rays Reveal Fundamental Spray Structure
5
Visible Light Imaging
X-Ray Imaging

Vehicle Technologies X-Ray Beamline Dedicated laboratory at x-ray source
– Previous experiments were done in a shared, general-purpose laboratory
– Dedicated lab funded by cost-share between BES and Vehicle Technologies
– More time for measurements, collaborations
– Explore new capabilities, applications
Upgraded x-ray optics in FY2011– Allows us to resolve finer structures in spray
• Old beamline: 150 µm x 14 µm
• New beamline, 2010: 10 µm x 8 µm
• New mirrors, 2011: 4 µm x 5 µm
– 20X more x-ray flux than 2008• More precise, faster measurements
• Can study pure fuels without additive
6
DOE has approved APS Upgrade (ca. 2015) – APS is currently deciding which beamlines will be included in upgrade
– Review committee “Strongly Recommended” that this beamline be upgraded
The Advanced Photon SourceArgonne National Laboratory
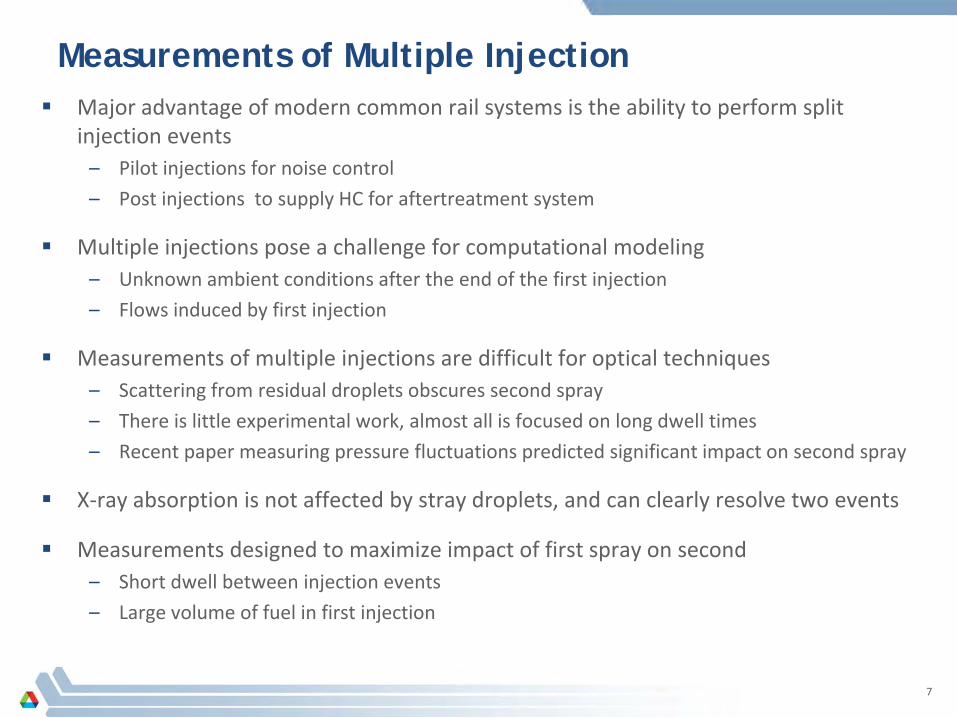
Measurements of Multiple Injection Major advantage of modern common rail systems is the ability to perform split
injection events– Pilot injections for noise control
– Post injections to supply HC for aftertreatment system
Multiple injections pose a challenge for computational modeling– Unknown ambient conditions after the end of the first injection
– Flows induced by first injection
Measurements of multiple injections are difficult for optical techniques– Scattering from residual droplets obscures second spray
– There is little experimental work, almost all is focused on long dwell times
– Recent paper measuring pressure fluctuations predicted significant impact on second spray
X-ray absorption is not affected by stray droplets, and can clearly resolve two events
Measurements designed to maximize impact of first spray on second– Short dwell between injection events
– Large volume of fuel in first injection
7

Sprays Merge at Short Dwell Times
8
1100 bar, 700 µs Dwell
1100 bar, 650 µs Dwell
650 µs

Influence of Main Injection on Post Injection
Does the first injection impact the fuel distribution for the second injection?
Measure spray penetration, x-ray cone angle, projected density
Several different rail pressures, dwell times
For two distinct spray events, the first injection appears to have little influence
9
1065 bar Rail Pressure700 µs Dwell
4.0 mm from Nozzle
“Correlation of Split-Injection Needle Lift and Spray Structure”, Kastengren et al., SAE Congress 2011
660 bar Rail Pressure 660 bar Rail Pressure700 µs Dwell
0 10 20 30 40 50 600
2
4
6
8
10
12
580 µs Dwell, Main 680 µs Dwell, Main 580 µs Dwell, Post 680 µs Dwell, Post
Pene
tratio
n (m
m)
Time After Apparent SOI (µs) 500 1000 1500 20002
4
6
8
10
12
14
X-Ra
y Co
ne A
ngle
(deg
rees
)
Time after Commanded SOI (µs)
Main Post
200 400 600 800
0
10
20
30
40
50Main InjectionPost Injection
Proj
ecte
d De
nsity
(µg/
mm
2 )
Time After Commanded SOI (µs)
Ope
ning
Ope
ning
Clos
ing
Clos
ing

Spray Measurements in Support of Compression Ignition using Low-Cetane Fuels
GM 1.9 TDI engine, flexible engine controller
Advanced combustion strategy: – Low-cetane fuels and compression ignition
– Difficult-to-ignite fuel allows early injection with partial premix
– Balance of fuel injected at TDC for control of combustion timing
10
Endoscopic imaging will be used quantify the envelope of operation (quality of combustion)
X-ray measurements of the fuel injection
– Measure the fuel/air mixing
– Development and validation of computational modeling

Fuel Injection Strategies Used in GM 1.9 Engine Studies
11
01020
01020
01020
260 280 300 320 340 360 380 4000
1020
0 CAD, 21 kg/m3
Inje
ctor
Cur
rent
(A)
2000 RPM Gasoline
-60 CAD, 3.57 kg/m3
-11 CAD, 15.5 kg/m3
0 CAD, 17.5 kg/m3
1500 RPM Diesel
+5 CAD, 21.5 kg/m3
-40 CAD, 7.1 kg/m3
1500 RPM Gasoline
+10 CAD, 26.9 kg/m3
-5 CAD, 32.6 kg/m3
-80 CAD, 3.7 kg/m3
CAD
2500 RPM Gasoline

Measurements in Support of Compression Ignition of Low-Cetane Fuel
To maximize the relevance of the measurements, match engine as closely as possible
– Identical injector, pump, common rail, fuel lines
– Similar flexible controller
– 3-hole injector nozzle, hole geometry matches production 7-hole nozzle
– Fuel is gasoline-type calibration fluid with lubricity additive (0.05%), no x-ray contrast additive
– Spray measurement conditions chosen to match typical engine conditions
– Fueling varies for each engine condition, must match engine measurements
12
-0.0002 0.0000 0.0002 0.0004 0.0006 0.0008
0
5
10
15
20 Engine Data Spray Measurements
Inje
ctor
Cur
rent
(A)
Time (s)
2500 RPM Gas - Early Injection (-80 CAD)

-15 -10 -5 0 5 10 150
5
10
15
20
In-C
ylind
er D
ensit
y (k
g/m
3 )
Crank Angle Degrees
0
5
10
15
20
25
30
Inje
ctor
Cur
rent
(Am
ps)
Diesel Fuel Injection Strategy
Simulating the In-Cylinder Density in a Static Pressure Chamber
Ambient density has direct impact on penetration, mixing, etc (more important than ambient pressure)
In-Cylinder density changes with crank angle
Must choose a density for measurements in static chamber
Plot shows electrical signal, fuel emerges 2 CAD later
Density changes during injection event are neglected
13
15.5 kg/m3 17.5 kg/m3

80 BTDC 3.7 kg/m360 BTDC 3.6 kg/m340 BTDC 7.1 kg/m3
Gasoline Injection at three Engine Operating Points
14
-0.1 0.0 0.10.0
0.1
0.2
0.3
Mas
s/Ar
ea (µ
g/m
m2 )
Transverse Position (mm)
40 BTDC 60 BTDC 80 BTDC
0.1 mm From Orifice
140 µm
-1.5 -1.0 -0.5 0.0 0.5 1.0 1.5
0.00
0.02
0.04
0.06
0.08
0.1010 mm From Orifice
Mas
s/Ar
ea (µ
g/m
m2 )
Transverse Position (mm)
40 BTDC 60 BTDC 80 BTDC

Comparison of Diesel and Gasoline Type Fuels Under Identical Conditions
15
-0.1 0.0 0.10.0
0.1
0.2
0.3
0.4
0.5
Mas
s/Ar
ea (µ
g/m
m2 )
Transverse Position (mm)
60 BTDC Diesel 60 BTDC Gasoline
0.1 mm From Orifice
140 µm
-1.5 -1.0 -0.5 0.0 0.5 1.0 1.50.00
0.05
0.10
0.1510 mm From Orifice
Mas
s/Ar
ea (µ
g/m
m2 )
Transverse Position (mm)
60 BTDC Diesel 60 BTDC Gasoline
0.0 0.1 0.2 0.30
5
10
15
20
25
60 BTDC Diesel 60 BTDC Gasoline
Spra
y Pe
netra
tion
(mm
)Time (ms)
"Correlation of Diesel Spray Structure to LTC Engine Combustion", A. L. Kastengren et al., ASME-ICE Fall Technical Conference, September 2011.

Measurements in Support of Sandia’s Engine Combustion Network
Collaboration of 12 leading spray and combustion groups worldwide
All groups studying same “Spray A” operating condition– Common injection hardware
– Well-defined fuel, pressure, temperatures, ambient density, etc
Data will be shared with partners, modeling groups worldwide
Argonne will contribute x-ray measurements of spray and needle motion– Needle lift defines initial conditions for modeling
– Spray measurements for validation
Required significant hardware improvements– 1500 bar Injection pressure
– Heated injector mount and spray chamber
– Measurements of needle lift under pressurized
conditions
16

High-Speed X-Ray Imaging of ECN Single-Hole Nozzles
17
Injectors are nominally Identical, but needle motion is different Imaging completed for
three of the 10 ECN injectors. (two single, one three-hole) Corresponding Spray
measurements in April 2011
0 1 2 3 4
0
250
500
750
1000
1500 us Duration 1000 us Duration 750 us Duration 500 us Duration 400 us Duration 300 us Duration
Need
le L
ift (µ
m)
Time (ms)
Injector 210675
0 1 2 3 4
-40
-30
-20
-10
0
Off-
Axis
Posit
ion
(µm
)
Time (ms)

Future Work in FY2011 and FY2012 Additional work on GM 1.9 Hardware
– Additional engine conditions as needed– Measurements with new spray nozzles– Comparisons of spray data with in-cylinder visualizations– Data used for spray/engine model validation
Further experiments with Engine Combustion Network– Spray radiography measurements of nozzles currently at Argonne– Needle lift measurements of other injectors/nozzles sent by ECN partners– Needle lift and spray data provided to computational modelers
Cavitation in a model nozzle– Proof-of-concept measurements of a scaled-up nozzle
– Visiting Fulbright Scholar from Monash University in Australia
– Unique, quantitative measurements of cavitation
– Couple with cavitation modeling performed at Argonne
Projects with industrial partners– Delphi Diesel – studies of injector geometry– Westport Innovations – image internal components of gas injectors– Chrysler – spray imaging to support advanced combustion engine, includes GDI sprays
18

X-Ray diagnostics are being used to address a range of research challenges– Studying sprays under engine-relevant conditions
– Providing data for spray model development and validation
– Understanding the fundamentals of atomization
– Provide a diagnostic for industrial partners
New experiment station dedicated to our research will make these measurements easier and available to a wider group of collaborators
19
Summary

20
Technical Back-Up Slides(Note: please include this “separator” slide if you are including back-up technical slides (maximum of five).
These back-up technical slides will be available for your presentation and will be included in the DVD and Web
PDF files released to the public.)

Experimental Setup
Combine radiography measurements of spray structure and phase-contrast imaging
Axial single-hole nozzle, nominally 110 µm diameter
Bosch Generation 2 injector; same injector as GM 1.9 L engine
For this work, 700 µs main injection commanded duration, 400 µs post
Spray into 5 bar N2 for radiography, 1 bar for phase-contrast imaging
Advanced Engine Combustion Working Group Meeting, February 2010
21

Injection Strategies Being Studied
22
-150 -100 -50 0 50 100 1500
1000
2000
3000
4000
5000
6000
Cylin
der P
ress
ure
(kPa
)
Crank Angle Degrees
0
5
10
15
20
25
30
Inje
ctor
Cur
rent
(Am
ps)
Diesel Fuel Injection Strategy
-150 -100 -50 0 50 100 1500
1000
2000
3000
4000
5000
6000
7000Gasoline Fuel Injection Strategy
Cylin
der P
ress
ure
(kPa
)
Crank Angle Degrees
0
5
10
15
20
25
30
Inje
ctor
Cur
rent
(Am
ps)
Early Injection Main Injection
-11 CAD 15.5 kg/m3 0 CAD 17.5 kg/m3
Early Injection Main Injection
-40 CAD 2.2 kg/m3 0 CAD 19.8 kg/m3
-60 4 0 19.8
-80 7.6 0 19.8
Stock DieselStrategy
CompressionIgnition Gasoline
Strategies

Gasoline Injection at three Engine Operating Points
23
80 BTDC 3.7 kg/m360 BTDC 3.6 kg/m340 BTDC 7.1 kg/m3
-0.1 0.0 0.10.0
0.1
0.2
0.3
Mas
s/Ar
ea (µ
g/m
m2 )
Transverse Position (mm)
40 BTDC 60 BTDC 80 BTDC
0.1 mm From Orifice
140 µm
-1.5 -1.0 -0.5 0.0 0.5 1.0 1.5
0.00
0.02
0.04
0.06
0.08
0.10
10 mm From Orifice
Mas
s/Ar
ea (µ
g/m
m2 )
Transverse Position (mm)
40 BTDC 60 BTDC 80 BTDC

Comparison of Diesel and Gasoline Type Fuels Under Identical Conditions
24
-0.1 0.0 0.10.0
0.1
0.2
0.3
0.4
0.5
Mas
s/Ar
ea (µ
g/m
m2 )
Transverse Position (mm)
60 BTDC Diesel 60 BTDC Gasoline
0.1 mm From Orifice
140 µm
-1.5 -1.0 -0.5 0.0 0.5 1.0 1.50.00
0.05
0.10
0.1510 mm From Orifice
Mas
s/Ar
ea (µ
g/m
m2 )
Transverse Position (mm)
60 BTDC Diesel 60 BTDC Gasoline
0.0 0.1 0.2 0.30
5
10
15
20
25
60 BTDC Diesel 60 BTDC Gasoline
Spra
y Pe
netra
tion
(mm
)Time (ms)
"Correlation of Diesel Spray Structure to LTC Engine Combustion", A. L. Kastengren et al., ASME-ICE Fall Technical Conference, September 2011.