PBSRG GLOBAL
Dean Kashiwagi, P.E., PhD Director, Professor
Performance Based Studies Research Group
CIB W117 Coordinator Fulbright Scholar
IFMA Fellow Pbsrg.com
Nov 4, 2014
SKEMA Business School
Best Value Approach
Objectives
• Utilizing expertise is the only way to improve performance and minimize cost
• Natural laws govern reality
• Make things simple and transparent
2
Rules of Change
• Nothing personal
• Change makes everyone uncomfortable
• Logic and common sense must be used
3
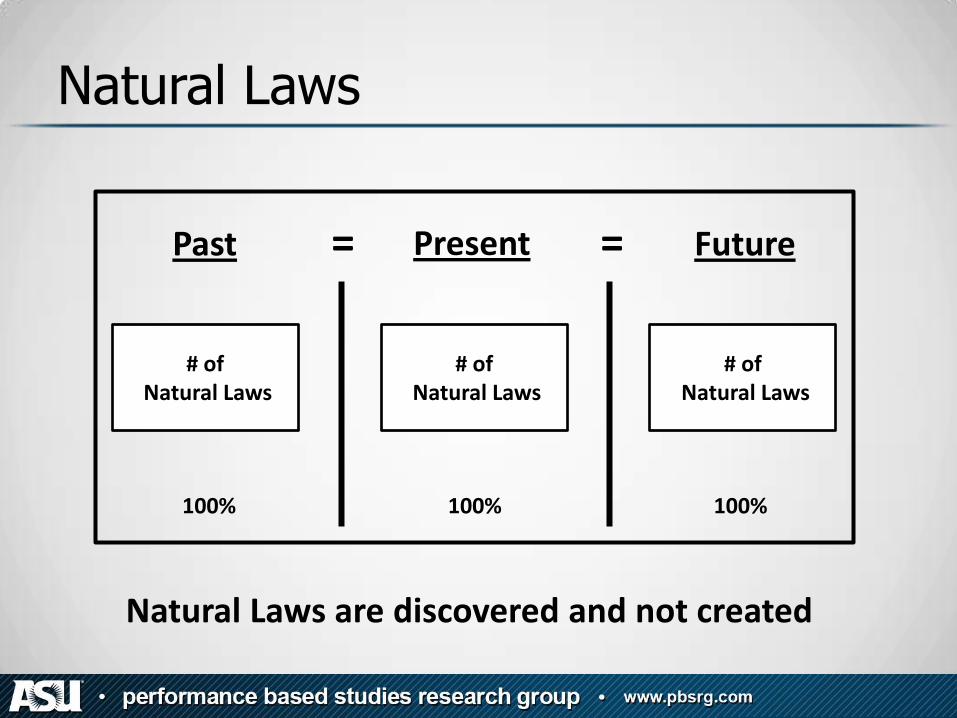
= = Past Present Future
# of Natural Laws
# of Natural Laws
# of Natural Laws
100% 100% 100%
Natural Laws
Natural Laws are discovered and not created
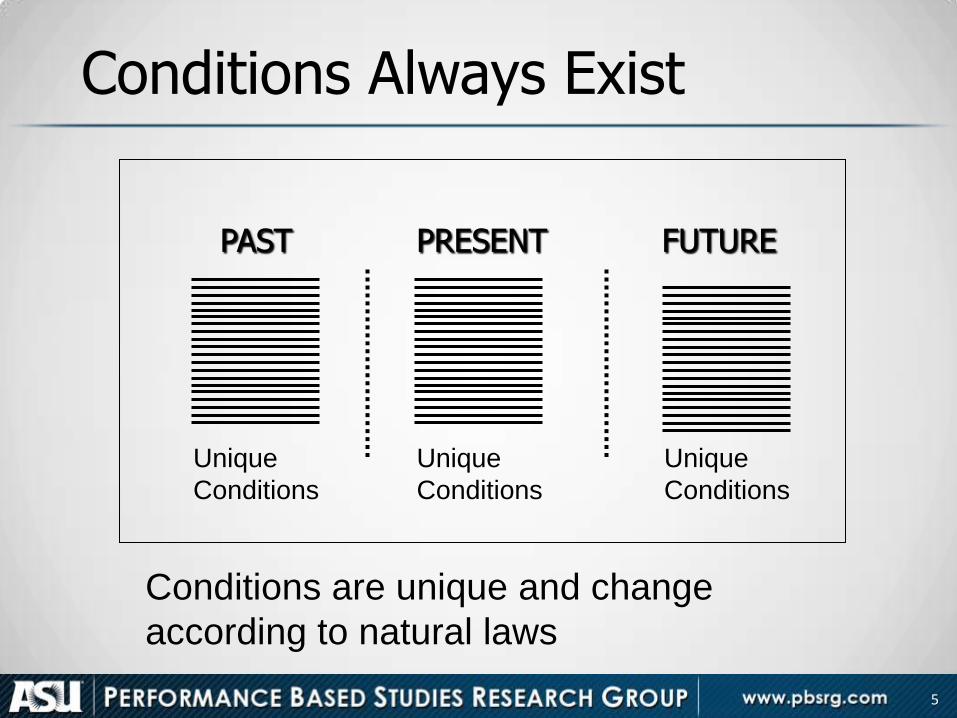
Conditions Always Exist
Conditions are unique and change
according to natural laws
Unique
Conditions
PAST
Unique
Conditions
PRESENT
Unique
Conditions
FUTURE
5
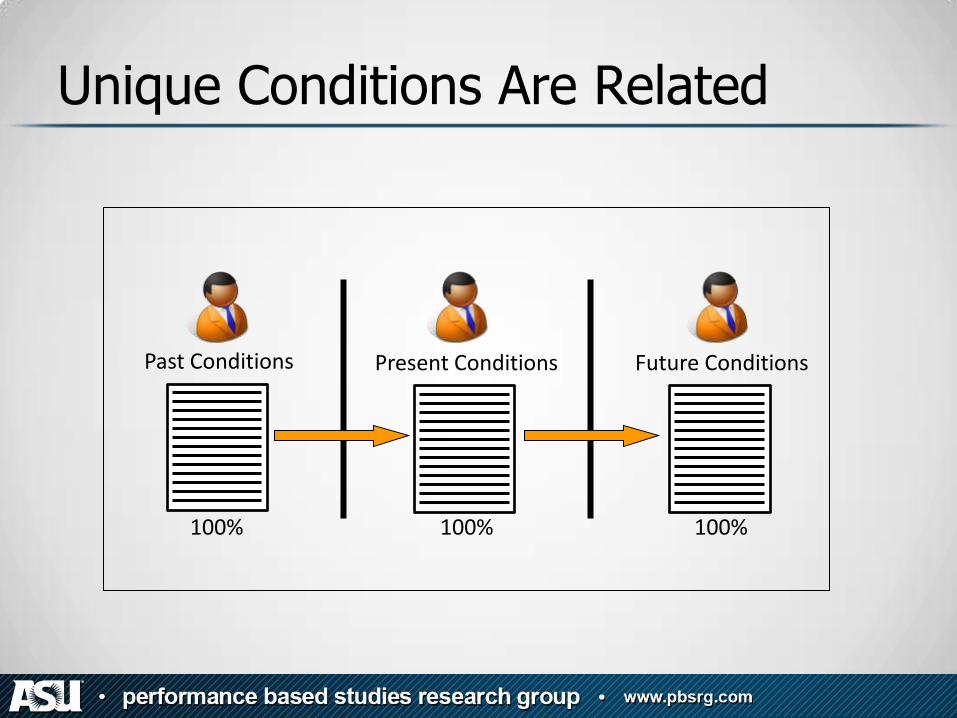
Past Conditions Present Conditions Future Conditions
100% 100% 100%
Unique Conditions Are Related
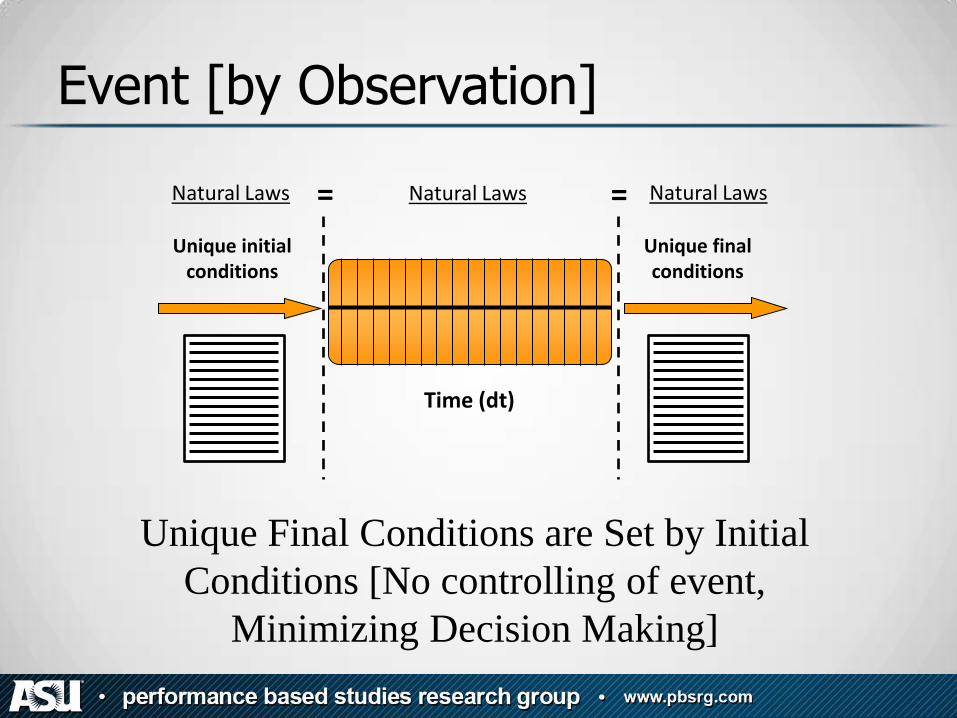
Unique initial conditions
Unique final conditions
Time (dt)
Natural Laws Natural Laws Natural Laws = =
Event [by Observation]
Unique Final Conditions are Set by Initial
Conditions [No controlling of event,
Minimizing Decision Making]
Impact of Understanding Natural Laws
• Makes things simple
• Explains what someone may not know due to a lack of detailed information
• Minimizes decision making
• Minimizes thinking
• Allows observation to identify accurate predictions
• Simplifies and creates transparency
• Minimizes actions reducing cost, stress, and poor results

1976

1992
w w w . p b s r g . c o m
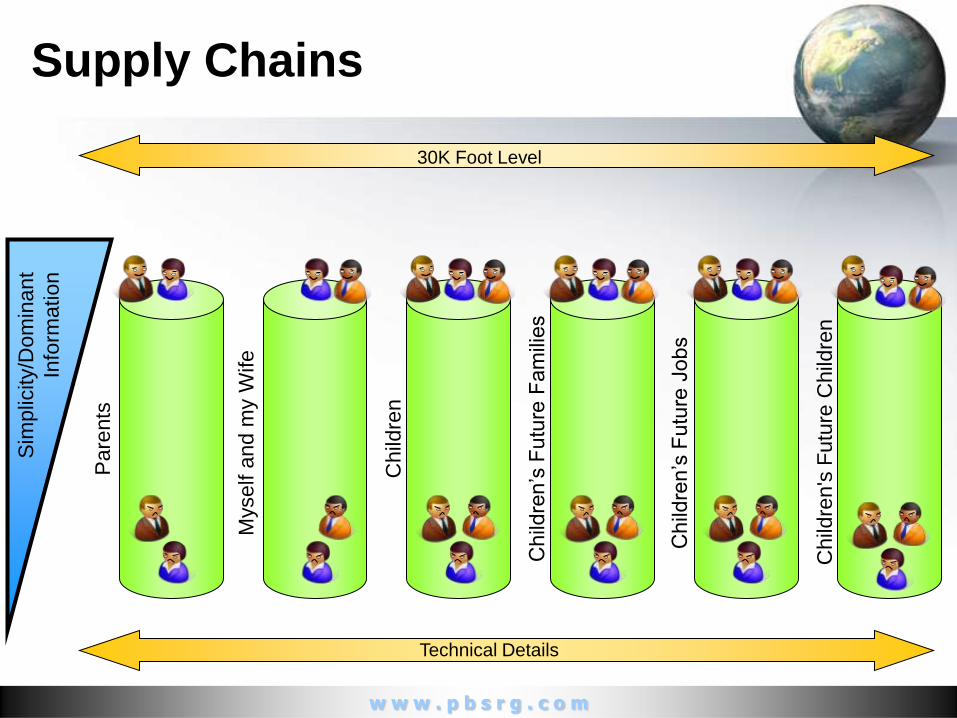
Supply Chains P
are
nts
Myself a
nd m
y W
ife
Child
ren
Child
ren’s
Futu
re F
am
ilies
Child
ren’s
Futu
re J
obs
Child
ren's
Futu
re C
hild
ren
Sim
plic
ity/D
om
inant
Info
rmation
Technical Details
30K Foot Level


Lessons Learned
• Talk less
• Observe more
• Risk increases when we attempt to change, influence or modify behavior of others
• Everything is predictable [if we observe]
• These are natural laws
• Breaking natural laws increases risk, lowers performance and increases cost
Best Value Approach
• Natural laws and deductive logic
• Simplify
• Minimize the use of management, direction and control [MDC]
• Do not make decisions
• Utilize expertise to increase value and performance and minimize cost
15
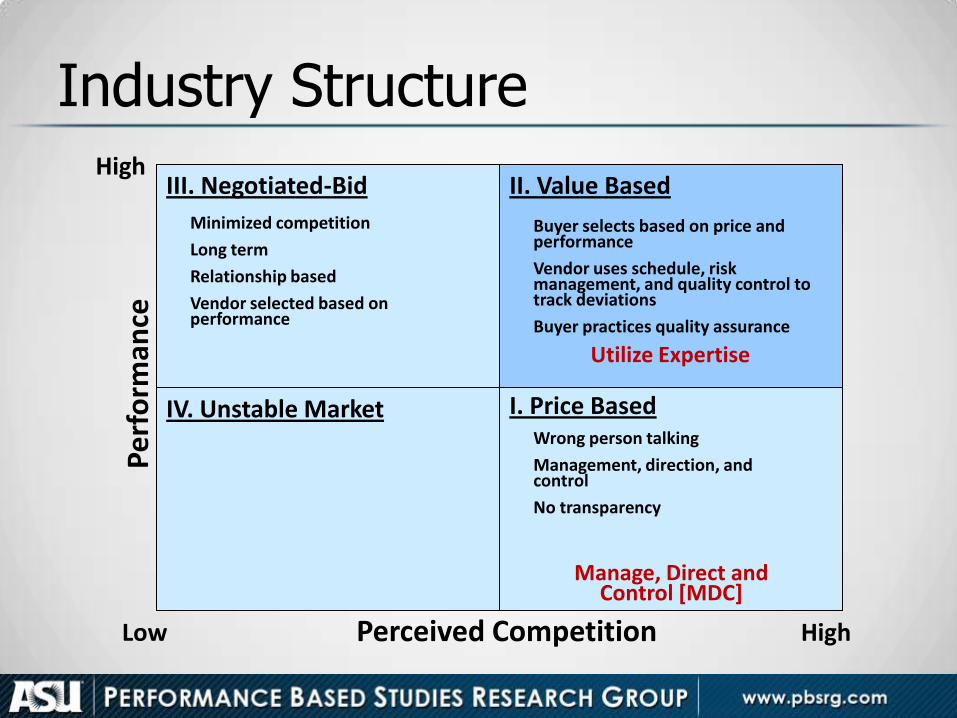
Industry Structure
High
I. Price Based
II. Value Based
IV. Unstable Market
III. Negotiated-Bid
Wrong person talking
Management, direction, and control
No transparency
Buyer selects based on price and performance
Vendor uses schedule, risk management, and quality control to track deviations
Buyer practices quality assurance
Perceived Competition
Pe
rfo
rman
ce
Low
High
Minimized competition
Long term
Relationship based
Vendor selected based on performance
Utilize Expertise
Manage, Direct and Control [MDC]
High
Low
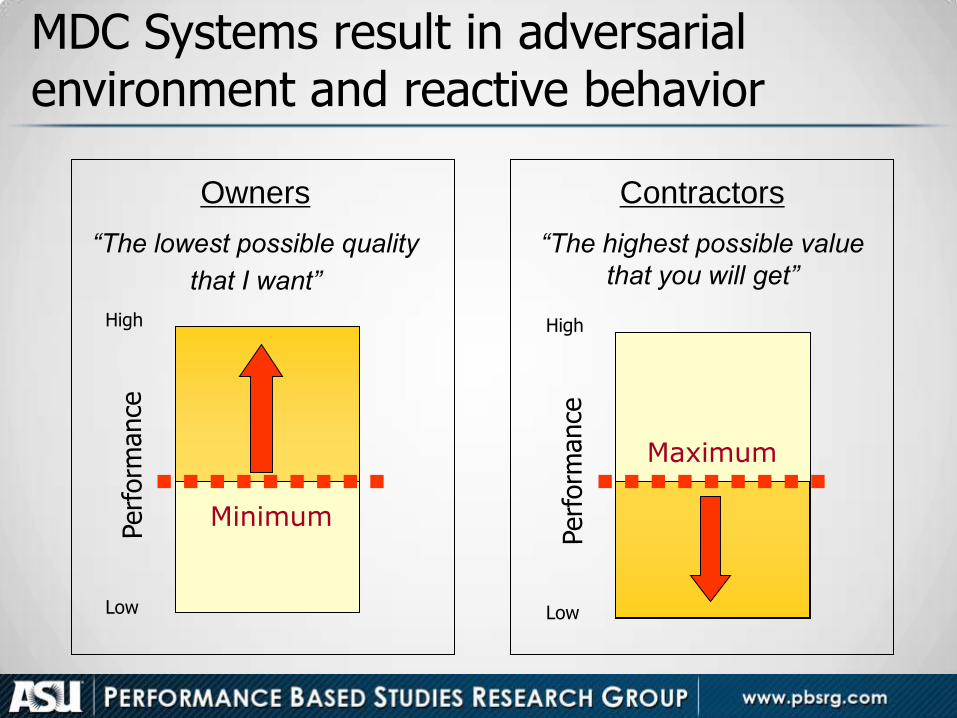
Owners
“The lowest possible quality
that I want”
Contractors
“The highest possible value
that you will get”
Minimum
MDC Systems result in adversarial environment and reactive behavior
High
Low
Maximum
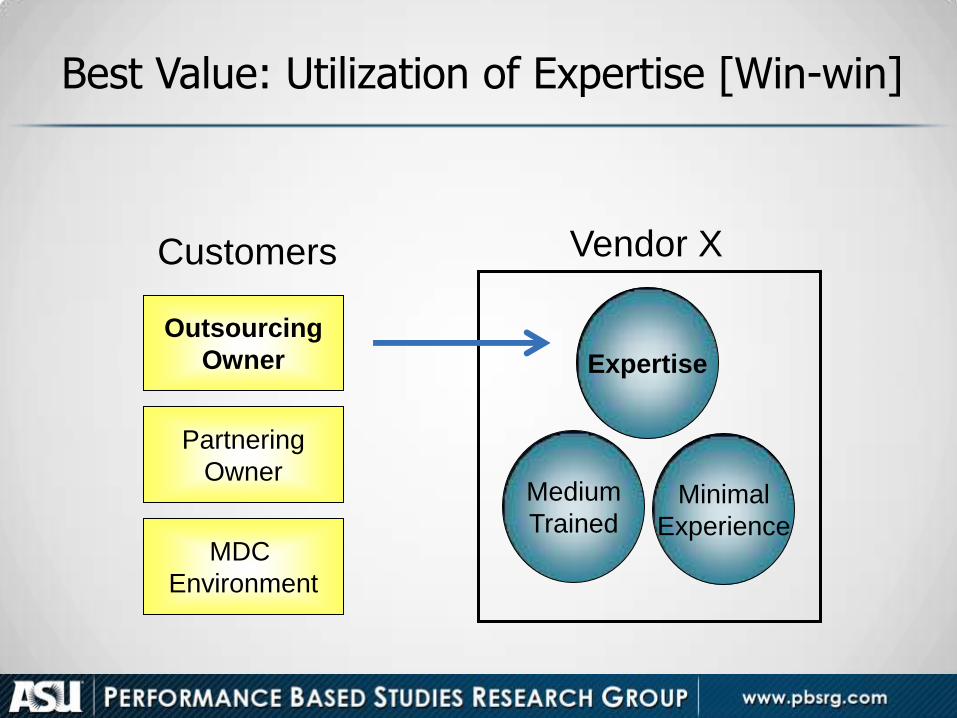
Best Value: Utilization of Expertise [Win-win]
Expertise
Medium
Trained
Vendor X Customers
Outsourcing
Owner
Partnering
Owner
MDC
Environment
Minimal
Experience
Decision Making by Non-Experts
• Should be minimized
• Increases risk
• Increases the need to trust each other
• Increases relationships
• Minimizes continuous improvement
19

20
Challenge: Minimize Decisions
• Decision Less Structure
• No management, direction and control (MDC) Approach (use expertise)
• Results
– Transparency
– Accountability
– Experience and expertise
– Detailed pre-planning
21
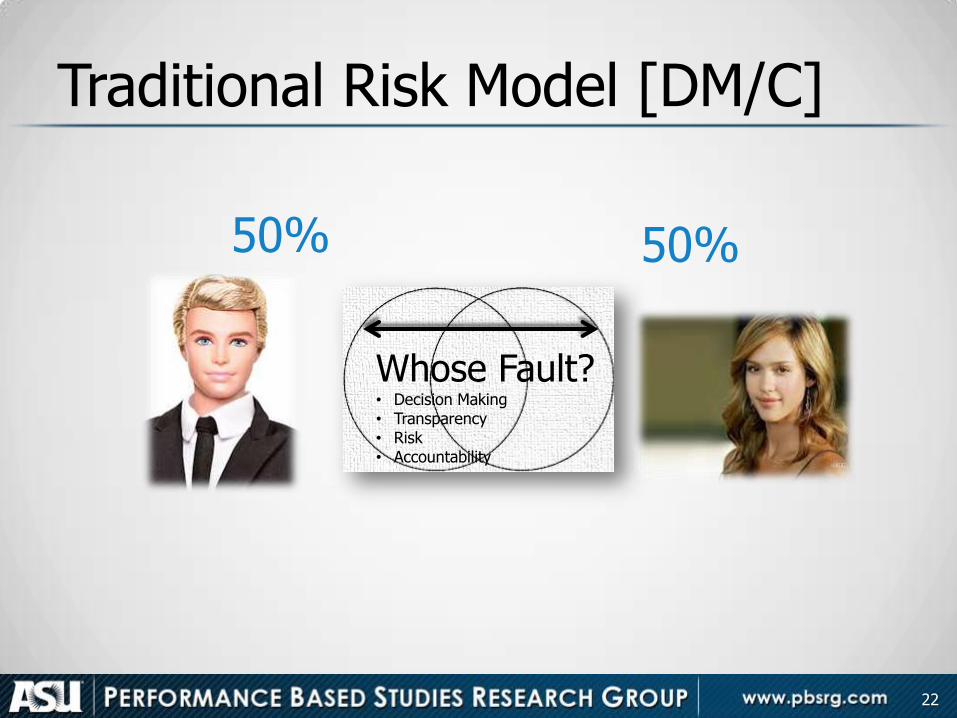
Traditional Risk Model [DM/C]
22
50% 50%
Whose Fault? • Decision Making • Transparency • Risk • Accountability
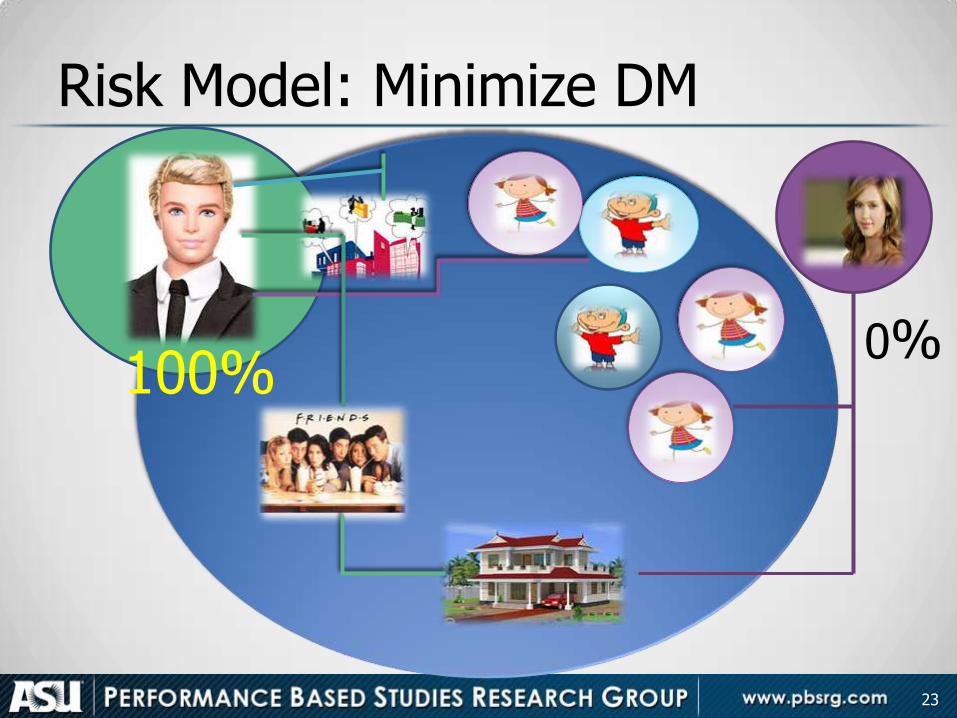
Risk Model: Minimize DM
23
100% 0%
“No control”
• Control and influence [form of control to alter final outcome] causes risk and transactions
• Decision making accompanies MDC
• Control is not used in the Best Value approach
• BV PIPS is different because there is no use of control
• Cannot override NL
24
Simplistic Approach
• Decision Making [No]
• Direction and control [No]
• Utilization of Expertise [Yes]
• How do you know expertise?
– see into future
– Simple
– Know why
25


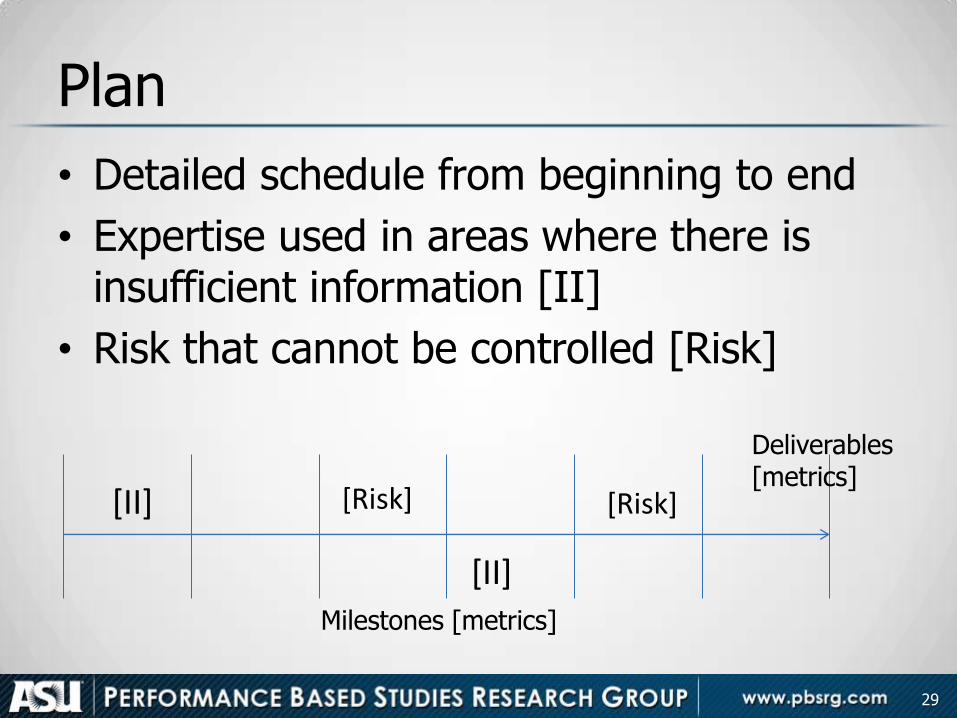
Plan
• Detailed schedule from beginning to end
• Expertise used in areas where there is insufficient information [II]
• Risk that cannot be controlled [Risk]
29
Deliverables [metrics]
Milestones [metrics]
[II]
[II]
[Risk] [Risk]
BV Approach Creates Transparency
• Simple
• Communicate in form of metrics
• Does not require “trust”
• Accountable
• Forces pre-planning
• Utilizes expertise
30
When to Use Best Value
• When the project is the most complex
• When the budget is critical
• When expertise is most needed
31
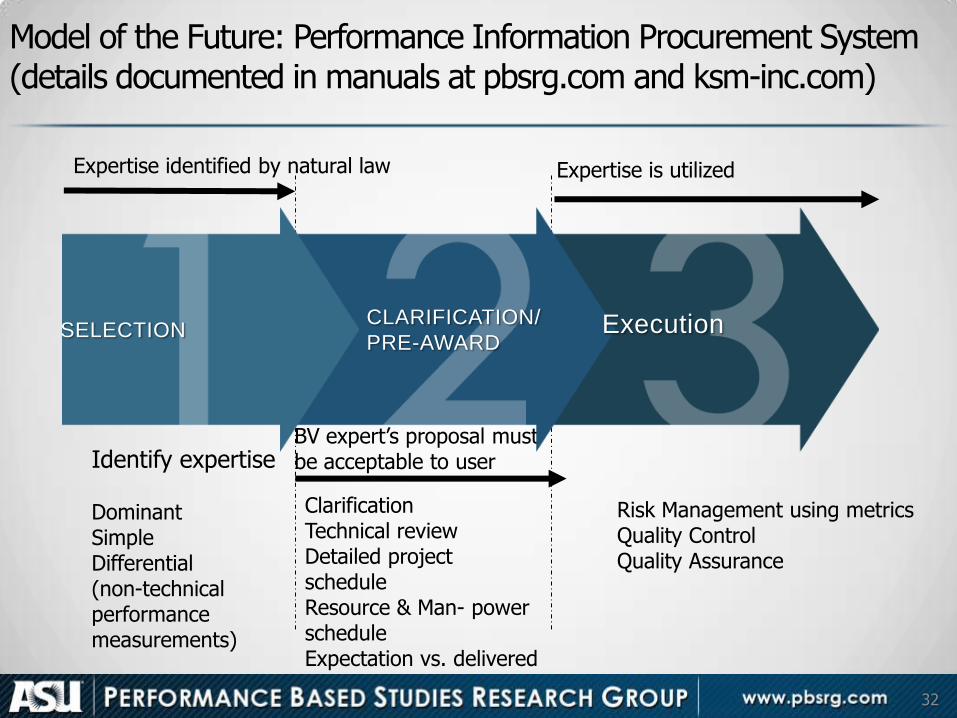
Model of the Future: Performance Information Procurement System (details documented in manuals at pbsrg.com and ksm-inc.com)
32
Expertise identified by natural law
BV expert’s proposal must be acceptable to user
Expertise is utilized
Identify expertise Dominant Simple Differential (non-technical performance measurements)
Clarification Technical review Detailed project schedule Resource & Man- power schedule Expectation vs. delivered
Risk Management using metrics Quality Control Quality Assurance
SELECTION CLARIFICATION/
PRE-AWARD Execution
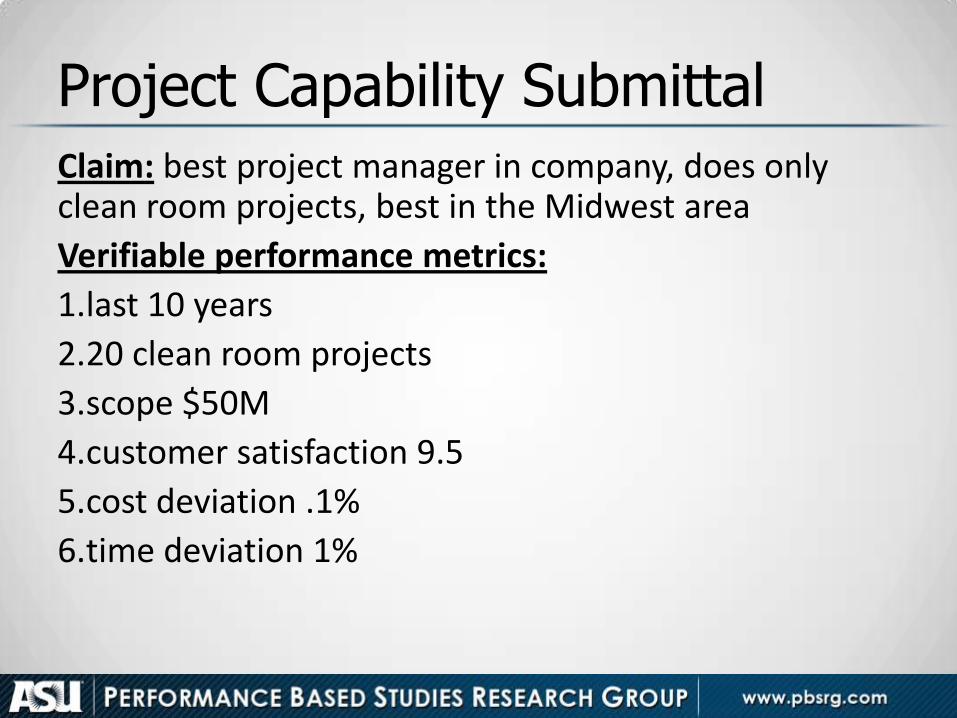
Project Capability Submittal
Claim: best project manager in company, does only clean room projects, best in the Midwest area
Verifiable performance metrics:
1.last 10 years
2.20 clean room projects
3.scope $50M
4.customer satisfaction 9.5
5.cost deviation .1%
6.time deviation 1%
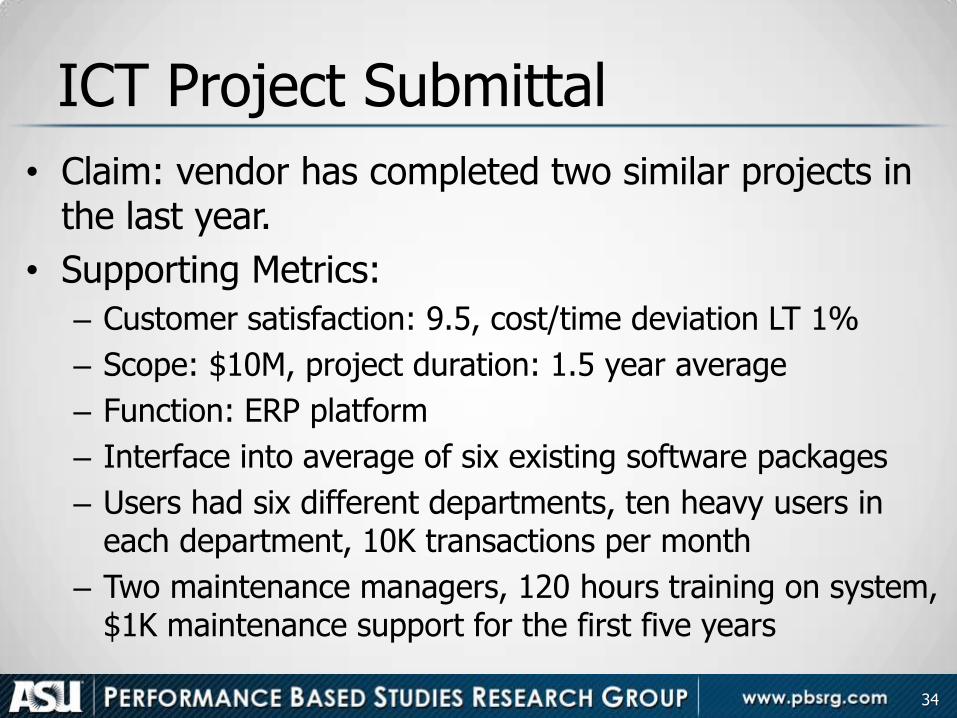
ICT Project Submittal
• Claim: vendor has completed two similar projects in the last year.
• Supporting Metrics:
– Customer satisfaction: 9.5, cost/time deviation LT 1%
– Scope: $10M, project duration: 1.5 year average
– Function: ERP platform
– Interface into average of six existing software packages
– Users had six different departments, ten heavy users in each department, 10K transactions per month
– Two maintenance managers, 120 hours training on system, $1K maintenance support for the first five years
34
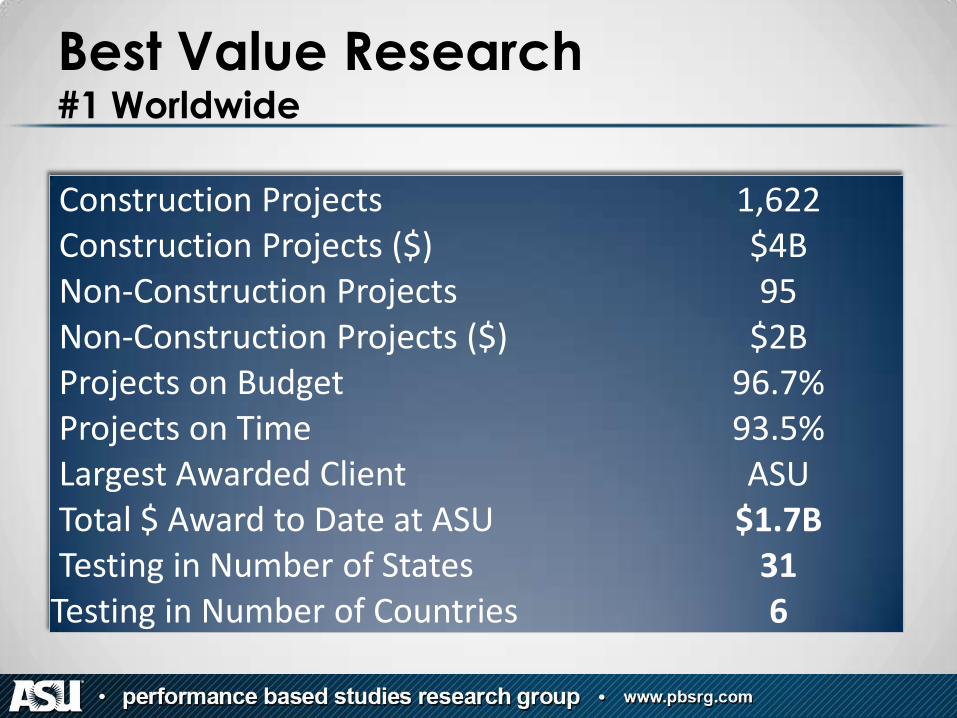
Best Value Research #1 Worldwide
Construction Projects 1,622 Construction Projects ($) $4B Non-Construction Projects 95 Non-Construction Projects ($) $2B Projects on Budget 96.7% Projects on Time 93.5% Largest Awarded Client ASU Total $ Award to Date at ASU $1.7B Testing in Number of States 31 Testing in Number of Countries 6
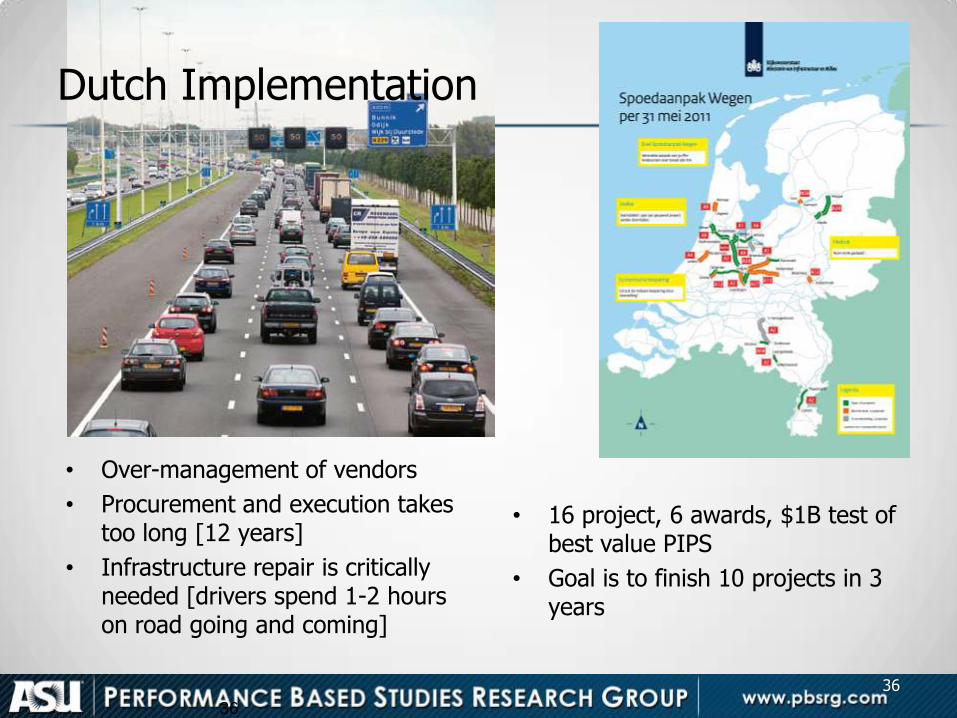
• Over-management of vendors
• Procurement and execution takes too long [12 years]
• Infrastructure repair is critically needed [drivers spend 1-2 hours on road going and coming]
• 16 project, 6 awards, $1B test of best value PIPS
• Goal is to finish 10 projects in 3 years
36
36
Dutch Implementation
37
37
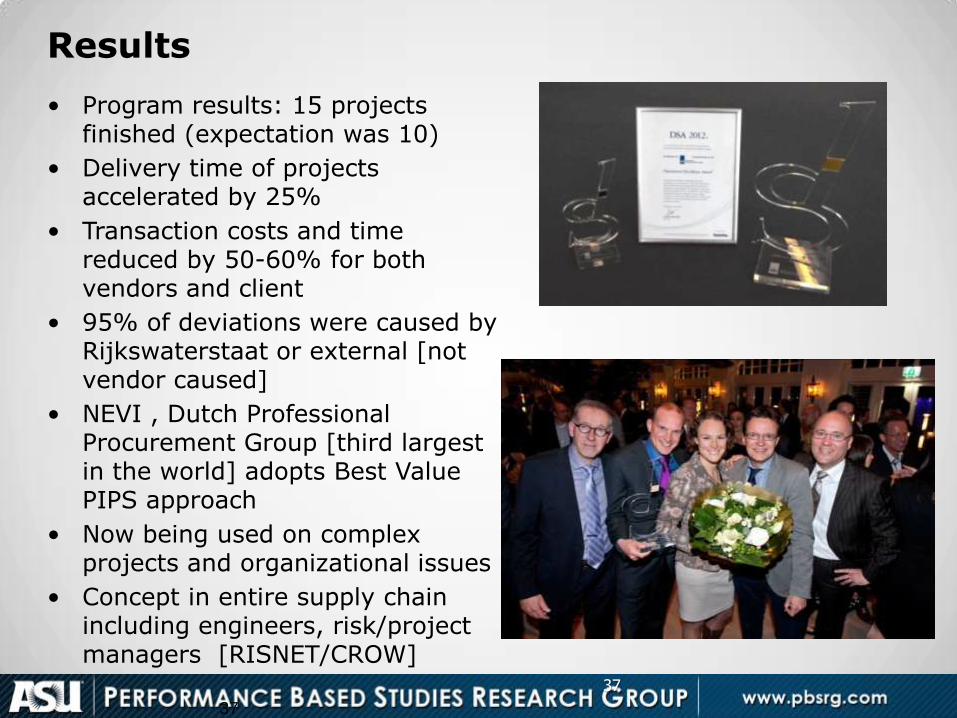
• Program results: 15 projects finished (expectation was 10)
• Delivery time of projects accelerated by 25%
• Transaction costs and time reduced by 50-60% for both vendors and client
• 95% of deviations were caused by Rijkswaterstaat or external [not vendor caused]
• NEVI , Dutch Professional Procurement Group [third largest in the world] adopts Best Value PIPS approach
• Now being used on complex projects and organizational issues
• Concept in entire supply chain including engineers, risk/project managers [RISNET/CROW]
Results

Best Value PIPS in Oklahoma
Steve Hagar
Central Purchasing Deputy Director
Licensed by ASU
Certified BV Expert
405-522-3369
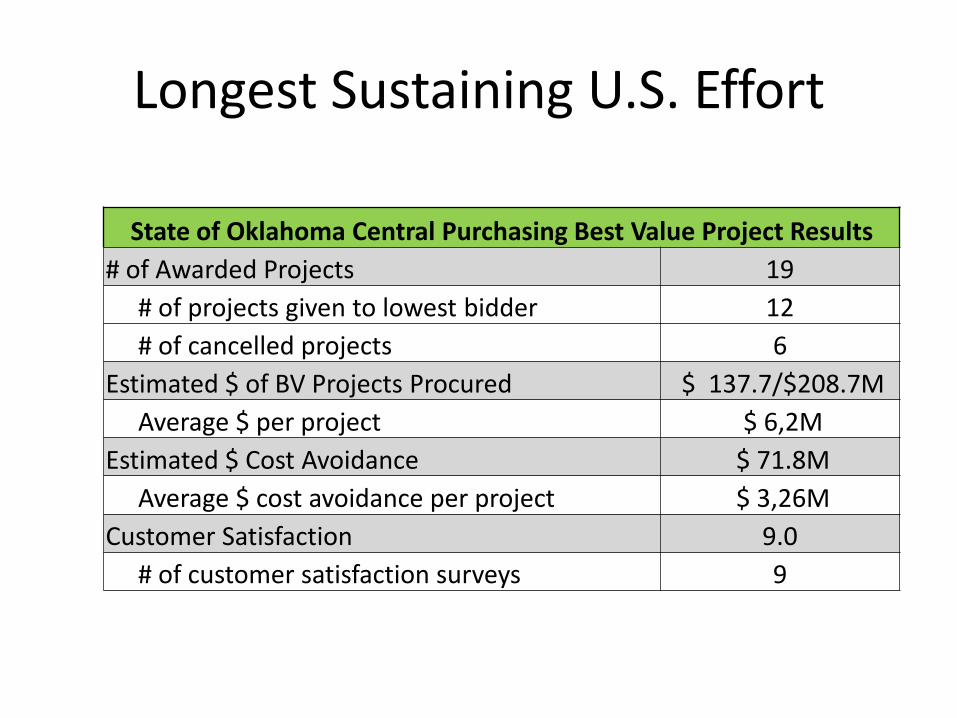
Longest Sustaining U.S. Effort
State of Oklahoma Central Purchasing Best Value Project Results
# of Awarded Projects 19
# of projects given to lowest bidder 12
# of cancelled projects 6
Estimated $ of BV Projects Procured $ 137.7/$208.7M
Average $ per project $ 6,2M
Estimated $ Cost Avoidance $ 71.8M
Average $ cost avoidance per project $ 3,26M
Customer Satisfaction 9.0
# of customer satisfaction surveys 9
Environment Environment
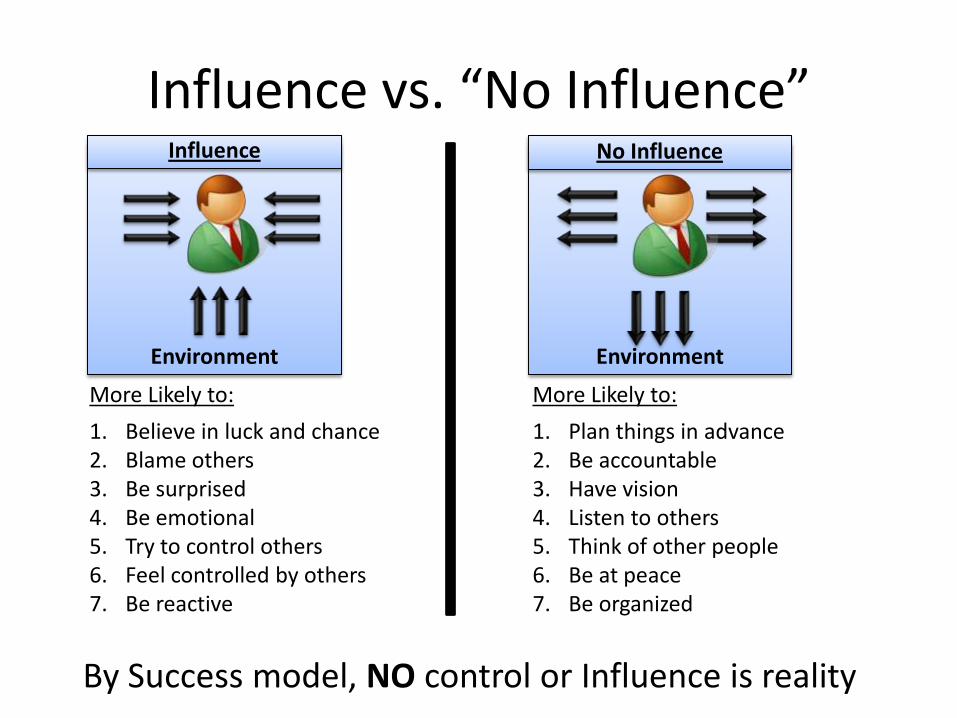
More Likely to:
1. Believe in luck and chance 2. Blame others 3. Be surprised 4. Be emotional 5. Try to control others 6. Feel controlled by others 7. Be reactive
More Likely to:
1. Plan things in advance 2. Be accountable 3. Have vision 4. Listen to others 5. Think of other people 6. Be at peace 7. Be organized
Influence No Influence
Influence vs. “No Influence”
By Success model, NO control or Influence is reality
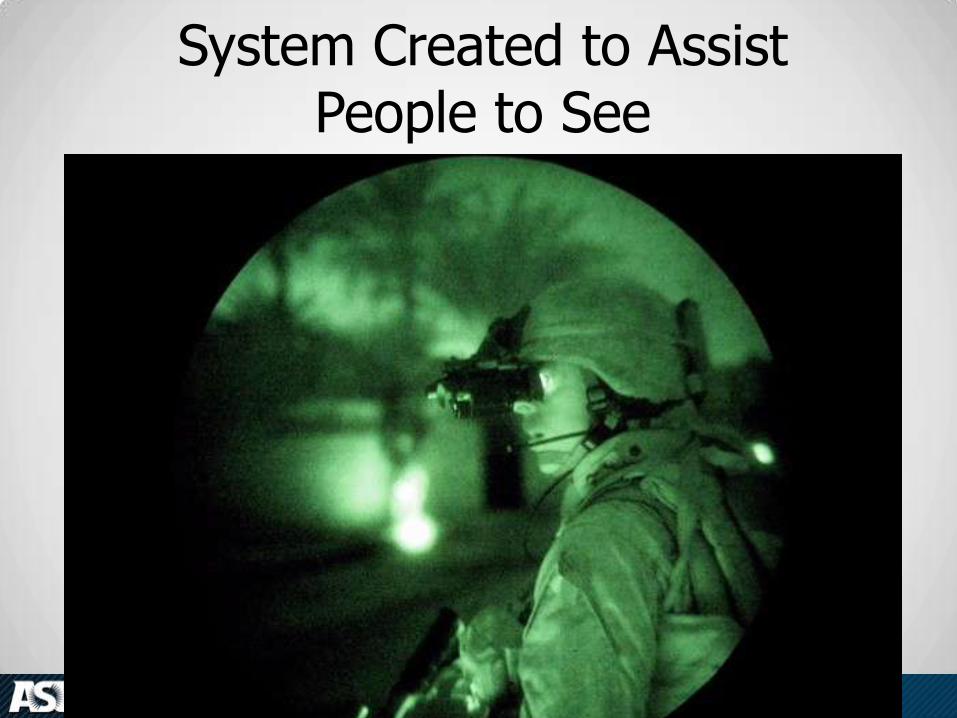
System Created to Assist People to See
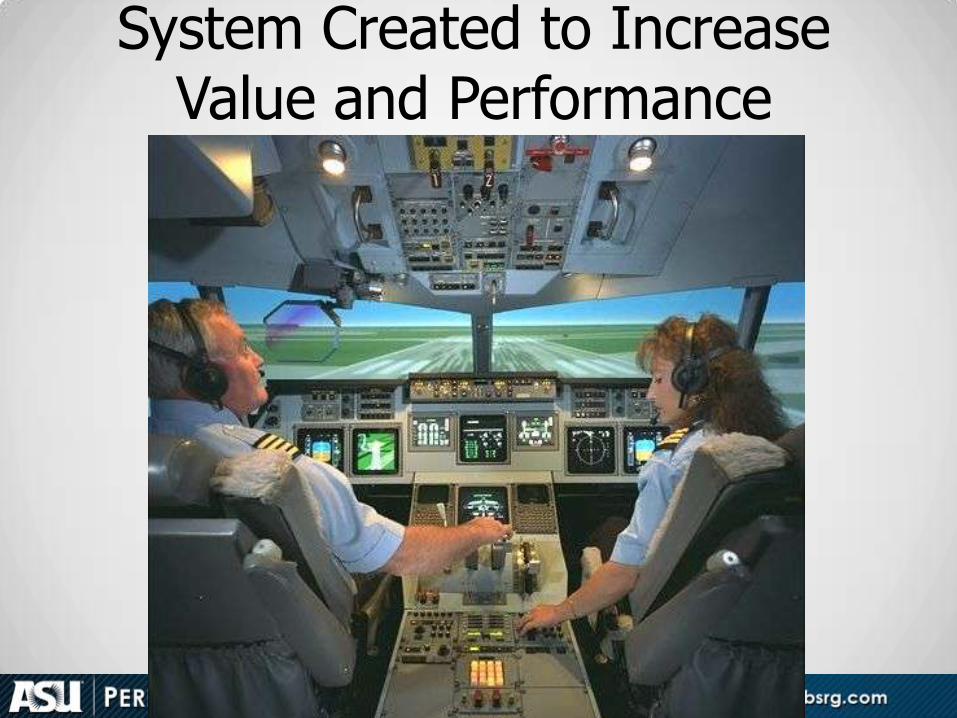
System Created to Increase Value and Performance
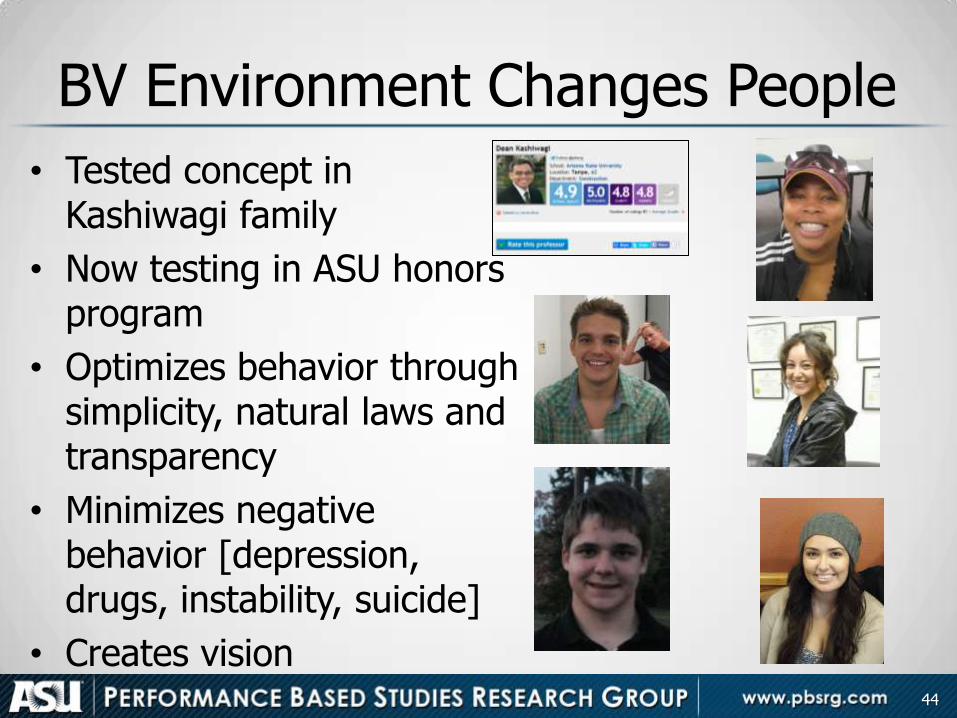
BV Environment Changes People
• Tested concept in Kashiwagi family
• Now testing in ASU honors program
• Optimizes behavior through simplicity, natural laws and transparency
• Minimizes negative behavior [depression, drugs, instability, suicide]
• Creates vision
44
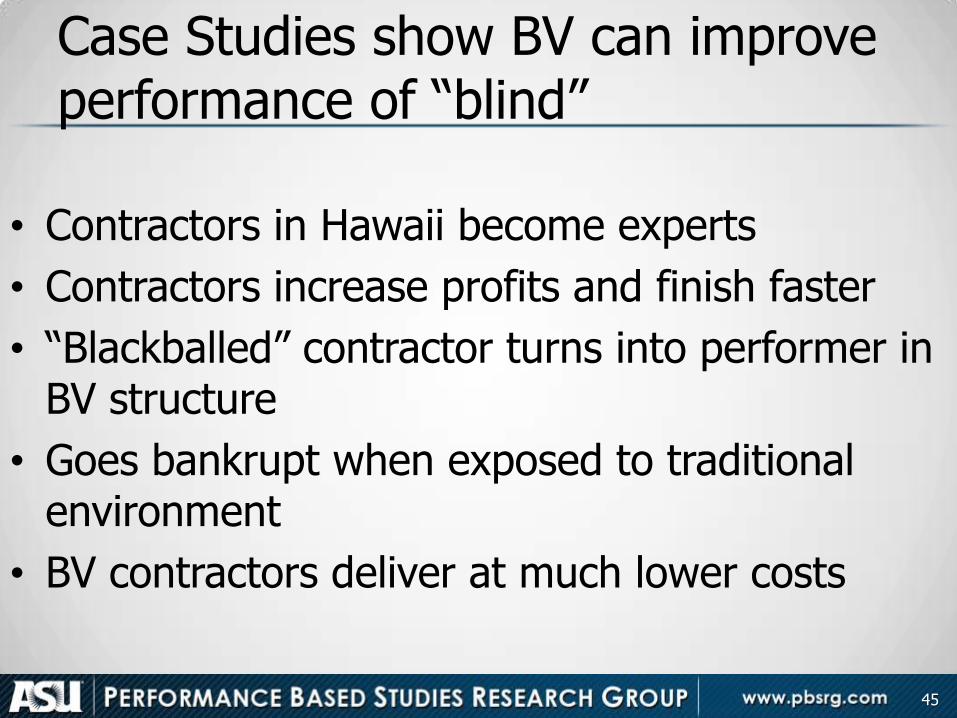
Case Studies show BV can improve performance of “blind”
• Contractors in Hawaii become experts
• Contractors increase profits and finish faster
• “Blackballed” contractor turns into performer in BV structure
• Goes bankrupt when exposed to traditional environment
• BV contractors deliver at much lower costs
45
Best Value
• Identify the expert
• Help the expert be better
• Get the client to let the expert do their project
46
CL Performance at ASU
47
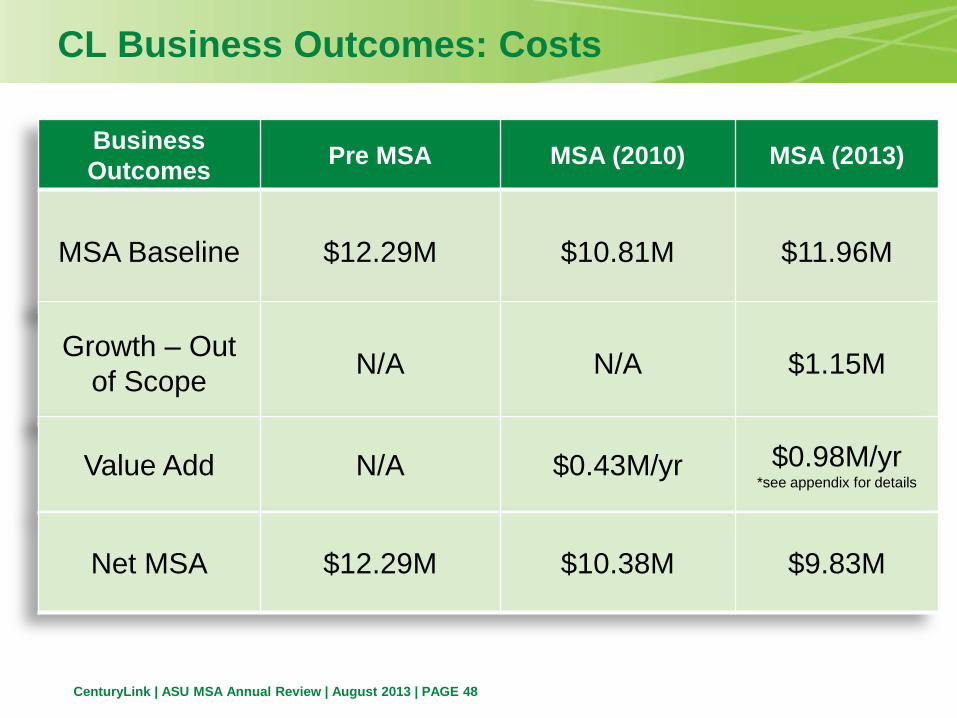
CenturyLink | ASU MSA Annual Review | August 2013 | PAGE 48
Business
Outcomes Pre MSA MSA (2010) MSA (2013)
MSA Baseline $12.29M $10.81M $11.96M
CL Business Outcomes: Costs
Growth – Out
of Scope N/A N/A $1.15M
Value Add N/A $0.43M/yr $0.98M/yr *see appendix for details
Net MSA $12.29M $10.38M $9.83M
CenturyLink | ASU MSA Annual Review | August 2013 | PAGE 49
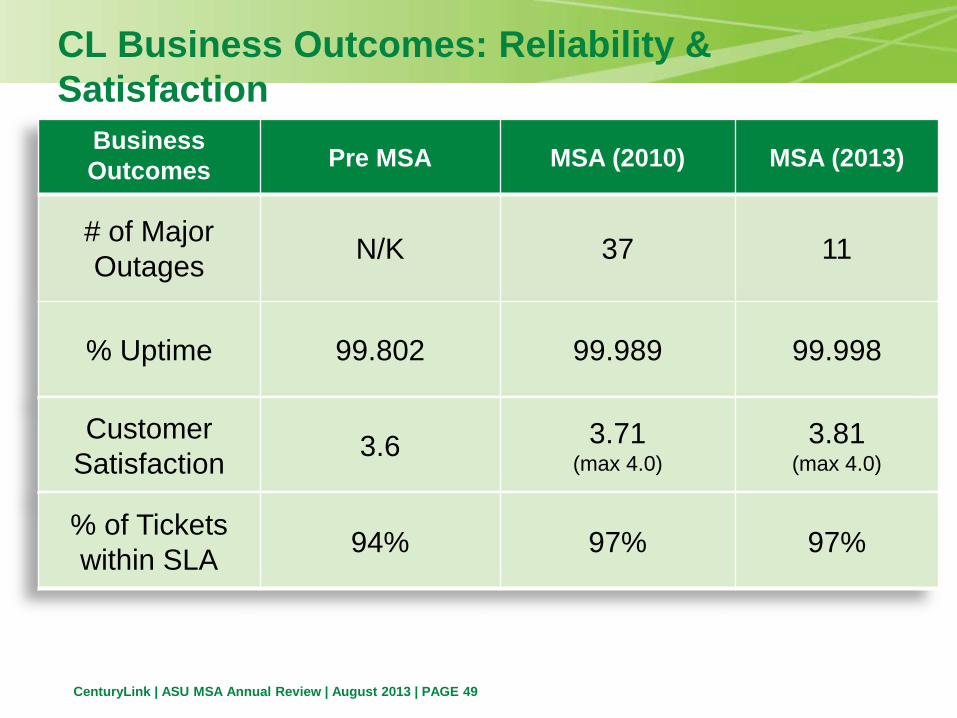
CL Business Outcomes: Reliability &
Satisfaction
Business
Outcomes Pre MSA MSA (2010) MSA (2013)
# of Major
Outages N/K 37 11
% Uptime 99.802 99.989 99.998
Customer
Satisfaction 3.6 3.71
(max 4.0)
3.81 (max 4.0)
% of Tickets
within SLA 94% 97% 97%
CenturyLink | ASU MSA Annual Review | August 2013 | PAGE 50
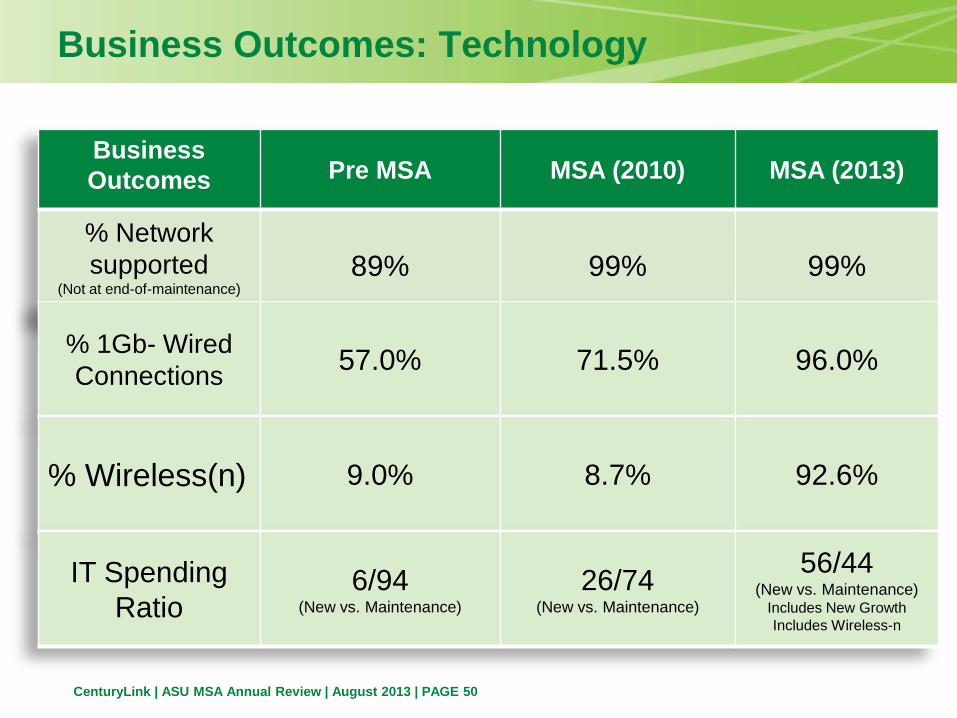
Business Outcomes: Technology
Business
Outcomes Pre MSA MSA (2010) MSA (2013)
% Network
supported (Not at end-of-maintenance)
89% 99% 99%
% 1Gb- Wired
Connections 57.0% 71.5% 96.0%
% Wireless(n) 9.0% 8.7% 92.6%
IT Spending
Ratio 6/94
(New vs. Maintenance)
26/74 (New vs. Maintenance)
56/44 (New vs. Maintenance)
Includes New Growth
Includes Wireless-n
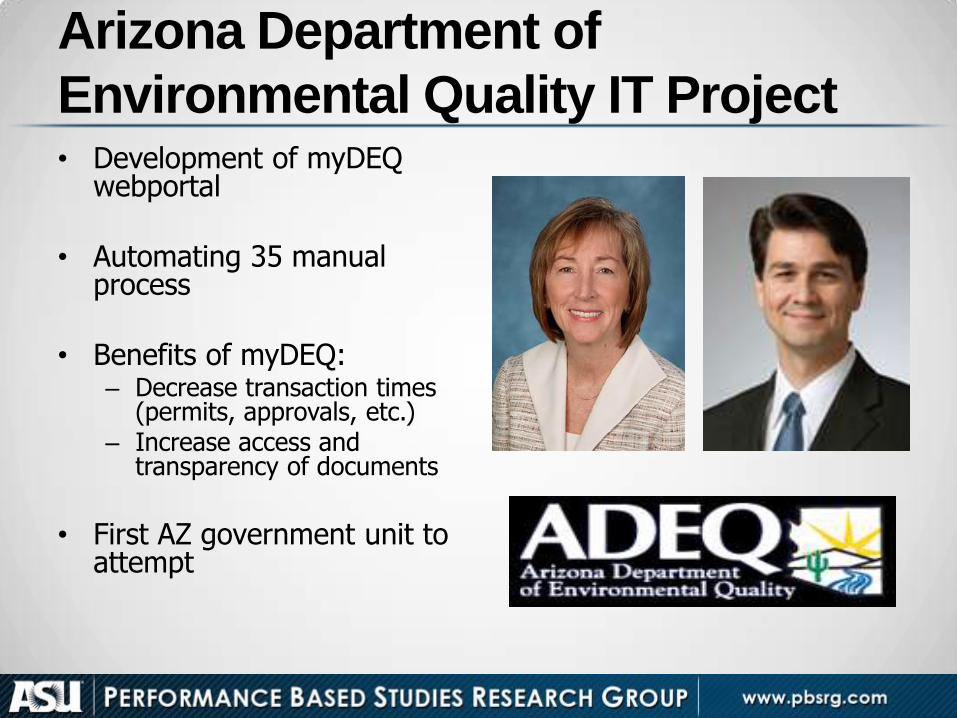
Arizona Department of
Environmental Quality IT Project • Development of myDEQ
webportal
• Automating 35 manual process
• Benefits of myDEQ: – Decrease transaction times
(permits, approvals, etc.) – Increase access and
transparency of documents
• First AZ government unit to
attempt
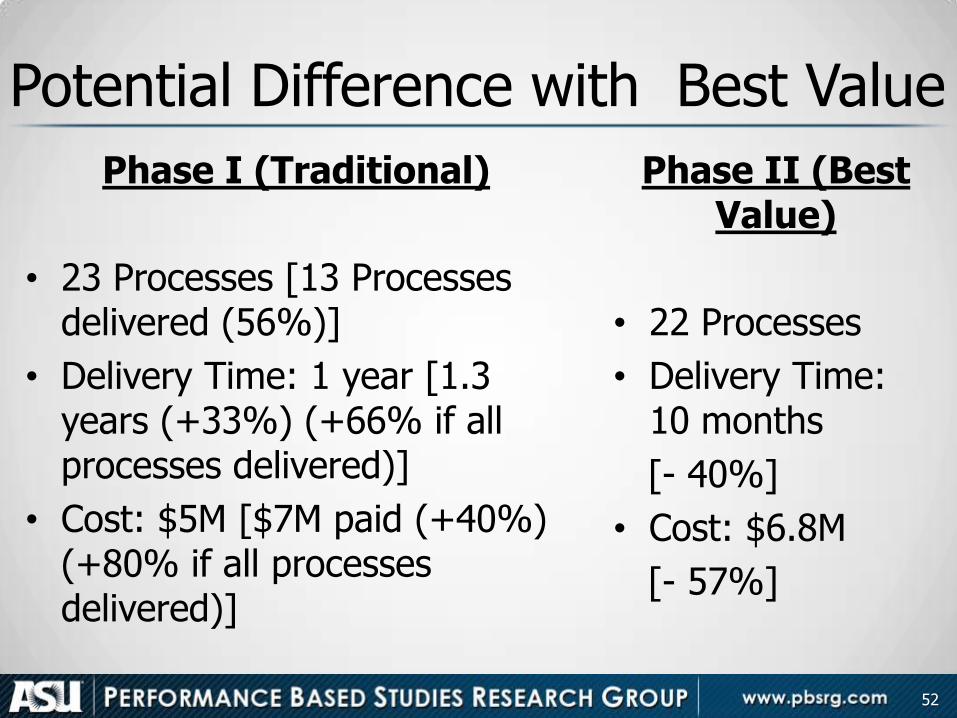
Potential Difference with Best Value
Phase I (Traditional)
• 23 Processes [13 Processes delivered (56%)]
• Delivery Time: 1 year [1.3 years (+33%) (+66% if all processes delivered)]
• Cost: $5M [$7M paid (+40%) (+80% if all processes delivered)]
Phase II (Best Value)
• 22 Processes
• Delivery Time: 10 months
[- 40%]
• Cost: $6.8M
[- 57%]
52
Case Study: SBP BV Characteristics
• No MDC: No management positions
• Voluntary Expert Lead Engineer/team
• Lead expert interfaces with customers
• Risk Definition/Mitigation Model
• Efficiency/Effectiveness/Performance Metrics
• Best interest of the client (business model case studies)
53
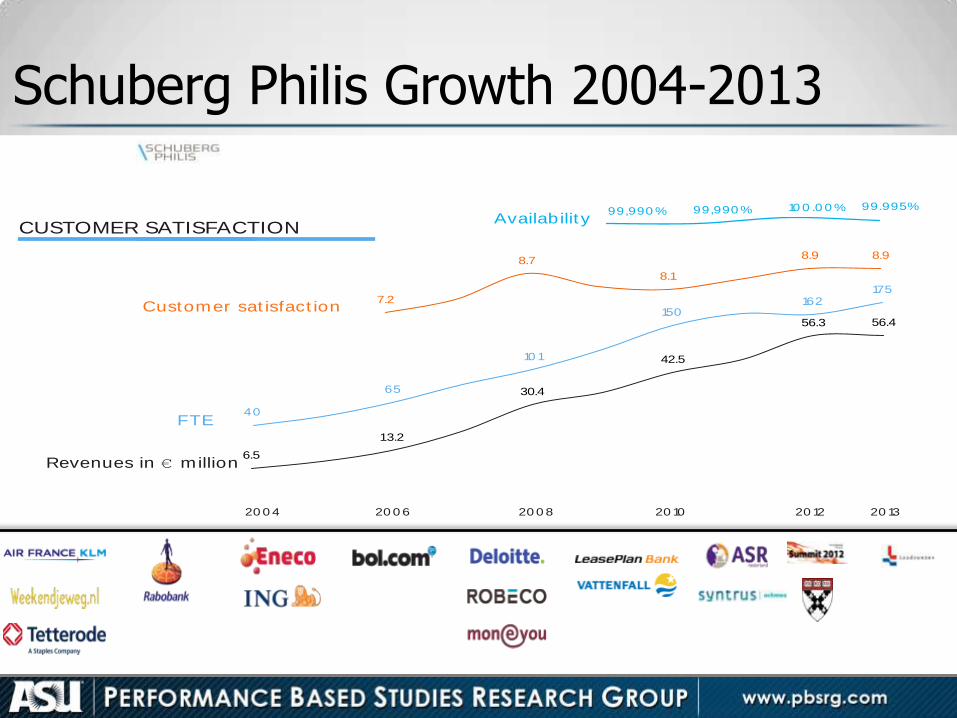
Schuberg Philis Growth 2004-2013
40
65
10 1
150162
175
CUSTOMER SATISFACTION
20 0 4 20 0 6 20 0 8 20 10 20 12 20 13
7.2
8.7
8.1
8.9 8.9
Customer sat isfact ion
6.5
13.2
30.4
42.5
56.3 56.4
Revenues in € million
FTE
99.995%99,990 % 99,990 % 10 0 .0 0 %Availabilit y
7.27.7
8.78.2
8.18.5
8.9 8.8
2004 2005 2006 2007 2008 2009 2010 2011 2012 2013
40 5065
85
101
118
149
170180
170
Customer Satisfaction (Scale 1 - 10)
FTE
Revenues
(in € 1.000)
6.59.0
13.2
20.2
30.4
35.0
42.5
47.5
56.051.0
2004 2005 2006 2007 2008 2009 2010 2011 2012 2013
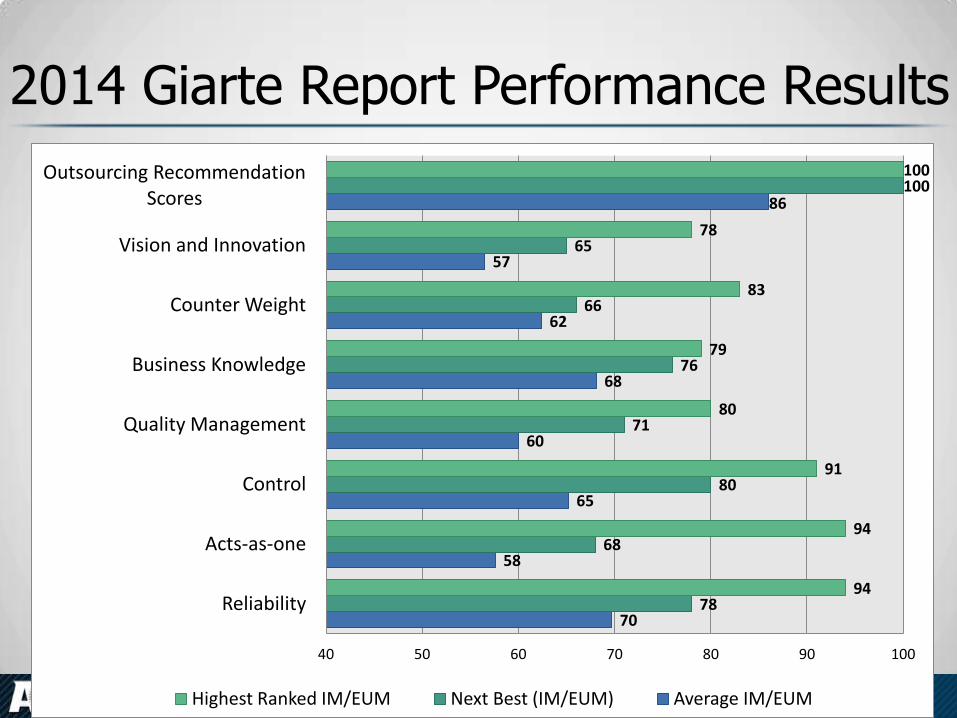
2014 Giarte Report Performance Results
70
58
65
60
68
62
57
86
78
68
80
71
76
66
65
100
94
94
91
80
79
83
78
100
40 50 60 70 80 90 100
Reliability
Acts-as-one
Control
Quality Management
Business Knowledge
Counter Weight
Vision and Innovation
Outsourcing Recommendation Scores
Highest Ranked IM/EUM Next Best (IM/EUM) Average IM/EUM
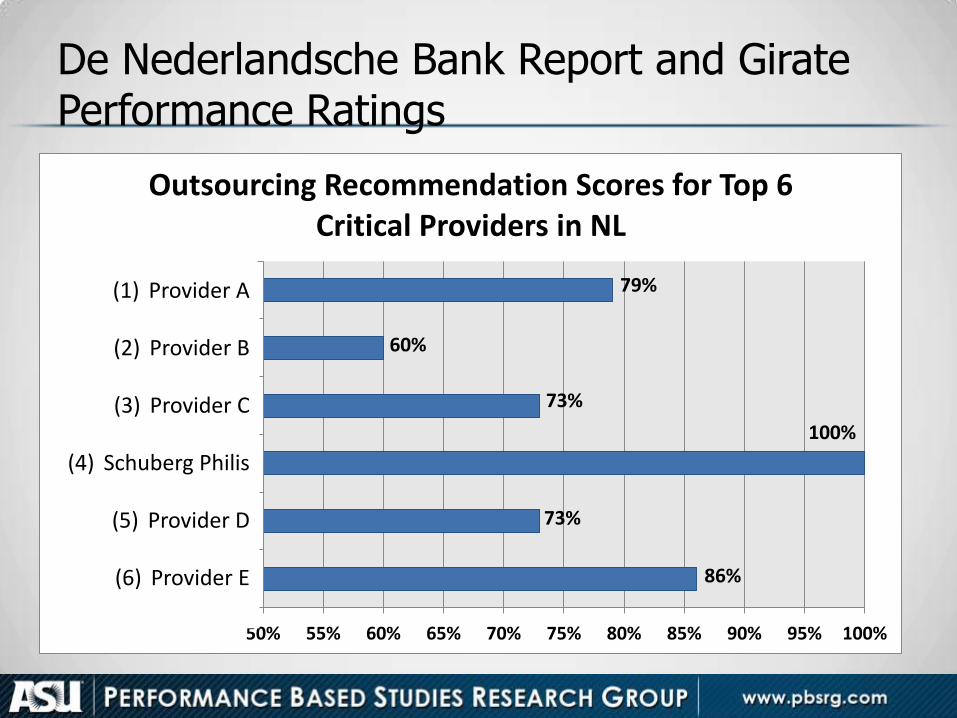
De Nederlandsche Bank Report and Girate Performance Ratings
86%
73%
100%
73%
60%
79%
50% 55% 60% 65% 70% 75% 80% 85% 90% 95% 100%
(6) HP Enterprise Services
(5) IBM
(4) Schuberg Philis
(3) Capgemini
(2) ATOS
(1) KPN
Outsourcing Recommendation Scores for Top 6 Critical Providers in NL
(1) Provider A
(2) Provider B
(3) Provider C
(4) Schuberg Philis
(5) Provider D
(6) Provider E
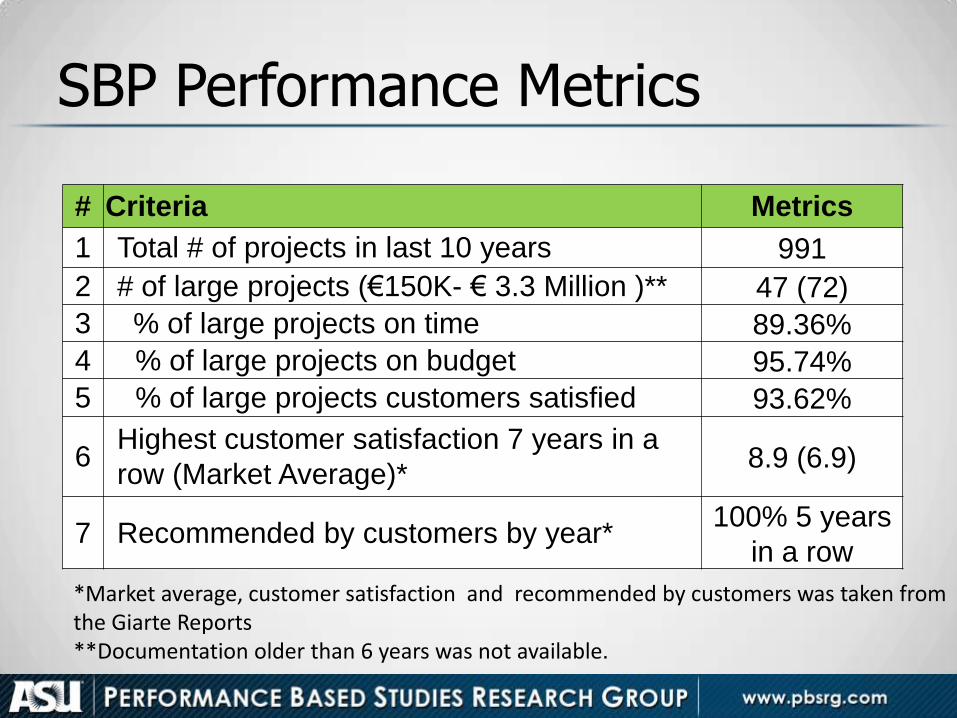
SBP Performance Metrics
# Criteria Metrics
1 Total # of projects in last 10 years 991
2 # of large projects (€150K- € 3.3 Million )** 47 (72)
3 % of large projects on time 89.36%
4 % of large projects on budget 95.74%
5 % of large projects customers satisfied 93.62%
6 Highest customer satisfaction 7 years in a
row (Market Average)* 8.9 (6.9)
7 Recommended by customers by year* 100% 5 years
in a row
*Market average, customer satisfaction and recommended by customers was taken from the Giarte Reports **Documentation older than 6 years was not available.
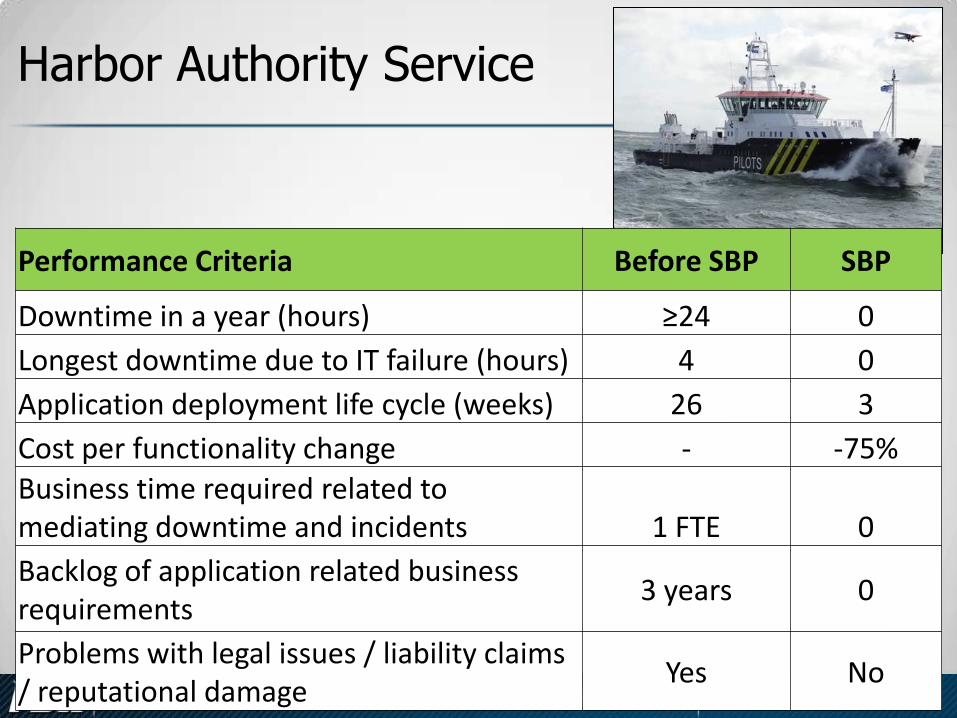
Harbor Authority Service
Performance Criteria Before SBP SBP
Downtime in a year (hours) ≥24 0
Longest downtime due to IT failure (hours) 4 0
Application deployment life cycle (weeks) 26 3
Cost per functionality change - -75%
Business time required related to mediating downtime and incidents 1 FTE 0
Backlog of application related business requirements
3 years 0
Problems with legal issues / liability claims / reputational damage
Yes No
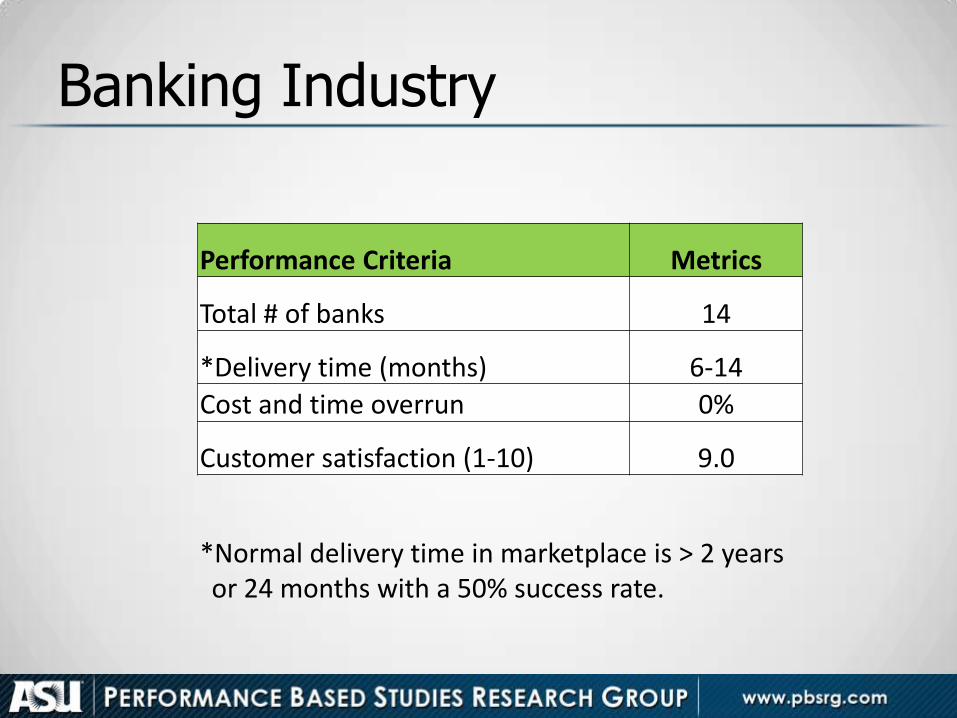
Banking Industry
Performance Criteria Metrics
Total # of banks 14
*Delivery time (months) 6-14
Cost and time overrun 0%
Customer satisfaction (1-10) 9.0
*Normal delivery time in marketplace is > 2 years or 24 months with a 50% success rate.
Potential Failure of ICT Projects
• ICT projects failure is caused by a lack of ICT expertise
• Failure to utilize expertise causes failure
• Failure of the expert to know from the end to the beginning utilizing non-technical metrics causes clients to get more involved in project details
60
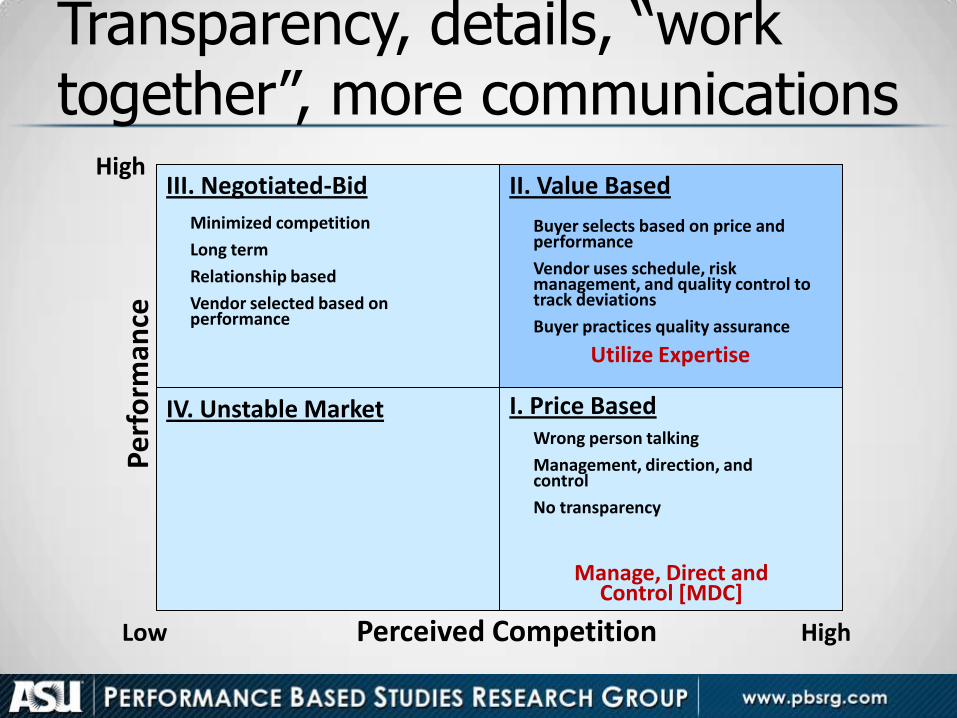
Transparency, details, “work together”, more communications
High
I. Price Based
II. Value Based
IV. Unstable Market
III. Negotiated-Bid
Wrong person talking
Management, direction, and control
No transparency
Buyer selects based on price and performance
Vendor uses schedule, risk management, and quality control to track deviations
Buyer practices quality assurance
Perceived Competition
Pe
rfo
rman
ce
Low
High
Minimized competition
Long term
Relationship based
Vendor selected based on performance
Utilize Expertise
Manage, Direct and Control [MDC]
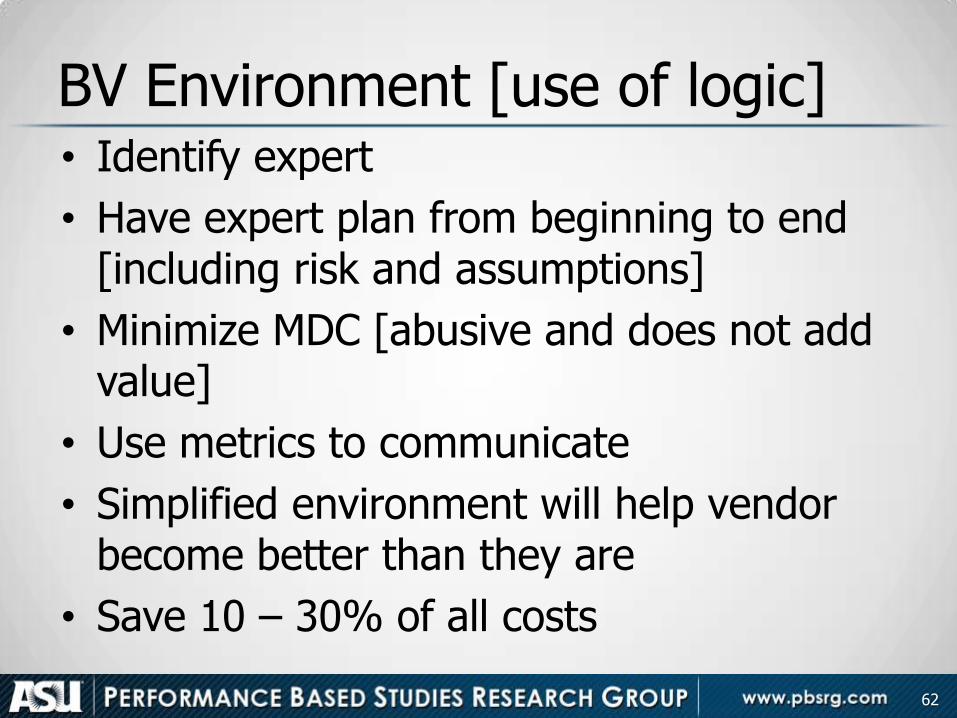
BV Environment [use of logic] • Identify expert
• Have expert plan from beginning to end [including risk and assumptions]
• Minimize MDC [abusive and does not add value]
• Use metrics to communicate
• Simplified environment will help vendor become better than they are
• Save 10 – 30% of all costs
62
For Further Information, drop a business card
Linked in [email protected] YouTube Pbsrg.com ksmleadership.com Jan 11 -15, 2015 Tempe, AZ 2015 Best Value Education and Training Best Value Netherlands A+ Certified Group Delft Research Program Sicco Santema
• Paper of BV model • Manuals • Further education
Recommended