1Q FY22Performance ReviewMay 27, 2021
© Copyright 2021 Dell Inc.2
DisclaimerNON-GAAP FINANCIAL MEASURES
This presentation includes information about non-GAAP revenue, non-GAAP gross margin, non-GAAP operating expenses, non-GAAP selling, general, and administrative expenses, non-GAAP research and development expenses, non-GAAP operating income, non-GAAP interest and other, net, non-GAAP income tax, non-GAAP net income, non-GAAP net income attributable to non-controlling interests, non-GAAP net income attributable to Dell Technologies Inc. – basic, non-GAAP net income attributable to Dell Technologies Inc. – diluted, non-GAAP earnings per share attributable to Dell Technologies Inc. – basic, non-GAAP earnings per share attributable to Dell Technologies Inc. – diluted, EBITDA, adjusted EBITDA, free cash flow, and free cash flow, excluding VMware, before impact from DFS related items (collectively the “non-GAAP financial measures”), which are not measurements of financial performance prepared in accordance with U.S. generally accepted accounting principles. We have provided a reconciliation of the non-GAAP measures to the most directly comparable GAAP measures in the slides captioned “Supplemental non-GAAP measures.”
SPECIAL NOTE ON FORWARD LOOKING STATEMENTS
Statements in this presentation that relate to future results and events are forward-looking statements and are based on Dell Technologies' current expectations. In some cases, you can identify these statements by such forward-looking words as “anticipate,” “believe,” “could,” “estimate,” “expect,” “intend,” “confidence,” “may,” “plan,” “potential,” “should,” “will” and “would,” or similar expressions. Actual results and events in future periods may differ materially from those expressed or implied by these forward-looking statements because of a number of risks, uncertainties and other factors, including those discussed in Dell Technologies’ periodic reports filed with the Securities and Exchange Commission. Dell Technologies assumes no obligation to update its forward-looking statements.
© Copyright 2021 Dell Inc.3
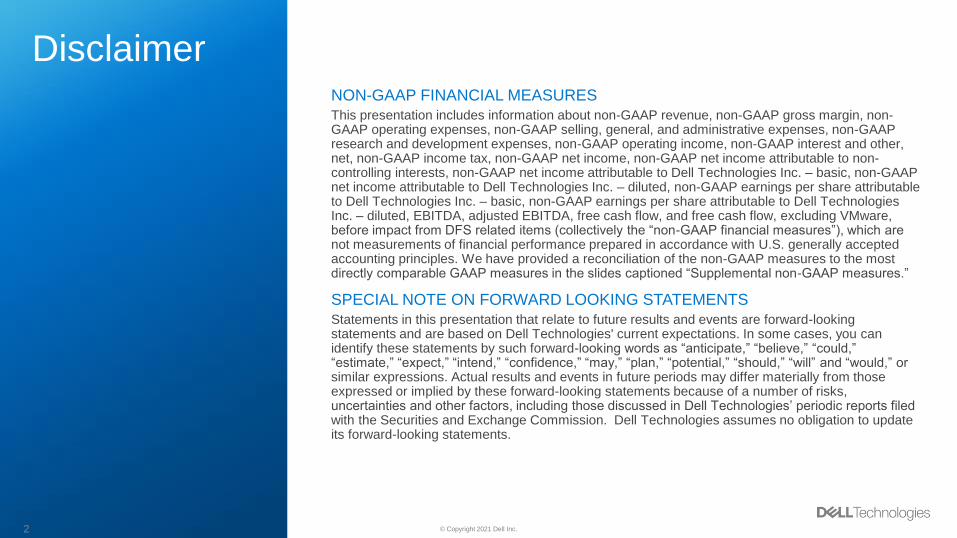
We are the essential technology companyDemonstrating our purpose and commitment to our stakeholders today and tomorrow
PURPOSE To create technologies that drive human progress.
VISION To become the most essential technology company for the data era.
STRATEGYFuel growth by modernizing our core infrastructure and PC businesses and focusing on
high priority areas including hybrid and private cloud, edge, telecom and APEX as-a-
Service.
Customers Shareholders Team Members Partners Community
© Copyright 2021 Dell Inc.4
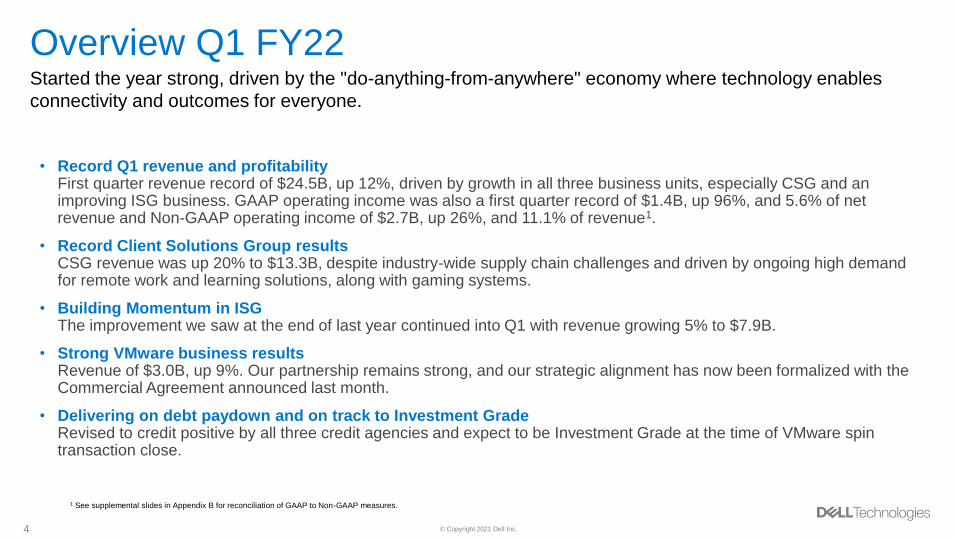
Overview Q1 FY22Started the year strong, driven by the "do-anything-from-anywhere" economy where technology enables
connectivity and outcomes for everyone.
• Record Q1 revenue and profitabilityFirst quarter revenue record of $24.5B, up 12%, driven by growth in all three business units, especially CSG and an improving ISG business. GAAP operating income was also a first quarter record of $1.4B, up 96%, and 5.6% of net revenue and Non-GAAP operating income of $2.7B, up 26%, and 11.1% of revenue1.
• Record Client Solutions Group resultsCSG revenue was up 20% to $13.3B, despite industry-wide supply chain challenges and driven by ongoing high demand for remote work and learning solutions, along with gaming systems.
• Building Momentum in ISGThe improvement we saw at the end of last year continued into Q1 with revenue growing 5% to $7.9B.
• Strong VMware business resultsRevenue of $3.0B, up 9%. Our partnership remains strong, and our strategic alignment has now been formalized with the Commercial Agreement announced last month.
• Delivering on debt paydown and on track to Investment GradeRevised to credit positive by all three credit agencies and expect to be Investment Grade at the time of VMware spin transaction close.
1 See supplemental slides in Appendix B for reconciliation of GAAP to Non-GAAP measures.
© Copyright 2021 Dell Inc.5
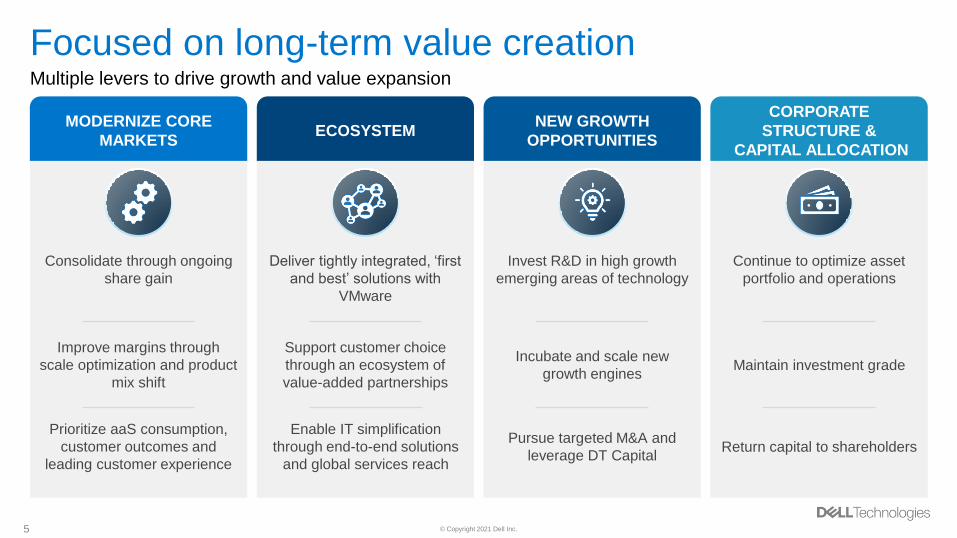
Focused on long-term value creationMultiple levers to drive growth and value expansion
Consolidate through ongoing
share gain
MODERNIZE CORE
MARKETSECOSYSTEM
NEW GROWTH
OPPORTUNITIES
CORPORATE
STRUCTURE &
CAPITAL ALLOCATION
Improve margins through
scale optimization and product
mix shift
Prioritize aaS consumption,
customer outcomes and
leading customer experience
Deliver tightly integrated, ‘first
and best’ solutions with
VMware
Invest R&D in high growth
emerging areas of technology
Continue to optimize asset
portfolio and operations
Support customer choice
through an ecosystem of
value-added partnerships
Incubate and scale new
growth engines
Pursue targeted M&A and
leverage DT Capital
Maintain investment grade
Return capital to shareholders
Enable IT simplification
through end-to-end solutions
and global services reach
© Copyright 2021 Dell Inc.6
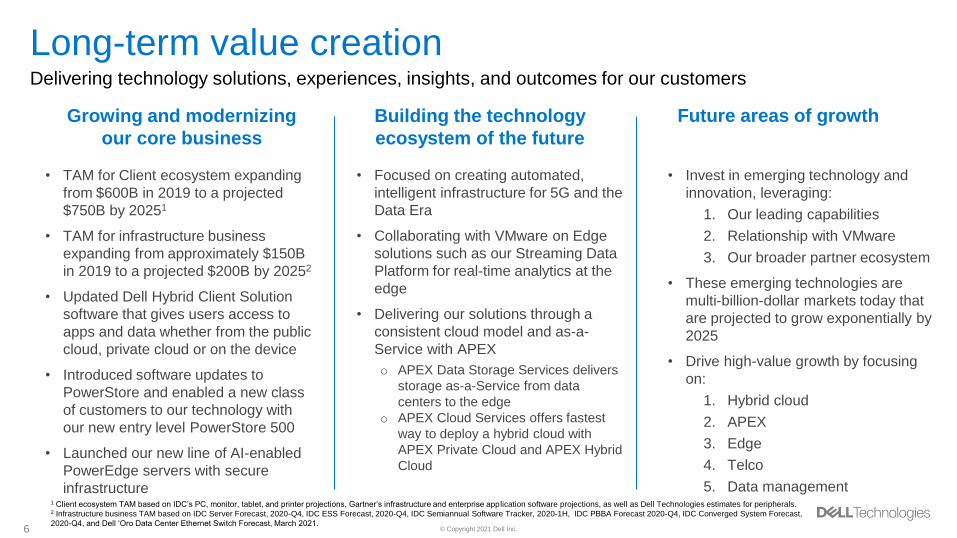
Long-term value creationDelivering technology solutions, experiences, insights, and outcomes for our customers
• TAM for Client ecosystem expanding
from $600B in 2019 to a projected
$750B by 20251
• TAM for infrastructure business
expanding from approximately $150B
in 2019 to a projected $200B by 20252
• Updated Dell Hybrid Client Solution
software that gives users access to
apps and data whether from the public
cloud, private cloud or on the device
• Introduced software updates to
PowerStore and enabled a new class
of customers to our technology with
our new entry level PowerStore 500
• Launched our new line of AI-enabled
PowerEdge servers with secure
infrastructure
Growing and modernizing
our core business
Building the technology
ecosystem of the future
Future areas of growth
• Invest in emerging technology and
innovation, leveraging:
1. Our leading capabilities
2. Relationship with VMware
3. Our broader partner ecosystem
• These emerging technologies are
multi-billion-dollar markets today that
are projected to grow exponentially by
2025
• Drive high-value growth by focusing
on:
1. Hybrid cloud
2. APEX
3. Edge
4. Telco
5. Data management
• Focused on creating automated,
intelligent infrastructure for 5G and the
Data Era
• Collaborating with VMware on Edge
solutions such as our Streaming Data
Platform for real-time analytics at the
edge
• Delivering our solutions through a
consistent cloud model and as-a-
Service with APEX
o APEX Data Storage Services delivers
storage as-a-Service from data
centers to the edge
o APEX Cloud Services offers fastest
way to deploy a hybrid cloud with
APEX Private Cloud and APEX Hybrid
Cloud
1 Client ecosystem TAM based on IDC’s PC, monitor, tablet, and printer projections, Gartner’s infrastructure and enterprise app lication software projections, as well as Dell Technologies estimates for peripherals.2 Infrastructure business TAM based on IDC Server Forecast, 2020-Q4, IDC ESS Forecast, 2020-Q4, IDC Semiannual Software Tracker, 2020-1H, IDC PBBA Forecast 2020-Q4, IDC Converged System Forecast,
2020-Q4, and Dell ‘Oro Data Center Ethernet Switch Forecast, March 2021.
© Copyright 2021 Dell Inc.7
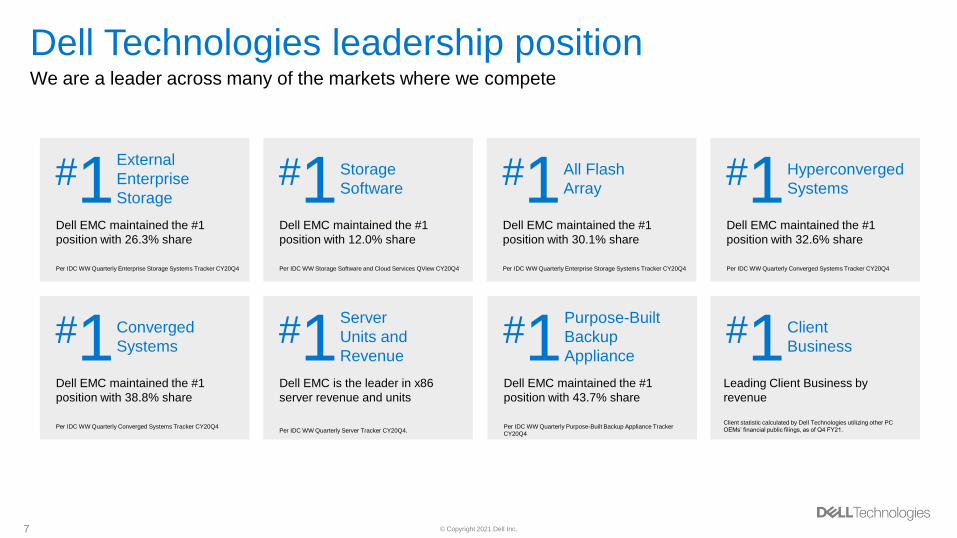
Dell Technologies leadership positionWe are a leader across many of the markets where we compete
All Flash
Array#1Dell EMC maintained the #1
position with 30.1% share
Per IDC WW Quarterly Enterprise Storage Systems Tracker CY20Q4
Storage
Software#1Dell EMC maintained the #1
position with 12.0% share
Per IDC WW Storage Software and Cloud Services QView CY20Q4
External
Enterprise
Storage#1Dell EMC maintained the #1
position with 26.3% share
Per IDC WW Quarterly Enterprise Storage Systems Tracker CY20Q4
Purpose-Built
Backup
Appliance #1Dell EMC maintained the #1
position with 43.7% share
Per IDC WW Quarterly Purpose-Built Backup Appliance Tracker
CY20Q4
Client
Business#1
Server
Units and
Revenue#1Dell EMC is the leader in x86
server revenue and units
Per IDC WW Quarterly Server Tracker CY20Q4.
Converged
Systems#1Dell EMC maintained the #1
position with 38.8% share
Per IDC WW Quarterly Converged Systems Tracker CY20Q4
Leading Client Business by
revenue
Client statistic calculated by Dell Technologies utilizing other PC
OEMs’ financial public filings, as of Q4 FY21.
Hyperconverged
Systems#1Dell EMC maintained the #1
position with 32.6% share
Per IDC WW Quarterly Converged Systems Tracker CY20Q4
© Copyright 2021 Dell Inc.8
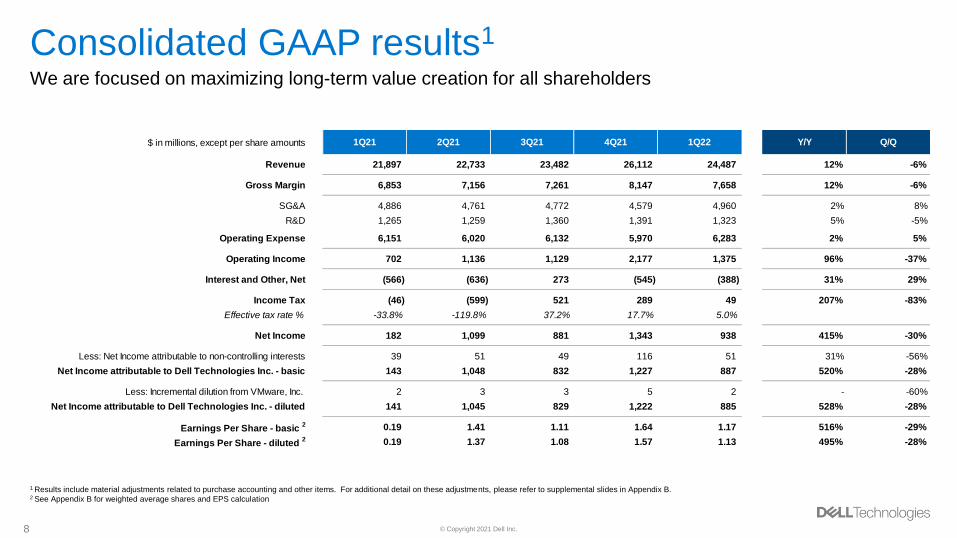
Consolidated GAAP results1
We are focused on maximizing long-term value creation for all shareholders
1 Results include material adjustments related to purchase accounting and other items. For additional detail on these adjustments, please refer to supplemental slides in Appendix B.2 See Appendix B for weighted average shares and EPS calculation
$ in millions, except per share amounts 1Q21 2Q21 3Q21 4Q21 1Q22 Y/Y Q/Q
Revenue 21,897 22,733 23,482 26,112 24,487 12% -6%
Gross Margin 6,853 7,156 7,261 8,147 7,658 12% -6%
SG&A 4,886 4,761 4,772 4,579 4,960 2% 8%
R&D 1,265 1,259 1,360 1,391 1,323 5% -5%
Operating Expense 6,151 6,020 6,132 5,970 6,283 2% 5%
Operating Income 702 1,136 1,129 2,177 1,375 96% -37%
Interest and Other, Net (566) (636) 273 (545) (388) 31% 29%
Income Tax (46) (599) 521 289 49 207% -83%
Effective tax rate % -33.8% -119.8% 37.2% 17.7% 5.0%
Net Income 182 1,099 881 1,343 938 415% -30%
Less: Net Income attributable to non-controlling interests 39 51 49 116 51 31% -56%
Net Income attributable to Dell Technologies Inc. - basic 143 1,048 832 1,227 887 520% -28%
Less: Incremental dilution from VMware, Inc. 2 3 3 5 2 - -60%
Net Income attributable to Dell Technologies Inc. - diluted 141 1,045 829 1,222 885 528% -28%
Earnings Per Share - basic 2 0.19 1.41 1.11 1.64 1.17 516% -29%
Earnings Per Share - diluted 2 0.19 1.37 1.08 1.57 1.13 495% -28%
© Copyright 2021 Dell Inc.9
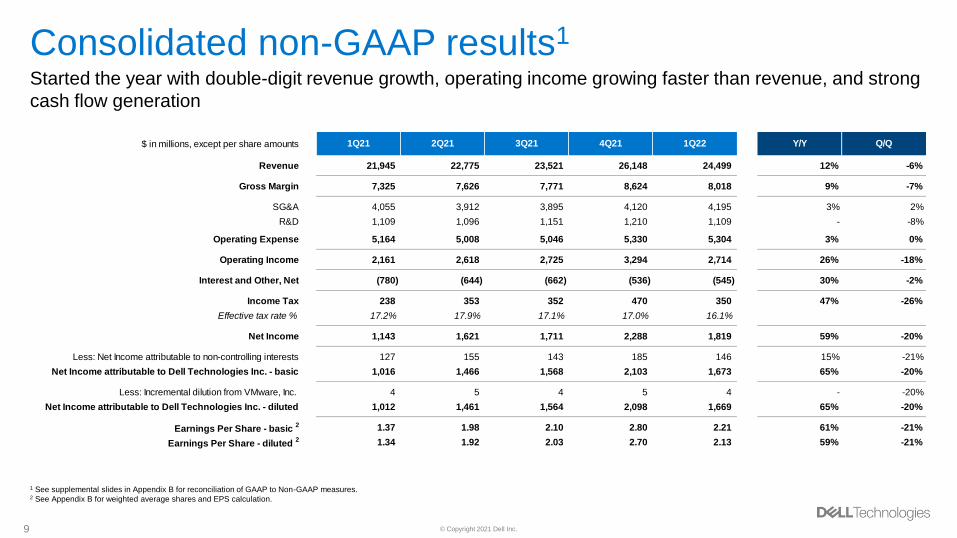
Consolidated non-GAAP results1
Started the year with double-digit revenue growth, operating income growing faster than revenue, and strong
cash flow generation
1 See supplemental slides in Appendix B for reconciliation of GAAP to Non-GAAP measures.2 See Appendix B for weighted average shares and EPS calculation.
$ in millions, except per share amounts 1Q21 2Q21 3Q21 4Q21 1Q22 Y/Y Q/Q
Revenue 21,945 22,775 23,521 26,148 24,499 12% -6%
Gross Margin 7,325 7,626 7,771 8,624 8,018 9% -7%
SG&A 4,055 3,912 3,895 4,120 4,195 3% 2%
R&D 1,109 1,096 1,151 1,210 1,109 - -8%
Operating Expense 5,164 5,008 5,046 5,330 5,304 3% 0%
Operating Income 2,161 2,618 2,725 3,294 2,714 26% -18%
Interest and Other, Net (780) (644) (662) (536) (545) 30% -2%
Income Tax 238 353 352 470 350 47% -26%
Effective tax rate % 17.2% 17.9% 17.1% 17.0% 16.1%
Net Income 1,143 1,621 1,711 2,288 1,819 59% -20%
Less: Net Income attributable to non-controlling interests 127 155 143 185 146 15% -21%
Net Income attributable to Dell Technologies Inc. - basic 1,016 1,466 1,568 2,103 1,673 65% -20%
Less: Incremental dilution from VMware, Inc. 4 5 4 5 4 - -20%
Net Income attributable to Dell Technologies Inc. - diluted 1,012 1,461 1,564 2,098 1,669 65% -20%
Earnings Per Share - basic 2 1.37 1.98 2.10 2.80 2.21 61% -21%
Earnings Per Share - diluted 2 1.34 1.92 2.03 2.70 2.13 59% -21%
© Copyright 2021 Dell Inc.10
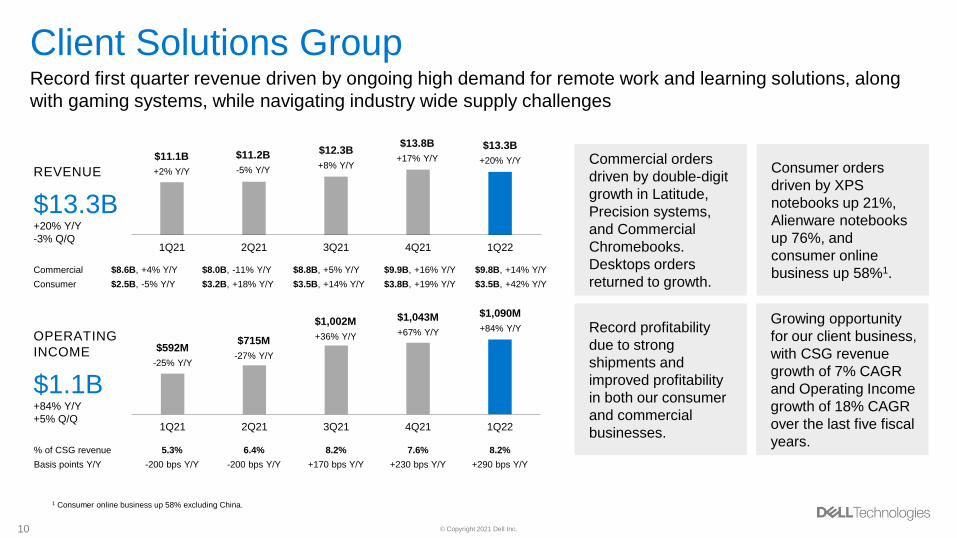
Client Solutions GroupRecord first quarter revenue driven by ongoing high demand for remote work and learning solutions, along
with gaming systems, while navigating industry wide supply challenges
Commercial orders
driven by double-digit
growth in Latitude,
Precision systems,
and Commercial
Chromebooks.
Desktops orders
returned to growth.
Consumer orders
driven by XPS
notebooks up 21%,
Alienware notebooks
up 76%, and
consumer online
business up 58%1.
Record profitability
due to strong
shipments and
improved profitability
in both our consumer
and commercial
businesses.
Growing opportunity
for our client business,
with CSG revenue
growth of 7% CAGR
and Operating Income
growth of 18% CAGR
over the last five fiscal
years.
REVENUE
$13.3B+20% Y/Y
-3% Q/Q
OPERATING
INCOME
$1.1B+84% Y/Y
+5% Q/Q
$8.6B, +4% Y/Y
$2.5B, -5% Y/Y
$8.0B, -11% Y/Y
$3.2B, +18% Y/Y
$8.8B, +5% Y/Y
$3.5B, +14% Y/Y
$9.9B, +16% Y/Y
$3.8B, +19% Y/Y
$9.8B, +14% Y/Y
$3.5B, +42% Y/Y
5.3%
-200 bps Y/Y
6.4%
-200 bps Y/Y
8.2%
+170 bps Y/Y
7.6%
+230 bps Y/Y
8.2%
+290 bps Y/Y
1Q21 2Q21 3Q21 4Q21 1Q22
$12.3B
+8% Y/Y
$13.8B
+17% Y/Y
$13.3B
+20% Y/Y$11.1B
+2% Y/Y
1Q21 2Q21 3Q21 4Q21 1Q22
$1,002M
+36% Y/Y
$1,043M
+67% Y/Y
$1,090M
+84% Y/Y
$592M
-25% Y/Y
$11.2B
-5% Y/Y
$715M
-27% Y/Y
% of CSG revenue
Basis points Y/Y
Commercial
Consumer
1 Consumer online business up 58% excluding China.
© Copyright 2021 Dell Inc.11
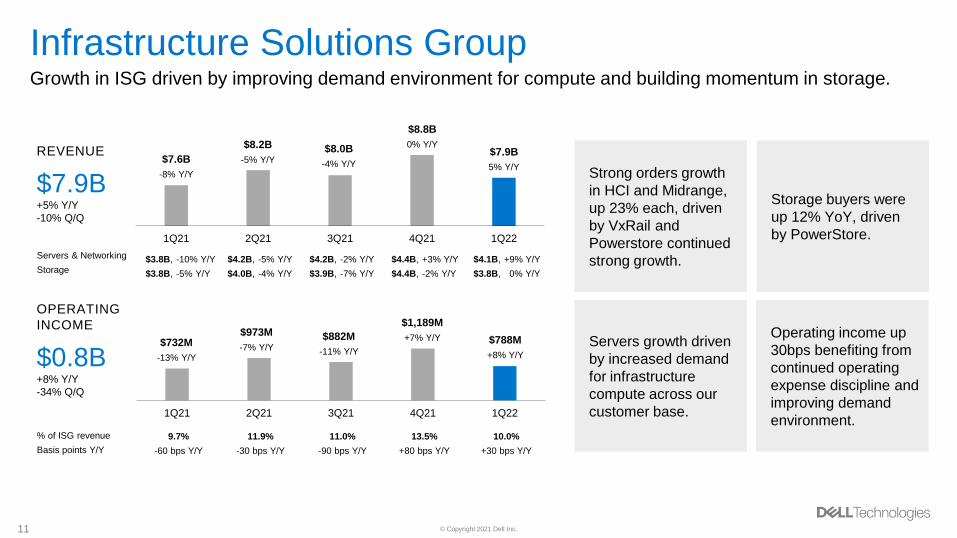
Infrastructure Solutions GroupGrowth in ISG driven by improving demand environment for compute and building momentum in storage.
-10% Y/Y
-5% Y/Y
-5% Y/Y
-4% Y/Y
-2% Y/Y
-7% Y/Y
+3% Y/Y
-2% Y/Y
+9% Y/Y
0% Y/Y
REVENUE
$7.9B+5% Y/Y
-10% Q/Q
OPERATING
INCOME
$0.8B+8% Y/Y
-34% Q/Q
$3.8B,
$3.8B,
$4.2B,
$4.0B,
$4.2B,
$3.9B,
$4.4B,
$4.4B,
$4.1B,
$3.8B,
% of ISG revenue
Basis points Y/Y
Servers & Networking
Storage
Strong orders growth
in HCI and Midrange,
up 23% each, driven
by VxRail and
Powerstore continued
strong growth.
Storage buyers were
up 12% YoY, driven
by PowerStore.
Servers growth driven
by increased demand
for infrastructure
compute across our
customer base.
Operating income up
30bps benefiting from
continued operating
expense discipline and
improving demand
environment.
1Q21 2Q21 3Q21 4Q21 1Q22
$8.0B
-4% Y/Y
$8.8B
0% Y/Y$7.9B
5% Y/Y$7.6B
-8% Y/Y
$8.2B
-5% Y/Y
1Q21 2Q21 3Q21 4Q21 1Q22
$882M
-11% Y/Y
$1,189M
+7% Y/Y $788M
+8% Y/Y
$732M
-13% Y/Y
$973M
-7% Y/Y
9.7%
-60 bps Y/Y
11.9%
-30 bps Y/Y
11.0%
-90 bps Y/Y
13.5%
+80 bps Y/Y
10.0%
+30 bps Y/Y
© Copyright 2021 Dell Inc.12
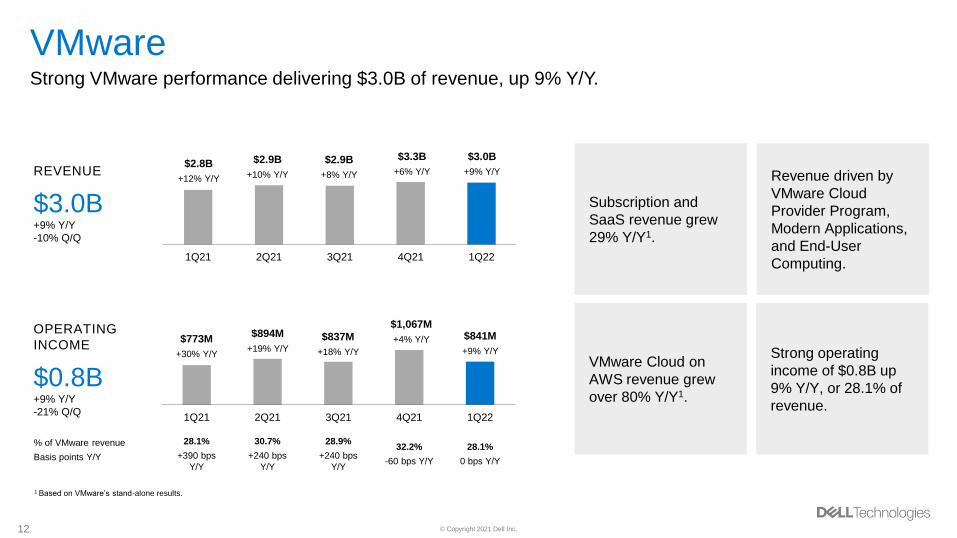
VMwareStrong VMware performance delivering $3.0B of revenue, up 9% Y/Y.
REVENUE
$3.0B+9% Y/Y
-10% Q/Q
OPERATING
INCOME
$0.8B+9% Y/Y
-21% Q/Q
% of VMware revenue
Basis points Y/Y
Subscription and
SaaS revenue grew
29% Y/Y1.
Revenue driven by
VMware Cloud
Provider Program,
Modern Applications,
and End-User
Computing.
VMware Cloud on
AWS revenue grew
over 80% Y/Y1.
Strong operating
income of $0.8B up
9% Y/Y, or 28.1% of
revenue.
1Q21 2Q21 3Q21 4Q21 1Q22
$2.9B
+8% Y/Y
$3.3B
+6% Y/Y
$3.0B
+9% Y/Y
$2.9B
+10% Y/Y
28.1%
+390 bps
Y/Y
30.7%
+240 bps
Y/Y
28.9%
+240 bps
Y/Y
32.2%
-60 bps Y/Y
28.1%
0 bps Y/Y
1Q21 2Q21 3Q21 4Q21 1Q22
$837M
+18% Y/Y
$1,067M
+4% Y/Y $841M
+9% Y/Y
$894M
+19% Y/Y
$2.8B
+12% Y/Y
$773M
+30% Y/Y
1 Based on VMware’s stand-alone results.
© Copyright 2021 Dell Inc.13
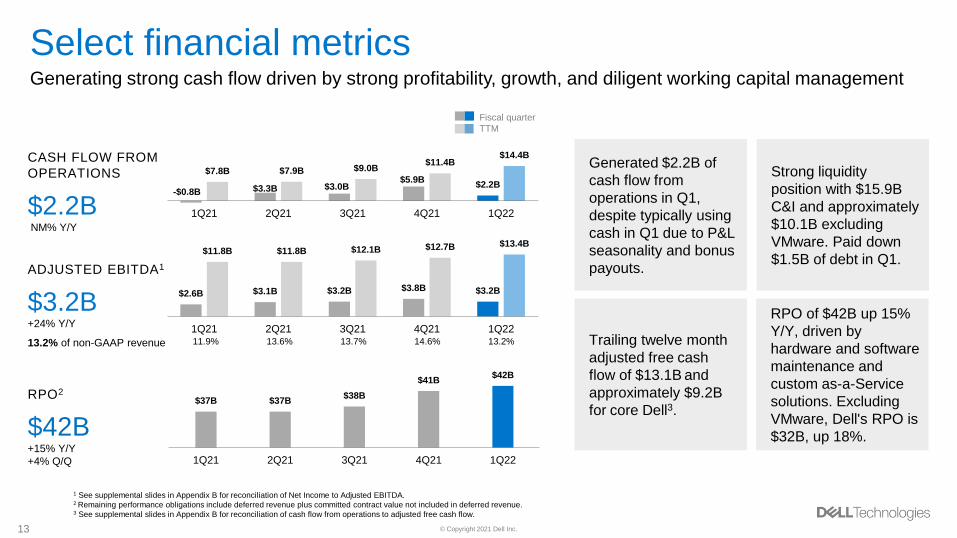
Select financial metricsGenerating strong cash flow driven by strong profitability, growth, and diligent working capital management
CASH FLOW FROM
OPERATIONS
$2.2BNM% Y/Y
ADJUSTED EBITDA1
$3.2B+24% Y/Y
13.2% of non-GAAP revenue
RPO2
$42B+15% Y/Y
+4% Q/Q
-$0.8B $3.3B $3.0B$5.9B
$2.2B
$7.8B $7.9B $9.0B$11.4B
$14.4B
1Q21 2Q21 3Q21 4Q21 1Q22
Fiscal quarter
TTM
Generated $2.2B of
cash flow from
operations in Q1,
despite typically using
cash in Q1 due to P&L
seasonality and bonus
payouts.
Strong liquidity
position with $15.9B
C&I and approximately
$10.1B excluding
VMware. Paid down
$1.5B of debt in Q1.
Trailing twelve month
adjusted free cash
flow of $13.1B and
approximately $9.2B
for core Dell3.
RPO of $42B up 15%
Y/Y, driven by
hardware and software
maintenance and
custom as-a-Service
solutions. Excluding
VMware, Dell's RPO is
$32B, up 18%.
1 See supplemental slides in Appendix B for reconciliation of Net Income to Adjusted EBITDA.2 Remaining performance obligations include deferred revenue plus committed contract value not included in deferred revenue.3 See supplemental slides in Appendix B for reconciliation of cash flow from operations to adjusted free cash flow.
$2.6B $3.1B $3.2B $3.8B $3.2B
$11.8B $11.8B $12.1B $12.7B $13.4B
1Q21 2Q21 3Q21 4Q21 1Q2211.9% 13.6% 13.7% 14.6% 13.2%
$37B $37B$38B
$41B$42B
1Q21 2Q21 3Q21 4Q21 1Q22
© Copyright 2021 Dell Inc.14
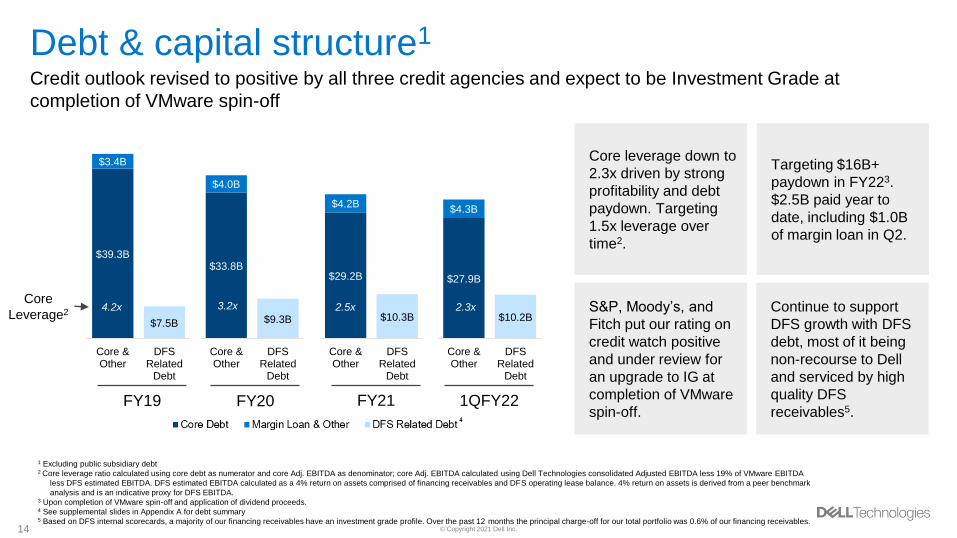
$27.9B
$10.2B
$4.3B
Core &Other
DFSRelated
Debt
$29.2B
$10.3B
$4.2B
Core &Other
DFSRelated
Debt
$39.3B
$7.5B
$3.4B
Core &Other
DFSRelated
Debt
Debt & capital structure1
Credit outlook revised to positive by all three credit agencies and expect to be Investment Grade at
completion of VMware spin-off
1 Excluding public subsidiary debt2 Core leverage ratio calculated using core debt as numerator and core Adj. EBITDA as denominator; core Adj. EBITDA calculated using Dell Technologies consolidated Adjusted EBITDA less 19% of VMware EBITDA
less DFS estimated EBITDA. DFS estimated EBITDA calculated as a 4% return on assets comprised of financing receivables and DFS operating lease balance. 4% return on assets is derived from a peer benchmark
analysis and is an indicative proxy for DFS EBITDA.3 Upon completion of VMware spin-off and application of dividend proceeds.4 See supplemental slides in Appendix A for debt summary 5 Based on DFS internal scorecards, a majority of our financing receivables have an investment grade profile. Over the past 12 months the principal charge-off for our total portfolio was 0.6% of our financing receivables.
Core leverage down to
2.3x driven by strong
profitability and debt
paydown. Targeting
1.5x leverage over
time2.
Targeting $16B+
paydown in FY223.
$2.5B paid year to
date, including $1.0B
of margin loan in Q2.
S&P, Moody’s, and
Fitch put our rating on
credit watch positive
and under review for
an upgrade to IG at
completion of VMware
spin-off.
Continue to support
DFS growth with DFS
debt, most of it being
non-recourse to Dell
and serviced by high
quality DFS
receivables5.FY19 FY20 FY21 1QFY22
2.3x2.5x3.2x4.2xCore
Leverage2
$33.8B
$9.3B
$4.0B
Core &Other
DFSRelated
Debt
3.2x
© Copyright 2021 Dell Inc.15
Q2 Guidance
• RevenueWe are seeing progress on the economic front but given ongoing supply constraints particularly impacting CSG and after factoring VMware's standalone guidance, we expect Q2 revenue to be slightly below our normal sequential pattern over the past few years. Normal sequential revenue increase is about 6%.
• Operating incomeExpect operating income to be down low to mid-single digits sequentially on an absolute dollar basis.
• Some costs coming back as we reinstated a number of employee-related benefits in Q1, most notably merit and promotions
• VMware and Dell core businesses are investing for long-term growth
• Will see mix shift within CSG driven by the normal seasonality of stronger education PC and Chromebook sales
• The component supply situation remains constrained and we expect component costs to be inflationary in Q2.
• Below the operating income line
• Will continue to benefit from lower interest expense.
• Majority of the activity for the new $16B+ debt reduction target will take place in conjunction with the expected close of the VMware transaction in calendar Q4.
• Non-GAAP tax rate, 17.5% plus or minus 100 basis points.
© Copyright 2021 Dell Inc.16
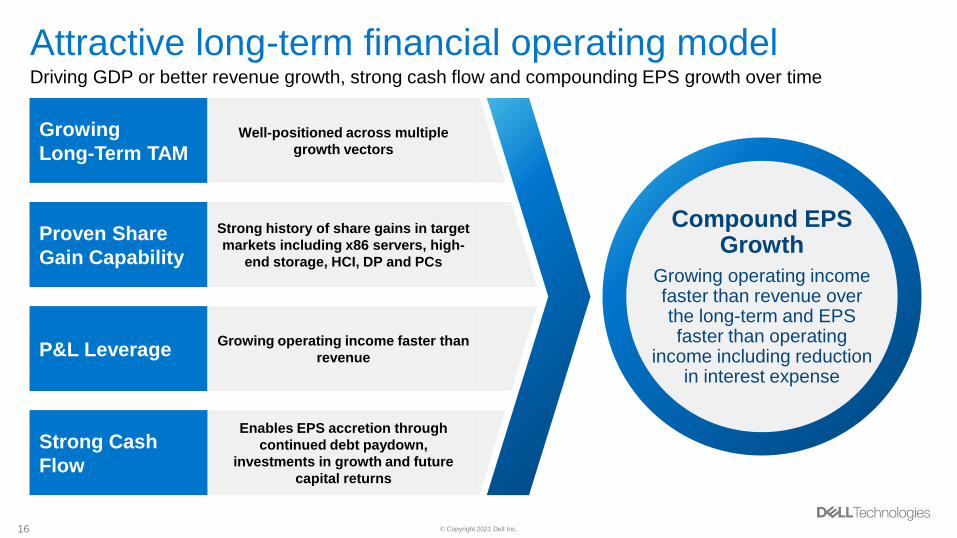
Attractive long-term financial operating modelDriving GDP or better revenue growth, strong cash flow and compounding EPS growth over time
Compound EPS Growth
Growing operating income faster than revenue over the long-term and EPS faster than operating
income including reduction in interest expense
Growing
Long-Term TAM
Proven Share
Gain Capability
P&L Leverage
Well-positioned across multiple
growth vectors
Strong history of share gains in target
markets including x86 servers, high-
end storage, HCI, DP and PCs
Growing operating income faster than
revenue
Enables EPS accretion through
continued debt paydown,
investments in growth and future
capital returns
Strong Cash
Flow
© Copyright 2021 Dell Inc.17
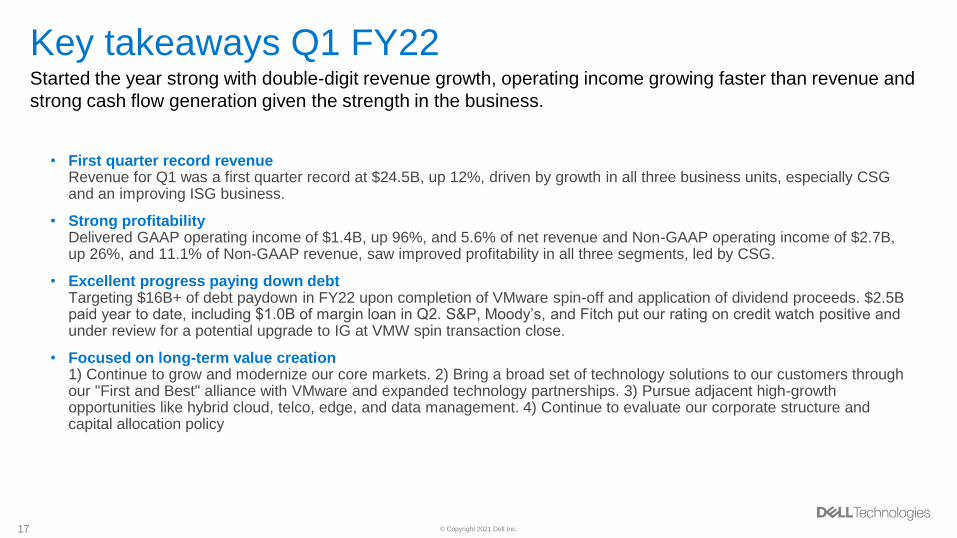
Key takeaways Q1 FY22Started the year strong with double-digit revenue growth, operating income growing faster than revenue and
strong cash flow generation given the strength in the business.
• First quarter record revenueRevenue for Q1 was a first quarter record at $24.5B, up 12%, driven by growth in all three business units, especially CSG and an improving ISG business.
• Strong profitabilityDelivered GAAP operating income of $1.4B, up 96%, and 5.6% of net revenue and Non-GAAP operating income of $2.7B, up 26%, and 11.1% of Non-GAAP revenue, saw improved profitability in all three segments, led by CSG.
• Excellent progress paying down debtTargeting $16B+ of debt paydown in FY22 upon completion of VMware spin-off and application of dividend proceeds. $2.5B paid year to date, including $1.0B of margin loan in Q2. S&P, Moody’s, and Fitch put our rating on credit watch positive and under review for a potential upgrade to IG at VMW spin transaction close.
• Focused on long-term value creation1) Continue to grow and modernize our core markets. 2) Bring a broad set of technology solutions to our customers through our "First and Best" alliance with VMware and expanded technology partnerships. 3) Pursue adjacent high-growth opportunities like hybrid cloud, telco, edge, and data management. 4) Continue to evaluate our corporate structure and capital allocation policy
© Copyright 2021 Dell Inc.18
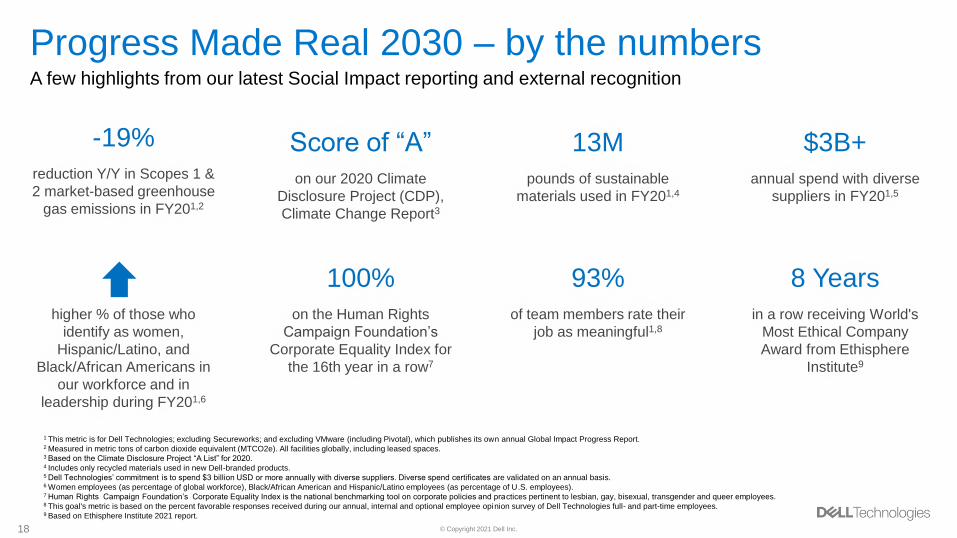
Progress Made Real 2030 – by the numbersA few highlights from our latest Social Impact reporting and external recognition
-19%
reduction Y/Y in Scopes 1 &
2 market-based greenhouse
gas emissions in FY201,2
Score of “A”
on our 2020 Climate
Disclosure Project (CDP),
Climate Change Report3
13M
pounds of sustainable
materials used in FY201,4
$3B+
annual spend with diverse
suppliers in FY201,5
100%
on the Human Rights
Campaign Foundation’s
Corporate Equality Index for
the 16th year in a row7
93%
of team members rate their
job as meaningful1,8
8 Years
in a row receiving World's
Most Ethical Company
Award from Ethisphere
Institute9
1 This metric is for Dell Technologies; excluding Secureworks; and excluding VMware (including Pivotal), which publishes its own annual Global Impact Progress Report.2 Measured in metric tons of carbon dioxide equivalent (MTCO2e). All facilities globally, including leased spaces.3 Based on the Climate Disclosure Project “A List” for 2020.4 Includes only recycled materials used in new Dell-branded products.5 Dell Technologies’ commitment is to spend $3 billion USD or more annually with diverse suppliers. Diverse spend certificates are validated on an annual basis. 6 Women employees (as percentage of global workforce), Black/African American and Hispanic/Latino employees (as percentage of U.S. employees).7 Human Rights Campaign Foundation’s Corporate Equality Index is the national benchmarking tool on corporate policies and practices pertinent to lesbian, gay, bisexual, transgender and queer employees.8 This goal's metric is based on the percent favorable responses received during our annual, internal and optional employee opinion survey of Dell Technologies full- and part-time employees.9 Based on Ethisphere Institute 2021 report.
higher % of those who
identify as women,
Hispanic/Latino, and
Black/African Americans in
our workforce and in
leadership during FY201,6

© Copyright 2021 Dell Inc.19
Appendix ADebt and DFS summary
© Copyright 2021 Dell Inc.20
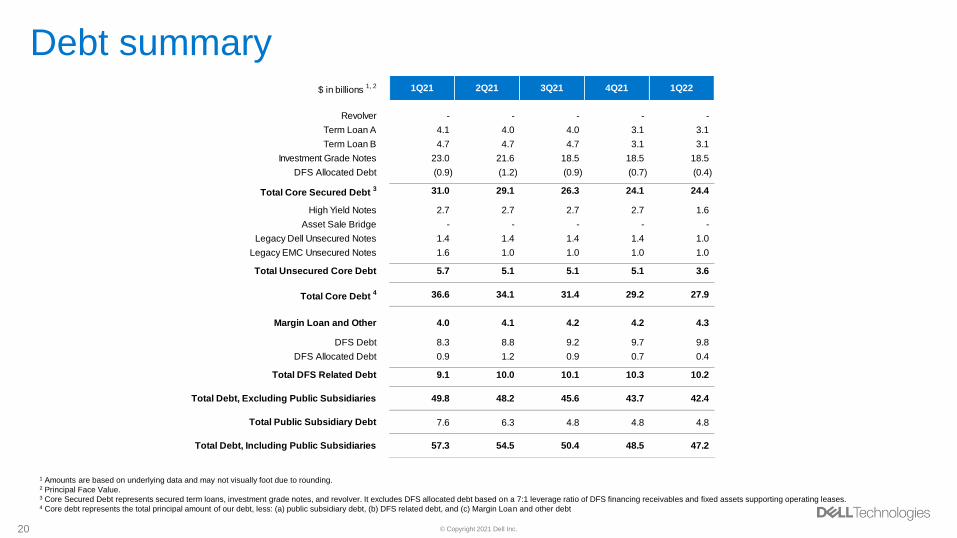
Debt summary
1 Amounts are based on underlying data and may not visually foot due to rounding.2 Principal Face Value.3 Core Secured Debt represents secured term loans, investment grade notes, and revolver. It excludes DFS allocated debt based on a 7:1 leverage ratio of DFS financing receivables and fixed assets supporting operating leases.4 Core debt represents the total principal amount of our debt, less: (a) public subsidiary debt, (b) DFS related debt, and (c) Margin Loan and other debt
$ in billions 1, 2 1Q21 2Q21 3Q21 4Q21 1Q22
Revolver - - - - -
Term Loan A 4.1 4.0 4.0 3.1 3.1
Term Loan B 4.7 4.7 4.7 3.1 3.1
Investment Grade Notes 23.0 21.6 18.5 18.5 18.5
DFS Allocated Debt (0.9) (1.2) (0.9) (0.7) (0.4)
Total Core Secured Debt 3 31.0 29.1 26.3 24.1 24.4
High Yield Notes 2.7 2.7 2.7 2.7 1.6
Asset Sale Bridge - - - - -
Legacy Dell Unsecured Notes 1.4 1.4 1.4 1.4 1.0
Legacy EMC Unsecured Notes 1.6 1.0 1.0 1.0 1.0
Total Unsecured Core Debt 5.7 5.1 5.1 5.1 3.6
Total Core Debt 4 36.6 34.1 31.4 29.2 27.9
Margin Loan and Other 4.0 4.1 4.2 4.2 4.3
DFS Debt 8.3 8.8 9.2 9.7 9.8
DFS Allocated Debt 0.9 1.2 0.9 0.7 0.4
Total DFS Related Debt 9.1 10.0 10.1 10.3 10.2
Total Debt, Excluding Public Subsidiaries 49.8 48.2 45.6 43.7 42.4
Total Public Subsidiary Debt 7.6 6.3 4.8 4.8 4.8
Total Debt, Including Public Subsidiaries 57.3 54.5 50.4 48.5 47.2
© Copyright 2021 Dell Inc.21
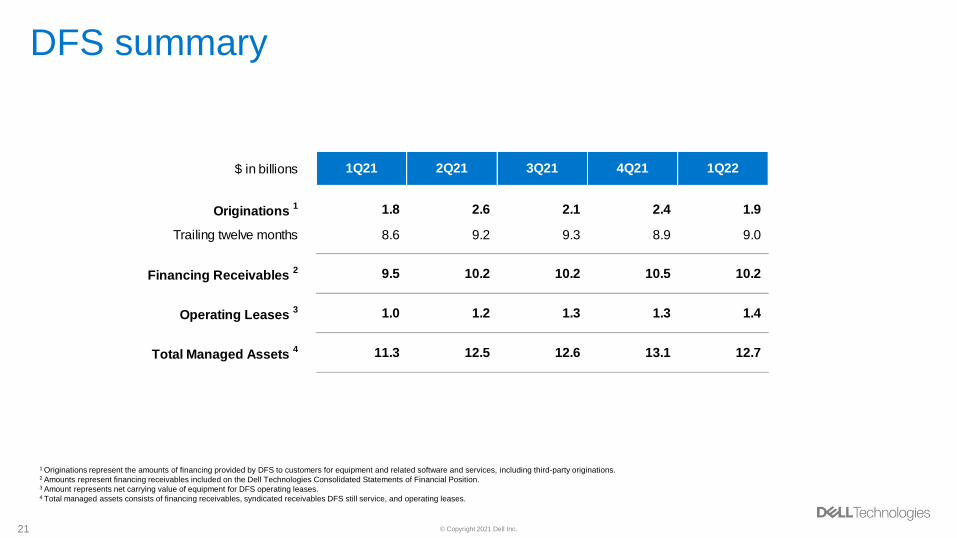
DFS summary
1 Originations represent the amounts of financing provided by DFS to customers for equipment and related software and services, including third-party originations.2 Amounts represent financing receivables included on the Dell Technologies Consolidated Statements of Financial Position.3 Amount represents net carrying value of equipment for DFS operating leases.4 Total managed assets consists of financing receivables, syndicated receivables DFS still service, and operating leases.
$ in billions 1Q21 2Q21 3Q21 4Q21 1Q22
Originations 1 1.8 2.6 2.1 2.4 1.9
Trailing twelve months 8.6 9.2 9.3 8.9 9.0
Financing Receivables 2 9.5 10.2 10.2 10.5 10.2
Operating Leases 3 1.0 1.2 1.3 1.3 1.4
Total Managed Assets 4 11.3 12.5 12.6 13.1 12.7
© Copyright 2021 Dell Inc.22
Appendix BSupplemental non-GAAP measures
© Copyright 2021 Dell Inc.23
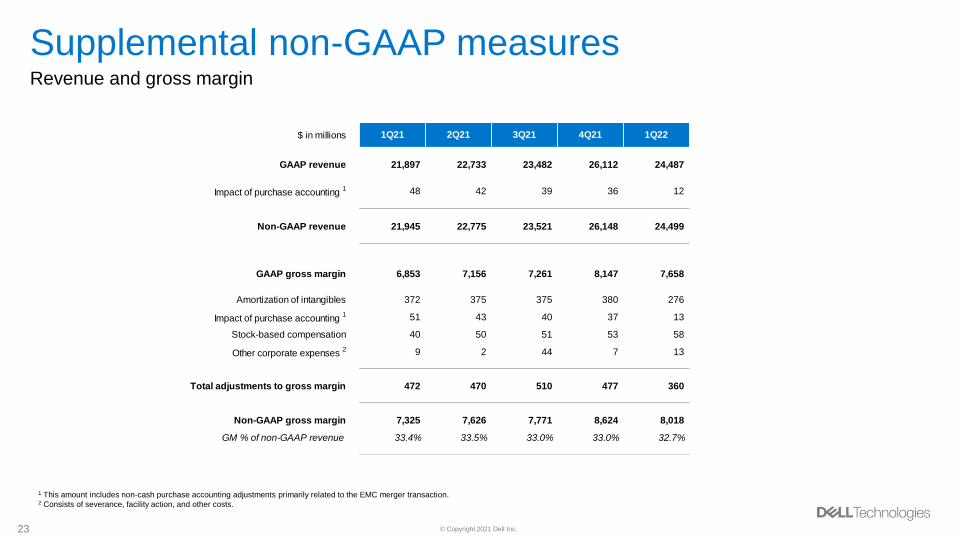
Supplemental non-GAAP measuresRevenue and gross margin
1 This amount includes non-cash purchase accounting adjustments primarily related to the EMC merger transaction.2 Consists of severance, facility action, and other costs.
$ in millions 1Q21 2Q21 3Q21 4Q21 1Q22
GAAP revenue 21,897 22,733 23,482 26,112 24,487
Impact of purchase accounting 1 48 42 39 36 12
Non-GAAP revenue 21,945 22,775 23,521 26,148 24,499
GAAP gross margin 6,853 7,156 7,261 8,147 7,658
Amortization of intangibles 372 375 375 380 276
Impact of purchase accounting 1 51 43 40 37 13
Stock-based compensation 40 50 51 53 58
Other corporate expenses 2 9 2 44 7 13
Total adjustments to gross margin 472 470 510 477 360
Non-GAAP gross margin 7,325 7,626 7,771 8,624 8,018
GM % of non-GAAP revenue 33.4% 33.5% 33.0% 33.0% 32.7%
© Copyright 2021 Dell Inc.24
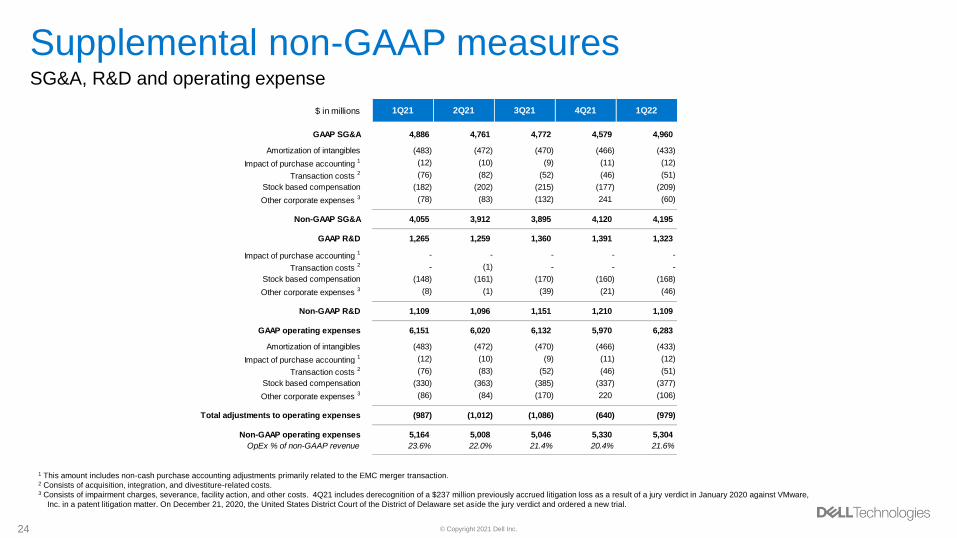
Supplemental non-GAAP measuresSG&A, R&D and operating expense
1 This amount includes non-cash purchase accounting adjustments primarily related to the EMC merger transaction.2 Consists of acquisition, integration, and divestiture-related costs.3 Consists of impairment charges, severance, facility action, and other costs. 4Q21 includes derecognition of a $237 million previously accrued litigation loss as a result of a jury verdict in January 2020 against VMware,
Inc. in a patent litigation matter. On December 21, 2020, the United States District Court of the District of Delaware set aside the jury verdict and ordered a new trial.
$ in millions 1Q21 2Q21 3Q21 4Q21 1Q22
GAAP SG&A 4,886 4,761 4,772 4,579 4,960
Amortization of intangibles (483) (472) (470) (466) (433)
Impact of purchase accounting 1 (12) (10) (9) (11) (12)
Transaction costs 2 (76) (82) (52) (46) (51)
Stock based compensation (182) (202) (215) (177) (209)
Other corporate expenses 3 (78) (83) (132) 241 (60)
Non-GAAP SG&A 4,055 3,912 3,895 4,120 4,195
GAAP R&D 1,265 1,259 1,360 1,391 1,323
Impact of purchase accounting 1 - - - - -
Transaction costs 2 - (1) - - -
Stock based compensation (148) (161) (170) (160) (168)
Other corporate expenses 3 (8) (1) (39) (21) (46)
Non-GAAP R&D 1,109 1,096 1,151 1,210 1,109
GAAP operating expenses 6,151 6,020 6,132 5,970 6,283
Amortization of intangibles (483) (472) (470) (466) (433)
Impact of purchase accounting 1 (12) (10) (9) (11) (12)
Transaction costs 2 (76) (83) (52) (46) (51)
Stock based compensation (330) (363) (385) (337) (377)
Other corporate expenses 3 (86) (84) (170) 220 (106)
Total adjustments to operating expenses (987) (1,012) (1,086) (640) (979)
Non-GAAP operating expenses 5,164 5,008 5,046 5,330 5,304
OpEx % of non-GAAP revenue 23.6% 22.0% 21.4% 20.4% 21.6%
© Copyright 2021 Dell Inc.25
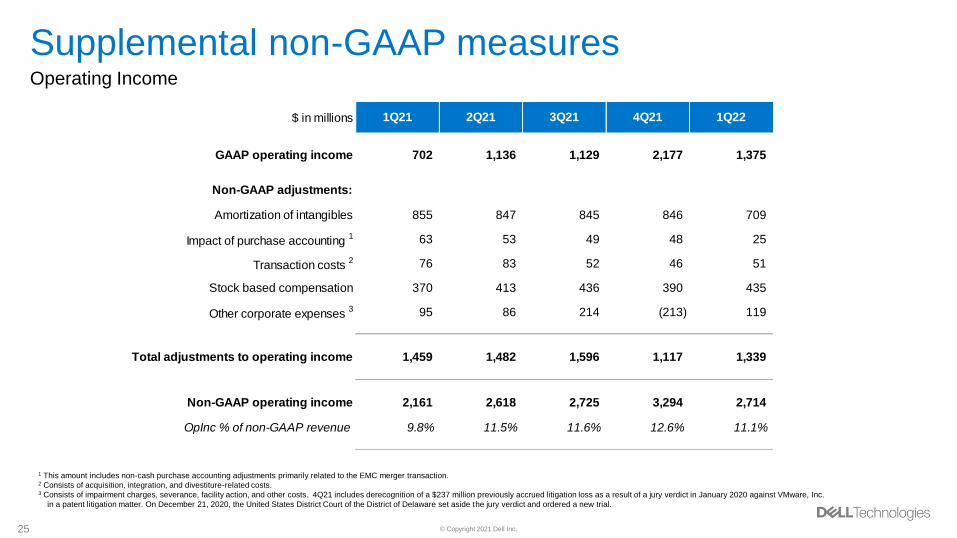
Supplemental non-GAAP measuresOperating Income
1 This amount includes non-cash purchase accounting adjustments primarily related to the EMC merger transaction.2 Consists of acquisition, integration, and divestiture-related costs.3 Consists of impairment charges, severance, facility action, and other costs. 4Q21 includes derecognition of a $237 million previously accrued litigation loss as a result of a jury verdict in January 2020 against VMware, Inc.
in a patent litigation matter. On December 21, 2020, the United States District Court of the District of Delaware set aside the jury verdict and ordered a new trial.
$ in millions 1Q21 2Q21 3Q21 4Q21 1Q22
GAAP operating income 702 1,136 1,129 2,177 1,375
Non-GAAP adjustments:
Amortization of intangibles 855 847 845 846 709
Impact of purchase accounting 1 63 53 49 48 25
Transaction costs 2 76 83 52 46 51
Stock based compensation 370 413 436 390 435
Other corporate expenses 3 95 86 214 (213) 119
Total adjustments to operating income 1,459 1,482 1,596 1,117 1,339
Non-GAAP operating income 2,161 2,618 2,725 3,294 2,714
OpInc % of non-GAAP revenue 9.8% 11.5% 11.6% 12.6% 11.1%
© Copyright 2021 Dell Inc.26
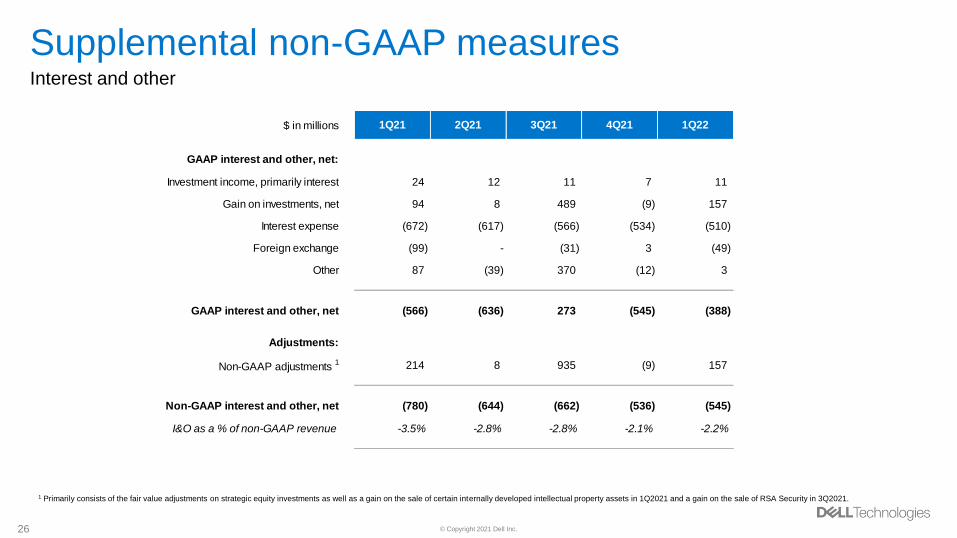
Supplemental non-GAAP measuresInterest and other
1 Primarily consists of the fair value adjustments on strategic equity investments as well as a gain on the sale of certain internally developed intellectual property assets in 1Q2021 and a gain on the sale of RSA Security in 3Q2021.
$ in millions 1Q21 2Q21 3Q21 4Q21 1Q22
GAAP interest and other, net:
Investment income, primarily interest 24 12 11 7 11
Gain on investments, net 94 8 489 (9) 157
Interest expense (672) (617) (566) (534) (510)
Foreign exchange (99) - (31) 3 (49)
Other 87 (39) 370 (12) 3
GAAP interest and other, net (566) (636) 273 (545) (388)
Adjustments:
Non-GAAP adjustments 1 214 8 935 (9) 157
Non-GAAP interest and other, net (780) (644) (662) (536) (545)
I&O as a % of non-GAAP revenue -3.5% -2.8% -2.8% -2.1% -2.2%
© Copyright 2021 Dell Inc.27
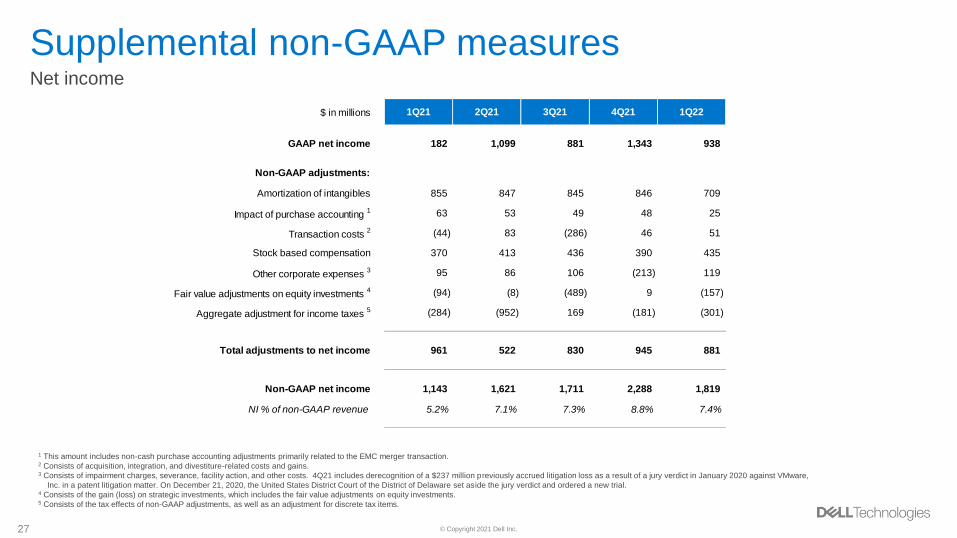
Supplemental non-GAAP measuresNet income
1 This amount includes non-cash purchase accounting adjustments primarily related to the EMC merger transaction.2 Consists of acquisition, integration, and divestiture-related costs and gains.3 Consists of impairment charges, severance, facility action, and other costs. 4Q21 includes derecognition of a $237 million previously accrued litigation loss as a result of a jury verdict in January 2020 against VMware,
Inc. in a patent litigation matter. On December 21, 2020, the United States District Court of the District of Delaware set aside the jury verdict and ordered a new trial.4 Consists of the gain (loss) on strategic investments, which includes the fair value adjustments on equity investments.5 Consists of the tax effects of non-GAAP adjustments, as well as an adjustment for discrete tax items.
$ in millions 1Q21 2Q21 3Q21 4Q21 1Q22
GAAP net income 182 1,099 881 1,343 938
Non-GAAP adjustments:
Amortization of intangibles 855 847 845 846 709
Impact of purchase accounting 1 63 53 49 48 25
Transaction costs 2 (44) 83 (286) 46 51
Stock based compensation 370 413 436 390 435
Other corporate expenses 3 95 86 106 (213) 119
Fair value adjustments on equity investments 4 (94) (8) (489) 9 (157)
Aggregate adjustment for income taxes 5 (284) (952) 169 (181) (301)
Total adjustments to net income 961 522 830 945 881
Non-GAAP net income 1,143 1,621 1,711 2,288 1,819
NI % of non-GAAP revenue 5.2% 7.1% 7.3% 8.8% 7.4%
© Copyright 2021 Dell Inc.28
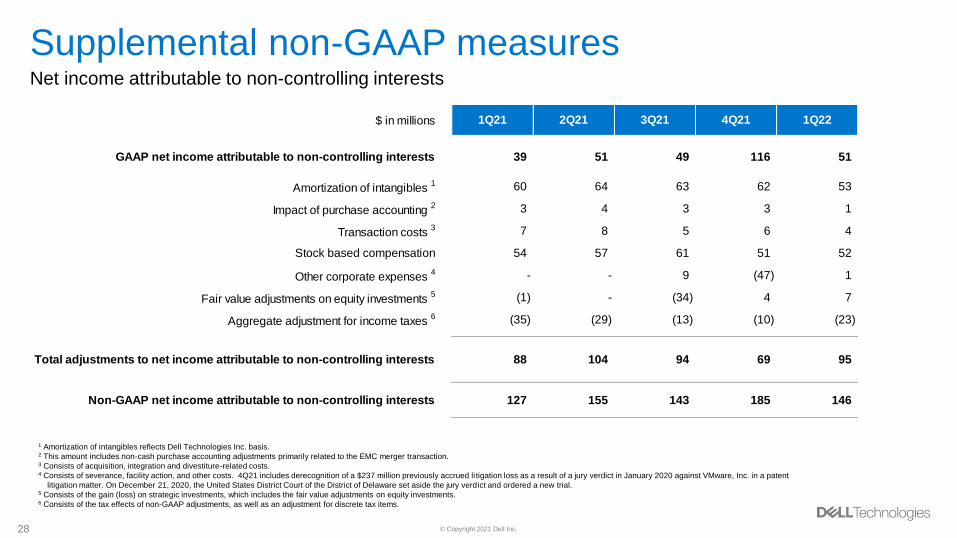
Supplemental non-GAAP measuresNet income attributable to non-controlling interests
1 Amortization of intangibles reflects Dell Technologies Inc. basis.2 This amount includes non-cash purchase accounting adjustments primarily related to the EMC merger transaction.3 Consists of acquisition, integration and divestiture-related costs.4 Consists of severance, facility action, and other costs. 4Q21 includes derecognition of a $237 million previously accrued li tigation loss as a result of a jury verdict in January 2020 against VMware, Inc. in a patent
litigation matter. On December 21, 2020, the United States District Court of the District of Delaware set aside the jury verdict and ordered a new trial.5 Consists of the gain (loss) on strategic investments, which includes the fair value adjustments on equity investments.6 Consists of the tax effects of non-GAAP adjustments, as well as an adjustment for discrete tax items.
$ in millions 1Q21 2Q21 3Q21 4Q21 1Q22
GAAP net income attributable to non-controlling interests 39 51 49 116 51
Amortization of intangibles 1 60 64 63 62 53
Impact of purchase accounting 2 3 4 3 3 1
Transaction costs 3 7 8 5 6 4
Stock based compensation 54 57 61 51 52
Other corporate expenses 4 - - 9 (47) 1
Fair value adjustments on equity investments 5 (1) - (34) 4 7
Aggregate adjustment for income taxes 6 (35) (29) (13) (10) (23)
Total adjustments to net income attributable to non-controlling interests 88 104 94 69 95
Non-GAAP net income attributable to non-controlling interests 127 155 143 185 146
© Copyright 2021 Dell Inc.29
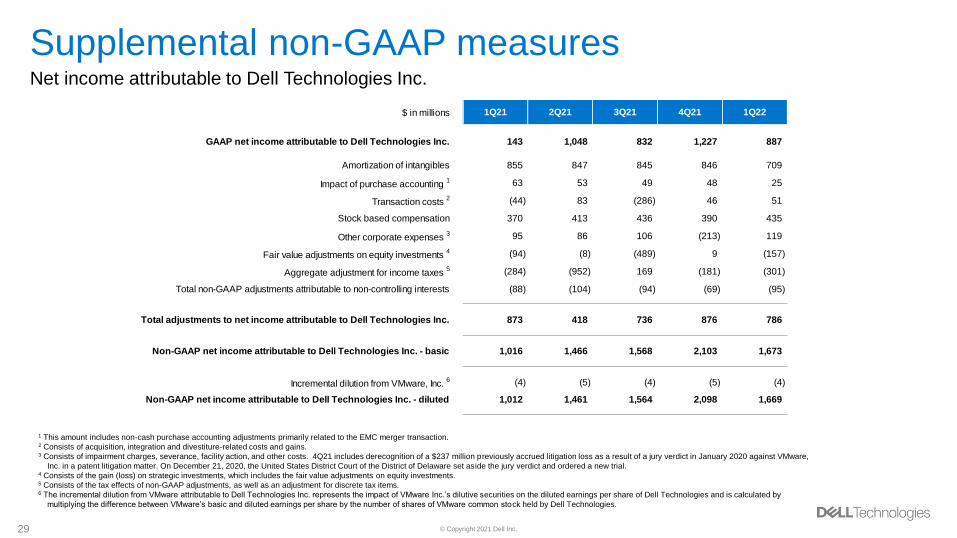
Supplemental non-GAAP measuresNet income attributable to Dell Technologies Inc.
1 This amount includes non-cash purchase accounting adjustments primarily related to the EMC merger transaction.2 Consists of acquisition, integration and divestiture-related costs and gains.3 Consists of impairment charges, severance, facility action, and other costs. 4Q21 includes derecognition of a $237 million previously accrued litigation loss as a result of a jury verdict in January 2020 against VMware,
Inc. in a patent litigation matter. On December 21, 2020, the United States District Court of the District of Delaware set aside the jury verdict and ordered a new trial.4 Consists of the gain (loss) on strategic investments, which includes the fair value adjustments on equity investments.5 Consists of the tax effects of non-GAAP adjustments, as well as an adjustment for discrete tax items.6 The incremental dilution from VMware attributable to Dell Technologies Inc. represents the impact of VMware Inc.’s dilutive securities on the diluted earnings per share of Dell Technologies and is calculated by
multiplying the difference between VMware’s basic and diluted earnings per share by the number of shares of VMware common stock held by Dell Technologies.
$ in millions 1Q21 2Q21 3Q21 4Q21 1Q22
GAAP net income attributable to Dell Technologies Inc. 143 1,048 832 1,227 887
Amortization of intangibles 855 847 845 846 709
Impact of purchase accounting 1 63 53 49 48 25
Transaction costs 2 (44) 83 (286) 46 51
Stock based compensation 370 413 436 390 435
Other corporate expenses 3 95 86 106 (213) 119
Fair value adjustments on equity investments 4 (94) (8) (489) 9 (157)
Aggregate adjustment for income taxes 5 (284) (952) 169 (181) (301)
Total non-GAAP adjustments attributable to non-controlling interests (88) (104) (94) (69) (95)
Total adjustments to net income attributable to Dell Technologies Inc. 873 418 736 876 786
Non-GAAP net income attributable to Dell Technologies Inc. - basic 1,016 1,466 1,568 2,103 1,673
Incremental dilution from VMware, Inc. 6 (4) (5) (4) (5) (4)
Non-GAAP net income attributable to Dell Technologies Inc. - diluted 1,012 1,461 1,564 2,098 1,669
© Copyright 2021 Dell Inc.30
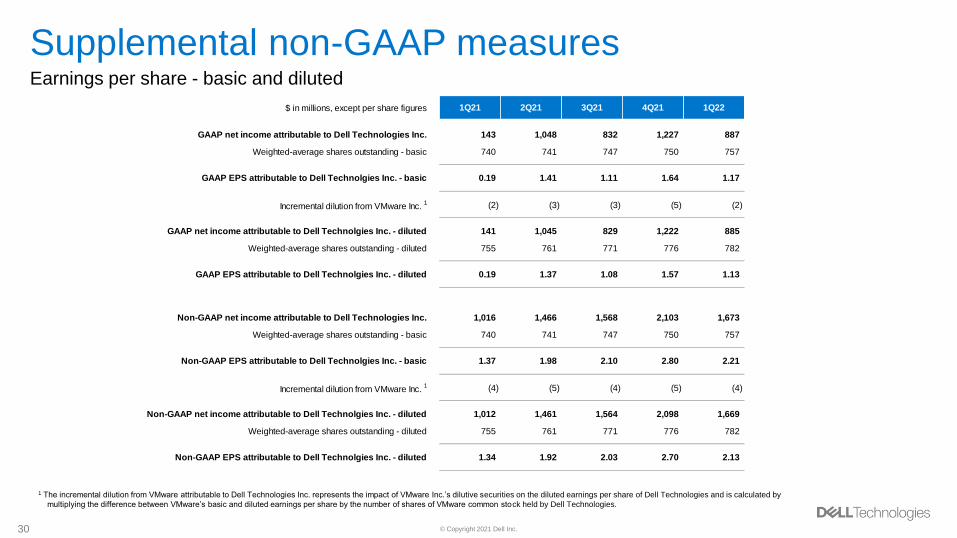
Supplemental non-GAAP measuresEarnings per share - basic and diluted
1 The incremental dilution from VMware attributable to Dell Technologies Inc. represents the impact of VMware Inc.’s dilutive securities on the diluted earnings per share of Dell Technologies and is calculated by
multiplying the difference between VMware’s basic and diluted earnings per share by the number of shares of VMware common stock held by Dell Technologies.
$ in millions, except per share figures 1Q21 2Q21 3Q21 4Q21 1Q22
GAAP net income attributable to Dell Technologies Inc. 143 1,048 832 1,227 887
Weighted-average shares outstanding - basic 740 741 747 750 757
GAAP EPS attributable to Dell Technolgies Inc. - basic 0.19 1.41 1.11 1.64 1.17
Incremental dilution from VMware Inc. 1 (2) (3) (3) (5) (2)
GAAP net income attributable to Dell Technolgies Inc. - diluted 141 1,045 829 1,222 885
Weighted-average shares outstanding - diluted 755 761 771 776 782
GAAP EPS attributable to Dell Technolgies Inc. - diluted 0.19 1.37 1.08 1.57 1.13
Non-GAAP net income attributable to Dell Technologies Inc. 1,016 1,466 1,568 2,103 1,673
Weighted-average shares outstanding - basic 740 741 747 750 757
Non-GAAP EPS attributable to Dell Technolgies Inc. - basic 1.37 1.98 2.10 2.80 2.21
Incremental dilution from VMware Inc. 1 (4) (5) (4) (5) (4)
Non-GAAP net income attributable to Dell Technolgies Inc. - diluted 1,012 1,461 1,564 2,098 1,669
Weighted-average shares outstanding - diluted 755 761 771 776 782
Non-GAAP EPS attributable to Dell Technolgies Inc. - diluted 1.34 1.92 2.03 2.70 2.13
© Copyright 2021 Dell Inc.31
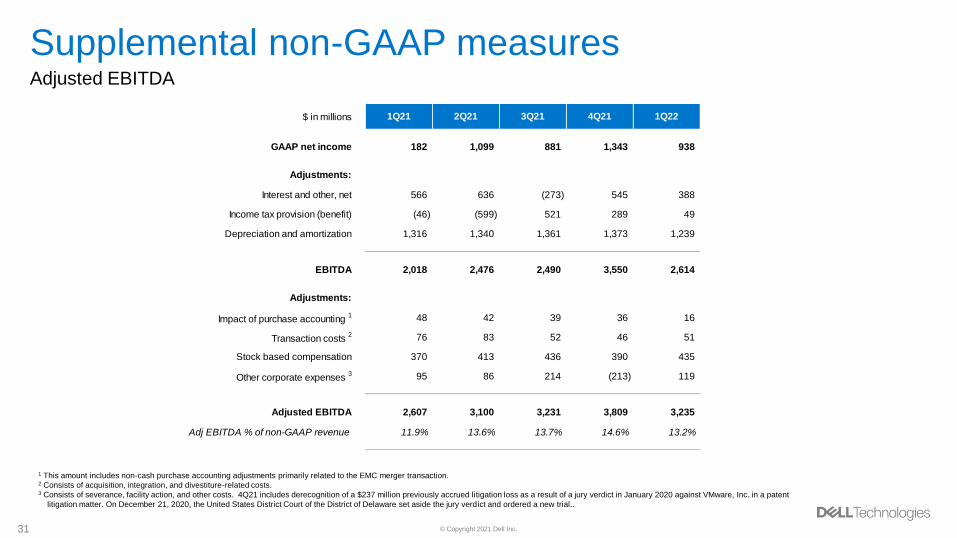
Supplemental non-GAAP measuresAdjusted EBITDA
1 This amount includes non-cash purchase accounting adjustments primarily related to the EMC merger transaction.2 Consists of acquisition, integration, and divestiture-related costs.3 Consists of severance, facility action, and other costs. 4Q21 includes derecognition of a $237 million previously accrued litigation loss as a result of a jury verdict in January 2020 against VMware, Inc. in a patent
litigation matter. On December 21, 2020, the United States District Court of the District of Delaware set aside the jury verdict and ordered a new trial..
$ in millions 1Q21 2Q21 3Q21 4Q21 1Q22
GAAP net income 182 1,099 881 1,343 938
Adjustments:
Interest and other, net 566 636 (273) 545 388
Income tax provision (benefit) (46) (599) 521 289 49
Depreciation and amortization 1,316 1,340 1,361 1,373 1,239
EBITDA 2,018 2,476 2,490 3,550 2,614
Adjustments:
Impact of purchase accounting 1 48 42 39 36 16
Transaction costs 2 76 83 52 46 51
Stock based compensation 370 413 436 390 435
Other corporate expenses 3 95 86 214 (213) 119
Adjusted EBITDA 2,607 3,100 3,231 3,809 3,235
Adj EBITDA % of non-GAAP revenue 11.9% 13.6% 13.7% 14.6% 13.2%
© Copyright 2021 Dell Inc.32
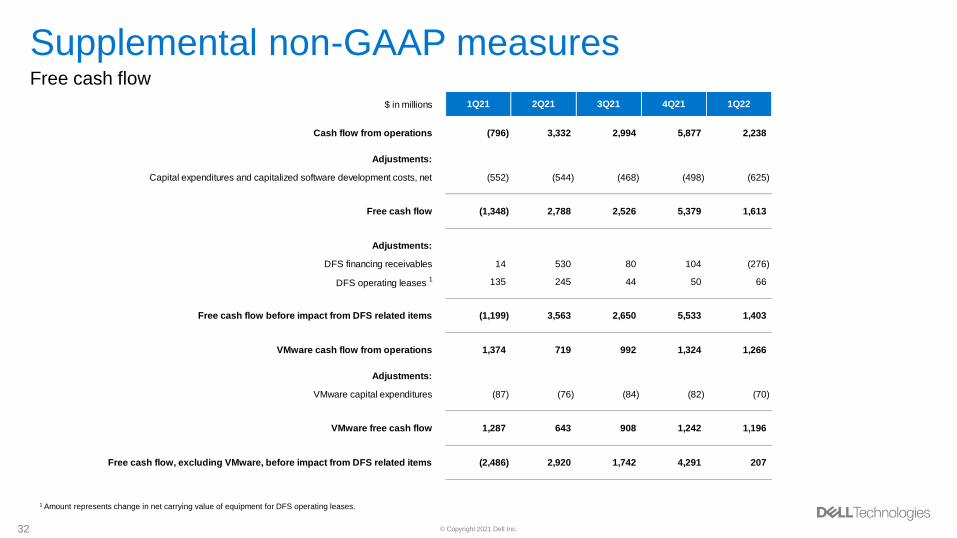
Supplemental non-GAAP measuresFree cash flow
1 Amount represents change in net carrying value of equipment for DFS operating leases.
$ in millions 1Q21 2Q21 3Q21 4Q21 1Q22
Cash flow from operations (796) 3,332 2,994 5,877 2,238
Adjustments:
Capital expenditures and capitalized software development costs, net (552) (544) (468) (498) (625)
Free cash flow (1,348) 2,788 2,526 5,379 1,613
Adjustments:
DFS financing receivables 14 530 80 104 (276)
DFS operating leases 1 135 245 44 50 66
Free cash flow before impact from DFS related items (1,199) 3,563 2,650 5,533 1,403
VMware cash flow from operations 1,374 719 992 1,324 1,266
Adjustments:
VMware capital expenditures (87) (76) (84) (82) (70)
VMware free cash flow 1,287 643 908 1,242 1,196
Free cash flow, excluding VMware, before impact from DFS related items (2,486) 2,920 1,742 4,291 207
End logo slide
Recommended