Embed Size (px)
Citation preview

Page 1 of 37
Highlights Q1 September FY221
Group gold production of 67,000 ounces
Leonora gold production up 15% quarter-on-quarter to 51,757 ounces
Group All-In Sustaining Cost (AISC) 8% lower quarter-on-quarter at A$1,492 per ounce
Aspiration – New Open Pit at Trevor Bore by 2024 with drill results of 7 m at 10.5 g/t Au, incl. 1 m at 44.5 g/t Au
Drilling at the Trotsky prospect at Simberi has identified additional oxide mineralisation
Syndicated financing agreement A$200 million and C$100 million extended to July 2025
Overview Sufficient near surface high grade intercepts at Trevor
Bore, within the Leonora Province, have been identified
for planning to commence on a potential new open pit only
25 km from the Gwalia processing plant. This will be the
first 100% owned new open pit to help fill the mill, with
multiple other opportunities in the exploration pipeline.
Drilling at Simberi at the Trotsky prospect has identified
additional oxide material to extend the operating life
before the conversion of the processing plant to sulphide
treatment.
Investment in development rates in FY21 are beginning to
pay dividends at Leonora with production increasing 15%
quarter-on-quarter. Overall gold production was down
quarter-on-quarter as the Simberi operations remained
offline, while work progressed on repairing the Deep-Sea
Tailing Placement (DSTP) pipeline. The processing facility
is expected to be brought back into production by the end
of Q2 Dec FY22.
Group All-In Sustaining Cost for the September quarter
was 8% lower at A$1,492 per ounce compared to the prior
quarter, predominantly due to increased gold production
from Leonora.
“Exploration at both Leonora and Simberi have yielded
strong results in the last quarter demonstrating the upside
in our brownfield portfolio. I have set the aspiration of a
new open pit commencing operation at Trevor Bore in
2024, This is the first step in delivering on our Leonora
Province Plan.” said Mr Craig Jetson, Managing Director
and CEO.
Total cash at bank on 30 September 2021 was A$42
million (30 June 2021: A$133 million), after net
investments of $21 million, dividend payments of $13
million, growth capex of A$11 million, income tax
payments of $10 million, project costs of A$4 million and
exploration expenditure of A$4 million.
Total debt owing under the Company’s syndicated facility
on 30 September 2021 remains at C$80 million.
Production Summary
Q1 Sep
FY21
Q2 Dec
FY21
Q3 Mar
FY2
Q4 Jun
FY21
Year
FY21
Q1 Sep
FY22
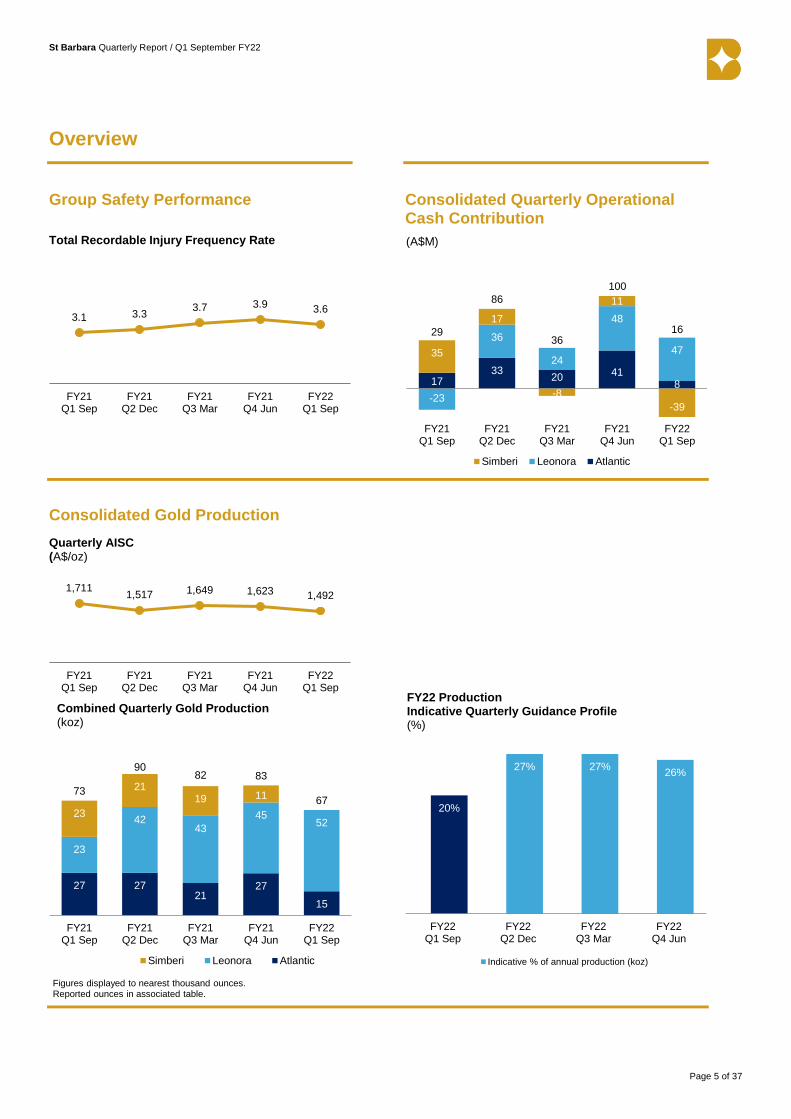
Group TRIFR2 mhrs 3.1 3.3 3.7 3.9 3.9 3.6
Gold Production koz 73 90 82 83 328 67
All-In Sustaining Cost A$/oz 1,711 1,517 1,649 1,623 1,616 1,492
Gold Sold koz 66 99 71 96 333 58
Realised Gold Price A$/oz 2,171 2,126 2,247 2,336 2,221 2,408
1 This report uses certain Non-IFRS measures as set out on the last page of this report. Unless otherwise noted, information in this report that relates to Mineral
Resources or Ore Reserves is extracted from the report titled ‘Ore Reserves and Mineral Resources Statements 30 June 2021’ released to the ASX on 26 August
2021. This report has not been audited.
2 Total Recordable Injury Frequency Rate rolling 12-month average, mhrs – injuries per million hours.
Q1 September FY22
(3 months to 30 September 2021)
St Barbara Quarterly Report / Q1 September FY22
Page 2 of 37
Safety
Total Recordable Injury Frequency Rate (TRIFR) safety performance was 3.6 as at 30 September 2021 compared with
3.9 as at 30 June 2021. The corresponding Lost Time Injury Frequency Rate on 30 September 2021 was 0.20 (30 June
2021 was 0.59). For the quarter there were four recordable injuries. The month of July was recordable injury free.
During the quarter the COVID-19 situation in PNG worsened with a sharp increase in community transmissions across
the country. Simberi has continued to implement the St Barbara COVID-19 protocols with the support and guidance of
external medical specialists and with additional controls to limit people movements. Currently a COVID-19 vaccination
program is taking place onsite with appropriate containment measures. As a result of these protocols there has only
been one positive case which was identified and isolated in the onsite quarantine facility. Prior to this, Simberi had no
active cases onsite since June 2021.
Safety focus over the quarter has been the commencement of the Safety Always leadership program, and the ongoing
development of communities of practices to increase awareness and focus on Critical Control Risk Standards. The
COVID-19 management work continues across all sites.
Leonora Province Plan
During the quarter work continued on advancing the Leonora Province Plan with drilling at Trevor Bore delivering near
surface high grade intercepts with 7 metres at 10.5 g/t Au from 17 metres, including 1 metre at 44.5 g/t Au from 21
metres. Drilling will resume in the next quarter and, contingent on continued encouraging intercepts, planning work will
be commencing for a potential new open pit at Trevor Bore with development expected to commence in calendar year
2023 with the aspiration of the open pit being operational in 2024. Trevor Bore is approximately 25 km from the Gwalia
plant and will be one of the first new pits to help fill the mill. It is expected that this pit would provide ore feed to the mill
for at least one year.
In the coming quarter a work program of infill, geotechnical and metallurgical sample drilling will commence at Tower
Hill and Harbour Lights. Work will also continue on the combined Pre-Feasibility Study for Tower Hill, Gwalia Open-Pit
Cutback and Harbour Lights, which will progress to mine design and scheduling in conjunction with the updated Gwalia
underground mining schedule. The Pre-Feasibility Study is expected to be completed in Q4 June FY22.
Building Brilliance at St Barbara For the September quarter FY22 the Building Brilliance transformation program has delivered a cash benefit of
A$23 million towards the quarterly target of A$15 million to A$25 million, with many of the production and cost initiatives
realising their potential during the quarter. Examples of initiatives implemented and developing for FY22 are described
below.
While the focus of Building Brilliance in FY21 was on operational productivity and cost efficiency, during FY22, Building
Brilliance will focus on the sustainability of initiatives at each operation and the program will be extended to corporate
activities. In FY22 the program will also concentrate on embedding the Building Brilliance process as a “business as
usual” mindset in daily activities to ensure business improvement initiatives continue to be developed and implemented
across the business.
Atlantic Operations
Mining: In FY21 the Building Brilliance program focussed on debottlenecking the processing plant. In FY22 the
program has extended into the open pit mining department. This has resulted in the development of initiatives for
increasing material movement and tracking performance. Further identification of initiatives is underway to
debottleneck mine production and improve mine planning and reconciliation.
Mill availability and throughput rate: Through the continual focus on embedding the Building Brilliance program
from FY21 the mill availability has been sustained at 96% and sustained a 5% improvement in average throughput
rate.
Leonora Operations
Development: During the September quarter, the availability of development headings has increased through a
combination of initiatives focused on cut length improvement, reduced scaling time utilising different explosives and
drilling techniques, deployment of different equipment underground to improve bolting cycle time and overall
St Barbara Quarterly Report / Q1 September FY22
Page 3 of 37
development heading ground support optimisation. This has resulted in a 20% improvement in average daily
development metres from 11.8 metres per day to 14.2 metres per day.
TKMs1 and material moved: A focus on material movement underground saw the delivery of initiatives which have
increased truck utilisation. Further use of remote equipment operation for the loading of the trucking fleet has
resulted in a 9% improvement in average daily haulage from 2.2 kt per day to 2.4 kt per day.
Contractor and External Spend: Leonora Operations has had a strong focus in the September quarter on external
spend initiatives and contractor spend. The combined success of the production and external spend reduction
initiatives has reduced the total material moved mining costs from A$160 to A$133 per tonne, a decrease of 17%.
Simberi Operations
Although Simberi is not currently processing ore, while the plant is shut down and pending restart after remediation
of the DSTP pipeline, many initiatives have been progressed to ensure the benefits are realised when operations
resume. Initiatives have focussed on equipment availability and productivity, mill recoveries and cost reduction.
Executive Changes
On 13 October 2021 Mr Peter Cowley was appointed Chief Operating Officer (Australasia) and a member of the
Executive Leadership Team, overseeing the Leonora and Simberi Operations, following his appointment in an interim
capacity to the role. He commenced in January 2021 with St Barbara as Head of Health, Safety and Environment. He
is a mining engineer with 35 years of experience in production, geomechanics, management and health, safety,
environment and security roles. He has lived and worked in Peru and South Africa for extended periods of time and has
providing HSES services and support to smelters, underground and open pit operations in many countries.
1 Tonne Kilometres
St Barbara Quarterly Report / Q1 September FY22
Page 4 of 37
Quarterly Briefing and Audio Webcast
Mr Craig Jetson, Managing Director & CEO, will brief analysts and investors on the Q1 September FY22 Quarterly
Report at 11:00 am Australian Eastern Daylight Time (UTC + 11 hours) on Monday 25 October 2021.
Analysts and institutional investors
Analysts and institutional investors can register for the briefing at https://s1.c-conf.com/diamondpass/10016684-
am98k1.html
Shareholders and media
An audio webcast will be available live and after the event on St Barbara’s website at
stbarbara.com.au/investors/webcast/ or by clicking here. The audio webcast is ‘listen only’ and does not enable
questions.
For more information
Investor Relations Media Relations
Chris Maitland
Head of Investor
Relations
Ben Wilson
GRACosway
T M
+61 3 8660 1914 +61 447 120 070
M +61 407 966 083
Authorised by
Craig Jetson
Managing Director & CEO
25 October 2021
St Barbara Limited ACN 009 165 066
Level 10, 432 St Kilda Road, Melbourne VIC 3004 ASX: SBM
Locked Bag 9, Collins Street East, Melbourne VIC 8003 ADR: STBMY
T +61 3 8660 1900 F +61 3 8660 1999 stbarbara.com.au
St Barbara Quarterly Report / Q1 September FY22
Page 5 of 37
Overview
Group Safety Performance
Consolidated Quarterly Operational Cash Contribution
Consolidated Gold Production
3.1 3.33.7 3.9 3.6
FY21Q1 Sep
FY21Q2 Dec
FY21Q3 Mar
FY21Q4 Jun
FY22Q1 Sep
Total Recordable Injury Frequency Rate
1733
20 418
-23
36
24
48
4735
17
-8
11
-39
29
86
36
100
16
FY21Q1 Sep
FY21Q2 Dec
FY21Q3 Mar
FY21Q4 Jun
FY22Q1 Sep
Simberi Leonora Atlantic
(A$M)
1,7111,517 1,649 1,623 1,492
FY21Q1 Sep
FY21Q2 Dec
FY21Q3 Mar
FY21Q4 Jun
FY22Q1 Sep
Quarterly AISC(A$/oz)
27 2721
27
15
23
4243
4552
23
2119 1173
9082 83
67
FY21Q1 Sep
FY21Q2 Dec
FY21Q3 Mar
FY21Q4 Jun
FY22Q1 Sep
Simberi Leonora Atlantic
Figures displayed to nearest thousand ounces.Reported ounces in associated table.
Combined Quarterly Gold Production(koz)
20%
27% 27%26%
FY22Q1 Sep
FY22Q2 Dec
FY22Q3 Mar
FY22Q4 Jun
Indicative % of annual production (koz)
FY22 ProductionIndicative Quarterly Guidance Profile(%)

St Barbara Quarterly Report / Q1 September FY22
Page 6 of 37
Consolidated Gold Production & Guidance
Production Summary
Consolidated
Q1 Sep
FY21
Q2 Dec
FY21
Q3 Mar
FY21
Q4 Jun
FY21
Year
FY21
Q1 Sep
FY22
Guidance
FY22
St Barbara’s financial year is
1 July to 30 June
Qtr to
30 Sep 2020
Qtr to
31 Dec 2020
Qtr to
31 Mar 2021
Qtr to
30 Jun 2021
Qtr to
30 Jun 2021
Qtr to
30 Sep 2021
Year to
30 June 2022
Production
Atlantic oz 27,226 26,693 20,606 26,718 101,243 15,243 65-85 koz
Leonora oz 22,625 42,198 42,716 45,157 152,696 51,757 180-200 koz
Simberi oz 23,139 20,779 18,981 10,824 73,723 - 60-70koz
Consolidated oz 72,990 89,670 82,303 82,698 327,662 67,000 305-355 koz
Mined Grade
Atlantic g/t 0.95 0.91 0.71 0.91 0.88 0.63
Leonora g/t 8.1 8.3 8.0 6.5 7.6 8.6
Simberi g/t 1.19 1.49 1.33 1.47 1.35 1.41
Total Cash Op. Costs
Atlantic A$/oz 669 736 903 769 761 1,188 n/a
Leonora A$/oz 1,560 1,037 1,044 1,271 1,185 1,033 n/a
Simberi A$/oz 1,481 1,817 2,032 2,835 1,912 - n/a
Consolidated A$/oz 1,203 1,128 1,237 1,314 1,218 1,071 n/a
All-In Sustaining Cost
Atlantic A$/oz 1,008 999 1,128 1,011 1,027 1,504 1,305-1,5151
Leonora A$/oz 2,592 1,573 1,555 1,663 1,744 1,488 1,605-1,720
Simberi A$/oz 1,678 2,070 2,426 2,964 2,162 - 2,465-2,6502
Consolidated A$/oz 1,711 1,517 1,649 1,623 1,616 1,492 1,710-1,860
Group Exploration Actual
Q1 Sep FY22
Guidance
FY22
A$M A$M
Australia 1 15-18
Tabar Island Group, Papua New Guinea 1 5-6
Nova Scotia, Canada 1 7-8
Consolidated 3 27-32
Group Capex Actual
Q1 Sep FY22
Guidance
FY22
Sustaining Growth Sustaining Growth
A$M A$M A$M A$M
Atlantic 2 2 15-20 30-40
Leonora 12 3 65-75 15-20
Simberi 3 2 15-20 25-35
Consolidated 17 7 95-115 70-95
1 C$1,240 to C$1,440 per ounce at AUD/CAD of 0.95
2 US$1,850 to US$1,990 per ounce at AUD/USD of 0.75

St Barbara Quarterly Report / Q1 September FY22
Page 7 of 37
Leonora Operations, Leonora, Western Australia
Operations
Production for Q1 Sep FY22 of 51,757 ounces was up
15% compared to the prior quarter (Q4 Jun FY21: 45,157
ounces). Production includes 3,426 ounces in 34 kt of ore
purchased from Linden Gold Alliance.
Mined grade for the quarter was 32% higher at 8.6 g/t Au
(Q4 Jun FY21: 6.5 g/t Au). This was due to the mining of
higher-grade stopes in Q1 Sep FY22 when compared to
Q4 Jun FY21.
AISC of A$1,488 per ounce was ~11% lower than the
previous quarter (Q4 Jun FY21: A$1,663 per ounce).
Lower AISC was principally due to increased gold
production as a result of higher mined grades supported
by reduced costs as the new mining contractor improved
operating performance.
Total material moved for the quarter was up 7% however
ore mined was marginally lower in the quarter at 178 kt
compared to 195 kt in Q4 Jun FY21, with waste mined the
highest in two years. A strong performance as a new fleet
of mining trucks started to be delivered during the quarter.
Ore milled in the quarter was 13% lower at 244 kt (Q4 Jun
FY21: 281 kt), as no surface stockpiles were processed
during the quarter. Gold recovery improved by 1% to 97%
due to higher grade and lower mill throughput of 129
tonnes per hour (tph) compared to the June quarter (138
tph).
The grade of milled tonnes for the quarter improved 30%
to 6.8 g/t Au (Q4 Jun FY21: 5.2 g/t Au) primarily due to
improved stope grades mined.
Building Brilliance continues to deliver improvements at
Gwalia, in particular:
The number of development fronts is expected to
increase to 28 by the end of FY22, at the end of Q1 there
were 23 fronts.
A focus on drilling the paste holes before bogging has
finished and is now resulting in a reduction of the amount
of paste pours required per stope. This has reduced
overall stope cycle time by 5.4 days per stope.
A new initiative to upgrade the tool used to guide the
daily underground schedule, has contributed to the
improvement of short interval control and the ability for
the operations team to make dynamic changes during
the shift to ensure production alignment to plan.
Outlook
FY22 guidance comprises:
Gold production of between 180,000 and 200,000
ounces and includes 10,000 ounces of production
from ore purchased from Linden Gold Alliance
AISC of between A$1,605 and A$1,720 per ounce
Sustaining capex of A$65 to A$75 million
Growth capex of A$15 to A$20 million.
2,592
1,573 1,555 1,663 1,488
AISC (A$/oz)
8.1 8.3 8.06.5
8.6
Mined grade (g/t Au)
Reserve grade5.2 g/t Au
30 June 2021
23
42 43 45
52
FY21Q1 Sep
FY21Q2 Dec
FY21Q3 Mar
FY21Q4 Jun
FY22Q1 Sep
Production (koz)
85
157168
195179102
84 73
71 105
6
193
241 241
266284
FY21Q1 Sep
FY21Q2 Dec
FY21Q3 Mar
FY21Q4 Jun
FY22Q1 Sep
Gwalia total material moved(kt)
Stope ore mined Development waste Raisebore waste

St Barbara Quarterly Report / Q1 September FY22
Page 8 of 37
Simberi Operations, Papua New Guinea
Operations
The mill remained shut down during the quarter as work
continued on replacing the deep-sea tailings placement
(DSTP) pipeline. The temporary break in operations is
being used to complete opportune maintenance,
implement multiple processing plant upgrades and
undertake work required to transition to the sulphide
expansion project.
Mining operations continued during the quarter, with a
focus on waste stripping and opening up cutbacks to allow
for productive mining when approval for a full restart from
the Mineral Resource Authority is granted.
Total material movement in Q1 Sep FY22 was 468 kt (Q4
Jun FY21: 1,471 kt), with 21 kt of ore mined (Q4 Jun FY21:
431 kt) and placed on stockpiles.
Waste mined in the September quarter was 447 kt
compared to 1,013 kt in the June quarter.
DSTP Pipeline Update
Engineering and design works are nearing completion and
all procurement has been completed, with critical
deliveries due over the month of October. The DSTP
installation contractor has mobilised to site and is
proceeding with enabling works. Pipeline fabrication will
continue through October with launch of the pipeline
planned for November, followed by commissioning. The
restart of the processing plant remains on schedule for Q2
Dec FY22.
Recent outbreak of COVID-19 in the region continues to
be a challenge on the site. This is being managed by
strengthening all existing COVID controls and limiting
personnel onto site to reduce interactions.
Simberi Sulphide Project Update
The pre-investment phase is advancing well, with initial
new fleet purchases completed and the front-end,
engineering and design (FEED) study package awarded
and on track for delivery in Q3 Mar FY22. The final
investment decision remains Q3 Mar FY22.
Concentrate sale and purchase agreements for the
majority of life of mine gold concentrate have been
finalised with a number of global trading companies,
subject to satisfying standard conditions precedent of a
positive investment decision by the Board and the project
achieving commercial production.
The Social and Environmental Impact Statement is under
review by Conservation and Environmental Protection
Authority (CEPA). The two addendums relating to further
trials and testing of waste rock management and the
DSTP footprint were submitted during the quarter.
Anticipated approval of the permit remains unchanged for
Q3 Mar FY22, with first sulphide ore production expected
in Q2 Dec FY24.
Outlook
FY22 guidance comprises:
Gold production of between 60,000 and 70,000
ounces
AISC of between A$2,465 and A$2,650 per ounce1
Sustaining capex of A$15 to A$20 million
Growth capex of A$25 to A$35 million.
1 US$1,850 to US$1,990 per ounce at AUD/USD 0.75
1,6782,070
2,4262,964
AISC(A$/oz)
1.3 1.3
1.1
1.3
Milled grade (g/t Au)
Oxide Reserve grade 1.2 g/t Au 30 June 2021
23
2119
11
FY21Q1 Sep
FY21Q2 Dec
FY21Q3 Mar
FY21Q4 Jun
FY22Q1 Sep
Production (koz)

St Barbara Quarterly Report / Q1 September FY22
Page 9 of 37
Atlantic Operations, Nova Scotia, Canada
Operations
Production for Q1 Sep FY22 was 15,243 ounces
representing a 43% quarter-on-quarter decrease (Q4
June FY21: 26,606 ounces). The lower-than-expected
production for the quarter was due to ore sourced
primarily from stockpiles, as mining operations focused on
waste movement and re-establishing work areas in the
pit. This is expected to be complete by mid-Q2 Dec FY22
enabling an increase in higher grade ore in the second
half of the FY22.
There was a 49% quarter-on-quarter increase in AISC to
A$1,504 per ounce for Q1 Sep FY22 (Q4 Jun FY21:
A$1,011 per ounce), driven by lower gold production.
The Building Brilliance program focused on external
spend reduction and mining productivity improvement
initiatives in Q1 Sep FY22.
New initiatives to repopulate the pipeline of improvement opportunities include: maximising trucking payloads and improving fleet effectiveness through implementing Teletrac on the excavator fleet, determining further bottlenecks to mine production and refining key performance indicators for tracking mine performance.
1 C$1,240 to C$1,440 per ounce at AUD/CAD 0.95
The average milled grade for Q1 Sep FY22 was 37%
lower at 0.7 g/t Au (Q4 Jun FY21: 1.11 g/t Au), primarily
due to increased reliance on stockpiled material as mining
shifted focus to waste movement and re-establishing
productive work areas.
Despite a significant reduction in gold grade the mill was
able to maintain gold recovery at 92% for the quarter
which was only 2% lower than the prior quarter (Q4 Jun
FY21: 94%).
Update on Permitting
Current focus of the permitting team is on waste rock
storage permits at Touquoy. A number of alternative
options are being investigated and the company will work
with the Nova Scotia Government to deliver the
appropriate permits in a timely manner.
Atlantic growth projects
Beaver Dam: Additional requests were made by the
regulators following the second round of information
requests submitted in June 2021. These requests are due
for resubmission at the end of October 2021. The
Feasibility Study has been completed and will be
submitted for internal approval in Q2 Dec FY22.
Fifteen Mile Stream: Responses to first round of
information requests received in late June 2021 are
underway and due for resubmission in Q3 Mar FY22. The
Feasibility Study is nearing completion and is on target for
completion early in 2022.
Cochrane Hill: Baseline monitoring for permitting is
continuing.
Outlook
FY22 guidance comprises:
Gold production of between 65,000 and 85,000
ounces
AISC of between A$1,305 and A$1,515 per ounce1
Sustaining capex of A$15 to A$20 million
Growth capex of A$30 to A$40 million.
1,008 9991,128 1,011
1,504
AISC(A$/oz)
1.3 1.21.0
1.1
0.7
Milled grade (g/t Au)
Reserve grade1.0 g/t Au 30 June 2021
27 27
21
27
15
FY21Q1 Sep
FY21Q2 Dec
FY21Q3 Mar
FY21Q4 Jun
FY22Q1 Sep
Production(koz)
St Barbara Quarterly Report / Q1 September FY22
Page 10 of 37
Exploration activities
Q1 Sep FY22
Exploration activity summary
Australia
Leonora – near mine (WA) Geological interpretation
Leonora – regional (WA) 17.5 RC holes for 1,934 m
Pinjin (WA) No field activity
Lake Wells (WA) 13 RC pre-collars for 344 m
2 Diamond tails for 430.2 m
Back Creek (NSW) No field activity
Drummartin JV (VIC) No field activity
Canada
Moose River Corridor 6 Rockchip samples
483 Soil samples
Touquoy Camp No field activity
NE Regional No field activity
SW Regional 115 Rockchip samples
280 Till samples
PNG
Simberi Island 7 Diamond holes for 830.3 m
28 RC holes for 2,510 m
Tatau Island No field activity
Australia
Leonora Exploration, Western Australia
Figures 1.0 to 1.6, Table 1
Gwalia near mine: Subject to access, a Resource
definition drilling program of up to 28 diamond holes for
approximately 7,000 m at Tower Hill and Harbour Lights
is expected to commence in early Q2 December FY22. In
addition, exploration diamond drilling testing for high
grade gold mineralisation between Gwalia, Tower Hill and
Harbour Lights as well as down plunge of Tower Hill and
Harbour Lights is planned to commence between late Q2
December FY22 or early Q3 March FY22.
A 12 hole RC drill program for 360 m is planned to test the
historic Harbour Lights waste dump for material with
economic gold grades between late Q2 December FY22
and early Q3 March FY22.
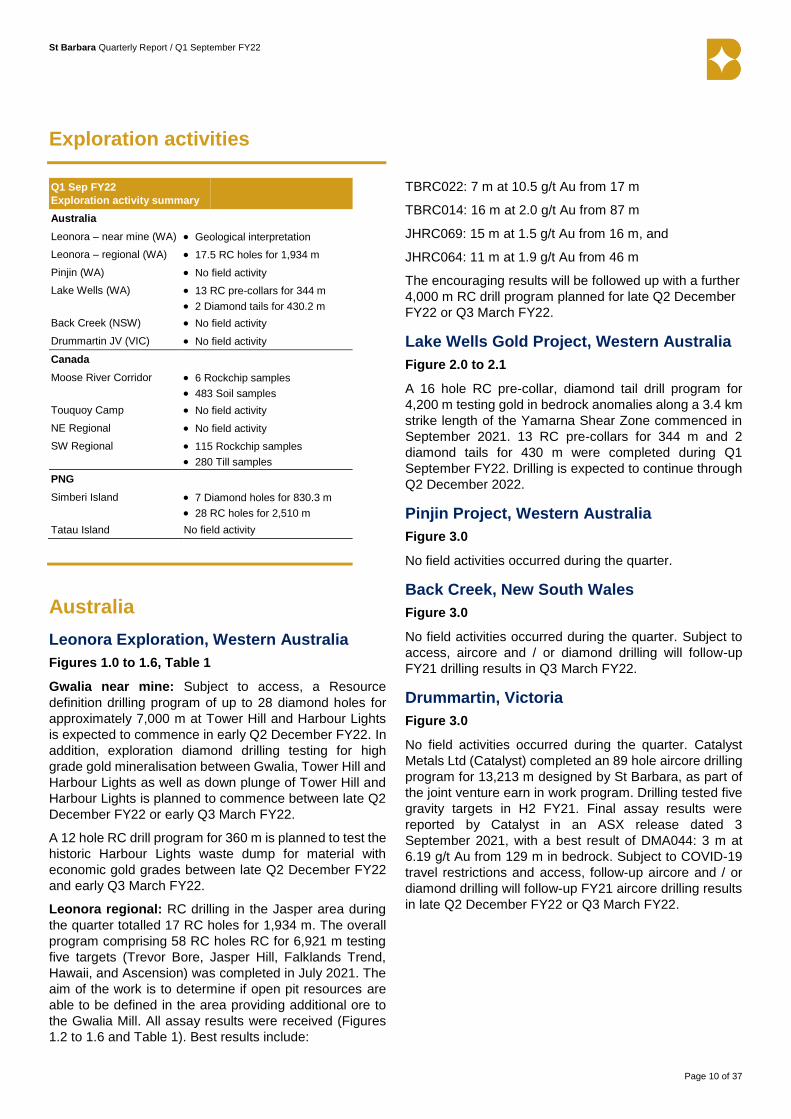
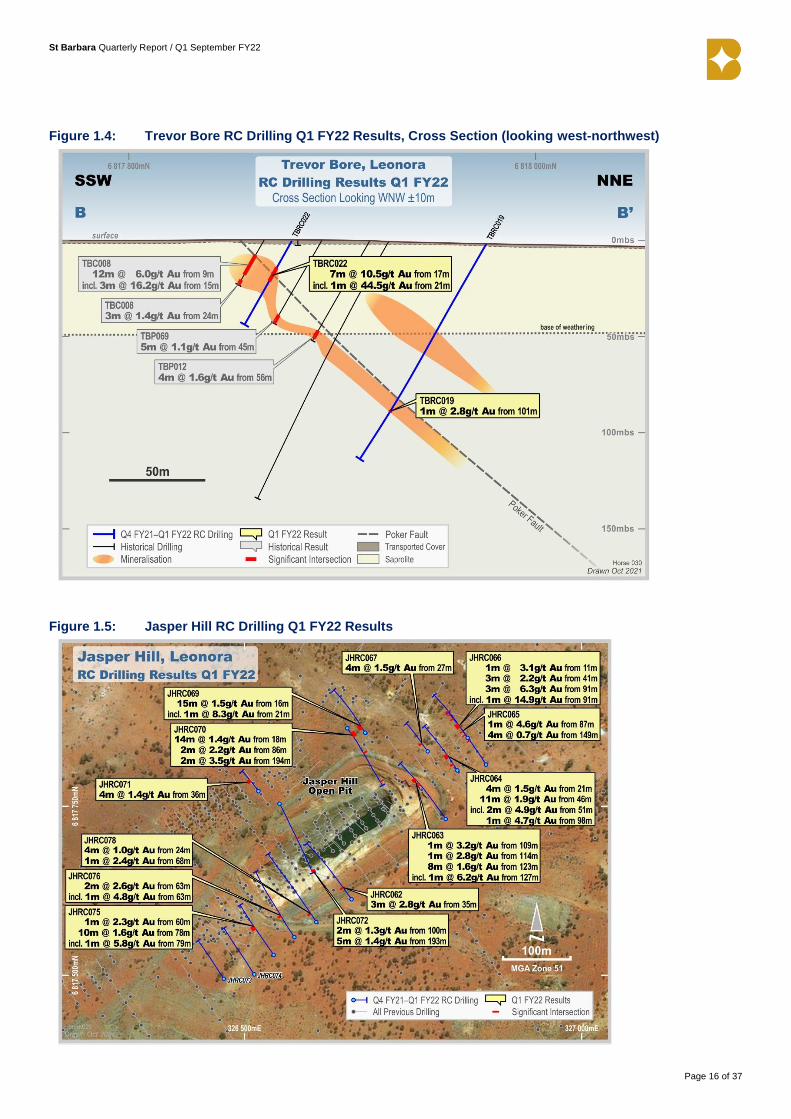
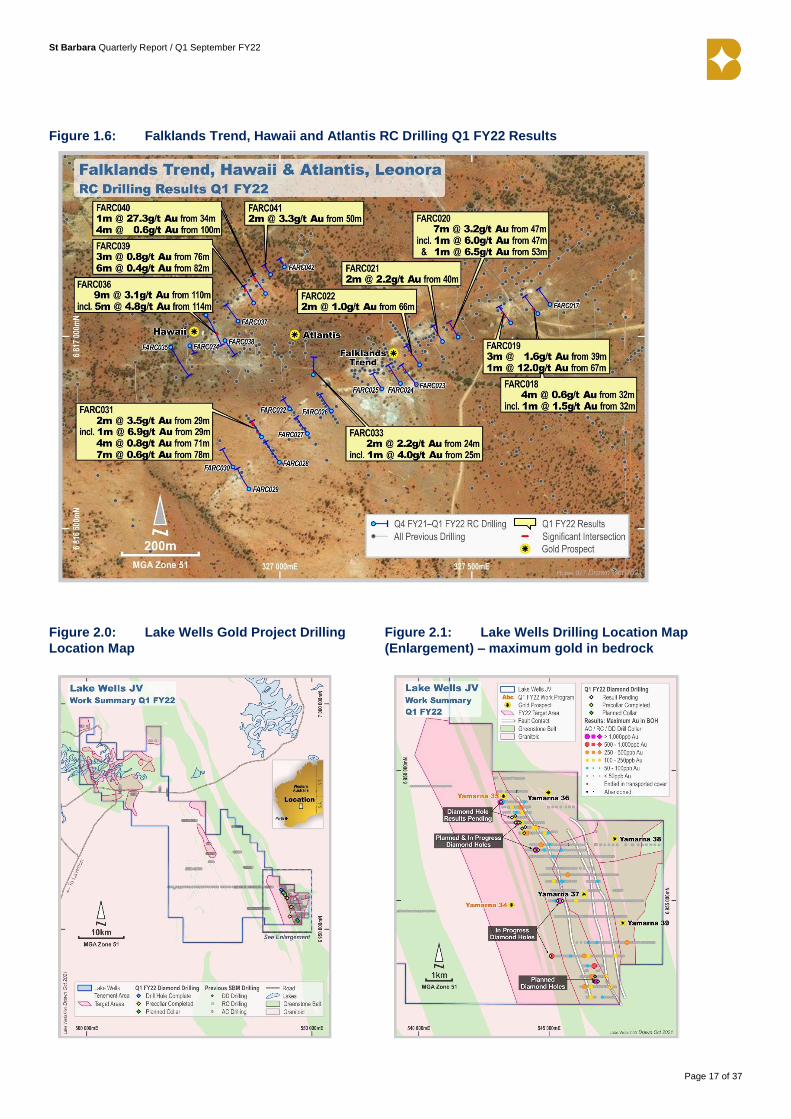
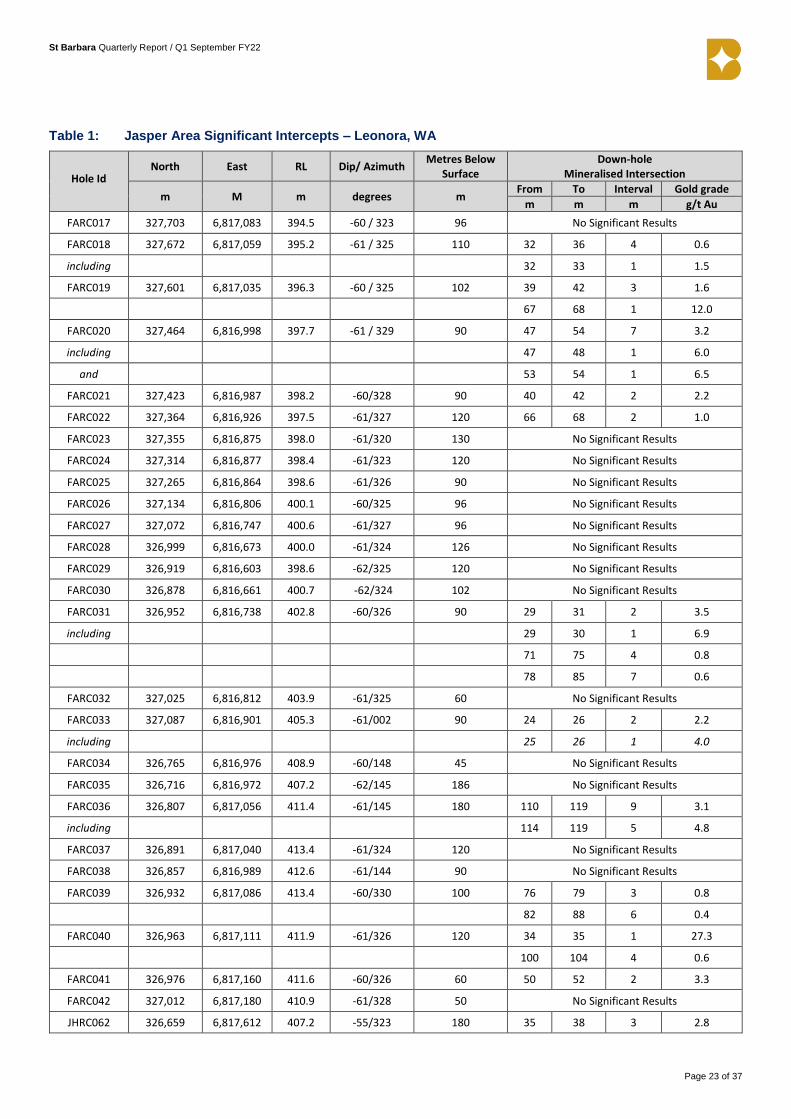
Leonora regional: RC drilling in the Jasper area during
the quarter totalled 17 RC holes for 1,934 m. The overall
program comprising 58 RC holes RC for 6,921 m testing
five targets (Trevor Bore, Jasper Hill, Falklands Trend,
Hawaii, and Ascension) was completed in July 2021. The
aim of the work is to determine if open pit resources are
able to be defined in the area providing additional ore to
the Gwalia Mill. All assay results were received (Figures
1.2 to 1.6 and Table 1). Best results include:
TBRC022: 7 m at 10.5 g/t Au from 17 m
TBRC014: 16 m at 2.0 g/t Au from 87 m
JHRC069: 15 m at 1.5 g/t Au from 16 m, and
JHRC064: 11 m at 1.9 g/t Au from 46 m
The encouraging results will be followed up with a further
4,000 m RC drill program planned for late Q2 December
FY22 or Q3 March FY22.
Lake Wells Gold Project, Western Australia
Figure 2.0 to 2.1
A 16 hole RC pre-collar, diamond tail drill program for
4,200 m testing gold in bedrock anomalies along a 3.4 km
strike length of the Yamarna Shear Zone commenced in
September 2021. 13 RC pre-collars for 344 m and 2
diamond tails for 430 m were completed during Q1
September FY22. Drilling is expected to continue through
Q2 December 2022.
Pinjin Project, Western Australia
Figure 3.0
No field activities occurred during the quarter.
Back Creek, New South Wales
Figure 3.0
No field activities occurred during the quarter. Subject to
access, aircore and / or diamond drilling will follow-up
FY21 drilling results in Q3 March FY22.
Drummartin, Victoria
Figure 3.0
No field activities occurred during the quarter. Catalyst
Metals Ltd (Catalyst) completed an 89 hole aircore drilling
program for 13,213 m designed by St Barbara, as part of
the joint venture earn in work program. Drilling tested five
gravity targets in H2 FY21. Final assay results were
reported by Catalyst in an ASX release dated 3
September 2021, with a best result of DMA044: 3 m at
6.19 g/t Au from 129 m in bedrock. Subject to COVID-19
travel restrictions and access, follow-up aircore and / or
diamond drilling will follow-up FY21 aircore drilling results
in late Q2 December FY22 or Q3 March FY22.
St Barbara Quarterly Report / Q1 September FY22
Page 11 of 37
Canada
Moose River Corridor
Figure 4.0
Mapping and rock chip sampling (6) was completed at two
targets. Soil sampling (483) was completed at seven
targets.
Touquoy Camp
Figure 4.0
No field activities occurred during the quarter.
Southwest Regional
Figure 4.0
Mapping and rock chip sampling (115) was completed at
seven targets. A large till sampling program (882) is
planned to cover most of the Southwest (SW) Regional
tenements. To date, 280 samples (32%) have been
collected over the western tenements testing five targets.
A tenement reduction was completed in the SW region
reducing the area by 54% from 12,026 to 5,579 claims.
The retained tenements are considered the most
prospective due to geological setting and results received
from work completed.
Northeast Regional
Figure 4.0
No field activities occurred during the quarter.
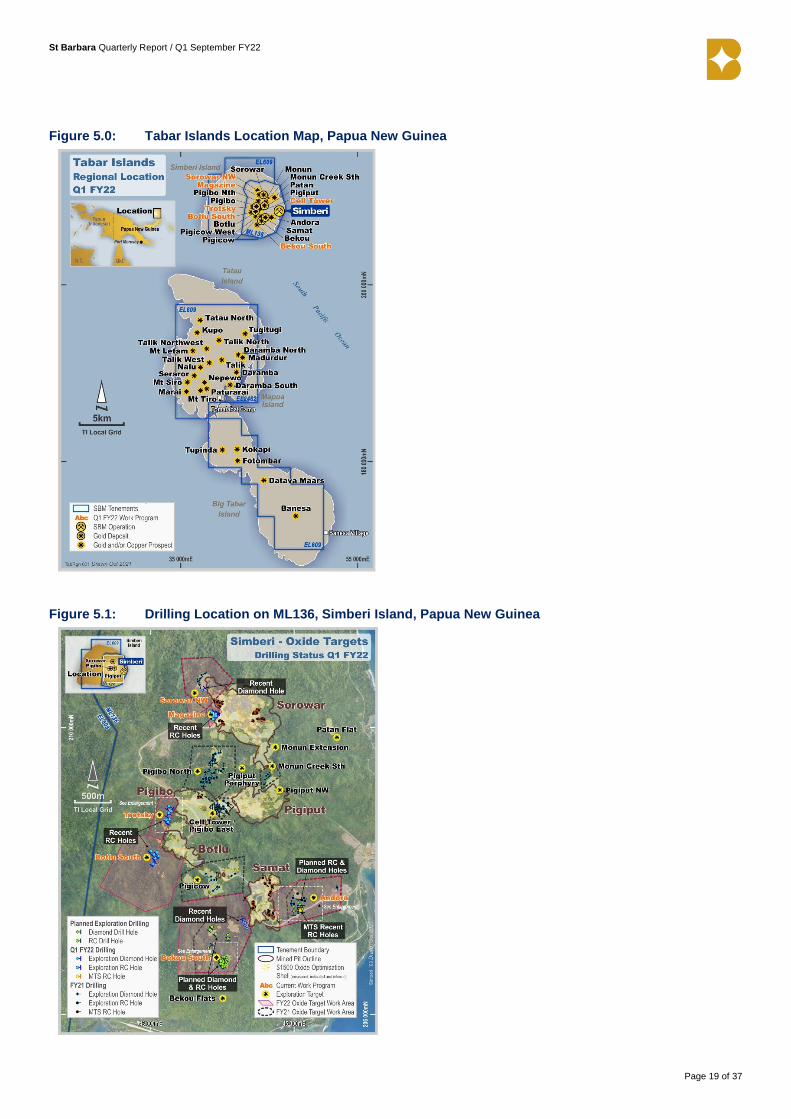
Papua New Guinea
Simberi, Tatau & Tabar Islands
Figures 5.0 to 5.7, Tables 2 & 3
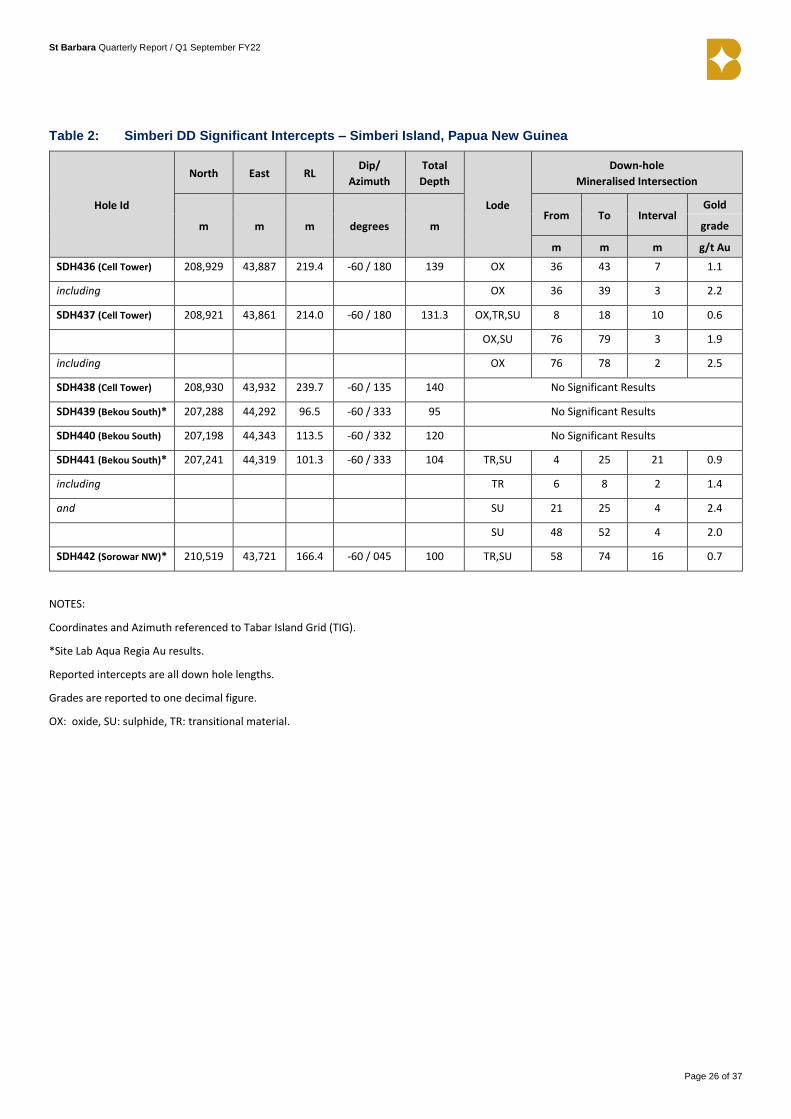
Diamond and RC drilling of oxide and transitional targets
on Simberi Island (ML136) to define potential additional
Inferred to Indicated Resources continued through Q1
September FY22. 28 RC holes for 2,510 m and 7 diamond
drill holes for 830 m were completed at Cell Tower / Pigibo
East, Magazine, Botlu South, Trotsky, Bekou South,
Sorowar North West, and Andora during the quarter.
Best preliminary results returned from Trotsky include:
SRCH121: 52 m at 1.5 g/t Au from 35 m (Ox/Tr/Su)1,
including 2 m at 18.8 g/t Au from 39 m (Su), and
SRCH123: 32 m at 2.0 g/t Au from 58 m (Ox/Tr/Su),
including 4 m at 12.2 g/t Au from 74 m (Ox).
Best preliminary results returned from Andora include:
065ADGC00A: 32 m at 5.5 g/t Au from 28 m (Ox/Tr), and
1 Oxide (Ox), Transition (Tr) and Sulphide (Su)
065ADGC00C: 40 m at 1.8 g/t Au from 26 m (Tr).
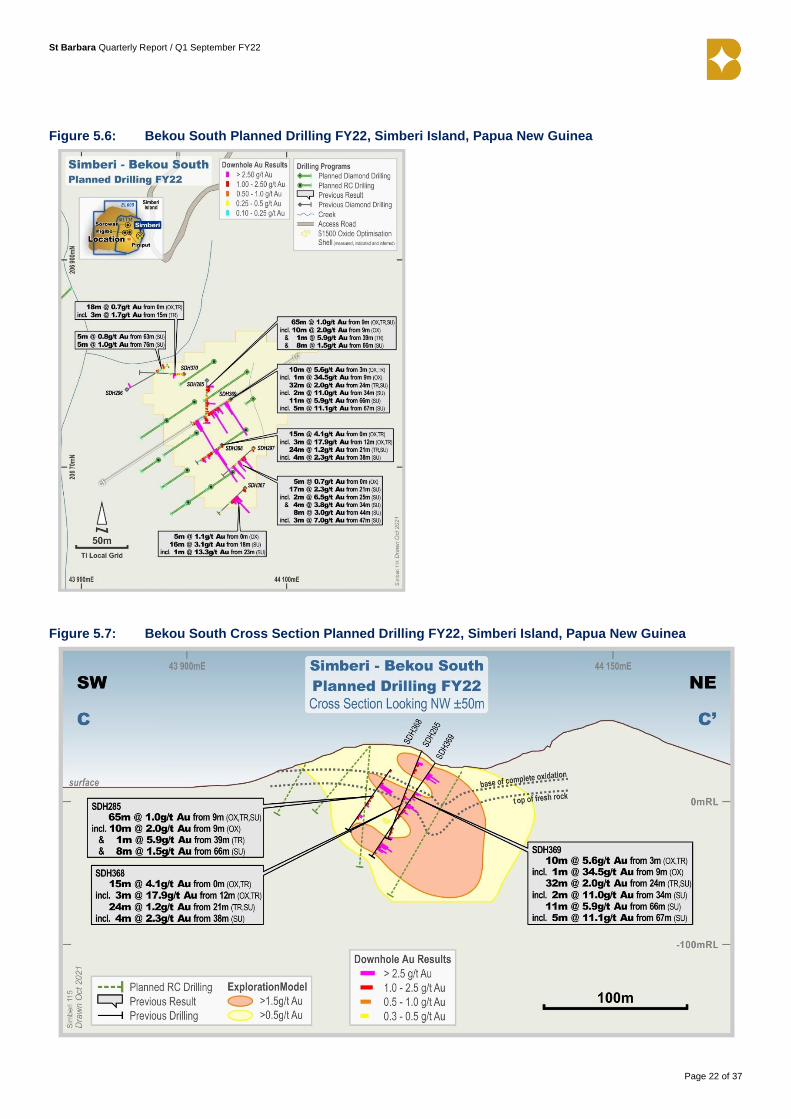
Drilling will continue through Q2 December FY22 at
Trotsky and Andora, following up encouraging results and
at Bekou South where there is an Inferred Resource.
Group Exploration Expenditure (unaudited)
Year
FY21
Q1 Sep
FY22
A$ million
Australia* 14 1
Canada* 8 1
PNG* 4 1
26 3
* These items are expensed
Equity Investments
At the date of this report, St Barbara holds the following
investments in Australian explorers2
Catalyst Metals Limited (ASX: CYL) 13.0%
Kin Mining NL (ASX: KIN) 19.8%
Peel Mining Limited (ASX: PEX) 9.9%
On 14 July St Barbara acquired 19.8% of Kin Mining NL (ASX: KIN) for A$25 million.
2 Shareholdings as notified by St Barbara in substantial holder notices
St Barbara Quarterly Report / Q1 September FY22
Page 12 of 37
Finance (unaudited)
57,918 ounces of gold were sold in Q1 Sep FY22, at an average realised gold price of A$2,408 per ounce (Q4 Jun
FY21: 95,535 ounces at A$2,336 per ounce), with 9,000 ounces delivered to call options that matured in the quarter
at a strike price of C$2,050 per ounce (average of A$2,213 per ounce). Gold sales were lower in the quarter due to
shipment timing, with 10,300 ounces in gold inventory at 30 September which was sold in October realising
proceeds of A$24 million.
Total cash at bank on 30 September 2021 was A$42 million (30 June 2021: A$133 million), after net investments
of $21 million, dividend payments of $13 million, growth capex of A$11 million, income tax payments of $10 million,
project costs of A$4 million and exploration expenditure of A$4 million.
Total debt owing under the Company’s syndicated facility on 30 September 2021 was C$80 million (30 June 2021:
C$80 million). The Australian tranche of the syndicated facility of A$200 million remains undrawn.
Operational cash contribution in Q1 Sep FY22 was A$16 million (Q4 Jun FY21: A$100 million) reflecting lower
production from Atlantic and interruption to production at Simberi.
Banks have signed commitment letters to extend the existing syndicated financing agreement of A$200 million and
C$100 million to July 2025. As a result, the C$80 million debt classified as a current liability as at 30 June 2021 will
be reclassified as a non-current liability.
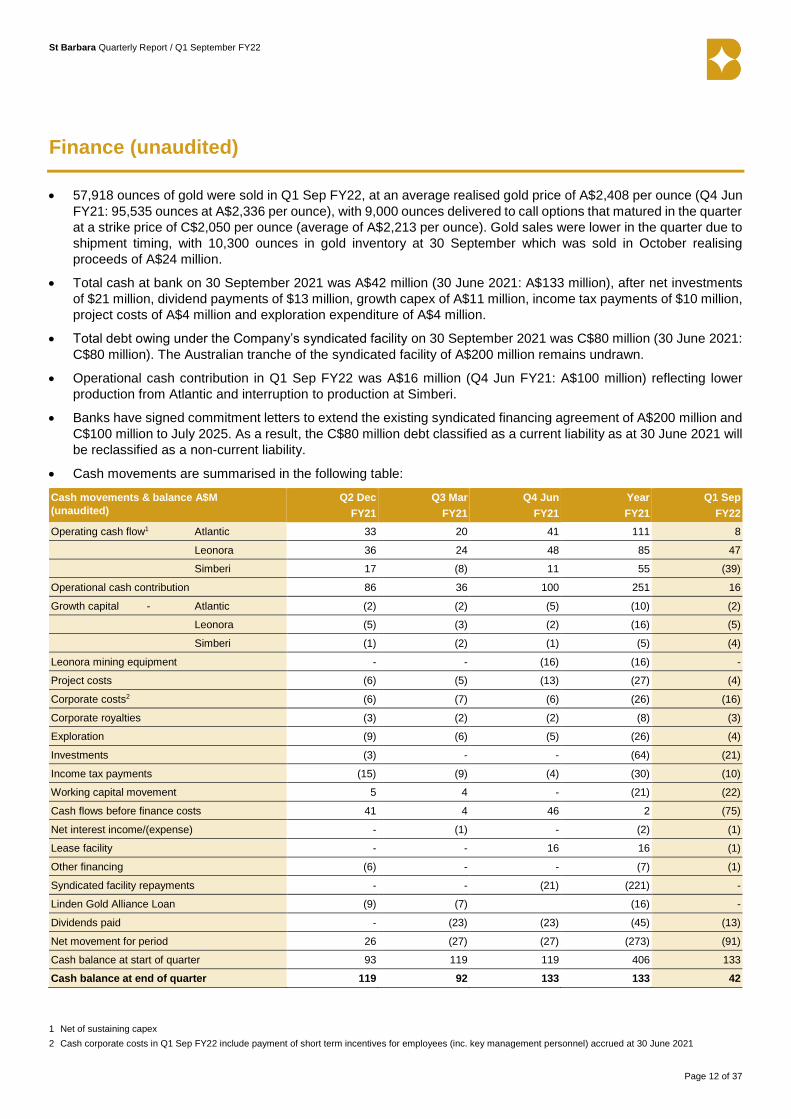
Cash movements are summarised in the following table:
Cash movements & balance A$M
(unaudited)
Q2 Dec
FY21
Q3 Mar
FY21
Q4 Jun
FY21
Year
FY21
Q1 Sep
FY22
Operating cash flow1 Atlantic 33 20 41 111 8
Leonora 36 24 48 85 47
Simberi 17 (8) 11 55 (39)
Operational cash contribution 86 36 100 251 16
Growth capital - Atlantic (2) (2) (5) (10) (2)
Leonora (5) (3) (2) (16) (5)
Simberi (1) (2) (1) (5) (4)
Leonora mining equipment - - (16) (16) -
Project costs (6) (5) (13) (27) (4)
Corporate costs2 (6) (7) (6) (26) (16)
Corporate royalties (3) (2) (2) (8) (3)
Exploration (9) (6) (5) (26) (4)
Investments (3) - - (64) (21)
Income tax payments (15) (9) (4) (30) (10)
Working capital movement 5 4 - (21) (22)
Cash flows before finance costs 41 4 46 2 (75)
Net interest income/(expense) - (1) - (2) (1)
Lease facility - - 16 16 (1)
Other financing (6) - - (7) (1)
Syndicated facility repayments - - (21) (221) -
Linden Gold Alliance Loan (9) (7) (16) -
Dividends paid - (23) (23) (45) (13)
Net movement for period 26 (27) (27) (273) (91)
Cash balance at start of quarter 93 119 119 406 133
Cash balance at end of quarter 119 92 133 133 42
1 Net of sustaining capex
2 Cash corporate costs in Q1 Sep FY22 include payment of short term incentives for employees (inc. key management personnel) accrued at 30 June 2021

St Barbara Quarterly Report / Q1 September FY22
Page 13 of 37
Hedging in place at the date of this report comprises:
Financial Year Volume ounces Price $/oz Type Delivery Delivery schedule
Nov 21 to Dec 22
Nov 21 to Jun 22
54,010
80,000
C$2,050
A$2,465
European call options
Forwards
Nov 2021 to Dec 2022
Nov 2021 to June 2022
Monthly
Monthly
Guidance
FY22 guidance is for consolidated gold production of between 305,000 and 355,000 ounces at an AISC of between
A$1,710 and A$1,860 per ounce.
Gold production
(koz)
AISC
(A$/oz)
Sustaining capex
(A$M)
Growth capex
(A$M)
Atlantic Operations 65 – 85 1,305 – 1,5151 15 – 20 30 – 40
Leonora Operations 180 – 200 1,605 – 1,720 65 – 75 15 – 20
Simberi Operations 60 – 70 2,465 – 2,6502 15 – 20 25 – 35
Consolidated 305 – 355 1,710 – 1,860 95 – 115 70 – 95
Corporate
Share Capital
Issued shares ASX:SBM
Opening Balance 30 June 2021 708,023,789
Issued3 1,503,260
Closing balance 30 September 2021 709,527,049
Unlisted employee rights ASX:SBMAK
Opening balance 30 June 2021 3,443,154
Issued Nil
Exercised as shares -167,116
Lapsed4 -428,833
Closing balance 30 September 2021 2,847,205
Comprises rights expiring:
30 June 2022 1,183,530
30 June 2023 1,639,512
Unlisted rights issued under the NED Equity Plan 24,163
Closing balance 30 September 2021 2,847,205
1 C$1,240 to C$1,440 per ounce at AUD/CAD of 0.95
2 US$1,850 to US$1,990 per ounce at AUD/USD of 0.75
3 ASX Appendix 2A 3 Aug 2021 shares issued to MD&CEO, Appendix 2A 26 Aug 2021 shares issued to satisfy vested performance rights, Appendix 2A 23 Sep
2021 shares issued in accordance with the St Barbara Tax Exempt Share Plan, Appendix 2A 30 Sep 2021 shares issued in accordance with the St Barbara Dividend
Reinvestment Plan
4 Rights lapsed due to conditions not being met

St Barbara Quarterly Report / Q1 September FY22
Page 14 of 37
Exploration Figures and Tables
Figure 1.0: Leonora Target Location Map
Figure 1.1: Jasper Region – RC Drilling Program Q1 FY22

St Barbara Quarterly Report / Q1 September FY22
Page 15 of 37
Figure 1.2: Trevor Bore RC Drilling Q1 FY22 Results
Figure 1.3: Trevor Bore RC Drilling Q1 FY22 Results, Cross Section (looking west-northwest)
St Barbara Quarterly Report / Q1 September FY22
Page 16 of 37
Figure 1.4: Trevor Bore RC Drilling Q1 FY22 Results, Cross Section (looking west-northwest)
Figure 1.5: Jasper Hill RC Drilling Q1 FY22 Results
St Barbara Quarterly Report / Q1 September FY22
Page 17 of 37
Figure 1.6: Falklands Trend, Hawaii and Atlantis RC Drilling Q1 FY22 Results
Figure 2.0: Lake Wells Gold Project Drilling
Location Map
Figure 2.1: Lake Wells Drilling Location Map
(Enlargement) – maximum gold in bedrock
St Barbara Quarterly Report / Q1 September FY22
Page 18 of 37
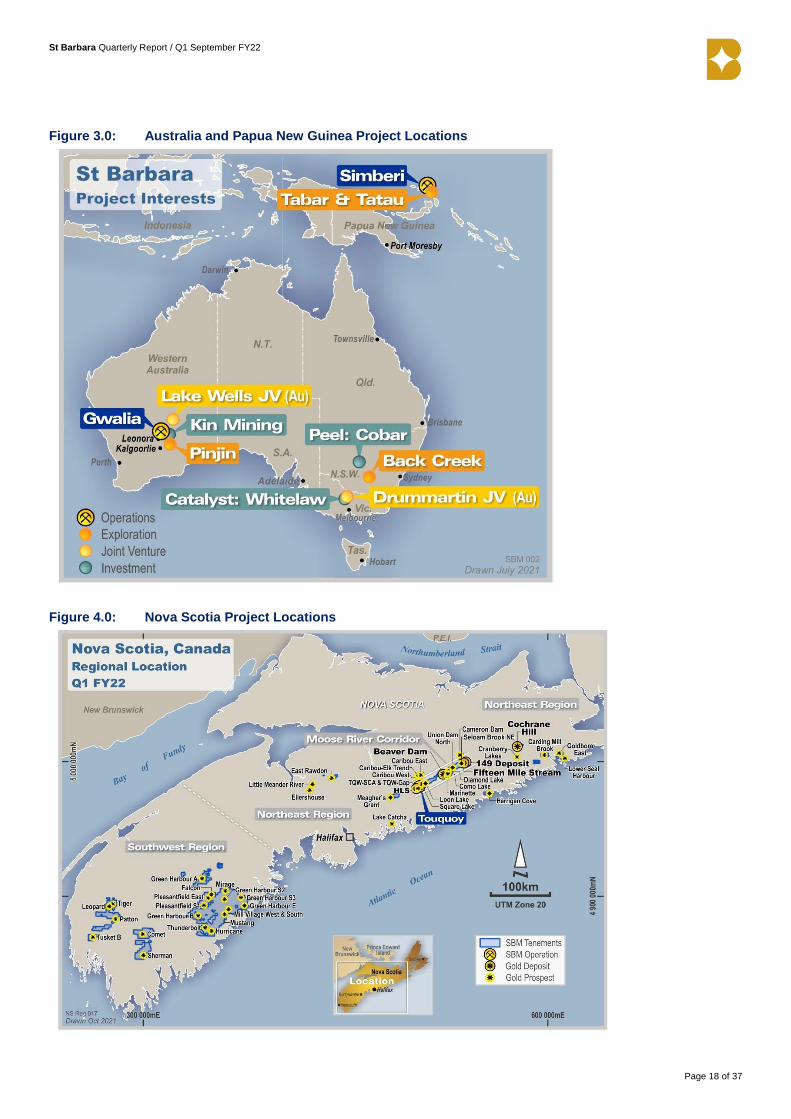
Figure 3.0: Australia and Papua New Guinea Project Locations
Figure 4.0: Nova Scotia Project Locations
St Barbara Quarterly Report / Q1 September FY22
Page 19 of 37
Figure 5.0: Tabar Islands Location Map, Papua New Guinea
Figure 5.1: Drilling Location on ML136, Simberi Island, Papua New Guinea

St Barbara Quarterly Report / Q1 September FY22
Page 20 of 37
Figure 5.2: Trotsky Drilling Q1 FY22 Results, Simberi Island, Papua New Guinea
Figure 5.3: Trotsky Drilling Q1 FY22 Results, Oblique Section (looking east-southeast)

St Barbara Quarterly Report / Q1 September FY22
Page 21 of 37
Figure 5.4: Andora Drilling Q1 FY22 Results, Simberi Island, Papua New Guinea
Figure 5.5: Andora Drilling Q1 FY22 Results, Cross Section (looking west)
St Barbara Quarterly Report / Q1 September FY22
Page 22 of 37
Figure 5.6: Bekou South Planned Drilling FY22, Simberi Island, Papua New Guinea
Figure 5.7: Bekou South Cross Section Planned Drilling FY22, Simberi Island, Papua New Guinea
St Barbara Quarterly Report / Q1 September FY22
Page 23 of 37
Table 1: Jasper Area Significant Intercepts – Leonora, WA
Hole Id North East RL Dip/ Azimuth
Metres Below Surface
Down-hole Mineralised Intersection
m M m degrees m From To Interval Gold grade
m m m g/t Au
FARC017 327,703 6,817,083 394.5 -60 / 323 96 No Significant Results
FARC018 327,672 6,817,059 395.2 -61 / 325 110 32 36 4 0.6
including 32 33 1 1.5
FARC019 327,601 6,817,035 396.3 -60 / 325 102 39 42 3 1.6
67 68 1 12.0
FARC020 327,464 6,816,998 397.7 -61 / 329 90 47 54 7 3.2
including 47 48 1 6.0
and 53 54 1 6.5
FARC021 327,423 6,816,987 398.2 -60/328 90 40 42 2 2.2
FARC022 327,364 6,816,926 397.5 -61/327 120 66 68 2 1.0
FARC023 327,355 6,816,875 398.0 -61/320 130 No Significant Results
FARC024 327,314 6,816,877 398.4 -61/323 120 No Significant Results
FARC025 327,265 6,816,864 398.6 -61/326 90 No Significant Results
FARC026 327,134 6,816,806 400.1 -60/325 96 No Significant Results
FARC027 327,072 6,816,747 400.6 -61/327 96 No Significant Results
FARC028 326,999 6,816,673 400.0 -61/324 126 No Significant Results
FARC029 326,919 6,816,603 398.6 -62/325 120 No Significant Results
FARC030 326,878 6,816,661 400.7 -62/324 102 No Significant Results
FARC031 326,952 6,816,738 402.8 -60/326 90 29 31 2 3.5
including 29 30 1 6.9
71 75 4 0.8
78 85 7 0.6
FARC032 327,025 6,816,812 403.9 -61/325 60 No Significant Results
FARC033 327,087 6,816,901 405.3 -61/002 90 24 26 2 2.2
including 25 26 1 4.0
FARC034 326,765 6,816,976 408.9 -60/148 45 No Significant Results
FARC035 326,716 6,816,972 407.2 -62/145 186 No Significant Results
FARC036 326,807 6,817,056 411.4 -61/145 180 110 119 9 3.1
including 114 119 5 4.8
FARC037 326,891 6,817,040 413.4 -61/324 120 No Significant Results
FARC038 326,857 6,816,989 412.6 -61/144 90 No Significant Results
FARC039 326,932 6,817,086 413.4 -60/330 100 76 79 3 0.8
82 88 6 0.4
FARC040 326,963 6,817,111 411.9 -61/326 120 34 35 1 27.3
100 104 4 0.6
FARC041 326,976 6,817,160 411.6 -60/326 60 50 52 2 3.3
FARC042 327,012 6,817,180 410.9 -61/328 50 No Significant Results
JHRC062 326,659 6,817,612 407.2 -55/323 180 35 38 3 2.8

St Barbara Quarterly Report / Q1 September FY22
Page 24 of 37
Table 1 cont: Jasper Area Significant Intercepts – Leonora, WA
Hole Id North East RL Dip/ Azimuth
Metres Below Surface
Down-hole Mineralised Intersection
m m m degrees m From To Interval Gold grade
m m m g/t Au
JHRC063 326,798 6,817,731 403.9 -55/325 180 109 110 1 3.2
114 115 1 2.8
123 131 8 1.6
including 127 128 1 6.2
JHRC064 326,815 6,817,803 405.0 -61/326 160 21 25 4 1.5
46 57 11 1.9
including 51 53 2 4.9
98 99 1 4.7
JHRC065 326,858 6,817,812 404.3 -60/327 200 87 88 1 4.6
149 153 4 0.7
JHRC066 326,831 6,817,851 405.2 -60/323 150 11 12 1 3.1
41 44 3 2.2
91 94 3 6.3
including 91 92 1 14.9
JHRC067 326,771 6,817,831 407.1 -60/324 102 27 31 4 1.5
JHRC068 326,681 6,817,858 410.7 -60/344 36 No Significant Results
JHRC069 326,679 6,817,859 410.7 -61/326 168 16 31 15 1.5
including 21 22 1 8.3
JHRC070 326,652 6,817,865 411.3 -61/145 210 18 32 14 1.4
86 88 2 2.2
194 196 2 3.5
JHRC071 326,521 6,817,772 409.1 -60/325 75 36 40 4 1.4
JHRC072 326,552 6,817,754 408.3 -55/148 200 100 102 2 1.3
193 198 5 1.4
JHRC073 326,469 6,817,495 412.8 -55/326 120 No Significant Results
JHRC074 326,514 6,817,501 412.1 -56/327 150 No Significant Results
JHRC075 326,543 6,817,530 410.8 -54/325 150 60 61 1 2.3
78 88 10 1.6
including 79 80 1 5.8
JHRC076 326,574 6,817,556 409.9 -55/326 200 63 65 2 2.6
including 63 64 1 4.8
JHRC077 326,608 6,817,577 409.2 -55/339 42 No Significant Results
JHRC078 326,606 6,817,579 409.1 -55/328 200 24 28 4 1.0
68 69 1 2.4
TBRC012 327,049 6,818,158 396.5 -61/198 90 No Significant Results
TBRC013 327,135 6,818,161 396.1 -80/200 120 No Significant Results

St Barbara Quarterly Report / Q1 September FY22
Page 25 of 37
Table 1 cont: Jasper Area Significant Intercepts – Leonora, WA
Hole Id North East RL Dip/ Azimuth
Metres Below Surface
Down-hole Mineralised Intersection
m m m degrees m From To Interval Gold grade
m m m g/t Au
TBRC014 327,187 6,818,173 395.4 -75/198 156 87 103 16 2.0
including 94 95 1 8.8
and 98 100 2 4.3
TBRC015 327,217 6,818,165 395.3 -67/200 130 No Significant Results
TBRC016 327,237 6,818,122 395.4 -60/198 96 62 65 3 1.0
TBRC017 327,311 6,818,009 396.3 -70/201 100 68 71 3 1.7
TBRC018 327,496 6,817,959 397.0 -60/198 130 60 65 5 0.4
TBRC019 327,460 6,817,976 396.6 -60/198 130 101 102 1 2.8
TBRC020 327,499 6,817,858 398.0 -59/198 40 24 26 2 5.6
TBRC021 327,468 6,817,860 398.1 -50/198 25 17 22 5 2.0
TBRC022 327,428 6,817,880 398.1 -61/196 50 17 24 7 10.5
including 21 22 1 44.5
ASRC001 324,490 6,818,094 391.7 -61/235 96 No Significant Results
ASRC002 324,544 6,818,138 392.0 -61/234 102 No Significant Results
ASRC003 324,582 6,818,164 392.4 -60/235 114 No Significant Results
ASRC004 324,565 6,818,053 392.5 -61/234 160 No Significant Results
ASRC005 324,587 6,817,960 394.1 -60/236 90 No Significant Results
ASRC006 324,629 6,817,988 393.6 -60/236 90 No Significant Results
NOTES:
Coordinates and Azimuth referenced to MGA94 zone 51 Grid.
Reported intercepts are all down hole lengths.
Dip and azimuth represent drill hole at collar.
Grades are reported to one decimal figure.
St Barbara Quarterly Report / Q1 September FY22
Page 26 of 37
Table 2: Simberi DD Significant Intercepts – Simberi Island, Papua New Guinea
Hole Id
North East RL Dip/
Azimuth
Total
Depth
Lode
Down-hole
Mineralised Intersection
m m m degrees m From To Interval
Gold
grade
m m m g/t Au
SDH436 (Cell Tower) 208,929 43,887 219.4 -60 / 180 139 OX 36 43 7 1.1
including OX 36 39 3 2.2
SDH437 (Cell Tower) 208,921 43,861 214.0 -60 / 180 131.3 OX,TR,SU 8 18 10 0.6
OX,SU 76 79 3 1.9
including OX 76 78 2 2.5
SDH438 (Cell Tower) 208,930 43,932 239.7 -60 / 135 140 No Significant Results
SDH439 (Bekou South)* 207,288 44,292 96.5 -60 / 333 95 No Significant Results
SDH440 (Bekou South) 207,198 44,343 113.5 -60 / 332 120 No Significant Results
SDH441 (Bekou South)* 207,241 44,319 101.3 -60 / 333 104 TR,SU 4 25 21 0.9
including TR 6 8 2 1.4
and SU 21 25 4 2.4
SU 48 52 4 2.0
SDH442 (Sorowar NW)* 210,519 43,721 166.4 -60 / 045 100 TR,SU 58 74 16 0.7
NOTES:
Coordinates and Azimuth referenced to Tabar Island Grid (TIG).
*Site Lab Aqua Regia Au results.
Reported intercepts are all down hole lengths.
Grades are reported to one decimal figure.
OX: oxide, SU: sulphide, TR: transitional material.

St Barbara Quarterly Report / Q1 September FY22
Page 27 of 37
Table 3: Simberi RC Significant Intercepts – Simberi Island, Papua New Guinea
Hole Id
North East RL Dip/
Azimuth
Total
Depth
Lode
Down-hole
Mineralised Intersection
m m m degrees m From To Interval
Gold
grade
m M m g/t Au
SRCH095 (Cell Tower) 208,916 44,080 252.6 -60 / 135 140 SU 31 49 18 0.9
including SU 31 37 6 1.4
OX,TR,SU 102 121 19 0.6
including OX 103 106 3 2.1
SRCH100 (Cell Tower) 208,979 44,017 240.2 -60 / 135 160 No Significant Results
SRCH101 (Cell Tower) 208,898 44,014 256.8 -60 / 135 160 OX,TR,SU 82 86 4 1.7
including OX,TR 83 85 2 2.8
OX,TR 100 102 2 1.9
TR,SU 116 126 10 0.7
including TR 123 126 3 1.6
SRCH102 (Cell Tower) 208,823 44,054 252.2 -60 / 135 103 OX 43 52 9 1.3
OX,TR,SU 64 77 13 1.3
SRCH103 (Cell Tower) 208,822 44,053 252.3 -60 / 220 140 No Significant Results
SRCH104 (Cell Tower) 208,826 44,056 252.7 -60 / 135 140 OX 33 37 4 1.0
OX,TR,SU 67 81 14 1.1
SRCH105 (Magazine)* 210,158 43,913 209.8 -60 / 045 80 OX 42 50 8 0.9
SRCH106 (Magazine)* 210,116 43,872 203.5 -60 / 045 100 OX,SU 25 28 3 1.6
SRCH107 (Magazine)* 210,193 43,907 196.6 -60 / 045 60 OX,TR 1 11 10 1.1
SRCH108 (Magazine) 210,159 43,878 196.3 -60 / 045 120 No Significant Results
SRCH109 (Magazine)* 210,211 43,852 170.2 -60 / 045 60 No Significant Results
SRCH110 (Botlu South)* 208,229 43,046 152.0 -60 / 225 60 OX 6 18 12 0.7
including OX 10 12 2 1.6
SRCH111 (Botlu South)* 208,174 43,066 131.4 -60 / 225 60 No Significant Results
SRCH112 (Botlu South)* 208,277 43,007 120.0 -60 / 225 60 No Significant Results
SRCH113 (Botlu South)* 208,266 43,085 137.6 -60 / 225 60 SU 23 26 3 1.1
SRCH114 (Botlu South)* 208,208 43,110 144.6 -60 / 225 60 No Significant Results
SRCH115 (Botlu South)* 208,095 43,035 157.9 -60 / 225 60 No Significant Results
SRCH116 (Botlu South)* 208,097 43,037 157.7 -60 / 045 60 TR,SU 14 20 6 0.70
SRCH117 (Trotsky)* 208,713 43,220 210.3 -60 / 210 51 OX,SU 12 34 22 1.0
including OX 29 30 1 6.6
SRCH118 (Trotsky)* 208,683 43,243 182.4 -60 / 210 60 No Significant Results
SRCH119 (Trotsky)* 208,720 43,264 183.4 -60 / 210 60 No Significant Results

St Barbara Quarterly Report / Q1 September FY22
Page 28 of 37
Table 3 cont: Simberi RC Significant Intercepts – Simberi Island, Papua New Guinea
Hole Id
North East RL Dip/
Azimuth
Total
Depth
Lode
Down-hole
Mineralised Intersection
m m m degrees m From To Interval
Gold
grade
m m m g/t Au
SRCH120 (Trotsky)* 208,809 43,250 221.1 -60 / 210 120 OX,TR 71 81 10 0.5
SRCH121 (Trotsky)* 208,836 43,289 223.3 -60 / 210 100 OX,TR,SU 35 87 52 1.5
including SU 39 41 2 18.8
and SU 73 76 3 2.4
SRCH122 (Trotsky)* 208,900 43,252 198.4 -60 / 210 100 SU 74 77 3 1.4
SU 93 100 7 3.3
including SU 93 96 3 6.0
SRCH123 (Trotsky)* 208,902 43,255 198.3 -60 / 120 130 OX,TR 11 25 14 1.9
including OX 11 14 3 7.4
OX,TR,SU 58 90 32 2.0
including OX 67 70 3 3.4
and OX 74 78 4 12.2
SU 102 128 26 0.7
including SU 125 127 2 1.6
065ADGC00A (Andora)* 207,456 45,090 24.0 -60 / 000 60 OX,TR 28 60 32 5.5
065ADGC00B (Andora)* 207,446 45,091 25.0 -90 / 000 80 TR 12 44 32 1.0
including TR 30 38 8 1.7
065ADGC00C (Andora)* 207,448 45,086 25.1 -60 / 000 66 TR 26 66 40 1.8
including TR 28 32 4 3.0
NOTES:
Coordinates and Azimuth referenced to Tabar Island Grid (TIG).
*Site Lab Aqua Regia Au results.
Reported intercepts are all down hole lengths.
Grades are reported to one decimal figure.
OX: oxide, SU: sulphide, TR: transitional material.

St Barbara Quarterly Report / Q1 September FY22
Page 29 of 37
LEONORA – JORC Code, 2012 Edition – Table 1
Contents
Jasper Area Drilling: Section 1 Sampling Techniques and Data
Section 2 Reporting of Exploration Results
Jasper Area Drilling - Section 1 Sampling Techniques and Data
(Criteria in this section apply to all succeeding sections.)
Criteria Commentary
Sampling
techniques
Sampling was conducted via Reverse Circulation (RC) drilling.
One metre samples were generated by a rig-mounted cyclone splitter. One half of the split sample collected in calico bags and the other, collected by a bucket and placed on the ground in neat rows of thirty.
Samples were transported to the secure onsite processing facility for storage in bulka bags.
Bulka bags were picked up by an SGS laboratory representative and transported to SGS laboratory in Kalgoorlie for fire assay with a 50 g charge and analysis by Flame Atomic Absorption Spectrometry (FAA505 method).
Representative specimens from every metre were sieved, cleaned and stored in plastic chip trays for future reference.
Drilling techniques RC drilling was carried out using a 140 mm hammer bit. Drilling was completed by Top Drill who utilised a track mounted Schramm C685 rig with 1350 cfm/500 psi compressor coupled with an 8x8 carrier mounted auxiliary compressor and booster package.
Drill sample
recovery
RC sample recovery and condition (wet/dry) were routinely recorded.
The drill cyclone and sample buckets were cleaned regularly, in particular after wet ground was encountered. The cyclone was also cleaned several times during the course of each hole and after the completion of each hole.
Logging All drill holes were logged in full for lithology, alteration, veining, weathering/regolith and colour.
All logging is qualitative and quantitative.
Sub-sampling
techniques and
sample preparation
Samples received by SGS laboratories in Kalgoorlie were sorted, weighed and dried, followed by complete pulverisation (90% passing -75 µm).
Quality of assay
data and laboratory
tests
Sample charge sizes of 50 g for each one metre sample analysed by fire assay is considered appropriate for the sample medium (predominantly fresh rock).
Certified reference material, blanks and duplicate samples were inserted into the sample stream at a ratio of 1:20.
SGS Laboratories inserted certified standards, blanks and replicates and lab repeats.
Verification of
sampling and
assaying
Primary geological and sampling data were recorded into made for purpose excel spreadsheets, peer reviewed and validated by SBM Geologists.
Data was then transferred into the St Barbara corporate DataShed database where it was further validated by St Barbara’s Geological Database Administrator. No adjustments to assay data were made.
Location of data
points
Prior to drilling, all holes were marked out using a handheld GPS with ±3 m accuracy for easting, northings and ±10 m elevation.
Upon completion of the program, all holes were resurveyed using a DGPS with decimetre accuracy to determine the final collar positions.
All locations were captured in MGA94 zone 51 grid.
Downhole surveys were taken by the drilling contractor at 10 m intervals utilising a north seeking Axis gyro system.
Data spacing and
distribution
Drilling targeted down dip extensions of known mineralisation and was not designed on a regular pattern.
Orientation of data
in relation to
geological structure
The regional stratigraphy generally strikes NNW and dips approximately 30 degrees to the NE.
Planned drill hole dips ranged from -50 to -80 degrees at collar.
Drill hole orientation was consistent with historic drilling completed over the various prospects and was drilled perpendicular to the mineralised trends. At the Jasper Hill, Falklands and Hawaii prospects; this was towards a magnetic azimuth of either 325 degrees or 145 degrees. At Trevor Bore; this was towards a magnetic azimuth of 198 degrees and at Ascension this was towards a magnetic azimuth of 235 degrees.
Sample security Company personnel or approved contractors only allowed on drill sites; drill samples are only removed from drill site by company employees and transported to the company’s secure processing facility. Processed samples are consigned to accredited laboratories for sample preparation and analysis.
Audits or reviews Logging and sampling data was peer reviewed in-house by SBM Geologists.
St Barbara Quarterly Report / Q1 September FY22
Page 30 of 37
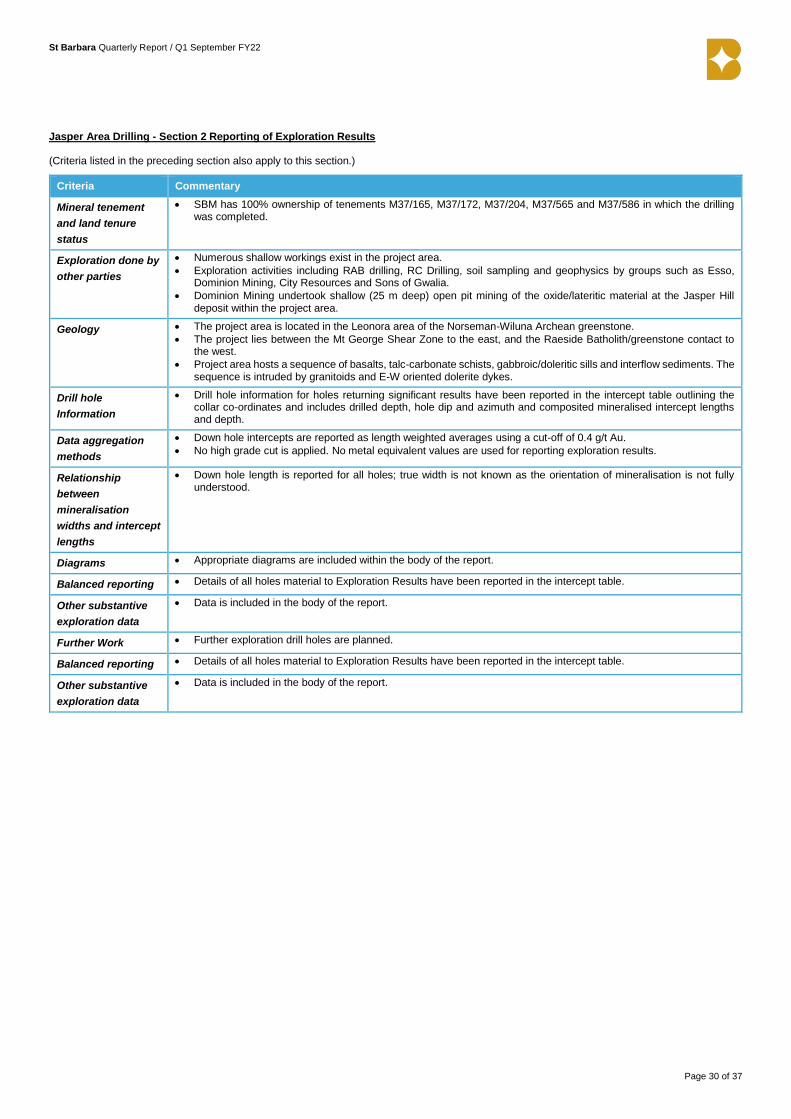
Jasper Area Drilling - Section 2 Reporting of Exploration Results
(Criteria listed in the preceding section also apply to this section.)
Criteria Commentary
Mineral tenement
and land tenure
status
SBM has 100% ownership of tenements M37/165, M37/172, M37/204, M37/565 and M37/586 in which the drilling was completed.
Exploration done by
other parties
Numerous shallow workings exist in the project area.
Exploration activities including RAB drilling, RC Drilling, soil sampling and geophysics by groups such as Esso, Dominion Mining, City Resources and Sons of Gwalia.
Dominion Mining undertook shallow (25 m deep) open pit mining of the oxide/lateritic material at the Jasper Hill deposit within the project area.
Geology The project area is located in the Leonora area of the Norseman-Wiluna Archean greenstone.
The project lies between the Mt George Shear Zone to the east, and the Raeside Batholith/greenstone contact to the west.
Project area hosts a sequence of basalts, talc-carbonate schists, gabbroic/doleritic sills and interflow sediments. The sequence is intruded by granitoids and E-W oriented dolerite dykes.
Drill hole
Information
Drill hole information for holes returning significant results have been reported in the intercept table outlining the collar co-ordinates and includes drilled depth, hole dip and azimuth and composited mineralised intercept lengths and depth.
Data aggregation
methods
Down hole intercepts are reported as length weighted averages using a cut-off of 0.4 g/t Au.
No high grade cut is applied. No metal equivalent values are used for reporting exploration results.
Relationship
between
mineralisation
widths and intercept
lengths
Down hole length is reported for all holes; true width is not known as the orientation of mineralisation is not fully understood.
Diagrams Appropriate diagrams are included within the body of the report.
Balanced reporting Details of all holes material to Exploration Results have been reported in the intercept table.
Other substantive
exploration data
Data is included in the body of the report.
Further Work Further exploration drill holes are planned.
Balanced reporting Details of all holes material to Exploration Results have been reported in the intercept table.
Other substantive
exploration data
Data is included in the body of the report.
St Barbara Quarterly Report / Q1 September FY22
Page 31 of 37
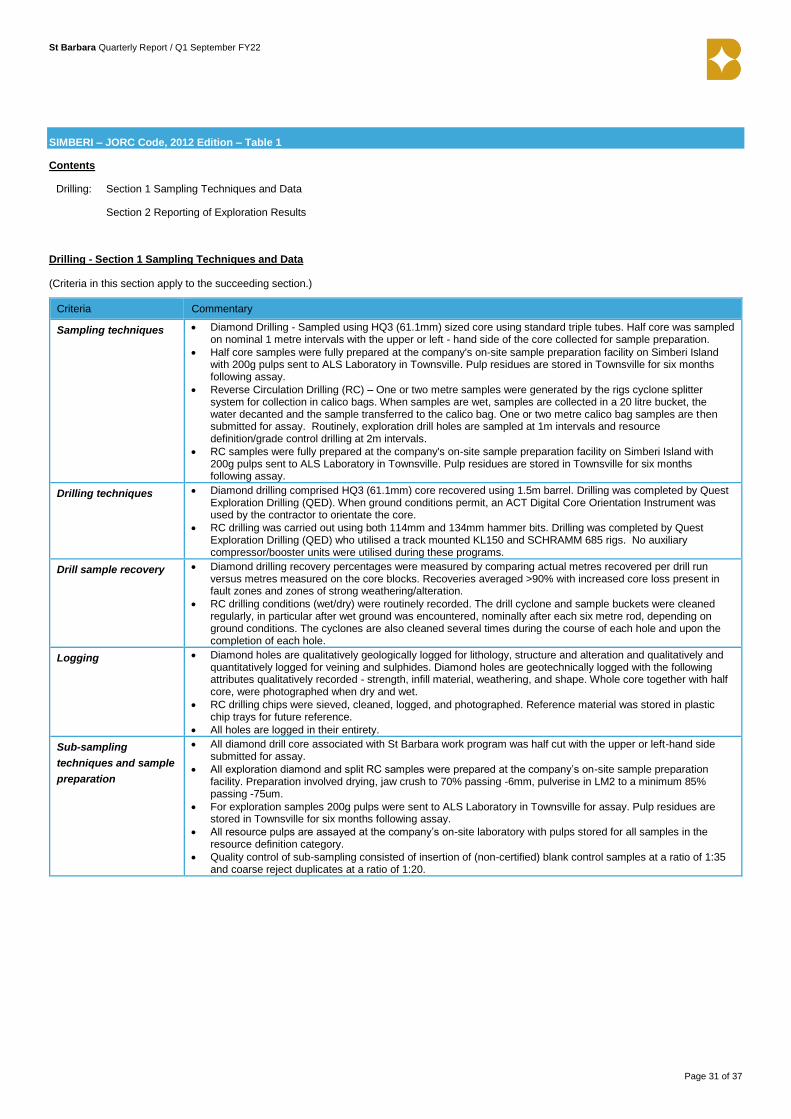
SIMBERI – JORC Code, 2012 Edition – Table 1
Contents
Drilling: Section 1 Sampling Techniques and Data
Section 2 Reporting of Exploration Results
Drilling - Section 1 Sampling Techniques and Data
(Criteria in this section apply to the succeeding section.)
Criteria Commentary
Sampling techniques Diamond Drilling - Sampled using HQ3 (61.1mm) sized core using standard triple tubes. Half core was sampled on nominal 1 metre intervals with the upper or left - hand side of the core collected for sample preparation.
Half core samples were fully prepared at the company's on-site sample preparation facility on Simberi Island with 200g pulps sent to ALS Laboratory in Townsville. Pulp residues are stored in Townsville for six months following assay.
Reverse Circulation Drilling (RC) – One or two metre samples were generated by the rigs cyclone splitter system for collection in calico bags. When samples are wet, samples are collected in a 20 litre bucket, the water decanted and the sample transferred to the calico bag. One or two metre calico bag samples are then submitted for assay. Routinely, exploration drill holes are sampled at 1m intervals and resource definition/grade control drilling at 2m intervals.
RC samples were fully prepared at the company's on-site sample preparation facility on Simberi Island with 200g pulps sent to ALS Laboratory in Townsville. Pulp residues are stored in Townsville for six months following assay.
Drilling techniques Diamond drilling comprised HQ3 (61.1mm) core recovered using 1.5m barrel. Drilling was completed by Quest Exploration Drilling (QED). When ground conditions permit, an ACT Digital Core Orientation Instrument was used by the contractor to orientate the core.
RC drilling was carried out using both 114mm and 134mm hammer bits. Drilling was completed by Quest Exploration Drilling (QED) who utilised a track mounted KL150 and SCHRAMM 685 rigs. No auxiliary compressor/booster units were utilised during these programs.
Drill sample recovery Diamond drilling recovery percentages were measured by comparing actual metres recovered per drill run versus metres measured on the core blocks. Recoveries averaged >90% with increased core loss present in fault zones and zones of strong weathering/alteration.
RC drilling conditions (wet/dry) were routinely recorded. The drill cyclone and sample buckets were cleaned regularly, in particular after wet ground was encountered, nominally after each six metre rod, depending on ground conditions. The cyclones are also cleaned several times during the course of each hole and upon the completion of each hole.
Logging Diamond holes are qualitatively geologically logged for lithology, structure and alteration and qualitatively and quantitatively logged for veining and sulphides. Diamond holes are geotechnically logged with the following attributes qualitatively recorded - strength, infill material, weathering, and shape. Whole core together with half core, were photographed when dry and wet.
RC drilling chips were sieved, cleaned, logged, and photographed. Reference material was stored in plastic chip trays for future reference.
All holes are logged in their entirety.
Sub-sampling
techniques and sample
preparation
All diamond drill core associated with St Barbara work program was half cut with the upper or left-hand side submitted for assay.
All exploration diamond and split RC samples were prepared at the company’s on-site sample preparation facility. Preparation involved drying, jaw crush to 70% passing -6mm, pulverise in LM2 to a minimum 85% passing -75um.
For exploration samples 200g pulps were sent to ALS Laboratory in Townsville for assay. Pulp residues are stored in Townsville for six months following assay.
All resource pulps are assayed at the company’s on-site laboratory with pulps stored for all samples in the resource definition category.
Quality control of sub-sampling consisted of insertion of (non-certified) blank control samples at a ratio of 1:35 and coarse reject duplicates at a ratio of 1:20.
St Barbara Quarterly Report / Q1 September FY22
Page 32 of 37
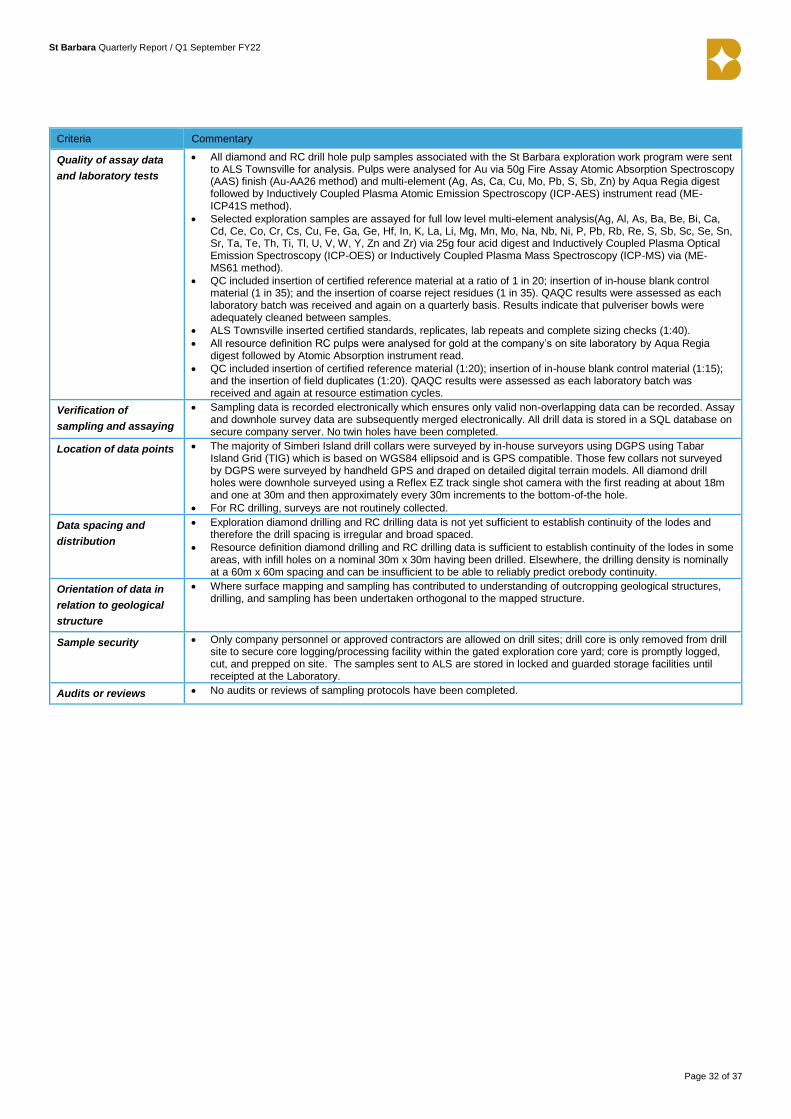
Criteria Commentary
Quality of assay data
and laboratory tests
All diamond and RC drill hole pulp samples associated with the St Barbara exploration work program were sent to ALS Townsville for analysis. Pulps were analysed for Au via 50g Fire Assay Atomic Absorption Spectroscopy (AAS) finish (Au-AA26 method) and multi-element (Ag, As, Ca, Cu, Mo, Pb, S, Sb, Zn) by Aqua Regia digest followed by Inductively Coupled Plasma Atomic Emission Spectroscopy (ICP-AES) instrument read (ME-ICP41S method).
Selected exploration samples are assayed for full low level multi-element analysis(Ag, Al, As, Ba, Be, Bi, Ca, Cd, Ce, Co, Cr, Cs, Cu, Fe, Ga, Ge, Hf, In, K, La, Li, Mg, Mn, Mo, Na, Nb, Ni, P, Pb, Rb, Re, S, Sb, Sc, Se, Sn, Sr, Ta, Te, Th, Ti, Tl, U, V, W, Y, Zn and Zr) via 25g four acid digest and Inductively Coupled Plasma Optical Emission Spectroscopy (ICP-OES) or Inductively Coupled Plasma Mass Spectroscopy (ICP-MS) via (ME-MS61 method).
QC included insertion of certified reference material at a ratio of 1 in 20; insertion of in-house blank control material (1 in 35); and the insertion of coarse reject residues (1 in 35). QAQC results were assessed as each laboratory batch was received and again on a quarterly basis. Results indicate that pulveriser bowls were adequately cleaned between samples.
ALS Townsville inserted certified standards, replicates, lab repeats and complete sizing checks (1:40).
All resource definition RC pulps were analysed for gold at the company’s on site laboratory by Aqua Regia digest followed by Atomic Absorption instrument read.
QC included insertion of certified reference material (1:20); insertion of in-house blank control material (1:15); and the insertion of field duplicates (1:20). QAQC results were assessed as each laboratory batch was received and again at resource estimation cycles.
Verification of
sampling and assaying
Sampling data is recorded electronically which ensures only valid non-overlapping data can be recorded. Assay and downhole survey data are subsequently merged electronically. All drill data is stored in a SQL database on secure company server. No twin holes have been completed.
Location of data points The majority of Simberi Island drill collars were surveyed by in-house surveyors using DGPS using Tabar Island Grid (TIG) which is based on WGS84 ellipsoid and is GPS compatible. Those few collars not surveyed by DGPS were surveyed by handheld GPS and draped on detailed digital terrain models. All diamond drill holes were downhole surveyed using a Reflex EZ track single shot camera with the first reading at about 18m and one at 30m and then approximately every 30m increments to the bottom-of-the hole.
For RC drilling, surveys are not routinely collected.
Data spacing and
distribution
Exploration diamond drilling and RC drilling data is not yet sufficient to establish continuity of the lodes and therefore the drill spacing is irregular and broad spaced.
Resource definition diamond drilling and RC drilling data is sufficient to establish continuity of the lodes in some areas, with infill holes on a nominal 30m x 30m having been drilled. Elsewhere, the drilling density is nominally at a 60m x 60m spacing and can be insufficient to be able to reliably predict orebody continuity.
Orientation of data in
relation to geological
structure
Where surface mapping and sampling has contributed to understanding of outcropping geological structures, drilling, and sampling has been undertaken orthogonal to the mapped structure.
Sample security Only company personnel or approved contractors are allowed on drill sites; drill core is only removed from drill site to secure core logging/processing facility within the gated exploration core yard; core is promptly logged, cut, and prepped on site. The samples sent to ALS are stored in locked and guarded storage facilities until receipted at the Laboratory.
Audits or reviews No audits or reviews of sampling protocols have been completed.
St Barbara Quarterly Report / Q1 September FY22
Page 33 of 37
Drilling - Section 2 Reporting of Exploration Results
(Criteria listed in the preceding section also apply to this section.)
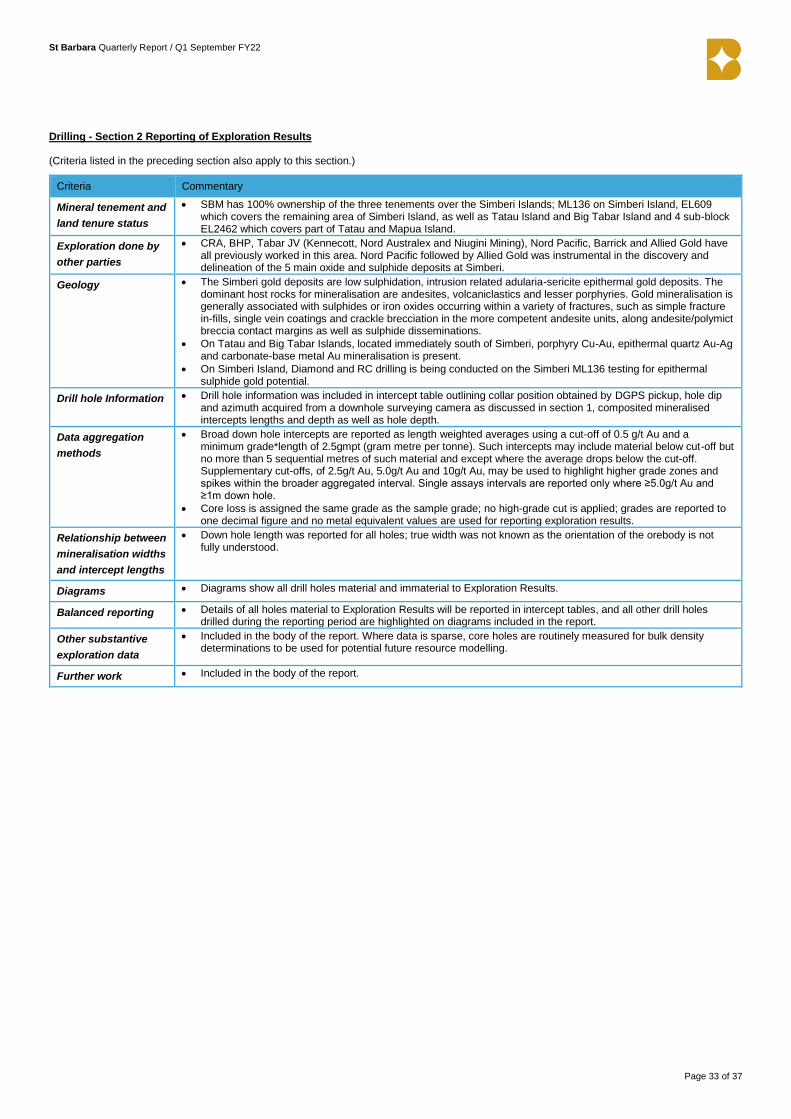
Criteria Commentary
Mineral tenement and
land tenure status
SBM has 100% ownership of the three tenements over the Simberi Islands; ML136 on Simberi Island, EL609 which covers the remaining area of Simberi Island, as well as Tatau Island and Big Tabar Island and 4 sub-block EL2462 which covers part of Tatau and Mapua Island.
Exploration done by
other parties
CRA, BHP, Tabar JV (Kennecott, Nord Australex and Niugini Mining), Nord Pacific, Barrick and Allied Gold have all previously worked in this area. Nord Pacific followed by Allied Gold was instrumental in the discovery and delineation of the 5 main oxide and sulphide deposits at Simberi.
Geology The Simberi gold deposits are low sulphidation, intrusion related adularia-sericite epithermal gold deposits. The dominant host rocks for mineralisation are andesites, volcaniclastics and lesser porphyries. Gold mineralisation is generally associated with sulphides or iron oxides occurring within a variety of fractures, such as simple fracture in-fills, single vein coatings and crackle brecciation in the more competent andesite units, along andesite/polymict breccia contact margins as well as sulphide disseminations.
On Tatau and Big Tabar Islands, located immediately south of Simberi, porphyry Cu-Au, epithermal quartz Au-Ag and carbonate-base metal Au mineralisation is present.
On Simberi Island, Diamond and RC drilling is being conducted on the Simberi ML136 testing for epithermal sulphide gold potential.
Drill hole Information Drill hole information was included in intercept table outlining collar position obtained by DGPS pickup, hole dip and azimuth acquired from a downhole surveying camera as discussed in section 1, composited mineralised intercepts lengths and depth as well as hole depth.
Data aggregation
methods
Broad down hole intercepts are reported as length weighted averages using a cut-off of 0.5 g/t Au and a minimum grade*length of 2.5gmpt (gram metre per tonne). Such intercepts may include material below cut-off but no more than 5 sequential metres of such material and except where the average drops below the cut-off. Supplementary cut-offs, of 2.5g/t Au, 5.0g/t Au and 10g/t Au, may be used to highlight higher grade zones and spikes within the broader aggregated interval. Single assays intervals are reported only where ≥5.0g/t Au and ≥1m down hole.
Core loss is assigned the same grade as the sample grade; no high-grade cut is applied; grades are reported to one decimal figure and no metal equivalent values are used for reporting exploration results.
Relationship between
mineralisation widths
and intercept lengths
Down hole length was reported for all holes; true width was not known as the orientation of the orebody is not fully understood.
Diagrams Diagrams show all drill holes material and immaterial to Exploration Results.
Balanced reporting Details of all holes material to Exploration Results will be reported in intercept tables, and all other drill holes drilled during the reporting period are highlighted on diagrams included in the report.
Other substantive
exploration data
Included in the body of the report. Where data is sparse, core holes are routinely measured for bulk density determinations to be used for potential future resource modelling.
Further work Included in the body of the report.
St Barbara Quarterly Report / Q1 September FY22
Page 34 of 37
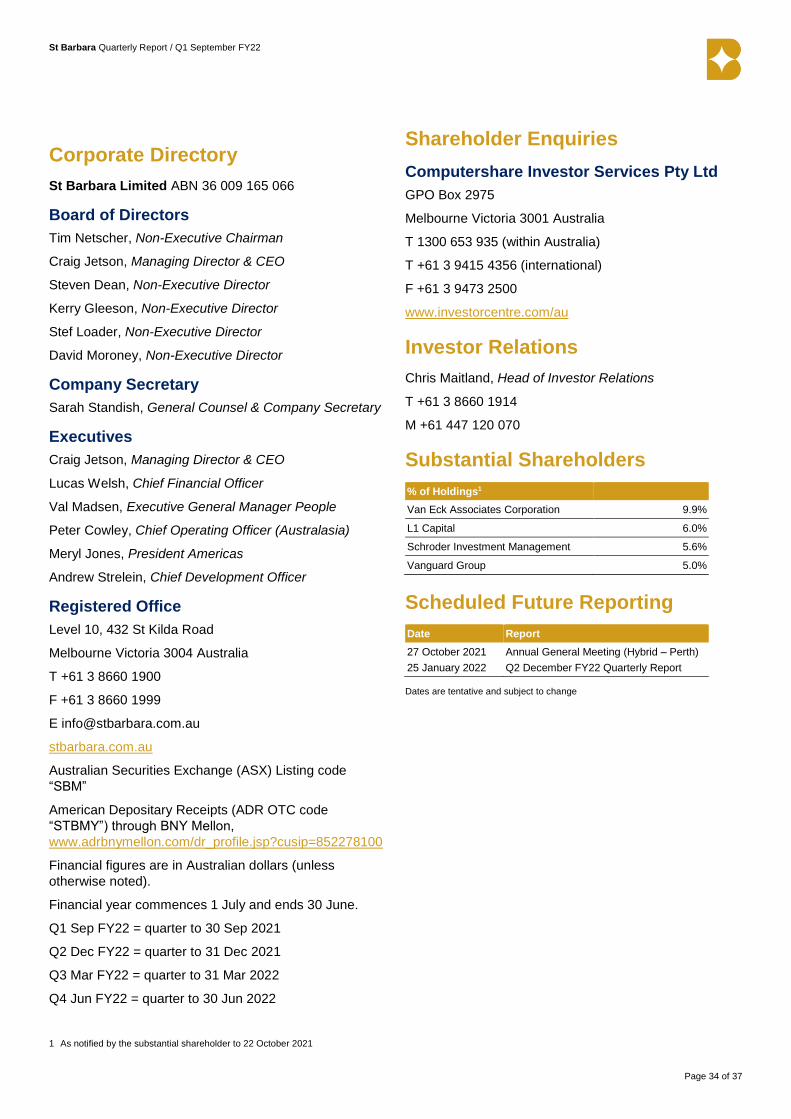
Corporate Directory
St Barbara Limited ABN 36 009 165 066
Board of Directors
Tim Netscher, Non-Executive Chairman
Craig Jetson, Managing Director & CEO
Steven Dean, Non-Executive Director
Kerry Gleeson, Non-Executive Director
Stef Loader, Non-Executive Director
David Moroney, Non-Executive Director
Company Secretary
Sarah Standish, General Counsel & Company Secretary
Executives
Craig Jetson, Managing Director & CEO
Lucas Welsh, Chief Financial Officer
Val Madsen, Executive General Manager People
Peter Cowley, Chief Operating Officer (Australasia)
Meryl Jones, President Americas
Andrew Strelein, Chief Development Officer
Registered Office
Level 10, 432 St Kilda Road
Melbourne Victoria 3004 Australia
T +61 3 8660 1900
F +61 3 8660 1999
stbarbara.com.au
Australian Securities Exchange (ASX) Listing code
“SBM”
American Depositary Receipts (ADR OTC code
“STBMY”) through BNY Mellon,
www.adrbnymellon.com/dr_profile.jsp?cusip=852278100
Financial figures are in Australian dollars (unless
otherwise noted).
Financial year commences 1 July and ends 30 June.
Q1 Sep FY22 = quarter to 30 Sep 2021
Q2 Dec FY22 = quarter to 31 Dec 2021
Q3 Mar FY22 = quarter to 31 Mar 2022
Q4 Jun FY22 = quarter to 30 Jun 2022
1 As notified by the substantial shareholder to 22 October 2021
Shareholder Enquiries
Computershare Investor Services Pty Ltd
GPO Box 2975
Melbourne Victoria 3001 Australia
T 1300 653 935 (within Australia)
T +61 3 9415 4356 (international)
F +61 3 9473 2500
www.investorcentre.com/au
Investor Relations
Chris Maitland, Head of Investor Relations
T +61 3 8660 1914
M +61 447 120 070
Substantial Shareholders
% of Holdings1
Van Eck Associates Corporation 9.9%
L1 Capital 6.0%
Schroder Investment Management 5.6%
Vanguard Group 5.0%
Scheduled Future Reporting
Date Report
27 October 2021
25 January 2022
Annual General Meeting (Hybrid – Perth)
Q2 December FY22 Quarterly Report
Dates are tentative and subject to change

St Barbara Quarterly Report / Q1 September FY22
Page 35 of 37
Appendix
Site gold production
Production summary Atlantic Operations Leonora Operations
Q2 Dec Q3 Mar Q4 Jun FY21 Q1 Sep Q2 Dec Q3 Mar Q4 Jun FY21 Q1 Sep
Ore Mined kt 854 813 967 3,710 447 157 168 195 605 179
Waste mined kt 1,087 1,214 1,284 4,722 1,753 84 73 71 331 105
Mined grade g/t 0.91 0.71 0.91 0.88 0.63 8.3 8.0 6.5 7.6 8.6
Ore milled1 kt 714 711 795 2,918 737 177 194 281 749 244
Milled grade1 g/t 1.24 0.96 1.11 1.15 0.70 7.6 7.1 5.2 6.6 6.8
Recovery % 94 93 94 94 92 97 97 96 97 97
Gold production oz 26,693 20,606 26,718 101,243 15,243 42,198 42,716 45,157 152,696 51,757
Gold sold oz 29,294 19,581 28,312 99,976 12,446 47,846 36,864 49,597 150,797 45,472
Realised gold price A$/oz 1,966 2,099 2,311 2,062 2,264 2,022 2,298 2,348 2,185 2,439
All-In Sustaining Cost2
A$/oz produced
Mining 280 344 268 286 508 711 734 955 844 658
Processing 302 405 333 331 488 101 163 173 158 177
Site Services 139 179 145 144 232 117 104 79 116 114
Stripping and ore inventory adj (29) (65) (31) (43) (78) 11 (3) 4 9 32
692 863 715 718 1,150 964 995 1,208 1,127 981
By-product credits (2) (2) (2) (2) (2) (3) (3) (3) (3) (3)
Third party refining & transport 3 2 3 2 3 2 2 2 1 1
Royalties 43 40 53 43 37 74 50 64 60 54
Total cash operating costs 736 903 769 761 1,188 1,013 1,047 1,274 1,185 1,033
Corporate and administration 75 89 67 77 123 75 89 67 77 88
Corporate royalty* - - - - - 59 43 49 49 46
Rehabilitation 13 16 18 14 31 8 8 8 8 6
Capitalised mine development* - - - - - 342 312 184 359 208
Sustaining capital expenditure 175 120 157 175 162 76 56 81 67 28
All-In Sustaining Cost (AISC)
(Gwalia)*
1,409
Ore purchased* 79
All-In Sustaining Cost (AISC) 999 1,128 1,011 1,027 1,504 1,573 1,555 1,663 1,744 1,488
* These items only relevant to Gwalia
1 Includes Gwalia mineralised waste
2 Non-IFRS measure, refer Appendix
St Barbara Quarterly Report / Q1 September FY22
Page 36 of 37
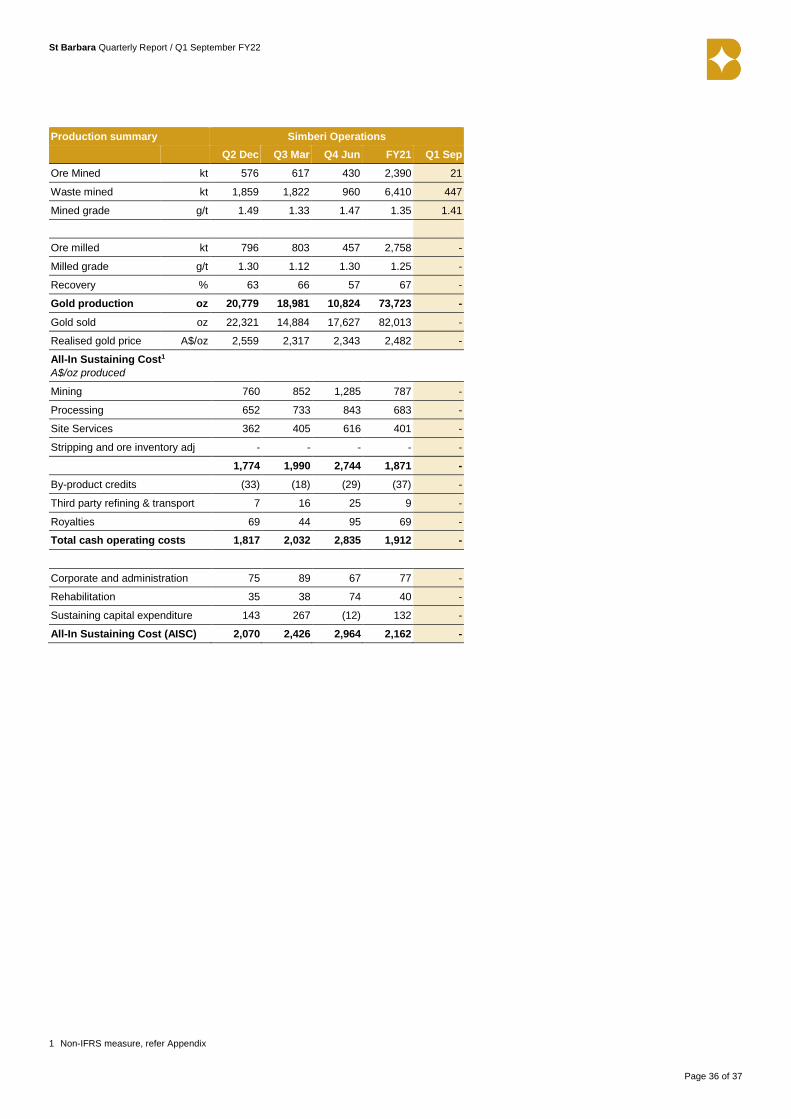
Production summary Simberi Operations
Q2 Dec Q3 Mar Q4 Jun FY21 Q1 Sep
Ore Mined kt 576 617 430 2,390 21
Waste mined kt 1,859 1,822 960 6,410 447
Mined grade g/t 1.49 1.33 1.47 1.35 1.41
Ore milled kt 796 803 457 2,758 -
Milled grade g/t 1.30 1.12 1.30 1.25 -
Recovery % 63 66 57 67 -
Gold production oz 20,779 18,981 10,824 73,723 -
Gold sold oz 22,321 14,884 17,627 82,013 -
Realised gold price A$/oz 2,559 2,317 2,343 2,482 -
All-In Sustaining Cost1
A$/oz produced
Mining 760 852 1,285 787 -
Processing 652 733 843 683 -
Site Services 362 405 616 401 -
Stripping and ore inventory adj - - - - -
1,774 1,990 2,744 1,871 -
By-product credits (33) (18) (29) (37) -
Third party refining & transport 7 16 25 9 -
Royalties 69 44 95 69 -
Total cash operating costs 1,817 2,032 2,835 1,912 -
Corporate and administration 75 89 67 77 -
Rehabilitation 35 38 74 40 -
Sustaining capital expenditure 143 267 (12) 132 -
All-In Sustaining Cost (AISC) 2,070 2,426 2,964 2,162 -
1 Non-IFRS measure, refer Appendix

St Barbara Quarterly Report / Q1 September FY22
Page 37 of 37
Disclaimer
This report has been prepared by St Barbara Limited (“Company”). The
material contained in this report is for information purposes only. This
release is not an offer or invitation for subscription or purchase of, or a
recommendation in relation to, securities in the Company and neither
this release nor anything contained in it shall form the basis of any
contract or commitment.
This report contains forward-looking statements that are subject to risk
factors associated with exploring for, developing, mining, processing
and the sale of gold. Forward-looking statements include those
containing such words as anticipate, estimates, forecasts, indicative,
should, will, would, expects, plans or similar expressions. Such
forward-looking statements are not guarantees of future performance
and involve known and unknown risks, uncertainties, assumptions and
other important factors, many of which are beyond the control of the
Company, and which could cause actual results or trends to differ
materially from those expressed in this report. Actual results may vary
from the information in this report. The Company does not make, and
this report should not be relied upon as, any representation or warranty
as to the accuracy, or reasonableness, of such statements or
assumptions. Investors are cautioned not to place undue reliance on
such statements.
This report has been prepared by the Company based on information
available to it, including information from third parties, and has not
been independently verified. No representation or warranty, express or
implied, is made as to the fairness, accuracy or completeness of the
information or opinions contained in this report.
The Company estimates its reserves and resources in accordance with
the Australasian Code for Reporting of Identified Mineral Resources
and Ore Reserves 2012 Edition (“JORC Code”), which governs such
disclosures by companies listed on the Australian Securities Exchange.
Non-IFRS Measures
The Company supplements its financial information reporting
determined under International Financial Reporting Standards (IFRS)
with certain non-IFRS financial measures, including Cash Operating
Costs and All-In Sustaining Cost. We believe that these measures
provide additional meaningful information to assist management,
investors and analysts in understanding the financial results and
assessing our prospects for future performance.
All-In Sustaining Cost (AISC) is based on Cash Operating Costs and
adds items relevant to sustaining production. It includes some, but not
all, of the components identified in World Gold Council’s Guidance
Note on Non-GAAP Metrics - All-In Sustaining Costs and All-In Costs
(June 2013).
AISC is calculated on gold production in the quarter.
For underground mines, amortisation of operating development is
adjusted from “Total Cash Operating Costs” in order to avoid
duplication with cash expended on operating development in the
period contained within the “Mine & Operating Development” line
item.
Rehabilitation is calculated as the amortisation of the rehabilitation
provision on a straight-line basis over the estimated life of mine.
Cash Contribution is cash flow from operations before finance costs,
refer reconciliation of cash movement earlier in this quarterly report.
Cash Operating Costs are calculated according to common mining
industry practice using The Gold Institute (USA) Production Cost
Standard (1999 revision).
Competent Persons Statement
Exploration Results
The information in this report that relates to Exploration Results is
based on information compiled by Dr Roger Mustard, who is a Member
of The Australasian Institute of Mining and Metallurgy. Dr Mustard is a
full-time employee of St Barbara and has sufficient experience relevant
to the style of mineralisation and type of deposit under consideration
and to the activity which he is undertaking to qualify as a Competent
Person as defined in the 2012 Edition of the ‘Australasian Code for
Reporting of Exploration Results, Mineral Resources and Ore
Reserves’. Dr Mustard consents to the inclusion in the report of the
matters based on his information in the form and context in which it
appears.
Mineral Resource and Ore Reserve Estimates
The information in this report that relates to Mineral Resources or Ore
Reserves is extracted from the report titled ‘Ore Reserves and Mineral
Resources Statements 30 June 2021’ released to the Australian
Securities Exchange (ASX) on 26 August 2021 and available to view at
www.stbarbara.com.au and for which Competent Persons’ consents
were obtained. Each Competent Person’s consent remains in place for
subsequent releases by the Company of the same information in the
same form and context, until the consent is withdrawn or replaced by a
subsequent report and accompanying consent.
The Company confirms that it is not aware of any new information or
data that materially affects the information included in the original ASX
announcements released on 26 August 2021 and, in the case of
estimates of Mineral Resources or Ore Reserves, that all material
assumptions and technical parameters underpinning the estimates in
the original ASX announcements continue to apply and have not
materially changed. The Company confirms that the form and context
in which the Competent Person's findings are presented have not been
materially modified from the original ASX announcements.
Full details are contained in the ASX release dated 26 August 2021
‘Ore Reserves and Mineral Resources Statements 30 June 2021’
available at stbarbara.com.au.