Embed Size (px)
Citation preview
User Manual
YBA250
Antenna and Transmission Line
Analyzer
071-1047-02
This document supports firmware version 1.402
and greater.
www.tektronix.com
Copyright © Tektronix, Inc. All rights reserved.
Tektronix products are covered by U.S. and foreign patents, issued and
pending. Information in this publication supercedes that in all previously
published material. Specifications and price change privileges reserved.
Tektronix, Inc., P.O. Box 500, Beaverton, OR 97077
TEKTRONIX, TEK, and NetTek are registered trademarks of Tektronix, Inc.
WARRANTY
Tektronix warrants that the products that it manufactures and sells will be free from defects
in materials and workmanship for a period of one (1) year from the date of purchase from
an authorized Tektronix distributor. If any such product proves defective during this
warranty period, Tektronix, at its option, either will repair the defective product without
charge for parts and labor, or will provide a replacement in exchange for the defective
product. Batteries are excluded from this warranty.
In order to obtain service under this warranty, Customer must notify Tektronix of the
defect before the expiration of the warranty period and make suitable arrangements for the
performance of service. Customer shall be responsible for packaging and shipping the
defective product to the service center designated by Tektronix, shipping charges prepaid,
and with a copy of customer proof of purchase. Tektronix shall pay for the return of the
product to Customer if the shipment is to a location within the country in which the
Tektronix service center is located. Customer shall be responsible for paying all shipping
charges, duties, taxes, and any other charges for products returned to any other locations.
This warranty shall not apply to any defect, failure or damage caused by improper use or
improper or inadequate maintenance and care. Tektronix shall not be obligated to furnish
service under this warranty a) to repair damage resulting from attempts by personnel other
than Tektronix representatives to install, repair or service the product; b) to repair damage
resulting from improper use or connection to incompatible equipment; c) to repair any
damage or malfunction caused by the use of non-Tektronix supplies; or d) to service a
product that has been modified or integrated with other products when the effect of such
modification or integration increases the time or difficulty of servicing the product.
THIS WARRANTY IS GIVEN BY TEKTRONIX WITH RESPECT TO THE
LISTED PRODUCTS IN LIEU OF ANY OTHER WARRANTIES, EXPRESS OR
IMPLIED. TEKTRONIX AND ITS VENDORS DISCLAIM ANY IMPLIED
WARRANTIES OF MERCHANTABILITY OR FITNESS FOR A PARTICULAR
PURPOSE. TEKTRONIX’ RESPONSIBILITY TO REPAIR OR REPLACE
DEFECTIVE PRODUCTS IS THE SOLE AND EXCLUSIVE REMEDY
PROVIDED TO THE CUSTOMER FOR BREACH OF THIS WARRANTY.
TEKTRONIX AND ITS VENDORS WILL NOT BE LIABLE FOR ANY
INDIRECT, SPECIAL, INCIDENTAL, OR CONSEQUENTIAL DAMAGES
IRRESPECTIVE OF WHETHER TEKTRONIX OR THE VENDOR HAS
ADVANCE NOTICE OF THE POSSIBILITY OF SUCH DAMAGES.

YBA250 Antenna and Transmission Line Analyzer User Manual i
Table of Contents
Preface xi. . . . . . . . . . . . . . . . . . . . . . . . . . . . . . . . . . . . . . . . . . . .
Product Overview xi. . . . . . . . . . . . . . . . . . . . . . . . . . . . . . . . . . .
About this Manual xiii. . . . . . . . . . . . . . . . . . . . . . . . . . . . . . . . . . .
Additional Information xiv. . . . . . . . . . . . . . . . . . . . . . . . . . . . . . .
Conventions xiv. . . . . . . . . . . . . . . . . . . . . . . . . . . . . . . . . . . . . . . .
Software Version xiv. . . . . . . . . . . . . . . . . . . . . . . . . . . . . . . . . . . .
Contacting Tektronix xv. . . . . . . . . . . . . . . . . . . . . . . . . . . . . . . . .
General Safety Summary xvii. . . . . . . . . . . . . . . . . . . . . . . . . . . .
Getting Started
The NetTek Analyzer Platform 1--1. . . . . . . . . . . . . . . . . . . . . . . . .
YBA250 Input Connector 1--3. . . . . . . . . . . . . . . . . . . . . . . . . . . . .
Installing and Removing a Module 1--4. . . . . . . . . . . . . . . . . . . . . .
Connecting External Power Supplies 1--6. . . . . . . . . . . . . . . . . . . .
Batteries 1--7. . . . . . . . . . . . . . . . . . . . . . . . . . . . . . . . . . . . . . . . . . .
Powering On the Instrument 1--11. . . . . . . . . . . . . . . . . . . . . . . . . . .
Calibrating the Touch-Screen Display 1--11. . . . . . . . . . . . . . . . . . .
Powering Off the Instrument 1--12. . . . . . . . . . . . . . . . . . . . . . . . . . .
Preventing Personal Injury from the Effects of Lightning 1--14. . . .
Attaching Accessories 1--16. . . . . . . . . . . . . . . . . . . . . . . . . . . . . . . .
Operating Basics
Navigating the Desktop 2--1. . . . . . . . . . . . . . . . . . . . . . . . . . . . . . .
Getting Help 2--4. . . . . . . . . . . . . . . . . . . . . . . . . . . . . . . . . . . . . . .
Starting the YBA250 Software 2--5. . . . . . . . . . . . . . . . . . . . . . . . .
Setting the YBA250 Software to Load at Startup 2--6. . . . . . . . . . .
YBA250 User Interface Elements 2--7. . . . . . . . . . . . . . . . . . . . . . .
YBA250 Menus 2--13. . . . . . . . . . . . . . . . . . . . . . . . . . . . . . . . . . . . .
Entering Text 2--17. . . . . . . . . . . . . . . . . . . . . . . . . . . . . . . . . . . . . . .
Connecting a Signal 2--19. . . . . . . . . . . . . . . . . . . . . . . . . . . . . . . . .
Use Precision Connectors and Cables 2--19. . . . . . . . . . . . . . . . . . . .
Attaching and Removing Precision Connectors 2--20. . . . . . . . . . . .
Connecting an RF Signal 2--21. . . . . . . . . . . . . . . . . . . . . . . . . . . . . .
Table of Contents
ii YBA250 Antenna and Transmission Line Analyzer User Manual
Measurement Overview 2--23. . . . . . . . . . . . . . . . . . . . . . . . . . . . .
One-Port Measurements 2--23. . . . . . . . . . . . . . . . . . . . . . . . . . . . . .
Two-Port Measurements 2--23. . . . . . . . . . . . . . . . . . . . . . . . . . . . . .
Calibration and Normalization 2--25. . . . . . . . . . . . . . . . . . . . . . .
Calibrating the YBA250 2--25. . . . . . . . . . . . . . . . . . . . . . . . . . . . . .
Normalizing the YBA250 2--40. . . . . . . . . . . . . . . . . . . . . . . . . . . . .
Configuring the Instrument 2--53. . . . . . . . . . . . . . . . . . . . . . . . . .
Enabling Signal Standards 2--53. . . . . . . . . . . . . . . . . . . . . . . . . . . . .
Setting the Output Power Level 2--54. . . . . . . . . . . . . . . . . . . . . . . .
Setting Measurement Method 2--56. . . . . . . . . . . . . . . . . . . . . . . . . .
Setting Display Preferences 2--57. . . . . . . . . . . . . . . . . . . . . . . . . . . .
Display Trace Smoothing 2--58. . . . . . . . . . . . . . . . . . . . . . . . . . . . .
Changing Settings for Saved Files 2--58. . . . . . . . . . . . . . . . . . . . . .
Saving GPS Coordinates with your Results 2--61. . . . . . . . . . . . . . .
Reference
Setting the Signal Standards and Test Frequency Range 3--1. .
Selecting Signal Standards 3--1. . . . . . . . . . . . . . . . . . . . . . . . . . . .
The Test Frequency Range 3--2. . . . . . . . . . . . . . . . . . . . . . . . . . . .
Setting the Test Frequency Range by Standard and
Direction 3--3. . . . . . . . . . . . . . . . . . . . . . . . . . . . . . . . . . . . . . . .
Setting the Test Frequency Range by Start and
Stop Frequency 3--5. . . . . . . . . . . . . . . . . . . . . . . . . . . . . . . . . .
Measuring Return Loss and VSWR 3--7. . . . . . . . . . . . . . . . . . . .
The Return Loss Display 3--7. . . . . . . . . . . . . . . . . . . . . . . . . . . . . .
Measuring Return Loss/VSWR 3--8. . . . . . . . . . . . . . . . . . . . . . . . .
Measuring Cable Loss 3--11. . . . . . . . . . . . . . . . . . . . . . . . . . . . . . . .
Measuring the Distance to a Fault 3--13. . . . . . . . . . . . . . . . . . . . .
The Distance to Fault Display 3--13. . . . . . . . . . . . . . . . . . . . . . . . . .
Measuring the Distance to a Fault 3--14. . . . . . . . . . . . . . . . . . . . . . .
Changing the Vertical Scale Units 3--16. . . . . . . . . . . . . . . . . . . . . . .
Limiting the Bandwidth for a Bandpass Filter 3--16. . . . . . . . . . . . .
Setting Cable Types 3--17. . . . . . . . . . . . . . . . . . . . . . . . . . . . . . . . . .
Creating a User-Defined Cable Type 3--19. . . . . . . . . . . . . . . . . . . .
Customizing the Cable Standards Table 3--20. . . . . . . . . . . . . . . . . .
Improving the Display of Distance Measurements 3--22. . . . . . . . . .
Resolution of Distance to Fault Measurement 3--23. . . . . . . . . . . . .
Table of Contents
YBA250 Antenna and Transmission Line Analyzer User Manual iii
Measuring Insertion Gain and Loss 3--25. . . . . . . . . . . . . . . . . . . .
The Insertion Gain/Loss Window 3--26. . . . . . . . . . . . . . . . . . . . . . .
Measuring Insertion Gain or Loss 3--26. . . . . . . . . . . . . . . . . . . . . . .
Generating a Continuous Wave (CW) Signal 3--31. . . . . . . . . . . .
Working with Traces 3--33. . . . . . . . . . . . . . . . . . . . . . . . . . . . . . . .
Setting the Trace Type 3--33. . . . . . . . . . . . . . . . . . . . . . . . . . . . . . . .
Changing the Units of the Distance to Fault Display 3--35. . . . . . . .
Saving Results 3--36. . . . . . . . . . . . . . . . . . . . . . . . . . . . . . . . . . . . . .
Displaying a Saved Trace 3--37. . . . . . . . . . . . . . . . . . . . . . . . . . . . .
Comparing Traces 3--38. . . . . . . . . . . . . . . . . . . . . . . . . . . . . . . . . . .
Using Markers and Band Edge Cursors 3--43. . . . . . . . . . . . . . . .
Displaying Markers 3--43. . . . . . . . . . . . . . . . . . . . . . . . . . . . . . . . . .
Band Edge Cursors 3--49. . . . . . . . . . . . . . . . . . . . . . . . . . . . . . . . . .
Markers and Mask Testing 3--50. . . . . . . . . . . . . . . . . . . . . . . . . . . . .
Mask Testing 3--51. . . . . . . . . . . . . . . . . . . . . . . . . . . . . . . . . . . . . . .
The Mask Maker Window 3--51. . . . . . . . . . . . . . . . . . . . . . . . . . . . .
Using the Mask Maker 3--53. . . . . . . . . . . . . . . . . . . . . . . . . . . . . . . .
Mask Maker Guidelines 3--56. . . . . . . . . . . . . . . . . . . . . . . . . . . . . . .
Defining (Selecting) a Mask for Testing 3--57. . . . . . . . . . . . . . . . . .
Performing a Mask Test 3--58. . . . . . . . . . . . . . . . . . . . . . . . . . . . . . .
Saving and Recalling Results, Screens,
and Setups 3--61. . . . . . . . . . . . . . . . . . . . . . . . . . . . . . . . . . . . . .
Saving Measurement Results 3--61. . . . . . . . . . . . . . . . . . . . . . . . . . .
Recalling Measurement Results 3--63. . . . . . . . . . . . . . . . . . . . . . . .
Exporting Measurement Results 3--64. . . . . . . . . . . . . . . . . . . . . . . .
Exporting a Screen 3--65. . . . . . . . . . . . . . . . . . . . . . . . . . . . . . . . . . .
Differences Between Exported Screens and Results 3--66. . . . . . . . .
Saving Setups 3--68. . . . . . . . . . . . . . . . . . . . . . . . . . . . . . . . . . . . . . .
Recalling Setups 3--69. . . . . . . . . . . . . . . . . . . . . . . . . . . . . . . . . . . .
Customizing the Setup menu 3--70. . . . . . . . . . . . . . . . . . . . . . . . . . .
Appendices
Appendix A: Specifications A--1. . . . . . . . . . . . . . . . . . . . . . . . . . .
Appendix B: Accessories B--1. . . . . . . . . . . . . . . . . . . . . . . . . . . . .
Standard Accessories B--1. . . . . . . . . . . . . . . . . . . . . . . . . . . . . . . . .
Optional Accessories B--2. . . . . . . . . . . . . . . . . . . . . . . . . . . . . . . . .
Appendix C: Options C--1. . . . . . . . . . . . . . . . . . . . . . . . . . . . . . . .
Table of Contents
iv YBA250 Antenna and Transmission Line Analyzer User Manual
Appendix D: Upgrading/Reinstalling Software D--1. . . . . . . . . .
Appendix E: Functional Verification Procedure E--1. . . . . . . . .
Self Tests E--1. . . . . . . . . . . . . . . . . . . . . . . . . . . . . . . . . . . . . . . . . .
Functional Tests E--3. . . . . . . . . . . . . . . . . . . . . . . . . . . . . . . . . . . . .
Appendix F: Supported Signal Standards F--1. . . . . . . . . . . . . . .
Appendix G: Customizing the Channel Table G--1. . . . . . . . . . . .
Glossary
Index
Table of Contents
YBA250 Antenna and Transmission Line Analyzer User Manual v
Figures
Figure 1--1: NetTek Analyzer Layout 1--1. . . . . . . . . . . . . . . . . . .
Figure 1--2: Front Panel Controls 1--2. . . . . . . . . . . . . . . . . . . . . .
Figure 1--3: I/O ports (Y400 NetTek Analyzer
Platform) 1--3. . . . . . . . . . . . . . . . . . . . . . . . . . . . . . . . . . . . . . .
Figure 1--4: YBA250 test port. 1--3. . . . . . . . . . . . . . . . . . . . . . . .
Figure 1--5: Removing the bus cover 1--4. . . . . . . . . . . . . . . . . . .
Figure 1--6: Attaching the YBA250 module 1--5. . . . . . . . . . . . . .
Figure 1--7: External power supplies 1--6. . . . . . . . . . . . . . . . . . .
Figure 1--8: Opening the battery compartment 1--7. . . . . . . . . .
Figure 1--9: Opening the battery retainer 1--8. . . . . . . . . . . . . . .
Figure 1--10: Installing/removing a battery 1--8. . . . . . . . . . . . . .
Figure 1--11: NetTek Analyzer Platform tilt stand 1--16. . . . . . . .
Figure 1--12: Installing the tilt stand on multiple
instrument modules 1--17. . . . . . . . . . . . . . . . . . . . . . . . . . . . . .
Figure 1--13: NetTek Analyzer Platform shoulder strap
and strand hook 1--18. . . . . . . . . . . . . . . . . . . . . . . . . . . . . . . . .
Figure 2--1: The YBA250 display 2--5. . . . . . . . . . . . . . . . . . . . . .
Figure 2--2: Setting the StartUp Application 2--6. . . . . . . . . . . . .
Figure 2--3: YBA250 user interface elements 2--7. . . . . . . . . . . .
Figure 2--4: The Soft Keyboard 2--17. . . . . . . . . . . . . . . . . . . . . . .
Figure 2--5: How to attach a precision connector 2--21. . . . . . . . .
Figure 2--6: TEST PORT location 2--22. . . . . . . . . . . . . . . . . . . . .
Figure 2--7: The Calibration window 2--26. . . . . . . . . . . . . . . . . . .
Figure 2--8: Precision terminations from YBAC1
Calibration Kit 2--28. . . . . . . . . . . . . . . . . . . . . . . . . . . . . . . . . .
Figure 2--9: Ready to perform calibration 2--29. . . . . . . . . . . . . .
Figure 2--10: Calibration window after calibration
is done 2--31. . . . . . . . . . . . . . . . . . . . . . . . . . . . . . . . . . . . . . . . .
Table of Contents
vi YBA250 Antenna and Transmission Line Analyzer User Manual
Figure 2--11: Ready to perform calibration with cable 2--32. . . .
Figure 2--12: Calibration window after calibration
is done 2--33. . . . . . . . . . . . . . . . . . . . . . . . . . . . . . . . . . . . . . . . .
Figure 2--13: Calibration browser window 2--35. . . . . . . . . . . . . .
Figure 2--14: The Calibration window 2--36. . . . . . . . . . . . . . . . . .
Figure 2--15: Normalization window 2--41. . . . . . . . . . . . . . . . . . .
Figure 2--16: Normalization type status label 2--43. . . . . . . . . . . .
Figure 2--17: Normalization Browser window 2--47. . . . . . . . . . .
Figure 2--18: Save Normalization window 2--48. . . . . . . . . . . . . . .
Figure 2--19: Load Saved Normalization window 2--49. . . . . . . . .
Figure 2--20: The Signal Standards tab of the
Options window 2--53. . . . . . . . . . . . . . . . . . . . . . . . . . . . . . . . .
Figure 2--21: Setting the output power level 2--55. . . . . . . . . . . . .
Figure 2--22: Location of Method drop-down list 2--56. . . . . . . . .
Figure 2--23: Preferences tab showing available
color schemes 2--57. . . . . . . . . . . . . . . . . . . . . . . . . . . . . . . . . . .
Figure 2--24: The Save & Export tab 2--59. . . . . . . . . . . . . . . . . . .
Figure 3--1: The Signal Standards tab of the Options
window 3--1. . . . . . . . . . . . . . . . . . . . . . . . . . . . . . . . . . . . . . . . .
Figure 3--2: Frequency range controls 3--3. . . . . . . . . . . . . . . . . .
Figure 3--3: Select Channel dialog box 3--5. . . . . . . . . . . . . . . . .
Figure 3--4: Entering the frequency with the keypad 3--6. . . . . .
Figure 3--5: The Return Loss window 3--7. . . . . . . . . . . . . . . . . .
Figure 3--6: Example of a Return Loss measurement 3--10. . . . .
Figure 3--7: Example of a VSWR measurement 3--10. . . . . . . . . .
Figure 3--8: Example of a cable loss measurement 3--12. . . . . . . .
Figure 3--9: The Distance to Fault display 3--13. . . . . . . . . . . . . . .
Figure 3--10: The Distance Options tab 3--15. . . . . . . . . . . . . . . . .
Figure 3--11: An example of a distance to fault
measurement 3--16. . . . . . . . . . . . . . . . . . . . . . . . . . . . . . . . . . . .
Figure 3--12: The Cable Types window 3--18. . . . . . . . . . . . . . . . .
Table of Contents
YBA250 Antenna and Transmission Line Analyzer User Manual vii
Figure 3--13: User Defined Cable window 3--19. . . . . . . . . . . . . . .
Figure 3--14: A portion of the cablestandards text file 3--22. . . . .
Figure 3--15: The Return Gain/Loss window 3--26. . . . . . . . . . . .
Figure 3--16: Setting output power for CW
signal mode 3--31. . . . . . . . . . . . . . . . . . . . . . . . . . . . . . . . . . . . .
Figure 3--17: Setting the trace type 3--34. . . . . . . . . . . . . . . . . . . .
Figure 3--18: Setting the distance units 3--36. . . . . . . . . . . . . . . . .
Figure 3--19: Defining Trace 2 3--39. . . . . . . . . . . . . . . . . . . . . . . .
Figure 3--20: Selecting the first result file 3--40. . . . . . . . . . . . . . .
Figure 3--21: Selecting the second result file 3--41. . . . . . . . . . . . .
Figure 3--22: Two compared traces 3--41. . . . . . . . . . . . . . . . . . . .
Figure 3--23: Display with markers 3--43. . . . . . . . . . . . . . . . . . . .
Figure 3--24: Display without markers 3--44. . . . . . . . . . . . . . . . .
Figure 3--25: Assigning markers to a trace 3--47. . . . . . . . . . . . . .
Figure 3--26: Band Edge Cursor displayed 3--49. . . . . . . . . . . . . .
Figure 3--27: Band Edge Cursors always visible 3--50. . . . . . . . . .
Figure 3--28: The Mask Maker utility 3--51. . . . . . . . . . . . . . . . . .
Figure 3--29: Example of a recalled results display 3--63. . . . . . .
Figure 3--30: Sample Exported Results file 3--65. . . . . . . . . . . . . .
Figure 3--31: Example of an Exported Results file 3--68. . . . . . . .
Figure 3--32: Setup menu controls 3--70. . . . . . . . . . . . . . . . . . . . .
Figure 3--33: Specifying the List of Setups 3--72. . . . . . . . . . . . . .
Figure E--1: Settings to run diagnostics E--2. . . . . . . . . . . . . . . . .
Figure E--2: Calibration window prior to calibration E--4. . . . .
Figure E--3: Ready to perform calibration E--4. . . . . . . . . . . . . .
Figure E--4: Calibration window after calibration
is done E--6. . . . . . . . . . . . . . . . . . . . . . . . . . . . . . . . . . . . . . . . .
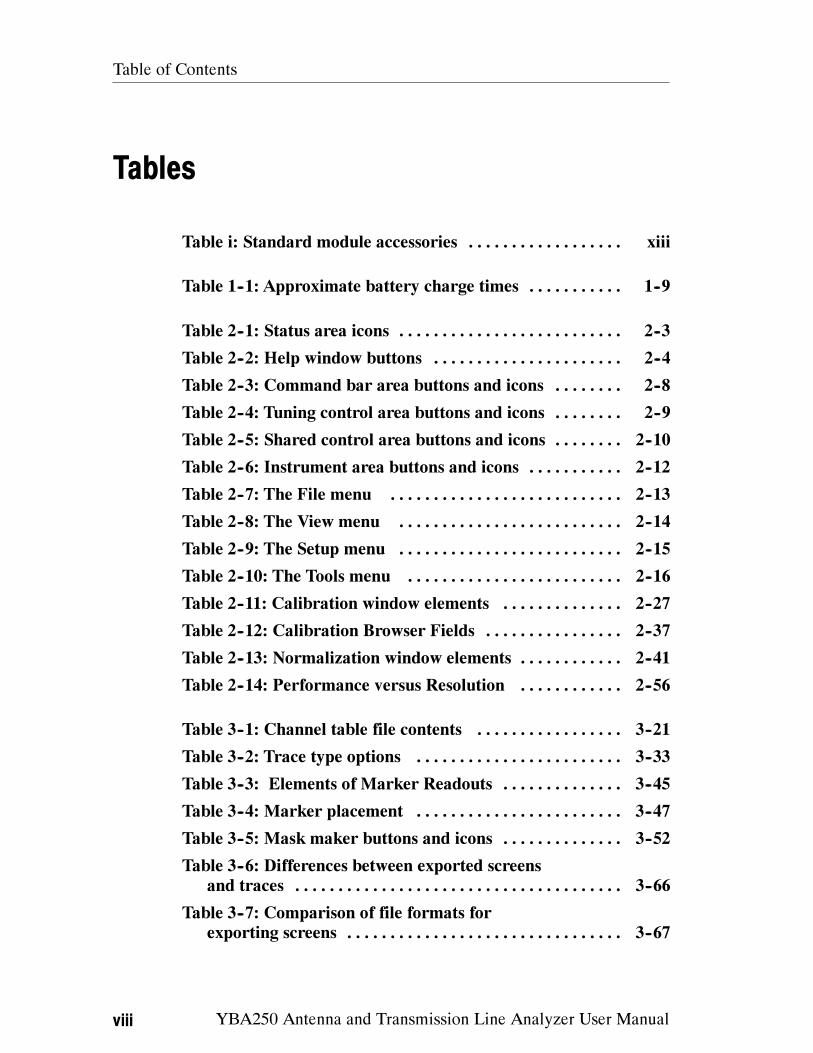
Table of Contents
viii YBA250 Antenna and Transmission Line Analyzer User Manual
Tables
Table i: Standard module accessories xiii. . . . . . . . . . . . . . . . . .
Table 1--1: Approximate battery charge times 1--9. . . . . . . . . . .
Table 2--1: Status area icons 2--3. . . . . . . . . . . . . . . . . . . . . . . . . .
Table 2--2: Help window buttons 2--4. . . . . . . . . . . . . . . . . . . . . .
Table 2--3: Command bar area buttons and icons 2--8. . . . . . . .
Table 2--4: Tuning control area buttons and icons 2--9. . . . . . . .
Table 2--5: Shared control area buttons and icons 2--10. . . . . . . .
Table 2--6: Instrument area buttons and icons 2--12. . . . . . . . . . .
Table 2--7: The File menu 2--13. . . . . . . . . . . . . . . . . . . . . . . . . . .
Table 2--8: The View menu 2--14. . . . . . . . . . . . . . . . . . . . . . . . . .
Table 2--9: The Setup menu 2--15. . . . . . . . . . . . . . . . . . . . . . . . . .
Table 2--10: The Tools menu 2--16. . . . . . . . . . . . . . . . . . . . . . . . .
Table 2--11: Calibration window elements 2--27. . . . . . . . . . . . . .
Table 2--12: Calibration Browser Fields 2--37. . . . . . . . . . . . . . . .
Table 2--13: Normalization window elements 2--41. . . . . . . . . . . .
Table 2--14: Performance versus Resolution 2--56. . . . . . . . . . . .
Table 3--1: Channel table file contents 3--21. . . . . . . . . . . . . . . . .
Table 3--2: Trace type options 3--33. . . . . . . . . . . . . . . . . . . . . . . .
Table 3--3: Elements of Marker Readouts 3--45. . . . . . . . . . . . . .
Table 3--4: Marker placement 3--47. . . . . . . . . . . . . . . . . . . . . . . .
Table 3--5: Mask maker buttons and icons 3--52. . . . . . . . . . . . . .
Table 3--6: Differences between exported screens
and traces 3--66. . . . . . . . . . . . . . . . . . . . . . . . . . . . . . . . . . . . . .
Table 3--7: Comparison of file formats for
exporting screens 3--67. . . . . . . . . . . . . . . . . . . . . . . . . . . . . . . .
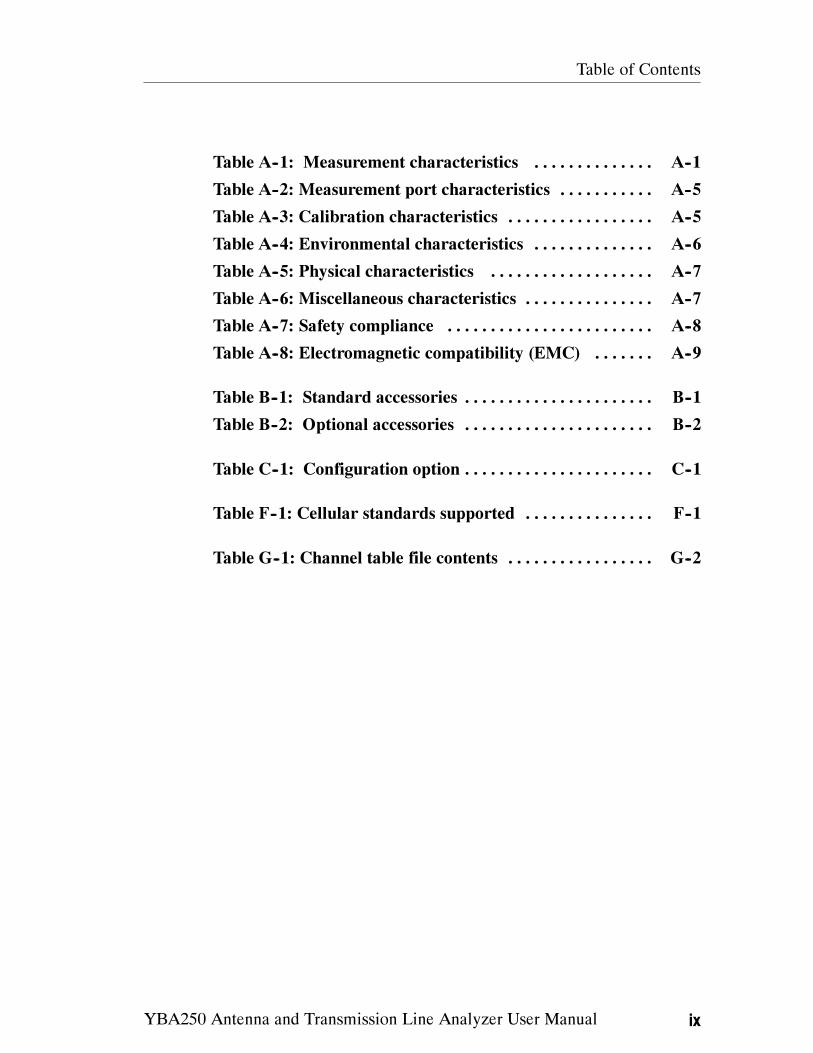
Table of Contents
YBA250 Antenna and Transmission Line Analyzer User Manual ix
Table A--1: Measurement characteristics A--1. . . . . . . . . . . . . .
Table A--2: Measurement port characteristics A--5. . . . . . . . . . .
Table A--3: Calibration characteristics A--5. . . . . . . . . . . . . . . . .
Table A--4: Environmental characteristics A--6. . . . . . . . . . . . . .
Table A--5: Physical characteristics A--7. . . . . . . . . . . . . . . . . . .
Table A--6: Miscellaneous characteristics A--7. . . . . . . . . . . . . . .
Table A--7: Safety compliance A--8. . . . . . . . . . . . . . . . . . . . . . . .
Table A--8: Electromagnetic compatibility (EMC) A--9. . . . . . .
Table B--1: Standard accessories B--1. . . . . . . . . . . . . . . . . . . . . .
Table B--2: Optional accessories B--2. . . . . . . . . . . . . . . . . . . . . .
Table C--1: Configuration option C--1. . . . . . . . . . . . . . . . . . . . . .
Table F--1: Cellular standards supported F--1. . . . . . . . . . . . . . .
Table G--1: Channel table file contents G--2. . . . . . . . . . . . . . . . .
Table of Contents
x YBA250 Antenna and Transmission Line Analyzer User Manual

YBA250 Antenna and Transmission Line Analyzer User Manual xi
Preface
The YBA250 Antenna and Transmission Line Analyzer is part of the
NetTek Analyzer Platform BTS Field Tool family. This high
performance, portable, field-ready tester is optimized for fast trouble
resolution and easy BTS antenna and tower mounted amplifier
(TMA) performance verification.
Product Overview
The standard YBA250 configuration consists of two components; the
YBA250 application module and the NetTek Analyzer Platform. The
application module contains the hardware and software needed to
analyze antenna characteristics and performance. The NetTek
Analyzer Platform provides the power and user interface to run the
YBA250 application module software and hardware. The YBA250
can be purchased separately to install on a NetTek Analyzer Platform
that you already have.
The YBA250 Antenna and Transmission Line Analyzer application
features include:
One-port Return Loss and VSWR measurements to quickly
analyze a system
One-port Cable Loss measurement to analyze system cable
characteristics
One-port distance-to-fault (DTF) measurement to identify the
location
Two-port Insertion Gain and Loss measurements to analyze the
characteristics of active components (such as TMAs and
directional couplers) and passive devices (such as bandwidth
filters and cables)
Advanced calibration and normalization techniques to eliminate
the need to perform a calibration each time the frequency or
display range is changed
Preface
xii YBA250 Antenna and Transmission Line Analyzer User Manual
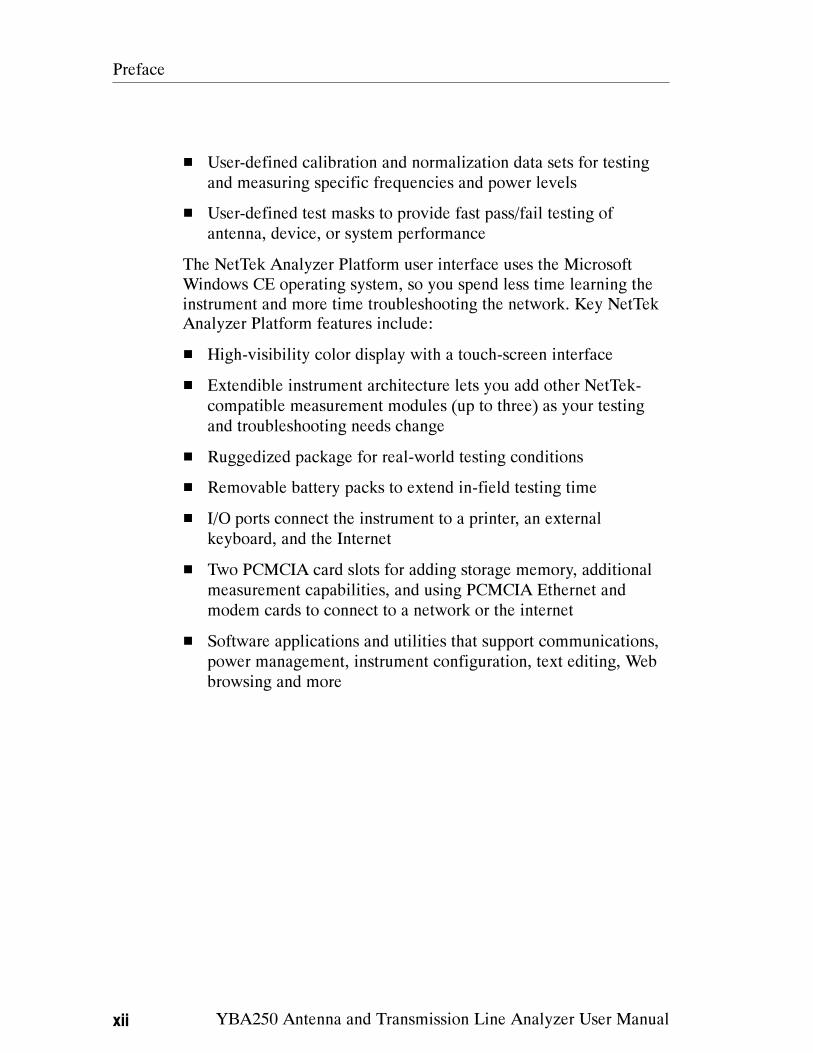
User-defined calibration and normalization data sets for testing
and measuring specific frequencies and power levels
User-defined test masks to provide fast pass/fail testing of
antenna, device, or system performance
The NetTek Analyzer Platform user interface uses the Microsoft
Windows CE operating system, so you spend less time learning the
instrument and more time troubleshooting the network. Key NetTek
Analyzer Platform features include:
High-visibility color display with a touch-screen interface
Extendible instrument architecture lets you add other NetTek-
compatible measurement modules (up to three) as your testing
and troubleshooting needs change
Ruggedized package for real-world testing conditions
Removable battery packs to extend in-field testing time
I/O ports connect the instrument to a printer, an external
keyboard, and the Internet
Two PCMCIA card slots for adding storage memory, additional
measurement capabilities, and using PCMCIA Ethernet and
modem cards to connect to a network or the internet
Software applications and utilities that support communications,
power management, instrument configuration, text editing, Web
browsing and more
Preface
YBA250 Antenna and Transmission Line Analyzer User Manual xiii
Standard Accessories
Table i provides a list of the standard accessories supplied with the
YBA250 Antenna and Transmission Line Analyzer Module. For a
complete list of standard and optional accessories, see Appendix B,
beginning on page B--1.
Table i: Standard module accessories
N Connector Plastic Cover. Used to protect the TEST PORT
signal connector.
User Manual. Contains information on setup, basic operation,
and taking measurements.
CD-ROM. Contains instrument software and an Adobe Acrobat
PDF version of the User Manual.
About this Manual
This manual is divided into four sections: Getting Started, Operating
Basics, Reference and Appendices.
The Getting Started section explains how to set up and start using
your YBA250 Antenna and Transmission Line Analyzer.
The Operating Basics section explains how to operate the YBA250.
The Reference section explains how to perform specific tests with the
YBA250.
The Appendices contain specifications, a functional verification
procedure, and other information that you might need occasionally.
Preface
xiv YBA250 Antenna and Transmission Line Analyzer User Manual
Additional Information
The YBA250 Antenna and Transmission Line Analyzer contains
online help to enable you to quickly get explanations of how to use
your YBA250. The online help is the first place you should look for
information about operating the YBA250 or the NetTek Analyzer
Platform.
Conventions
This manual uses the following convention. The statement Start >
Help is requesting that you open the Start menu and select Help. To
do this, tap the Start button in the toolbar at the bottom of the
desktop window; then tap Help in the resulting menu.
Software Version
This manual supports YBA250 Antenna and Transmission Line
Analyzers running software version 1.402 or greater. To determine
your software version, select Tools > Software Info when the
YBA250 application is running.
Preface
YBA250 Antenna and Transmission Line Analyzer User Manual xv
Contacting Tektronix
Phone 1-800-833-9200*
Address Tektronix, Inc.
Department or name (if known)
14200 SW Karl Braun Drive
P.O. Box 500
Beaverton, OR 97077
USA
Web site www.tektronix.com
Sales
support
1-800-833-9200, select option 1*
Service sup-
port
1-800-833-9200, select option 2*
Technical
support
www.tektronix.com/support
1-800-833-9200, select option 3*
6:00 a.m. -- 5:00 p.m. Pacific Standard Time
* This phone number is toll free in North America. After office hours, please
leave a voice mail message.
Outside North America, contact a Tektronix sales office or distributor; see
the Tektronix web site for a list of offices.
Preface
xvi YBA250 Antenna and Transmission Line Analyzer User Manual

YBA250 Antenna and Transmission Line Analyzer User Manual xvii
General Safety Summary
Review the following safety precautions to avoid injury and prevent
damage to this product or any products connected to it. To avoid
potential hazards, use this product only as specified.
Only qualified personnel should perform service procedures.
While using this product, you may need to access other parts of the
system. Read the General Safety Summary in other system manuals
for warnings and cautions related to operating the system.
WARNING. Do not connect to any source which may be subject to the
effects of lightning.
To Avoid Fire or Personal Injury
Use Proper Power Cord. Use only the power cord specified for this
product and certified for the country of use.
Connect and Disconnect Properly. Do not connect or disconnect probes
or test leads while they are connected to a voltage source.
Observe All Terminal Ratings. To avoid fire or shock hazard, observe all
ratings and markings on the product. Consult the product manual for
further ratings information before making connections to the product.
The common terminal is at ground potential. Do not connect the
common terminal to elevated voltages.
Replace Batteries Properly. Replace batteries only with the proper type
and rating specified.
Recharge Batteries Properly. Recharge batteries only as specified.
Use Proper AC Adapter. Use only the AC adapter specified for this
product.
Do Not Operate Without Covers. Do not operate this product with
covers or panels removed.
Do Not Operate With Suspected Failures. If you suspect there is damage
to this product, have it inspected by qualified service personnel.
Do Not Operate in an Explosive Atmosphere.
General Safety Summary
xviii YBA250 Antenna and Transmission Line Analyzer User Manual
Safety Terms and Symbols
Terms in This Manual. These terms may appear in this manual:
WARNING. Warning statements identify conditions or practices that
could result in injury or loss of life.
CAUTION. Caution statements identify conditions or practices that
could result in damage to this product or other property.
Terms on the Product. These terms may appear on the product:
DANGER indicates an injury hazard immediately accessible as you
read the marking.
WARNING indicates an injury hazard not immediately accessible as
you read the marking.
CAUTION indicates a hazard to property including the product.
Symbols on the Product. These symbols may appear on the product:
CAUTION
Refer to Manual
Battery Recycling
The NetTek Analyzer Platform uses rechargeable Lithium Ion
batteries, which must be recycled or disposed of properly. For the
location of a local battery recycler in the U.S. or Canada, please
contact:
RBRC (800) BATTERY
Rechargeable Battery Recycling Corp. (800) 227-7379
P.O. Box 141870 www.rbrc.com
Gainesville, Florida 32614

Getting Started

YBA250 Antenna and Transmission Line Analyzer User Manual 1- 1
Getting Started
This section describes the Y400 NetTek Analyzer Platform, on
which the YBA250 Antenna and Transmission Line Analyzer
operates.
The NetTek Analyzer Platform
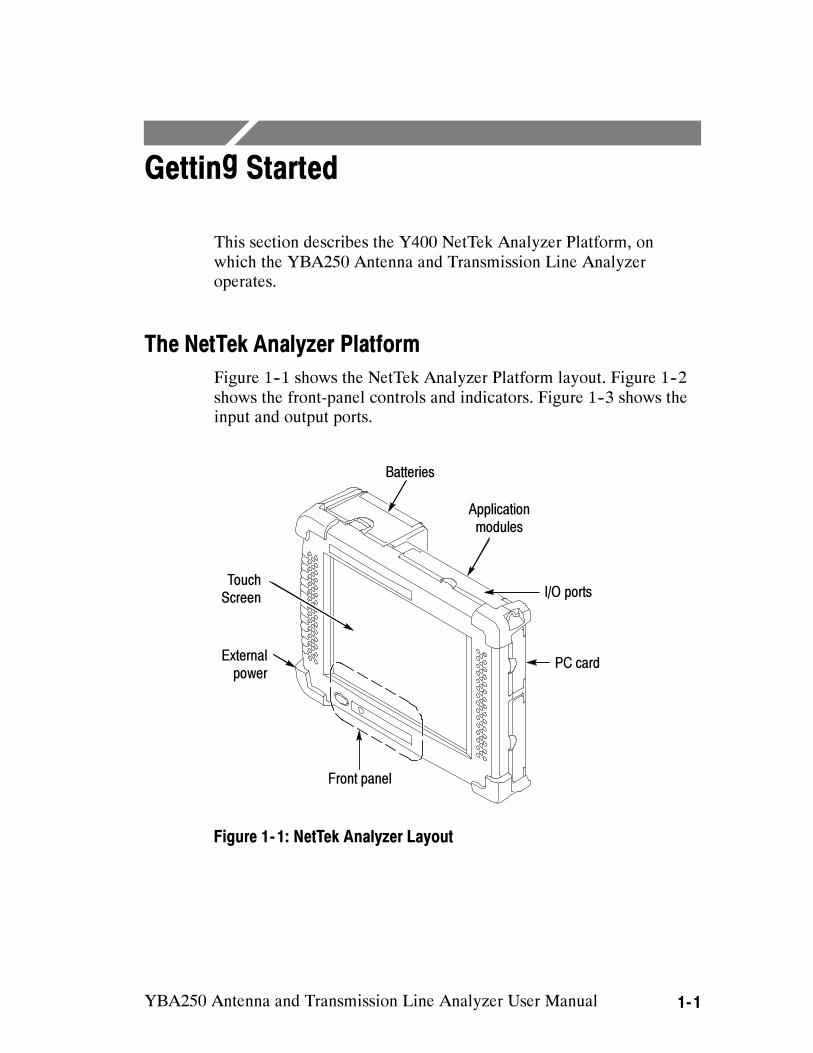
Figure 1--1 shows the NetTek Analyzer Platform layout. Figure 1--2
shows the front-panel controls and indicators. Figure 1--3 shows the
input and output ports.
Batteries
Application
modules
PC card
Front panel
External
power
I/O ports
Touch
Screen
Figure 1- 1: NetTek Analyzer Layout

Getting Started
1- 2 YBA250 Antenna and Transmission Line Analyzer User Manual
CAUTION. Only use soft objects, such as plastic or your finger, to tap
the touch-screen display. Do not use metal or other abrasive
materials because they will damage the display surface.
1 2 3 4
Figure 1- 2: Front Panel Controls
1. Power/Suspend Switch. Push on; push off. See pages 1--11 and
1--12 for additional information.
2. Reset Switch. Push to perform a hardware reset if a lock-up
occurs. All programs and data loaded into volatile memory since
startup are lost.
3. Status Indicator. Green indicates that the instrument is powered
on. Amber indicates that the instrument is powered on but the
display is turned off (for power conservation).
4. Batteries Indicator. Green indicates that the instrument is
connected to an external power source (and charging any
installed batteries). Red indicates a low battery.
Getting Started
YBA250 Antenna and Transmission Line Analyzer User Manual 1- 3
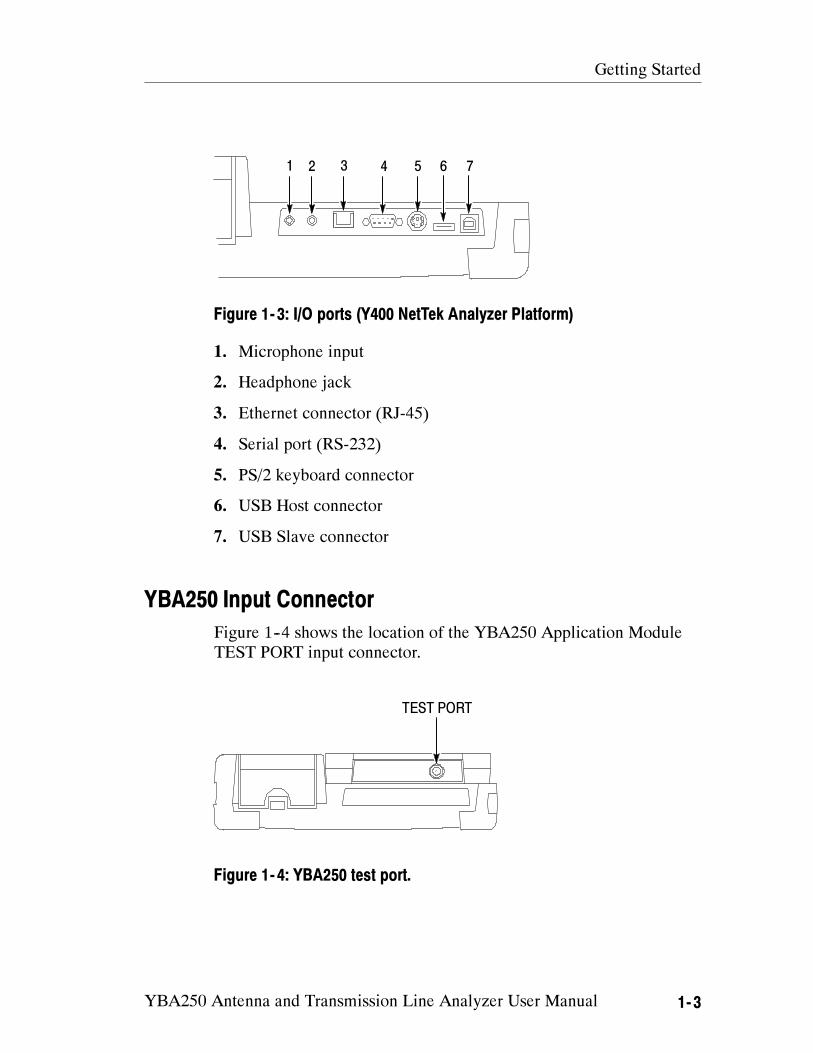
1 2 3 4 5 6 7
Figure 1- 3: I/O ports (Y400 NetTek Analyzer Platform)
1. Microphone input
2. Headphone jack
3. Ethernet connector (RJ-45)
4. Serial port (RS-232)
5. PS/2 keyboard connector
6. USB Host connector
7. USB Slave connector
YBA250 Input Connector
Figure 1--4 shows the location of the YBA250 Application Module
TEST PORT input connector.
TEST PORT
Figure 1- 4: YBA250 test port.
Getting Started
1- 4 YBA250 Antenna and Transmission Line Analyzer User Manual
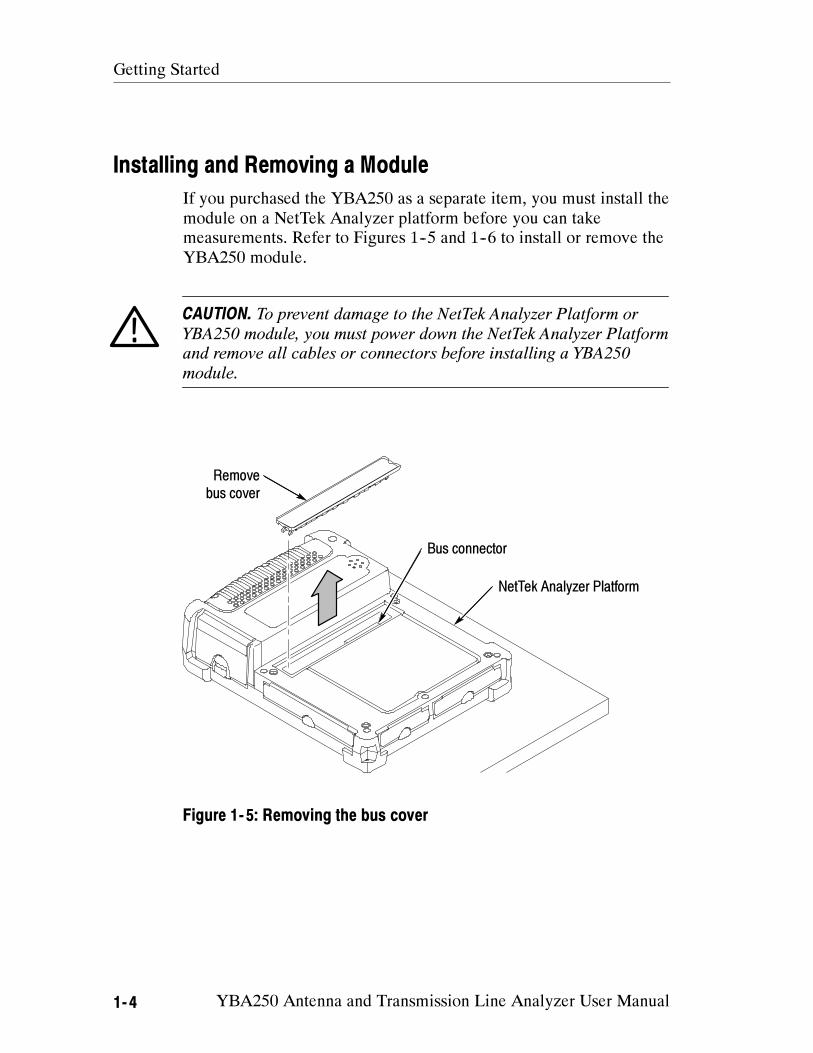
Installing and Removing a Module
If you purchased the YBA250 as a separate item, you must install the
module on a NetTek Analyzer platform before you can take
measurements. Refer to Figures 1--5 and 1--6 to install or remove the
YBA250 module.
CAUTION. To prevent damage to the NetTek Analyzer Platform or
YBA250 module, you must power down the NetTek Analyzer Platform
and remove all cables or connectors before installing a YBA250
module.
NetTek Analyzer Platform
Remove
bus cover
Bus connector
Figure 1- 5: Removing the bus cover
Getting Started
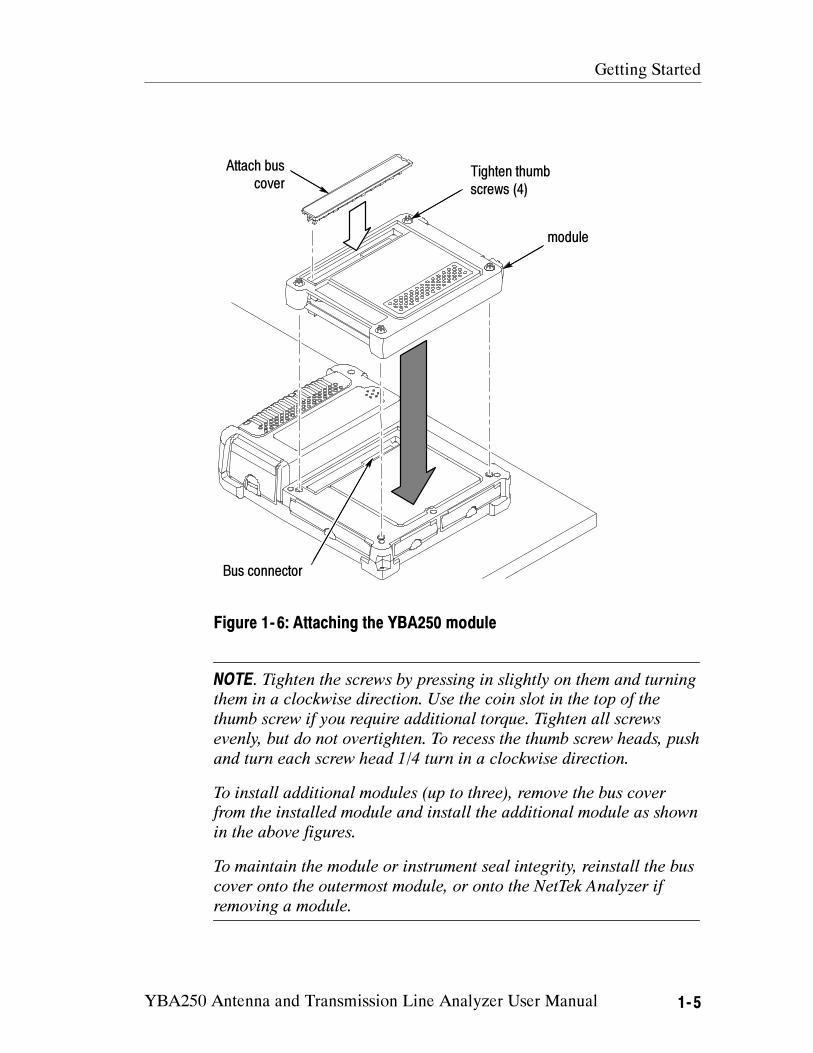
YBA250 Antenna and Transmission Line Analyzer User Manual 1- 5
Tighten thumb
screws (4)
module
Attach bus
cover
Bus connector
Figure 1- 6: Attaching the YBA250 module
NOTE. Tighten the screws by pressing in slightly on them and turning
them in a clockwise direction. Use the coin slot in the top of the
thumb screw if you require additional torque. Tighten all screws
evenly, but do not overtighten. To recess the thumb screw heads, push
and turn each screw head 1/4 turn in a clockwise direction.
To install additional modules (up to three), remove the bus cover
from the installed module and install the additional module as shown
in the above figures.
To maintain the module or instrument seal integrity, reinstall the bus
cover onto the outermost module, or onto the NetTek Analyzer if
removing a module.
Getting Started
1- 6 YBA250 Antenna and Transmission Line Analyzer User Manual
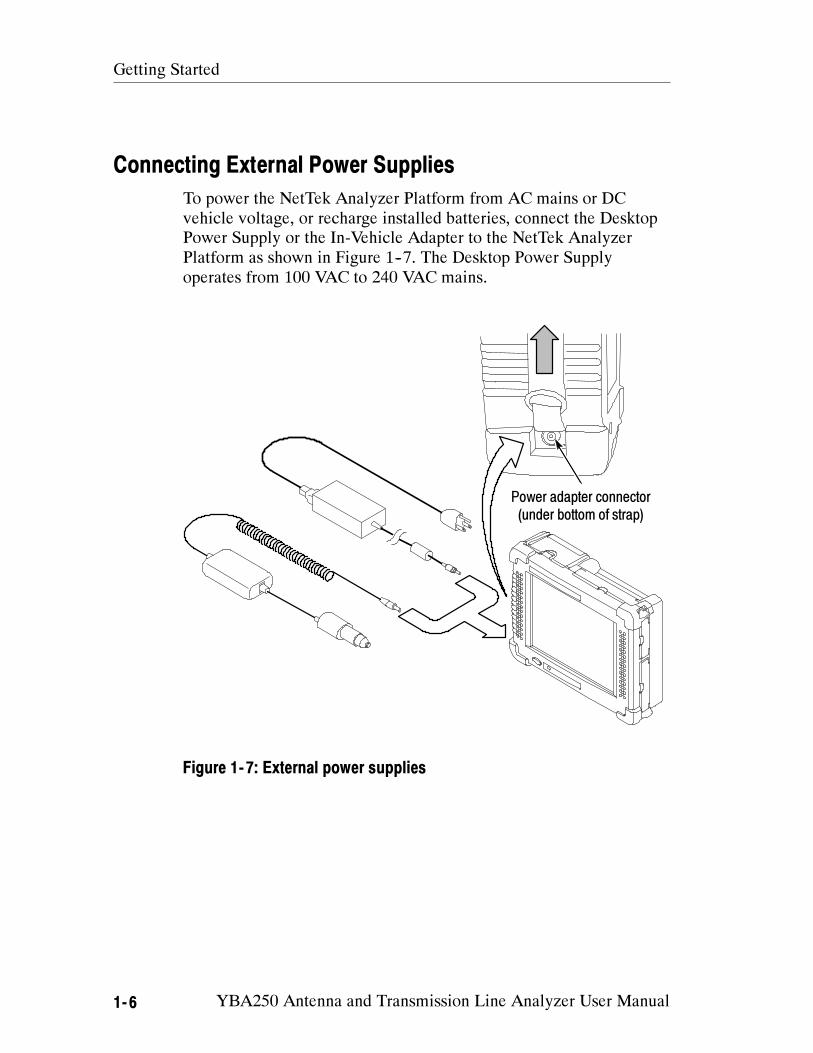
Connecting External Power Supplies
To power the NetTek Analyzer Platform from AC mains or DC
vehicle voltage, or recharge installed batteries, connect the Desktop
Power Supply or the In-Vehicle Adapter to the NetTek Analyzer
Platform as shown in Figure 1--7. The Desktop Power Supply
operates from 100 VAC to 240 VAC mains.
Power adapter connector
(under bottom of strap)
Figure 1- 7: External power supplies
Getting Started
YBA250 Antenna and Transmission Line Analyzer User Manual 1- 7
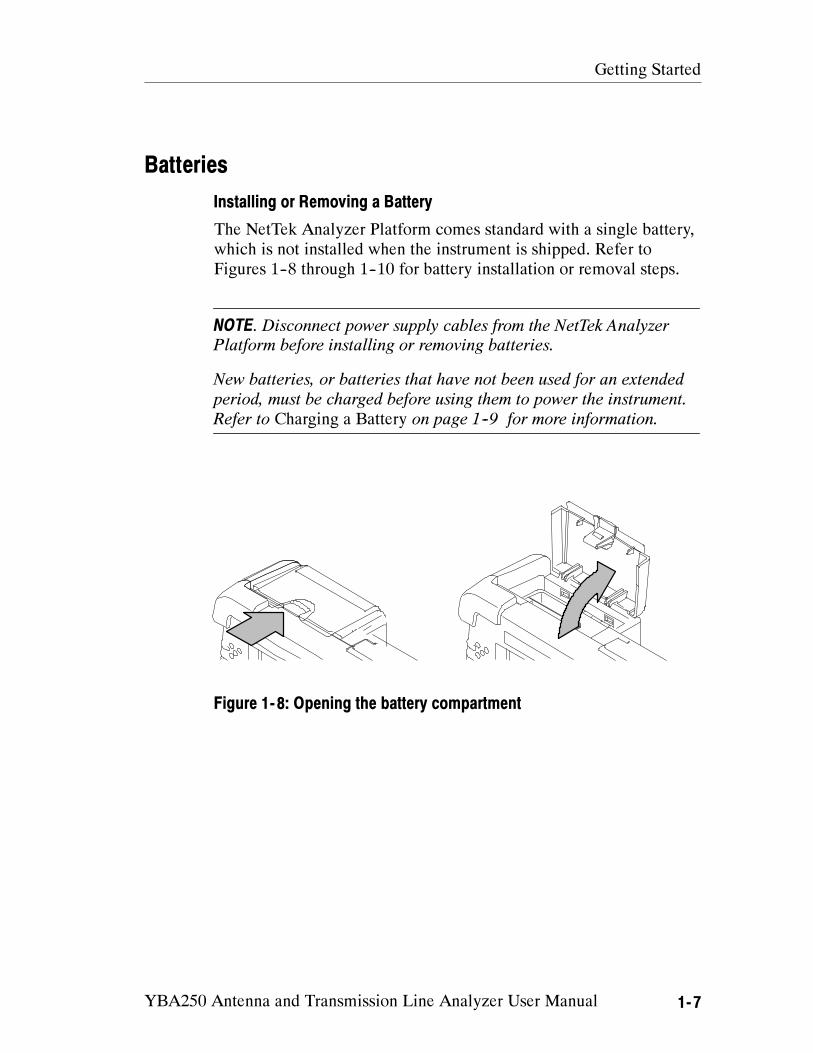
Batteries
Installing or Removing a Battery
The NetTek Analyzer Platform comes standard with a single battery,
which is not installed when the instrument is shipped. Refer to
Figures 1--8 through 1--10 for battery installation or removal steps.
NOTE. Disconnect power supply cables from the NetTek Analyzer
Platform before installing or removing batteries.
New batteries, or batteries that have not been used for an extended
period, must be charged before using them to power the instrument.
Refer to Charging a Battery on page 1--9 for more information.
Figure 1- 8: Opening the battery compartment
Getting Started
1- 8 YBA250 Antenna and Transmission Line Analyzer User Manual
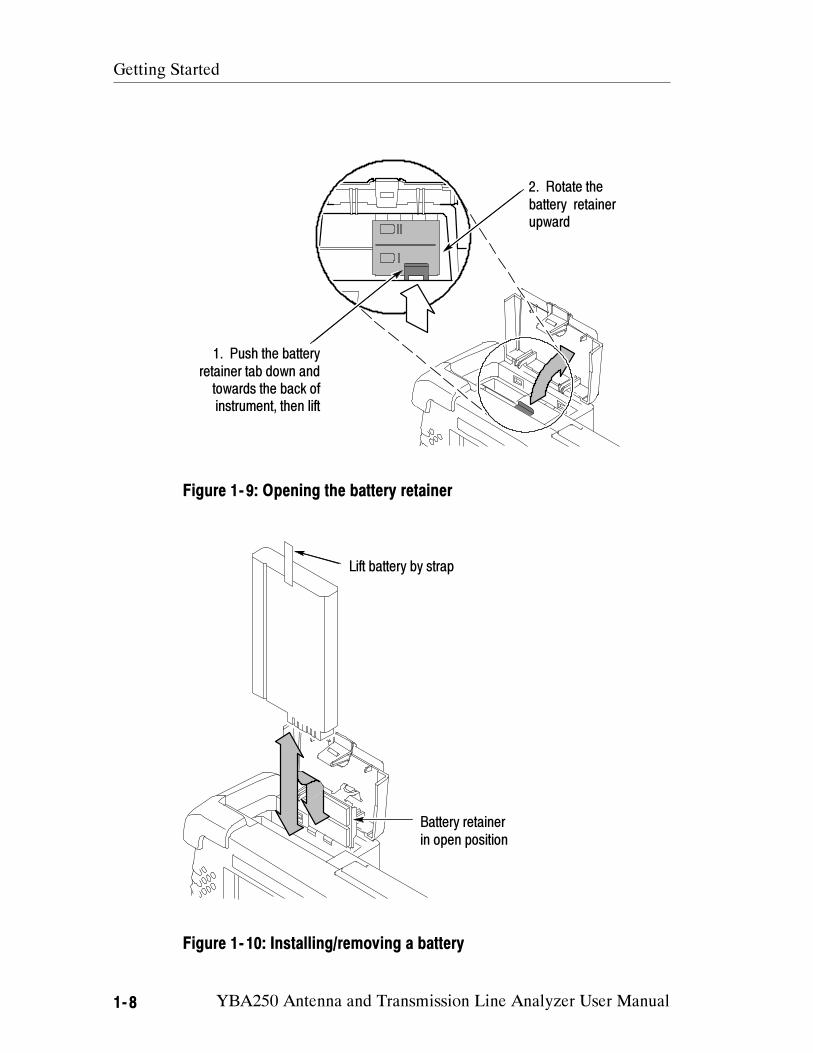
1. Push the battery
retainer tab down and
towards the back of
instrument, then lift
2. Rotate the
battery retainer
upward
Figure 1- 9: Opening the battery retainer
Battery retainer
in open position
Lift battery by strap
Figure 1- 10: Installing/removing a battery
Getting Started
YBA250 Antenna and Transmission Line Analyzer User Manual 1- 9
NOTE. The battery electrical contacts, on the bottom of the battery,
must face in the direction shown in Figure 1--10.
Close and latch the battery retainer and battery compartment door
after installing or removing batteries.
You can add a second battery to increase the operating time. Replace
a battery with the specified type only. To purchase a battery from
Tektronix, please contact your Tektronix Service Center for the
correct part number.
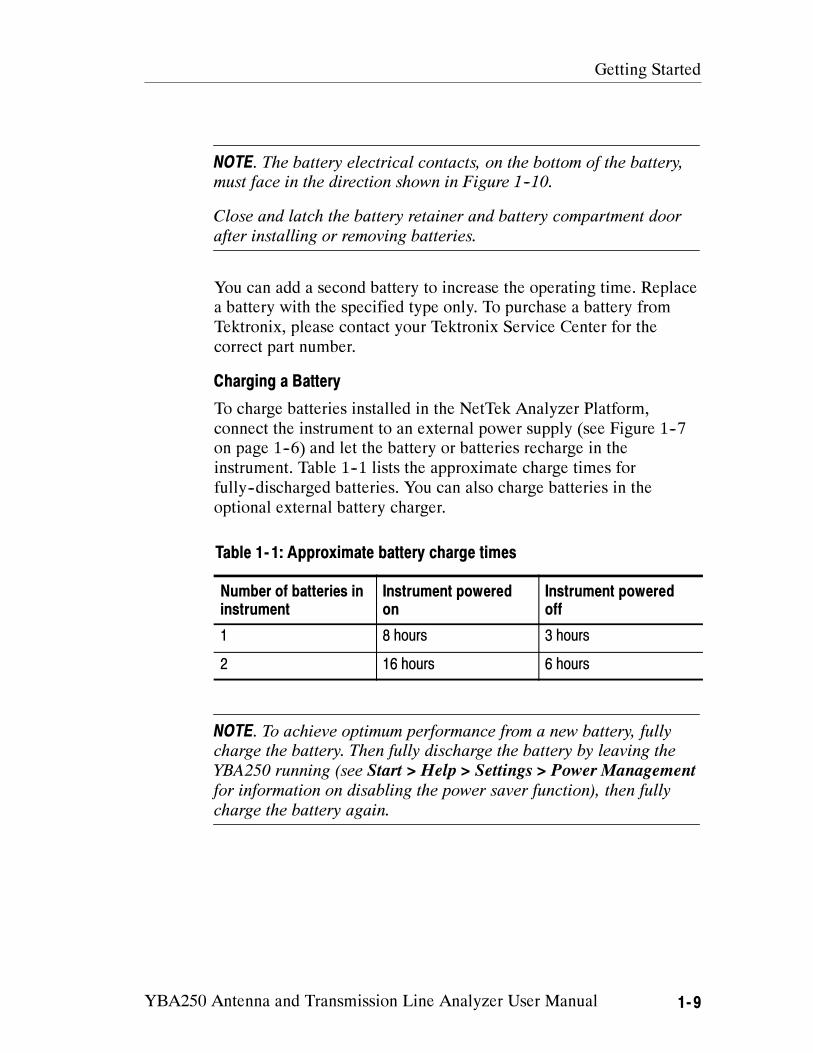
Charging a Battery
To charge batteries installed in the NetTek Analyzer Platform,
connect the instrument to an external power supply (see Figure 1--7
on page 1--6) and let the battery or batteries recharge in the
instrument. Table 1--1 lists the approximate charge times for
fully--discharged batteries. You can also charge batteries in the
optional external battery charger.
Table 1- 1: Approximate battery charge times
Number of batteries in
instrument
Instrument powered
on
Instrument powered
off
1 8 hours 3 hours
2 16 hours 6 hours
NOTE. To achieve optimum performance from a new battery, fully
charge the battery. Then fully discharge the battery by leaving the
YBA250 running (see Start > Help > Settings > Power Management
for information on disabling the power saver function), then fully
charge the battery again.
Getting Started
1- 10 YBA250 Antenna and Transmission Line Analyzer User Manual
Batteries are partially charged and calibrated at the factory. A
calibrated battery allows the NetTek Analyzer Platform to more
accurately estimate how much longer the YBA250 can operate
before the instrument automatically powers off. The YBA250 always
warns you before it powers off, so that you can save important test
results or settings.
To verify the status of your batteries at any time:
1. Select Start > Settings > Control Panel.
2. Double-tap the Power Management icon. The Batteries tab lists
the status of each battery.
If the battery charge is low, connect the NetTek Analyzer Platform to
an external power source and let the battery or batteries recharge in
the instrument for eight hours. For more information, select Start >
Help > Settings > Power Management > Charging Batteries.
Maximizing Battery Operating Time
For tips on how to maximize battery operating time, select
Start > Help > Settings > Power Management > Optimizing
Battery Life.
Transporting Lithium-Ion Batteries
Regulations regarding transportation of lithium-ion batteries on
passenger aircraft may subject this product to special handling
restrictions. Consult your air carrier for applicability and determina-
tion of any special lithium-ion battery transportation requirements.
Each NetTek Analyzer Platform lithium-ion battery pack contains
less than 8 grams of lithium, with individual cells each containing
less than 1.5 grams of lithium, as measured by International Civil
Aviation Organization (ICAO) standards.
Getting Started
YBA250 Antenna and Transmission Line Analyzer User Manual 1- 11
Powering On the Instrument
To power on the NetTek Analyzer Platform, press the large blue oval
front-panel switch in the lower-left corner. The green status indicator
to the right of the switch lights and the system begins its power-on
process. The touch-screen display and human interface are described
in the Operating Basics section.
How the Software Loads
When you press the power switch on the front panel, the NetTek
Analyzer Platform powers on and runs its startup diagnostics (if
enabled). Once the NetTek Analyzer Platform has completed its
power-on sequence, the YBA250 software begins to load.
If there is enough flash memory available, the software loads into
flash memory. If there is not enough flash memory available, then
the YBA250 software loads into volatile memory (this happens only
with user-installed modules; if your YBA250 was purchased already
installed on a NetTek Analyzer Platform the software was loaded
into flash memory at the factory).
Loading the software into flash memory reduces the YBA250
application power-on startup time. If the software is not loaded in
flash memory, the software must be loaded into the NetTek Analyzer
Platform each time the instrument is powered on, resulting in a
longer start up time. Note that the software load process is
automatic; there are no user decisions required or settings available
that affect the software load process.
Calibrating the Touch-Screen Display
For the touch-screen display to respond correctly to your taps, you
must set the stylus centering and double-tap speed.
Setting the stylus tap rate
1. Select Start > Settings > Control Panel.
2. Open (double-tap) the Stylus icon.
3. In the Double-Tap tab, double-tap the checkerboard grid at a
comfortable speed with your stylus or finger to set the tap rate.
Getting Started
1- 12 YBA250 Antenna and Transmission Line Analyzer User Manual
4. Double-tap the checkerboard grid to verify your settings.
Setting the stylus centering
1. Select Start > Settings > Control Panel.
2. Open the Stylus icon.
3. In the Calibration tab, select Recalibrate.
4. Follow the on-screen instructions to set the location and amount
of pressure needed for the touch-screen to respond to your taps.
Apply pressure to the touch-screen for approximately 5 seconds
at each position, until the target moves.
5. Select OK to close the dialog box and save your settings.
Powering Off the Instrument
The NetTek Analyzer Platform has separate, but related, standby and
power off functions.
Suspend Mode
Use Suspend mode to place the NetTek Analyzer Platform in a
suspended (standby or sleep) state. This is the typical power down
mode that allows the YBA250 software to remain in volatile
memory. If the NetTek Analyzer Platform remains in Suspend mode
for an extended time (approximately two hours), it automatically
enters Shutdown mode.
To suspend analyzer operation, choose one of the following methods:
Press the front-panel power switch.
Select Start > Programs > Shutdown. In the Shut Down dialog
box, select Suspend.
To cancel Suspend mode and wake up the NetTek Analyzer
Platform, press the front-panel power switch. The instrument returns
to the state that existed before suspend mode was invoked.
Getting Started
YBA250 Antenna and Transmission Line Analyzer User Manual 1- 13
Shutdown Mode
To completely power down the NetTek Analyzer Platform, do the
following:
1. Select Start > Programs > Shutdown.
2. In the Shut Down dialog box, select Shutdown.
A shutdown clears volatile memory, including the YBA250 software
if it is loaded in volatile memory, user setups, and measurement data
not saved to nonvolatile memory. For information on how to save
these items to nonvolatile memory:
1. Select Start > Help.
2. In the Help window select Tektronix Basics.
3. Select Store Data in Nonvolatile Memory.
The next time you press the front-panel power switch, the NetTek
Analyzer Platform cycles through the complete power up process,
taking about 30 seconds to completely power up.
Restart (Software Reset)
If the NetTek Analyzer Platform or YBA250 application stops
responding correctly, try performing a restart to clear the problem.
To restart the YBA250, do the following:
1. Select Start > Programs > Shutdown.
2. In the Shut Down dialog box, select Restart.
The display blanks for approximately five seconds. The YBA250
software reloads and restarts. A restart does not empty volatile
memory.
Getting Started
1- 14 YBA250 Antenna and Transmission Line Analyzer User Manual
Front-Panel Power Switch
Depending on the current state of the NetTek Analyzer Platform,
pressing the front-panel power switch performs one of the following
functions:
If the NetTek Analyzer Platform is shut down: powers on the
instrument.
If the NetTek Analyzer Platform is operating: initiates Suspend
mode.
If the NetTek Analyzer Platform is in Suspend mode: cancels
Suspend mode and activates the YBA250.
If the analyzer is in PowerSaver mode (touch-screen display off):
activates the display.
Preventing Personal Injury from the Effects of Lightning
WARNING. To prevent personal injury from the effects of lightning,
exercise the following precautions when using this product:
Before connecting this product to any source
Check your local weather forecast for the possibility of
thunderstorms or lightning.
If weather conditions could allow thunderstorms or lightning to
develop, be sure to visually check the sky and weather conditions
in your area frequently.
If you can hear thunder or if you see lightning, do not connect
this product to any source which may be exposed to the effects of
lightning.
Getting Started
YBA250 Antenna and Transmission Line Analyzer User Manual 1- 15
Use your own good judgement and common sense. You must
protect yourself from the effects of lightning.
You must assume that hazardous voltages will be present on
exposed surfaces of this product if it is connected to a source
exposed to lightning. The insulation of this product will not
protect you from these hazardous voltages.
Do not connect this product to any source which might be subject to
the effects of lightning
If thunderstorms or lightning are in your vicinity:
When weather conditions that could lead to lightning activity
exist in your area, you could be at risk of a lightning strike
before the cloud is close enough for you to hear thunder or see
lightning.
When lightning strikes a structure or facility, current travels
through the rebar, concrete, pipes, cables, vent stacks, and
electrical system.
Lightning can induce electric and magnetic fields into structures
and portions of wiring. The length of a conductor affected by the
magnetic field of a lightning strike may exceed two miles.
Be alert and aware of the effects of lightning
When lightning strikes a conductor, which in turn introduces the
current into an area some distance from the ground strike point,
equipment can be damaged and personnel injured if they
become an indirect path in the completion of the ground circuit.
Conductors such as the braided shields of cables or unshielded
wires will have significant transient currents flowing in them in
regions exposed to the electric field effect of lightning.
Induced voltages may cause breakdown of insulation in wiring at
connectors and in electrical components or breakdown of air.
Getting Started
1- 16 YBA250 Antenna and Transmission Line Analyzer User Manual
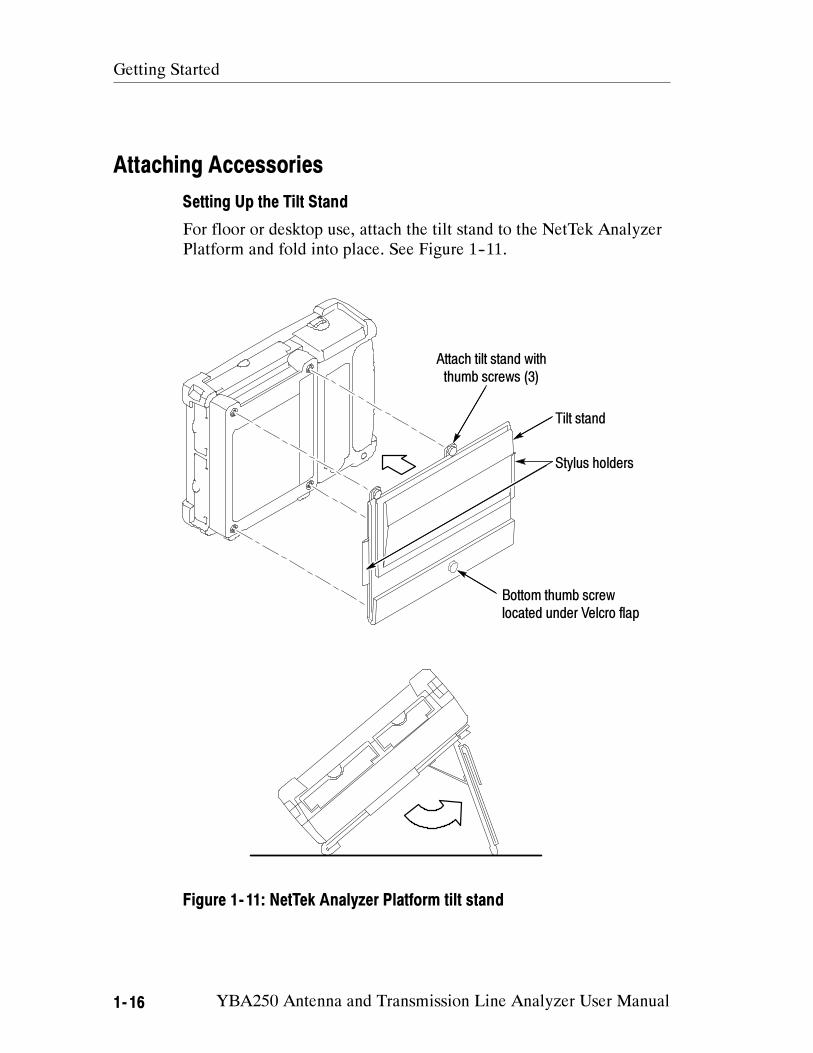
Attaching Accessories
Setting Up the Tilt Stand
For floor or desktop use, attach the tilt stand to the NetTek Analyzer
Platform and fold into place. See Figure 1--11.
Attach tilt stand with
thumb screws (3)
Bottom thumb screw
located under Velcro flap
Tilt stand
Stylus holders
Figure 1- 11: NetTek Analyzer Platform tilt stand
Getting Started
YBA250 Antenna and Transmission Line Analyzer User Manual 1- 17
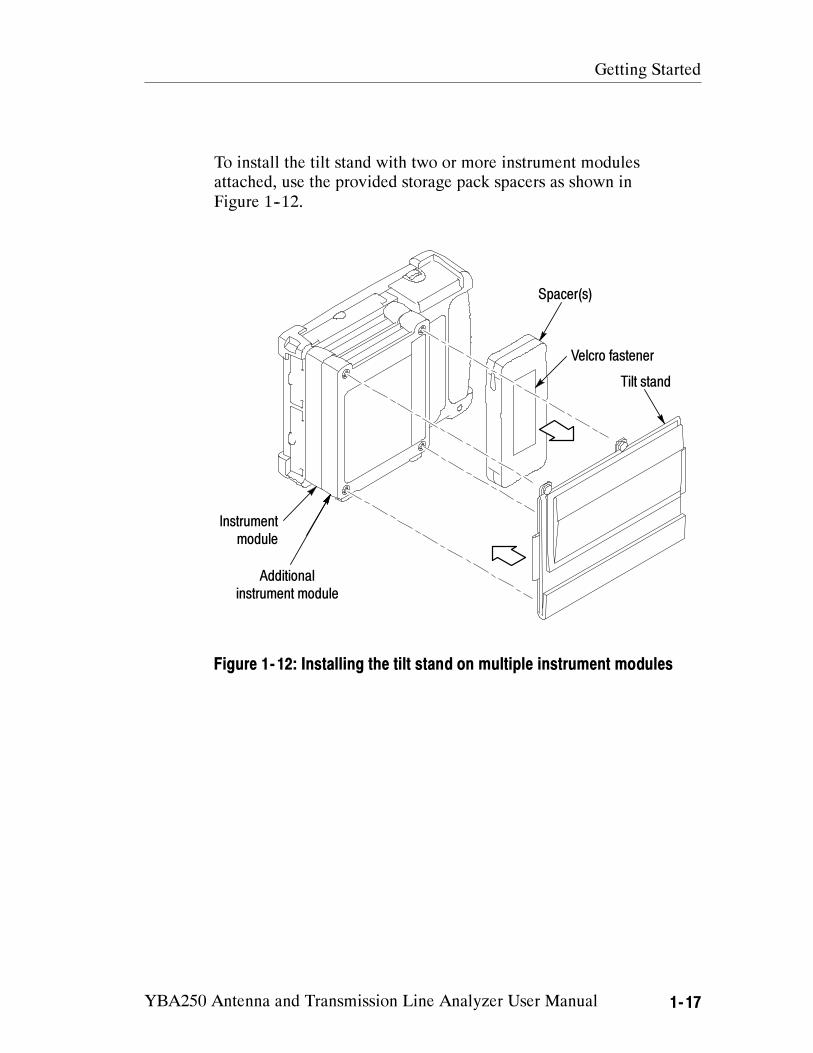
To install the tilt stand with two or more instrument modules
attached, use the provided storage pack spacers as shown in
Figure 1--12.
Additional
instrument module
Spacer(s)
Tilt stand
Velcro fastener
Instrument
module
Figure 1- 12: Installing the tilt stand on multiple instrument modules
Getting Started
1- 18 YBA250 Antenna and Transmission Line Analyzer User Manual
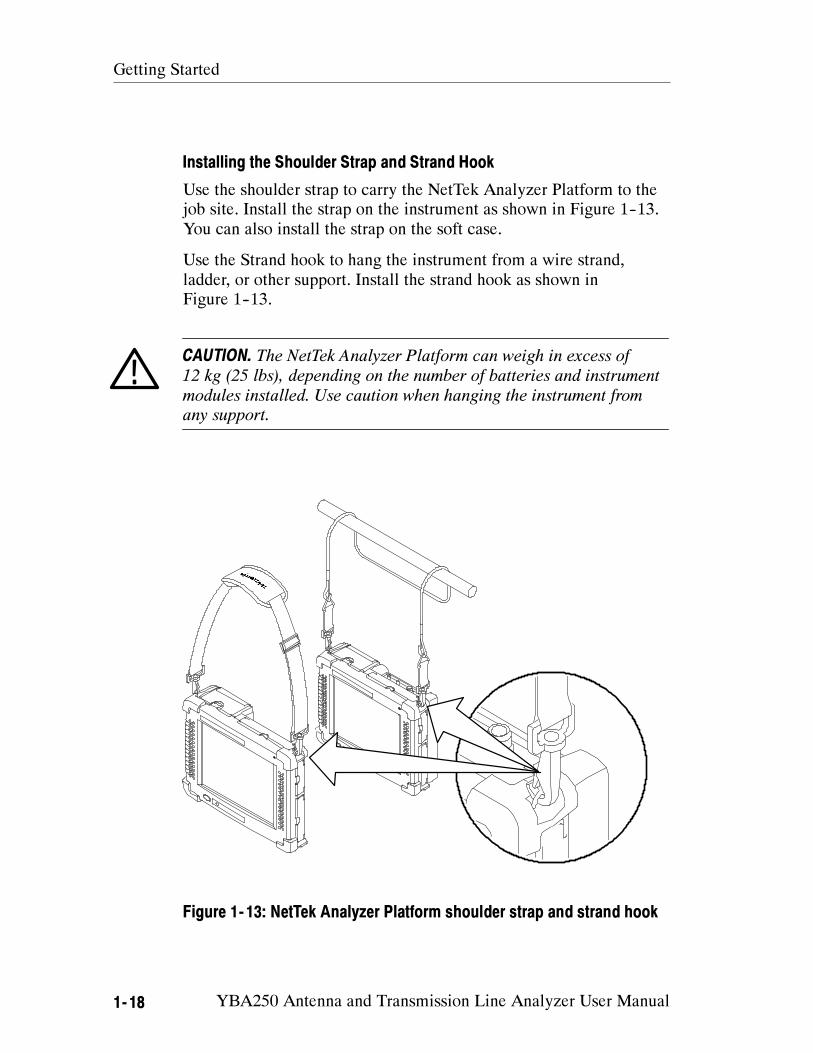
Installing the Shoulder Strap and Strand Hook
Use the shoulder strap to carry the NetTek Analyzer Platform to the
job site. Install the strap on the instrument as shown in Figure 1--13.
You can also install the strap on the soft case.
Use the Strand hook to hang the instrument from a wire strand,
ladder, or other support. Install the strand hook as shown in
Figure 1--13.
CAUTION. The NetTek Analyzer Platform can weigh in excess of
12 kg (25 lbs), depending on the number of batteries and instrument
modules installed. Use caution when hanging the instrument from
any support.
Figure 1- 13: NetTek Analyzer Platform shoulder strap and strand hook

Operating Basics

YBA250 Antenna and Transmission Line Analyzer User Manual 2- 1
Operating Basics
This section explains the essential things you need to know to before
operating the YBA250 Antenna and Transmission Line Analyzer.
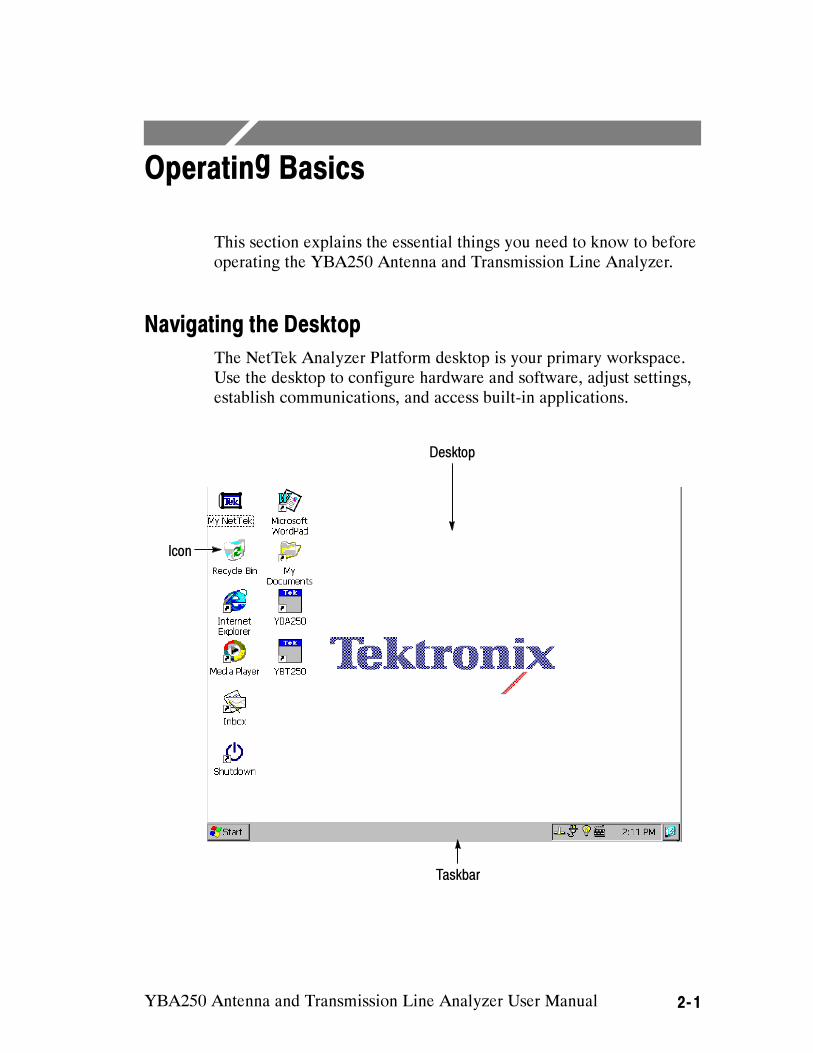
Navigating the Desktop
The NetTek Analyzer Platform desktop is your primary workspace.
Use the desktop to configure hardware and software, adjust settings,
establish communications, and access built-in applications.
Taskbar
Desktop
Icon
Operating Basics
2- 2 YBA250 Antenna and Transmission Line Analyzer User Manual
Icons
Double-tap desktop icons to open folders or to start programs.
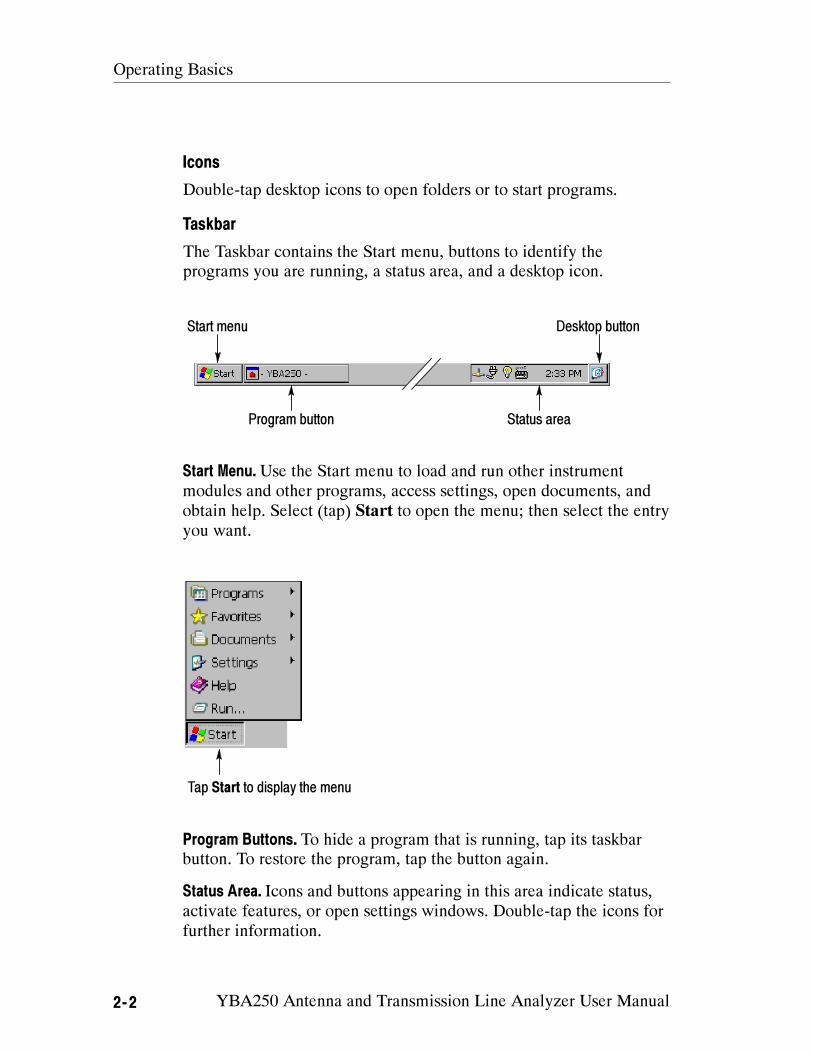
Taskbar
The Taskbar contains the Start menu, buttons to identify the
programs you are running, a status area, and a desktop icon.
Desktop button
Program button Status area
Start menu
Start Menu.Use the Start menu to load and run other instrument
modules and other programs, access settings, open documents, and
obtain help. Select (tap) Start to open the menu; then select the entry
you want.
Tap Start to display the menu
Program Buttons. To hide a program that is running, tap its taskbar
button. To restore the program, tap the button again.
Status Area. Icons and buttons appearing in this area indicate status,
activate features, or open settings windows. Double-tap the icons for
further information.
Operating Basics
YBA250 Antenna and Transmission Line Analyzer User Manual 2- 3
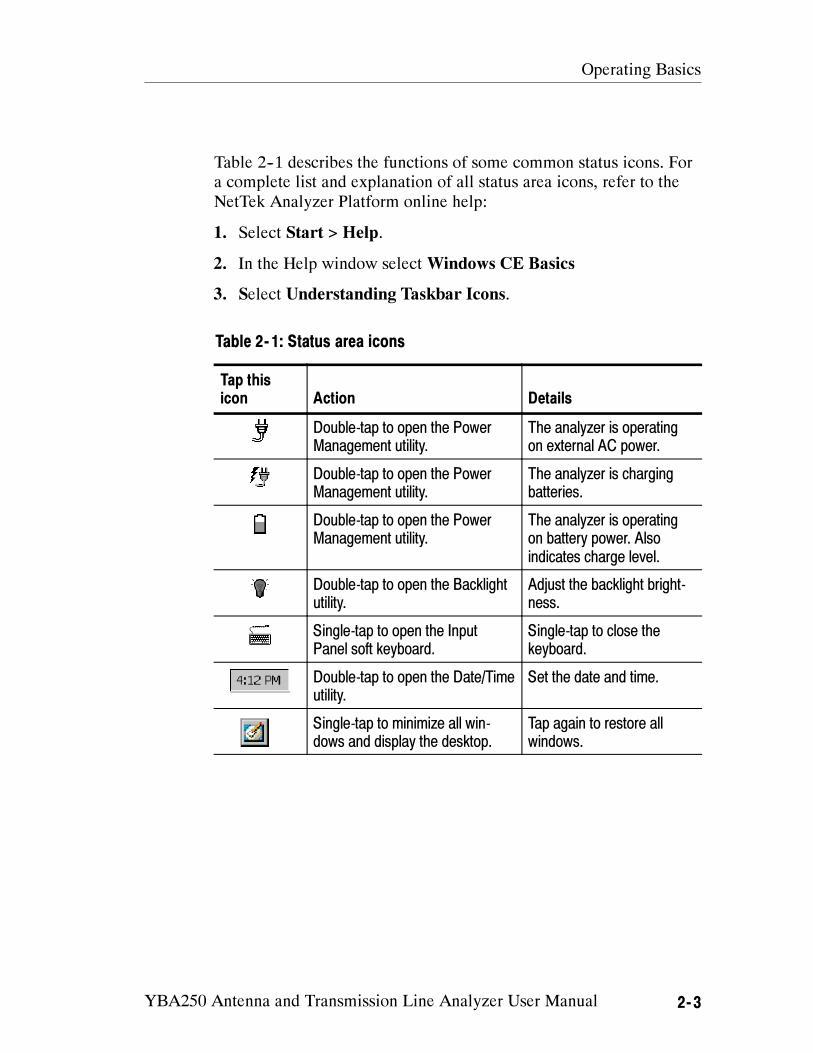
Table 2--1 describes the functions of some common status icons. For
a complete list and explanation of all status area icons, refer to the
NetTek Analyzer Platform online help:
1. Select Start > Help.
2. In the Help window select Windows CE Basics
3. Select Understanding Taskbar Icons.
Table 2- 1: Status area icons
Tap this
icon Action Details
Double-tap to open the Power
Management utility.
The analyzer is operating
on external AC power.
Double-tap to open the Power
Management utility.
The analyzer is charging
batteries.
Double-tap to open the Power
Management utility.
The analyzer is operating
on battery power. Also
indicates charge level.
Double-tap to open the Backlight
utility.
Adjust the backlight bright-
ness.
Single-tap to open the Input
Panel soft keyboard.
Single-tap to close the
keyboard.
Double-tap to open the Date/Time
utility.
Set the date and time.
Single-tap to minimize all win-
dows and display the desktop.
Tap again to restore all
windows.
Operating Basics
2- 4 YBA250 Antenna and Transmission Line Analyzer User Manual
Getting Help
To open the Help window and obtain general information on
YBA250 topics, select Help from the Start menu. Select YBA250 to
get help on the YBA250.
There are three ways to display Help when you are running the
YBA250 software:
Tap the icon in the upper-right corner of the YBA250
display. This displays the top level of the YBA250 help.
Tap underlined text on the screen. This displays the Help topic
for the item selected.
Display Help from some dialog boxes by selecting the Help
button in the bottom-right corner of the dialog box.
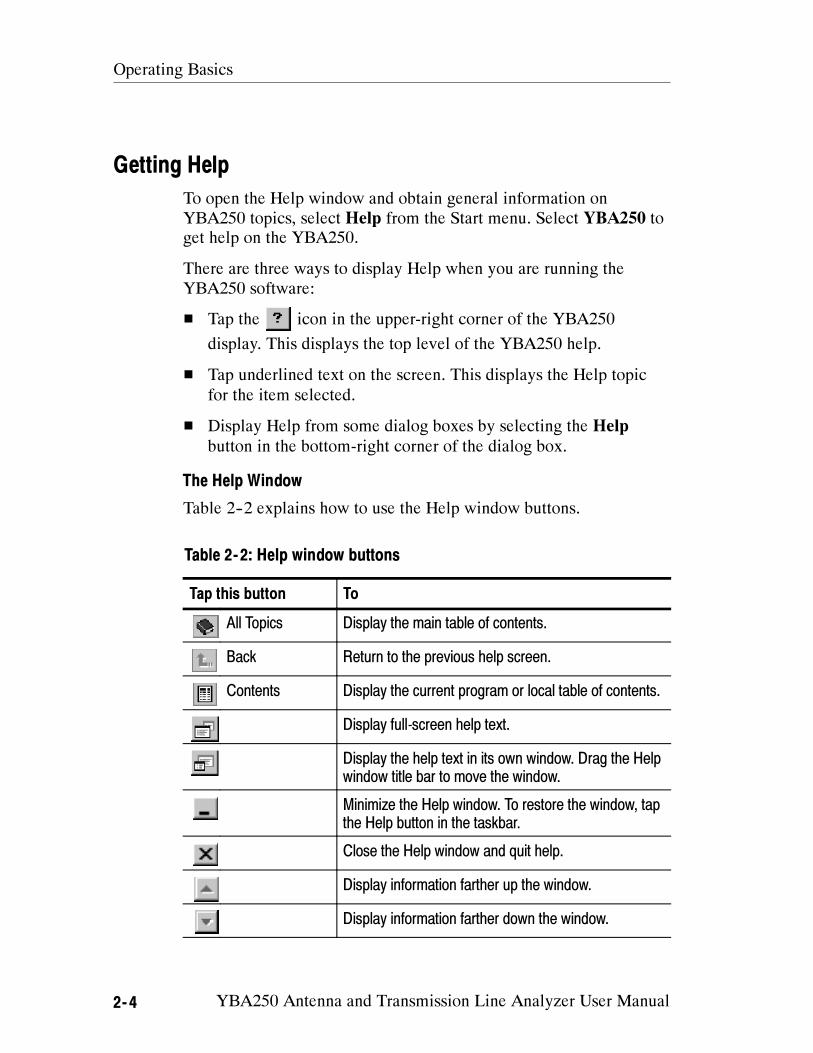
The Help Window
Table 2--2 explains how to use the Help window buttons.
Table 2- 2: Help window buttons
Tap this button To
All Topics Display the main table of contents.
Back Return to the previous help screen.
Contents Display the current program or local table of contents.
Display full-screen help text.
Display the help text in its own window. Drag the Help
window title bar to move the window.
Minimize the Help window. To restore the window, tap
the Help button in the taskbar.
Close the Help window and quit help.
Display information farther up the window.
Display information farther down the window.
Operating Basics
YBA250 Antenna and Transmission Line Analyzer User Manual 2- 5
Starting the YBA250 Software
If you purchased your YBA250 installed on NetTek Analyzer
Platform, it comes from the factory set to automatically start the
YBA250 software when the NetTek Analyzer Platform is powered
up. If you added your YBA250 module to a NetTek Analyzer
Platform you already own, you will need to start the YBA250
software or set the software to load at startup.
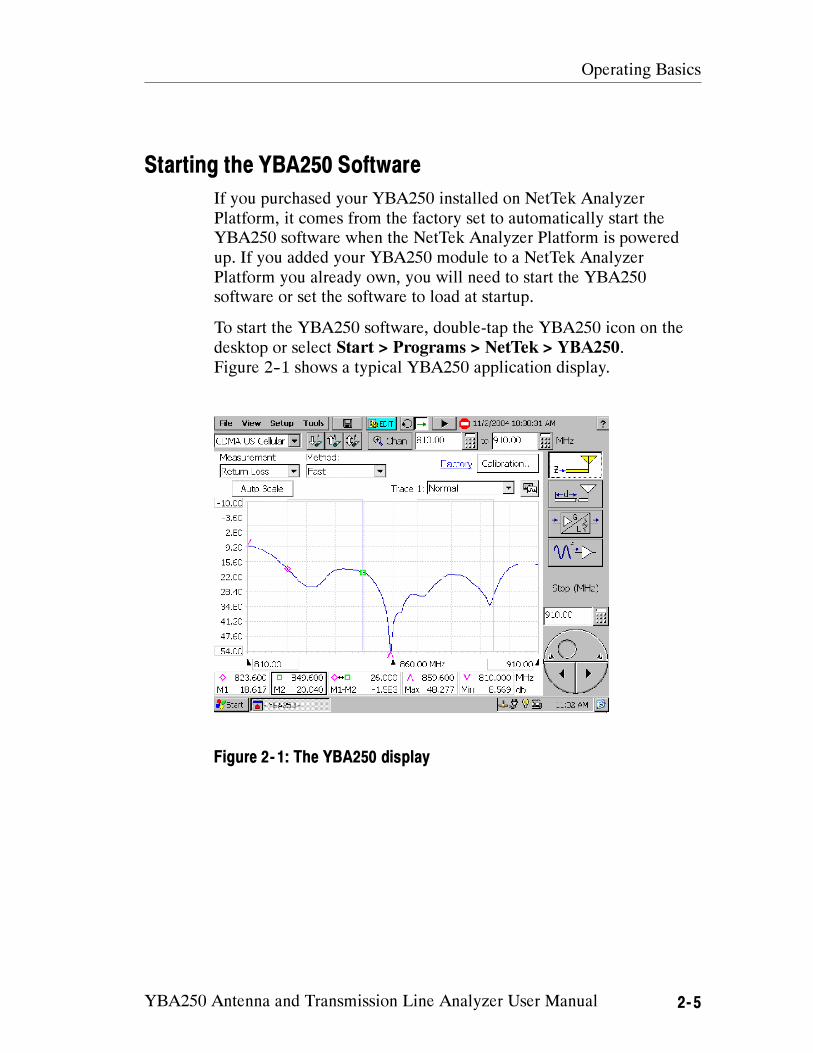
To start the YBA250 software, double-tap the YBA250 icon on the
desktop or select Start > Programs > NetTek > YBA250.
Figure 2--1 shows a typical YBA250 application display.
Figure 2- 1: The YBA250 display
Operating Basics
2- 6 YBA250 Antenna and Transmission Line Analyzer User Manual
Setting the YBA250 Software to Load at Startup
If you purchased your YBA250 as a module to use on an existing
NetTek Analyzer Platform, you may want to set the YBA250 to load
at startup.
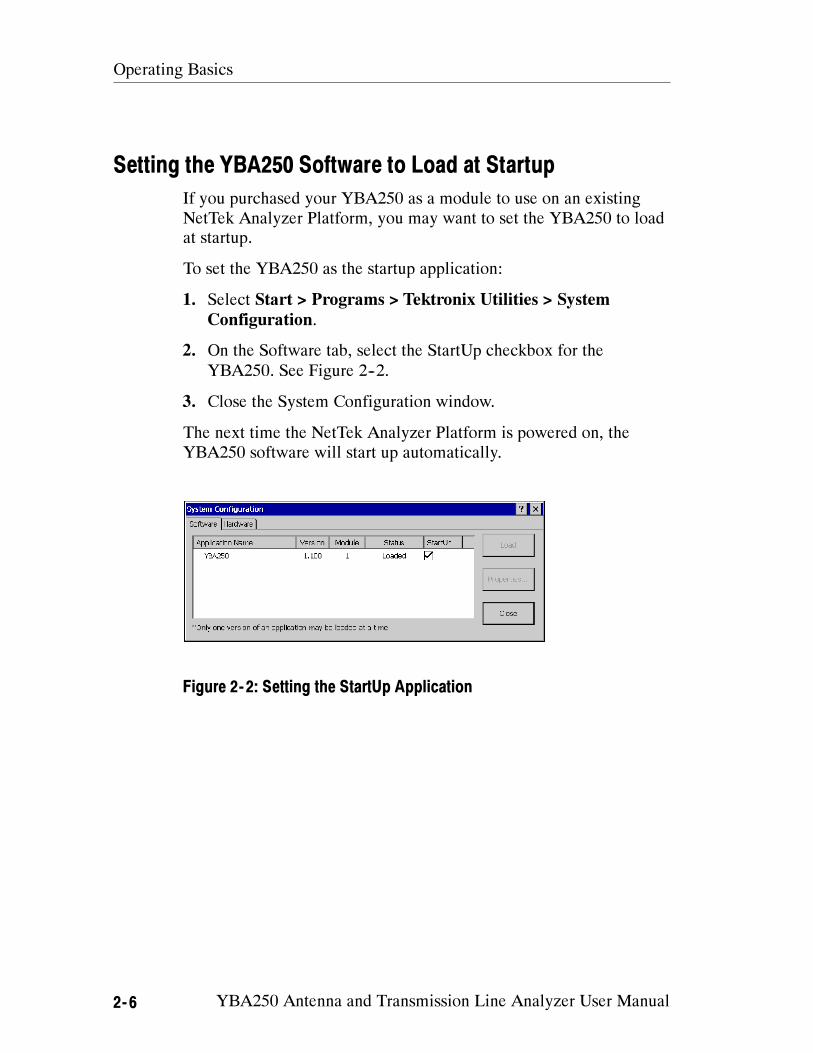
To set the YBA250 as the startup application:
1. Select Start > Programs > Tektronix Utilities > System
Configuration.
2. On the Software tab, select the StartUp checkbox for the
YBA250. See Figure 2--2.
3. Close the System Configuration window.
The next time the NetTek Analyzer Platform is powered on, the
YBA250 software will start up automatically.
Figure 2- 2: Setting the StartUp Application
Operating Basics
YBA250 Antenna and Transmission Line Analyzer User Manual 2- 7
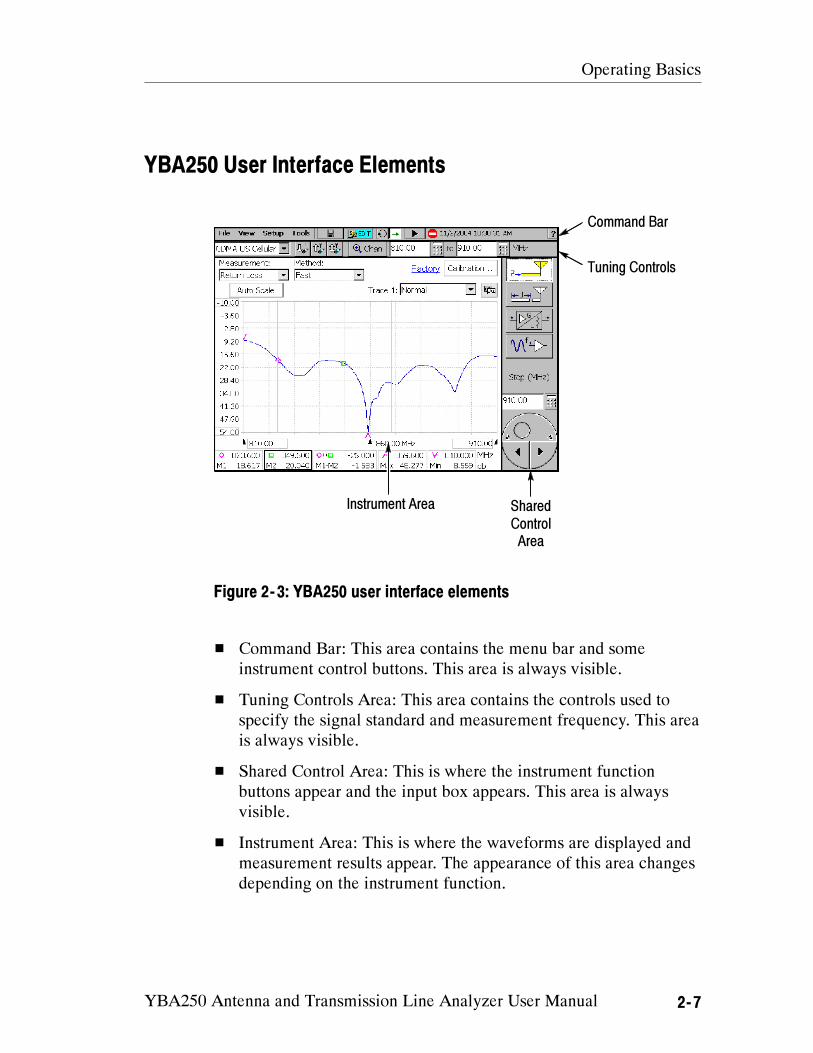
YBA250 User Interface Elements
Instrument Area Shared
Control
Area
Tuning Controls
Command Bar
Figure 2- 3: YBA250 user interface elements
Command Bar: This area contains the menu bar and some
instrument control buttons. This area is always visible.
Tuning Controls Area: This area contains the controls used to
specify the signal standard and measurement frequency. This area
is always visible.
Shared Control Area: This is where the instrument function
buttons appear and the input box appears. This area is always
visible.
Instrument Area: This is where the waveforms are displayed and
measurement results appear. The appearance of this area changes
depending on the instrument function.
Operating Basics
2- 8 YBA250 Antenna and Transmission Line Analyzer User Manual
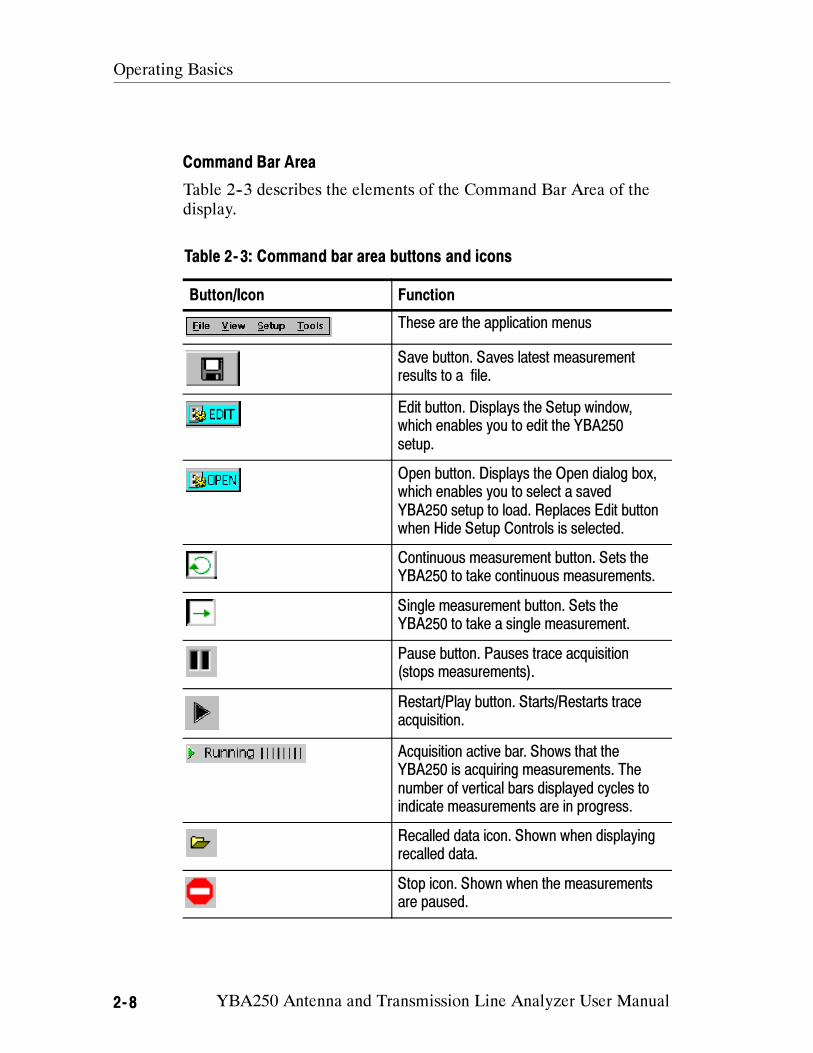
Command Bar Area
Table 2--3 describes the elements of the Command Bar Area of the
display.
Table 2- 3: Command bar area buttons and icons
Button/Icon Function
These are the application menus
Save button. Saves latest measurement
results to a file.
Edit button. Displays the Setup window,
which enables you to edit the YBA250
setup.
Open button. Displays the Open dialog box,
which enables you to select a saved
YBA250 setup to load. Replaces Edit button
when Hide Setup Controls is selected.
Continuous measurement button. Sets the
YBA250 to take continuous measurements.
Single measurement button. Sets the
YBA250 to take a single measurement.
Pause button. Pauses trace acquisition
(stops measurements).
Restart/Play button. Starts/Restarts trace
acquisition.
Acquisition active bar. Shows that the
YBA250 is acquiring measurements. The
number of vertical bars displayed cycles to
indicate measurements are in progress.
Recalled data icon. Shown when displaying
recalled data.
Stop icon. Shown when the measurements
are paused.
Operating Basics
YBA250 Antenna and Transmission Line Analyzer User Manual 2- 9
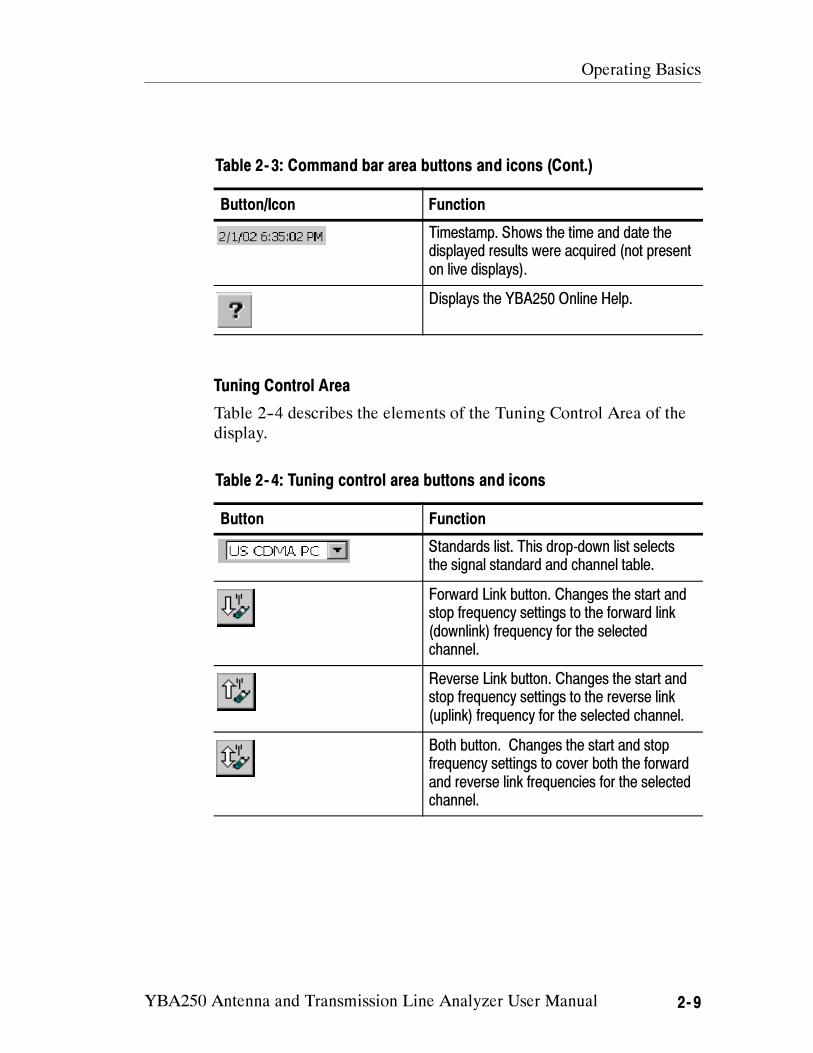
Table 2- 3: Command bar area buttons and icons (Cont.)
Button/Icon Function
Timestamp. Shows the time and date the
displayed results were acquired (not present
on live displays).
Displays the YBA250 Online Help.
Tuning Control Area
Table 2--4 describes the elements of the Tuning Control Area of the
display.
Table 2- 4: Tuning control area buttons and icons
Button Function
Standards list. This drop-down list selects
the signal standard and channel table.
Forward Link button. Changes the start and
stop frequency settings to the forward link
(downlink) frequency for the selected
channel.
Reverse Link button. Changes the start and
stop frequency settings to the reverse link
(uplink) frequency for the selected channel.
Both button. Changes the start and stop
frequency settings to cover both the forward
and reverse link frequencies for the selected
channel.
Operating Basics
2- 10 YBA250 Antenna and Transmission Line Analyzer User Manual
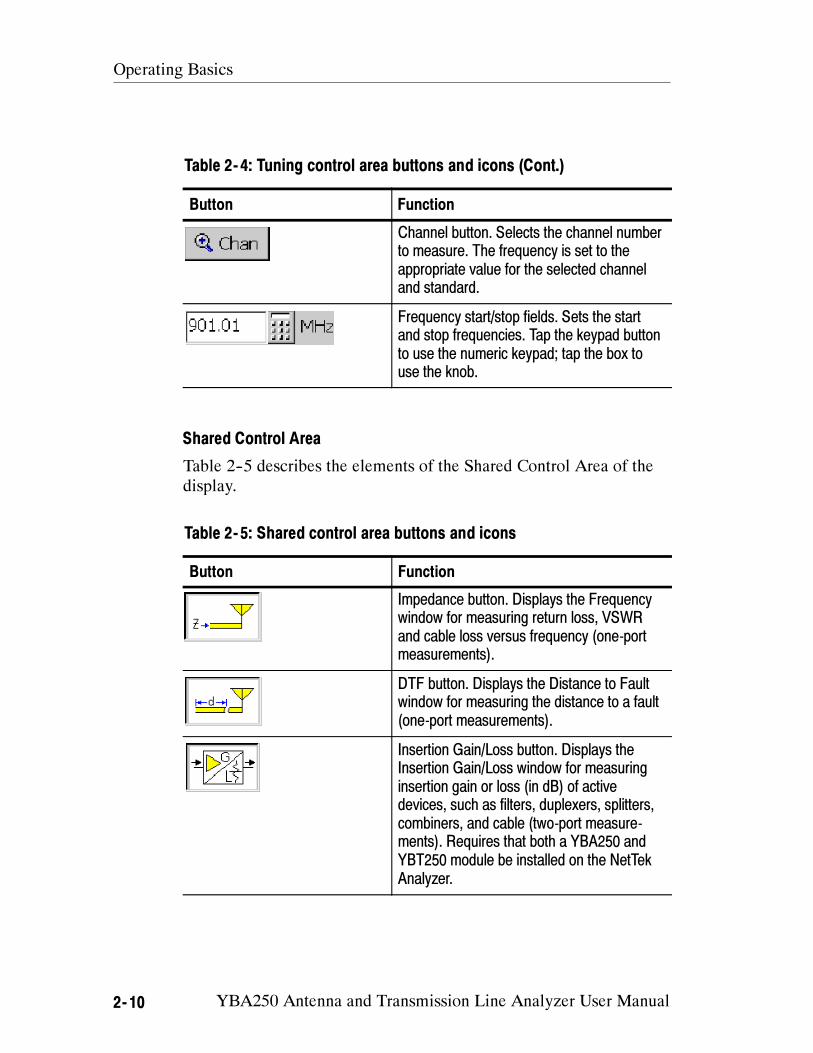
Table 2- 4: Tuning control area buttons and icons (Cont.)
Button Function
Channel button. Selects the channel number
to measure. The frequency is set to the
appropriate value for the selected channel
and standard.
Frequency start/stop fields. Sets the start
and stop frequencies. Tap the keypad button
to use the numeric keypad; tap the box to
use the knob.
Shared Control Area
Table 2--5 describes the elements of the Shared Control Area of the
display.
Table 2- 5: Shared control area buttons and icons
Button Function
Impedance button. Displays the Frequency
window for measuring return loss, VSWR
and cable loss versus frequency (one-port
measurements).
DTF button. Displays the Distance to Fault
window for measuring the distance to a fault
(one-port measurements).
Insertion Gain/Loss button. Displays the
Insertion Gain/Loss window for measuring
insertion gain or loss (in dB) of active
devices, such as filters, duplexers, splitters,
combiners, and cable (two-port measure-
ments). Requires that both a YBA250 and
YBT250 module be installed on the NetTek
Analyzer.
Operating Basics
YBA250 Antenna and Transmission Line Analyzer User Manual 2- 11
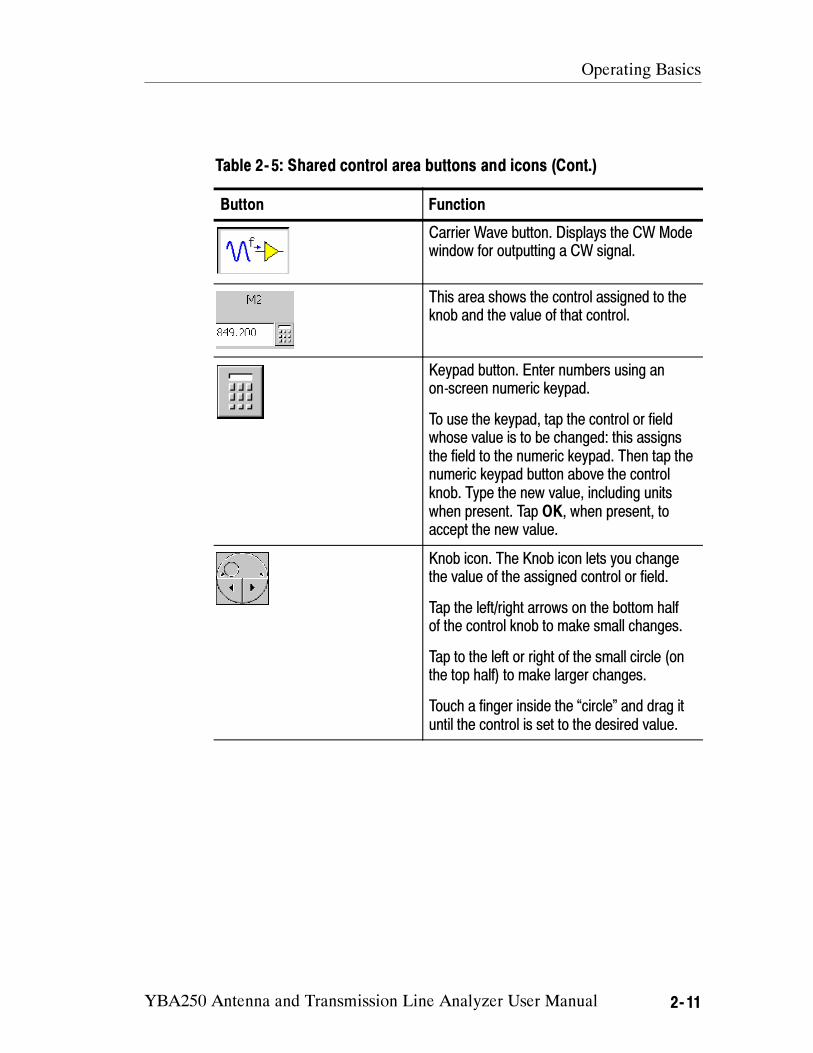
Table 2- 5: Shared control area buttons and icons (Cont.)
Button Function
Carrier Wave button. Displays the CW Mode
window for outputting a CW signal.
This area shows the control assigned to the
knob and the value of that control.
Keypad button. Enter numbers using an
on-screen numeric keypad.
To use the keypad, tap the control or field
whose value is to be changed: this assigns
the field to the numeric keypad. Then tap the
numeric keypad button above the control
knob. Type the new value, including units
when present. Tap OK, when present, to
accept the new value.
Knob icon. The Knob icon lets you change
the value of the assigned control or field.
Tap the left/right arrows on the bottom half
of the control knob to make small changes.
Tap to the left or right of the small circle (on
the top half) to make larger changes.
Touch a finger inside the “circle” and drag it
until the control is set to the desired value.
Operating Basics
2- 12 YBA250 Antenna and Transmission Line Analyzer User Manual
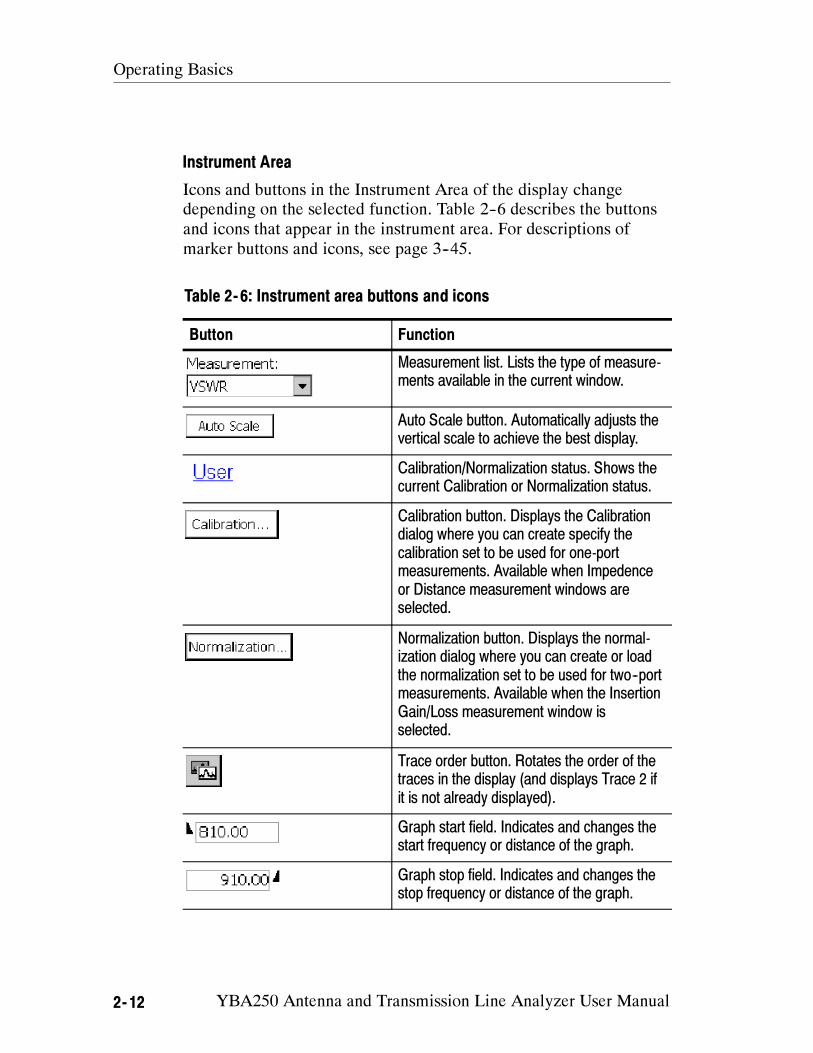
Instrument Area
Icons and buttons in the Instrument Area of the display change
depending on the selected function. Table 2--6 describes the buttons
and icons that appear in the instrument area. For descriptions of
marker buttons and icons, see page 3--45.
Table 2- 6: Instrument area buttons and icons
Button Function
Measurement list. Lists the type of measure-
ments available in the current window.
Auto Scale button. Automatically adjusts the
vertical scale to achieve the best display.
Calibration/Normalization status. Shows the
current Calibration or Normalization status.
Calibration button. Displays the Calibration
dialog where you can create specify the
calibration set to be used for one-port
measurements. Available when Impedence
or Distance measurement windows are
selected.
Normalization button. Displays the normal-
ization dialog where you can create or load
the normalization set to be used for two--port
measurements. Available when the Insertion
Gain/Loss measurement window is
selected.
Trace order button. Rotates the order of the
traces in the display (and displays Trace 2 if
it is not already displayed).
Graph start field. Indicates and changes the
start frequency or distance of the graph.
Graph stop field. Indicates and changes the
stop frequency or distance of the graph.
Operating Basics
YBA250 Antenna and Transmission Line Analyzer User Manual 2- 13
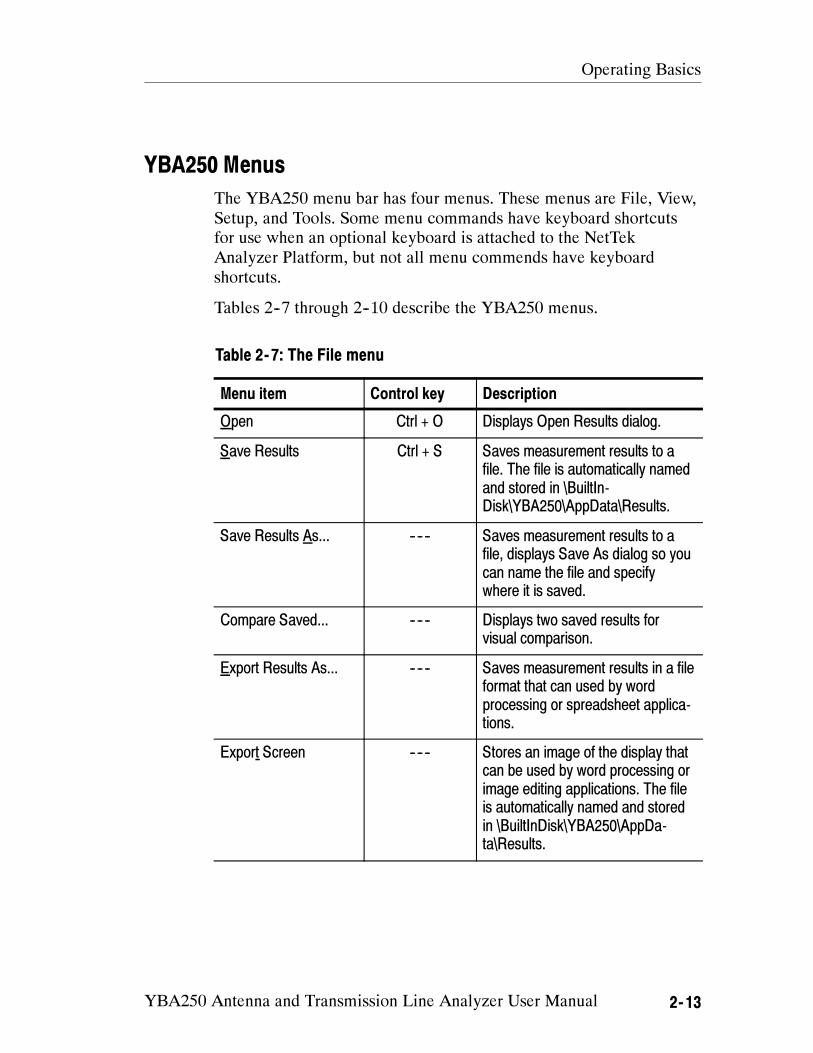
YBA250 Menus
The YBA250 menu bar has four menus. These menus are File, View,
Setup, and Tools. Some menu commands have keyboard shortcuts
for use when an optional keyboard is attached to the NetTek
Analyzer Platform, but not all menu commends have keyboard
shortcuts.
Tables 2--7 through 2--10 describe the YBA250 menus.
Table 2- 7: The File menu
Menu item Control key Description
Open Ctrl + O Displays Open Results dialog.
Save Results Ctrl + S Saves measurement results to a
file. The file is automatically named
and stored in \BuiltIn-
Disk\YBA250\AppData\Results.
Save Results As... ------ Saves measurement results to a
file, displays Save As dialog so you
can name the file and specify
where it is saved.
Compare Saved... ------ Displays two saved results for
visual comparison.
Export Results As... ------ Saves measurement results in a file
format that can used by word
processing or spreadsheet applica-
tions.
Export Screen ------ Stores an image of the display that
can be used by word processing or
image editing applications. The file
is automatically named and stored
in \BuiltInDisk\YBA250\AppDa-
ta\Results.
Operating Basics
2- 14 YBA250 Antenna and Transmission Line Analyzer User Manual
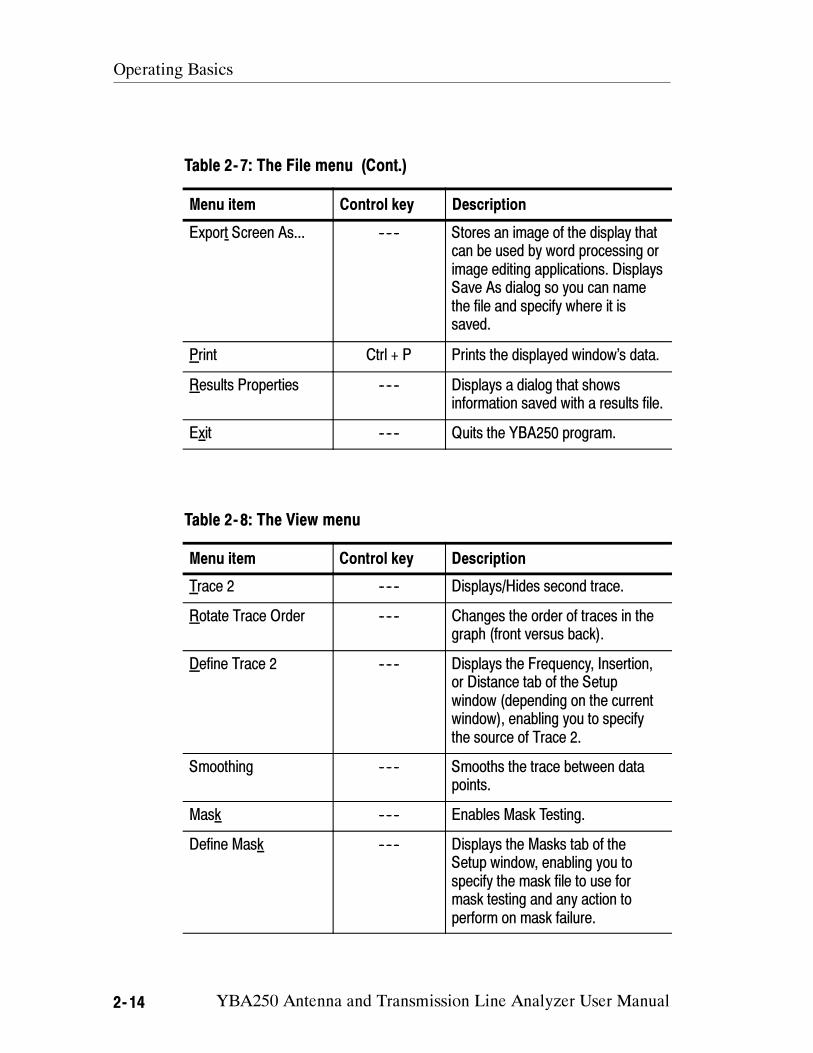
Table 2- 7: The File menu (Cont.)
Menu item DescriptionControl key
Export Screen As... ------ Stores an image of the display that
can be used by word processing or
image editing applications. Displays
Save As dialog so you can name
the file and specify where it is
saved.
Print Ctrl + P Prints the displayed window’s data.
Results Properties ------ Displays a dialog that shows
information saved with a results file.
Exit ------ Quits the YBA250 program.
Table 2- 8: The View menu
Menu item Control key Description
Trace 2 ------ Displays/Hides second trace.
Rotate Trace Order ------ Changes the order of traces in the
graph (front versus back).
Define Trace 2 ------ Displays the Frequency, Insertion,
or Distance tab of the Setup
window (depending on the current
window), enabling you to specify
the source of Trace 2.
Smoothing ------ Smooths the trace between data
points.
Mask ------ Enables Mask Testing.
Define Mask ------ Displays the Masks tab of the
Setup window, enabling you to
specify the mask file to use for
mask testing and any action to
perform on mask failure.
Operating Basics
YBA250 Antenna and Transmission Line Analyzer User Manual 2- 15
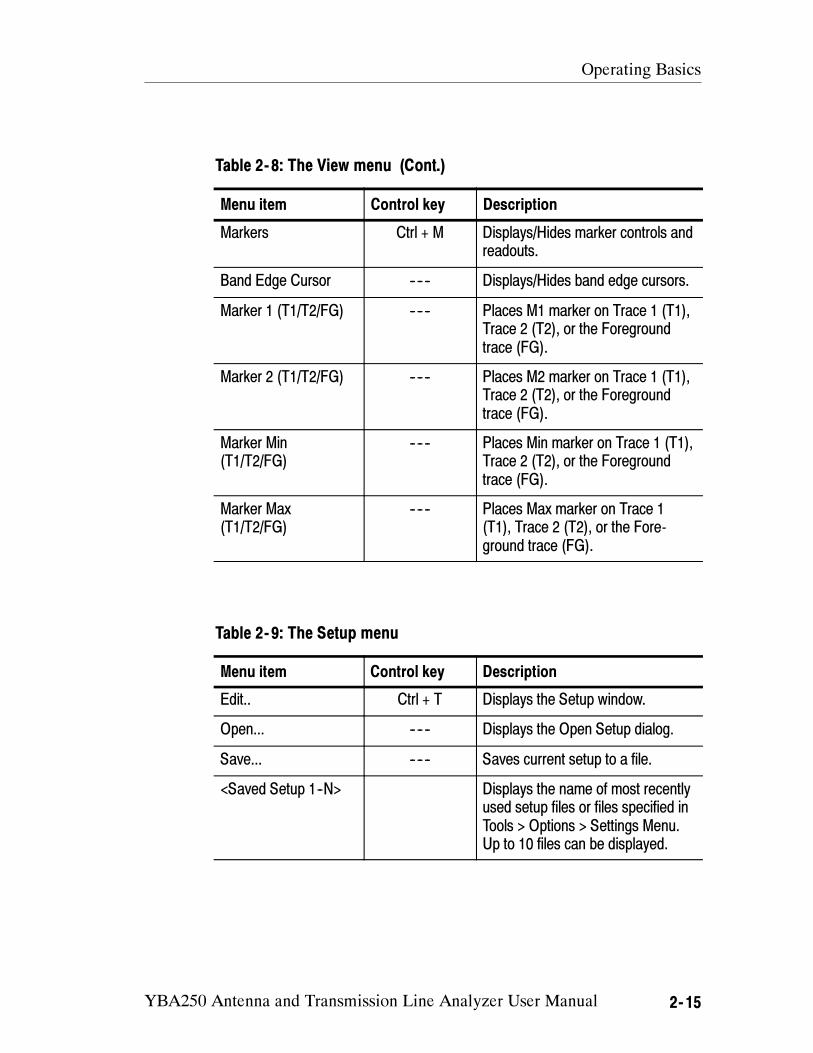
Table 2- 8: The View menu (Cont.)
Menu item DescriptionControl key
Markers Ctrl + M Displays/Hides marker controls and
readouts.
Band Edge Cursor ------ Displays/Hides band edge cursors.
Marker 1 (T1/T2/FG) ------ Places M1 marker on Trace 1 (T1),
Trace 2 (T2), or the Foreground
trace (FG).
Marker 2 (T1/T2/FG) ------ Places M2 marker on Trace 1 (T1),
Trace 2 (T2), or the Foreground
trace (FG).
Marker Min
(T1/T2/FG)
------ Places Min marker on Trace 1 (T1),
Trace 2 (T2), or the Foreground
trace (FG).
Marker Max
(T1/T2/FG)
------ Places Max marker on Trace 1
(T1), Trace 2 (T2), or the Fore-
ground trace (FG).
Table 2- 9: The Setup menu
Menu item Control key Description
Edit.. Ctrl + T Displays the Setup window.
Open... ------ Displays the Open Setup dialog.
Save... ------ Saves current setup to a file.
<Saved Setup 1--N> Displays the name of most recently
used setup files or files specified in
Tools > Options > Settings Menu.
Up to 10 files can be displayed.
Operating Basics
2- 16 YBA250 Antenna and Transmission Line Analyzer User Manual
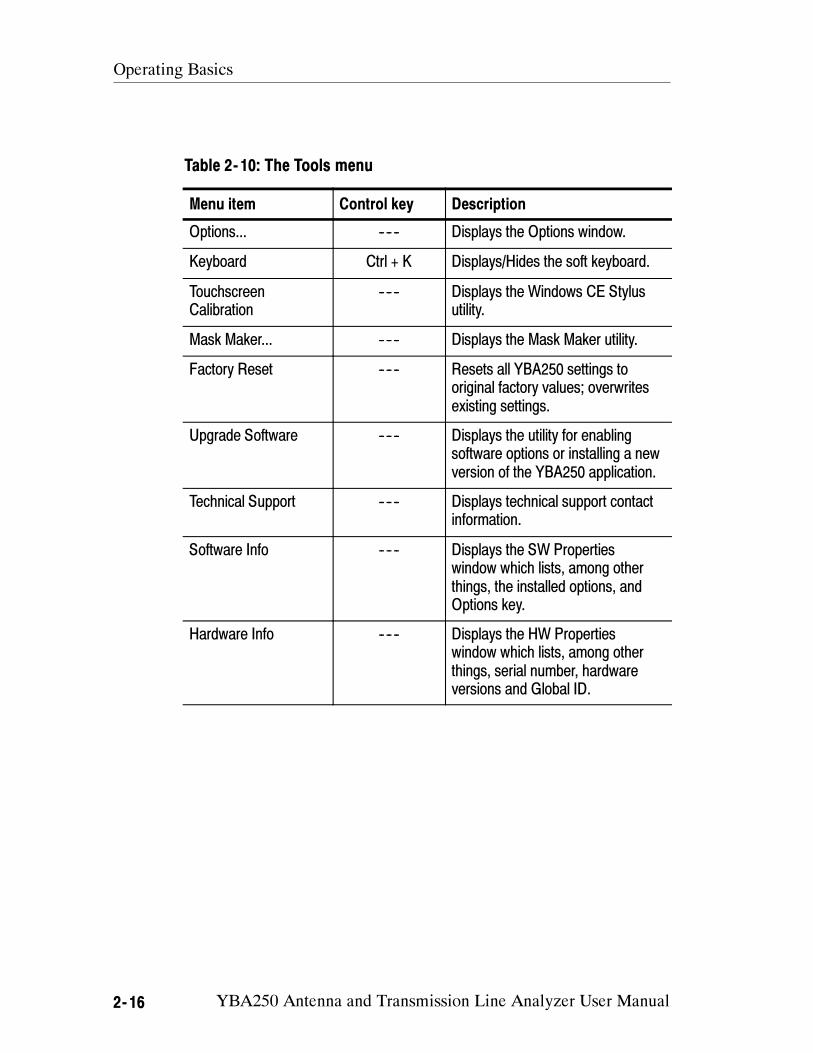
Table 2- 10: The Tools menu
Menu item Control key Description
Options... ------ Displays the Options window.
Keyboard Ctrl + K Displays/Hides the soft keyboard.
Touchscreen
Calibration
------ Displays the Windows CE Stylus
utility.
Mask Maker... ------ Displays the Mask Maker utility.
Factory Reset ------ Resets all YBA250 settings to
original factory values; overwrites
existing settings.
Upgrade Software ------ Displays the utility for enabling
software options or installing a new
version of the YBA250 application.
Technical Support ------ Displays technical support contact
information.
Software Info ------ Displays the SW Properties
window which lists, among other
things, the installed options, and
Options key.
Hardware Info ------ Displays the HW Properties
window which lists, among other
things, serial number, hardware
versions and Global ID.

Operating Basics
YBA250 Antenna and Transmission Line Analyzer User Manual 2- 17
Entering Text
The Input Panel soft keyboard lets you type characters into text
boxes or address fields without using an external keyboard.
To display and use the soft keyboard, tap the icon in the toolbar
status area. Figure 2--4 shows the default keyboard.
Figure 2- 4: The Soft Keyboard
To set soft keyboard properties, or switch between a large keyboard
(default) and a smaller keyboard, select Start > Settings > Control
Panel. Open the Input Panel icon, and then select Options.

Operating Basics
2- 18 YBA250 Antenna and Transmission Line Analyzer User Manual
YBA250 Antenna and Transmission Line Analyzer User Manual 2- 19
Connecting a Signal
This section explains the importance of using precision cables and
connectors, how to connect the YBA250 to an antenna, and how to
calibrate the YBA250.
Use Precision Connectors and Cables
To ensure that your measurements are accurate, always use precision
cables and connectors. Quality of materials and construction is what
separates a precision connector from a standard connector. A
precision connector is manufactured with precisely machined
connection surfaces and tight tolerances. Precision female center
connectors often have six fingers instead of the four fingers common
on less expensive connectors.
Precision cables are specially constructed to have an exact 50--ohm
impedance. However, the only real way to tell if a connector is a
precision one is to know the VSWR and loss specifications over the
frequency range to be measured. While the loss specification is
important to accurate measurements, the VSWR of the cable is
critical.
How cables and connectors affect measurements
Reflection measurements are usually made as a comparison of the
unknown (device being measured) to a known standard. This
standard is assumed to be perfect.
Any non-precision cable can dramatically affect a reflection
measurement. The higher the frequency of measurement, the worse
the degradation will likely be. There are two distinct types of errors
introduced by a cable.
The first error is simply the reflection and loss of the cable itself.
This usually causes a device being tested to seem to have a worse
VSWR or Return Loss than it really does.
Connecting a Signal
2- 20 YBA250 Antenna and Transmission Line Analyzer User Manual
The second type of error is the change in reflection, phase, or loss of
the cable as it is flexed or bent. This causes readings to change as the
jumper is bent (particularly for measurements of antennas with good
VSWR).
Any non-precision connector also affects reflection measurements.
The effect non-precision connectors have is to decrease return loss
by reflecting part of the signal. As with cables, the higher the
frequency of measurement, the worse the degradation will likely be.
Attaching and Removing Precision Connectors
There is a correct way to attach and remove precision connectors.
Precision connectors are exceptionally sensitive to mishandling.
CAUTION. Attaching or removing a precision connector incorrectly
will damage the connector. You must attach and remove precision
connectors using the proper procedure to avoid damaging the
connector.
Precision connectors that have been damaged by improper handing
will not provide dependable measurements.
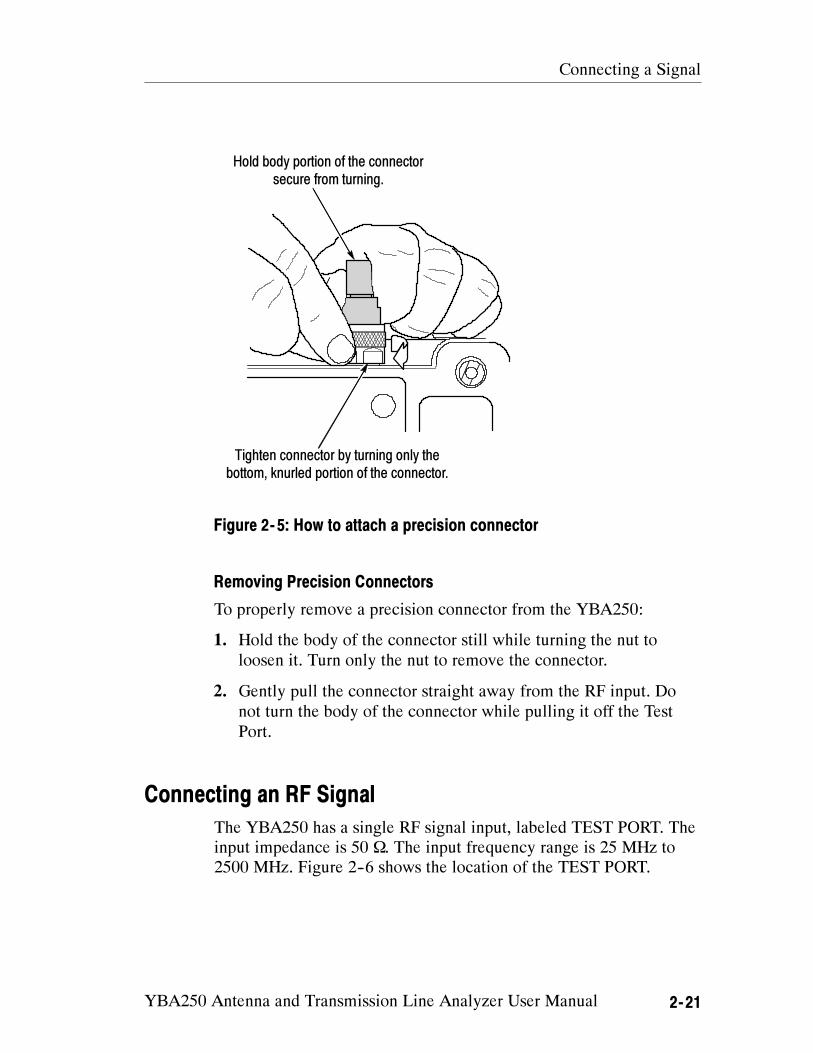
Attaching Precision Connectors
To properly attach a precision connector to the YBA250:
1. Gently push the connector straight onto the Test Port. DO NOT
turn the body of the connector while pushing it onto the Test Port.
2. To secure the connector, hold the body of the connector still
while turning the nut until it is finger-tight. Turn ONLY the nut to
secure the connector. See Figure 2--5.
Connecting a Signal
YBA250 Antenna and Transmission Line Analyzer User Manual 2- 21
Hold body portion of the connector
secure from turning.
Tighten connector by turning only the
bottom, knurled portion of the connector.
Figure 2- 5: How to attach a precision connector
Removing Precision Connectors
To properly remove a precision connector from the YBA250:
1. Hold the body of the connector still while turning the nut to
loosen it. Turn only the nut to remove the connector.
2. Gently pull the connector straight away from the RF input. Do
not turn the body of the connector while pulling it off the Test
Port.
Connecting an RF Signal
The YBA250 has a single RF signal input, labeled TEST PORT. The
input impedance is 50 Ω. The input frequency range is 25 MHz to
2500 MHz. Figure 2--6 shows the location of the TEST PORT.

Connecting a Signal
2- 22 YBA250 Antenna and Transmission Line Analyzer User Manual
Figure 2- 6: TEST PORT location
To connect an antenna to the YBA250:
WARNING. To prevent personal injury from the effects of lightning, do
not connect this product to any source that might be subject to the
effects of lightning. Use your own good judgement and common
sense. You must protect yourself from the effects of lightning.
1. Following your standard practice, disconnect the antenna to be
tested from the transmitter or receiver.
2. Discharge the antenna (short the center conductor to the cable
ground shield).
3. Connect one end of a precision cable to the antenna.
4. Connect the other end of the precision cable to the TEST PORT
on the YBA250.

YBA250 Antenna and Transmission Line Analyzer User Manual 2- 23
Measurement Overview
YBA250 measurements are divided into two categories; one--port
and two-port measurements.
One-Port Measurements
One-port measurements, also known as reflection measurements, use
a single port on the YBA250 module to measure return loss, VSWR,
cable loss, and distance to fault (DTF). One-port measurements
connect one end of a signal path to the YBA250 module, with the
other end of the signal path connected to the device under test (such
as an antenna).
One-port insertion loss is best for measuring losses in signal paths
that contain passive, low-loss components such as cables and
attenuators. The one-port insertion loss measurement is not as
accurate as the two-port insertion loss measurement, but does not
require access to both ends of a signal path.
Two-Port Measurements
Two-port measurements, also known as transmission measurements,
provide insertion gain and loss measurements such as filter response
(loss) versus frequency and tower-mounted amplifier (TMA) gain
versus frequency. Both a YBA250 and YBT250 module must be
installed on the NetTek Analyzer to perform two-port Insertion
Gain/Loss measurements. The YBA250 module injects a signal into
the device or system under test, and the YBT250 module receives
and measures the resultant signal.
Measurement Overview
2- 24 YBA250 Antenna and Transmission Line Analyzer User Manual
Two--port insertion gain and loss measurements are best for
measuring signal paths that contain active, wide--dynamic--range
components, such as circulators, amplifiers, and directional couplers.
Two--port loss measurements are more accurate than one--port
measurements. Two--port measurements connect both ends of a
signal path to the YBA250 and YBT250 modules to measure
insertion gain and insertion loss.
YBA250 Antenna and Transmission Line Analyzer User Manual 2- 25
Calibration and Normalization
To get the most accurate measurements, calibrate the YBA250
before you begin to make measurements at a site. One--port
measurements (return/cable loss, VSWR, and DTF) require a
calibration process (described below). Two--port measurements
(insertion gain/loss) require a normalization process (starting on
page 2--40).
Calibrating the YBA250
To get the most accurate one--port measurements, calibrate the
YBA250 each time before taking measurements at a site.
There are two types of one--port measurement calibration; Factory
and User. The Factory calibration is a calibration data set generated
during manufacture and saved in non--volatile memory that can be
recalled at any time. The Factory calibration provides good
measurement accuracy without requiring the use of a calibration kit.
The User calibration is a calibration data set generated using the
YBAC1 Calibration Kit (or an equivalent calibration kit) with the
instrument, and saved in non--volatile memory that can be recalled at
any time. Using a User calibration data set compensates for changes
in instrument temperature, power level and component aging, to
ensure the most accurate measurements.
The YBAC1 is a set of three high--precision measurement standards.
You connect each of the measurement standards in the kit to the
YBA250 Test Port and run a calibration procedure that normalizes
measurements to the accuracy of the calibration kit standards.
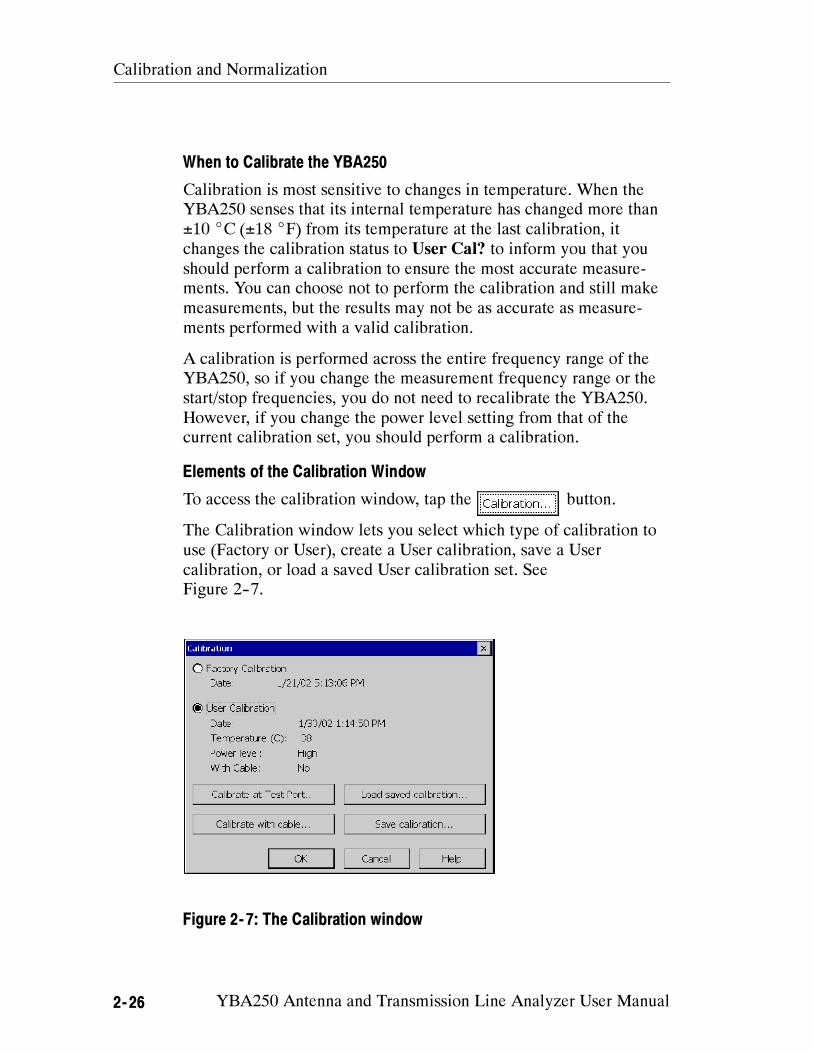
Calibration and Normalization
2- 26 YBA250 Antenna and Transmission Line Analyzer User Manual
When to Calibrate the YBA250
Calibration is most sensitive to changes in temperature. When the
YBA250 senses that its internal temperature has changed more than
±10 C (±18 F) from its temperature at the last calibration, it
changes the calibration status to User Cal? to inform you that you
should perform a calibration to ensure the most accurate measure-
ments. You can choose not to perform the calibration and still make
measurements, but the results may not be as accurate as measure-
ments performed with a valid calibration.
A calibration is performed across the entire frequency range of the
YBA250, so if you change the measurement frequency range or the
start/stop frequencies, you do not need to recalibrate the YBA250.
However, if you change the power level setting from that of the
current calibration set, you should perform a calibration.
Elements of the Calibration Window
To access the calibration window, tap the button.
The Calibration window lets you select which type of calibration to
use (Factory or User), create a User calibration, save a User
calibration, or load a saved User calibration set. See
Figure 2--7.
Figure 2- 7: The Calibration window
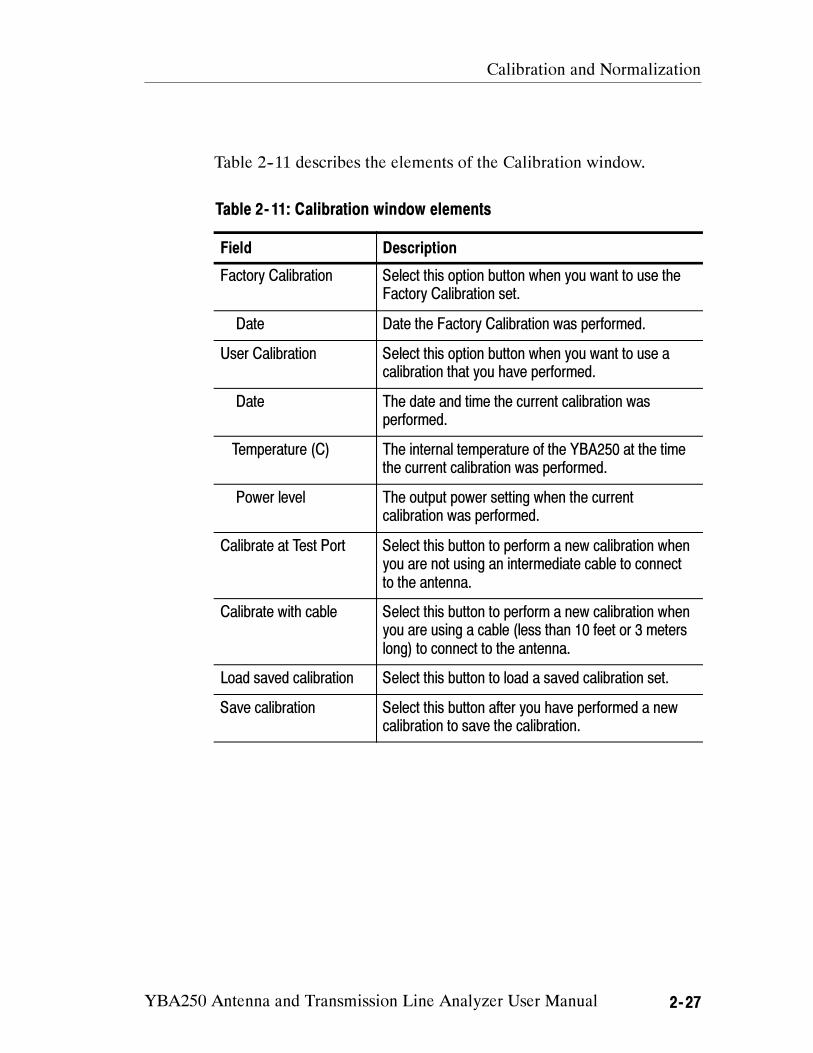
Calibration and Normalization
YBA250 Antenna and Transmission Line Analyzer User Manual 2- 27
Table 2--11 describes the elements of the Calibration window.
Table 2- 11: Calibration window elements
Field Description
Factory Calibration Select this option button when you want to use the
Factory Calibration set.
Date Date the Factory Calibration was performed.
User Calibration Select this option button when you want to use a
calibration that you have performed.
Date The date and time the current calibration was
performed.
Temperature (C) The internal temperature of the YBA250 at the time
the current calibration was performed.
Power level The output power setting when the current
calibration was performed.
Calibrate at Test Port Select this button to perform a new calibration when
you are not using an intermediate cable to connect
to the antenna.
Calibrate with cable Select this button to perform a new calibration when
you are using a cable (less than 10 feet or 3 meters
long) to connect to the antenna.
Load saved calibration Select this button to load a saved calibration set.
Save calibration Select this button after you have performed a new
calibration to save the calibration.
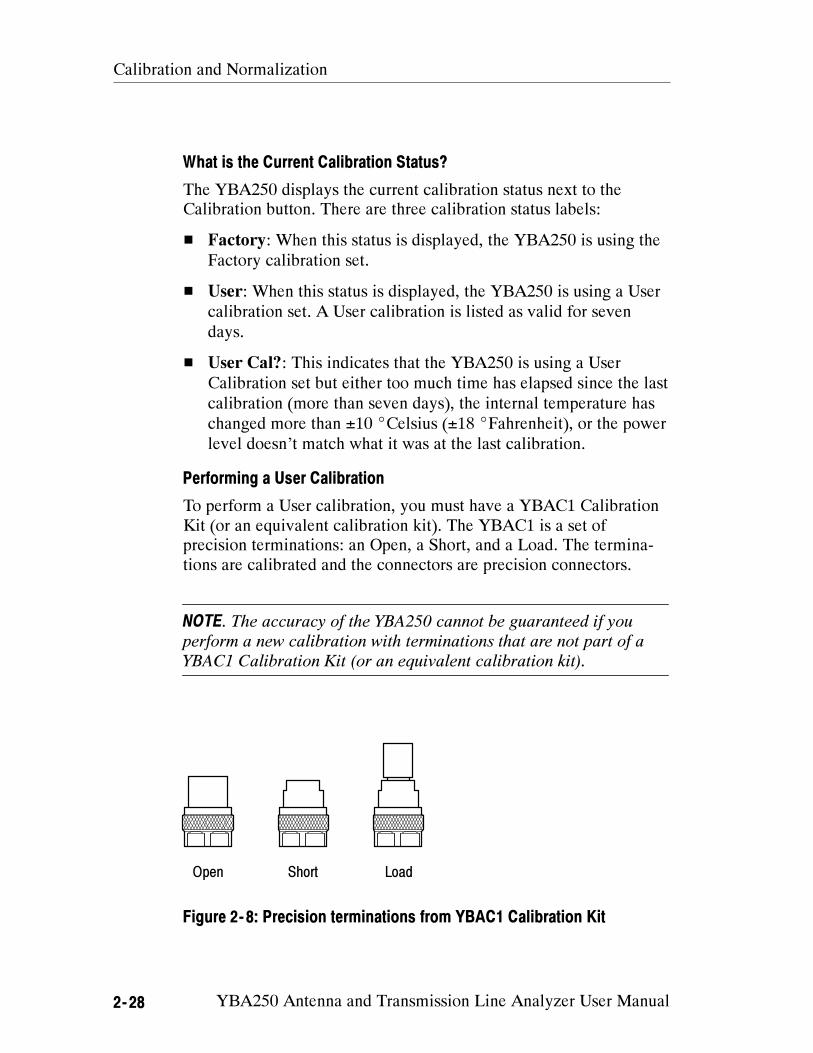
Calibration and Normalization
2- 28 YBA250 Antenna and Transmission Line Analyzer User Manual
What is the Current Calibration Status?
The YBA250 displays the current calibration status next to the
Calibration button. There are three calibration status labels:
Factory: When this status is displayed, the YBA250 is using the
Factory calibration set.
User: When this status is displayed, the YBA250 is using a User
calibration set. A User calibration is listed as valid for seven
days.
User Cal?: This indicates that the YBA250 is using a User
Calibration set but either too much time has elapsed since the last
calibration (more than seven days), the internal temperature has
changed more than ±10 Celsius (±18 Fahrenheit), or the power
level doesn’t match what it was at the last calibration.
Performing a User Calibration
To perform a User calibration, you must have a YBAC1 Calibration
Kit (or an equivalent calibration kit). The YBAC1 is a set of
precision terminations: an Open, a Short, and a Load. The termina-
tions are calibrated and the connectors are precision connectors.
NOTE. The accuracy of the YBA250 cannot be guaranteed if you
perform a new calibration with terminations that are not part of a
YBAC1 Calibration Kit (or an equivalent calibration kit).
Open Short Load
Figure 2- 8: Precision terminations from YBAC1 Calibration Kit
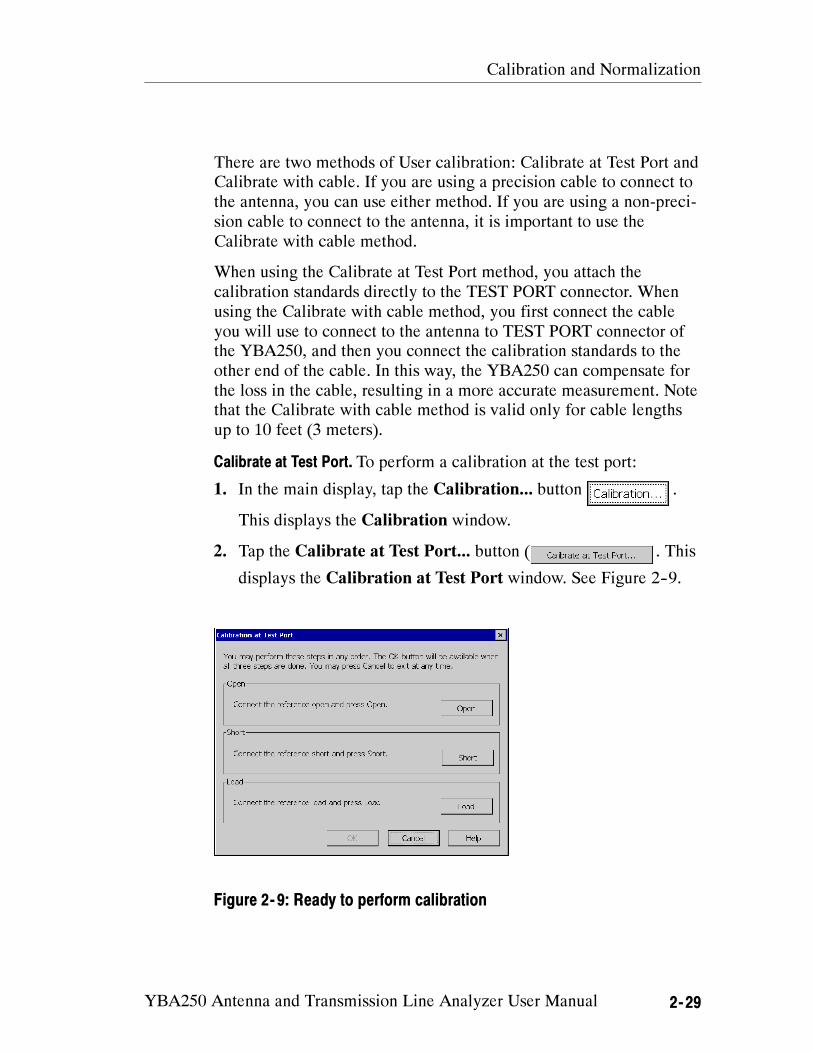
Calibration and Normalization
YBA250 Antenna and Transmission Line Analyzer User Manual 2- 29
There are two methods of User calibration: Calibrate at Test Port and
Calibrate with cable. If you are using a precision cable to connect to
the antenna, you can use either method. If you are using a non-preci-
sion cable to connect to the antenna, it is important to use the
Calibrate with cable method.
When using the Calibrate at Test Port method, you attach the
calibration standards directly to the TEST PORT connector. When
using the Calibrate with cable method, you first connect the cable
you will use to connect to the antenna to TEST PORT connector of
the YBA250, and then you connect the calibration standards to the
other end of the cable. In this way, the YBA250 can compensate for
the loss in the cable, resulting in a more accurate measurement. Note
that the Calibrate with cable method is valid only for cable lengths
up to 10 feet (3 meters).
Calibrate at Test Port. To perform a calibration at the test port:
1. In the main display, tap the Calibration... button .
This displays the Calibration window.
2. Tap the Calibrate at Test Port... button ( . This
displays the Calibration at Test Port window. See Figure 2--9.
Figure 2- 9: Ready to perform calibration
Calibration and Normalization
2- 30 YBA250 Antenna and Transmission Line Analyzer User Manual
3. Carefully attach the OPEN calibration standard to the TEST
PORT using the procedure described on page 2--20.
You can perform steps 4 through 8 in any order. Note that the OK
button is not selectable until all three steps have been completed.
If you accidently tap the wrong button (for example, you tap
Open while you have the Short calibration standard connected),
just repeat the step. To cancel the calibration, tap Cancel at any
time.
4. Tap the Open button in the Calibration at Test Port window.
When the calibration is completed, Done appears above the Open
button.
5. Carefully replace the OPEN calibration standard with the SHORT
calibration standard.
6. Tap the Short button in the Calibration at Test Port window.
When the calibration is completed, Done appears above the Short
button.
7. Carefully replace the SHORT calibration standard with the
LOAD calibration standard.
8. Tap the Load button. When the calibration is completed, Done
appears above the Load button.
9. Carefully remove the LOAD calibration standard from the TEST
PORT.
10.Once calibration has been completed for all three standards, tap
the OK button. The OK button is not selectable until all three
calibration standards have been marked as done. See Fig-
ure 2--10.

Calibration and Normalization
YBA250 Antenna and Transmission Line Analyzer User Manual 2- 31
Figure 2- 10: Calibration window after calibration is done
This loads new calibration settings that remain valid until the
temperature of the YBA250 changes by more than ±10 C (±18 F)
or more than seven days have elapsed since the calibration was
performed.
Calibrate with Cable. To perform a calibration with a cable that is
10 feet (3 meters) or less in length:
1. In the main display, tap the Calibration... button .
This displays the Calibration window.
2. Tap the Calibrate with cable... button . This
displays the Calibration with Cable window. See Figure 2--11.
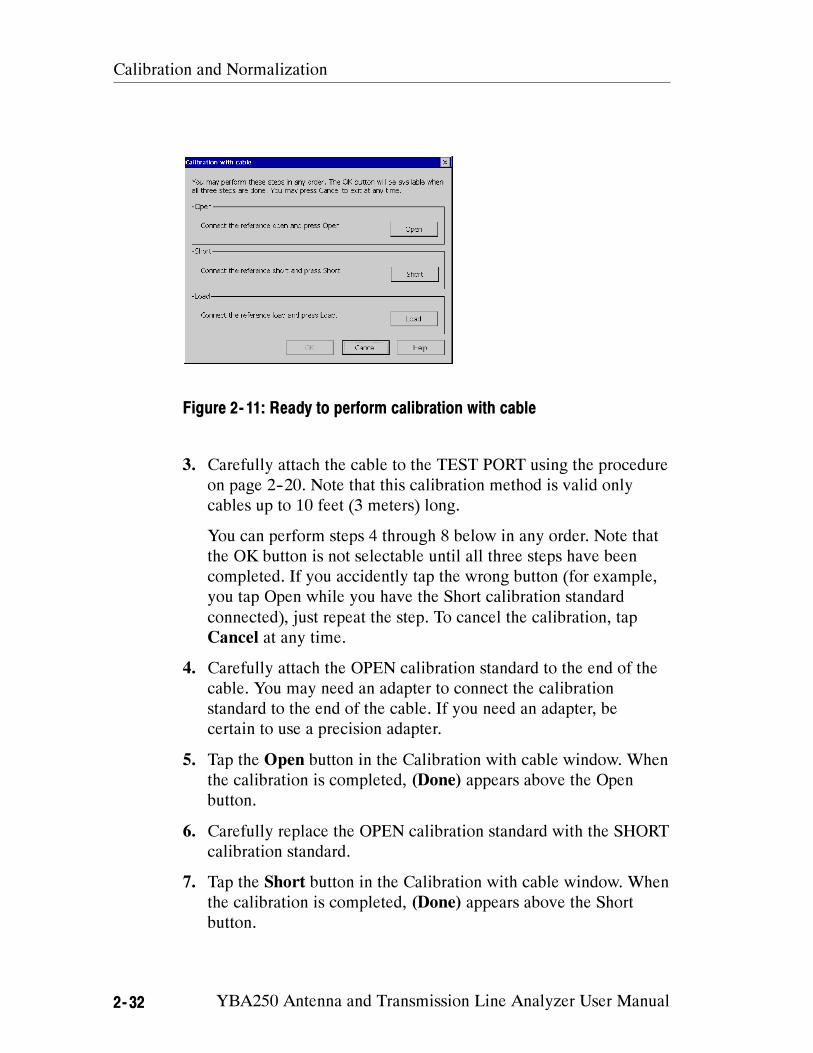
Calibration and Normalization
2- 32 YBA250 Antenna and Transmission Line Analyzer User Manual
Figure 2- 11: Ready to perform calibration with cable
3. Carefully attach the cable to the TEST PORT using the procedure
on page 2--20. Note that this calibration method is valid only
cables up to 10 feet (3 meters) long.
You can perform steps 4 through 8 below in any order. Note that
the OK button is not selectable until all three steps have been
completed. If you accidently tap the wrong button (for example,
you tap Open while you have the Short calibration standard
connected), just repeat the step. To cancel the calibration, tap
Cancel at any time.
4. Carefully attach the OPEN calibration standard to the end of the
cable. You may need an adapter to connect the calibration
standard to the end of the cable. If you need an adapter, be
certain to use a precision adapter.
5. Tap the Open button in the Calibration with cable window. When
the calibration is completed, (Done) appears above the Open
button.
6. Carefully replace the OPEN calibration standard with the SHORT
calibration standard.
7. Tap the Short button in the Calibration with cable window. When
the calibration is completed, (Done) appears above the Short
button.
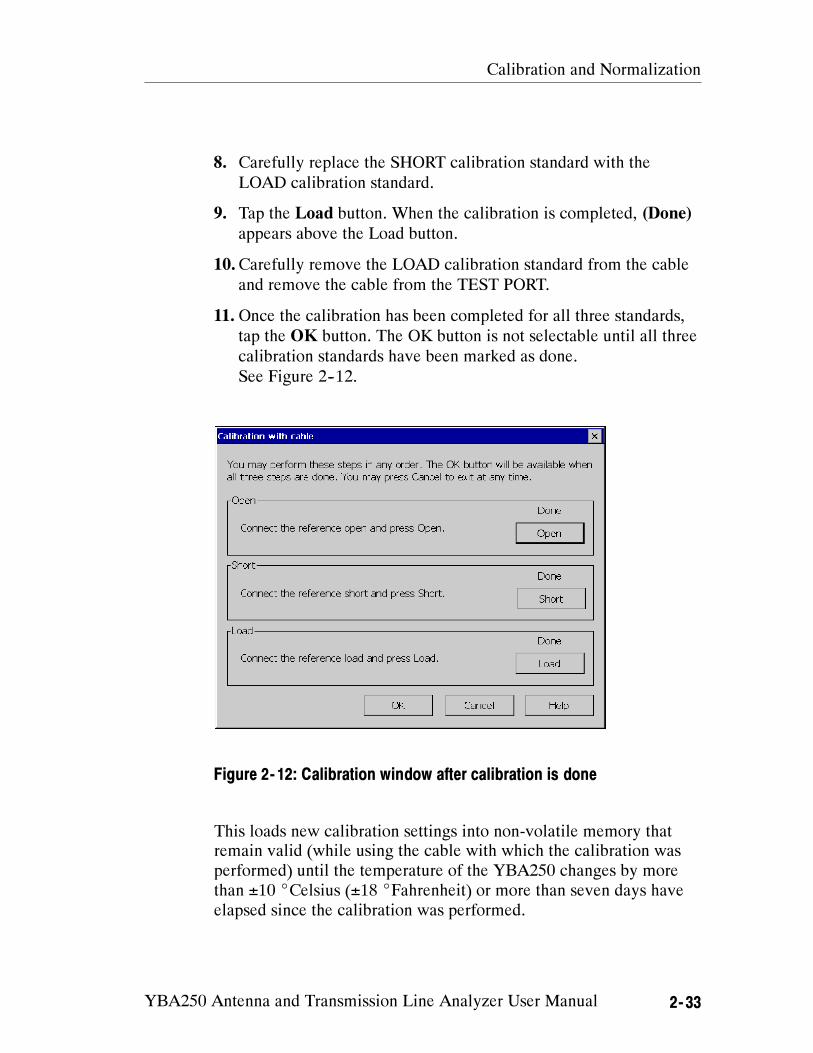
Calibration and Normalization
YBA250 Antenna and Transmission Line Analyzer User Manual 2- 33
8. Carefully replace the SHORT calibration standard with the
LOAD calibration standard.
9. Tap the Load button. When the calibration is completed, (Done)
appears above the Load button.
10.Carefully remove the LOAD calibration standard from the cable
and remove the cable from the TEST PORT.
11. Once the calibration has been completed for all three standards,
tap the OK button. The OK button is not selectable until all three
calibration standards have been marked as done.
See Figure 2--12.
Figure 2- 12: Calibration window after calibration is done
This loads new calibration settings into non-volatile memory that
remain valid (while using the cable with which the calibration was
performed) until the temperature of the YBA250 changes by more
than ±10 Celsius (±18 Fahrenheit) or more than seven days have
elapsed since the calibration was performed.
Calibration and Normalization
2- 34 YBA250 Antenna and Transmission Line Analyzer User Manual
Saving User Calibration Data Sets
User Calibration data sets can be saved in non-volatile memory so
that they can be loaded at another time. One reason to do this is so
that you do not have to carry a calibration kit with you in the field.
To save calibration sets for later recall:
1. Perform a new calibration as described starting on page 2--28.
2. Tap the Save calibration... button in the Calibration window.
3. Name the calibration set (for example, “Nehalem Mountain” to
denote the location where the calibration was performed) and tap
OK.
This saves the calibration set in non-volatile memory so that it can
be loaded at another time. Calibration data sets are stored within the
module, so that if the YBA250 module is moved to another NetTek
Analyzer Platform the calibration data set stays with the module.
Loading a Saved Calibration Set
If you are in the field and need to perform a calibration but do not
have the YBAC1 Calibration Kit with you, you can load a saved
calibration set.
To load a saved calibration set:
1. Tap the Calibration... button . This displays the
Calibration window.
2. To load a saved calibration set, tap the Load saved calibration...
button. This displays the Calibration Browser window. See
Figure 2--13.
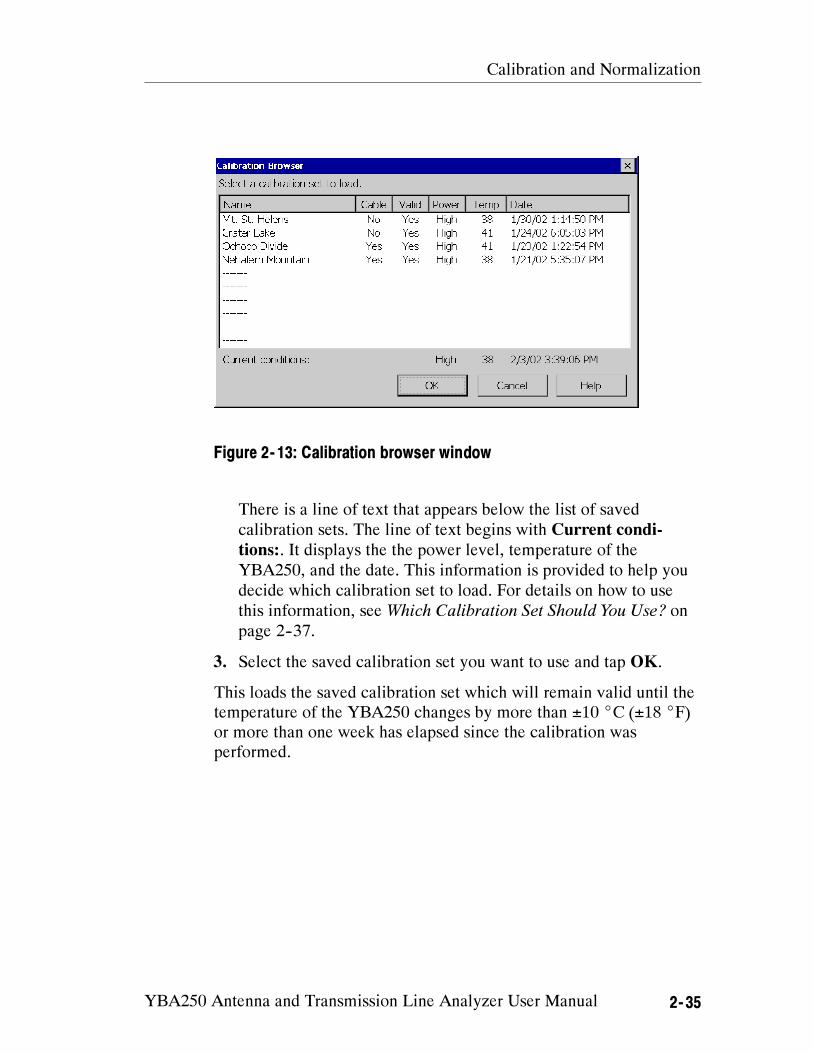
Calibration and Normalization
YBA250 Antenna and Transmission Line Analyzer User Manual 2- 35
Figure 2- 13: Calibration browser window
There is a line of text that appears below the list of saved
calibration sets. The line of text begins with Current condi-
tions:. It displays the the power level, temperature of the
YBA250, and the date. This information is provided to help you
decide which calibration set to load. For details on how to use
this information, see Which Calibration Set Should You Use? on
page 2--37.
3. Select the saved calibration set you want to use and tap OK.
This loads the saved calibration set which will remain valid until the
temperature of the YBA250 changes by more than ±10 C (±18 F)
or more than one week has elapsed since the calibration was
performed.
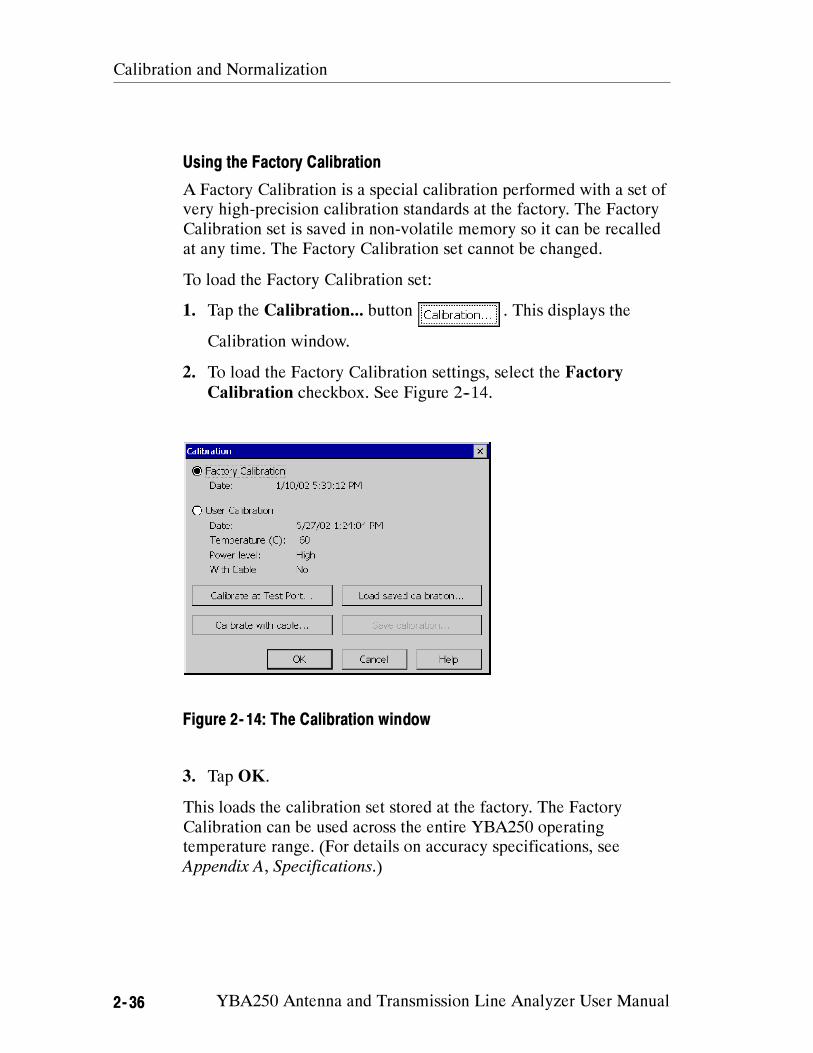
Calibration and Normalization
2- 36 YBA250 Antenna and Transmission Line Analyzer User Manual
Using the Factory Calibration
A Factory Calibration is a special calibration performed with a set of
very high-precision calibration standards at the factory. The Factory
Calibration set is saved in non-volatile memory so it can be recalled
at any time. The Factory Calibration set cannot be changed.
To load the Factory Calibration set:
1. Tap the Calibration... button . This displays the
Calibration window.
2. To load the Factory Calibration settings, select the Factory
Calibration checkbox. See Figure 2--14.
Figure 2- 14: The Calibration window
3. Tap OK.
This loads the calibration set stored at the factory. The Factory
Calibration can be used across the entire YBA250 operating
temperature range. (For details on accuracy specifications, see
Appendix A, Specifications.)
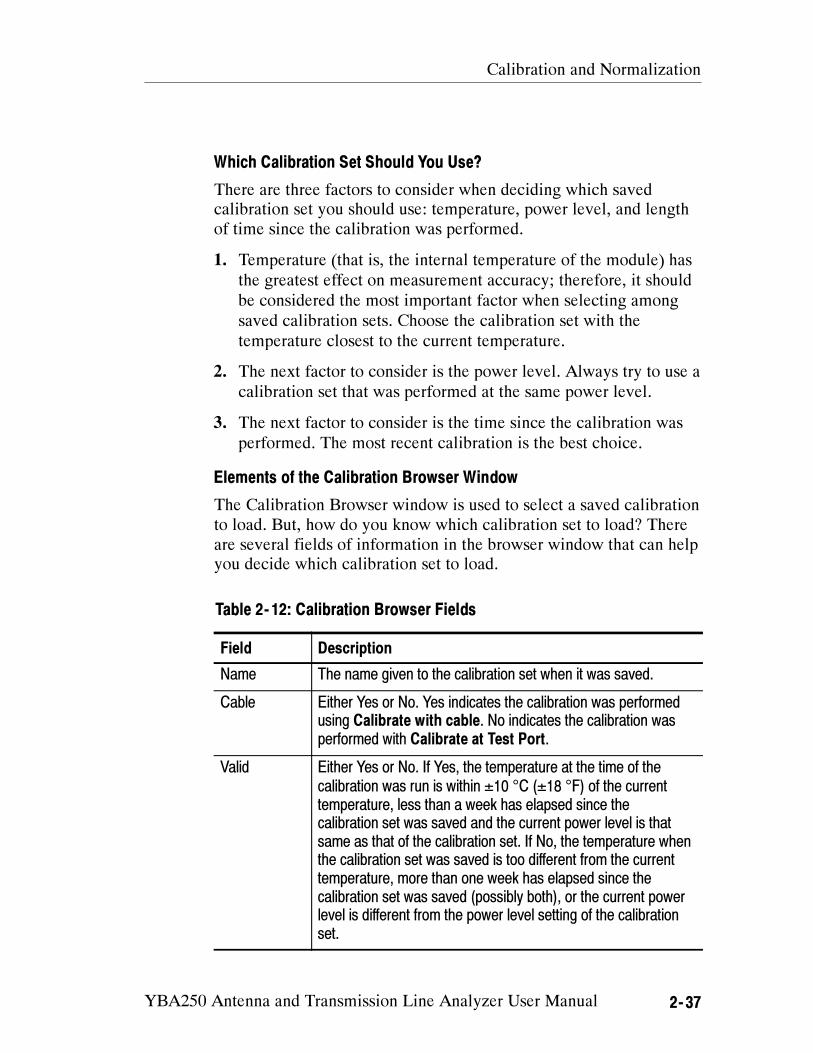
Calibration and Normalization
YBA250 Antenna and Transmission Line Analyzer User Manual 2- 37
Which Calibration Set Should You Use?
There are three factors to consider when deciding which saved
calibration set you should use: temperature, power level, and length
of time since the calibration was performed.
1. Temperature (that is, the internal temperature of the module) has
the greatest effect on measurement accuracy; therefore, it should
be considered the most important factor when selecting among
saved calibration sets. Choose the calibration set with the
temperature closest to the current temperature.
2. The next factor to consider is the power level. Always try to use a
calibration set that was performed at the same power level.
3. The next factor to consider is the time since the calibration was
performed. The most recent calibration is the best choice.
Elements of the Calibration Browser Window
The Calibration Browser window is used to select a saved calibration
to load. But, how do you know which calibration set to load? There
are several fields of information in the browser window that can help
you decide which calibration set to load.
Table 2- 12: Calibration Browser Fields
Field Description
Name The name given to the calibration set when it was saved.
Cable Either Yes or No. Yes indicates the calibration was performed
using Calibrate with cable. No indicates the calibration was
performed with Calibrate at Test Port.
Valid Either Yes or No. If Yes, the temperature at the time of the
calibration was run is within ±10 °C (±18 °F) of the current
temperature, less than a week has elapsed since the
calibration set was saved and the current power level is that
same as that of the calibration set. If No, the temperature when
the calibration set was saved is too different from the current
temperature, more than one week has elapsed since the
calibration set was saved (possibly both), or the current power
level is different from the power level setting of the calibration
set.

Calibration and Normalization
2- 38 YBA250 Antenna and Transmission Line Analyzer User Manual
Table 2- 12: Calibration Browser Fields (Cont.)
Field Description
Power Either High or Low. The output power setting when the
calibration was performed.
Temp The internal temperature of the YBA250 at the time the
calibration was performed.
Date The date the calibration was performed.
Current
Conditions
A line below the list of saved calibration sets that lists current
conditions:
Output level: Either High or Low
Temperature: Current temperature in degrees Celsius.
Date: The current date set on the NetTek Analyzer Platform.
Time: The time on the NetTek Analyzer Platform when the
Calibration Browser was opened.
Calibration Guidelines
Calibration is most sensitive to changes in temperature. When the
YBA250 senses its internal temperature has changed more than
±10 C (±18 F) from its temperature at the last calibration, it
changes the calibration status to User Cal? to inform you that you
should perform a calibration to ensure the most accurate
measurements.
You can choose not to perform the calibration and still make
measurements, but the results may not be as be accurate as
measurements performed with a valid calibration.
A calibration is performed across the entire frequency range of
the YBA250, so if you change the measurement frequency range
or the start/stop frequencies, you do not need to recalibrate the
YBA250.
Calibration and Normalization
YBA250 Antenna and Transmission Line Analyzer User Manual 2- 39
If you change the power level setting from that of the current
calibration set, you should perform a calibration. See General
Tab for information on changing the power level.
To achieve the most accurate results, always perform a User
calibration before you begin taking measurements at a site.
However, if this isn’t possible (for example, you don’t have a
YBAC1 Calibration Kit or an equivalent calibration kit with
you), you can load saved user calibration sets or use the Factory
Calibration. Factory calibration is always available and provides
reasonably accurate results.
If you have saved calibration sets, load the calibration set that
most closely matches the current conditions. Saved calibration
sets will provide more accurate results than a Factory calibration
set or the User Cal? status.

Calibration and Normalization
2- 40 YBA250 Antenna and Transmission Line Analyzer User Manual
Normalizing the YBA250
Normalization generates measurement correction data to compensate
for signal source variations, test cable and attenuator losses, and
cable/attenuator reflections, for two--port measurements. Normaliza-
tion data (Default or User) must be loaded before you can perform
accurate two--port insertion gain or loss measurements.
There are two types of normalization: Default and User. The Default
normalization data set covers the entire YBA250 frequency range
(30 MHz to 2500 MHz) and all signal source levels (+3dBm to
--60dBm). This provides a general baseline measurement reference
across all frequencies and signal levels. Default normalization
provides good measurement accuracy across all frequencies any time
a User normalization is not available or is not valid.
The User normalization data set covers a specified frequency range
and output power level, based on the instrument settings when the
User normalization data was created. A User normalization provides
the most accurate measurements.
Both Default and User normalizations generate correction data using
precision cables and attenuators connected between the YBA250 and
the YBT250 modules. The normalization data, plus instrument state
information (such as date/time and internal module temperature), is
saved to non--volatile memory.
The Normalization Window Elements
The Normalization window is where you select which type of
normalization to use (Default or User), create a new Default or User
normalization, save normalization data to a file, or load a saved
normalization set.
To display the two--port Normalization window, tap the Normaliza-
tion... button while in the Insertion Gain/Loss window. Figure 2--15
shows the Normalization window. Table 2--13 describes the contents
of the Normalization window.
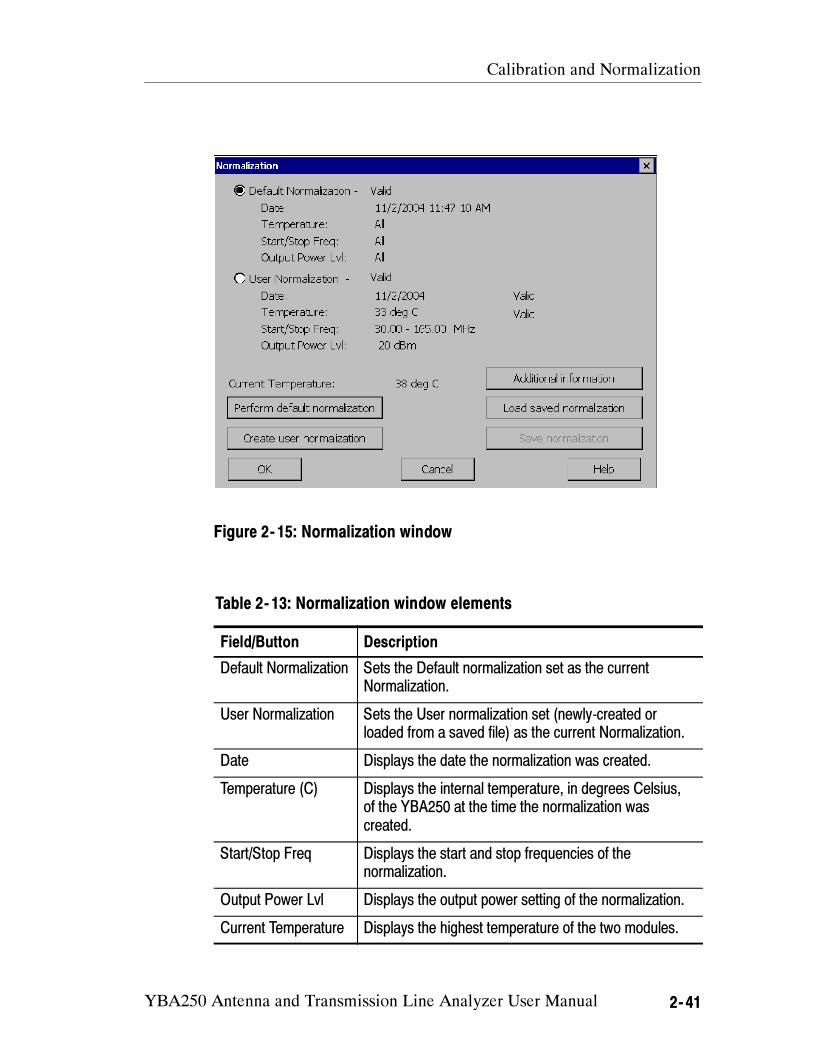
Calibration and Normalization
YBA250 Antenna and Transmission Line Analyzer User Manual 2- 41
Figure 2- 15: Normalization window
Table 2- 13: Normalization window elements
Field/Button Description
Default Normalization Sets the Default normalization set as the current
Normalization.
User Normalization Sets the User normalization set (newly-created or
loaded from a saved file) as the current Normalization.
Date Displays the date the normalization was created.
Temperature (C) Displays the internal temperature, in degrees Celsius,
of the YBA250 at the time the normalization was
created.
Start/Stop Freq Displays the start and stop frequencies of the
normalization.
Output Power Lvl Displays the output power setting of the normalization.
Current Temperature Displays the highest temperature of the two modules.
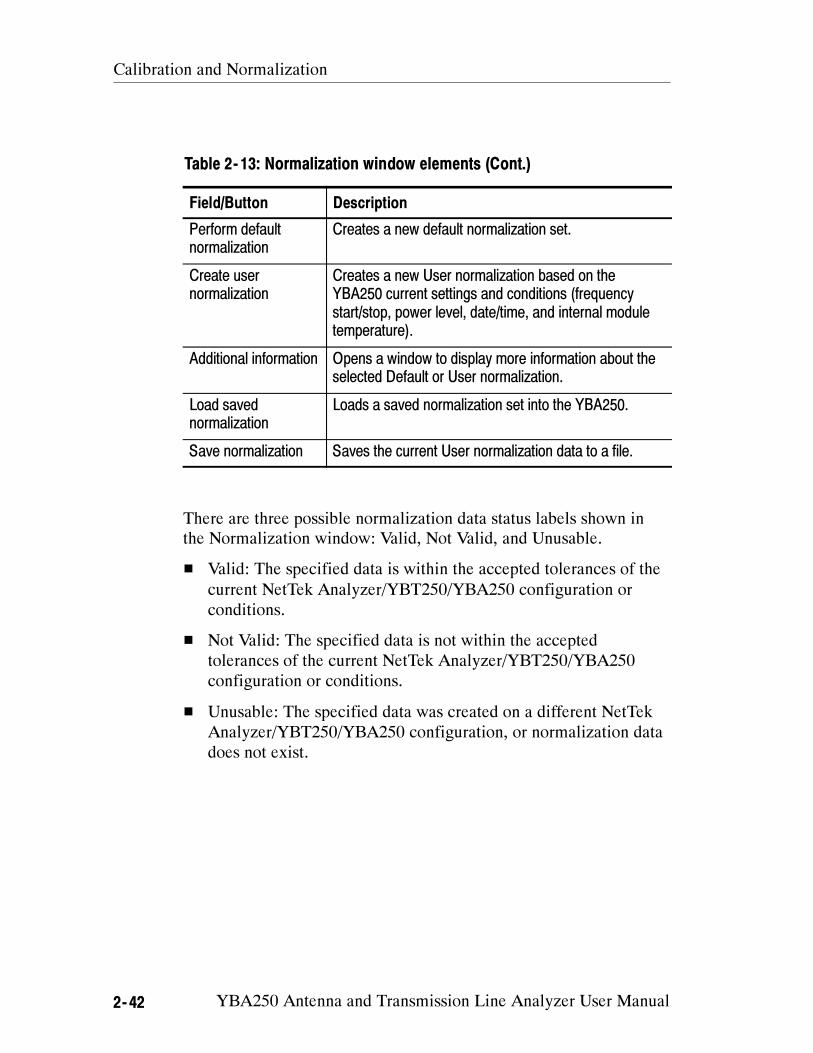
Calibration and Normalization
2- 42 YBA250 Antenna and Transmission Line Analyzer User Manual
Table 2- 13: Normalization window elements (Cont.)
Field/Button Description
Perform default
normalization
Creates a new default normalization set.
Create user
normalization
Creates a new User normalization based on the
YBA250 current settings and conditions (frequency
start/stop, power level, date/time, and internal module
temperature).
Additional information Opens a window to display more information about the
selected Default or User normalization.
Load saved
normalization
Loads a saved normalization set into the YBA250.
Save normalization Saves the current User normalization data to a file.
There are three possible normalization data status labels shown in
the Normalization window: Valid, Not Valid, and Unusable.
Valid: The specified data is within the accepted tolerances of the
current NetTek Analyzer/YBT250/YBA250 configuration or
conditions.
Not Valid: The specified data is not within the accepted
tolerances of the current NetTek Analyzer/YBT250/YBA250
configuration or conditions.
Unusable: The specified data was created on a different NetTek
Analyzer/YBT250/YBA250 configuration, or normalization data
does not exist.
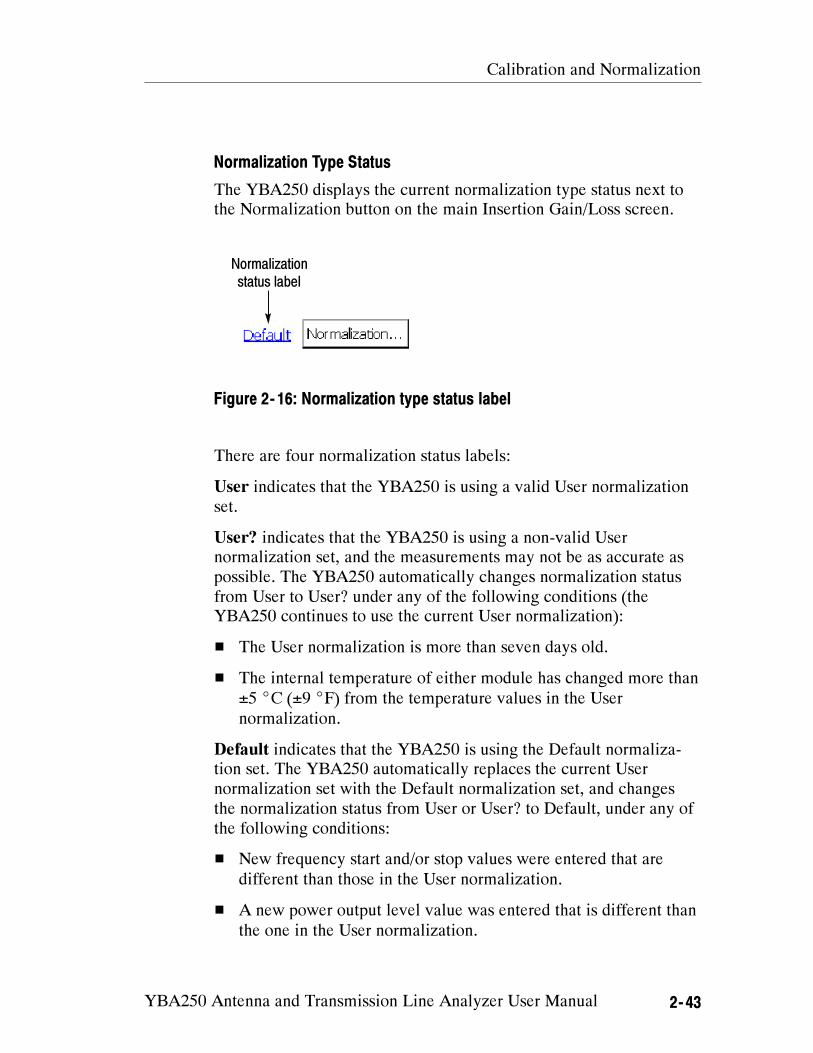
Calibration and Normalization
YBA250 Antenna and Transmission Line Analyzer User Manual 2- 43
Normalization Type Status
The YBA250 displays the current normalization type status next to
the Normalization button on the main Insertion Gain/Loss screen.
Normalization
status label
Figure 2- 16: Normalization type status label
There are four normalization status labels:
User indicates that the YBA250 is using a valid User normalization
set.
User? indicates that the YBA250 is using a non-valid User
normalization set, and the measurements may not be as accurate as
possible. The YBA250 automatically changes normalization status
from User to User? under any of the following conditions (the
YBA250 continues to use the current User normalization):
The User normalization is more than seven days old.
The internal temperature of either module has changed more than
±5 C (±9 F) from the temperature values in the User
normalization.
Default indicates that the YBA250 is using the Default normaliza-
tion set. The YBA250 automatically replaces the current User
normalization set with the Default normalization set, and changes
the normalization status from User or User? to Default, under any of
the following conditions:
New frequency start and/or stop values were entered that are
different than those in the User normalization.
A new power output level value was entered that is different than
the one in the User normalization.
Calibration and Normalization
2- 44 YBA250 Antenna and Transmission Line Analyzer User Manual
UnNormalized indicates one of the following:
Neither a User or Default normalization set is loaded.
Either or both YBA250 or YBT250 modules were replaced with
a different serial numbered module.
The YBA250 module determines that the available Default
normalization is not usable with the current module configura-
tion.
NOTE. The Default normalization is always usable, when used with
the same YBA250/YBT250 module combination used to create the
default normalization. The Default normalization is also usable when
the creation date is older than seven days or the module temperature
exceeds the above limits.
Creating a Default Normalization
To create a Default normalization, do the following:
1. Tap the Insertion Gain/Loss button to display the Insertion
Gain/Loss screen.
2. Tap the Normalization... button to display the Normalization
window.
3. Tap the Perform default normalization button to display the
Default Normalization window.
4. Follow the on--screen instructions and diagram to connect the
precision cables and attenuators between the YBA250 and
YBT250 modules. Make sure to use the same cables and
attenuators during the Default normalization process that you will
use to take the insertion gain/loss measurements.
5. Tap the Normalize button. The instrument takes a minute or so to
generate the normalization data, and then saves the Default
normalization to memory, closes the window and returns you to
the Normalization window.
Calibration and Normalization
YBA250 Antenna and Transmission Line Analyzer User Manual 2- 45
NOTE. Note: The Default normalization data set is not accessible as
a file; it is stored in memory and set as the current Default
normalization. To replace the existing Default normalization data,
create a new Default normalization.
Creating a User Normalization
To create a User normalization, do the following:
1. Tap the Insertion Gain/Loss button to display the Insertion
Gain/Loss screen.
2. Select the measurement type (Insertion Loss or Insertion Gain).
3. Select the signal standard from the drop--down list located below
the menu bar.
4. Set the specific start/stop frequencies using any of the following
methods:
Tap the Channel button to set the frequency span to a specific
channel. The YBA250 centers the display at the center
frequency of the selected channel and sets the span to twice
the bandwidth specified by the signal standard, or 1.5 MHz,
whichever is greater. If a Forward/Reverse/Both button is
selected, it is taken into account when the Start and Stop
frequencies are set. After you have selected a channel, tap
OK.
Enter the Start and Stop frequencies in the frequency fields
adjacent to the Channel button by using the numeric keypads
or the knob.
To measure across just the forward or reverse bands, tap the
Forward or Reverse button. To measure across both the
Forward and Reverse bands, tap the Both button.
5. Select the signal power output level from the Power Output
Level: list.
6. Tap the Normalization... button.
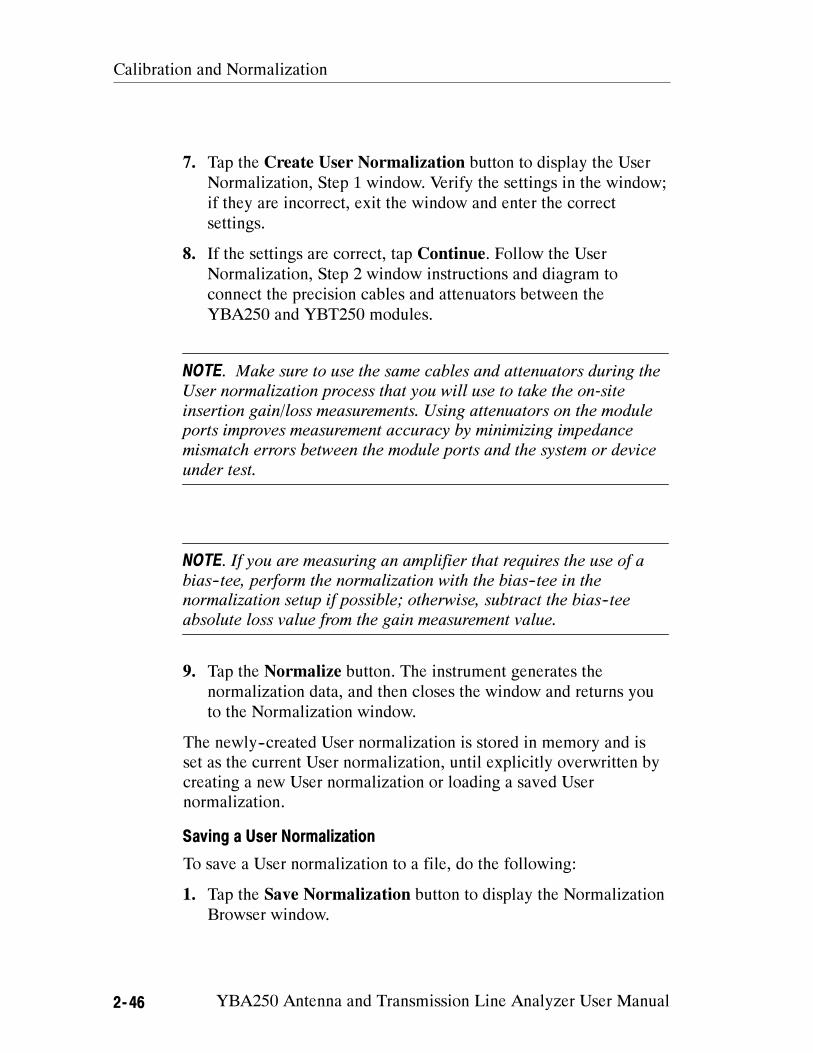
Calibration and Normalization
2- 46 YBA250 Antenna and Transmission Line Analyzer User Manual
7. Tap the Create User Normalization button to display the User
Normalization, Step 1 window. Verify the settings in the window;
if they are incorrect, exit the window and enter the correct
settings.
8. If the settings are correct, tap Continue. Follow the User
Normalization, Step 2 window instructions and diagram to
connect the precision cables and attenuators between the
YBA250 and YBT250 modules.
NOTE. Make sure to use the same cables and attenuators during the
User normalization process that you will use to take the on-site
insertion gain/loss measurements. Using attenuators on the module
ports improves measurement accuracy by minimizing impedance
mismatch errors between the module ports and the system or device
under test.
NOTE. If you are measuring an amplifier that requires the use of a
bias--tee, perform the normalization with the bias--tee in the
normalization setup if possible; otherwise, subtract the bias--tee
absolute loss value from the gain measurement value.
9. Tap the Normalize button. The instrument generates the
normalization data, and then closes the window and returns you
to the Normalization window.
The newly--created User normalization is stored in memory and is
set as the current User normalization, until explicitly overwritten by
creating a new User normalization or loading a saved User
normalization.
Saving a User Normalization
To save a User normalization to a file, do the following:
1. Tap the Save Normalization button to display the Normalization
Browser window.
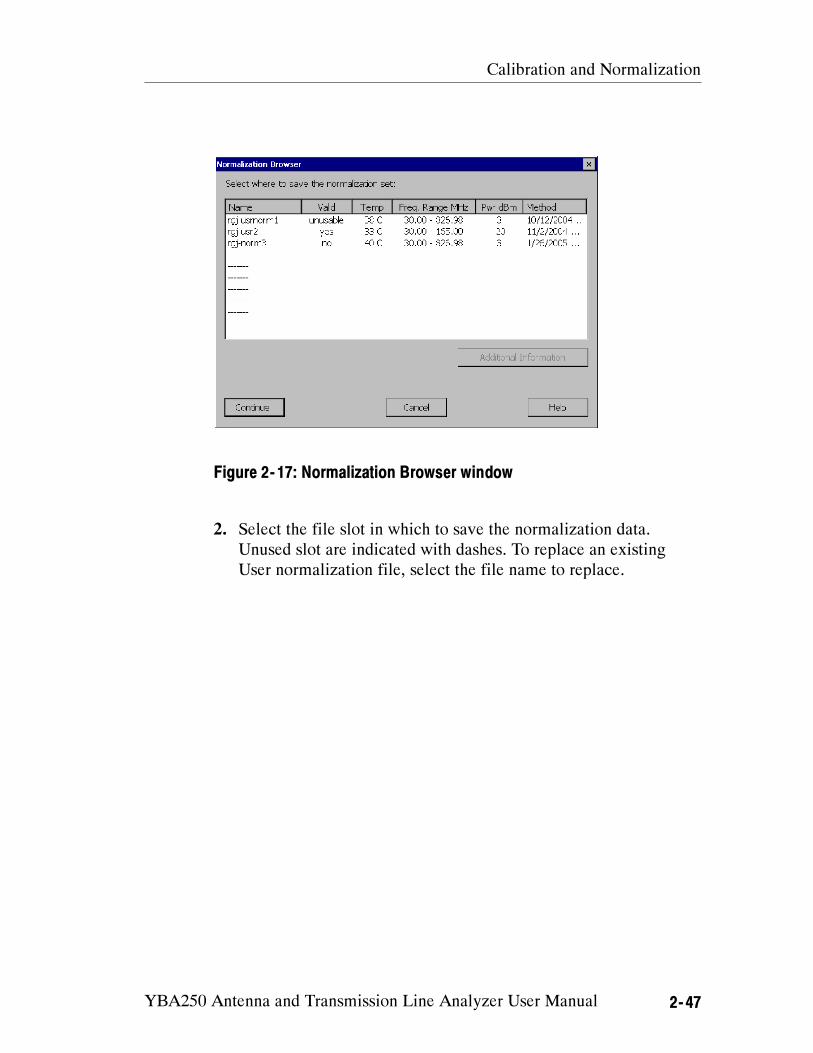
Calibration and Normalization
YBA250 Antenna and Transmission Line Analyzer User Manual 2- 47
Figure 2- 17: Normalization Browser window
2. Select the file slot in which to save the normalization data.
Unused slot are indicated with dashes. To replace an existing
User normalization file, select the file name to replace.
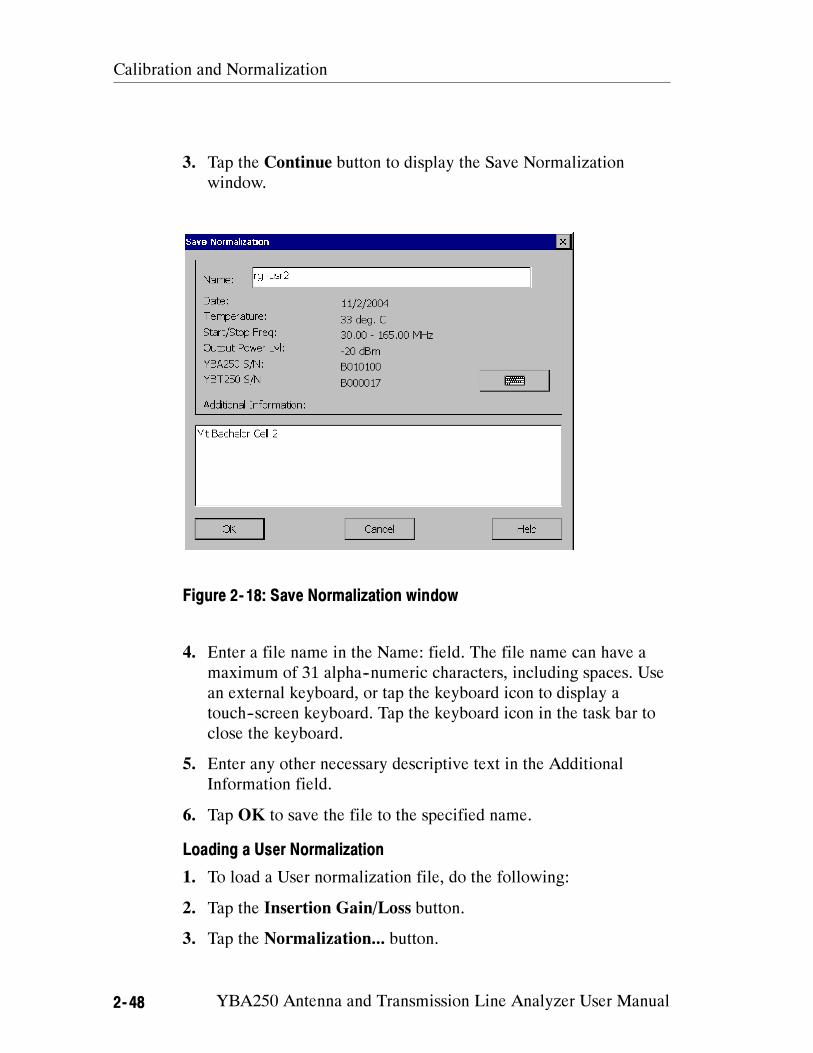
Calibration and Normalization
2- 48 YBA250 Antenna and Transmission Line Analyzer User Manual
3. Tap the Continue button to display the Save Normalization
window.
Figure 2- 18: Save Normalization window
4. Enter a file name in the Name: field. The file name can have a
maximum of 31 alpha--numeric characters, including spaces. Use
an external keyboard, or tap the keyboard icon to display a
touch--screen keyboard. Tap the keyboard icon in the task bar to
close the keyboard.
5. Enter any other necessary descriptive text in the Additional
Information field.
6. Tap OK to save the file to the specified name.
Loading a User Normalization
1. To load a User normalization file, do the following:
2. Tap the Insertion Gain/Loss button.
3. Tap the Normalization... button.
Calibration and Normalization
YBA250 Antenna and Transmission Line Analyzer User Manual 2- 49
4. Tap the Load Saved Normalization button to display the Load
Saved Normalization window.
Figure 2- 19: Load Saved Normalization window
5. Select the file from which to load the normalization data. Tap the
Additional Information button to display more information
about the file.
6. Tap OK to load the selected User normalization file into the
instrument.
NOTE. Loading a normalization sets the instrument start/stop
frequency and output power level values to those stored in the
normalization. Other instrument settings, including measurement
standard, measurement type, and measurement method, do not
change when loading a normalization.
Calibration and Normalization
2- 50 YBA250 Antenna and Transmission Line Analyzer User Manual
Normalization Guidelines
Two-port User normalizations created for a specific frequency
range and power output provide the most accurate two-port
insertion gain and loss measurements.
The YBA250 does not ship with any User normalizations. You
can create User normalizations any time before taking measure-
ments. For best accuracy, create a new User normalization on site
before taking measurements.
The Default normalization is excellent for locating high--level
malfunctions, such as testing an amplifier with low or no gain,
isolating a transmission line problem, or testing a lightning-dam-
aged filter.
The YBA250 does not ship with a Default normalization; you
should create one before performing any measurements. The
YBA250 can take measurements without a Default or User
normalization loaded, but the measurements will not be accurate.
For reasonable accuracy, create a new Default normalization on
site before taking measurements.
A User normalization is only valid for the frequency range and
power level used when the normalization data was collected. The
normalization frequency and power information is shown in the
normalization screens.
Bias Tees, filters, and attenuators required to take a measurement
(as opposed to filters and attenuators you are testing for correct
operation) should be connected to the attenuators on the NetTek
Analyzer ports, and a new normalization created to remove their
effects from the measurement path.
For maximum measurement accuracy, use the same cables and
attenuators used to create the normalization data set to take
measurements.
Calibration and Normalization
YBA250 Antenna and Transmission Line Analyzer User Manual 2- 51
The User normalization becomes less accurate and the YBA250
automatically changes normalization status from User to User?
under the following conditions (the YBA250 continues to use the
current User normalization):
The User normalization is more than seven days old.
The internal temperature of either module changes by more
than ±5 C (±9 F) from the temperature values at which the
User normalization was created.
The YBA250 automatically replaces the current User normaliza-
tion set with the Default normalization (if present) and changes
the normalization status from User or User? to Default under the
following conditions:
Frequency start and/or stop values were entered that are
different than those in the User normalization.
A power output level value was entered that is different than
the one in the User normalization.
The YBA250 automatically changes the normalization status
from User, User?, or Default to UnNormalized, if either or both
YBA250 or YBT250 modules are replaced with a different serial
numbered module.
The Default normalization data is always usable when used with
the same YBT250/YBA250 module combination used to create
the default normalization, even when the data is older than seven
days or the module temperatures exceed the above limits.
If you use multiple frequency ranges or power levels to take
measurements, it may be convenient to create and save a user
normalization entry for each of the measurements. Loading a
saved User Normalization sets the instrument to the frequency
range and power setting associated with that normalization.
Default and User normalization data sets work only with the
specific YBA250/YBT250 module pair used to create that data.
The YBA250 reports the normalization set as not valid if you use
the normalization data with different YBT250 and/or YBA250
modules.
Calibration and Normalization
2- 52 YBA250 Antenna and Transmission Line Analyzer User Manual
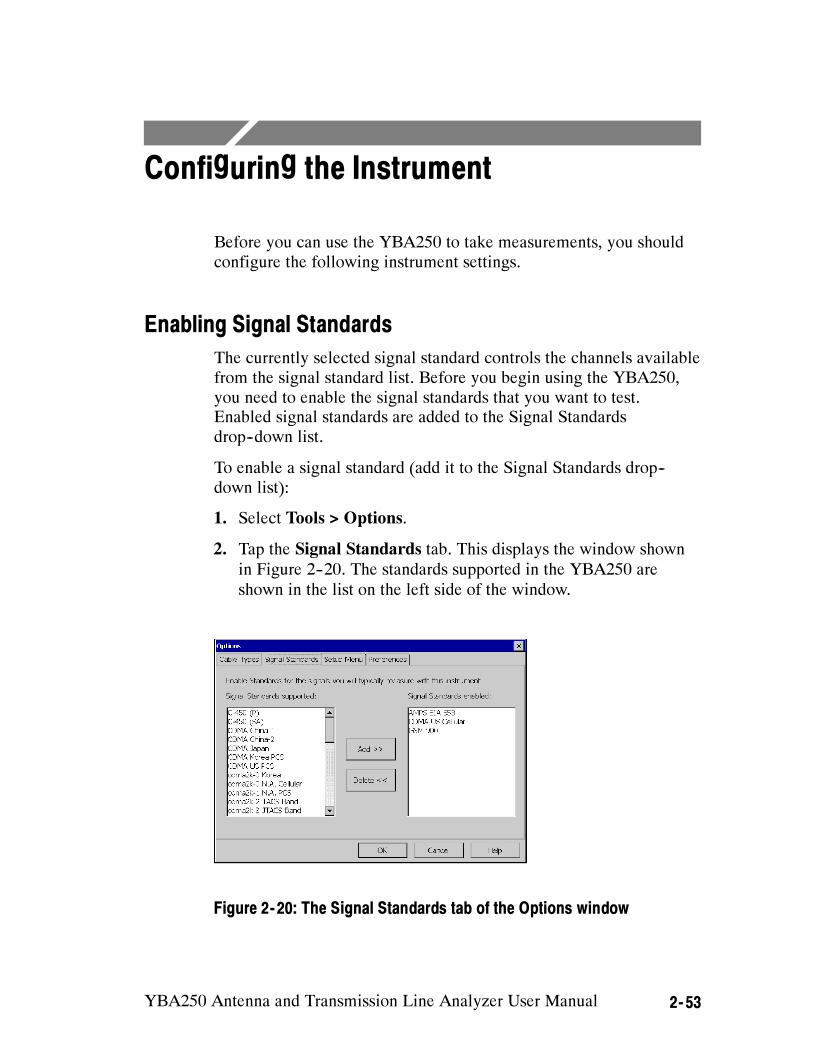
YBA250 Antenna and Transmission Line Analyzer User Manual 2- 53
Configuring the Instrument
Before you can use the YBA250 to take measurements, you should
configure the following instrument settings.
Enabling Signal Standards
The currently selected signal standard controls the channels available
from the signal standard list. Before you begin using the YBA250,
you need to enable the signal standards that you want to test.
Enabled signal standards are added to the Signal Standards
drop--down list.
To enable a signal standard (add it to the Signal Standards drop--
down list):
1. Select Tools > Options.
2. Tap the Signal Standards tab. This displays the window shown
in Figure 2--20. The standards supported in the YBA250 are
shown in the list on the left side of the window.
Figure 2- 20: The Signal Standards tab of the Options window
Configuring the Instrument
2- 54 YBA250 Antenna and Transmission Line Analyzer User Manual
3. To enable a signal standard, tap the name of the standard you
want to enable and then tap Add>>.
4. When you have enabled all the standards you will be testing, tap
OK.
Only enabled standards are displayed in the Signal Standards
drop-down list.
Setting the Output Power Level
You can set the output power used for Calibration, Return Loss,
Distance to Fault and Cable Loss measurements to either Low or
High power. The default setting is High. The advantage of the High
power setting is that it makes measurements more immune to
interference from other signal sources. The advantage of the Low
power setting is that it is less likely to disrupt calls on other
transmitters.
The High power setting is also a good choice when testing long
cables or cables with a high cable-loss value. If you are trying to
measure cable with an active device on it, you may need to chose the
Low power setting to avoid over driving the active device.
To set the Output Power level:
1. Tap the Edit button or select Setup > Edit from the
menu bar.
2. Tap the General tab.
3. Select the option button for Low power or High Power. See
Figure 2--21.
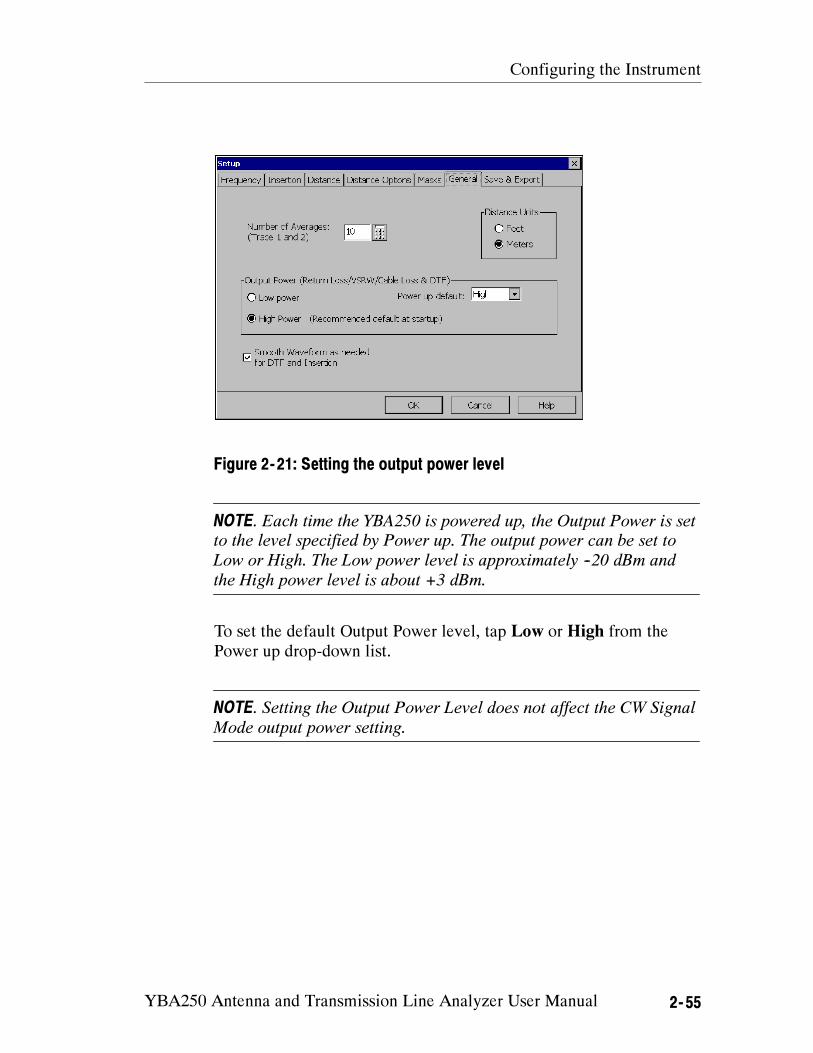
Configuring the Instrument
YBA250 Antenna and Transmission Line Analyzer User Manual 2- 55
Figure 2- 21: Setting the output power level
NOTE. Each time the YBA250 is powered up, the Output Power is set
to the level specified by Power up. The output power can be set to
Low or High. The Low power level is approximately --20 dBm and
the High power level is about +3 dBm.
To set the default Output Power level, tap Low or High from the
Power up drop-down list.
NOTE. Setting the Output Power Level does not affect the CW Signal
Mode output power setting.
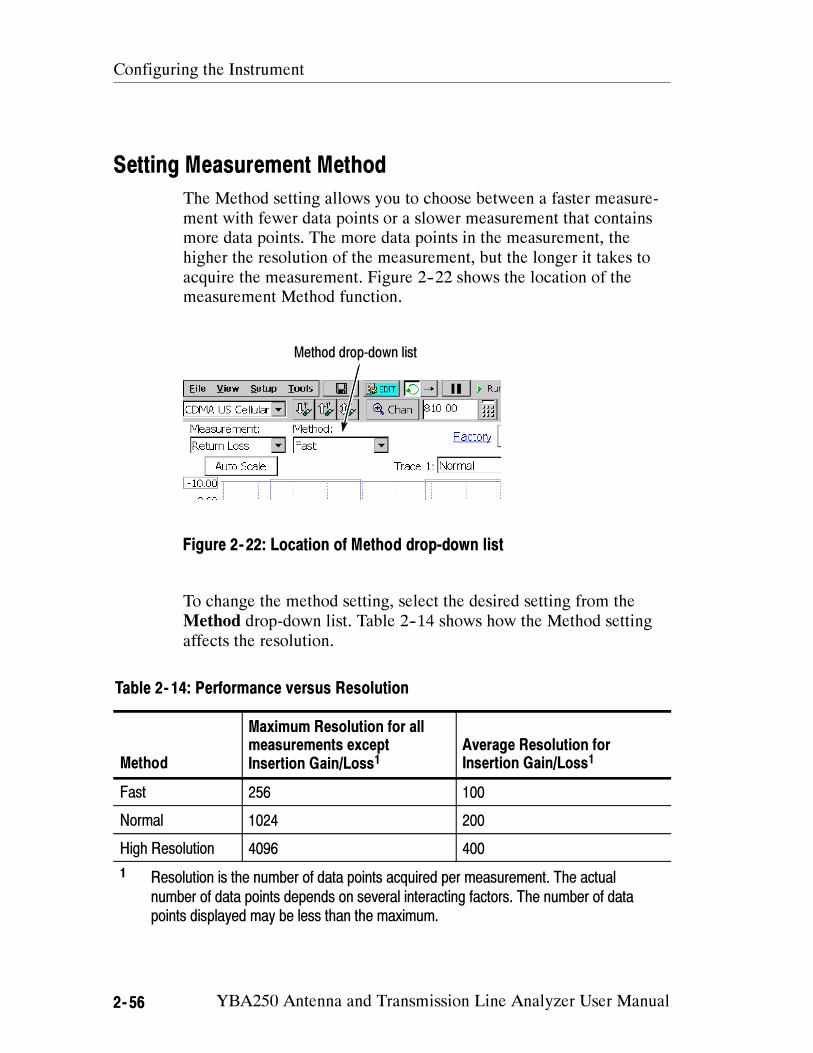
Configuring the Instrument
2- 56 YBA250 Antenna and Transmission Line Analyzer User Manual
Setting Measurement Method
The Method setting allows you to choose between a faster measure-
ment with fewer data points or a slower measurement that contains
more data points. The more data points in the measurement, the
higher the resolution of the measurement, but the longer it takes to
acquire the measurement. Figure 2--22 shows the location of the
measurement Method function.
Method drop-down list
Figure 2- 22: Location of Method drop-down list
To change the method setting, select the desired setting from the
Method drop-down list. Table 2--14 shows how the Method setting
affects the resolution.
Table 2- 14: Performance versus Resolution
Method
Maximum Resolution for all
measurements except
Insertion Gain/Loss1
Average Resolution for
Insertion Gain/Loss1
Fast 256 100
Normal 1024 200
High Resolution 4096 400
1Resolution is the number of data points acquired per measurement. The actual
number of data points depends on several interacting factors. The number of data
points displayed may be less than the maximum.
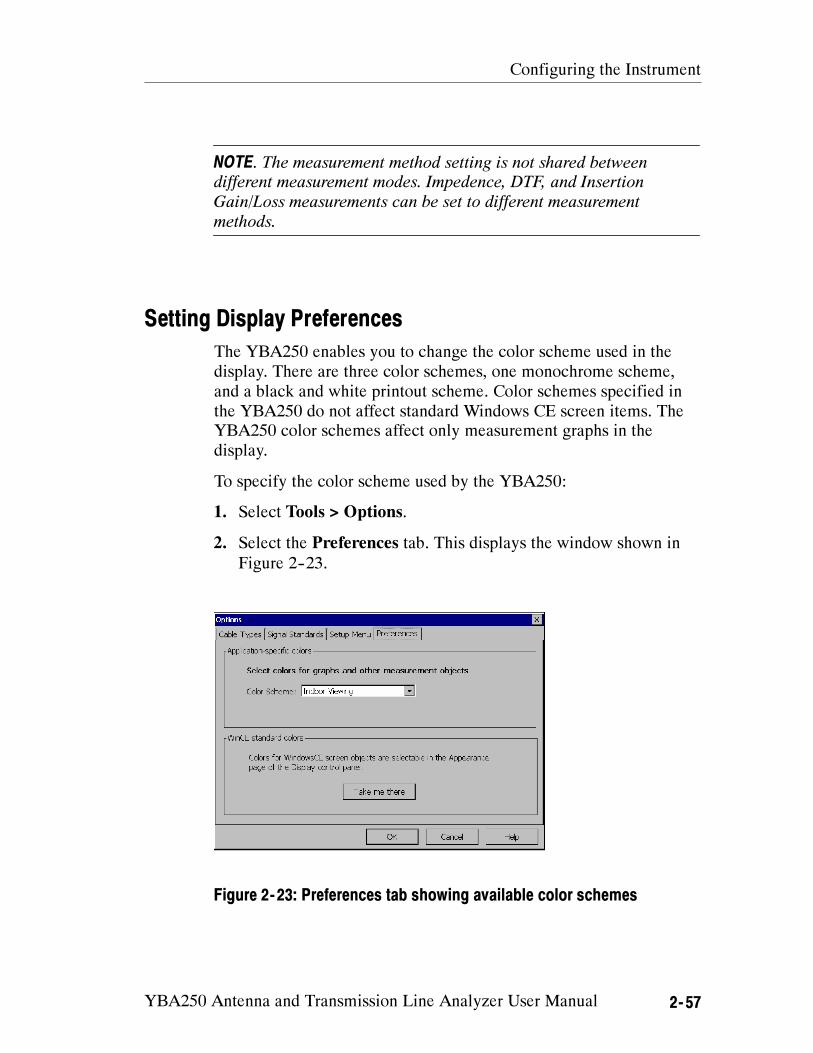
Configuring the Instrument
YBA250 Antenna and Transmission Line Analyzer User Manual 2- 57
NOTE. The measurement method setting is not shared between
different measurement modes. Impedence, DTF, and Insertion
Gain/Loss measurements can be set to different measurement
methods.
Setting Display Preferences
The YBA250 enables you to change the color scheme used in the
display. There are three color schemes, one monochrome scheme,
and a black and white printout scheme. Color schemes specified in
the YBA250 do not affect standard Windows CE screen items. The
YBA250 color schemes affect only measurement graphs in the
display.
To specify the color scheme used by the YBA250:
1. Select Tools > Options.
2. Select the Preferences tab. This displays the window shown in
Figure 2--23.
Figure 2- 23: Preferences tab showing available color schemes
Configuring the Instrument
2- 58 YBA250 Antenna and Transmission Line Analyzer User Manual
3. To display a list of the available color schemes, tap the Color
Scheme list box. Available color schemes are Indoor Viewing,
Outdoor Viewing, Dark on white, Monochrome grays, and Black
on White for Printer.
4. To select a color scheme, tap the name of the desired color
scheme.
5. To change the Windows CE display properties, tap Take Me
There. This displays the Windows CE Display Properties
window, where you can set the display background and window
color scheme.
6. Tap OK to save changes.
7. To view the changed color scheme, quit the YBA250 program
and restart it.
Display Trace Smoothing
For DTF and Insertion Gain/Loss measurements, when increasing
the Start distance, decreasing the Stop distance, or reducing the
frequency measurement range, the graph trace may become ”blocky”
because there are fewer data points to display. You can use the
View > Smoothing command to smooth the displayed trace between
data points.
You can also set trace smoothing as the default for DTF and
Insertion Gain/Loss measurements by selecting Smooth Waveform
as needed for DTF and Insertion on the Setup > General tab.
When a measurement has less than 128 data points, the YBA250
automatically applies the smoothing function to the trace.
Changing Settings for Saved Files
The YBA250 enables you to specify settings for saved files such as
prefixes for filenames, the name of a technician making a test, notes
to be included in saved results files, and the default format for
exported screens.
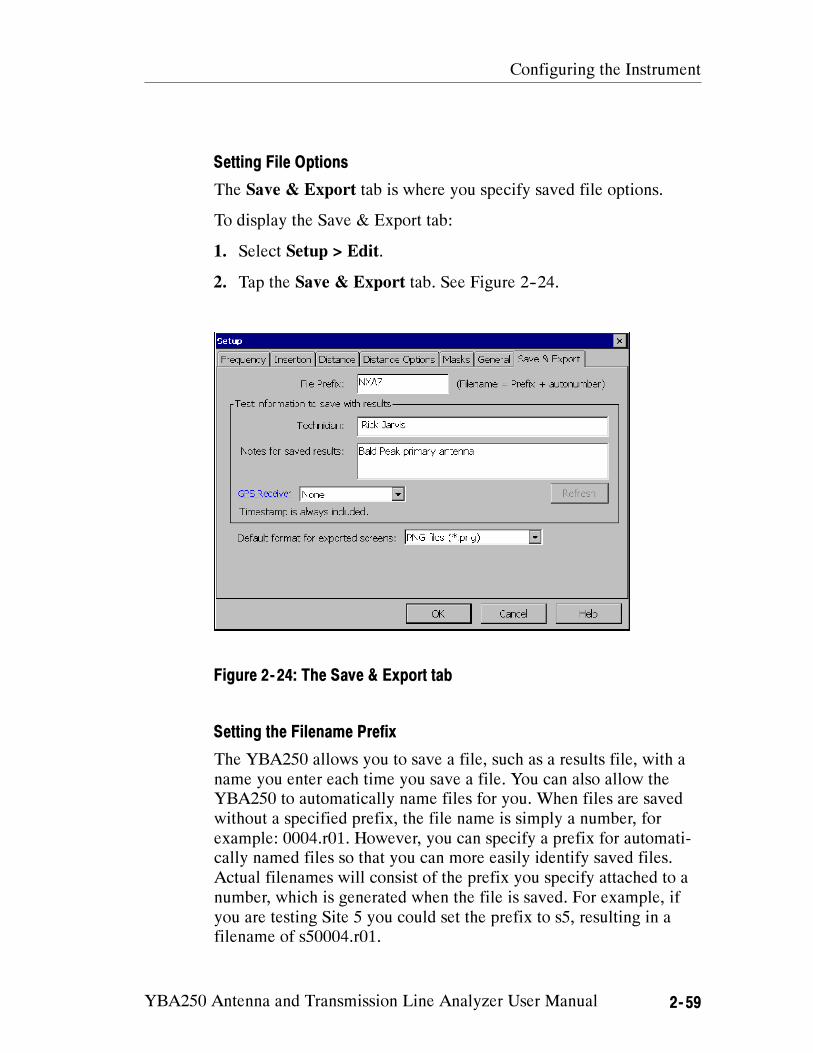
Configuring the Instrument
YBA250 Antenna and Transmission Line Analyzer User Manual 2- 59
Setting File Options
The Save & Export tab is where you specify saved file options.
To display the Save & Export tab:
1. Select Setup > Edit.
2. Tap the Save & Export tab. See Figure 2--24.
Figure 2- 24: The Save & Export tab
Setting the Filename Prefix
The YBA250 allows you to save a file, such as a results file, with a
name you enter each time you save a file. You can also allow the
YBA250 to automatically name files for you. When files are saved
without a specified prefix, the file name is simply a number, for
example: 0004.r01. However, you can specify a prefix for automati-
cally named files so that you can more easily identify saved files.
Actual filenames will consist of the prefix you specify attached to a
number, which is generated when the file is saved. For example, if
you are testing Site 5 you could set the prefix to s5, resulting in a
filename of s50004.r01.
Configuring the Instrument
2- 60 YBA250 Antenna and Transmission Line Analyzer User Manual
NOTE. The length of a file name is variable, depending on the length
of the path (where the file is located). The limit of the path and file
name is 256 characters. The shorter the path to the file, the longer
the file name can be.
To specify the file name prefix:
1. Select Setup > Edit. This displays the Setup window.
2. Tap the Save & Export tab. See Figure 2--24.
3. Tap the box after File Prefix:.
4. Enter text (using the soft keyboard or an external keyboard) to
use as the prefix of file names.
5. Tap OK to save your changes.
Setting the Technician Name
The YBA250 allows you to store the name of the technician
performing a test in the results file for the test.
To specify the technician’s name:
1. Select Setup > Edit. This displays the Setup window.
2. Tap the Save & Export tab. See Figure 2--24.
3. Tap the box after Technician:.
4. Enter the technician name. You can also use this space for
additional test information instead of a technician name.
5. Tap OK to save the technician name field.
Entering Notes for Saved Results
The YBA250 lets you enter a note to be saved in results files. Thus,
if there are any special conditions about a test, you can save notes
within the results file. You can enter up to 254 characters in the notes
field.
Configuring the Instrument
YBA250 Antenna and Transmission Line Analyzer User Manual 2- 61
To specify notes for saved results:
1. Select Setup > Edit. This displays the Setup window.
2. Tap the Save & Export tab. See Figure 2--24.
3. Tap the box after Notes for saved results:.
4. Enter text (using the soft keyboard or an external keyboard) for
the note.
5. Tap OK to save the notes you entered.
Saving GPS Coordinates with your Results
You can connect a GPS (Global Positioning System) receiver to your
NetTek Analyzer to collect location coordinates that are saved with
your measurement results. The most recent position read from the
GPS receiver is included with your results when you save or export
your results.
NOTE. For correct coordinates when using the GPS function, save or
export your results while the GPS receiver is at the location where
you made the test. If you take a measurement, move the instrument,
and then save your results, you will not be saving the coordinates of
the location where you took the test. You will be saving the
coordinates of your new location.
Selecting a Compatible GPS Receiver
You can use any GPS receiver that supports NMEA 0183 V2.0.
Specifically, the GPS must output the $GPRMC sentence on a
regular basis.
The YBA250 application reads the GPS position from the GPS
receiver once per second, or at the rate the GPS receiver sends the
$GPRMC sentence, whichever is slower.
Connecting through the Serial Port. The GPS receiver can connect to
the serial port (4800 baud rate). The Garmin GPS III and Garmin
GPS III Plus have been tested with the YBA250 application.
Configuring the Instrument
2- 62 YBA250 Antenna and Transmission Line Analyzer User Manual
Connecting through the PCMCIA Slot. The GPS receiver can connect
through the PCMCIA slot and emulate a serial port on COM4. The
Teletype GPS WorldNavigator (product #1351) has been tested with
the YBA250 application.
Setting Up YBA250/GPS receiver communications
To set up the GPS receiver to work with the YBA250:
1. Set your GPS receiver to regularly output NMEA sentences.
2. Connect the GPS receiver (by serial cable or through the
PCMCIA slot) to the NetTek Analyzer platform.
3. In the YBA250 application, tap the Edit button and then the
Save & Export tab.
4. Select the correct GPS receiver interface type (Serial or
PCMCIA) from the GPS Receiver drop-down list.
The YBA250 displays the latitude and longitude just to the right of
the drop-down list box a short time after the GPS receiver sends the
$GPRMC sentence. Tap the Refresh button to update the displayed
coordinates.
You can also view the latest GPS position in the Results Properties
dialog box (File > Results Properties). When you open a saved
results file, the Results Properties shows information about the
results file, including the GPS position at the time the results file was
saved.
Troubleshooting Your GPS Receiver
After you have selected the GPS receiver type in the Save & Export
dialog box, a position should appear immediately to the right of the
list box.
Error Message: Invalid Position. If, after you select the GPS receiver
type in the Save & Export dialog, the message “Invalid Position”
appears, then the communication connection to the receiver has been
successfully established, and the $GPRMC sentence is being
successfully read from the receiver, but the position supplied in that
sentence is not valid. In this case, check your GPS receiver to see if
it does have a valid position, and, if not, refer to the GPS receiver
documentation to resolve this problem.
Configuring the Instrument
YBA250 Antenna and Transmission Line Analyzer User Manual 2- 63
Error Message: Unable to Read Position Information If the instrument
displays an error dialog indicating that the application was unable to
read position information from the GPS receiver, do the following:
Make sure the cable from the receiver to the serial port is
connected and that the PCMCIA card is firmly seated.
Ensure that the receiver is set to regularly output NMEA
sentences.
If you have purchased the vxHpc terminal emulator, you can
view the NMEA sentences being sent.
Open the vxHpc terminal emulator by tapping Start > Programs
> Communication > vxHpc.
To view the NMEA sentences being sent, you need to set up
vxHpc to connect to the correct port:
For a serial port GPS receiver, set up vxHpc to connect to
COM1.
For the Teletype WorldNavigator, set up vxHpc to connect to
Teletype_1358 (for Y350C NetTek Analyzer Platforms) or
COM4 (for Y400 NetTek Analyzer Platforms).
Configure the serial port as follows:
4800 baud
8 data bits
No parity
1 stop bit
No flow control
Open the session. You should see NMEA sentences being sent the
GPS receiver.
If you do not see NMEA sentences, either the GPS receiver is not
sending the sentences or the connection to the GPS receiver is not
passing them (check the cables again). Refer to your GPS
receiver documentation to find out how to output NMEA
sentences regularly.
Configuring the Instrument
2- 64 YBA250 Antenna and Transmission Line Analyzer User Manual

Reference

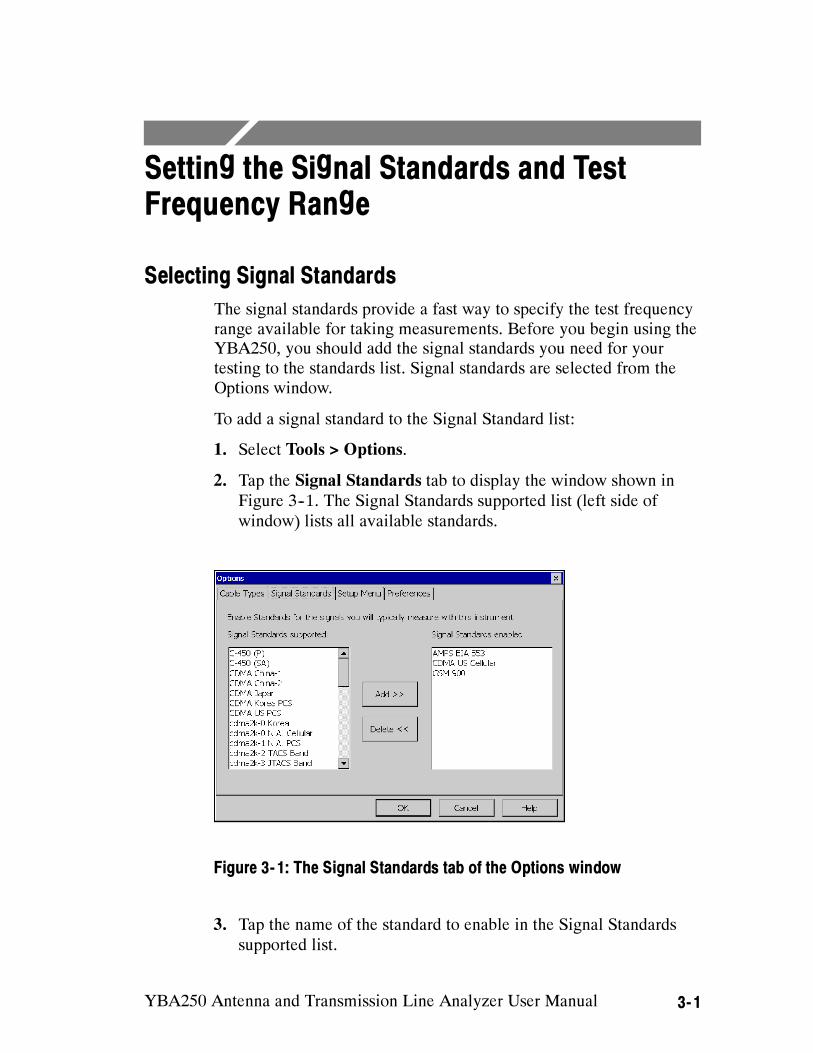
YBA250 Antenna and Transmission Line Analyzer User Manual 3- 1
Setting the Signal Standards and Test
Frequency Range
Selecting Signal Standards
The signal standards provide a fast way to specify the test frequency
range available for taking measurements. Before you begin using the
YBA250, you should add the signal standards you need for your
testing to the standards list. Signal standards are selected from the
Options window.
To add a signal standard to the Signal Standard list:
1. Select Tools > Options.
2. Tap the Signal Standards tab to display the window shown in
Figure 3--1. The Signal Standards supported list (left side of
window) lists all available standards.
Figure 3- 1: The Signal Standards tab of the Options window
3. Tap the name of the standard to enable in the Signal Standards
supported list.
Setting the Signal Standards and Test Frequency Range
3- 2 YBA250 Antenna and Transmission Line Analyzer User Manual
4. Tap Add>>. This moves the standard name from one list to the
other.
5. Repeat steps 3 and 4 until you have added all necessary signal
standards to the list.
6. When you have enabled all the standards you will be testing, tap
OK.
Only enabled standards are listed in the signal standards list that
appears in the tuning controls area of the measurement displays.
NOTE. You can also double--tap on a standard to move it from one list
to the other.
The Test Frequency Range
All measurements (except DTF) are made across a test frequency
range. The test frequency range is defined by specifying a start and a
stop frequency. You must set the test frequency range before making
a measurement.
Figure 3--2 shows the location of the frequency information, as well
as the buttons and controls used to set the test frequency range.
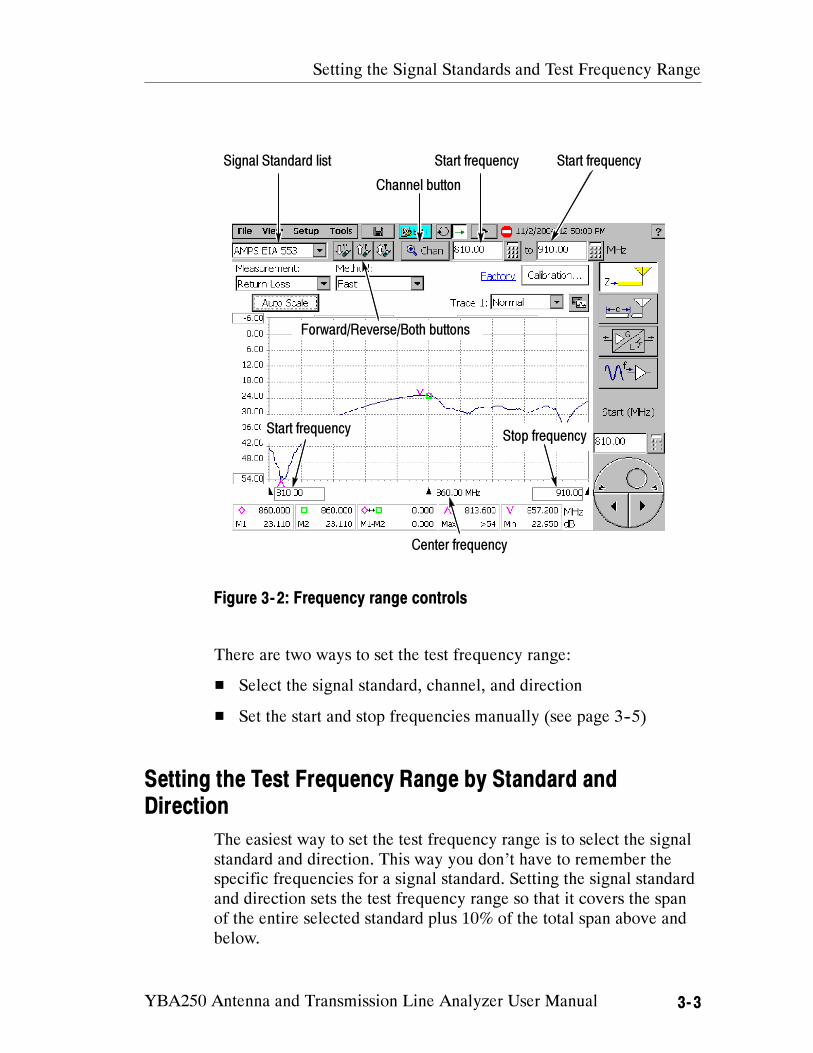
Setting the Signal Standards and Test Frequency Range
YBA250 Antenna and Transmission Line Analyzer User Manual 3- 3
Start frequencySignal Standard list
Channel button
Center frequency
Start frequencyStop frequency
Forward/Reverse/Both buttons
Start frequency
Figure 3- 2: Frequency range controls
There are two ways to set the test frequency range:
Select the signal standard, channel, and direction
Set the start and stop frequencies manually (see page 3--5)
Setting the Test Frequency Range by Standard and
Direction
The easiest way to set the test frequency range is to select the signal
standard and direction. This way you don’t have to remember the
specific frequencies for a signal standard. Setting the signal standard
and direction sets the test frequency range so that it covers the span
of the entire selected standard plus 10% of the total span above and
below.
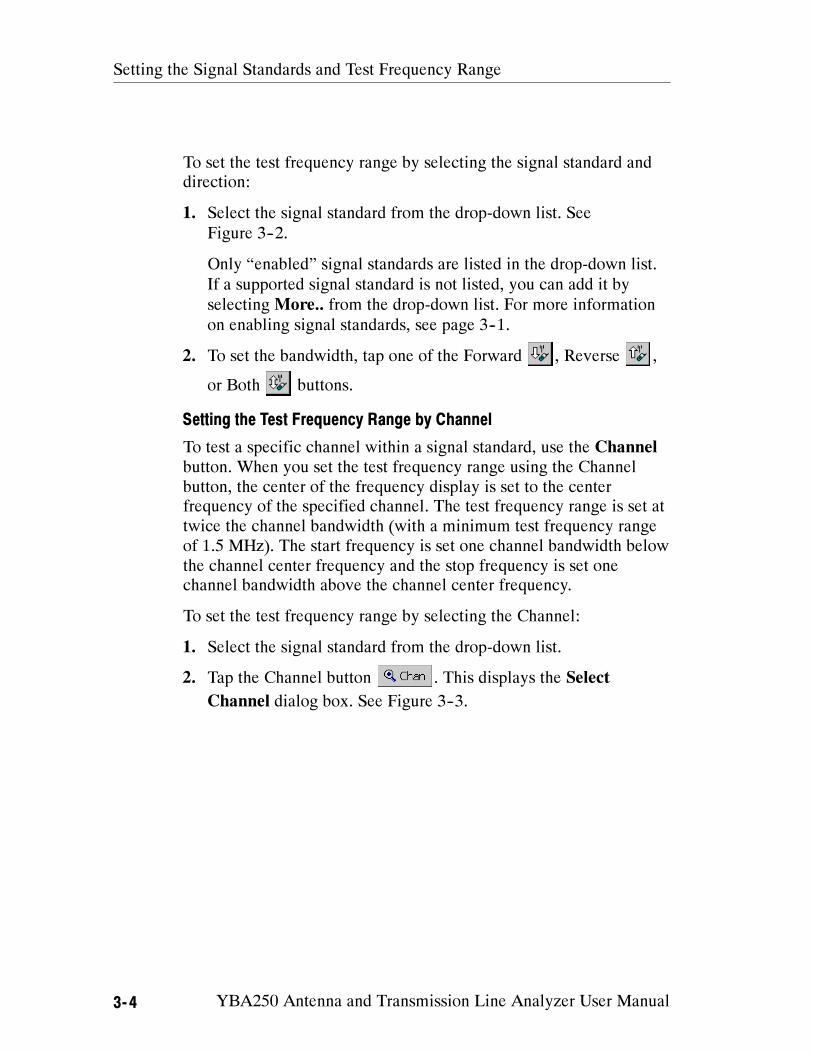
Setting the Signal Standards and Test Frequency Range
3- 4 YBA250 Antenna and Transmission Line Analyzer User Manual
To set the test frequency range by selecting the signal standard and
direction:
1. Select the signal standard from the drop-down list. See
Figure 3--2.
Only “enabled” signal standards are listed in the drop-down list.
If a supported signal standard is not listed, you can add it by
selecting More.. from the drop-down list. For more information
on enabling signal standards, see page 3--1.
2. To set the bandwidth, tap one of the Forward , Reverse ,
or Both buttons.
Setting the Test Frequency Range by Channel
To test a specific channel within a signal standard, use the Channel
button. When you set the test frequency range using the Channel
button, the center of the frequency display is set to the center
frequency of the specified channel. The test frequency range is set at
twice the channel bandwidth (with a minimum test frequency range
of 1.5 MHz). The start frequency is set one channel bandwidth below
the channel center frequency and the stop frequency is set one
channel bandwidth above the channel center frequency.
To set the test frequency range by selecting the Channel:
1. Select the signal standard from the drop-down list.
2. Tap the Channel button . This displays the Select
Channel dialog box. See Figure 3--3.
Setting the Signal Standards and Test Frequency Range
YBA250 Antenna and Transmission Line Analyzer User Manual 3- 5
Note that both uplink and downlink
frequencies are listed. Be sure to
select the correct link direction
when selecting a channel
Figure 3- 3: Select Channel dialog box
3. Scroll through the list until you find the channel to test and tap
the desired channel number to select it.
Note that the list shows both the uplink and downlink frequen-
cies. Be sure to tap the correct direction when selecting a
channel.
4. Tap OK.
You can customize the Channel Table contents to suit your specific
measurement needs. See Customizing the Channel Table on
page G--1 for more information.
Setting the Test Frequency Range by Start and Stop
Frequency
To set the test frequency range by specifying the start and stop
frequencies:
1. Tap the numeric keypad next to the Start or Stop frequency entry
box located below the menu bar (see Figure 3--2). This displays
the Enter Frequency dialog shown in Figure 3--4.
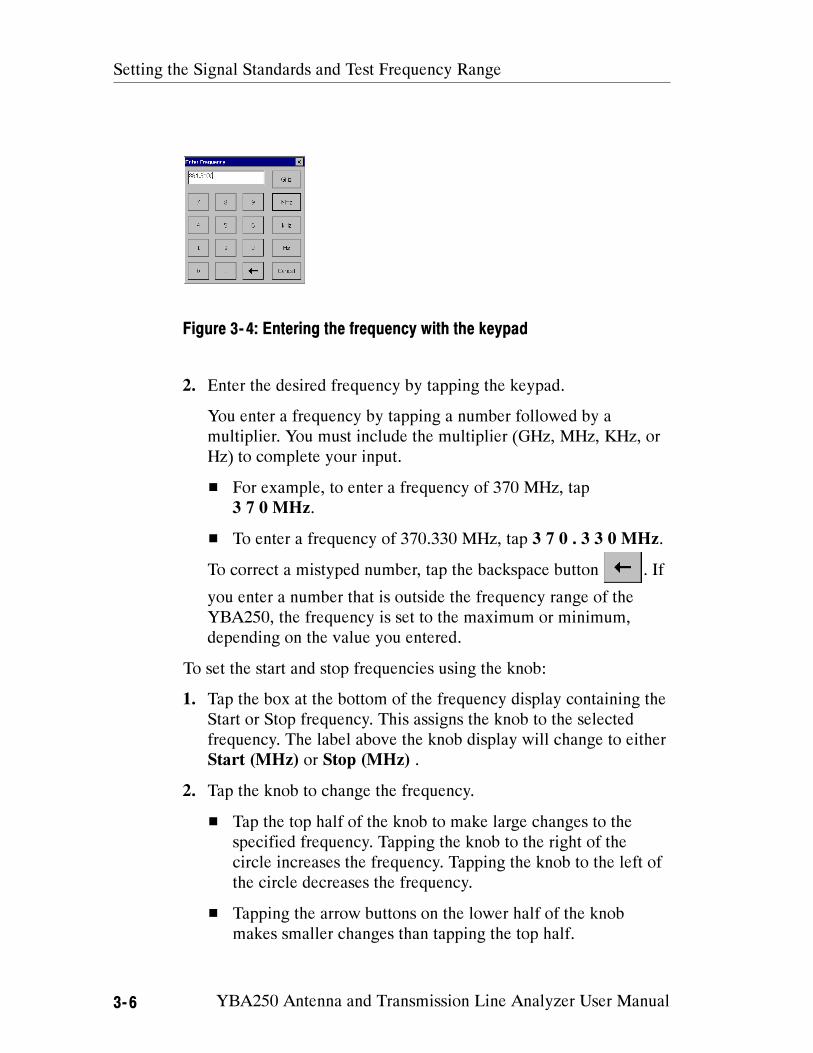
Setting the Signal Standards and Test Frequency Range
3- 6 YBA250 Antenna and Transmission Line Analyzer User Manual
Figure 3- 4: Entering the frequency with the keypad
2. Enter the desired frequency by tapping the keypad.
You enter a frequency by tapping a number followed by a
multiplier. You must include the multiplier (GHz, MHz, KHz, or
Hz) to complete your input.
For example, to enter a frequency of 370 MHz, tap
3 7 0 MHz.
To enter a frequency of 370.330 MHz, tap 3 7 0 . 3 3 0 MHz.
To correct a mistyped number, tap the backspace button . If
you enter a number that is outside the frequency range of the
YBA250, the frequency is set to the maximum or minimum,
depending on the value you entered.
To set the start and stop frequencies using the knob:
1. Tap the box at the bottom of the frequency display containing the
Start or Stop frequency. This assigns the knob to the selected
frequency. The label above the knob display will change to either
Start (MHz) or Stop (MHz) .
2. Tap the knob to change the frequency.
Tap the top half of the knob to make large changes to the
specified frequency. Tapping the knob to the right of the
circle increases the frequency. Tapping the knob to the left of
the circle decreases the frequency.
Tapping the arrow buttons on the lower half of the knob
makes smaller changes than tapping the top half.
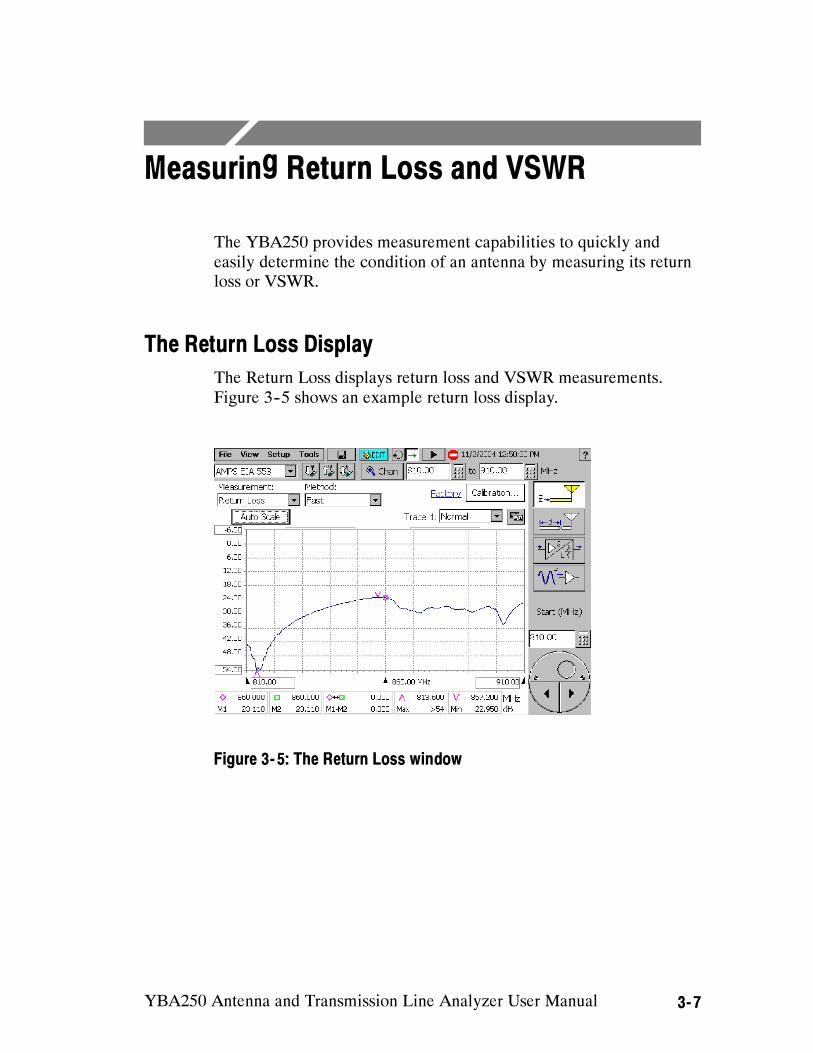
YBA250 Antenna and Transmission Line Analyzer User Manual 3- 7
Measuring Return Loss and VSWR
The YBA250 provides measurement capabilities to quickly and
easily determine the condition of an antenna by measuring its return
loss or VSWR.
The Return Loss Display
The Return Loss displays return loss and VSWR measurements.
Figure 3--5 shows an example return loss display.
Figure 3- 5: The Return Loss window
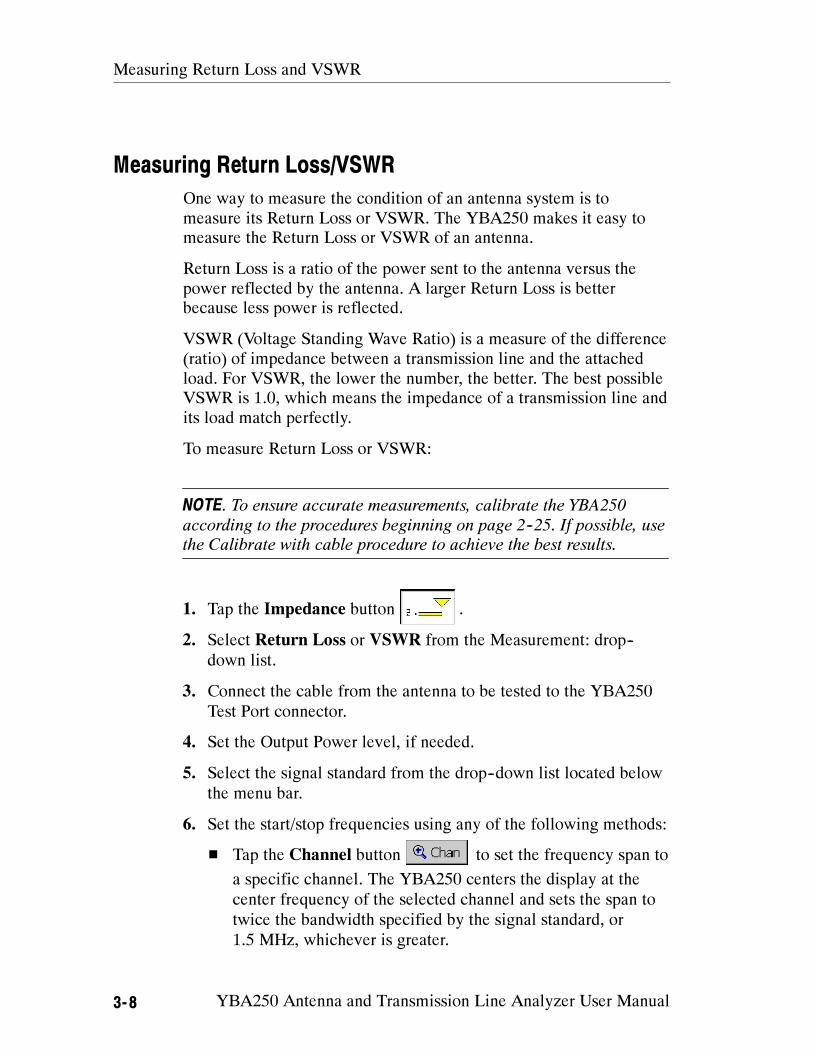
Measuring Return Loss and VSWR
3- 8 YBA250 Antenna and Transmission Line Analyzer User Manual
Measuring Return Loss/VSWR
One way to measure the condition of an antenna system is to
measure its Return Loss or VSWR. The YBA250 makes it easy to
measure the Return Loss or VSWR of an antenna.
Return Loss is a ratio of the power sent to the antenna versus the
power reflected by the antenna. A larger Return Loss is better
because less power is reflected.
VSWR (Voltage Standing Wave Ratio) is a measure of the difference
(ratio) of impedance between a transmission line and the attached
load. For VSWR, the lower the number, the better. The best possible
VSWR is 1.0, which means the impedance of a transmission line and
its load match perfectly.
To measure Return Loss or VSWR:
NOTE. To ensure accurate measurements, calibrate the YBA250
according to the procedures beginning on page 2--25. If possible, use
the Calibrate with cable procedure to achieve the best results.
1. Tap the Impedance button .
2. Select Return Loss or VSWR from the Measurement: drop--
down list.
3. Connect the cable from the antenna to be tested to the YBA250
Test Port connector.
4. Set the Output Power level, if needed.
5. Select the signal standard from the drop--down list located below
the menu bar.
6. Set the start/stop frequencies using any of the following methods:
Tap the Channel button to set the frequency span to
a specific channel. The YBA250 centers the display at the
center frequency of the selected channel and sets the span to
twice the bandwidth specified by the signal standard, or
1.5 MHz, whichever is greater.
Measuring Return Loss and VSWR
YBA250 Antenna and Transmission Line Analyzer User Manual 3- 9
If a Forward, Reverse, or Both button is selected, the band
information is taken into account when the Start and Stop
frequencies are set. After you have selected a channel, tap
OK.
Enter the Start and Stop frequencies in the frequency fields
adjacent to the Channel button by using the numeric keypad
icons or the knob.
Tap either the Forward or Reverse button to
measure across just the forward or reverse bands. To measure
across both the Forward and Reverse bands, tap the Both
Both button.
7. Set the measurement mode to either Single measurement or
Continuous measurement .
NOTE. Continuous measurements consume more battery power than
single-shot measurements. To extend battery-based operation, use
single-shot mode whenever possible.
The YBA250 starts taking measurements. Figures 3--6 and 3--7 show
example measurements for return loss and VSWR measurements.
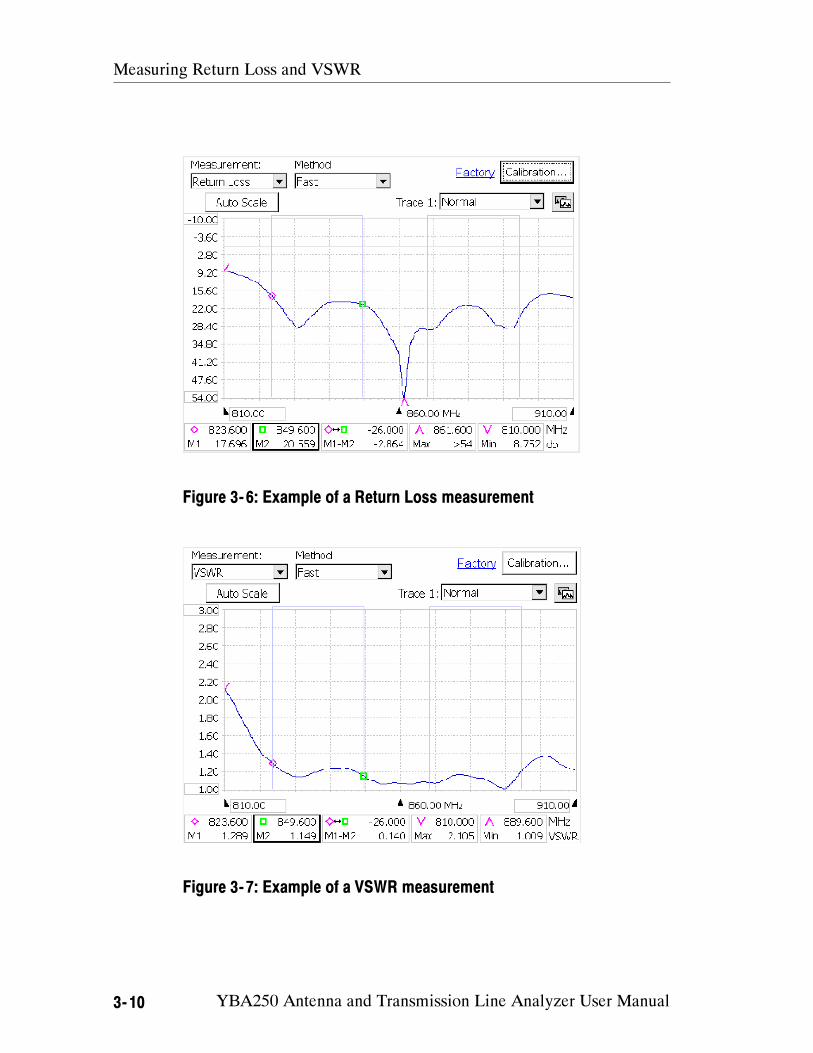
Measuring Return Loss and VSWR
3- 10 YBA250 Antenna and Transmission Line Analyzer User Manual
Figure 3- 6: Example of a Return Loss measurement
Figure 3- 7: Example of a VSWR measurement
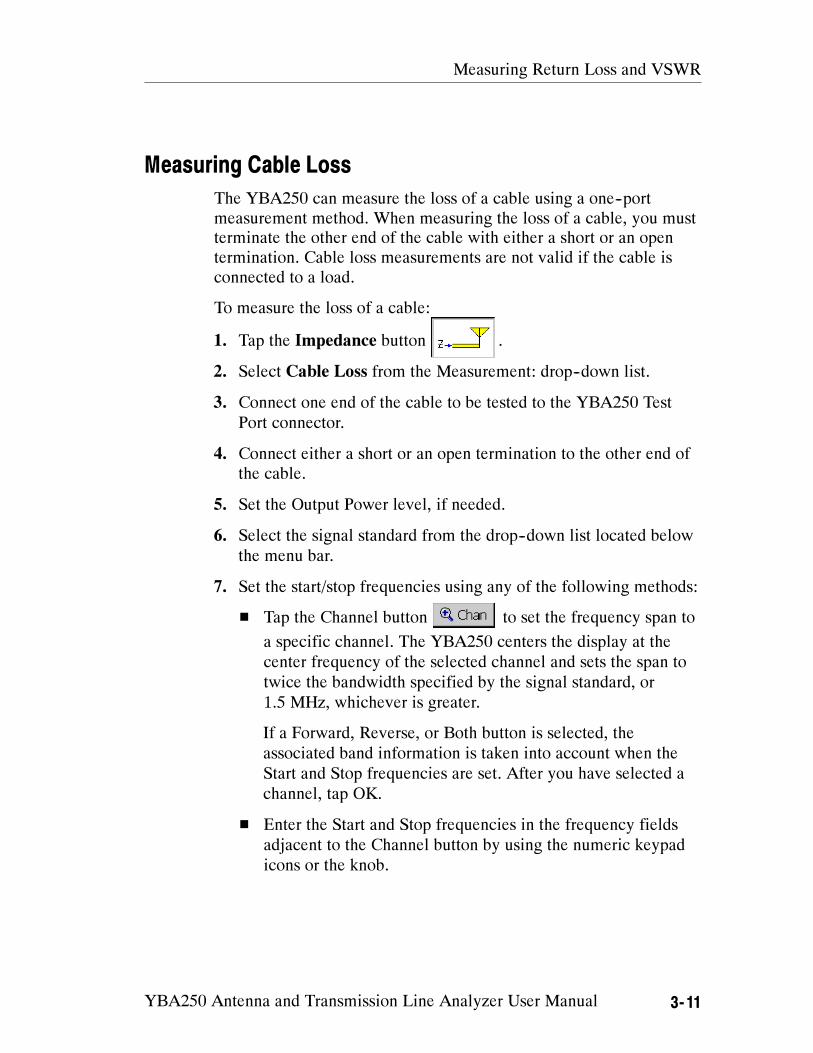
Measuring Return Loss and VSWR
YBA250 Antenna and Transmission Line Analyzer User Manual 3- 11
Measuring Cable Loss
The YBA250 can measure the loss of a cable using a one--port
measurement method. When measuring the loss of a cable, you must
terminate the other end of the cable with either a short or an open
termination. Cable loss measurements are not valid if the cable is
connected to a load.
To measure the loss of a cable:
1. Tap the Impedance button .
2. Select Cable Loss from the Measurement: drop--down list.
3. Connect one end of the cable to be tested to the YBA250 Test
Port connector.
4. Connect either a short or an open termination to the other end of
the cable.
5. Set the Output Power level, if needed.
6. Select the signal standard from the drop--down list located below
the menu bar.
7. Set the start/stop frequencies using any of the following methods:
Tap the Channel button to set the frequency span to
a specific channel. The YBA250 centers the display at the
center frequency of the selected channel and sets the span to
twice the bandwidth specified by the signal standard, or
1.5 MHz, whichever is greater.
If a Forward, Reverse, or Both button is selected, the
associated band information is taken into account when the
Start and Stop frequencies are set. After you have selected a
channel, tap OK.
Enter the Start and Stop frequencies in the frequency fields
adjacent to the Channel button by using the numeric keypad
icons or the knob.
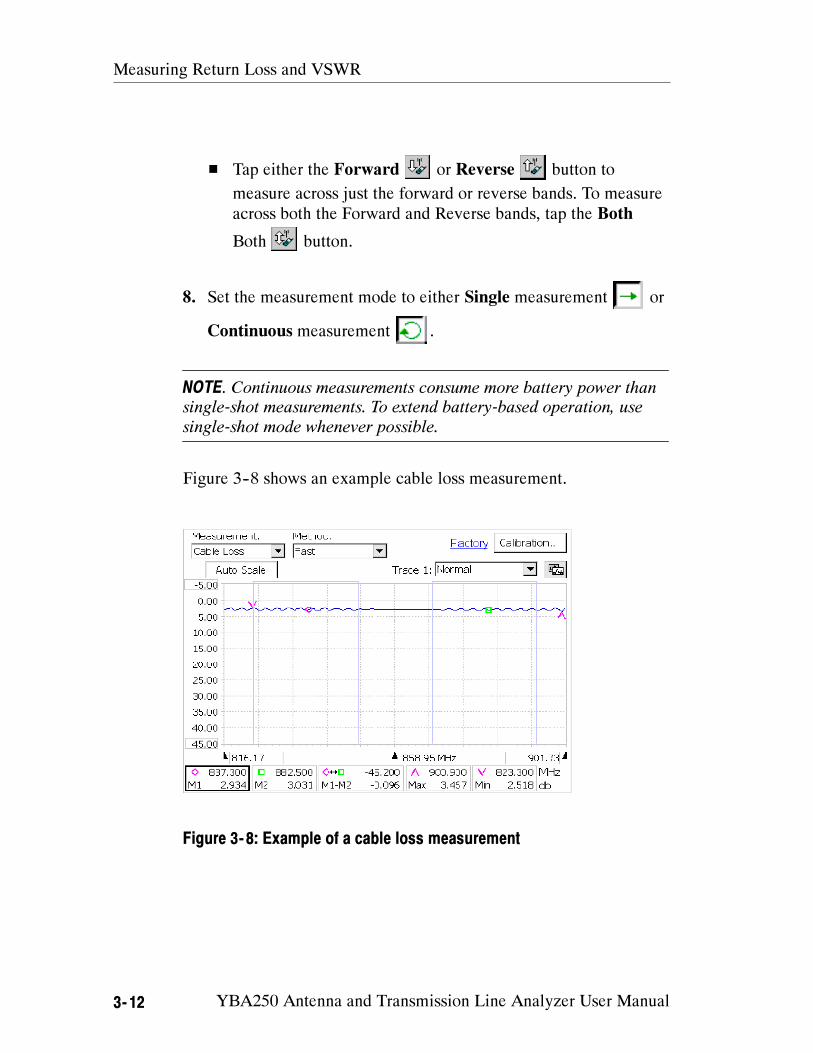
Measuring Return Loss and VSWR
3- 12 YBA250 Antenna and Transmission Line Analyzer User Manual
Tap either the Forward or Reverse button to
measure across just the forward or reverse bands. To measure
across both the Forward and Reverse bands, tap the Both
Both button.
8. Set the measurement mode to either Single measurement or
Continuous measurement .
NOTE. Continuous measurements consume more battery power than
single-shot measurements. To extend battery-based operation, use
single-shot mode whenever possible.
Figure 3--8 shows an example cable loss measurement.
Figure 3- 8: Example of a cable loss measurement
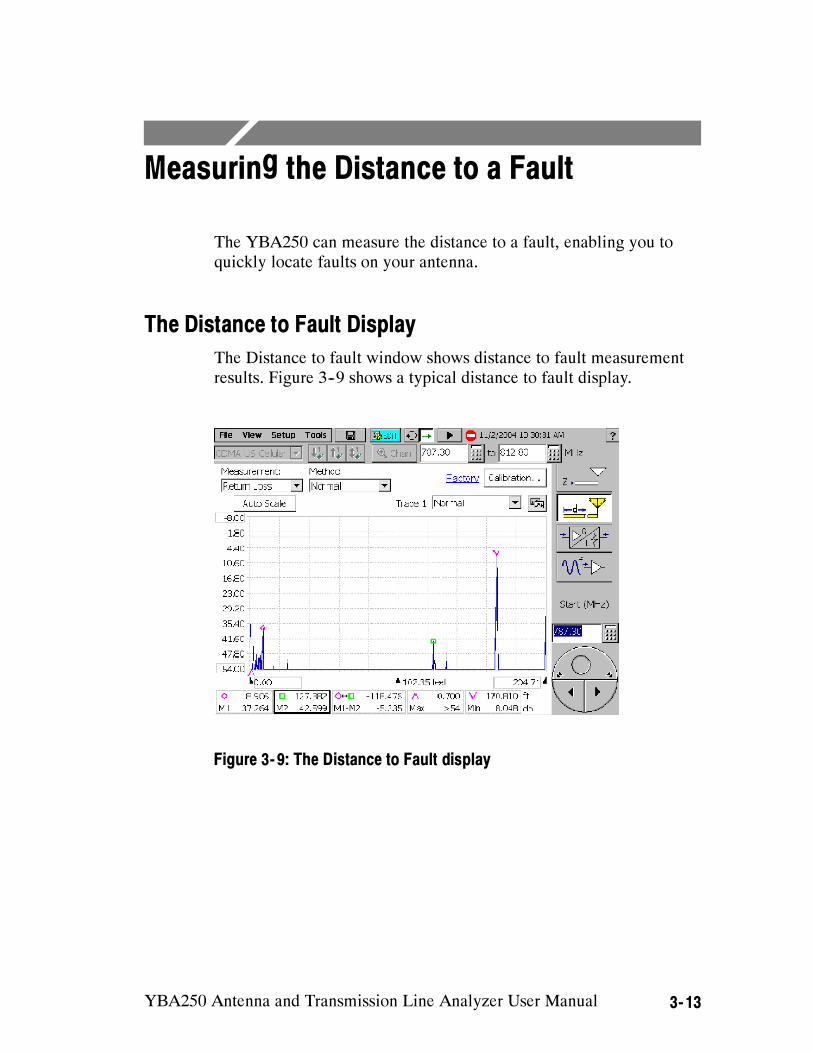
YBA250 Antenna and Transmission Line Analyzer User Manual 3- 13
Measuring the Distance to a Fault
The YBA250 can measure the distance to a fault, enabling you to
quickly locate faults on your antenna.
The Distance to Fault Display
The Distance to fault window shows distance to fault measurement
results. Figure 3--9 shows a typical distance to fault display.
Figure 3- 9: The Distance to Fault display
Measuring the Distance to a Fault
3- 14 YBA250 Antenna and Transmission Line Analyzer User Manual
Measuring the Distance to a Fault
WARNING. To prevent personal injury from the effects of lightning, do
not connect this product to any source that might be subject to the
effects of lightning. Use your own good judgement and common
sense. You must protect yourself from the effects of lightning.
To measure the distance to a fault:
1. Following your standard practice, disconnect the antenna to be
tested from the transmitter.
2. Discharge the antenna line (short the center conductor to the
cable ground shield).
CAUTION. Failure to discharge the antenna line can cause severe
damage to the YBA250 from the static electrical charge, which may
be present on the antenna and cable.
3. Connect the cable/antenna assembly to be tested to the YBA250
test port.
4. Tap the Distance button .
5. Set the Output Power level, if needed.
6. Specify the cable type to be tested:
a. Tap the Edit button .
b. Tap the Distance Options tab.
c. Select the cable type to be tested from the drop--down list
next to Type:. See Figure 3--10.
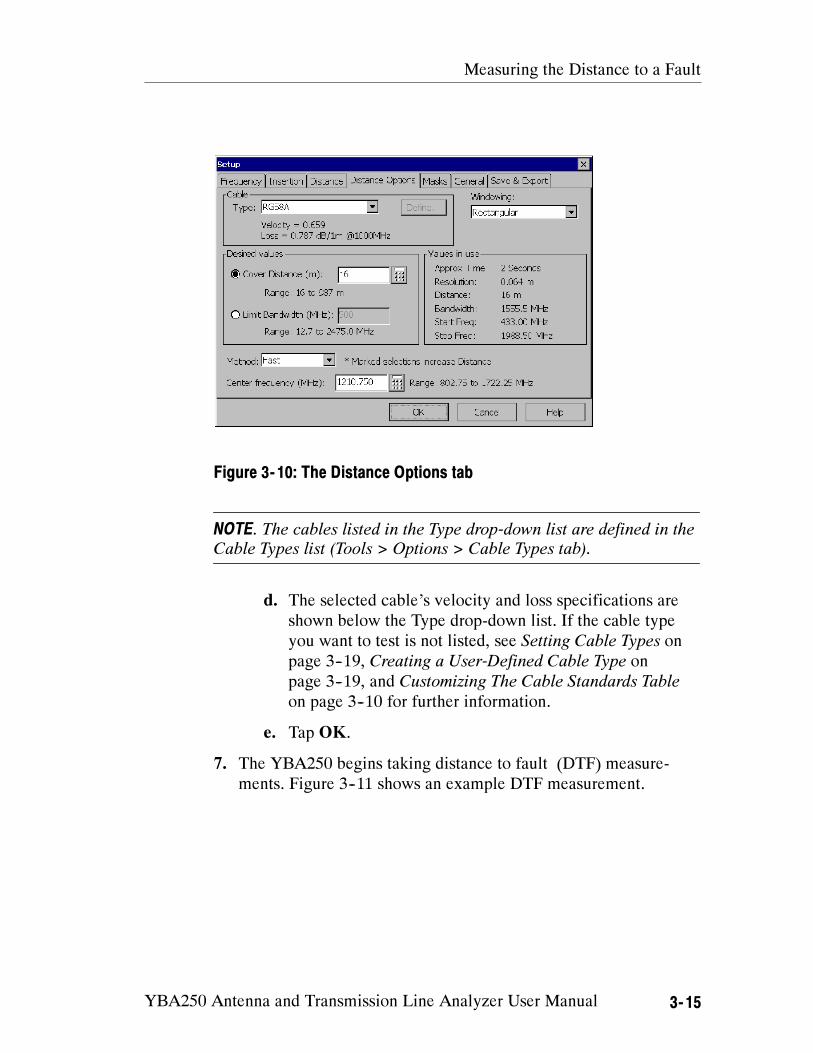
Measuring the Distance to a Fault
YBA250 Antenna and Transmission Line Analyzer User Manual 3- 15
Figure 3- 10: The Distance Options tab
NOTE. The cables listed in the Type drop-down list are defined in the
Cable Types list (Tools > Options > Cable Types tab).
d. The selected cable’s velocity and loss specifications are
shown below the Type drop-down list. If the cable type
you want to test is not listed, see Setting Cable Types on
page 3--19, Creating a User-Defined Cable Type on
page 3--19, and Customizing The Cable Standards Table
on page 3--10 for further information.
e. Tap OK.
7. The YBA250 begins taking distance to fault (DTF) measure-
ments. Figure 3--11 shows an example DTF measurement.
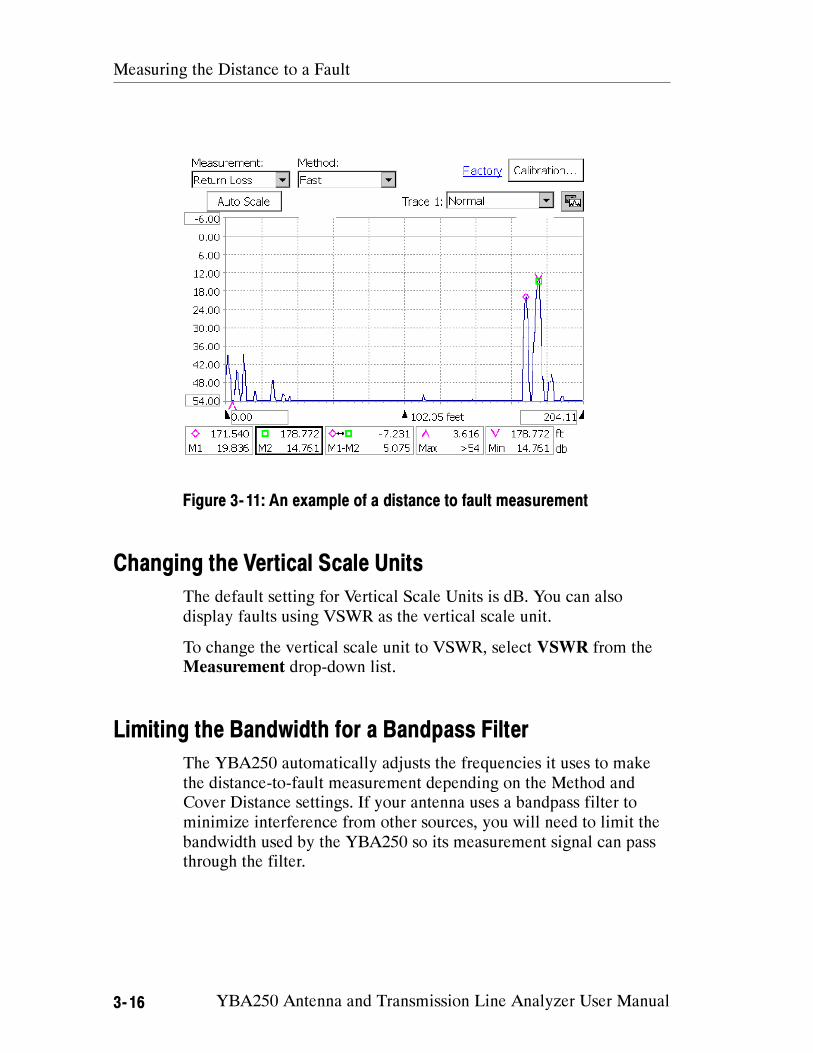
Measuring the Distance to a Fault
3- 16 YBA250 Antenna and Transmission Line Analyzer User Manual
Figure 3- 11: An example of a distance to fault measurement
Changing the Vertical Scale Units
The default setting for Vertical Scale Units is dB. You can also
display faults using VSWR as the vertical scale unit.
To change the vertical scale unit to VSWR, select VSWR from the
Measurement drop-down list.
Limiting the Bandwidth for a Bandpass Filter
The YBA250 automatically adjusts the frequencies it uses to make
the distance-to-fault measurement depending on the Method and
Cover Distance settings. If your antenna uses a bandpass filter to
minimize interference from other sources, you will need to limit the
bandwidth used by the YBA250 so its measurement signal can pass
through the filter.

Measuring the Distance to a Fault
YBA250 Antenna and Transmission Line Analyzer User Manual 3- 17
To set the bandwidth for the distance-to-fault measurement:
1. Tap the Edit button. This displays the Setup window.
2. Tap the Distance Options tab. See Figure 3--10.
3. Select the Limit Bandwidth option button.
4. Tap the numeric keypad next to the Limit Bandwidth box.
5. Enter the bandwidth of the filter.
6. Tap the numeric keypad next to the Center frequency box.
7. Enter the center frequency of the bandpass filter.
8. Tap OK to save your changes.
Note that values in the Values in use box will change as you change
values for the Limit Bandwidth or the Center Frequency. Most
importantly, by limiting the range of frequencies available for the
distance to fault measurement, the maximum distance that can be
measured will be limited. The exact distance will depend on the
Limit Bandwidth and method selected.
Setting Cable Types
It is essential to specify the cable type being tested to achieve
accurate measurements. It is impossible to determine the true
distance to a fault if the wrong cable type (propagation velocity and
loss) is specified.
To select the cable types you will be testing:
1. Select Tools > Options menu item.
2. Tap the Cable Types tab to display the Cable Types window, as
shown in Figure 3--12.
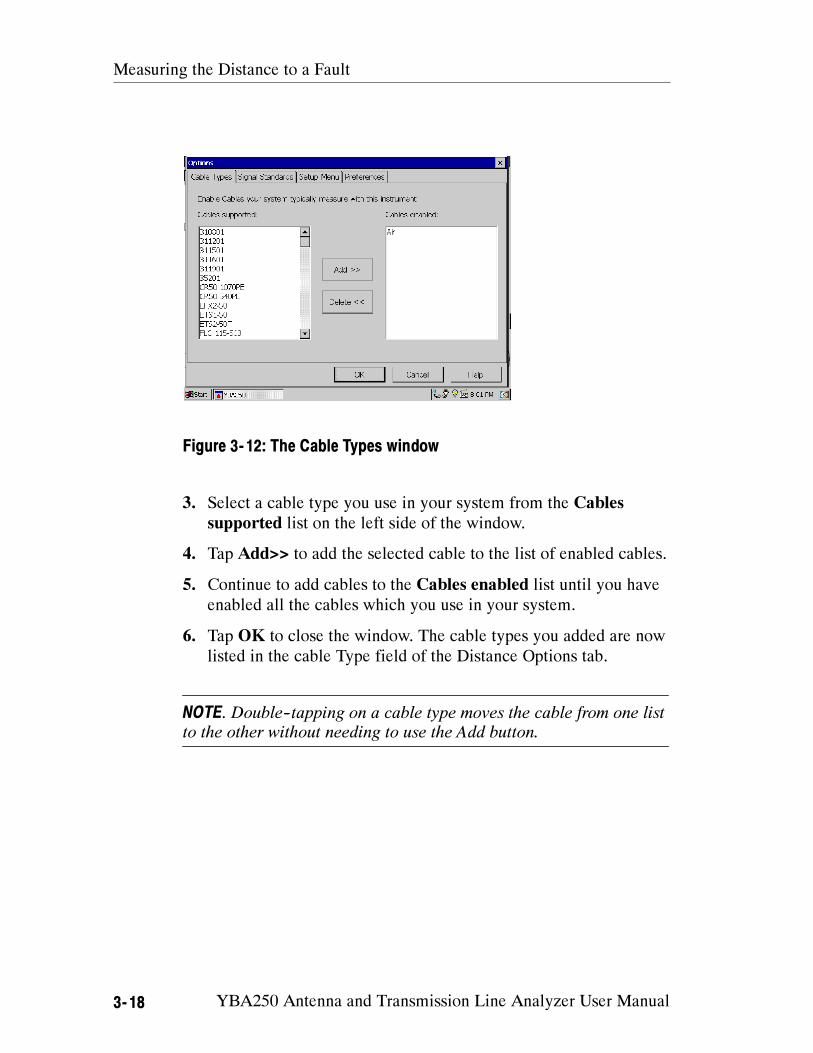
Measuring the Distance to a Fault
3- 18 YBA250 Antenna and Transmission Line Analyzer User Manual
Figure 3- 12: The Cable Types window
3. Select a cable type you use in your system from the Cables
supported list on the left side of the window.
4. Tap Add>> to add the selected cable to the list of enabled cables.
5. Continue to add cables to the Cables enabled list until you have
enabled all the cables which you use in your system.
6. Tap OK to close the window. The cable types you added are now
listed in the cable Type field of the Distance Options tab.
NOTE. Double--tapping on a cable type moves the cable from one list
to the other without needing to use the Add button.
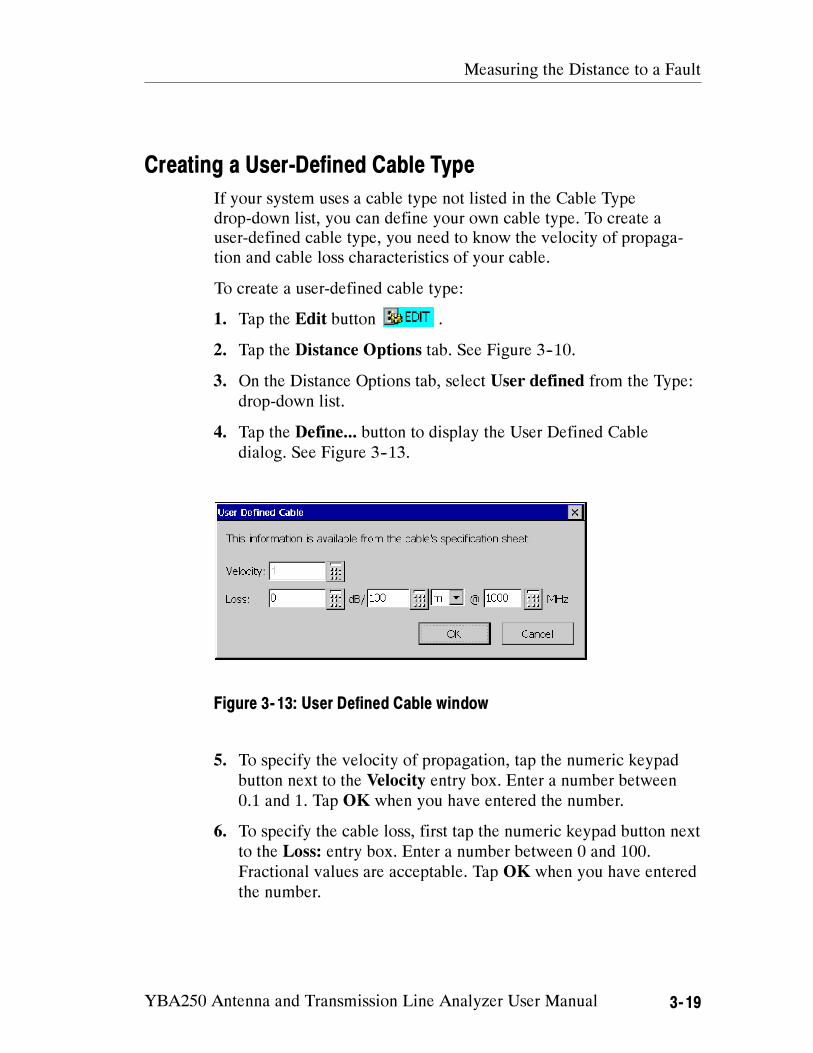
Measuring the Distance to a Fault
YBA250 Antenna and Transmission Line Analyzer User Manual 3- 19
Creating a User-Defined Cable Type
If your system uses a cable type not listed in the Cable Type
drop-down list, you can define your own cable type. To create a
user-defined cable type, you need to know the velocity of propaga-
tion and cable loss characteristics of your cable.
To create a user-defined cable type:
1. Tap the Edit button .
2. Tap the Distance Options tab. See Figure 3--10.
3. On the Distance Options tab, select User defined from the Type:
drop-down list.
4. Tap the Define... button to display the User Defined Cable
dialog. See Figure 3--13.
Figure 3- 13: User Defined Cable window
5. To specify the velocity of propagation, tap the numeric keypad
button next to the Velocity entry box. Enter a number between
0.1 and 1. Tap OK when you have entered the number.
6. To specify the cable loss, first tap the numeric keypad button next
to the Loss: entry box. Enter a number between 0 and 100.
Fractional values are acceptable. Tap OK when you have entered
the number.
Measuring the Distance to a Fault
3- 20 YBA250 Antenna and Transmission Line Analyzer User Manual
7. To specify the distance at which the cable loss is specified, tap
the numeric keypad button to the right of “dB/”. Enter a number
for the distance. Tap OK when you have entered the number.
8. Tap the drop-down list (there is only one) to specify the unit
distance, either ft (feet) or m (meters).
9. To specify the frequency at which the cable loss is specified, tap
the numeric keypad button next to MHz. Enter a number
between 1 and 10000. Tap OK when you have entered the
number.
10.Tap OK when you have entered all the necessary numbers. These
values are assigned to the User defined cable type in the list.
The specifications you entered for your cable type are shown below
the Type drop-down list. These are the values that are used for
distance to fault measurements when you select User defined.
Customizing the Cable Standards Table
The Cable Standards Table is a plain text file used by the YBA250 to
specify the characteristics of the cable types that are tested. You can
customize the Cable Standards Table to suit the specific needs of
your system. For example, if there are cable types in your system
that are not included in the default list of cable types, you could add
them to the cable standards table. This allows you to select your
cable types from the Type drop-down list whenever you want to
make a distance to fault measurement. You can also shorten the Type
drop-down list by deleting cables from the cable standards list if you
never test those cable types.
The YBA250 looks for a file named CableStandards.txt in the
\BuiltInDisk\NetTekApps\YBA250 folder when it starts up. You can
edit this file to include cable types not originally included in the file
from the factory.

Measuring the Distance to a Fault
YBA250 Antenna and Transmission Line Analyzer User Manual 3- 21
Customizing the Cable Standards Table
To customize the cable standards table:
1. Locate the existing CableStandards.txt file in either the
\BuiltInDisk\NetTekApps\YBA250 folder or
\NetTekApps\YBA250 folder (only if the application software
loaded into volatile memory instead of flash memory).
2. Make a copy of the original file and store the copy in another
location within the BuiltInDisk folder as a backup.
3. Use Pocket Word to edit the contents of the file to suit your
systems settings. When saving the file, be certain to save the file
as a TEXT file (txt), not as a Pocket Word file (pwd).
When editing your CableStandards.txt file, it is more reliable to copy
a row and then edit the copied row to meet your requirements than to
modify an existing row.
Table 3--1 lists the elements of the CableStandards.txt file.
Table 3- 1: Channel table file contents
Column heading Description
Cable ID An identification number assigned to the
cable.
Cable Name This is the name of the cable that appears in
the Type drop-down list.
Velocity The cable’s velocity of propagation.
Loss The loss of the cable per the loss distance,
in dB.
Loss Distance The distance over which the cable loss is
specified.
Loss Frequency The frequency at which the cable loss is
specified.
Metric T/F Indicates whether the Loss distance is
metric on not. If True, the loss distance is in
meters.
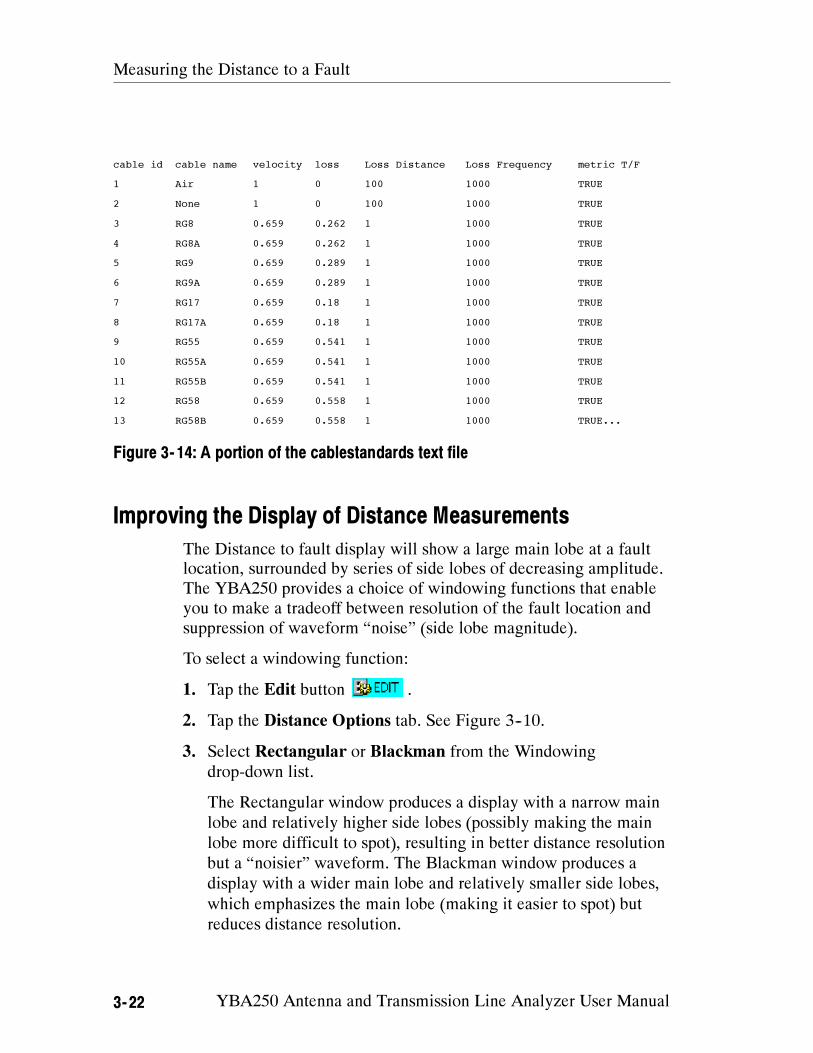
Measuring the Distance to a Fault
3- 22 YBA250 Antenna and Transmission Line Analyzer User Manual
cable id cable name velocity loss Loss Distance Loss Frequency metric T/F
1 Air 1 0 100 1000 TRUE
2 None 1 0 100 1000 TRUE
3 RG8 0.659 0.262 1 1000 TRUE
4 RG8A 0.659 0.262 1 1000 TRUE
5 RG9 0.659 0.289 1 1000 TRUE
6 RG9A 0.659 0.289 1 1000 TRUE
7 RG17 0.659 0.18 1 1000 TRUE
8 RG17A 0.659 0.18 1 1000 TRUE
9 RG55 0.659 0.541 1 1000 TRUE
10 RG55A 0.659 0.541 1 1000 TRUE
11 RG55B 0.659 0.541 1 1000 TRUE
12 RG58 0.659 0.558 1 1000 TRUE
13 RG58B 0.659 0.558 1 1000 TRUE...
Figure 3- 14: A portion of the cablestandards text file
Improving the Display of Distance Measurements
The Distance to fault display will show a large main lobe at a fault
location, surrounded by series of side lobes of decreasing amplitude.
The YBA250 provides a choice of windowing functions that enable
you to make a tradeoff between resolution of the fault location and
suppression of waveform “noise” (side lobe magnitude).
To select a windowing function:
1. Tap the Edit button .
2. Tap the Distance Options tab. See Figure 3--10.
3. Select Rectangular or Blackman from the Windowing
drop-down list.
The Rectangular window produces a display with a narrow main
lobe and relatively higher side lobes (possibly making the main
lobe more difficult to spot), resulting in better distance resolution
but a “noisier” waveform. The Blackman window produces a
display with a wider main lobe and relatively smaller side lobes,
which emphasizes the main lobe (making it easier to spot) but
reduces distance resolution.
Measuring the Distance to a Fault
YBA250 Antenna and Transmission Line Analyzer User Manual 3- 23
Resolution of Distance to Fault Measurement
The resolution (distance between data points) shown in the Distance
display is based on several interacting factors. Resolution is
important because it limits how accurately you can locate a fault.
The resolution varies with the Method, the bandwidth used, and the
maximum distance setting.
The maximum distance, bandwidth, and Method settings can be
changed. Normally, the only settings you need to adjust are the
maximum distance and the Method. However, if your antenna has a
bandpass filter installed, you will need to limit the bandwidth on the
YBA250 to make correct distance-to-fault measurements. Limiting
the bandwidth used by the YBA250 may limit the distance and
resolution of the measurement.
To increase the resolution:
1. Tap the Edit button.
2. Tap the Distance Options tab. See Figure 3--10.
3. Tap the Cover Distance option button if it is not selected.
4. Tap the numeric keypad next to the Cover Distance box.
5. Enter the distance from the receiver to the antenna.
Review the displayed value for Resolution in the Values in use box.
Note that as you shorten the Cover Distance sufficiently (without
changing the Method), the Resolution will improve, that is, the
distance between data points will shorten. When you change the
method to Normal or High Resolution (without changing the Cover
Distance), the Approx Time will increase as will the Resolution.

Measuring the Distance to a Fault
3- 24 YBA250 Antenna and Transmission Line Analyzer User Manual

YBA250 Antenna and Transmission Line Analyzer User Manual 3- 25
Measuring Insertion Gain and Loss
The YBA250 can quickly and easily take two-port insertion gain and
loss measurements. Two--port measurements, also known as
transmission measurements, provide insertion gain and loss
measurements by using two test ports; a signal source (the YBA250
module) and a signal receiver (the YBT250 module). Results are
displayed as a graph (level versus frequency) and a single numeric
readout that shows the average gain or loss value over the specified
frequency span.
Insertion gain measures the gain (in dB) of active devices such as
tower-mounted amplifiers (TMA), repeaters, and boosters. Active
devices may be integrated with other components, including filters,
duplexers, splitters, and combiners. You can also measure the
insertion gain of an entire RF path that includes amplifiers and
passive devices. Insertion loss measures the loss (in dB) of active
devices such as filters, duplexers, splitters, combiners, as well as
passive components such as cable.
Two--port insertion gain and loss measurements are best for
measuring signal paths that contain active, wide--dynamic--range
components, such as circulators, filters, tower mounted amplifiers
(TMA), and directional couplers. Two--port loss measurements are
more accurate than one--port measurements.
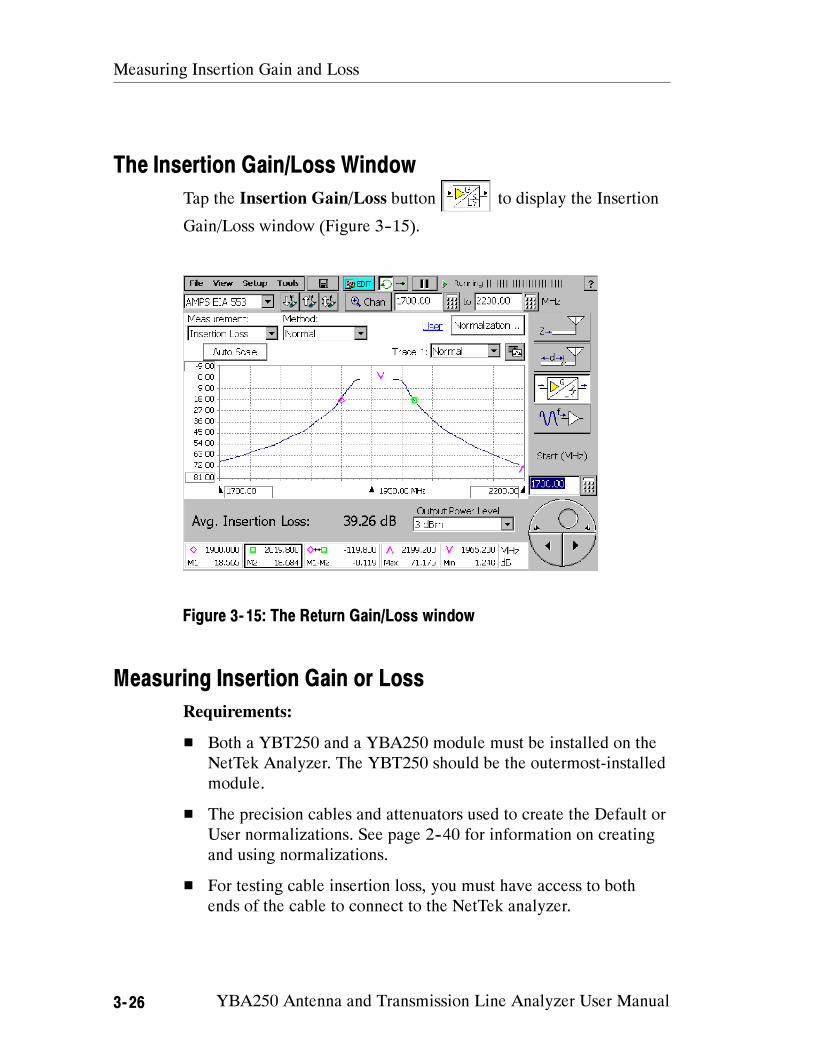
Measuring Insertion Gain and Loss
3- 26 YBA250 Antenna and Transmission Line Analyzer User Manual
The Insertion Gain/Loss Window
Tap the Insertion Gain/Loss button to display the Insertion
Gain/Loss window (Figure 3--15).
Figure 3- 15: The Return Gain/Loss window
Measuring Insertion Gain or Loss
Requirements:
Both a YBT250 and a YBA250 module must be installed on the
NetTek Analyzer. The YBT250 should be the outermost-installed
module.
The precision cables and attenuators used to create the Default or
User normalizations. See page 2--40 for information on creating
and using normalizations.
For testing cable insertion loss, you must have access to both
ends of the cable to connect to the NetTek analyzer.
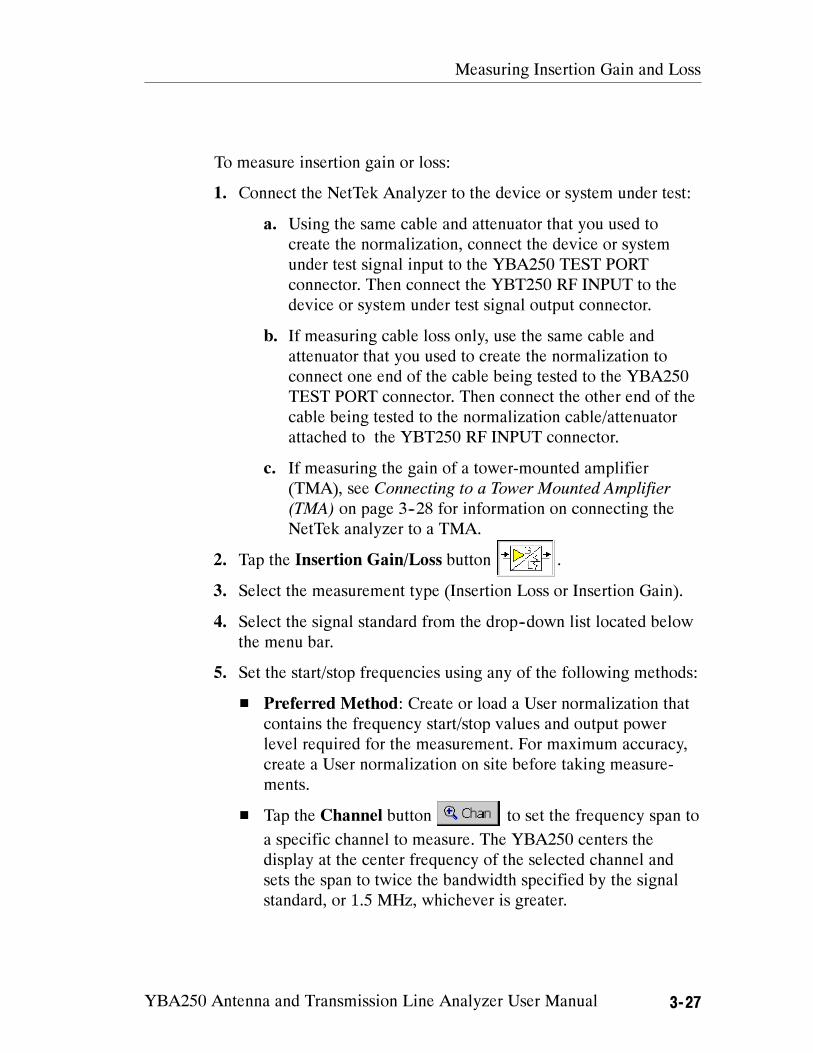
Measuring Insertion Gain and Loss
YBA250 Antenna and Transmission Line Analyzer User Manual 3- 27
To measure insertion gain or loss:
1. Connect the NetTek Analyzer to the device or system under test:
a. Using the same cable and attenuator that you used to
create the normalization, connect the device or system
under test signal input to the YBA250 TEST PORT
connector. Then connect the YBT250 RF INPUT to the
device or system under test signal output connector.
b. If measuring cable loss only, use the same cable and
attenuator that you used to create the normalization to
connect one end of the cable being tested to the YBA250
TEST PORT connector. Then connect the other end of the
cable being tested to the normalization cable/attenuator
attached to the YBT250 RF INPUT connector.
c. If measuring the gain of a tower-mounted amplifier
(TMA), see Connecting to a Tower Mounted Amplifier
(TMA) on page 3--28 for information on connecting the
NetTek analyzer to a TMA.
2. Tap the Insertion Gain/Loss button .
3. Select the measurement type (Insertion Loss or Insertion Gain).
4. Select the signal standard from the drop--down list located below
the menu bar.
5. Set the start/stop frequencies using any of the following methods:
Preferred Method: Create or load a User normalization that
contains the frequency start/stop values and output power
level required for the measurement. For maximum accuracy,
create a User normalization on site before taking measure-
ments.
Tap the Channel button to set the frequency span to
a specific channel to measure. The YBA250 centers the
display at the center frequency of the selected channel and
sets the span to twice the bandwidth specified by the signal
standard, or 1.5 MHz, whichever is greater.
Measuring Insertion Gain and Loss
3- 28 YBA250 Antenna and Transmission Line Analyzer User Manual
If a Forward, Reverse, or Both button is selected, the
associated band information is taken into account when the
Start and Stop frequencies are set. After you have selected a
channel, tap OK.
Enter the Start and Stop frequencies in the frequency fields
adjacent to the Channel button by using the numeric keypad
icons or the knob.
Tap either the Forward or Reverse button to
measure across just the forward or reverse bands. To measure
across both the Forward and Reverse bands, tap the Both
button.
6. Select the signal power output level from the Power Output
Level: list.
7. Set the measurement mode to either Single measurement or
Continuous measurement .
8. If necessary, tap the Play button to start taking measurements.
NOTE. Continuous measurements consume more battery power than
single-shot measurements. To extend battery-based operation, use
single-shot mode whenever possible.
Connecting to a Tower Mounted Amplifier (TMA)
CAUTION. Please check your country’s laws regarding transmitters
before using the NetTek Analyzer to transmit a test signal.
To connect the NetTek Analyzer to a TMA to perform insertion gain
or loss measurements, perform the following procedure:
Measuring Insertion Gain and Loss
YBA250 Antenna and Transmission Line Analyzer User Manual 3- 29
Requirements:
A Bias Tee connector.
A Bias Tee power supply.
The same precision cables and attenuators used to create the
Default and/or User normalization.
NOTE. Bias tees designed for TMAs often contain 1/4--wave shorting
stubs and gas discharge tubes for protection. These protection
circuits can affect the accuracy of the measurement and can cause
peaks and dips in the waveform. Use a wideband bias tee without
protection circuits (such as Tektronix part number 015-0718-00) to
avoid or reduce this problem.
1. Connect the YBA250 TEST PORT to the TMA Antenna input
port, using the same cable and attenuator used to create the
normalization.
2. Connect the Bias Tee to the attenuator on the YBT250 RF
INPUT. Use the same attenuator used to create the normalization.
3. Connect the Bias Tee to the BTS connector on the TMA using
the same cable used to create the normalization.
4. Connect the Bias Tee power supply to the Bias Tee.
TMA Bias Tee Connection Notes:
Check that the bias tee power supply voltage and polarity rating
are compatible with the TMA before applying power.
Create a User normalization with the bias tee attached before
taking measurements, unless you want to include the loss of the
bias tee in the measurement.
You do not need to turn on the bias tee power supply to create the
User normalization.
Measuring Insertion Gain and Loss
3- 30 YBA250 Antenna and Transmission Line Analyzer User Manual
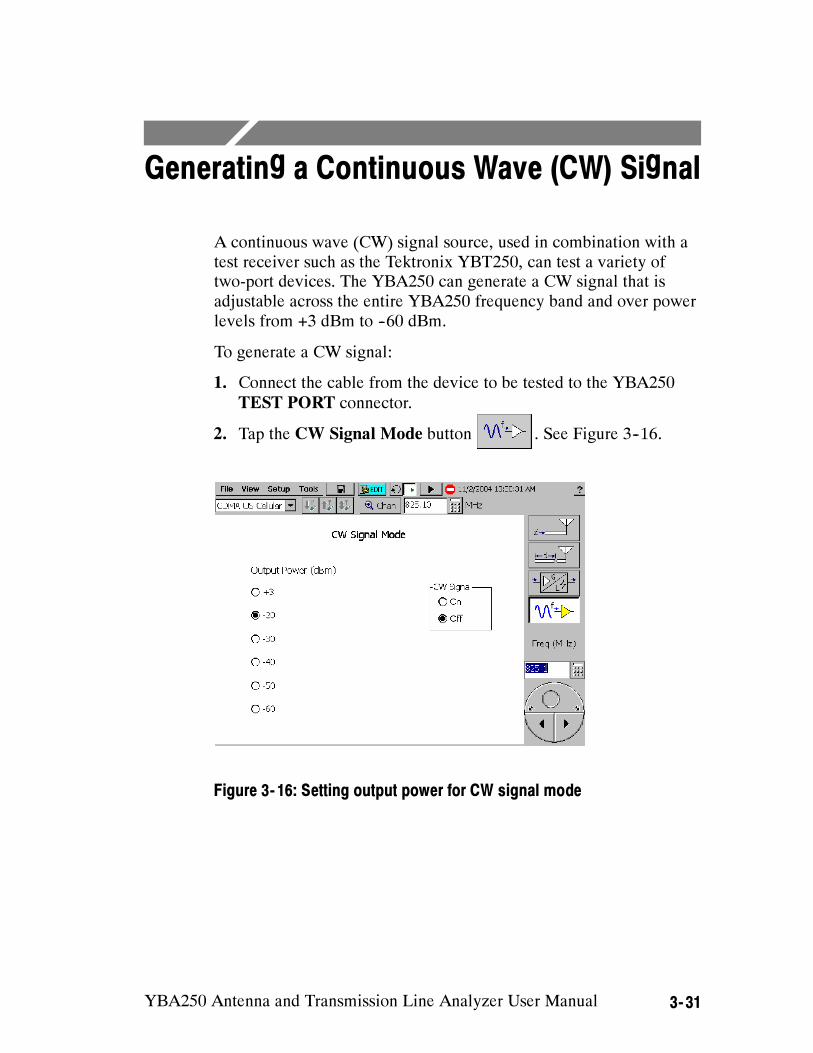
YBA250 Antenna and Transmission Line Analyzer User Manual 3- 31
Generating a Continuous Wave (CW) Signal
A continuous wave (CW) signal source, used in combination with a
test receiver such as the Tektronix YBT250, can test a variety of
two-port devices. The YBA250 can generate a CW signal that is
adjustable across the entire YBA250 frequency band and over power
levels from +3 dBm to --60 dBm.
To generate a CW signal:
1. Connect the cable from the device to be tested to the YBA250
TEST PORT connector.
2. Tap the CW Signal Mode button . See Figure 3--16.
Figure 3- 16: Setting output power for CW signal mode
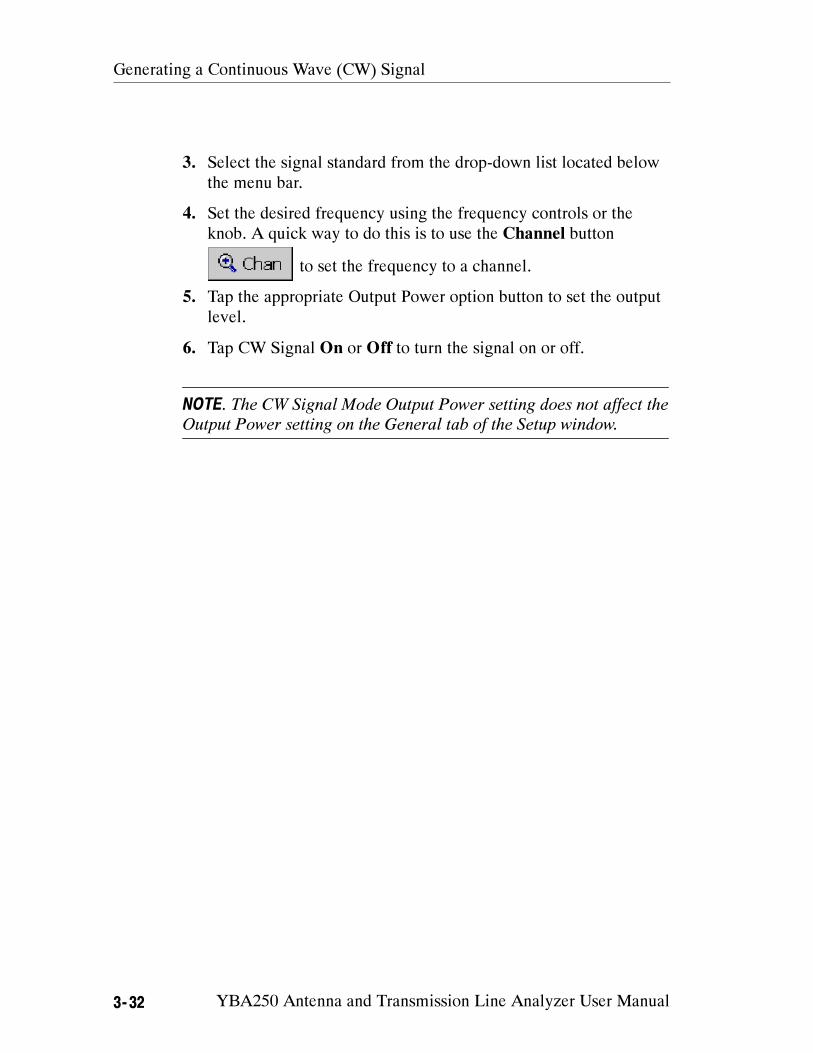
Generating a Continuous Wave (CW) Signal
3- 32 YBA250 Antenna and Transmission Line Analyzer User Manual
3. Select the signal standard from the drop-down list located below
the menu bar.
4. Set the desired frequency using the frequency controls or the
knob. A quick way to do this is to use the Channel button
to set the frequency to a channel.
5. Tap the appropriate Output Power option button to set the output
level.
6. Tap CW Signal On or Off to turn the signal on or off.
NOTE. The CW Signal Mode Output Power setting does not affect the
Output Power setting on the General tab of the Setup window.
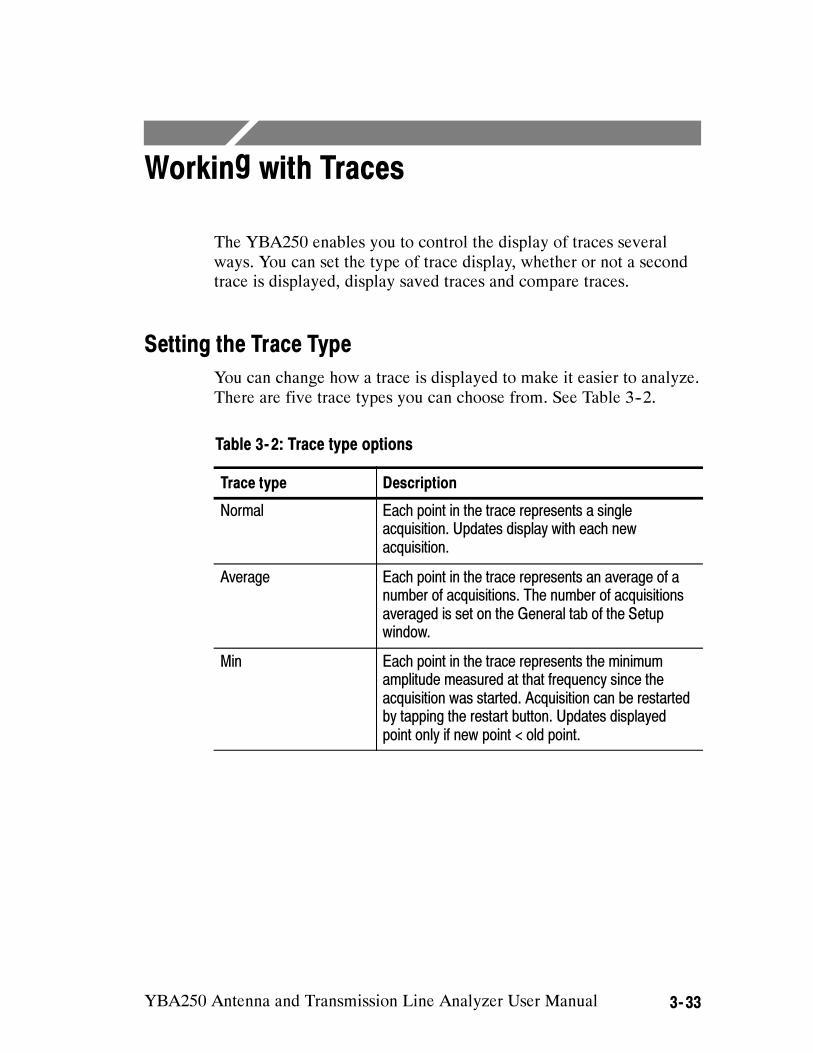
YBA250 Antenna and Transmission Line Analyzer User Manual 3- 33
Working with Traces
The YBA250 enables you to control the display of traces several
ways. You can set the type of trace display, whether or not a second
trace is displayed, display saved traces and compare traces.
Setting the Trace Type
You can change how a trace is displayed to make it easier to analyze.
There are five trace types you can choose from. See Table 3--2.
Table 3- 2: Trace type options
Trace type Description
Normal Each point in the trace represents a single
acquisition. Updates display with each new
acquisition.
Average Each point in the trace represents an average of a
number of acquisitions. The number of acquisitions
averaged is set on the General tab of the Setup
window.
Min Each point in the trace represents the minimum
amplitude measured at that frequency since the
acquisition was started. Acquisition can be restarted
by tapping the restart button. Updates displayed
point only if new point < old point.
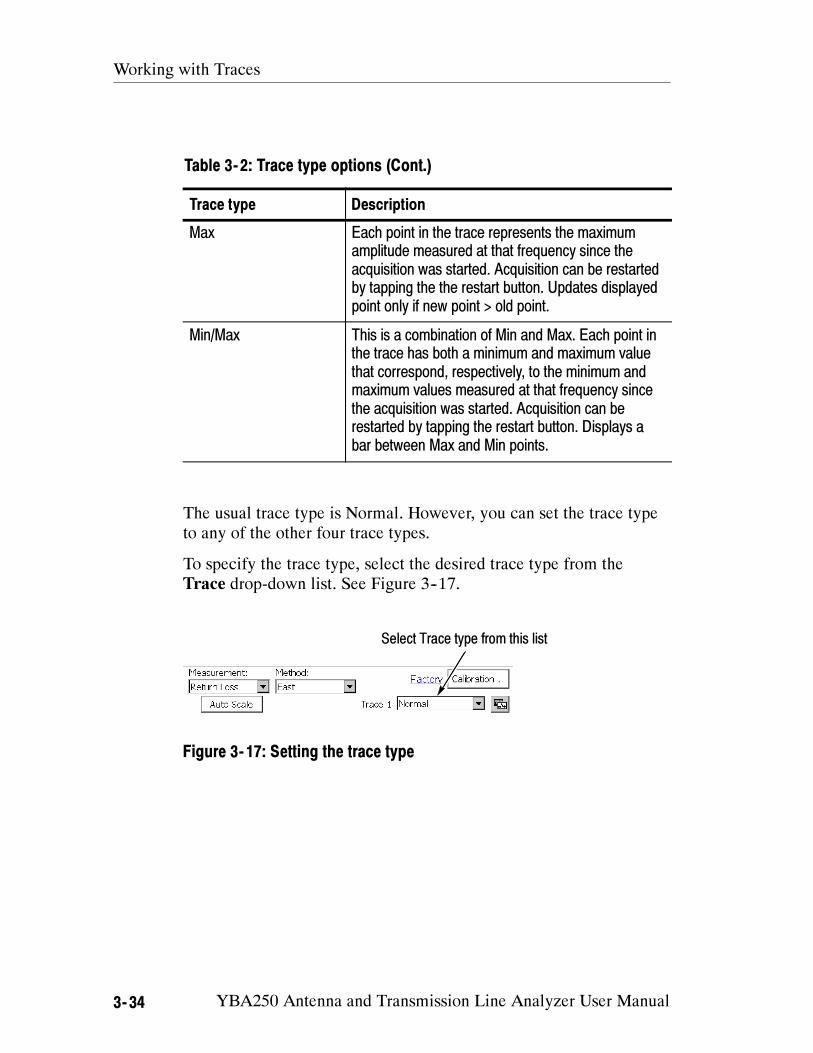
Working with Traces
3- 34 YBA250 Antenna and Transmission Line Analyzer User Manual
Table 3- 2: Trace type options (Cont.)
Trace type Description
Max Each point in the trace represents the maximum
amplitude measured at that frequency since the
acquisition was started. Acquisition can be restarted
by tapping the the restart button. Updates displayed
point only if new point > old point.
Min/Max This is a combination of Min and Max. Each point in
the trace has both a minimum and maximum value
that correspond, respectively, to the minimum and
maximum values measured at that frequency since
the acquisition was started. Acquisition can be
restarted by tapping the restart button. Displays a
bar between Max and Min points.
The usual trace type is Normal. However, you can set the trace type
to any of the other four trace types.
To specify the trace type, select the desired trace type from the
Trace drop-down list. See Figure 3--17.
Select Trace type from this list
Figure 3- 17: Setting the trace type
Working with Traces
YBA250 Antenna and Transmission Line Analyzer User Manual 3- 35
You can also set the trace type in the Setup window:
1. Select Setup > Edit.
2. Tap the appropriate tab to set the trace type for a particular
measurement:
a. Tap the Frequency tab to set the trace type for Return
Loss measurements
b. Tap the Insertion tab to set the trace type for the Insertion
Gain/Loss measurements.
c. Tap the Distance tab to set the trace type for Distance to
Fault measurements.
3. Select the desired trace type from the drop--down list.
If you select Average, you can also set the number of traces
averaged together to create the trace display. The default number
of averages is 10. This number applies to both Trace 1 and 2.
a. To set the number of averages, tap the General tab. Then
tap the keypad next to Number of Averages.
b. Enter the number of traces to average and then tap OK.
4. Tap OK to save your changes.
Changing the Units of the Distance to Fault Display
The units of distance in the Distance to Fault display can be set to
either feet or meters.
To change the distance units of the Distance to Fault display:
1. Tap the Edit button or select Setup > Edit.
2. Tap the General tab. See Figure 3--18.

Working with Traces
3- 36 YBA250 Antenna and Transmission Line Analyzer User Manual
Figure 3- 18: Setting the distance units
3. Change the distance units by tapping the appropriate Distance
Units option button.
Saving Results
You can save a trace for later recall. For example, you can save an
example of a good trace for comparison with a live trace later.
To save a trace with an automatically generated filename:
Select File > Save Results.
Traces are saved in the \BuiltInDisk\YBA250\AppData\Results
directory by default, but that can be changed for future save
operations by selecting a different path in the Save Results As
window. Remember that only traces saved within the BuiltInDisk
folder (or removable storage such as a PC memory card) are stored
in non-volatile memory. Traces saved outside the BuiltInDisk folder
are lost when the NetTek Analyzer Platform is shutdown.
Working with Traces
YBA250 Antenna and Transmission Line Analyzer User Manual 3- 37
To save a trace with a name and location you specify:
1. Select File > Save Results As.... The Save As dialog box
appears.
2. Enter a name and location for the file and tap OK.
NOTE. Traces are saved with the settings in effect at the time the
trace is saved.
Displaying a Saved Trace
You can display a previously saved trace for review or comparison
with another trace.
To display a saved trace:
1. Select File > Open. The Open dialog box appears.
2. Locate the saved trace, tap the name of the trace and then tap
OK.
NOTE. Traces are saved with the settings in effect at the time the
trace is saved. When a saved trace is displayed, the stored settings
values will be shown for reference, though no actual instrument
settings will change. As soon as you press to return to making
new acquisitions, the settings will be restored to what they were
before the saved trace was opened.
Working with Traces
3- 38 YBA250 Antenna and Transmission Line Analyzer User Manual
Comparing Traces
The YBA250 enables you to compare traces two ways. The first
allows you to compare a live trace to a reference trace. The second
way compares two saved traces.
Comparing a Live Trace to a Reference Trace
The YBA250 provides the ability for you to visually compare the
current live trace against a reference trace. The reference trace,
called Trace 2, can be another current trace or a saved trace.
To display a second trace:
Select View >Trace 2.
or
Tap the Rotate Traces icon .
If Trace 2 is not enabled, selecting the Rotate Trace icon enables the
Trace 2 display.
Defining Trace 2
Trace 2 can be a live trace (for example, an averaged display of the
latest acquisitions) or a saved trace.
To define Trace 2:
1. Select View >Define Trace 2.... The Setup window appears when
you select the Frequency, Distance, or Insertion tab. See
Figure 3--19.
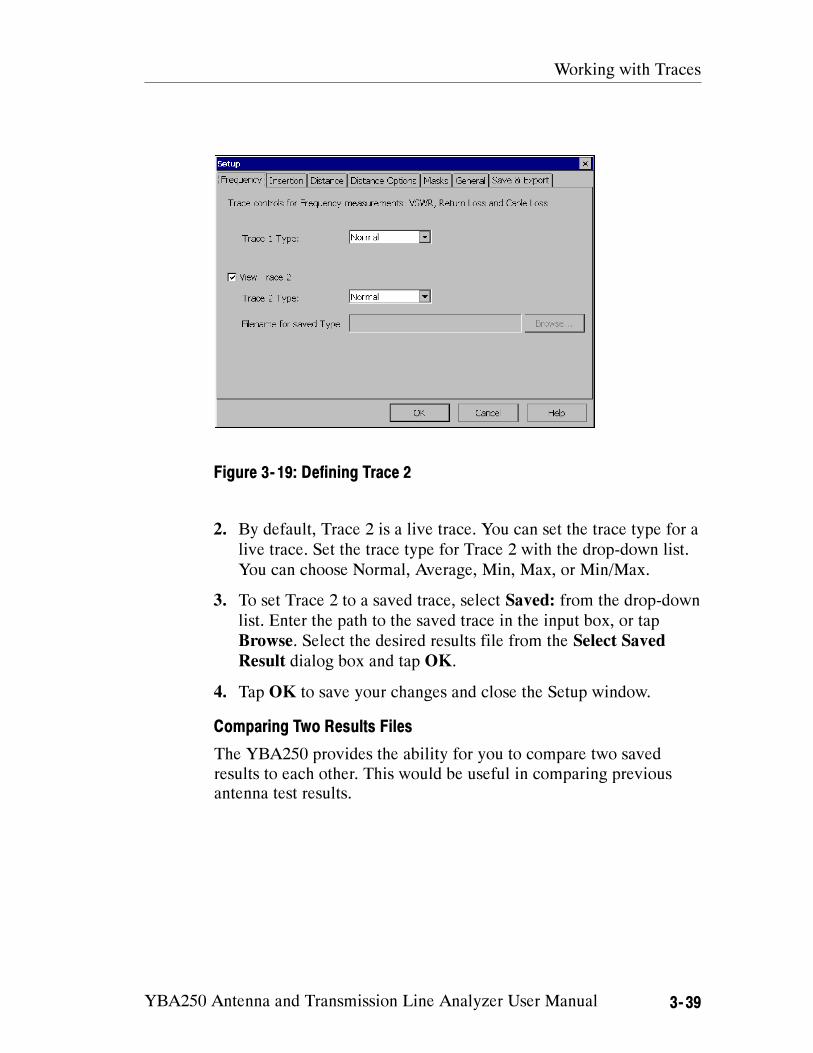
Working with Traces
YBA250 Antenna and Transmission Line Analyzer User Manual 3- 39
Figure 3- 19: Defining Trace 2
2. By default, Trace 2 is a live trace. You can set the trace type for a
live trace. Set the trace type for Trace 2 with the drop-down list.
You can choose Normal, Average, Min, Max, or Min/Max.
3. To set Trace 2 to a saved trace, select Saved: from the drop-down
list. Enter the path to the saved trace in the input box, or tap
Browse. Select the desired results file from the Select Saved
Result dialog box and tap OK.
4. Tap OK to save your changes and close the Setup window.
Comparing Two Results Files
The YBA250 provides the ability for you to compare two saved
results to each other. This would be useful in comparing previous
antenna test results.
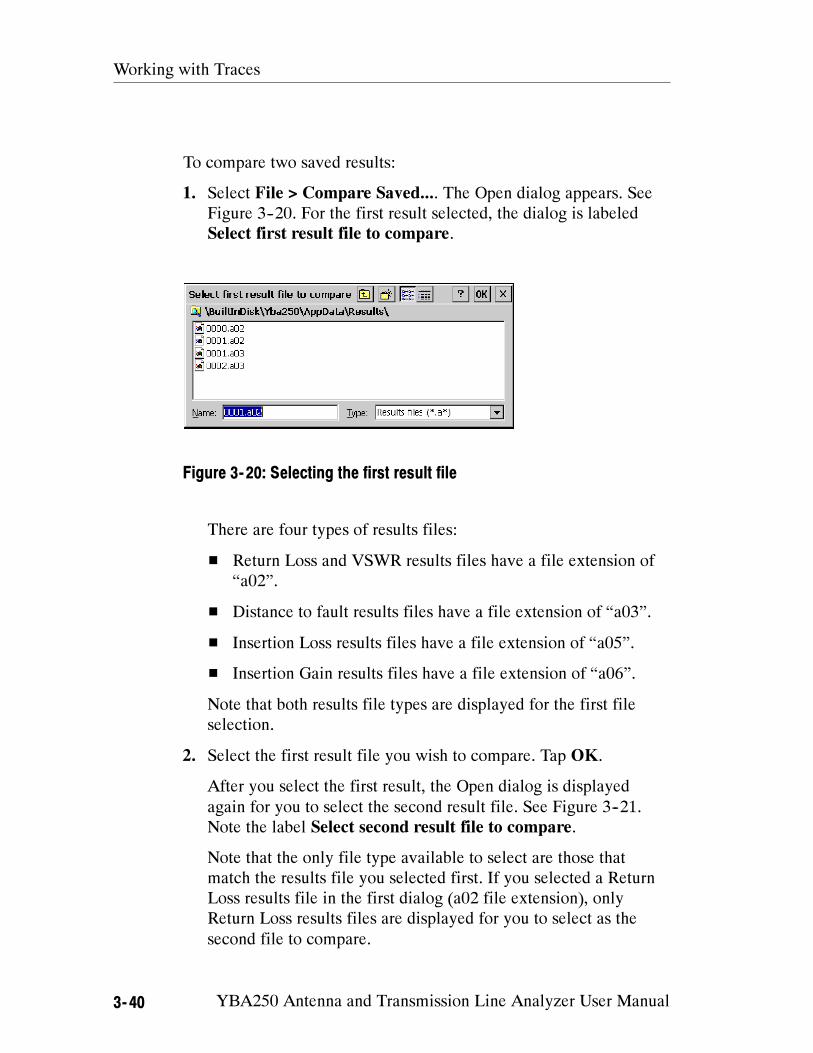
Working with Traces
3- 40 YBA250 Antenna and Transmission Line Analyzer User Manual
To compare two saved results:
1. Select File > Compare Saved.... The Open dialog appears. See
Figure 3--20. For the first result selected, the dialog is labeled
Select first result file to compare.
Figure 3- 20: Selecting the first result file
There are four types of results files:
Return Loss and VSWR results files have a file extension of
“a02”.
Distance to fault results files have a file extension of “a03”.
Insertion Loss results files have a file extension of “a05”.
Insertion Gain results files have a file extension of “a06”.
Note that both results file types are displayed for the first file
selection.
2. Select the first result file you wish to compare. Tap OK.
After you select the first result, the Open dialog is displayed
again for you to select the second result file. See Figure 3--21.
Note the label Select second result file to compare.
Note that the only file type available to select are those that
match the results file you selected first. If you selected a Return
Loss results file in the first dialog (a02 file extension), only
Return Loss results files are displayed for you to select as the
second file to compare.

Working with Traces
YBA250 Antenna and Transmission Line Analyzer User Manual 3- 41
Figure 3- 21: Selecting the second result file
Once you have selected both traces, they are displayed. The two
traces are displayed in different colors so that they are easier to
compare. See Figure 3--22. You can use markers on the saved
traces to compare points on the traces.
Figure 3- 22: Two compared traces
Working with Traces
3- 42 YBA250 Antenna and Transmission Line Analyzer User Manual
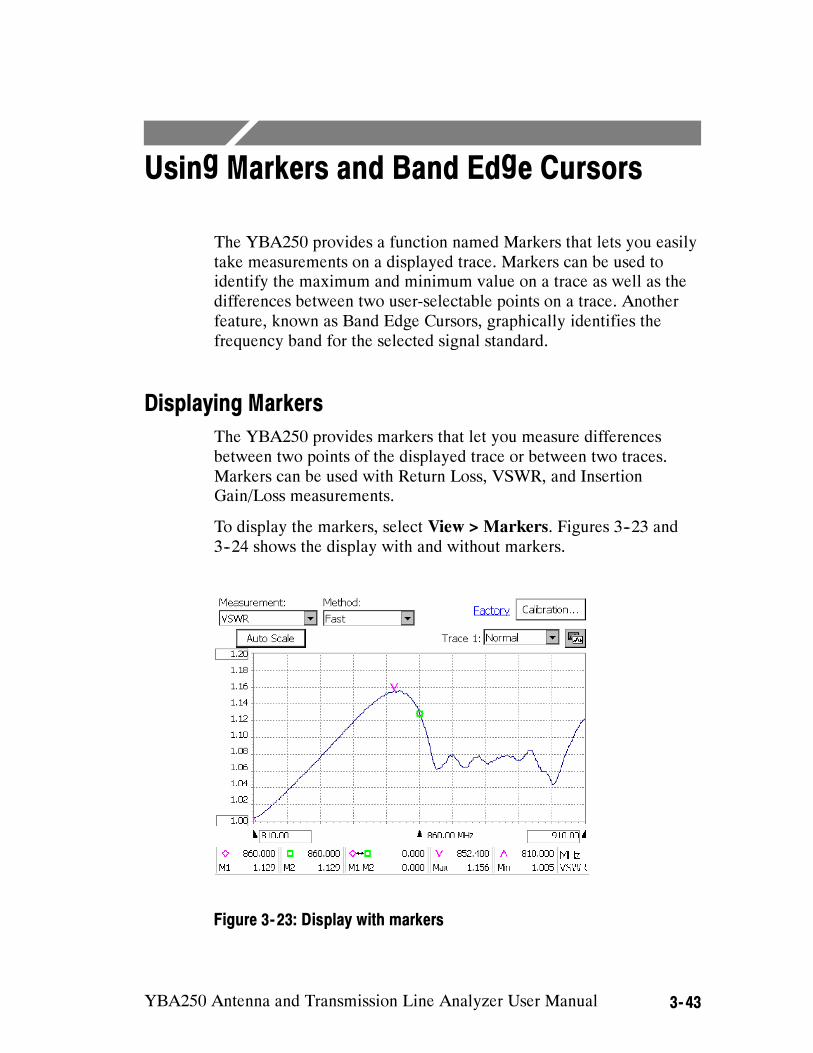
YBA250 Antenna and Transmission Line Analyzer User Manual 3- 43
Using Markers and Band Edge Cursors
The YBA250 provides a function named Markers that lets you easily
take measurements on a displayed trace. Markers can be used to
identify the maximum and minimum value on a trace as well as the
differences between two user-selectable points on a trace. Another
feature, known as Band Edge Cursors, graphically identifies the
frequency band for the selected signal standard.
Displaying Markers
The YBA250 provides markers that let you measure differences
between two points of the displayed trace or between two traces.
Markers can be used with Return Loss, VSWR, and Insertion
Gain/Loss measurements.
To display the markers, select View > Markers. Figures 3--23 and
3--24 shows the display with and without markers.
Figure 3- 23: Display with markers
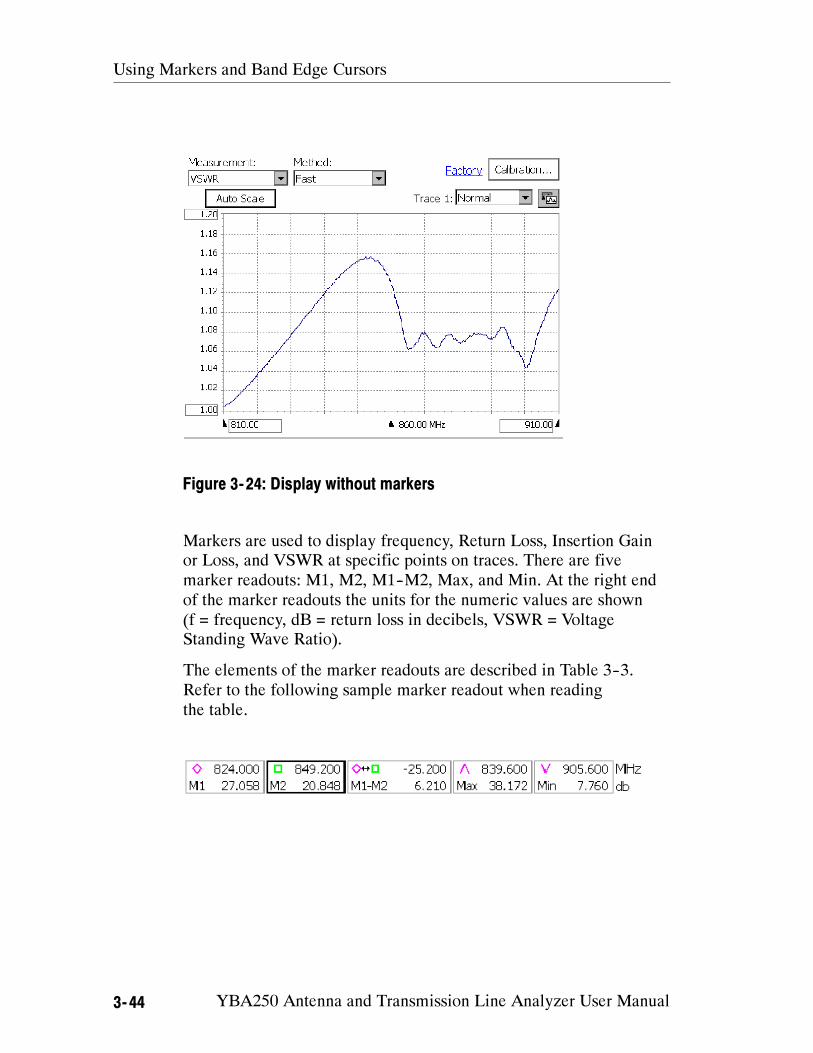
Using Markers and Band Edge Cursors
3- 44 YBA250 Antenna and Transmission Line Analyzer User Manual
Figure 3- 24: Display without markers
Markers are used to display frequency, Return Loss, Insertion Gain
or Loss, and VSWR at specific points on traces. There are five
marker readouts: M1, M2, M1--M2, Max, and Min. At the right end
of the marker readouts the units for the numeric values are shown
(f = frequency, dB = return loss in decibels, VSWR = Voltage
Standing Wave Ratio).
The elements of the marker readouts are described in Table 3--3.
Refer to the following sample marker readout when reading
the table.
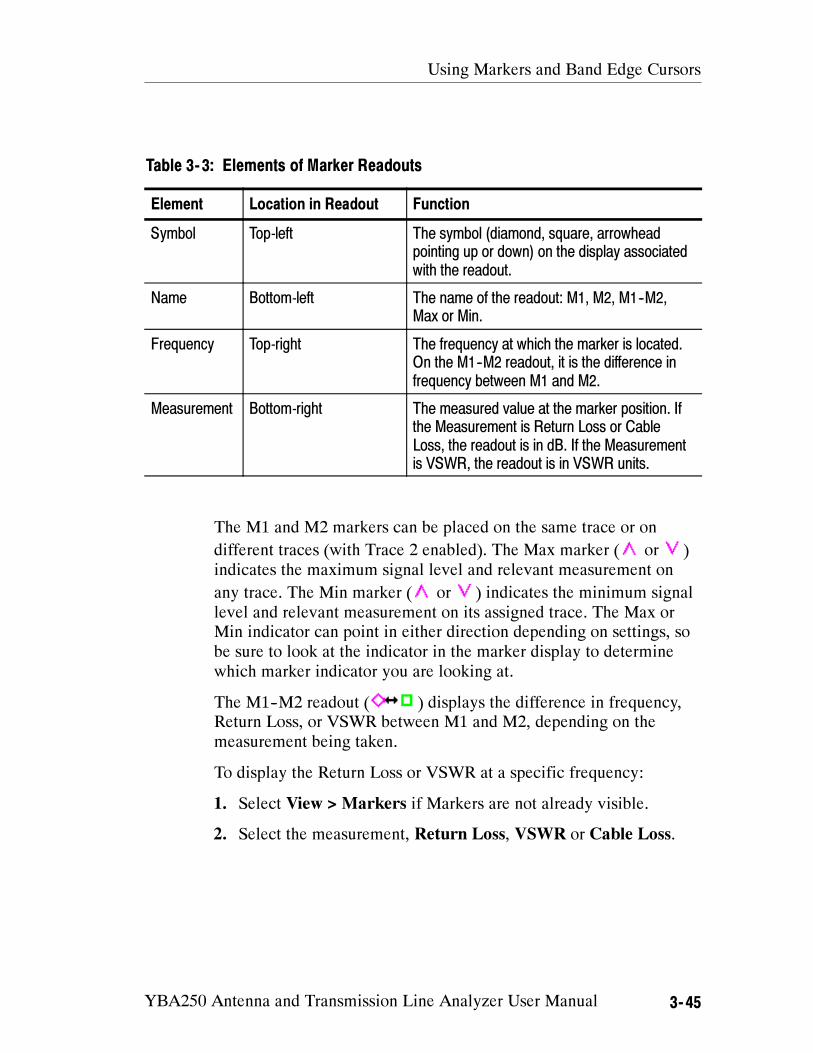
Using Markers and Band Edge Cursors
YBA250 Antenna and Transmission Line Analyzer User Manual 3- 45
Table 3- 3: Elements of Marker Readouts
Element Location in Readout Function
Symbol Top-left The symbol (diamond, square, arrowhead
pointing up or down) on the display associated
with the readout.
Name Bottom-left The name of the readout: M1, M2, M1--M2,
Max or Min.
Frequency Top-right The frequency at which the marker is located.
On the M1--M2 readout, it is the difference in
frequency between M1 and M2.
Measurement Bottom-right The measured value at the marker position. If
the Measurement is Return Loss or Cable
Loss, the readout is in dB. If the Measurement
is VSWR, the readout is in VSWR units.
The M1 and M2 markers can be placed on the same trace or on
different traces (with Trace 2 enabled). The Max marker ( or )
indicates the maximum signal level and relevant measurement on
any trace. The Min marker ( or ) indicates the minimum signal
level and relevant measurement on its assigned trace. The Max or
Min indicator can point in either direction depending on settings, so
be sure to look at the indicator in the marker display to determine
which marker indicator you are looking at.
The M1--M2 readout ( ) displays the difference in frequency,
Return Loss, or VSWR between M1 and M2, depending on the
measurement being taken.
To display the Return Loss or VSWR at a specific frequency:
1. Select View > Markers if Markers are not already visible.
2. Select the measurement, Return Loss, VSWR or Cable Loss.
Using Markers and Band Edge Cursors
3- 46 YBA250 Antenna and Transmission Line Analyzer User Manual
3. To place Marker 1:
a. Tap the M1 box. This assigns the knob to Marker 1. Note
the readout above the knob changes to M1.
b. Tap the point on the waveform where you want the marker
placed. You can also tap the numeric keypad, next to the
knob, to enter the frequency where the marker should be
placed or use the knob to change the location of the
marker.
c. Read the M1 frequency, Return Loss, and VSWR in the
M1 readout.
4. To place Marker 2:
a. Tap the M2 box. This assigns the knob to Marker 2. Note
the readout above the knob changes to M2.
b. Tap the point on the waveform where you want the marker
placed. You can also tap the numeric keypad, next to the
knob, to enter the frequency where the marker should be
placed or use the knob to change the location of the
marker.
c. Read the M2 frequency, Return Loss, and VSWR in the
M2 readout.
To place markers on two traces:
1. If it is not already selected, select Trace 2 from the View menu.
This displays Trace 2 as defined on the Loss tab.
2. From the View menu, select the desired location for the markers.
See Figure 3--25.
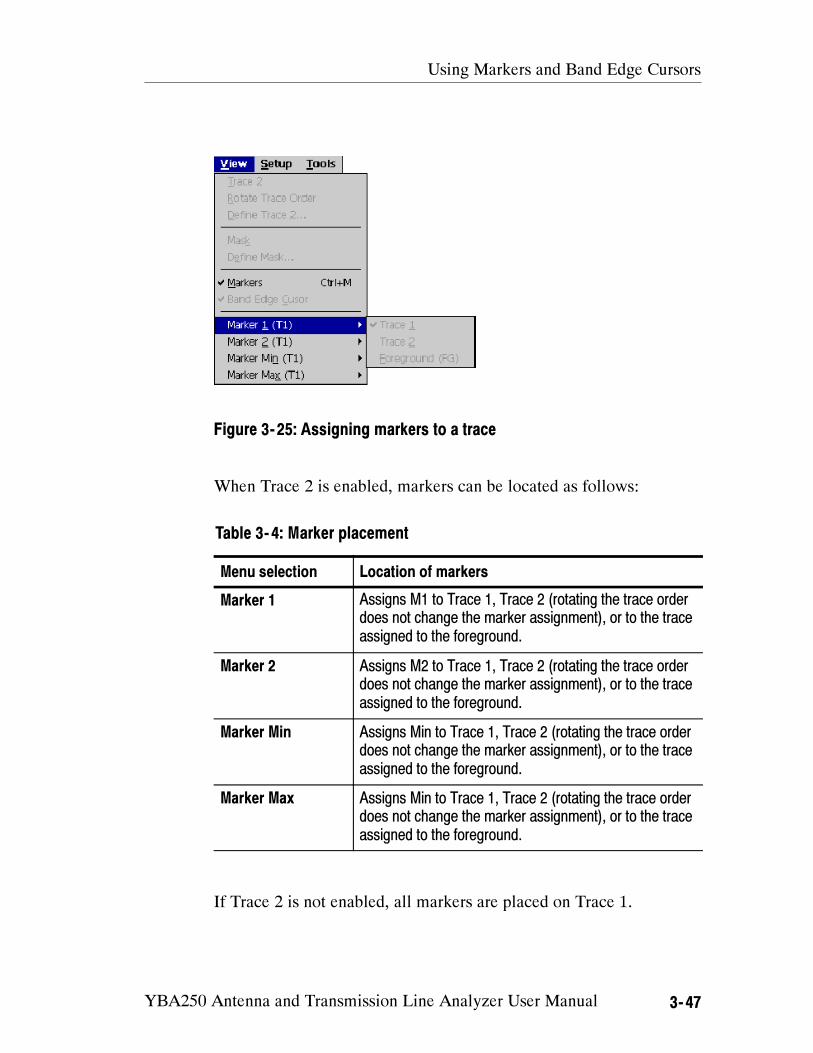
Using Markers and Band Edge Cursors
YBA250 Antenna and Transmission Line Analyzer User Manual 3- 47
Figure 3- 25: Assigning markers to a trace
When Trace 2 is enabled, markers can be located as follows:
Table 3- 4: Marker placement
Menu selection Location of markers
Marker 1 Assigns M1 to Trace 1, Trace 2 (rotating the trace order
does not change the marker assignment), or to the trace
assigned to the foreground.
Marker 2 Assigns M2 to Trace 1, Trace 2 (rotating the trace order
does not change the marker assignment), or to the trace
assigned to the foreground.
Marker Min Assigns Min to Trace 1, Trace 2 (rotating the trace order
does not change the marker assignment), or to the trace
assigned to the foreground.
Marker Max Assigns Min to Trace 1, Trace 2 (rotating the trace order
does not change the marker assignment), or to the trace
assigned to the foreground.
If Trace 2 is not enabled, all markers are placed on Trace 1.
Using Markers and Band Edge Cursors
3- 48 YBA250 Antenna and Transmission Line Analyzer User Manual
Measuring Return Loss or VSWR Between Points on a Single Trace
To measure the difference in Return Loss and VSWR between two
points on a single trace:
1. Display the markers by selecting View>Markers.
2. Tap the M1 readout. This assigns the marker to the knob and to
the touch screen in the display area.
3. Tap the display where you want to place the marker. You can also
use the knob to position the marker.
4. Tap the M2 readout. This assigns the marker to the knob and to
the touch screen in the display area.
5. Tap the display where you want to place the marker. You can also
use the knob to position the marker.
6. Read the difference in Return Loss and VSWR in the M1--M2
marker display.
Measuring Return Loss or VSWR Differences Between Two Traces
When Trace 2 is displayed, you can measure the difference in Return
Loss and VSWR between points on two traces:
1. If Trace 2 is not displayed, select View > Trace 2.
2. Display the markers by selecting View > Markers.
3. Specify the location of the markers by choosing one of the menu
selections shown in Table 3--4 from the View menu.
4. Tap the M1 readout. This assigns the marker to the control knob
and to the touch screen in the display area.
5. Tap the display where you want to place the marker. You can also
use the knob to position the marker.
6. Tap the M2 readout. This assigns the marker to the knob and to
the touch screen in the display area.
7. Tap the display where you want to place the marker. You can also
use the knob to position the marker.
8. Read the difference in frequency and level at the right side of the
marker display.
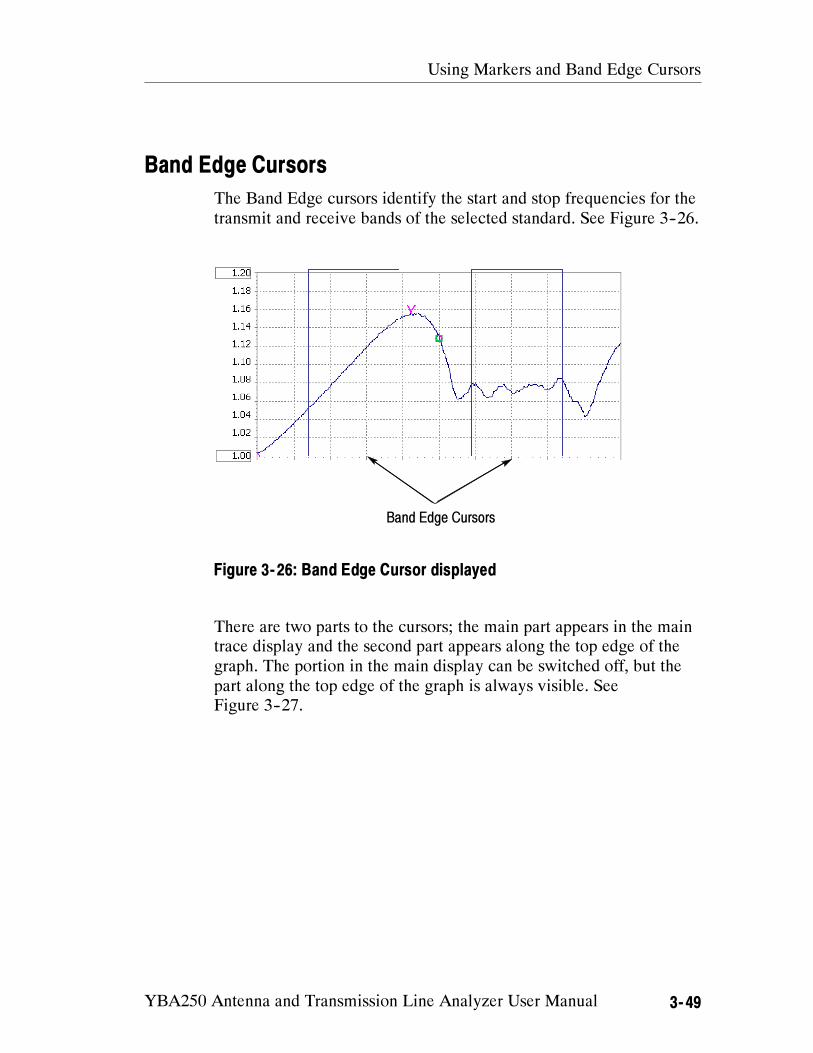
Using Markers and Band Edge Cursors
YBA250 Antenna and Transmission Line Analyzer User Manual 3- 49
Band Edge Cursors
The Band Edge cursors identify the start and stop frequencies for the
transmit and receive bands of the selected standard. See Figure 3--26.
Band Edge Cursors
Figure 3- 26: Band Edge Cursor displayed
There are two parts to the cursors; the main part appears in the main
trace display and the second part appears along the top edge of the
graph. The portion in the main display can be switched off, but the
part along the top edge of the graph is always visible. See
Figure 3--27.
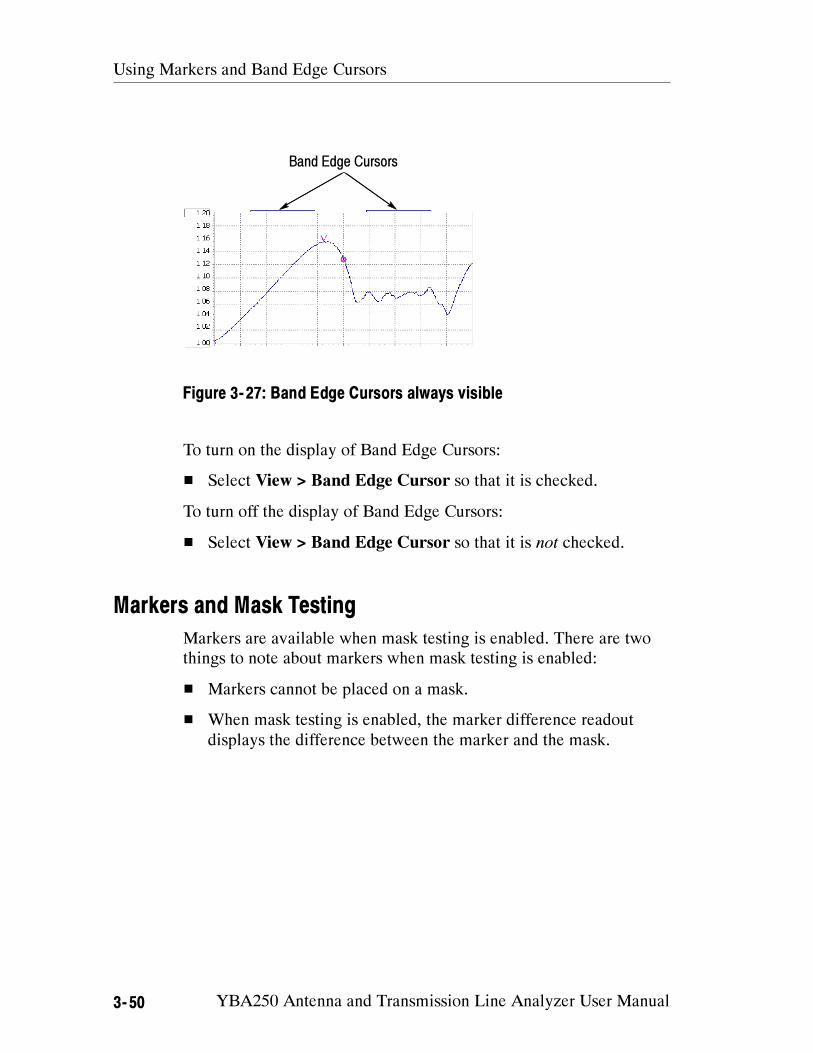
Using Markers and Band Edge Cursors
3- 50 YBA250 Antenna and Transmission Line Analyzer User Manual
Band Edge Cursors
Figure 3- 27: Band Edge Cursors always visible
To turn on the display of Band Edge Cursors:
Select View > Band Edge Cursor so that it is checked.
To turn off the display of Band Edge Cursors:
Select View > Band Edge Cursor so that it is not checked.
Markers and Mask Testing
Markers are available when mask testing is enabled. There are two
things to note about markers when mask testing is enabled:
Markers cannot be placed on a mask.
When mask testing is enabled, the marker difference readout
displays the difference between the marker and the mask.
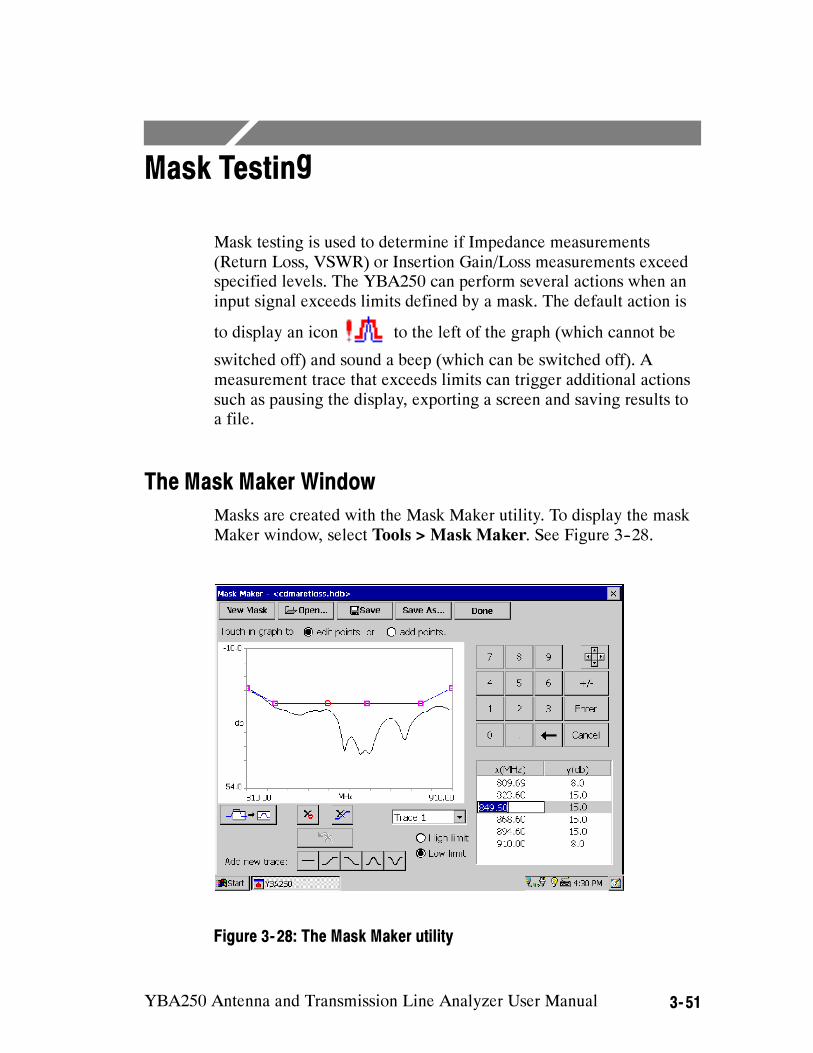
YBA250 Antenna and Transmission Line Analyzer User Manual 3- 51
Mask Testing
Mask testing is used to determine if Impedance measurements
(Return Loss, VSWR) or Insertion Gain/Loss measurements exceed
specified levels. The YBA250 can perform several actions when an
input signal exceeds limits defined by a mask. The default action is
to display an icon to the left of the graph (which cannot be
switched off) and sound a beep (which can be switched off). A
measurement trace that exceeds limits can trigger additional actions
such as pausing the display, exporting a screen and saving results to
a file.
The Mask Maker Window
Masks are created with the Mask Maker utility. To display the mask
Maker window, select Tools > Mask Maker. See Figure 3--28.
Figure 3- 28: The Mask Maker utility
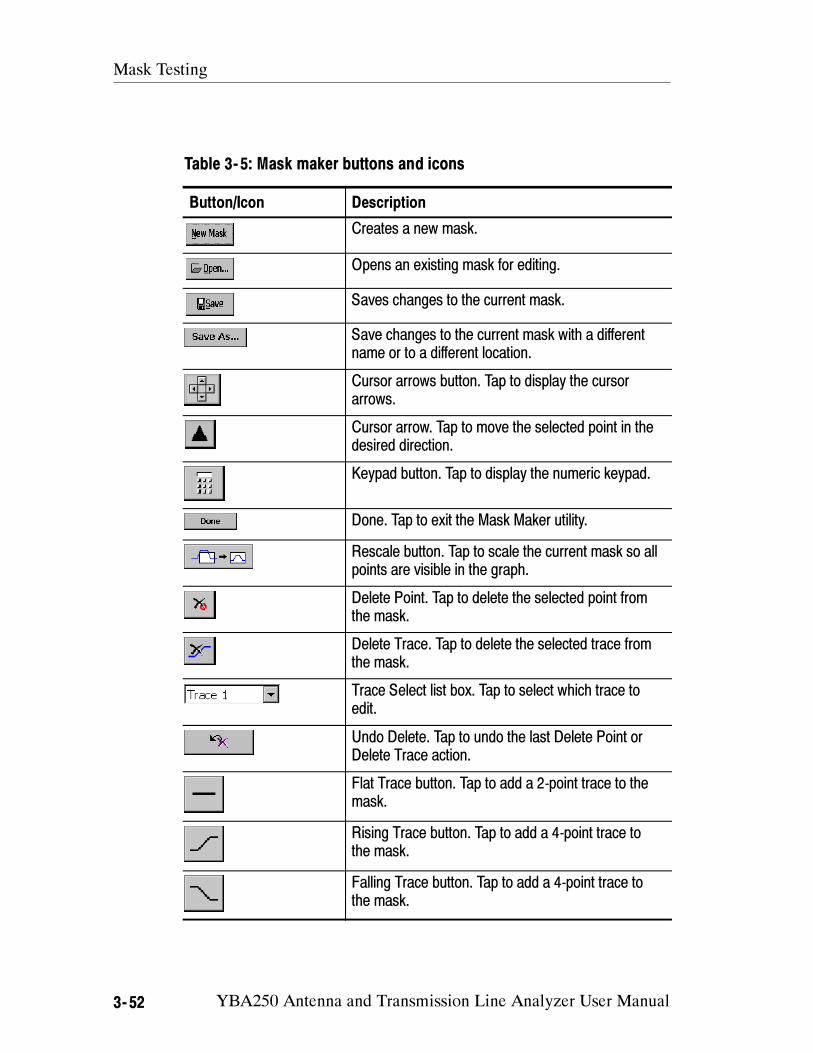
Mask Testing
3- 52 YBA250 Antenna and Transmission Line Analyzer User Manual
Table 3- 5: Mask maker buttons and icons
Button/Icon Description
Creates a new mask.
Opens an existing mask for editing.
Saves changes to the current mask.
Save changes to the current mask with a different
name or to a different location.
Cursor arrows button. Tap to display the cursor
arrows.
Cursor arrow. Tap to move the selected point in the
desired direction.
Keypad button. Tap to display the numeric keypad.
Done. Tap to exit the Mask Maker utility.
Rescale button. Tap to scale the current mask so all
points are visible in the graph.
Delete Point. Tap to delete the selected point from
the mask.
Delete Trace. Tap to delete the selected trace from
the mask.
Trace Select list box. Tap to select which trace to
edit.
Undo Delete. Tap to undo the last Delete Point or
Delete Trace action.
Flat Trace button. Tap to add a 2-point trace to the
mask.
Rising Trace button. Tap to add a 4-point trace to
the mask.
Falling Trace button. Tap to add a 4-point trace to
the mask.

Mask Testing
YBA250 Antenna and Transmission Line Analyzer User Manual 3- 53
Table 3- 5: Mask maker buttons and icons (Cont.)
Button/Icon Description
Positive Pulse button. Tap to add a 6-point trace to
the mask.
Negative Trace button. Tap to add a 6-point trace to
the mask.
Using the Mask Maker
Defining Mask Frequency Range and Trace
Before creating a mask, you must define the mask start and stop
frequencies.
1. Tap the measurement button for which you want to create a mask
( Impedance or Insertion Gain/Loss ).
2. Select the measurement for which you want to create a mask
from the Measurement drop-down list.
3. Set the frequency range of the display by selecting the signal
standard, band (Forward/Reverse/Both), selecting the channel,
and/or by setting the Start and Stop frequencies.
4. If possible, use a known signal input to create a measurement
trace with the correct wave shape. You can use this as the
reference trace for creating a mask.
Opening the Mask Maker
From the Tools menu, select Mask Maker to open the Mask Maker
window. The Mask Maker trace window shows the current
measurement trace and one of two mask types:
If Mask testing was already defined (enabled), the selected mask
is displayed in the Mask Maker window.
If Mask testing was not enabled, a new default mask (the
pulse-shaped trace) is displayed.
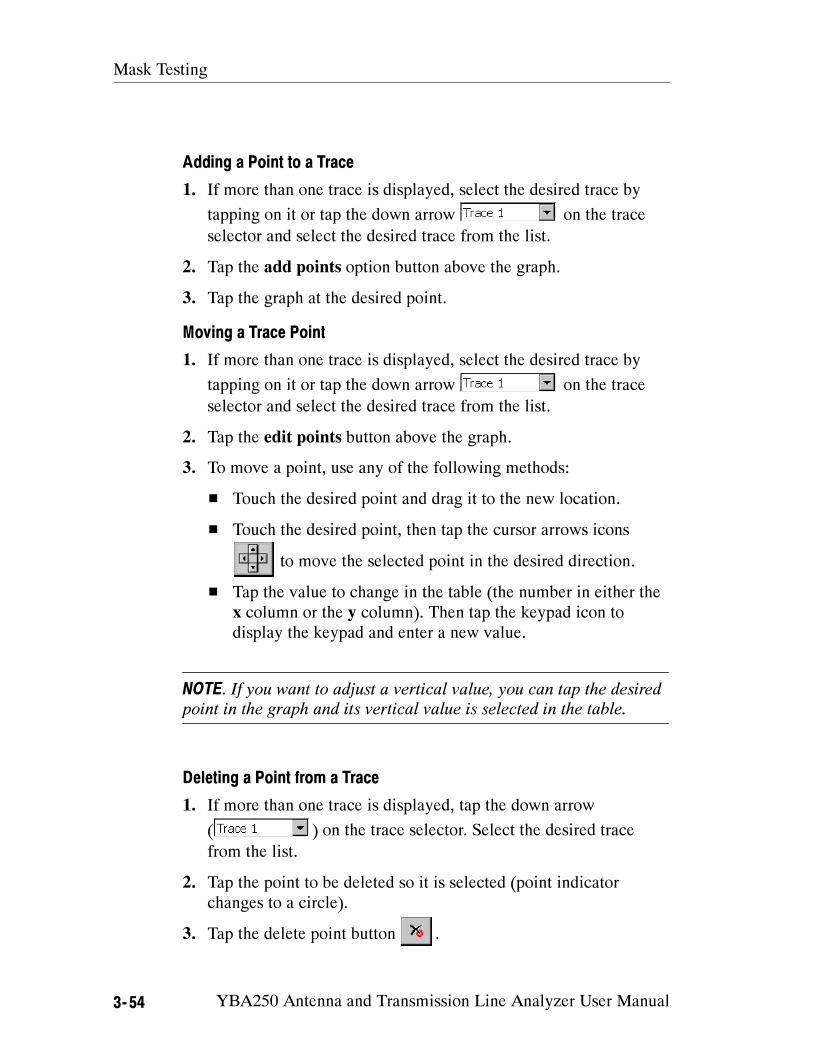
Mask Testing
3- 54 YBA250 Antenna and Transmission Line Analyzer User Manual
Adding a Point to a Trace
1. If more than one trace is displayed, select the desired trace by
tapping on it or tap the down arrow on the trace
selector and select the desired trace from the list.
2. Tap the add points option button above the graph.
3. Tap the graph at the desired point.
Moving a Trace Point
1. If more than one trace is displayed, select the desired trace by
tapping on it or tap the down arrow on the trace
selector and select the desired trace from the list.
2. Tap the edit points button above the graph.
3. To move a point, use any of the following methods:
Touch the desired point and drag it to the new location.
Touch the desired point, then tap the cursor arrows icons
to move the selected point in the desired direction.
Tap the value to change in the table (the number in either the
x column or the y column). Then tap the keypad icon to
display the keypad and enter a new value.
NOTE. If you want to adjust a vertical value, you can tap the desired
point in the graph and its vertical value is selected in the table.
Deleting a Point from a Trace
1. If more than one trace is displayed, tap the down arrow
( ) on the trace selector. Select the desired trace
from the list.
2. Tap the point to be deleted so it is selected (point indicator
changes to a circle).
3. Tap the delete point button .
Mask Testing
YBA250 Antenna and Transmission Line Analyzer User Manual 3- 55
Adding a Trace to a Mask
To add a trace to the mask, tap one of the Add new trace buttons.
A trace of the selected shape will appear on the graph.
Deleting a Trace from a Mask
1. Tap the down arrow on the trace selector.
2. Select the trace to delete from the list.
If the edit points option button is selected, you can also select a
trace by touching it near one of its points.
3. Tap the delete trace button .
Setting Mask Violation Limits
1. Tap the down arrow on the trace selector.
2. Select the desired trace from the list.
3. Tap High limit to indicate a violation when a signal trace has a
value higher than the mask trace.
4. Tap Low limit to indicate a violation when a signal trace has a
value lower than the mask trace.
Mask Testing
3- 56 YBA250 Antenna and Transmission Line Analyzer User Manual
Saving a Mask
1. Tap the Save button. If this is a new mask that has not been saved
before, the instrument opens the Save As window.
2. Enter the mask file name in the Name field.
3. Tap OK.
4. To save a mask to a different file name, tap the Save As... button
and enter the new mask file name.
Loading a Mask
You can load a saved mask to use for mask testing or as the starting
point for creating a new mask.
1. Tap the Open.. button to display the Open window.
2. Select the mask file to load from the displayed list.
3. Tap OK.
Mask Maker Guidelines
A mask consists of one or more traces, with each trace containing
at least one point.
You can add as many points as you want to a mask trace.
You can place as many traces on a mask as you want.
The selected point on a mask trace is indicated by a circle. Other
points are indicated by a square.
A mask trace does not have to cover the entire test frequency
range. Signal points at frequencies that don’t have associated
mask points are not tested for violations. This allows you to
check only those parts of the signal that are critical to your
specific measurement, for example the attenuation in adjacent
channels.
If you place points outside the visible area of the graph, tap the
rescale button to bring all points into view.
Mask Testing
YBA250 Antenna and Transmission Line Analyzer User Manual 3- 57
If you accidentally delete a point or a trace, you can undo the last
delete action by tapping the Undo Delete button .
Tap the numeric keypad to switch to the numeric keypad
from the cursor keys.
Tap the cursors keys button to switch to the cursor keys
from the numeric keypad.
Defining (Selecting) a Mask for Testing
Before you can perform a mask test, you must define (select) the
mask to be used. Defining a mask specifies the mask to used for
mask testing. If you have not yet created a mask, see Using the Mask
Maker on page 3--53.
To define a mask:
1. Select View > Define Mask. This displays the Masks tab of the
Setup window.
2. Decide which type of mask you want to use (Return Loss,
VSWR, Cable Loss, Insertion Gain, or Insertion Loss) and tap the
appropriate Browse button to display the Select mask file
window.
3. Select the mask you want to use for your mask test, and then tap
OK.
4. Tap the Enable Mask Testing check box.
5. To have the YBA250 perform an action (in addition to displaying
the violation icon) when a mask violation occurs, tap the
appropriate check box.
Tap Beep to sound an alarm when a violation occurs (this is
selected by default).
Tap Pause to cause the YBA250 to pause when a violation
occurs.
Mask Testing
3- 58 YBA250 Antenna and Transmission Line Analyzer User Manual
Tap Export Screen to save the screen as a graphics file when
a violation occurs.
Tap Save Results to cause the YBA250 to save the measure-
ments results to a file when a violation occurs.
6. Tap OK to accept your changes.
Mask testing is enabled with the defined mask displayed.
Performing a Mask Test
To perform a mask test, Select View > Mask so that there is a check
mark next to Mask.
The defined mask is displayed. If the trace exceeds the mask, the
violation icon will appear on the left side of the spectrum
graph and the violated mask trace will change color (the specific
color depends on the selected color scheme.
NOTE. A mask trace does not have to cover the entire test frequency
range. Signal points at frequencies that don’t have associated mask
points are not tested for violations. This allows you to check only
those parts of the signal that are critical to your specific measure-
ment, for example the attenuation in adjacent channels.
Mask Testing and Markers
When Mask testing is enabled, the marker difference readout
displays the difference between the marker and the mask. A positive
value indicates a “pass.” A negative value indicates a “fail.” A
positive value for an upper limit means the signal level is lower than
the mask level at the marker frequency. A negative value means the
signal level is higher than the mask level, thus violating the mask.
For a lower limit mask, a positive difference means that the signal
level is higher than the mask level and a negative difference means
that the signal level is lower than the mask level.
Mask Testing
YBA250 Antenna and Transmission Line Analyzer User Manual 3- 59
The YBA250 calculates the difference between the marker and the
mask using the preceding rule to determine the sign of the differ-
ence. The YBA250 calculates the difference between the signal level
and the level of each of the traces in the mask. The YBA250 then
displays the worst case difference between the signal level and all
the traces in the mask.
For example, suppose there are two traces in a mask: one is an upper
limit and the other is a lower limit. The upper limit mask trace level
at the marker frequency is 0 dB, the signal level is --10 dB, and the
lower limit mask trace level is --30 dB. Thus, the difference between
the upper limit and the signal is 10 dB and the difference between
the signal level and the lower limit is 20 dB. The YBA250 will
display the M1 marker difference as 10 dB because the signal is
closer to the upper limit than it is to the lower limit.
Alternately, assume that the upper limit mask trace level is 0 dB, the
signal level is --30 dB, and the lower limit mask trace level is
--25 dB. Thus, the difference between the upper limit and the signal
is 30 dB and the difference between the signal level and the lower
limit is --5 dB. The YBA250 will display the M1 marker difference
as --5 dB because the signal is closer to the lower limit than it is to
the upper limit. And because the signal is lower than the lower limit,
the signal fails the mask test.
If the YBA250 displays dashes (--------) for the marker difference
instead of a number, it means that there is no mask defined at the
marker frequency.
Mask Testing
3- 60 YBA250 Antenna and Transmission Line Analyzer User Manual
YBA250 Antenna and Transmission Line Analyzer User Manual 3- 61
Saving and Recalling Results, Screens,
and Setups
The YBA250 can save measurement results and screens (screen
captures) for later recall or for transfer to a PC. You can also set up
the YBA250 for specific tests and save the setup to a file for later
recall, saving you time when making measurements in the field.
When saving files, it is important to save the files in the correct
location. There are two types of memory in the YBA250. Volatile
memory is memory that loses data when power is removed.
Non-volatile memory retains data when power is removed. When the
YBA250 is powered down, any data stored in volatile memory is
lost. Only data stored in non-volatile memory is retained when the
YBA250 is powered down. On the YBA250, the BuiltInDisk folder
(and associated sub-folders) is the only folder maintained in
non-volatile memory.
When saving results, screens, or setups, be sure to save them to a
folder located within the BuiltInDisk folder. The default folder for
saved results is \BuiltInDisk\YBA250\AppData\Results. The default
folder for saved screens is \BuiltInDisk\YBA250\AppData\Results.
The default folder for saved setups is \BuiltInDisk\YBA250\AppDa-
ta\Settings. Because these locations are all located within the
BuiltInDisk directory, any data saved there is maintained after the
NetTek Analyzer Platform is powered down.
Saving Measurement Results
The YBA250 enables you to save a measurement result to a file for
later recall. Saving measurement results is meant for use in
reproducing a display at a later time. When results are recalled, they
appear in the display just as they did when saved. To use measure-
ment data results in another program for analysis or generating a
report, use the Export Results function; see page 3--64.
Saving and Recalling Results, Screens, and Setups
3- 62 YBA250 Antenna and Transmission Line Analyzer User Manual
To save measurement results:
1. Take the measurement you want to save.
2. Select File > Save Results. (Save Results appears only when the
Measure window is selected; Save Trace appears when the
Spectrum and Interference windows are selected.)
3. Select the folder where you want to save the results.
4. Type a name for the file. Tap in the taskbar, to display the
soft keyboard. Tap again to hide the keyboard when you are
finished.
5. Tap OK to save the file.
What is Saved in a Measurement Results File
The following information is saved in the results file for each
included measurement:
Name of the measurement
Measurement results and units
Time and date of the measurement
Additional information saved in a results file includes:
Technician name
User notes
Setup information that is visible in the results display
Error information (if errors were present)

Saving and Recalling Results, Screens, and Setups
YBA250 Antenna and Transmission Line Analyzer User Manual 3- 63
Recalling Measurement Results
You can recall saved measurement results for display. When saved
measurement results are displayed, the display appears just as it did
when the measurement was saved except for the status area of the
control bar.
To recall measurement results for display:
1. Select File > Open.
2. Locate the directory that contains the measurement results file
(the default is \BuiltInDisk\YBA250\AppData\Results).
3. Select the results file to recall and tap OK. The instrument
displays the saved results.
Saved Data icon indicates recalled
results are displayed
Date and time
result was saved
To restart acquisition,
tap the Start button
Figure 3- 29: Example of a recalled results display
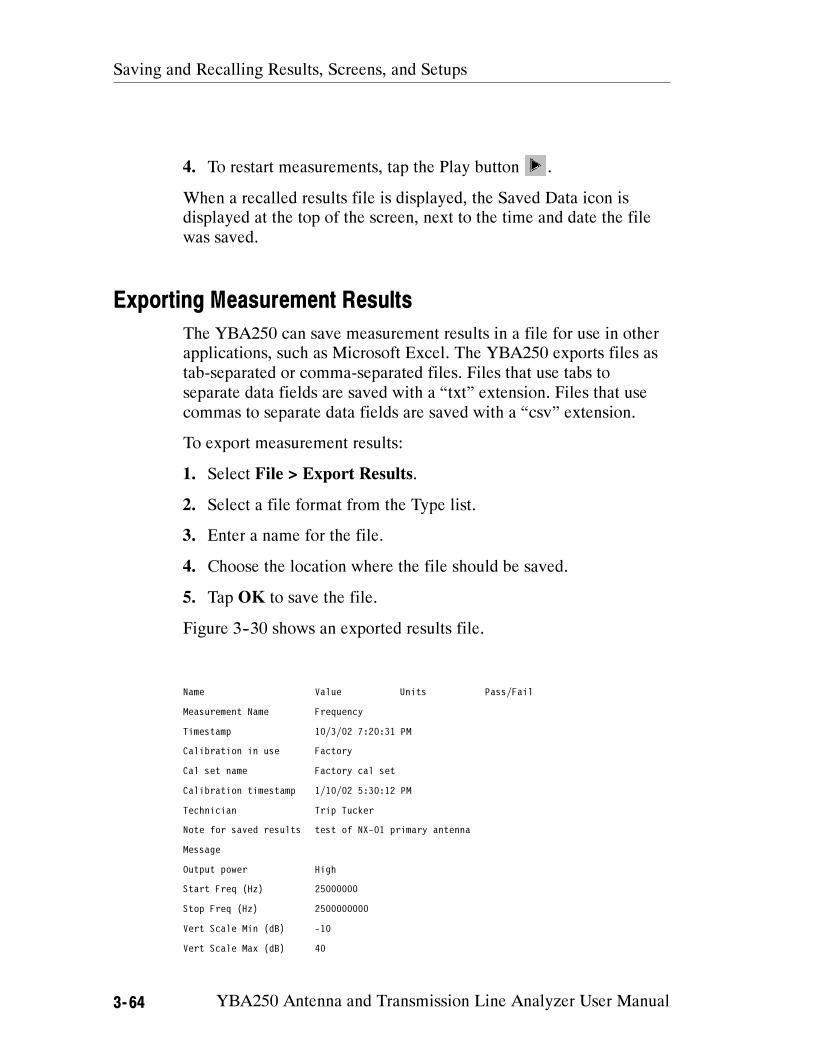
Saving and Recalling Results, Screens, and Setups
3- 64 YBA250 Antenna and Transmission Line Analyzer User Manual
4. To restart measurements, tap the Play button .
When a recalled results file is displayed, the Saved Data icon is
displayed at the top of the screen, next to the time and date the file
was saved.
Exporting Measurement Results
The YBA250 can save measurement results in a file for use in other
applications, such as Microsoft Excel. The YBA250 exports files as
tab-separated or comma-separated files. Files that use tabs to
separate data fields are saved with a “txt” extension. Files that use
commas to separate data fields are saved with a “csv” extension.
To export measurement results:
1. Select File > Export Results.
2. Select a file format from the Type list.
3. Enter a name for the file.
4. Choose the location where the file should be saved.
5. Tap OK to save the file.
Figure 3--30 shows an exported results file.
Name Value Units Pass/Fail
Measurement Name Frequency
Timestamp 10/3/02 7:20:31 PM
Calibration in use Factory
Cal set name Factory cal set
Calibration timestamp 1/10/02 5:30:12 PM
Technician Trip Tucker
Note for saved results test of NX-01 primary antenna
Message
Output power High
Start Freq (Hz) 25000000
Stop Freq (Hz) 2500000000
Vert Scale Min (dB) -10
Vert Scale Max (dB) 40
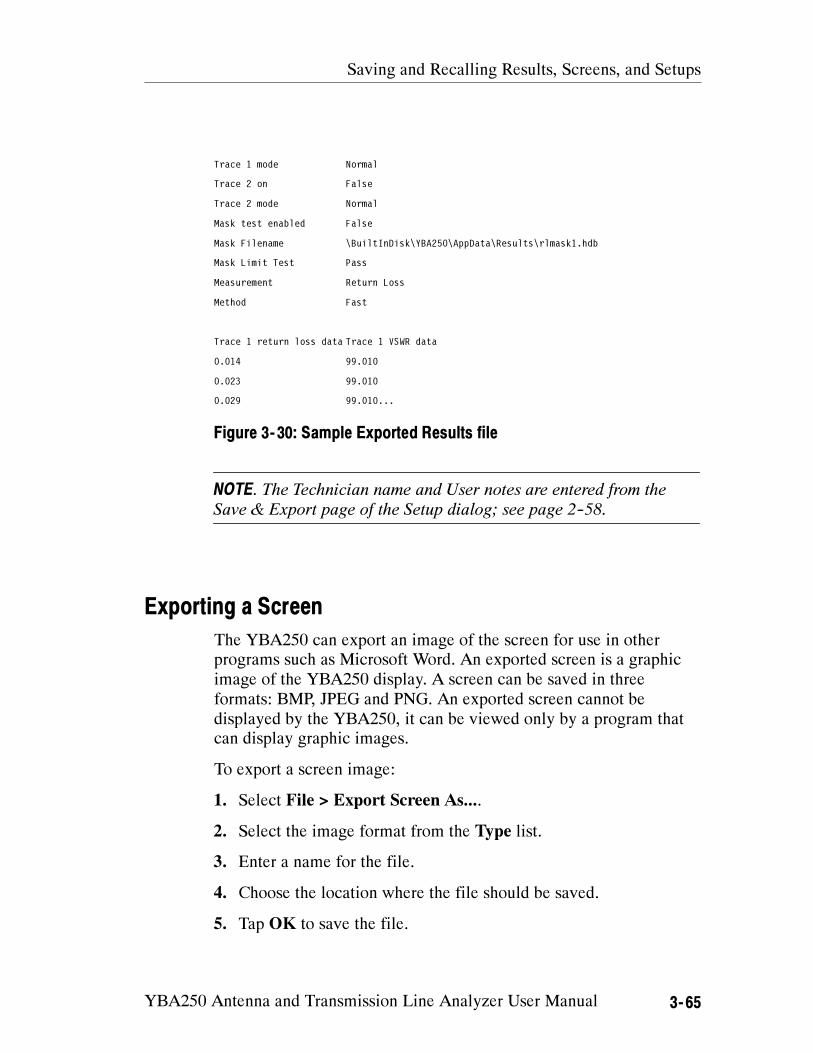
Saving and Recalling Results, Screens, and Setups
YBA250 Antenna and Transmission Line Analyzer User Manual 3- 65
Trace 1 mode Normal
Trace 2 on False
Trace 2 mode Normal
Mask test enabled False
Mask Filename \BuiltInDisk\YBA250\AppData\Results\rlmask1.hdb
Mask Limit Test Pass
Measurement Return Loss
Method Fast
Trace 1 return loss data Trace 1 VSWR data
0.014 99.010
0.023 99.010
0.029 99.010...
Figure 3- 30: Sample Exported Results file
NOTE. The Technician name and User notes are entered from the
Save & Export page of the Setup dialog; see page 2--58.
Exporting a Screen
The YBA250 can export an image of the screen for use in other
programs such as Microsoft Word. An exported screen is a graphic
image of the YBA250 display. A screen can be saved in three
formats: BMP, JPEG and PNG. An exported screen cannot be
displayed by the YBA250, it can be viewed only by a program that
can display graphic images.
To export a screen image:
1. Select File > Export Screen As....
2. Select the image format from the Type list.
3. Enter a name for the file.
4. Choose the location where the file should be saved.
5. Tap OK to save the file.
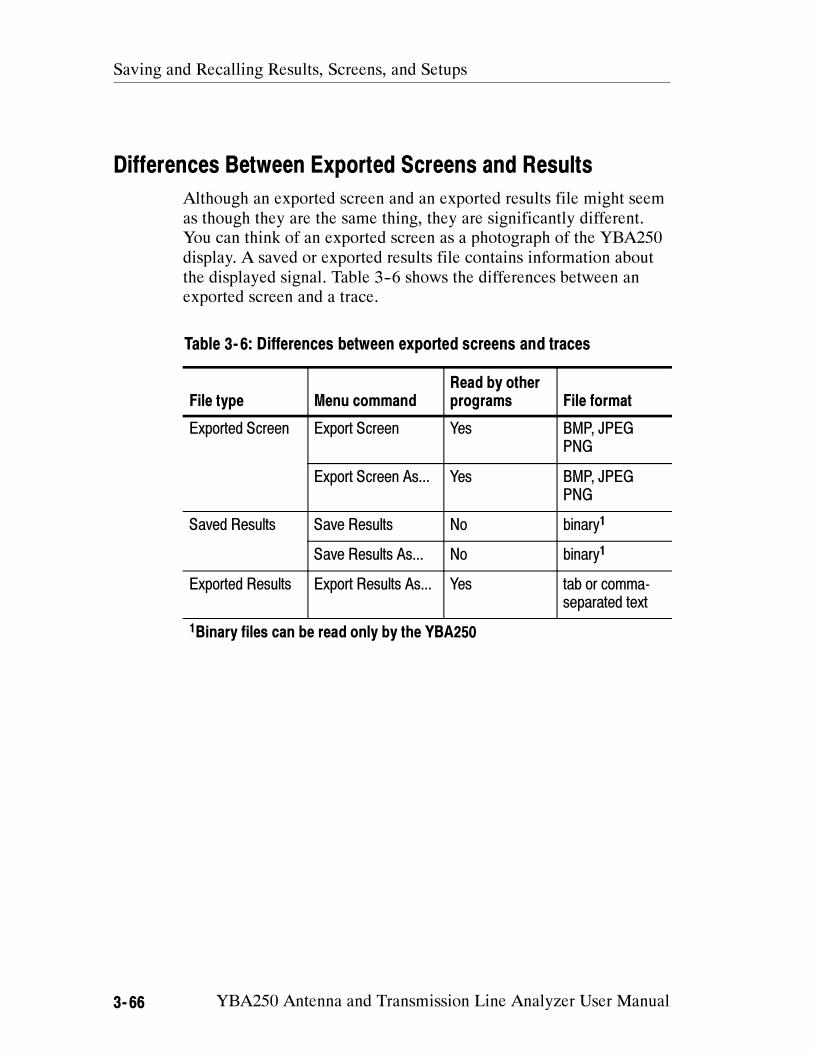
Saving and Recalling Results, Screens, and Setups
3- 66 YBA250 Antenna and Transmission Line Analyzer User Manual
Differences Between Exported Screens and Results
Although an exported screen and an exported results file might seem
as though they are the same thing, they are significantly different.
You can think of an exported screen as a photograph of the YBA250
display. A saved or exported results file contains information about
the displayed signal. Table 3--6 shows the differences between an
exported screen and a trace.
Table 3- 6: Differences between exported screens and traces
File type Menu command
Read by other
programs File format
Exported Screen Export Screen Yes BMP, JPEG
PNG
Export Screen As... Yes BMP, JPEG
PNG
Saved Results Save Results No binary1
Save Results As... No binary1
Exported Results Export Results As... Yes tab or comma-
separated text
1Binary files can be read only by the YBA250
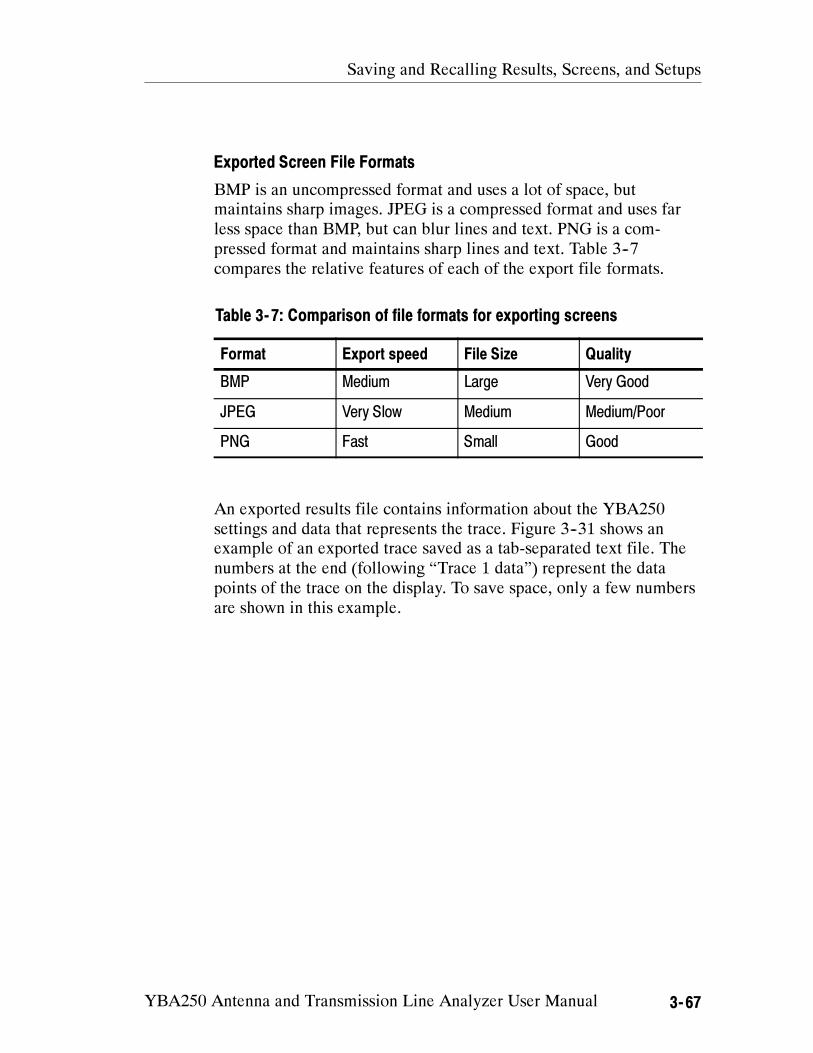
Saving and Recalling Results, Screens, and Setups
YBA250 Antenna and Transmission Line Analyzer User Manual 3- 67
Exported Screen File Formats
BMP is an uncompressed format and uses a lot of space, but
maintains sharp images. JPEG is a compressed format and uses far
less space than BMP, but can blur lines and text. PNG is a com-
pressed format and maintains sharp lines and text. Table 3--7
compares the relative features of each of the export file formats.
Table 3- 7: Comparison of file formats for exporting screens
Format Export speed File Size Quality
BMP Medium Large Very Good
JPEG Very Slow Medium Medium/Poor
PNG Fast Small Good
An exported results file contains information about the YBA250
settings and data that represents the trace. Figure 3--31 shows an
example of an exported trace saved as a tab-separated text file. The
numbers at the end (following “Trace 1 data”) represent the data
points of the trace on the display. To save space, only a few numbers
are shown in this example.

Saving and Recalling Results, Screens, and Setups
3- 68 YBA250 Antenna and Transmission Line Analyzer User Manual
Name Value Units Pass/Fail
Measurement Name Frequency
Timestamp 10/3/02 7:20:31 PM
Calibration in use Factory
Cal set name Factory cal set
Calibration timestamp 1/10/02 5:30:12 PM
Technician Trip Tucker
Note for saved results test of NX-01 primary antenna
Message
Output power High
Start Freq (Hz) 25000000
Stop Freq (Hz) 2500000000
Vert Scale Min (dB) -10
Vert Scale Max (dB) 40
Trace 1 mode Normal
Trace 2 on False
Trace 2 mode Normal
Mask test enabled False
Mask Filename \BuiltInDisk\YBA250\AppData\Results\rlmask1.hdb
Mask Limit Test Pass
Measurement Return Loss
Method Fast
Trace 1 return loss data Trace 1 VSWR data
0.014 99.010
0.023 99.010
0.029 99.010...
Figure 3- 31: Example of an Exported Results file
Saving Setups
The YBA250 can save its settings in Setup files for later recall.
Recalling a saved setup changes the YBA250 settings to match those
in the saved setup. Using saved setups minimizes your setup time in
the field and helps to ensure more consistent measurement results.
For example, you could save a setup for measuring return loss on a
specific frequency band.

Saving and Recalling Results, Screens, and Setups
YBA250 Antenna and Transmission Line Analyzer User Manual 3- 69
The saved setup contains the measurement settings as well as all
other instrument control settings. Once the setup is saved, it can be
copied to other YBA250 instruments to save setup time in the field.
To save YBA250 setups:
1. Set all the YBA250 settings the way you want them.
2. Select Setup > Save....
3. Enter a name for the file.
4. Choose the location where the file should be saved (the default is
\BuiltInDisk\YBA250\AppData\Settings).
5. Tap OK to save the setup file.
Recalling Setups
Recalling a saved setup changes the YBA250 settings to match those
in the saved setup file.
To recall setups:
1. To recall a setup, select Setup > Open...
2. Locate the directory that contains the setup file (the default is
\BuiltInDisk\YBA250\AppData\Settings).
3. Select the setup file to recall and tap OK.
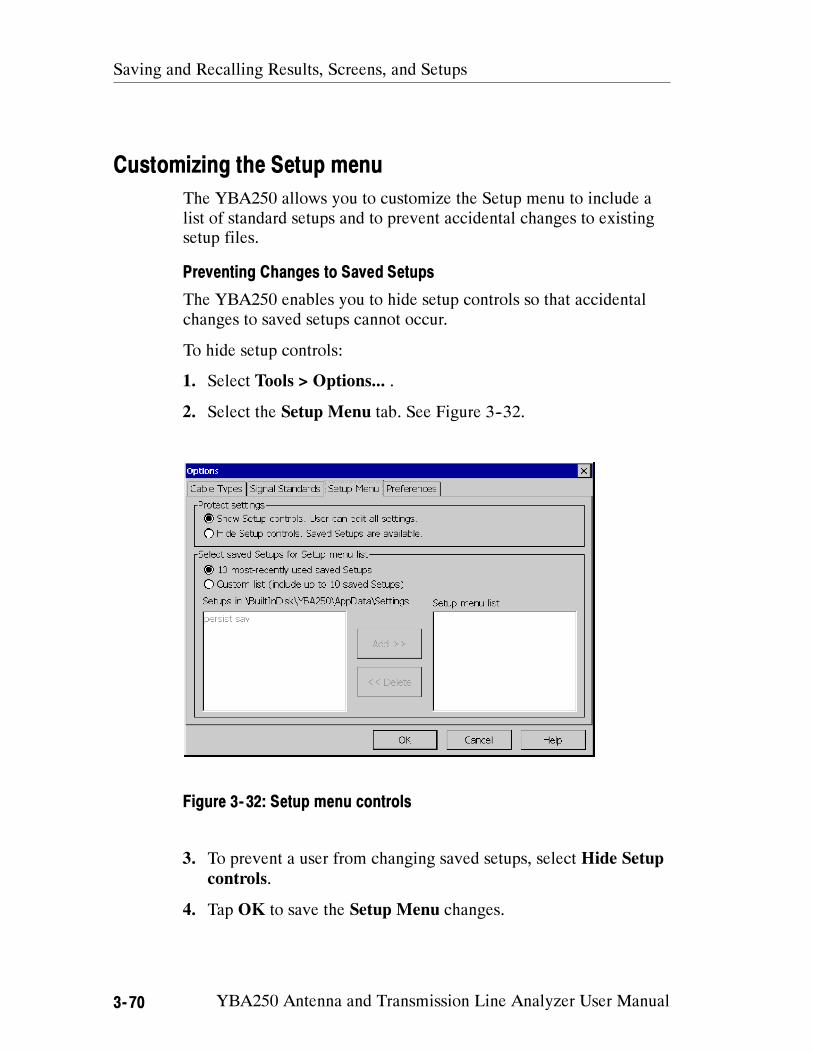
Saving and Recalling Results, Screens, and Setups
3- 70 YBA250 Antenna and Transmission Line Analyzer User Manual
Customizing the Setup menu
The YBA250 allows you to customize the Setup menu to include a
list of standard setups and to prevent accidental changes to existing
setup files.
Preventing Changes to Saved Setups
The YBA250 enables you to hide setup controls so that accidental
changes to saved setups cannot occur.
To hide setup controls:
1. Select Tools > Options... .
2. Select the Setup Menu tab. See Figure 3--32.
Figure 3- 32: Setup menu controls
3. To prevent a user from changing saved setups, select Hide Setup
controls.
4. Tap OK to save the Setup Menu changes.
Saving and Recalling Results, Screens, and Setups
YBA250 Antenna and Transmission Line Analyzer User Manual 3- 71
When Hide Setup controls is selected, the Edit button changes to
the Open button. Tapping the Open button displays the
Open dialog box instead of the Setup window. This allows the user to
select a saved setup for recall, but not to edit any settings or save any
setups. Additionally, when Hide Setup controls is selected, the
Setup > Edit and Setup > Save menu items are disabled.
Enabling Changes to Saved Setups
If setup controls have been hidden, you cannot create new setup
files. You must show setup controls so you can create new setup
files.
To show setup controls:
1. Select Tools > Options... .
2. Select the Setup Menu tab. See Figure 3--32.
3. Select Show Setup Controls.
Once setup controls are visible, you can create new setup files.
Specifying the List of Saved Setups
The YBA250 enables you to specify the list of saved setups that
appears in the Setup menu. You can choose to either list the 10 most
recently used saved setups or display a custom list of setups. A
custom list of saved setups provides consistent and quick access to a
standard group of setup files.
To specify the list of setups in the Setup menu:
1. Copy or move all the setup files you want to list in the Setup
menu to the \BuiltInDisk\YBA250\AppData\Settings folder. The
YBA250 will allow you to select only setups located in the
\BuiltInDisk\YBA250\AppData\Settings folder for display in the
Setup menu.
2. Select Tools > Options... .
3. Select the Setup Menu tab. See Figure 3--33.
4. To display the 10 most recently used saved setups in the Setup
menu, select 10 most--recently used saved Setups.
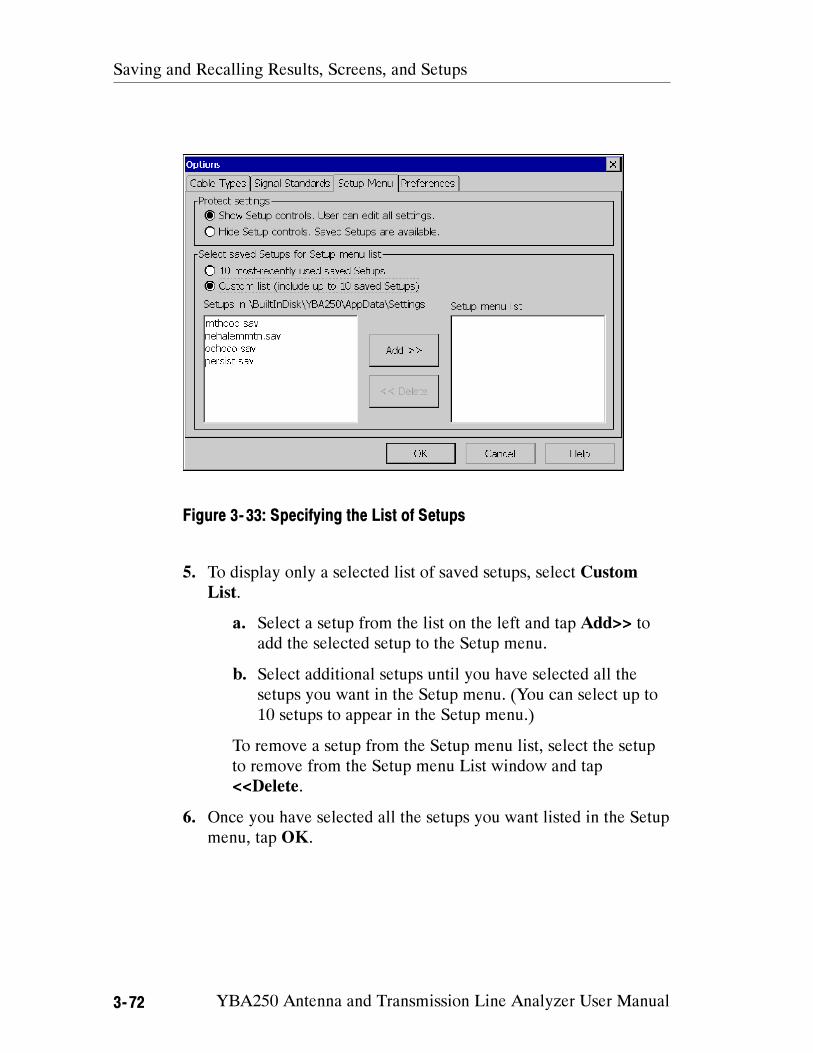
Saving and Recalling Results, Screens, and Setups
3- 72 YBA250 Antenna and Transmission Line Analyzer User Manual
Figure 3- 33: Specifying the List of Setups
5. To display only a selected list of saved setups, select Custom
List.
a. Select a setup from the list on the left and tap Add>> to
add the selected setup to the Setup menu.
b. Select additional setups until you have selected all the
setups you want in the Setup menu. (You can select up to
10 setups to appear in the Setup menu.)
To remove a setup from the Setup menu list, select the setup
to remove from the Setup menu List window and tap
<<Delete.
6. Once you have selected all the setups you want listed in the Setup
menu, tap OK.

Appendices

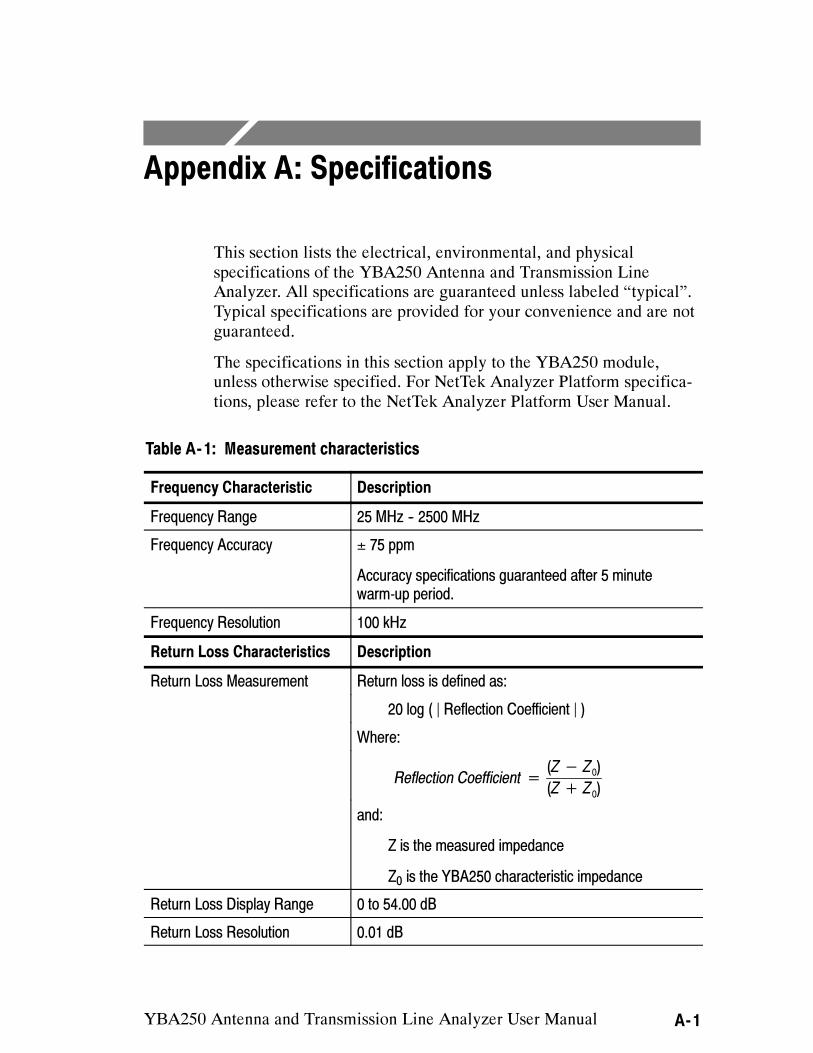
YBA250 Antenna and Transmission Line Analyzer User Manual A-1
Appendix A: Specifications
This section lists the electrical, environmental, and physical
specifications of the YBA250 Antenna and Transmission Line
Analyzer. All specifications are guaranteed unless labeled “typical”.
Typical specifications are provided for your convenience and are not
guaranteed.
The specifications in this section apply to the YBA250 module,
unless otherwise specified. For NetTek Analyzer Platform specifica-
tions, please refer to the NetTek Analyzer Platform User Manual.
Table A- 1: Measurement characteristics
Frequency Characteristic Description
Frequency Range 25 MHz -- 2500 MHz
Frequency Accuracy ± 75 ppm
Accuracy specifications guaranteed after 5 minute
warm-up period.
Frequency Resolution 100 kHz
Return Loss Characteristics Description
Return Loss Measurement Return loss is defined as:
20 log ( Reflection Coefficient )
Where:
Reflection Coefficient =
(Z− Z0)
(Z+ Z0)
and:
Z is the measured impedance
Z0is the YBA250 characteristic impedance
Return Loss Display Range 0 to 54.00 dB
Return Loss Resolution 0.01 dB
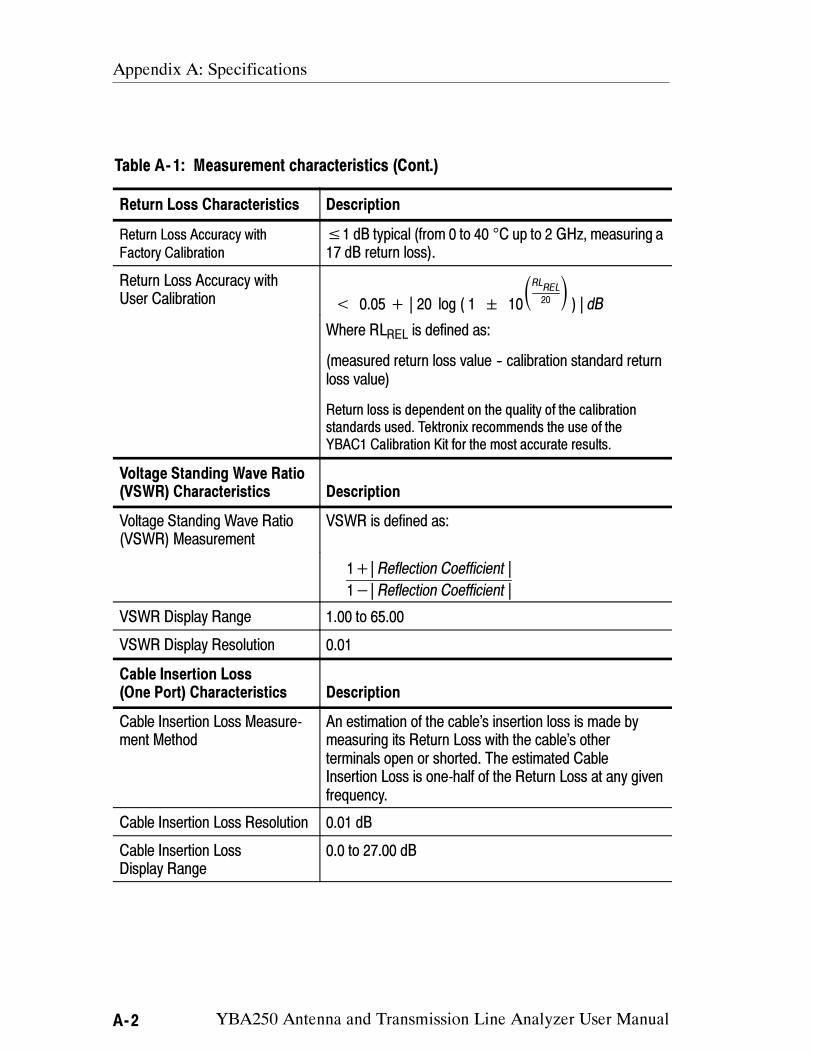
Appendix A: Specifications
A-2 YBA250 Antenna and Transmission Line Analyzer User Manual
Table A- 1: Measurement characteristics (Cont.)
Return Loss Characteristics Description
Return Loss Accuracy with
Factory Calibration
≤1 dB typical (from 0 to 40 °C up to 2 GHz, measuring a
17 dB return loss).
Return Loss Accuracy with
User Calibration< 0.05+ | 20 log ( 1 10
RL
REL
20
) | dB
Where RLREL
is defined as:
(measured return loss value -- calibration standard return
loss value)
Return loss is dependent on the quality of the calibration
standards used. Tektronix recommends the use of the
YBAC1 Calibration Kit for the most accurate results.
Voltage Standing Wave Ratio
(VSWR) Characteristics Description
Voltage Standing Wave Ratio
(VSWR) Measurement
VSWR is defined as:
1+| Reflection Coefficient |
1−| Reflection Coefficient |
VSWR Display Range 1.00 to 65.00
VSWR Display Resolution 0.01
Cable Insertion Loss
(One Port) Characteristics Description
Cable Insertion Loss Measure-
ment Method
An estimation of the cable’s insertion loss is made by
measuring its Return Loss with the cable’s other
terminals open or shorted. The estimated Cable
Insertion Loss is one-half of the Return Loss at any given
frequency.
Cable Insertion Loss Resolution 0.01 dB
Cable Insertion Loss
Display Range
0.0 to 27.00 dB

Appendix A: Specifications
YBA250 Antenna and Transmission Line Analyzer User Manual A-3
Table A- 1: Measurement characteristics (Cont.)
Distance to Fault (DTF)
Characteristics Description
Distance to Fault Measurement The YBA250 displays Return Loss versus distance or
VSWR versus distance.
Distance to Fault Range Coaxial lines up to 1486¯Vrelmeters in length can be
tested. Vrelis the relative signal velocity in the coaxial
line with respect to the speed of light.
Distance to Fault Resolution Incremental distances of ≤ 6.1¯Vrelcentimeters at a
distance of 200¯Vrelmeters can be resolved.
This resolution is available only in situations where the
instrument’s entire frequency range can be used to make
the measurement. If a device with a narrow bandwidth
limits the system under test, the distance resolution is
limited by physics to:
1.5 108 VREL
∆F
whereF is the frequency range the measurements are
made over. Vrelis the relative signal velocity in the
coaxial line with respect to the speed of light.
Distance to Fault Amplitude
Correction
The measured value of a broad band discontinuity is
corrected using information based on the known
characteristics of the cable being tested.
Insertion Loss
Characteristics Description
Measurement The dBm power measured without the device in the
signal path minus the dBm power measured with the
device in the signal path. The Normalization measure-
ment provides the power measurement without the
device under test in the signal path.
The test signal is generated by the YBA250. The test
signal is measured by the YBT250 under control of the
YBA250 application.
Frequency Range 30 to 2500 MHz
Display Range +100 dB to --100 dB

Appendix A: Specifications
A-4 YBA250 Antenna and Transmission Line Analyzer User Manual
Table A- 1: Measurement characteristics (Cont.)
Insertion Loss
Characteristics Description
Resolution 0.01 dB
Accuracy, Typical (Average Insertion
Loss measurement)
1.0 dB for components with VSWR < 1.5:1
0.5 dB for components with VSWR < 1.15:1
Reflections in the signal path create standing waves
when operating at a fixed frequency. When frequency is
swept, these reflections cause ripple in the measurement
waveform.
The average loss measurement indicates the average
loss over the displayed frequency range.
Insertion Gain
Characteristics Description
Measurement The dBm power measured with the device in the signal
path minus the dBm power measured with the device
removed from the signal path. The Normalization
measurement provides the power measurement without
the device under test in the signal path.
The test signal is generated by the YBA250. The test
signal is measured by the YBT250 under control of the
YBA250 application.
Frequency Range 30 to 2500 MHz
Display Range +100 dB to --100 dB
Resolution 0.01 dB
Accuracy, Typical (Average Insertion
Gain measurement)
1.0 dB for components with VSWR < 1.5:1
When using a bias--T with voltage above 12 Volts, avoid
exceeding the voltage rating of attenuators in the signal
path. This risk is present when the bias--T is part of the
normalization signal path without the amplifier.
Reflections in the signal path create standing waves
when operating at a fixed frequency. When frequency is
swept, these reflections cause ripple in the measurement
waveform. The average insertion gain reading indicates
the average gain over the frequency range displayed.
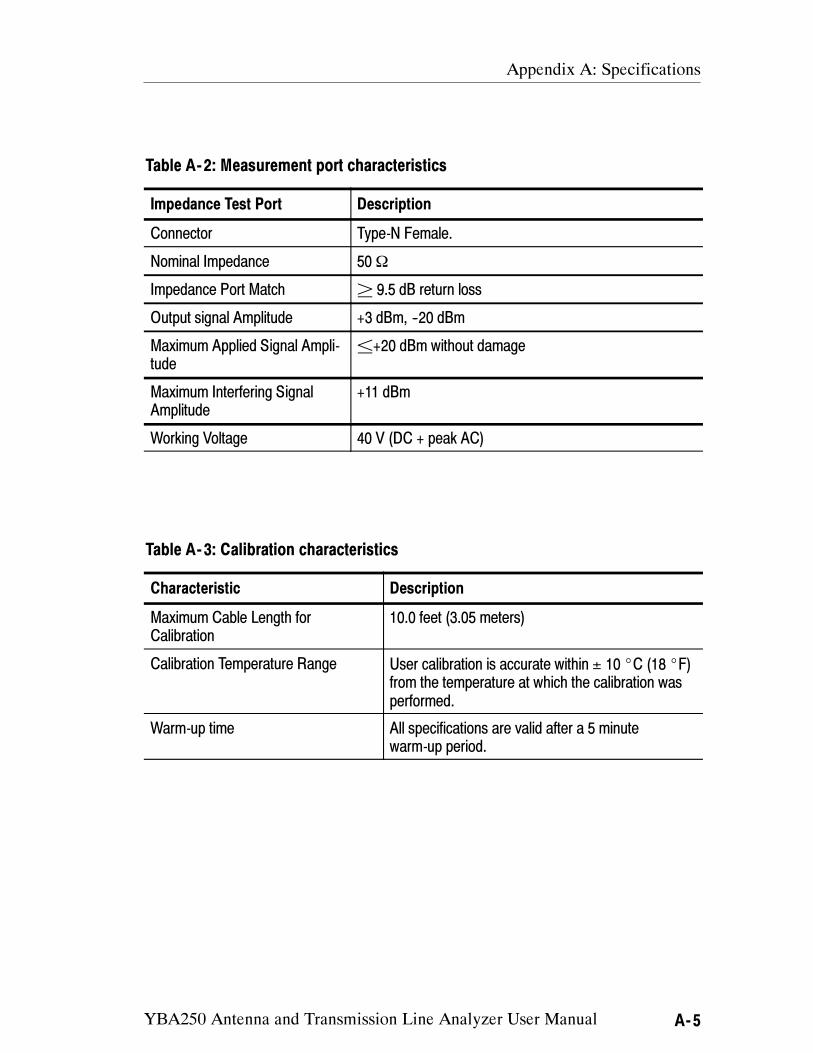
Appendix A: Specifications
YBA250 Antenna and Transmission Line Analyzer User Manual A-5
Table A- 2: Measurement port characteristics
Impedance Test Port Description
Connector Type-N Female.
Nominal Impedance 50 Ω
Impedance Port Match ² 9.5 dB return loss
Output signal Amplitude +3 dBm, --20 dBm
Maximum Applied Signal Ampli-
tude
±+20 dBm without damage
Maximum Interfering Signal
Amplitude
+11 dBm
Working Voltage 40 V (DC + peak AC)
Table A- 3: Calibration characteristics
Characteristic Description
Maximum Cable Length for
Calibration
10.0 feet (3.05 meters)
Calibration Temperature Range User calibration is accurate within ± 10 C (18 F)
from the temperature at which the calibration was
performed.
Warm-up time All specifications are valid after a 5 minute
warm-up period.
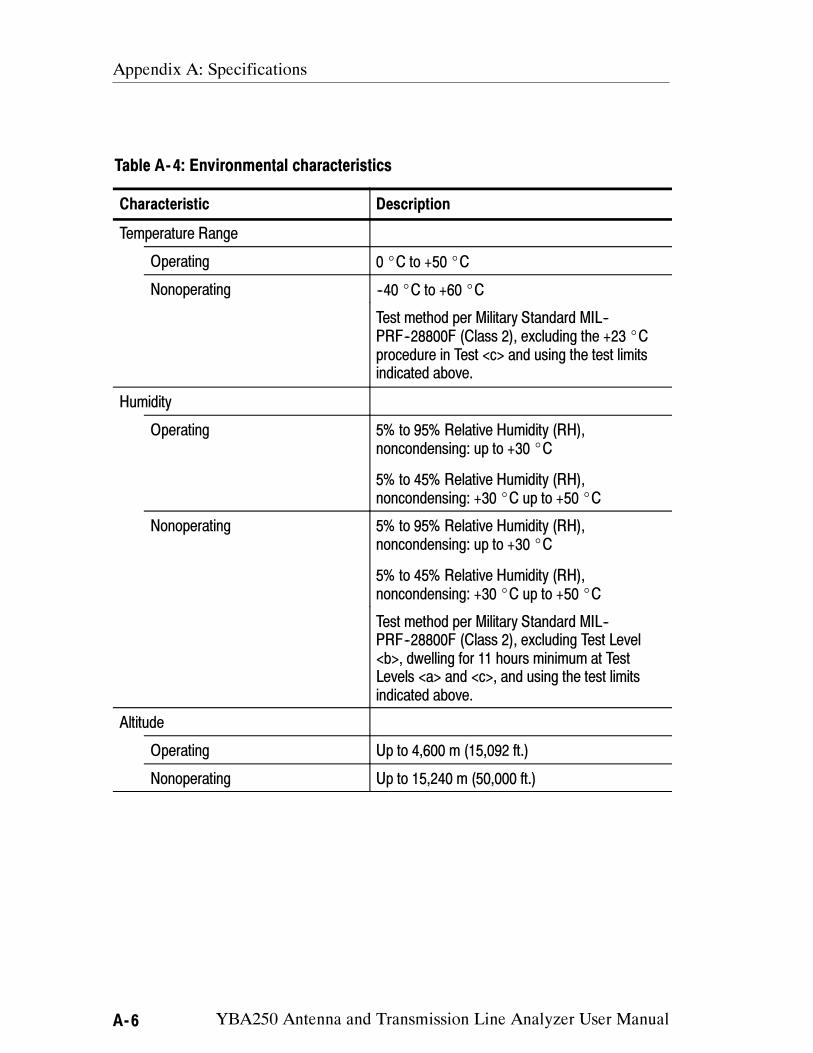
Appendix A: Specifications
A-6 YBA250 Antenna and Transmission Line Analyzer User Manual
Table A- 4: Environmental characteristics
Characteristic Description
Temperature Range
Operating 0 C to +50 C
Nonoperating --40 C to +60 C
Test method per Military Standard MIL--
PRF--28800F (Class 2), excluding the +23 C
procedure in Test <c> and using the test limits
indicated above.
Humidity
Operating 5% to 95% Relative Humidity (RH),
noncondensing: up to +30 C
5% to 45% Relative Humidity (RH),
noncondensing: +30 C up to +50 C
Nonoperating 5% to 95% Relative Humidity (RH),
noncondensing: up to +30 C
5% to 45% Relative Humidity (RH),
noncondensing: +30 C up to +50 C
Test method per Military Standard MIL--
PRF--28800F (Class 2), excluding Test Level
<b>, dwelling for 11 hours minimum at Test
Levels <a> and <c>, and using the test limits
indicated above.
Altitude
Operating Up to 4,600 m (15,092 ft.)
Nonoperating Up to 15,240 m (50,000 ft.)
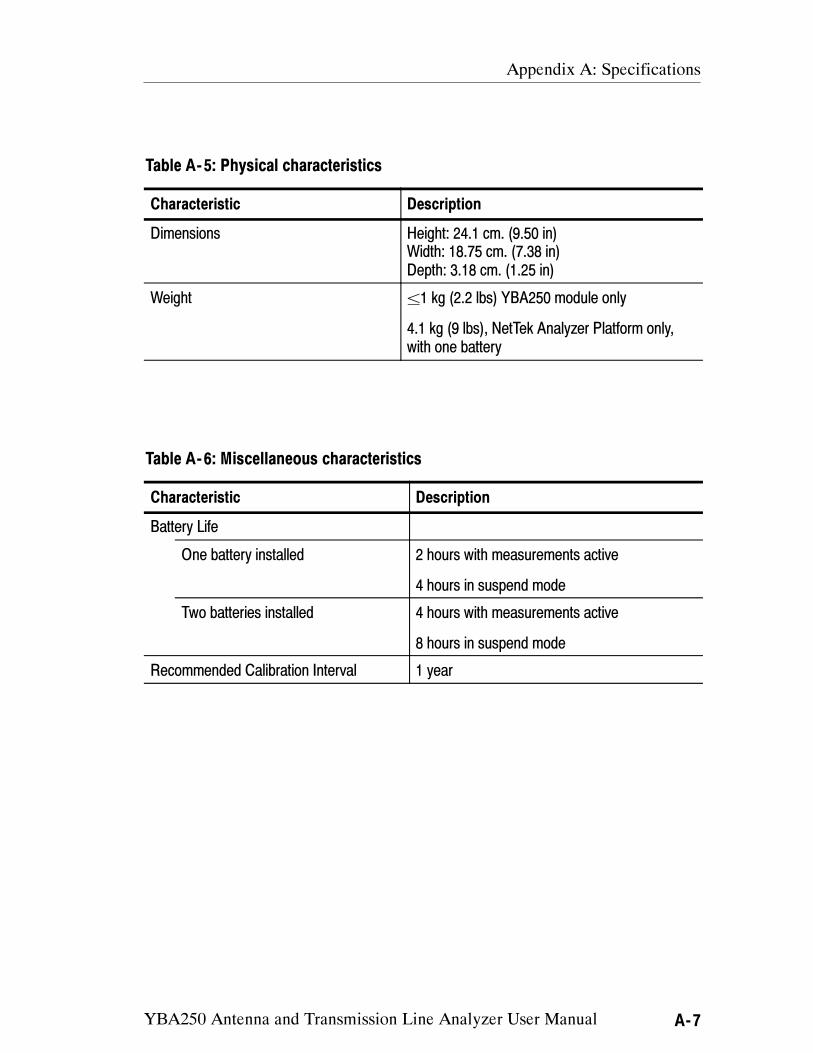
Appendix A: Specifications
YBA250 Antenna and Transmission Line Analyzer User Manual A-7
Table A- 5: Physical characteristics
Characteristic Description
Dimensions Height: 24.1 cm. (9.50 in)
Width: 18.75 cm. (7.38 in)
Depth: 3.18 cm. (1.25 in)
Weight ±1 kg (2.2 lbs) YBA250 module only
4.1 kg (9 lbs), NetTek Analyzer Platform only,
with one battery
Table A- 6: Miscellaneous characteristics
Characteristic Description
Battery Life
One battery installed 2 hours with measurements active
4 hours in suspend mode
Two batteries installed 4 hours with measurements active
8 hours in suspend mode
Recommended Calibration Interval 1 year
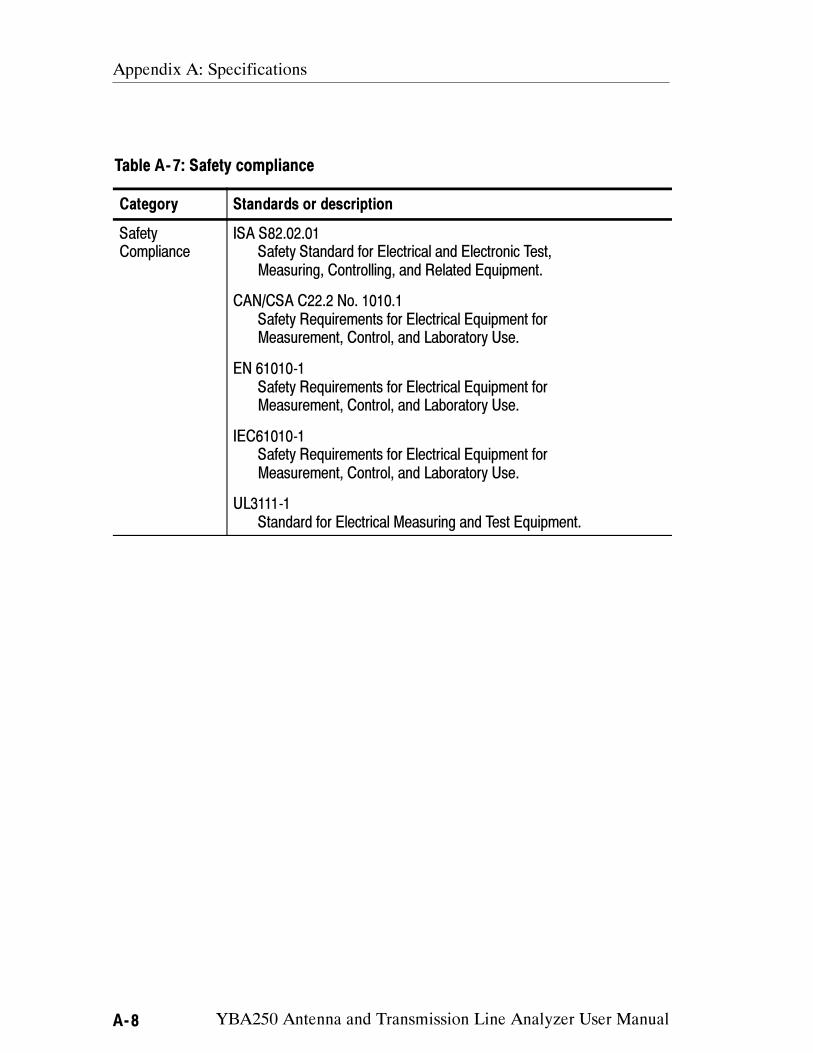
Appendix A: Specifications
A-8 YBA250 Antenna and Transmission Line Analyzer User Manual
Table A- 7: Safety compliance
Category Standards or description
Safety
Compliance
ISA S82.02.01
Safety Standard for Electrical and Electronic Test,
Measuring, Controlling, and Related Equipment.
CAN/CSA C22.2 No. 1010.1
Safety Requirements for Electrical Equipment for
Measurement, Control, and Laboratory Use.
EN 61010-1
Safety Requirements for Electrical Equipment for
Measurement, Control, and Laboratory Use.
IEC61010-1
Safety Requirements for Electrical Equipment for
Measurement, Control, and Laboratory Use.
UL3111-1
Standard for Electrical Measuring and Test Equipment.
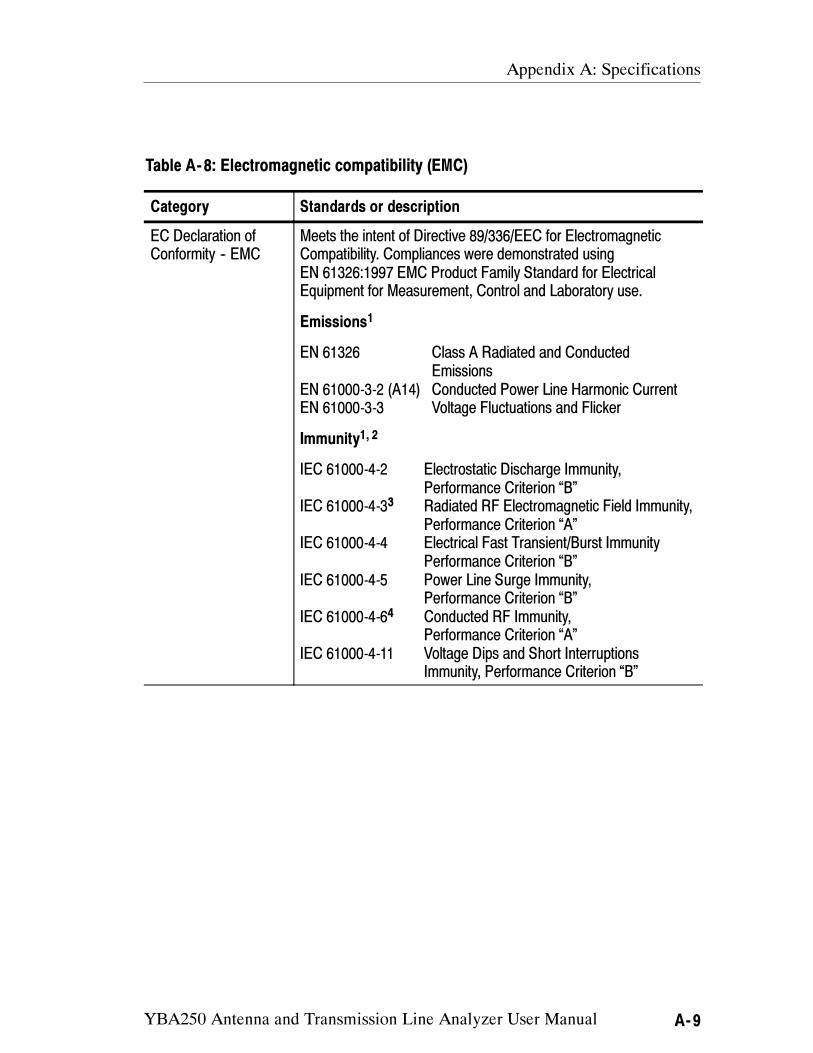
Appendix A: Specifications
YBA250 Antenna and Transmission Line Analyzer User Manual A-9
Table A- 8: Electromagnetic compatibility (EMC)
Category Standards or description
EC Declaration of
Conformity -- EMC
Meets the intent of Directive 89/336/EEC for Electromagnetic
Compatibility. Compliances were demonstrated using
EN 61326:1997 EMC Product Family Standard for Electrical
Equipment for Measurement, Control and Laboratory use.
Emissions1
EN 61326 Class A Radiated and Conducted
Emissions
EN 61000-3-2 (A14) Conducted Power Line Harmonic Current
EN 61000-3-3 Voltage Fluctuations and Flicker
Immunity1, 2
IEC 61000-4-2 Electrostatic Discharge Immunity,
Performance Criterion “B”
IEC 61000-4-33
Radiated RF Electromagnetic Field Immunity,
Performance Criterion “A”
IEC 61000-4-4 Electrical Fast Transient/Burst Immunity
Performance Criterion “B”
IEC 61000-4-5 Power Line Surge Immunity,
Performance Criterion “B”
IEC 61000-4-64
Conducted RF Immunity,
Performance Criterion “A”
IEC 61000-4-11 Voltage Dips and Short Interruptions
Immunity, Performance Criterion “B”
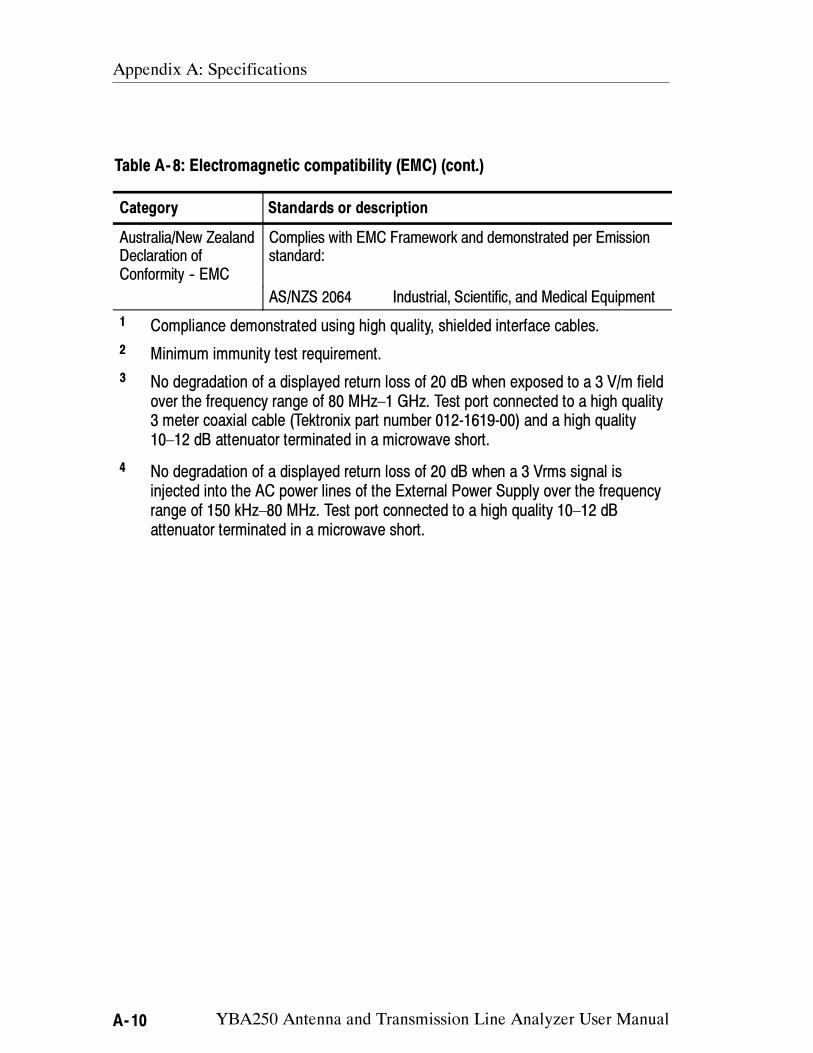
Appendix A: Specifications
A-10 YBA250 Antenna and Transmission Line Analyzer User Manual
Table A- 8: Electromagnetic compatibility (EMC) (cont.)
Category Standards or description
Australia/New Zealand
Declaration of
Conformity -- EMC
Complies with EMC Framework and demonstrated per Emission
standard:
AS/NZS 2064 Industrial, Scientific, and Medical Equipment
1Compliance demonstrated using high quality, shielded interface cables.
2Minimum immunity test requirement.
3No degradation of a displayed return loss of 20 dB when exposed to a 3 V/m field
over the frequency range of 80 MHz–1 GHz. Test port connected to a high quality
3 meter coaxial cable (Tektronix part number 012-1619-00) and a high quality
10–12 dB attenuator terminated in a microwave short.
4No degradation of a displayed return loss of 20 dB when a 3 Vrms signal is
injected into the AC power lines of the External Power Supply over the frequency
range of 150 kHz–80 MHz. Test port connected to a high quality 10–12 dB
attenuator terminated in a microwave short.
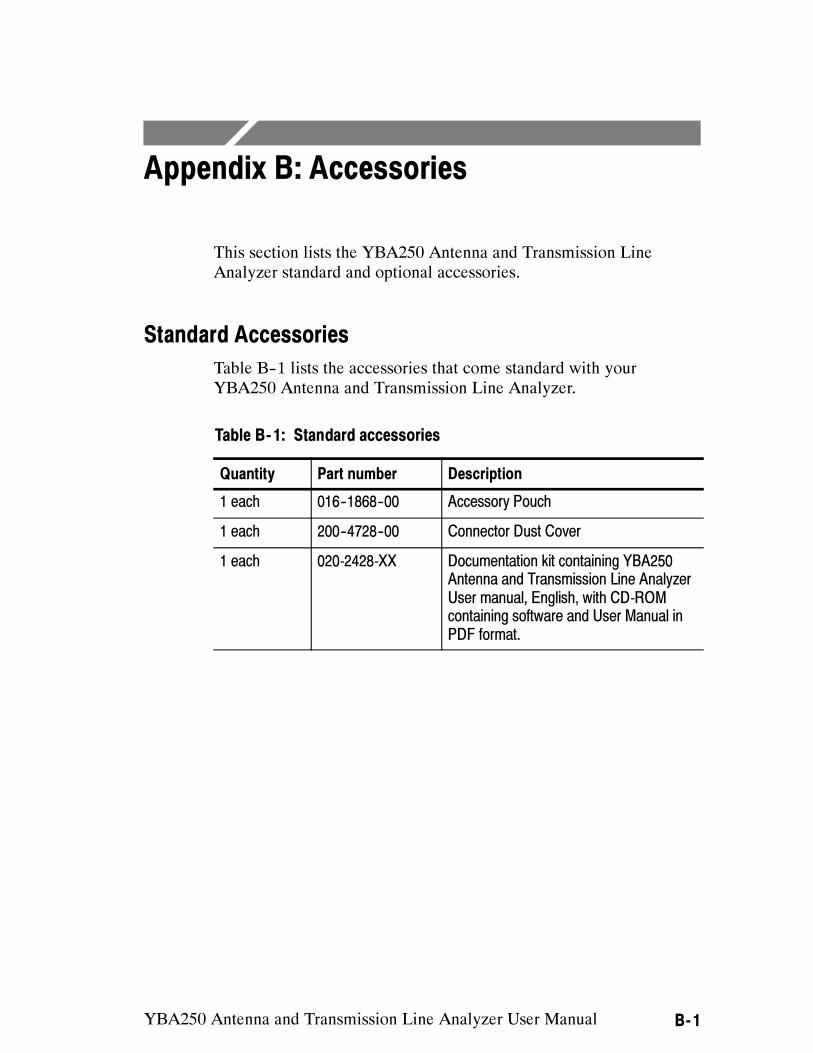
YBA250 Antenna and Transmission Line Analyzer User Manual B-1
Appendix B: Accessories
This section lists the YBA250 Antenna and Transmission Line
Analyzer standard and optional accessories.
Standard Accessories
Table B--1 lists the accessories that come standard with your
YBA250 Antenna and Transmission Line Analyzer.
Table B- 1: Standard accessories
Quantity Part number Description
1 each 016--1868--00 Accessory Pouch
1 each 200--4728--00 Connector Dust Cover
1 each 020-2428-XX Documentation kit containing YBA250
Antenna and Transmission Line Analyzer
User manual, English, with CD-ROM
containing software and User Manual in
PDF format.
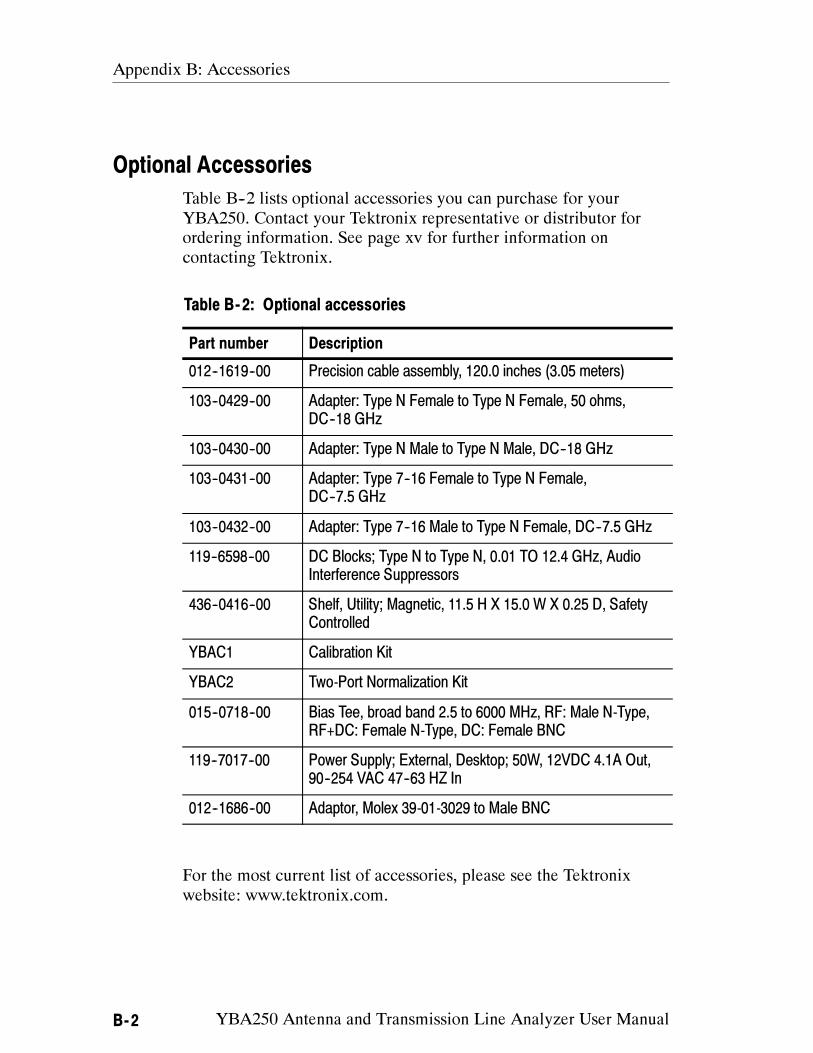
Appendix B: Accessories
B-2 YBA250 Antenna and Transmission Line Analyzer User Manual
Optional Accessories
Table B--2 lists optional accessories you can purchase for your
YBA250. Contact your Tektronix representative or distributor for
ordering information. See page xv for further information on
contacting Tektronix.
Table B- 2: Optional accessories
Part number Description
012--1619--00 Precision cable assembly, 120.0 inches (3.05 meters)
103--0429--00 Adapter: Type N Female to Type N Female, 50 ohms,
DC--18 GHz
103--0430--00 Adapter: Type N Male to Type N Male, DC--18 GHz
103--0431--00 Adapter: Type 7--16 Female to Type N Female,
DC--7.5 GHz
103--0432--00 Adapter: Type 7--16 Male to Type N Female, DC--7.5 GHz
119--6598--00 DC Blocks; Type N to Type N, 0.01 TO 12.4 GHz, Audio
Interference Suppressors
436--0416--00 Shelf, Utility; Magnetic, 11.5 H X 15.0 W X 0.25 D, Safety
Controlled
YBAC1 Calibration Kit
YBAC2 Two-Port Normalization Kit
015--0718--00 Bias Tee, broad band 2.5 to 6000 MHz, RF: Male N-Type,
RF+DC: Female N-Type, DC: Female BNC
119--7017--00 Power Supply; External, Desktop; 50W, 12VDC 4.1A Out,
90--254 VAC 47--63 HZ In
012--1686--00 Adaptor, Molex 39-01-3029 to Male BNC
For the most current list of accessories, please see the Tektronix
website: www.tektronix.com.
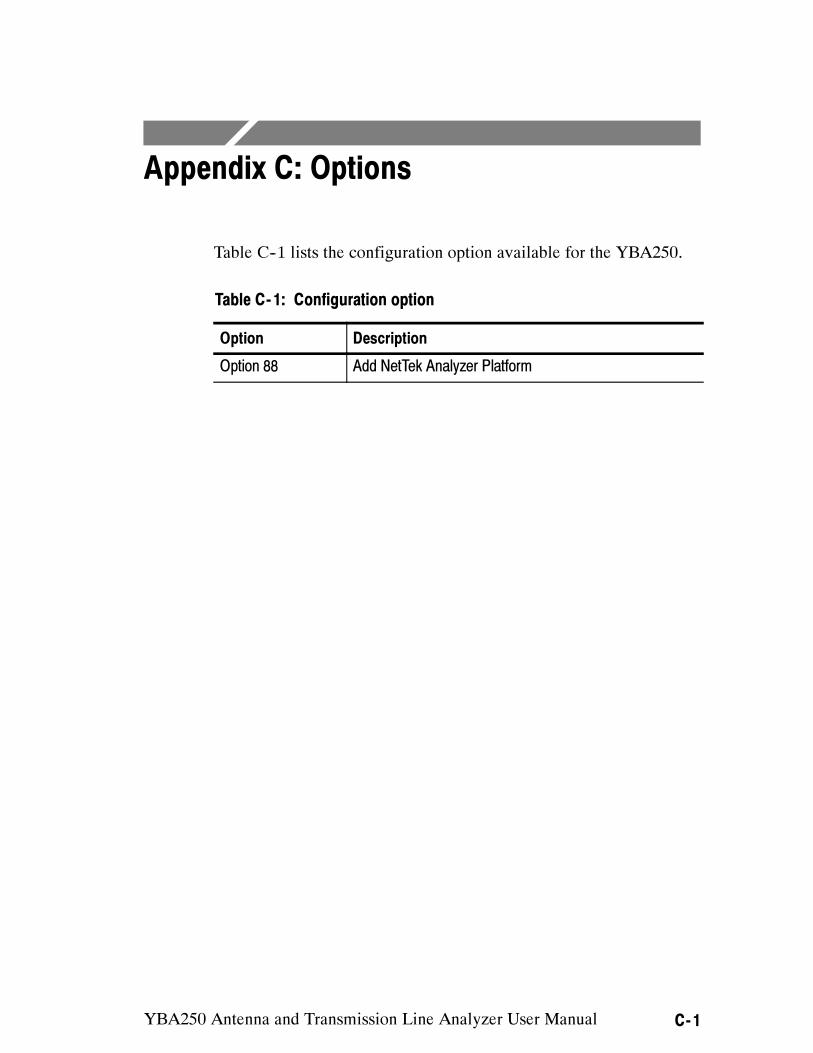
YBA250 Antenna and Transmission Line Analyzer User Manual C-1
Appendix C: Options
Table C--1 lists the configuration option available for the YBA250.
Table C- 1: Configuration option
Option Description
Option 88 Add NetTek Analyzer Platform
Appendix C: Options
C-2 YBA250 Antenna and Transmission Line Analyzer User Manual
YBA250 Antenna and Transmission Line Analyzer User Manual D-1
Appendix D: Upgrading/Reinstalling
Software
To upgrade or reinstall software for your YBA250, you will need a
Windows PC. On-screen installation instructions will guide you
through connecting to the NetTek Analyzer Platform and upgrading
or reinstalling the YBA250 software.
To upgrade or reinstall software for your YBA250:
1. Insert the YBA250 Installation SW CD-ROM (Tektronix part
number, 063-3554-XX) into your PC and follow the on-screen
instructions that appear.
2. If no instructions appear after you insert the CD-ROM, use
Windows Explorer to display the contents of the CD-ROM and
double-click the setup.exe file to begin the installation. Follow
the on-screen instructions.
3. If you received new software as part of an upgrade kit, place the
label supplied in the kit on the bottom edge of your YBA250
module.
Appendix D: Upgrading/Reinstalling Software
D-2 YBA250 Antenna and Transmission Line Analyzer User Manual
YBA250 Antenna and Transmission Line Analyzer User Manual E- 1
Appendix E: Functional Verification
Procedure
This appendix provides a functional verification procedure. The
procedure verifies the basic functionality of the YBA250. The
functional verification procedure can be used for incoming
inspection purposes.
NOTE. The functional verification procedure in this appendix does
not confirm that the YBA250 meets or exceeds the performance
requirements for the specifications listed in Appendix A.
There are two parts to this procedure:
Self Tests: provides instructions for performing the internal
diagnostic self-tests.
Functional Tests: provides instructions for verifying
capabilities not completely covered by the diagnostic
self-tests. Requires the use of a signal generator.
Self Tests
Equipment Required
None.
Prerequisite
None.
To run the internal diagnostics self-tests:
1. Power up the NetTek Analyzer Platform.
2. Press File > Exit to quit the YBA250 application, if it is running.
3. Press Start > Programs > Tektronix Utilities>Diagnostics in the
taskbar.
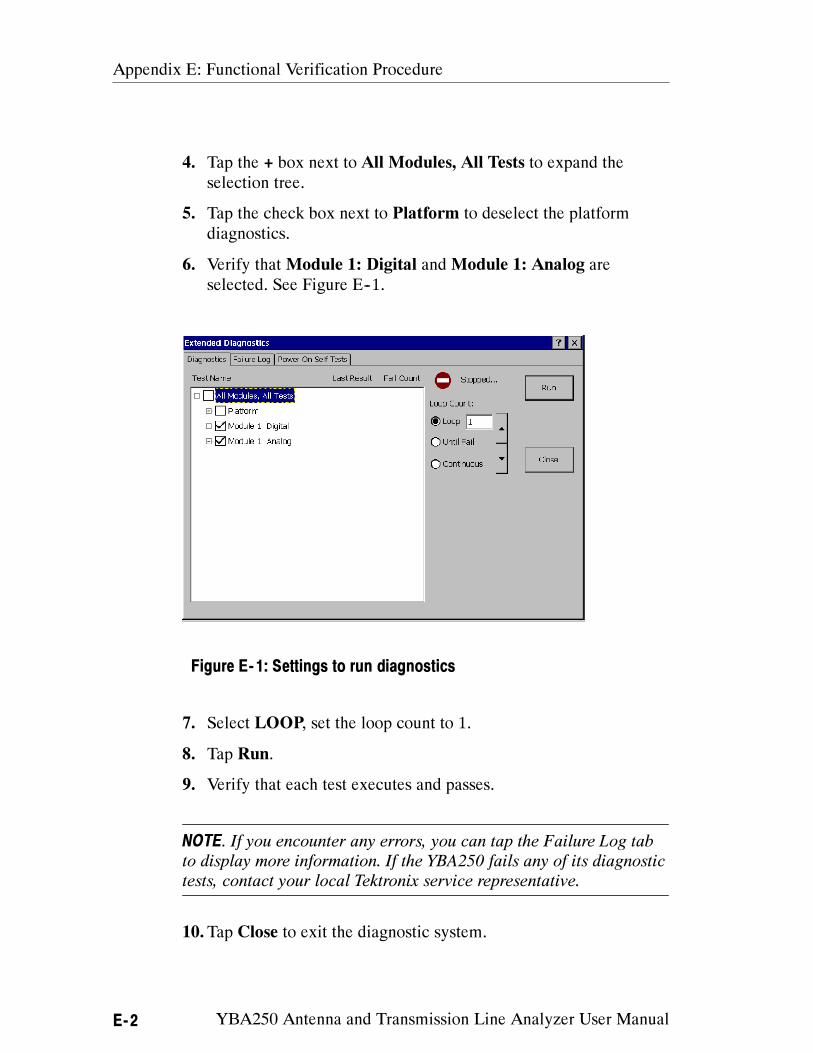
Appendix E: Functional Verification Procedure
E- 2 YBA250 Antenna and Transmission Line Analyzer User Manual
4. Tap the + box next to All Modules, All Tests to expand the
selection tree.
5. Tap the check box next to Platform to deselect the platform
diagnostics.
6. Verify that Module 1: Digital and Module 1: Analog are
selected. See Figure E--1.
Figure E- 1: Settings to run diagnostics
7. Select LOOP, set the loop count to 1.
8. Tap Run.
9. Verify that each test executes and passes.
NOTE. If you encounter any errors, you can tap the Failure Log tab
to display more information. If the YBA250 fails any of its diagnostic
tests, contact your local Tektronix service representative.
10.Tap Close to exit the diagnostic system.
Appendix E: Functional Verification Procedure
YBA250 Antenna and Transmission Line Analyzer User Manual E- 3
Functional Tests
In the following test, you will perform a User calibration and then
measure the return loss of a 50 Ω load from a calibration kit.
Equipment Required
Calibration Kit (Tektronix YBAC1 or equivalent)
Prerequisite
None
NOTE. These procedures verify only that the YBA250 is operating
correctly. They do not verify that the YBA250 meets warranted
specifications.
To perform the functional test:
1. Power up the NetTek Analyzer Platform.
2. If necessary, launch the YBA250 application by double-tapping
the YBA250 icon on the desktop or selecting Start >
Programs > NetTek > YBA250 from the Taskbar.
3. Select Return Loss from the Measurement drop-down list.
4. Tap the Continuous mode button .
5. Allow the NetTek Analyzer Platform to run for five to ten
minutes to warm up.
6. In the main display, tap the Calibration... button .
This displays the Calibration window. See Figure E--2.
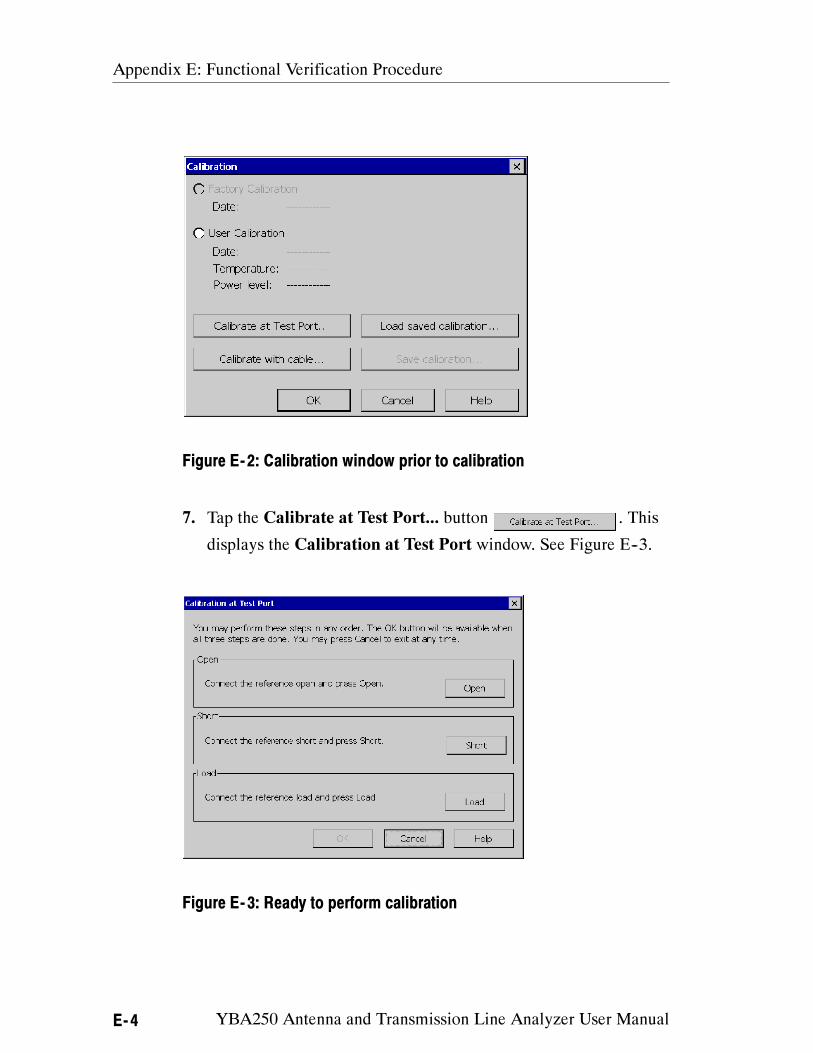
Appendix E: Functional Verification Procedure
E- 4 YBA250 Antenna and Transmission Line Analyzer User Manual
Figure E- 2: Calibration window prior to calibration
7. Tap the Calibrate at Test Port... button . This
displays the Calibration at Test Port window. See Figure E--3.
Figure E- 3: Ready to perform calibration
Appendix E: Functional Verification Procedure
YBA250 Antenna and Transmission Line Analyzer User Manual E- 5
8. Carefully attach the OPEN calibration standard to the Test Port
connector using the procedure described on page 2--20.
9. Tap the Open button in the Calibration at Test Port window.
When the calibration is completed, Done appears above the Open
button.
10.Remove the OPEN calibration standard from the Test Port
connector.
11. Carefully attach the SHORT calibration standard to the Test Port
connector.
12.Tap the Short button in the New Calibration window. When the
calibration is completed, Done appears above the Short button.
13.Remove the SHORT calibration standard from the Test Port
connector.
14.Carefully attach the LOAD calibration standard to the Test Port
connector.
15.Tap the Load button. When the calibration is completed, Done
appears above the Load button.
16.Carefully remove the LOAD calibration standard from the Test
Port connector.
17.Once calibration has been completed for all three standards, tap
the OK button. The OK button is not selectable until all three
calibration standards have been marked as done. See Figure E--4.
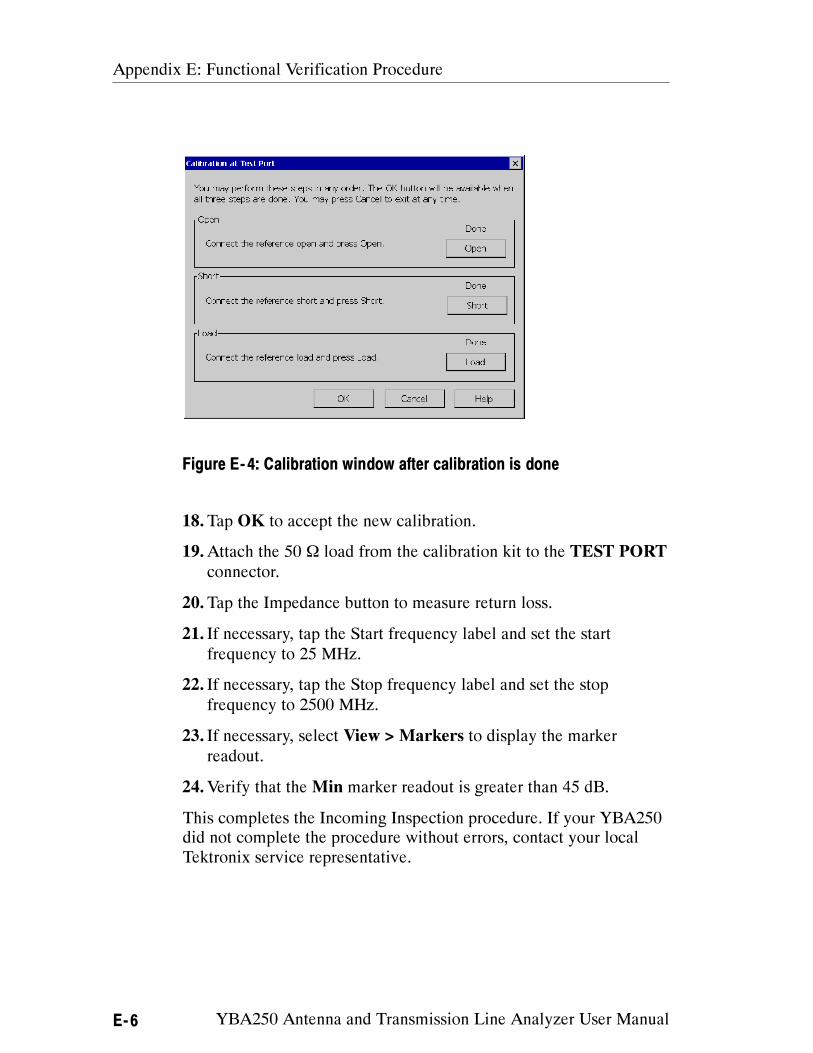
Appendix E: Functional Verification Procedure
E- 6 YBA250 Antenna and Transmission Line Analyzer User Manual
Figure E- 4: Calibration window after calibration is done
18.Tap OK to accept the new calibration.
19.Attach the 50 Ω load from the calibration kit to the TEST PORT
connector.
20.Tap the Impedance button to measure return loss.
21. If necessary, tap the Start frequency label and set the start
frequency to 25 MHz.
22. If necessary, tap the Stop frequency label and set the stop
frequency to 2500 MHz.
23. If necessary, select View > Markers to display the marker
readout.
24.Verify that the Min marker readout is greater than 45 dB.
This completes the Incoming Inspection procedure. If your YBA250
did not complete the procedure without errors, contact your local
Tektronix service representative.
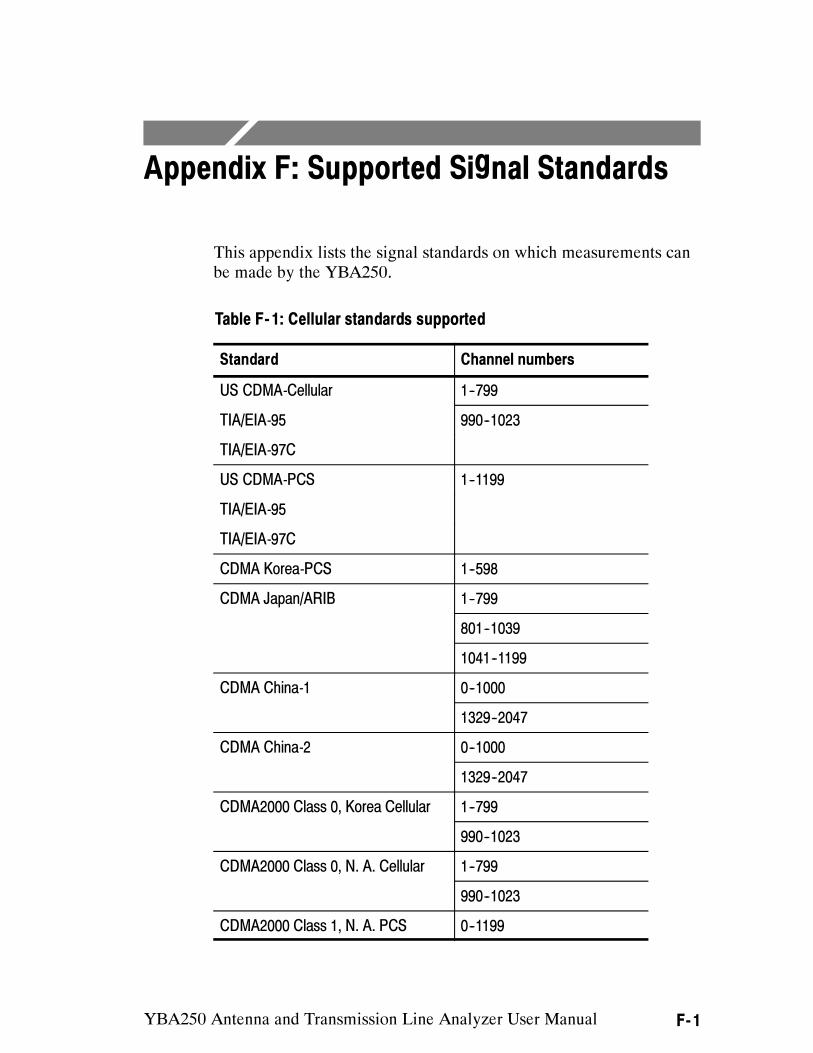
YBA250 Antenna and Transmission Line Analyzer User Manual F- 1
Appendix F: Supported Signal Standards
This appendix lists the signal standards on which measurements can
be made by the YBA250.
Table F- 1: Cellular standards supported
Standard Channel numbers
US CDMA-Cellular 1--799
TIA/EIA-95 990--1023
TIA/EIA-97C
US CDMA-PCS 1--1199
TIA/EIA-95
TIA/EIA-97C
CDMA Korea-PCS 1--598
CDMA Japan/ARIB 1--799
801--1039
1041--1199
CDMA China-1 0--1000
1329--2047
CDMA China-2 0--1000
1329--2047
CDMA2000 Class 0, Korea Cellular 1--799
990--1023
CDMA2000 Class 0, N. A. Cellular 1--799
990--1023
CDMA2000 Class 1, N. A. PCS 0--1199

Appendix F: Supported Signal Standards
F- 2 YBA250 Antenna and Transmission Line Analyzer User Manual
Table F- 1: Cellular standards supported (Cont.)
Standard Channel numbers
CDMA2000 Class 2 (TACS Band) 0--1000
1329--2047
CDMA2000 Class 3 (JTACS Band) 1--799( )
801--1039
1041--1199
1201--1600
CDMA2000 Class 4, Korea PCS 0--599
CDMA2000 Class 5, (NMT-450W
25 kH )
1--300(
25 kHz)
539--871
CDMA2000 Class 5, (NMT-450N
20 kH )
1039--1473(
20 kHz)
1792--2016
CDMA2000 Class 6, IMT-2000 0--1199
CDMA2000 Class 7, N. A. 700 MHz
Cell Band
0--359
CDMA2000 Class 8, GSM Band 0--1499
CDMA2000 Class 9, GSM Band 0--699
CDMA2000 Class 10, SMR 800 Band 0--719
720--919
W-CDMA (UMTS) 9612--9888
10562--10838
W-CDMA (NA--PCS) 9262--9538( )
9662--9938
W-CDMA (NA--Addl. PCS) 12--287( )
412--687

Appendix F: Supported Signal Standards
YBA250 Antenna and Transmission Line Analyzer User Manual F- 3
Table F- 1: Cellular standards supported (Cont.)
Standard Channel numbers
W-CDMA (DCS1800) 8562--8913( )
9037--9388
NADC IS-136 Cellular 1--799
990--1023
NADC--PCS / IS-136 1--1999
SMR 800 -- 25kHz 1--600
SMR 800 -- 12.5kHz 1--1199
SMR 1500 1--479
GSM 450 259--293
GSM 480 306--340
GSM 850 128--251
GSM--E 900 0--124
975--1023
GSM--P 900 1--124
GSM--R 900 0--124
955--1023
GSM 1800 512--885
GSM 1900 512--810
PDC1500 (JDC) 0--960
PHS 1--77
AMPS / EIA 553 1--799
990--1023
N-AMPS / IS-88 1--799 (NM,NL, and
NU)
990--1023 (NM,NL, and
NU)
TACS 1--1000
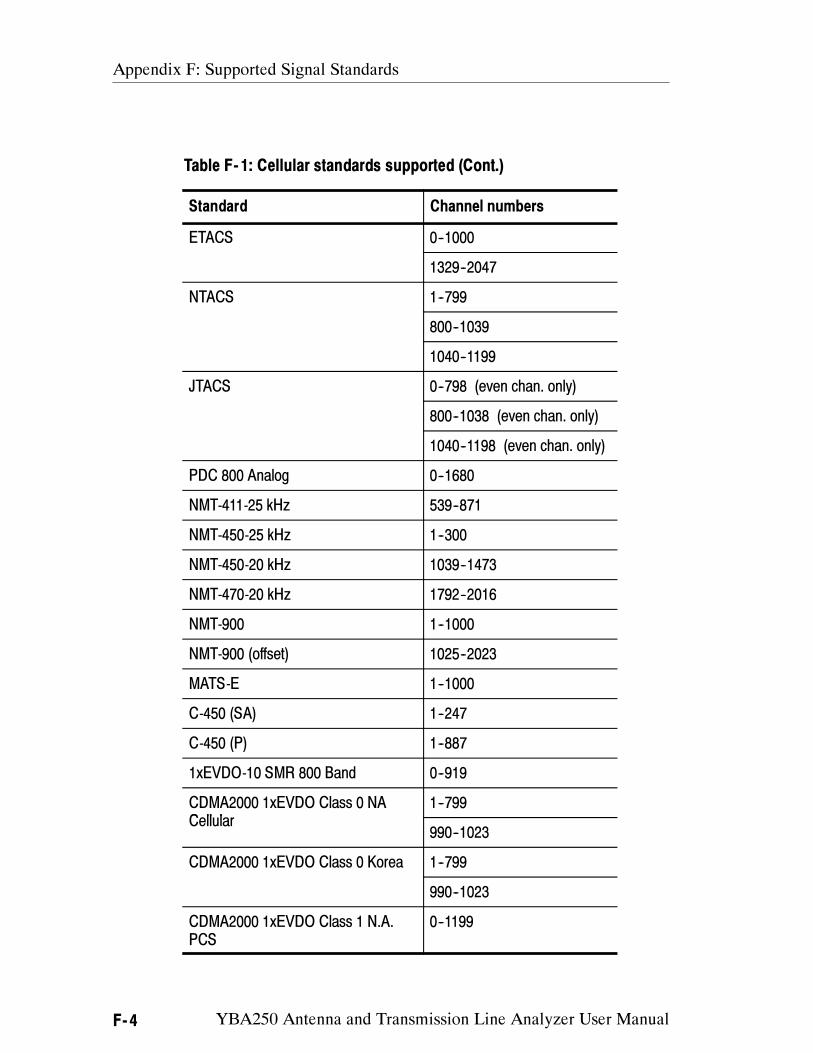
Appendix F: Supported Signal Standards
F- 4 YBA250 Antenna and Transmission Line Analyzer User Manual
Table F- 1: Cellular standards supported (Cont.)
Standard Channel numbers
ETACS 0--1000
1329--2047
NTACS 1--799
800--1039
1040--1199
JTACS 0--798 (even chan. only)
800--1038 (even chan. only)
1040--1198 (even chan. only)
PDC 800 Analog 0--1680
NMT-411-25 kHz 539--871
NMT-450-25 kHz 1--300
NMT-450-20 kHz 1039--1473
NMT-470-20 kHz 1792--2016
NMT-900 1--1000
NMT-900 (offset) 1025--2023
MATS-E 1--1000
C-450 (SA) 1--247
C-450 (P) 1--887
1xEVDO-10 SMR 800 Band 0--919
CDMA2000 1xEVDO Class 0 NA
C ll l
1--799
Cellular
990--1023
CDMA2000 1xEVDO Class 0 Korea 1--799
990--1023
CDMA2000 1xEVDO Class 1 N.A.
PCS
0--1199

Appendix F: Supported Signal Standards
YBA250 Antenna and Transmission Line Analyzer User Manual F- 5
Table F- 1: Cellular standards supported (Cont.)
Standard Channel numbers
CDMA2000 1xEVDO Class 2 TACS
B d
0--1000
Band
1329--2047
CDMA2000 1xEVDO Class 3 JTACS
B d
1--799
Band
801--1039
1041--1199
1201--1600
CDMA2000 1xEVDO Class 4 Korea
PCS
0--599
CDMA2000 1xEVDO Class 5
NMT 25k 450
1--300
NMT--25k--450
539--871
CDMA2000 1xEVDO Class 5
NMT 20k 450
1039--1473
NMT--20k--450
1792--2016
CDMA2000 1xEVDO Class 6
IMT--2000
0--1199
CDMA2000 1xEVDO Class 7 N.A.
700 MHz Cellular
0--359
CDMA2000 1xEVDO Class 8 GSM
Band
0--1499
CDMA2000 1xEVDO Class 9 GSM
Band
0--699
CDMA2000 1xEVDO Class 10 SMR
800 B d
0--719
800 Band
720--919
Appendix F: Supported Signal Standards
F- 6 YBA250 Antenna and Transmission Line Analyzer User Manual

YBA250 Antenna and Transmission Line Analyzer User Manual G-1
Appendix G: Customizing the Channel
Table
This appendix describes how to modify the Channel Table to meet
your testing needs.
Customizing the Channel Table
The Channel Table is a file used by the YBA250 to specify the
characteristics of the channels assigned to a signal standard. You can
customize the Channel Table to suit the specific needs of your
system. For example, if you have set the bandwidth of your channels
to be wider than the standard bandwidth, you can specify the wider
bandwidth in a customized Channel Table. If your system’s channel
bandwidth is non-standard and the YBA250 is using the standard
Channel Table, the test frequency range based on the standard
channel bandwidth will not be accurate for your system.
The YBA250 looks for a file named UserStandards.txt in the
\BuiltInDisk folder when it starts up. If it does not find the file, the
YBT250 then looks for the standard channel table file, SignalStan-
dards.txt, in the NetTekApps\YBA250 folder. If that file is not found,
a dialog box will be displayed informing you that no standards file
was found, so a new channel table will be generated using internal
default values.
Creating a Custom Channel Table
To create a custom channel table:
1. Locate the existing SignalStandards.txt file in either the
\BuiltInDisk\NetTekApps\YBA250 folder or
\NetTekApps\YBA250 folder (only if the application software
loaded into volatile memory instead of flash memory).
2. Copy the SignalStandards.txt file to the \BuiltInDisk folder.
The YBA250 will look only in the \BuiltInDisk folder for a
custom channel table.
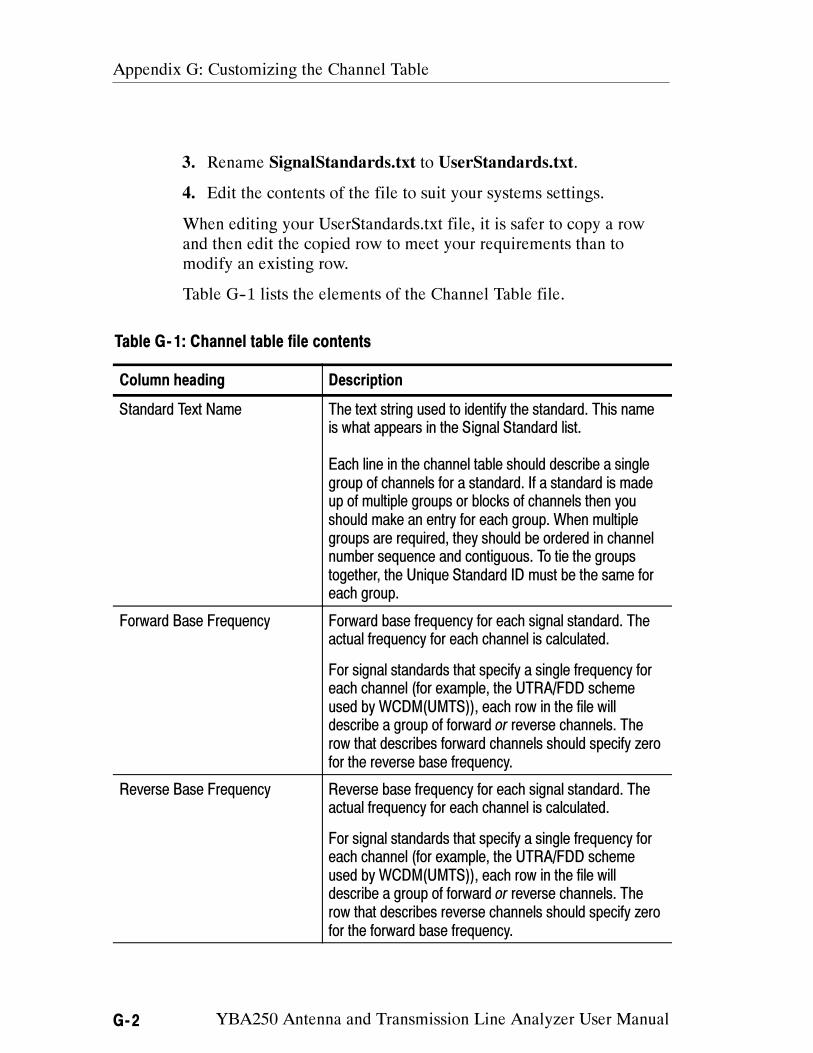
Appendix G: Customizing the Channel Table
G-2 YBA250 Antenna and Transmission Line Analyzer User Manual
3. Rename SignalStandards.txt to UserStandards.txt.
4. Edit the contents of the file to suit your systems settings.
When editing your UserStandards.txt file, it is safer to copy a row
and then edit the copied row to meet your requirements than to
modify an existing row.
Table G--1 lists the elements of the Channel Table file.
Table G- 1: Channel table file contents
Column heading Description
Standard Text Name The text string used to identify the standard. This name
is what appears in the Signal Standard list.
Each line in the channel table should describe a single
group of channels for a standard. If a standard is made
up of multiple groups or blocks of channels then you
should make an entry for each group. When multiple
groups are required, they should be ordered in channel
number sequence and contiguous. To tie the groups
together, the Unique Standard ID must be the same for
each group.
Forward Base Frequency Forward base frequency for each signal standard. The
actual frequency for each channel is calculated.
For signal standards that specify a single frequency for
each channel (for example, the UTRA/FDD scheme
used by WCDM(UMTS)), each row in the file will
describe a group of forward or reverse channels. The
row that describes forward channels should specify zero
for the reverse base frequency.
Reverse Base Frequency Reverse base frequency for each signal standard. The
actual frequency for each channel is calculated.
For signal standards that specify a single frequency for
each channel (for example, the UTRA/FDD scheme
used by WCDM(UMTS)), each row in the file will
describe a group of forward or reverse channels. The
row that describes reverse channels should specify zero
for the forward base frequency.
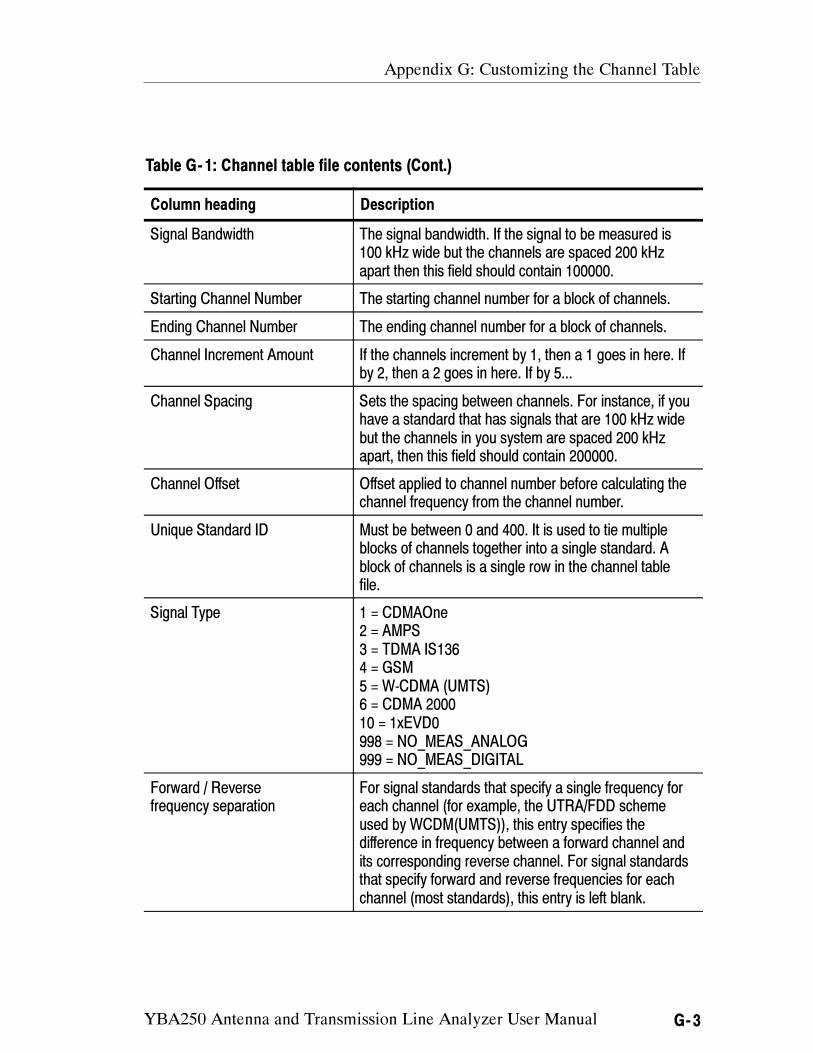
Appendix G: Customizing the Channel Table
YBA250 Antenna and Transmission Line Analyzer User Manual G-3
Table G- 1: Channel table file contents (Cont.)
Column heading Description
Signal Bandwidth The signal bandwidth. If the signal to be measured is
100 kHz wide but the channels are spaced 200 kHz
apart then this field should contain 100000.
Starting Channel Number The starting channel number for a block of channels.
Ending Channel Number The ending channel number for a block of channels.
Channel Increment Amount If the channels increment by 1, then a 1 goes in here. If
by 2, then a 2 goes in here. If by 5...
Channel Spacing Sets the spacing between channels. For instance, if you
have a standard that has signals that are 100 kHz wide
but the channels in you system are spaced 200 kHz
apart, then this field should contain 200000.
Channel Offset Offset applied to channel number before calculating the
channel frequency from the channel number.
Unique Standard ID Must be between 0 and 400. It is used to tie multiple
blocks of channels together into a single standard. A
block of channels is a single row in the channel table
file.
Signal Type 1 = CDMAOne
2 = AMPS
3 = TDMA IS136
4 = GSM
5 = W-CDMA (UMTS)
6 = CDMA 2000
10 = 1xEVD0
998 = NO_MEAS_ANALOG
999 = NO_MEAS_DIGITAL
Forward / Reverse
frequency separation
For signal standards that specify a single frequency for
each channel (for example, the UTRA/FDD scheme
used by WCDM(UMTS)), this entry specifies the
difference in frequency between a forward channel and
its corresponding reverse channel. For signal standards
that specify forward and reverse frequencies for each
channel (most standards), this entry is left blank.
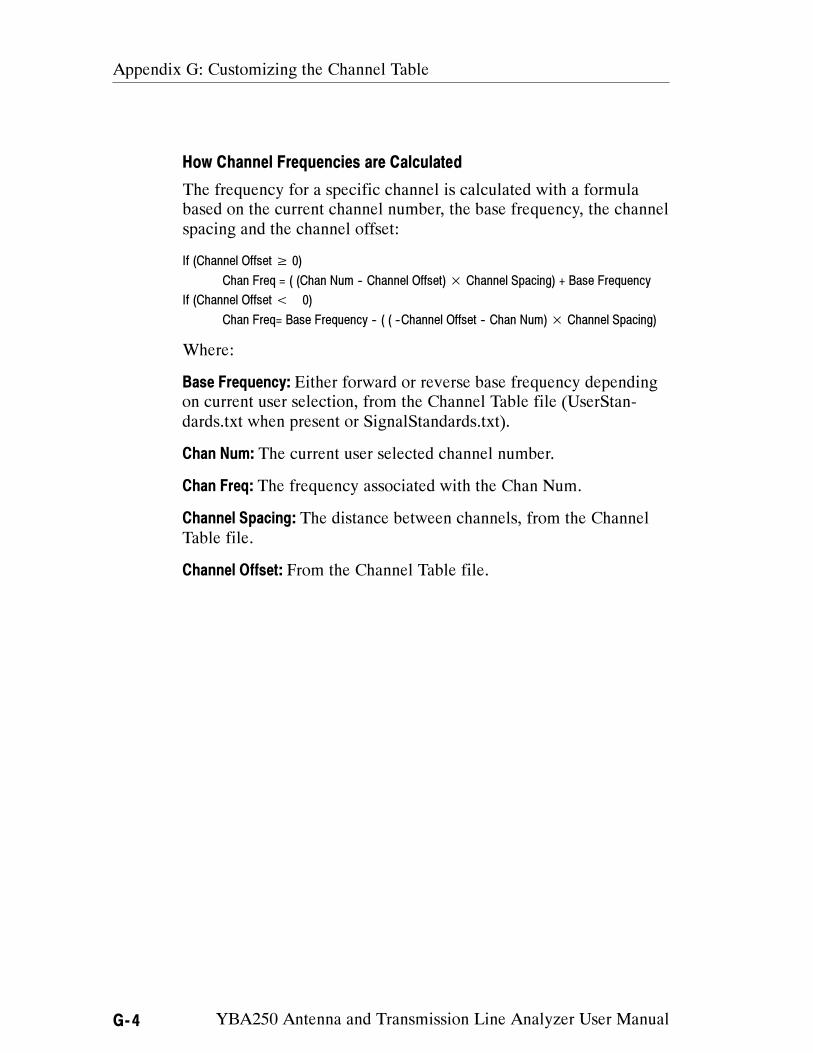
Appendix G: Customizing the Channel Table
G-4 YBA250 Antenna and Transmission Line Analyzer User Manual
How Channel Frequencies are Calculated
The frequency for a specific channel is calculated with a formula
based on the current channel number, the base frequency, the channel
spacing and the channel offset:
If (Channel Offset ≥ 0)
Chan Freq = ( (Chan Num -- Channel Offset)× Channel Spacing) + Base Frequency
If (Channel Offset< 0)
Chan Freq= Base Frequency -- ( ( --Channel Offset -- Chan Num)× Channel Spacing)
Where:
Base Frequency: Either forward or reverse base frequency depending
on current user selection, from the Channel Table file (UserStan-
dards.txt when present or SignalStandards.txt).
Chan Num: The current user selected channel number.
Chan Freq: The frequency associated with the Chan Num.
Channel Spacing: The distance between channels, from the Channel
Table file.
Channel Offset: From the Channel Table file.

Glossary

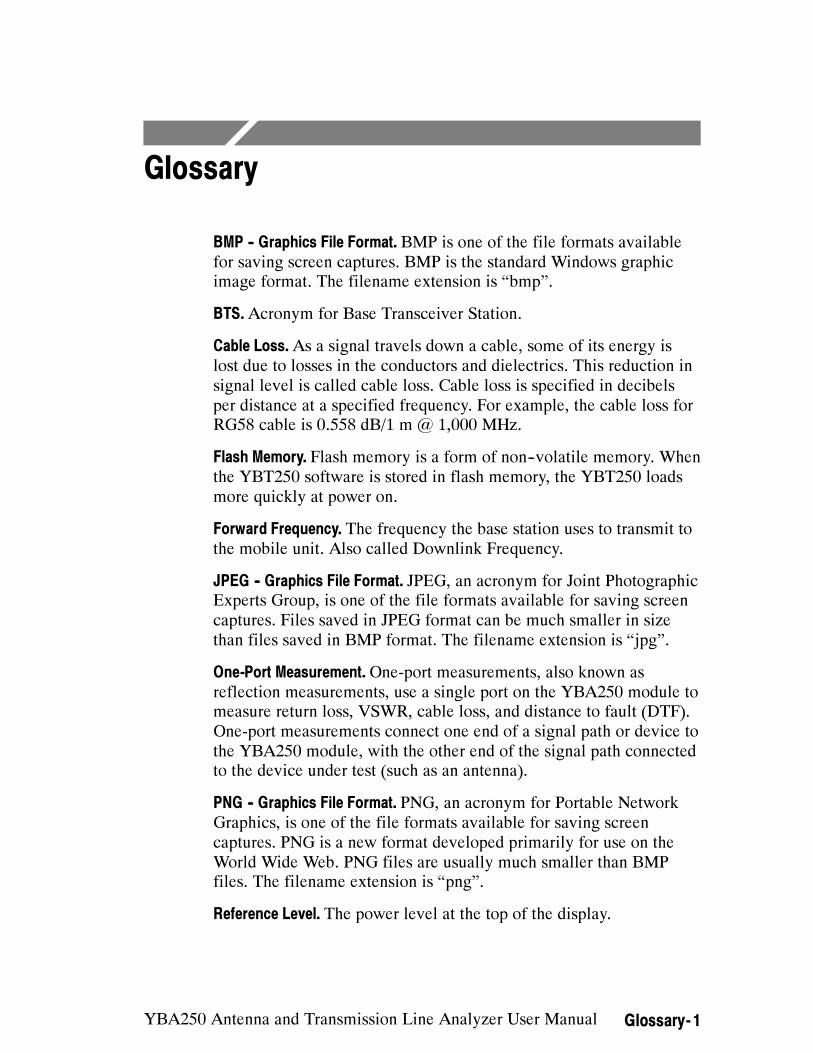
YBA250 Antenna and Transmission Line Analyzer User Manual Glossary- 1
Glossary
BMP -- Graphics File Format. BMP is one of the file formats available
for saving screen captures. BMP is the standard Windows graphic
image format. The filename extension is “bmp”.
BTS.Acronym for Base Transceiver Station.
Cable Loss.As a signal travels down a cable, some of its energy is
lost due to losses in the conductors and dielectrics. This reduction in
signal level is called cable loss. Cable loss is specified in decibels
per distance at a specified frequency. For example, the cable loss for
RG58 cable is 0.558 dB/1 m @ 1,000 MHz.
Flash Memory. Flash memory is a form of non--volatile memory. When
the YBT250 software is stored in flash memory, the YBT250 loads
more quickly at power on.
Forward Frequency. The frequency the base station uses to transmit to
the mobile unit. Also called Downlink Frequency.
JPEG -- Graphics File Format. JPEG, an acronym for Joint Photographic
Experts Group, is one of the file formats available for saving screen
captures. Files saved in JPEG format can be much smaller in size
than files saved in BMP format. The filename extension is “jpg”.
One-Port Measurement.One-port measurements, also known as
reflection measurements, use a single port on the YBA250 module to
measure return loss, VSWR, cable loss, and distance to fault (DTF).
One-port measurements connect one end of a signal path or device to
the YBA250 module, with the other end of the signal path connected
to the device under test (such as an antenna).
PNG -- Graphics File Format. PNG, an acronym for Portable Network
Graphics, is one of the file formats available for saving screen
captures. PNG is a new format developed primarily for use on the
World Wide Web. PNG files are usually much smaller than BMP
files. The filename extension is “png”.
Reference Level. The power level at the top of the display.
Glossary
Glossary- 2 YBA250 Antenna and Transmission Line Analyzer User Manual
Return Loss. Return Loss is a ratio of the power sent to the antenna
versus the power reflected by the antenna. A larger Return Loss is
better because less power is reflected.
Reverse Frequency. The frequency the mobile unit uses to transmit to
the base station. Also called uplink frequency, reverse channel or
uplink channel.
Span. The frequency range covered by the display graph.
TMA.Acronym for Tower-Mounted Amplifier.
Two-Port Measurement. Two-port measurements, also known as
transmission measurements, provide insertion gain and loss
measurements such as filter response (loss) versus frequency and
tower-mounted amplifier (TMA) gain versus frequency. Both a
YBA250 and YBT250 module must be installed on the NetTek
Analyzer to perform two-port Insertion Gain/Loss measurements.
The YBA250 module injects a signal into the device or system under
test, and the YBT250 module receives and measures the resultant
signal.
Velocity of Propagation. The Velocity of Propagation is the velocity at
which a signal travels through the cable. Velocity of propagation is
expressed as a fraction of the speed of light. A Velocity of Propaga-
tion equal to 1 means that the signal is traveling down the cable at
the speed of light. A Velocity of Propagation equal to 0.5 means that
the signal is traveling down the cable at half the speed of light.
VSWR.VSWR (Voltage Standing Wave Ratio) is a measure of the
ratio of the maximum resultant voltage to the minimum resultant
voltage along a transmission line. It represents the amount of
impedance mismatch between the transmission line and the load. For
VSWR, the lower the number, the better. The best possible VSWR is
1.0, which means the impedance of a transmission line and its load
match perfectly.

Index

YBA250 Antenna and Transmission Line Analyzer User Manual Index- 1
Index
A
a02 - a06 file extensions, 3--40
Address, Tektronix, xv
attaching precision connectors and
cables, 2--20
Average, trace type, 3--33
B
Band Edge Cursor, 3--49
View menu, 2--15
BATTERIES indicator, 1--2
battery, installing, 1--7
battery life, A--7
bias tee
connection notes, 3--29
connector and power
supply, 3--29
BMP, Glossary--1
BTS, Glossary--1
button, rotate traces, 3--38
buttons
Chan, 3--4
command bar area, 2--8
help, 2--4
program, 2--2
shared control area, 2--10
tuning control area, 2--9, 2--12
C
cable loss, 3--11, Glossary--1
cable standards table,
customizing, 3--20
cable type, user defined, 3--19
Cable Types tab, 3--17
calibration, 2--25
calibration guidelines, 2--38
calibration interval, A--7
cellular standards supported, F--1
Center frequency setting, 3--16
Chan button, 3--4
changing vertical scale units, 3--16
channel table, G--1
customizing, G--1
Compare Save... command, File
menu, 2--13
Compare Saved command, 3--39
comparing traces, 3--38
connecting to an antenna, 2--21
connecting to TMA, 3--28
connector, input, 1--3
Contacting Tektronix, xv
Continuous button, 2--8
controls, front panel, 1--1
conventions, xiv
Coordinates, saving
GPS data, 2--61
Cover Distance setting, 3--23
creating a default
normalization, 2--44
creating a user normalization, 2--45
customizing the cable standards
table, 3--20
CW signal mode, 3--31
CW Signal Mode button, 2--11
Index
Index- 2 YBA250 Antenna and Transmission Line Analyzer User Manual
D
DC power adapter, 1--6
Default (normalization), 2--43
default normalization,
creating, 2--44
Define Mask, View Menu, 2--14
Define Trace 2, View Menu, 2--14
Define Trace 2 tab, 3--38
Desktop
icons, 2--3
overview, 2--1
status area, 2--2
desktop
icon, 2--2
program button, 2--2
Start menu, 2--2
taskbar, 2--2
desktop AC power supply, 1--6
dimensions, external, A--7
display, preferences, 2--57
displaying, saved traces, 3--37
Distance button, 2--10
distance to a fault, 3--13
distance units, setting, 3--35
E
Edit command, Setup menu, 2--15
enabling signal
standards, 2--53, 3--1
Exit command, File menu, 2--14
Export Results command, File
menu, 2--13
Export Screen As command, File
menu, 2--14
Export Screen command, File
menu, 2--13
exporting
results, 3--64
screens, 3--65
external power supplies, 1--6
F
Factory calibration status, 2--28
Factory Reset command, Tools
menu, 2--16
file extensions, results files, 3--40
File menu, 2--13
file options, setting, 2--58
file prefix, setting, 2--59
filename length, 2--60
find information, start Help, 2--4
flash memory, Glossary--1
floppy disk button, 2--8
Folder icon, 2--8
forward frequency, Glossary--1
Frequency button, 2--10
front--panel controls, 1--1
functional verification, E--1
G
GPS receiver set up, 2--61
guidelines
calibration, 2--38
normalization, 2--50
H
Hardware Info command, Tools
menu, 2--16
Help
find information, 2--4
icon, 2--4
help icon, 2--9
hide program, 2--2
Index
YBA250 Antenna and Transmission Line Analyzer User Manual Index- 3
I
Icon, status, 2--3
icons
?, 2--4
command bar area, 2--8
desktop, 2--2, 2--3
shared control area, 2--10
tuning control area, 2--9, 2--12
in--vehicle DC adapter, 1--6
incoming inspection, E--1
information, getting help, 2--4
input connector, 1--3, 2--21
Input panel, enter keyboard
characters, 2--17
insertion gain, 3--26
insertion gain or loss,
measuring, 3--27
Insertion Gain/Loss button, 2--10
insertion loss, 3--26
Installing
shoulder strap, 1--18
strand hook, 1--18
installing, YBA250 module, 1--4
J
JPG, Glossary--1
K
Keyboard, (soft) input panel, 2--17
Keyboard command, Tools
menu, 2--16
keypad button, 2--11
knob, 2--11
L
length of filename, 2--60
Limit Bandwidth setting, 3--16
loading a user normalization, 2--48
Location data, saving GPS
coordinates, 2--61
Lock-up, recovering from, 1--2
M
M1 Trace 1, M2 Trace 2, 3--47
Marker 1, View menu, 2--15
Marker 2, View menu, 2--15
Marker Max, View menu, 2--15
Marker Min, View menu, 2--15
Markers
M1 Trace 1, M2 Trace 2, 3--47
View menu, 2--15
markers
measuring frequency and
level, 3--48
readouts, 3--45
viewing, 3--43
Mask, View Menu, 2--14
Mask Maker... command, Tools
menu, 2--16
Max trace type, 3--34
measurement overview, 2--23
measurements
cable loss, 3--11
distance to fault, 3--13
insertion gain, 3--26
insertion loss, 3--26
return loss, 3--8
VSWR, 3--8
Menus
File, 2--13
Help, 2--4
Setup, 2--15
Start, 2--2
Index
Index- 4 YBA250 Antenna and Transmission Line Analyzer User Manual
Tools, 2--16
View, 2--14
Method setting, 2--56
Min trace type, 3--33
Min/Max trace type, 3--34
N
Normal, trace type, 3--33
normalization
creating a default
normalization, 2--44
creating a user
normalization, 2--45
default, 2--40
dialog elements, 2--40
dialog status labels, 2--42
displaying normalization
dialog, 2--40
guidelines, 2--50
loading a user
normalization, 2--48
overview, 2--40
saving a user normalization, 2--46
type status labels, 2--43
Default, 2--43
UnNormalized, 2--44
User, 2--43
User?, 2--43
user, 2--40
Not Valid (normalization), 2--42
notes, entering, 2--60
numeric keypad button, 2--11
O
On--Off button, 1--2
one--port measurement, 2--23,
Glossary--1
Open button, 2--8
Open command
File menu, 2--13
Setup menu, 2--15
Options, C--1
Options command, Tools
menu, 2--16
output power, setting, 2--54
P
Pause button, 2--8
Phone number, Tektronix, xv
PNG, Glossary--1
power supplies, external, 1--6
power switch, 1--2, 1--14
precision connectors and
cables, 2--19
Preferences tab, 2--57
Print command, File menu, 2--14
Product support, contact
information, xv
program button, 2--2
Q
question mark icon, 2--9
R
recalling results, 3--63
recalling setups, 3--69
reference level, Glossary--1
removing precision connectors and
cables, 2--20
Reset
hardware, 1--2
software, 1--13
Index
YBA250 Antenna and Transmission Line Analyzer User Manual Index- 5
reset switch, 1--2
Restart button, 2--8
results
exporting, 3--64
recalling, 3--63
saving, 3--61
Results Properties command, File
menu, 2--14
return loss, 3--8, Glossary--2
reverse frequency, Glossary--2
Rotate Trace Order, View
menu, 2--14
rotate traces button, 3--38
Running indicator, 2--8
S
Save & Export tab, 2--59
Save command, Setup menu, 2--15
Save Results command, File
menu, 2--13
Save Results As command, File
menu, 2--13
Save Results As command, File
Menu, 3--36
save results button, 2--8
Save Results command, File
menu, 3--36
saved trace, displaying, 3--37
Saving, GPS coordinates, 2--61
saving a user normalization, 2--46
saving results, 3--61
screens
exporting, 3--65
file formats, 3--67
Service support, contact
information, xv
setting
display colors, 2--57
distance units, 3--35
file options, 2--58
file prefix, 2--59
note text, 2--60
startup application, 2--6
technician name, 2--60
trace type, 3--33
setting cable types, 3--17
Setup Menu, customizing, 3--70
Setup menu, 2--15
setups
recalling, 3--69
saving, 3--68
Shoulder strap, 1--18
signal standards
enabling, 2--53, 3--1
supported, F--1
Single measurement button, 2--8
Smoothing, View Menu, 2--14
smoothing, 2--58
Software, load process, 1--11
software
reinstalling, D--1
upgrading, D--1
Software Info, Tools menu, 2--16
software version, xiv
span, Glossary--2
specifications, A--1
Start, menu, 2--2
Start and Stop frequency,
setting, 3--5
startup application, setting, 2--6
Status
area, desktop, 2--2
icons, 2--3
STATUS indicator, 1--2
Status indicator, 1--2
Stop icon, 2--8
Strand hook, 1--18
suspend mode, 1--12
Index
Index- 6 YBA250 Antenna and Transmission Line Analyzer User Manual
T
taskbar, desktop, 2--2
Technical support, contact
information, xv
technician name, setting, 2--60
Tektronix, contacting, xv
test frequency range, 3--3
tilt stand, 1--16
timestamp readout, 2--9
TMA, Glossary--2
Tools menu, 2--16
touch--screen calibration, 1--11
Touchscreen Calibration command,
Tools menu, 2--16
tower mounted amplifier
(TMA), 3--28
Trace 2, View Menu, 2--14
trace display options, 3--39
Trace2, 3--38
Troubleshooting, GPS
receiver, 2--62
two--port measurement, 2--23,
Glossary--2
U
UnNormalized
(normalization), 2--44
Unusable (normalization), 2--42
Upgrade Software command, Tools
menu, 2--16
URL, Tektronix, xv
User (normalization), 2--43
User Cal? calibration status, 2--28
User calibration status, 2--28
user normalization
creating, 2--45
loading, 2--48
saving, 2--46
User? (normalization), 2--43
user--defined cable type, 3--19
V
Valid (normalization), 2--42
velocity of propagation,
Glossary--2
View menu, 2--14
VSWR, 3--8, Glossary--2
W
Web site address, Tektronix, xv
weight, A--7
Windowing setting, 3--22