Embed Size (px)
Citation preview

User Manual
NetTek YBA250
Antenna and Transmission Line
Analyzer
071-1047-03
This document supports firmware version 1.448
and greater.
www.tektronix.com

Copyright © Tektronix. All rights reserved. Licensed software products areowned by Tektronix or its subsidiaries or suppliers, and are protected bynational copyright laws and international treaty provisions.
Tektronix products are covered by U.S. and foreign patents, issued andpending. Information in this publication supercedes that in all previouslypublished material. Specifications and price change privileges reserved.
TEKTRONIX, TEK, and NetTek are registered trademarks of Tektronix, Inc.
Contacting Tektronix
Tektronix, Inc.14200 SW Karl Braun DriveP.O. Box 500Beaverton, OR 97077USA
For product information, sales, service, and technical support:
In North America, call 1-800-833-9200.
Worldwide, visit www.tektronix.com to find contacts in your area.

Warranty 15
Tektronix warrants that the product will be free from defects in materials and workmanshipfor a period of one (1) year from the date of original purchase from an authorizedTektronix distributor. If the product proves defective during this warranty period,Tektronix, at its option, either will repair the defective product without charge for parts andlabor, or will provide a replacement in exchange for the defective product. Batteries areexcluded from this warranty. Parts, modules and replacement products used by Tektronixfor warranty work may be new or reconditioned to like new performance. All replacedparts, modules and products become the property of Tektronix.
In order to obtain service under this warranty, Customer must notify Tektronix of thedefect before the expiration of the warranty period and make suitable arrangements for theperformance of service. Customer shall be responsible for packaging and shipping thedefective product to the service center designated by Tektronix, shipping charges prepaid,and with a copy of customer proof of purchase. Tektronix shall pay for the return of theproduct to Customer if the shipment is to a location within the country in which theTektronix service center is located. Customer shall be responsible for paying all shippingcharges, duties, taxes, and any other charges for products returned to any other locations.
This warranty shall not apply to any defect, failure or damage caused by improper use orimproper or inadequate maintenance and care. Tektronix shall not be obligated to furnishservice under this warranty a) to repair damage resulting from attempts by personnel otherthan Tektronix representatives to install, repair or service the product; b) to repair damageresulting from improper use or connection to incompatible equipment; c) to repair anydamage or malfunction caused by the use of non-Tektronix supplies; or d) to service aproduct that has been modified or integrated with other products when the effect of suchmodification or integration increases the time or difficulty of servicing the product.
THIS WARRANTY IS GIVEN BY TEKTRONIX WITH RESPECT TO THEPRODUCT IN LIEU OF ANY OTHER WARRANTIES, EXPRESS OR IMPLIED.TEKTRONIX AND ITS VENDORS DISCLAIM ANY IMPLIED WARRANTIES OFMERCHANTABILITY OR FITNESS FOR A PARTICULAR PURPOSE.TEKTRONIX’ RESPONSIBILITY TO REPAIR OR REPLACE DEFECTIVEPRODUCTS IS THE SOLE AND EXCLUSIVE REMEDY PROVIDED TO THECUSTOMER FOR BREACH OF THIS WARRANTY. TEKTRONIX AND ITSVENDORS WILL NOT BE LIABLE FOR ANY INDIRECT, SPECIAL, INCIDENTAL,OR CONSEQUENTIAL DAMAGES IRRESPECTIVE OF WHETHER TEKTRONIXOR THE VENDOR HAS ADVANCE NOTICE OF THE POSSIBILITY OF SUCHDAMAGES.

YBA250 Antenna and Transmission Line Analyzer User Manual i
Table of Contents
General Safety Summary xi. . . . . . . . . . . . . . . . . . . . . . . . . . . . . .Environmental Considerations xiii. . . . . . . . . . . . . . . . . . . . . . . . .Product End-of-Life Handling xiii. . . . . . . . . . . . . . . . . . . . . . . . . .Restriction of Hazardous Substances xiv. . . . . . . . . . . . . . . . . . . .
Preface xv. . . . . . . . . . . . . . . . . . . . . . . . . . . . . . . . . . . . . . . . . . . .Product Overview xv. . . . . . . . . . . . . . . . . . . . . . . . . . . . . . . . . . .About this Manual xvii. . . . . . . . . . . . . . . . . . . . . . . . . . . . . . . . . . .Additional Information xviii. . . . . . . . . . . . . . . . . . . . . . . . . . . . . . .Software Version xviii. . . . . . . . . . . . . . . . . . . . . . . . . . . . . . . . . . . .Preventing Personal Injury from the Effects of Lightning xviii. . . .
Getting Started
Getting Started 1--1. . . . . . . . . . . . . . . . . . . . . . . . . . . . . . . . . . . . .The NetTek Analyzer Platform 1--1. . . . . . . . . . . . . . . . . . . . . . . . .YBA250 Input Connector 1--3. . . . . . . . . . . . . . . . . . . . . . . . . . . . .Installing and Removing a Module 1--4. . . . . . . . . . . . . . . . . . . . . .Connecting External Power Supplies 1--6. . . . . . . . . . . . . . . . . . . .Batteries 1--7. . . . . . . . . . . . . . . . . . . . . . . . . . . . . . . . . . . . . . . . . . .Powering On the Instrument 1--11. . . . . . . . . . . . . . . . . . . . . . . . . . .Calibrating the Touch-Screen Display 1--11. . . . . . . . . . . . . . . . . . .Powering Off the Instrument 1--12. . . . . . . . . . . . . . . . . . . . . . . . . . .Attaching Accessories 1--15. . . . . . . . . . . . . . . . . . . . . . . . . . . . . . . .
Operating Basics
Operating Basics 2--1. . . . . . . . . . . . . . . . . . . . . . . . . . . . . . . . . . .Navigating the Desktop 2--1. . . . . . . . . . . . . . . . . . . . . . . . . . . . . . .Getting Help 2--4. . . . . . . . . . . . . . . . . . . . . . . . . . . . . . . . . . . . . . .Starting the YBA250 Software 2--5. . . . . . . . . . . . . . . . . . . . . . . . .Setting the YBA250 Software to Load at Startup 2--6. . . . . . . . . . .YBA250 User Interface Elements 2--7. . . . . . . . . . . . . . . . . . . . . . .YBA250 Menus 2--13. . . . . . . . . . . . . . . . . . . . . . . . . . . . . . . . . . . . .Entering Text 2--17. . . . . . . . . . . . . . . . . . . . . . . . . . . . . . . . . . . . . . .
Connecting a Signal 2--19. . . . . . . . . . . . . . . . . . . . . . . . . . . . . . . . .Use Precision Connectors and Cables 2--19. . . . . . . . . . . . . . . . . . . .Attaching and Removing Precision Connectors 2--20. . . . . . . . . . . .
Table of Contents
ii YBA250 Antenna and Transmission Line Analyzer User Manual
Connecting an RF Signal 2--21. . . . . . . . . . . . . . . . . . . . . . . . . . . . . .
Measurement Overview 2--23. . . . . . . . . . . . . . . . . . . . . . . . . . . . .One-Port Measurements 2--23. . . . . . . . . . . . . . . . . . . . . . . . . . . . . .Two-Port Measurements 2--23. . . . . . . . . . . . . . . . . . . . . . . . . . . . . .
Calibration and Normalization 2--25. . . . . . . . . . . . . . . . . . . . . . .Calibrating the YBA250 2--25. . . . . . . . . . . . . . . . . . . . . . . . . . . . . .Normalizing the YBA250 2--40. . . . . . . . . . . . . . . . . . . . . . . . . . . . .
Configuring the Instrument 2--53. . . . . . . . . . . . . . . . . . . . . . . . . .Enabling Signal Standards 2--53. . . . . . . . . . . . . . . . . . . . . . . . . . . . .Setting the Output Power Level 2--54. . . . . . . . . . . . . . . . . . . . . . . .Setting Measurement Method 2--56. . . . . . . . . . . . . . . . . . . . . . . . . .Setting Display Preferences 2--57. . . . . . . . . . . . . . . . . . . . . . . . . . . .Display Trace Smoothing 2--58. . . . . . . . . . . . . . . . . . . . . . . . . . . . .Changing Settings for Saved Files 2--58. . . . . . . . . . . . . . . . . . . . . .Saving GPS Coordinates with your Results 2--61. . . . . . . . . . . . . . .
Reference
Setting the Signal Standards and Test Frequency Range 3--1. .Selecting Signal Standards 3--1. . . . . . . . . . . . . . . . . . . . . . . . . . . .The Test Frequency Range 3--2. . . . . . . . . . . . . . . . . . . . . . . . . . . .Setting the Test Frequency Range by Standard and Direction 3--3.Setting the Test Frequency Range by Start and Stop Frequency 3--5
Measuring Return Loss and VSWR 3--7. . . . . . . . . . . . . . . . . . . .The Return Loss Display 3--7. . . . . . . . . . . . . . . . . . . . . . . . . . . . . .Measuring Return Loss/VSWR 3--8. . . . . . . . . . . . . . . . . . . . . . . . .Measuring Cable Loss 3--11. . . . . . . . . . . . . . . . . . . . . . . . . . . . . . . .
Measuring the Distance to a Fault 3--13. . . . . . . . . . . . . . . . . . . . .The Distance to Fault Display 3--13. . . . . . . . . . . . . . . . . . . . . . . . . .Measuring the Distance to a Fault 3--14. . . . . . . . . . . . . . . . . . . . . . .Changing the Vertical Scale Units 3--16. . . . . . . . . . . . . . . . . . . . . . .Limiting the Bandwidth for a Bandpass Filter 3--16. . . . . . . . . . . . .Setting Cable Types 3--17. . . . . . . . . . . . . . . . . . . . . . . . . . . . . . . . . .Creating a User-Defined Cable Type 3--19. . . . . . . . . . . . . . . . . . . .Customizing the Cable Standards Table 3--20. . . . . . . . . . . . . . . . . .Improving the Display of Distance Measurements 3--22. . . . . . . . . .Resolution of Distance to Fault Measurement 3--23. . . . . . . . . . . . .
Measuring Insertion Gain and Loss 3--25. . . . . . . . . . . . . . . . . . . .The Insertion Gain/Loss Window 3--26. . . . . . . . . . . . . . . . . . . . . . .

Table of Contents
YBA250 Antenna and Transmission Line Analyzer User Manual iii
Measuring Insertion Gain or Loss 3--26. . . . . . . . . . . . . . . . . . . . . . .
Generating a Continuous Wave (CW) Signal 3--31. . . . . . . . . . . .
Working with Traces 3--33. . . . . . . . . . . . . . . . . . . . . . . . . . . . . . . .Setting the Trace Type 3--33. . . . . . . . . . . . . . . . . . . . . . . . . . . . . . . .Changing the Units of the Distance to Fault Display 3--35. . . . . . . .Saving Results 3--36. . . . . . . . . . . . . . . . . . . . . . . . . . . . . . . . . . . . . .Displaying a Saved Trace 3--37. . . . . . . . . . . . . . . . . . . . . . . . . . . . .Comparing Traces 3--38. . . . . . . . . . . . . . . . . . . . . . . . . . . . . . . . . . .
Using Markers and Band Edge Cursors 3--43. . . . . . . . . . . . . . . .Markers 3--43. . . . . . . . . . . . . . . . . . . . . . . . . . . . . . . . . . . . . . . . . . .Band Edge Cursors 3--49. . . . . . . . . . . . . . . . . . . . . . . . . . . . . . . . . .
Mask Testing 3--51. . . . . . . . . . . . . . . . . . . . . . . . . . . . . . . . . . . . . . .The Mask Maker Window 3--51. . . . . . . . . . . . . . . . . . . . . . . . . . . . .Using the Mask Maker 3--53. . . . . . . . . . . . . . . . . . . . . . . . . . . . . . . .Mask Maker Guidelines 3--56. . . . . . . . . . . . . . . . . . . . . . . . . . . . . . .Defining (Selecting) a Mask for Testing 3--57. . . . . . . . . . . . . . . . . .Performing a Mask Test 3--58. . . . . . . . . . . . . . . . . . . . . . . . . . . . . . .
Saving and Recalling Results, Screens,and Setups 3--61. . . . . . . . . . . . . . . . . . . . . . . . . . . . . . . . . . . . . .
Saving Measurement Results 3--61. . . . . . . . . . . . . . . . . . . . . . . . . . .Recalling Measurement Results 3--63. . . . . . . . . . . . . . . . . . . . . . . .Exporting Measurement Results 3--64. . . . . . . . . . . . . . . . . . . . . . . .Exporting a Screen 3--65. . . . . . . . . . . . . . . . . . . . . . . . . . . . . . . . . . .Differences Between Exported Screens and Results 3--66. . . . . . . . .Saving Setups 3--68. . . . . . . . . . . . . . . . . . . . . . . . . . . . . . . . . . . . . . .Recalling Setups 3--69. . . . . . . . . . . . . . . . . . . . . . . . . . . . . . . . . . . .Customizing the Setup menu 3--70. . . . . . . . . . . . . . . . . . . . . . . . . . .
Appendices
Appendix A: Specifications A--1. . . . . . . . . . . . . . . . . . . . . . . . . . .
Appendix B: Accessories B--1. . . . . . . . . . . . . . . . . . . . . . . . . . . . .
Appendix C: Options C--1. . . . . . . . . . . . . . . . . . . . . . . . . . . . . . . .
Appendix D: Upgrading/Reinstalling Software D--1. . . . . . . . . .
Appendix E: Functional Verification Procedure E--1. . . . . . . . .
Appendix F: Supported Signal Standards F--1. . . . . . . . . . . . . . .
Appendix G: Customizing the Channel Table G--1. . . . . . . . . . . .

Table of Contents
iv YBA250 Antenna and Transmission Line Analyzer User Manual
Glossary
Index

Table of Contents
YBA250 Antenna and Transmission Line Analyzer User Manual v
Figures
Figure 1--1: NetTek Analyzer Layout 1--1. . . . . . . . . . . . . . . . . . .
Figure 1--2: Front Panel Controls 1--2. . . . . . . . . . . . . . . . . . . . . .
Figure 1--3: I/O ports (NetTek Y400 Analyzer Platform) 1--3. .
Figure 1--4: YBA250 test port. 1--3. . . . . . . . . . . . . . . . . . . . . . . .
Figure 1--5: Removing the bus cover 1--4. . . . . . . . . . . . . . . . . . .
Figure 1--6: Attaching the YBA250 module 1--5. . . . . . . . . . . . . .
Figure 1--7: External power supplies 1--6. . . . . . . . . . . . . . . . . . .
Figure 1--8: Opening the battery compartment 1--7. . . . . . . . . .
Figure 1--9: Opening the battery retainer 1--8. . . . . . . . . . . . . . .
Figure 1--10: Installing/removing a battery 1--8. . . . . . . . . . . . . .
Figure 1--11: NetTek Analyzer Platform tilt stand 1--15. . . . . . . .
Figure 1--12: Installing the tilt stand on multipleinstrument modules 1--16. . . . . . . . . . . . . . . . . . . . . . . . . . . . . .
Figure 1--13: NetTek Analyzer Platform shoulder strapand strand hook 1--17. . . . . . . . . . . . . . . . . . . . . . . . . . . . . . . . .
Figure 2--1: The YBA250 display 2--5. . . . . . . . . . . . . . . . . . . . . .
Figure 2--2: Setting the StartUp Application 2--6. . . . . . . . . . . . .
Figure 2--3: YBA250 user interface elements 2--7. . . . . . . . . . . .
Figure 2--4: The Soft Keyboard 2--17. . . . . . . . . . . . . . . . . . . . . . .
Figure 2--5: How to attach a precision connector 2--21. . . . . . . . .
Figure 2--6: TEST PORT location 2--22. . . . . . . . . . . . . . . . . . . . .
Figure 2--7: The Calibration window 2--26. . . . . . . . . . . . . . . . . . .
Figure 2--8: Ready to perform calibration 2--29. . . . . . . . . . . . . .
Figure 2--9: Calibration window after calibrationis done 2--30. . . . . . . . . . . . . . . . . . . . . . . . . . . . . . . . . . . . . . . . .
Figure 2--10: Ready to perform calibration with cable 2--31. . . .
Figure 2--11: Calibration window after calibrationis done 2--33. . . . . . . . . . . . . . . . . . . . . . . . . . . . . . . . . . . . . . . . .

Table of Contents
vi YBA250 Antenna and Transmission Line Analyzer User Manual
Figure 2--12: Calibration browser window 2--34. . . . . . . . . . . . . .
Figure 2--13: The Calibration window 2--36. . . . . . . . . . . . . . . . . .
Figure 2--14: Normalization window 2--41. . . . . . . . . . . . . . . . . . .
Figure 2--15: Normalization type status label 2--43. . . . . . . . . . . .
Figure 2--16: Normalization Browser window 2--47. . . . . . . . . . .
Figure 2--17: Save Normalization window 2--48. . . . . . . . . . . . . . .
Figure 2--18: Load Saved Normalization window 2--49. . . . . . . . .
Figure 2--19: The Signal Standards tab of theOptions window 2--53. . . . . . . . . . . . . . . . . . . . . . . . . . . . . . . . .
Figure 2--20: Setting the output power level 2--55. . . . . . . . . . . . .
Figure 2--21: Location of Method drop-down list 2--56. . . . . . . . .
Figure 2--22: Preferences tab showing availablecolor schemes 2--57. . . . . . . . . . . . . . . . . . . . . . . . . . . . . . . . . . .
Figure 2--23: The Save & Export tab 2--59. . . . . . . . . . . . . . . . . . .
Figure 3--1: The Signal Standards tab 3--1. . . . . . . . . . . . . . . . . .
Figure 3--2: Frequency range controls 3--3. . . . . . . . . . . . . . . . . .
Figure 3--3: Select Channel dialog box 3--5. . . . . . . . . . . . . . . . .
Figure 3--4: Entering the frequency with the keypad 3--6. . . . . .
Figure 3--5: The Return Loss window 3--7. . . . . . . . . . . . . . . . . .
Figure 3--6: Example of a Return Loss measurement 3--10. . . . .
Figure 3--7: Example of a VSWR measurement 3--10. . . . . . . . . .
Figure 3--8: Example of a cable loss measurement 3--12. . . . . . . .
Figure 3--9: The Distance to Fault display 3--13. . . . . . . . . . . . . . .
Figure 3--10: The Distance Options tab 3--15. . . . . . . . . . . . . . . . .
Figure 3--11: An example of a distance to faultmeasurement 3--16. . . . . . . . . . . . . . . . . . . . . . . . . . . . . . . . . . . .
Figure 3--12: The Cable Types window 3--18. . . . . . . . . . . . . . . . .
Figure 3--13: User Defined Cable window 3--19. . . . . . . . . . . . . . .
Figure 3--14: A portion of the cablestandards text file 3--22. . . . .
Figure 3--15: The Return Gain/Loss window 3--26. . . . . . . . . . . .

Table of Contents
YBA250 Antenna and Transmission Line Analyzer User Manual vii
Figure 3--16: Setting output power for CW signal mode 3--31. . .
Figure 3--17: Setting the trace type 3--34. . . . . . . . . . . . . . . . . . . .
Figure 3--18: Setting the distance units 3--36. . . . . . . . . . . . . . . . .
Figure 3--19: Defining Trace 2 3--39. . . . . . . . . . . . . . . . . . . . . . . .
Figure 3--20: Selecting the first result file 3--40. . . . . . . . . . . . . . .
Figure 3--21: Selecting the second result file 3--41. . . . . . . . . . . . .
Figure 3--22: Two compared traces 3--41. . . . . . . . . . . . . . . . . . . .
Figure 3--23: VSWR measurement withmarkers enabled 3--44. . . . . . . . . . . . . . . . . . . . . . . . . . . . . . . . .
Figure 3--24: The Marker readout 3--44. . . . . . . . . . . . . . . . . . . . .
Figure 3--25: The Markers setup dialog box 3--45. . . . . . . . . . . . .
Figure 3--26: Band Edge Cursor displayed 3--49. . . . . . . . . . . . . .
Figure 3--27: Band Edge Cursors always visible 3--50. . . . . . . . . .
Figure 3--28: The Mask Maker utility 3--51. . . . . . . . . . . . . . . . . .
Figure 3--29: Example of a recalled results display 3--63. . . . . . .
Figure 3--30: Sample Exported Results file 3--65. . . . . . . . . . . . . .
Figure 3--31: Example of an Exported Results file 3--68. . . . . . . .
Figure 3--32: Setup menu controls 3--70. . . . . . . . . . . . . . . . . . . . .
Figure 3--33: Specifying the List of Setups 3--72. . . . . . . . . . . . . .
Figure E--1: Settings to run diagnostics E--2. . . . . . . . . . . . . . . . .
Figure E--2: Calibration window prior to calibration E--4. . . . .
Figure E--3: Ready to perform calibration E--4. . . . . . . . . . . . . .
Figure E--4: Calibration window after calibrationis done E--6. . . . . . . . . . . . . . . . . . . . . . . . . . . . . . . . . . . . . . . . .

Table of Contents
viii YBA250 Antenna and Transmission Line Analyzer User Manual
Tables
Table i: Standard module accessories xiii. . . . . . . . . . . . . . . . . .
Table 1--1: Approximate battery charge times 1--9. . . . . . . . . . .
Table 2--1: Status area icons 2--3. . . . . . . . . . . . . . . . . . . . . . . . . .
Table 2--2: Help window buttons 2--4. . . . . . . . . . . . . . . . . . . . . .
Table 2--3: Command bar area buttons and icons 2--8. . . . . . . .
Table 2--4: Tuning control area buttons and icons 2--9. . . . . . . .
Table 2--5: Shared control area buttons and icons 2--10. . . . . . . .
Table 2--6: Instrument area buttons and icons 2--12. . . . . . . . . . .
Table 2--7: The File menu 2--13. . . . . . . . . . . . . . . . . . . . . . . . . . .
Table 2--8: The View menu 2--14. . . . . . . . . . . . . . . . . . . . . . . . . .
Table 2--9: The Setup menu 2--15. . . . . . . . . . . . . . . . . . . . . . . . . .
Table 2--10: The Tools menu 2--16. . . . . . . . . . . . . . . . . . . . . . . . .
Table 2--11: Calibration window elements 2--27. . . . . . . . . . . . . .
Table 2--12: Calibration Browser Fields 2--37. . . . . . . . . . . . . . . .
Table 2--13: Normalization window elements 2--41. . . . . . . . . . . .
Table 2--14: Performance versus Resolution 2--56. . . . . . . . . . . .
Table 3--1: Channel table file contents 3--21. . . . . . . . . . . . . . . . .
Table 3--2: Trace type options 3--33. . . . . . . . . . . . . . . . . . . . . . . .
Table 3--3: Markers dialog box settings 3--45. . . . . . . . . . . . . . . .
Table 3--4: Mask maker buttons and icons 3--52. . . . . . . . . . . . . .
Table 3--5: Differences between exported screensand traces 3--66. . . . . . . . . . . . . . . . . . . . . . . . . . . . . . . . . . . . . .
Table 3--6: Comparison of file formats forexporting screens 3--67. . . . . . . . . . . . . . . . . . . . . . . . . . . . . . . .

Table of Contents
YBA250 Antenna and Transmission Line Analyzer User Manual ix
Table A--1: Measurement characteristics A--1. . . . . . . . . . . . . .
Table A--2: Measurement port characteristics A--5. . . . . . . . . . .
Table A--3: Calibration characteristics A--5. . . . . . . . . . . . . . . . .
Table A--4: Environmental characteristics A--6. . . . . . . . . . . . . .
Table A--5: Physical characteristics A--7. . . . . . . . . . . . . . . . . . .
Table A--6: Miscellaneous characteristics A--7. . . . . . . . . . . . . . .
Table A--7: Safety compliance A--8. . . . . . . . . . . . . . . . . . . . . . . .
Table A--8: Electromagnetic compatibility (EMC) A--9. . . . . . .
Table B--1: Standard accessories B--1. . . . . . . . . . . . . . . . . . . . . .
Table B--2: Optional accessories B--2. . . . . . . . . . . . . . . . . . . . . .
Table C--1: Configuration option C--1. . . . . . . . . . . . . . . . . . . . . .
Table F--1: Cellular standards supported F--1. . . . . . . . . . . . . . .
Table G--1: Channel table file contents G--2. . . . . . . . . . . . . . . . .

Table of Contents
x YBA250 Antenna and Transmission Line Analyzer User Manual

YBA250 Antenna and Transmission Line Analyzer User Manual xi
General Safety Summary
Review the following safety precautions to avoid injury and preventdamage to this product or any products connected to it.
To avoid potential hazards, use this product only as specified.
Only qualified personnel should perform service procedures.
While using this product, you may need to access other parts of thesystem. Read the General Safety Summary in other system manualsfor warnings and cautions related to operating the system.
WARNING. Do not connect to any source which may be subject to theeffects of lightning.
To Avoid Fire or Personal Injury
Use Proper Power Cord.Use only the power cord specified for thisproduct and certified for the country of use.
Connect and Disconnect Properly. Do not connect or disconnect probesor test leads while they are connected to a voltage source.
Observe All Terminal Ratings. To avoid fire or shock hazard, observe allratings and markings on the product. Consult the product manual forfurther ratings information before making connections to the product.
Do Not Operate Without Covers. Do not operate this product withcovers or panels removed.
Do Not Operate With Suspected Failures. If you suspect there is damageto this product, have it inspected by qualified service personnel.
Replace Batteries Properly. Replace batteries only with the specifiedtype and rating.
Recharge Batteries Properly. Recharge batteries for the recommendedcharge cycle only.
Use Proper AC Adapter. Use only the AC adapter specified for thisproduct.
Do Not Operate in an Explosive Atmosphere.

General Safety Summary
xii YBA250 Antenna and Transmission Line Analyzer User Manual
Terms in this Manual
These terms may appear in this manual:
WARNING. Warning statements identify conditions or practices thatcould result in injury or loss of life.
CAUTION. Caution statements identify conditions or practices thatcould result in damage to this product or other property.
Symbols and Terms on the Product
These terms may appear on the product:
DANGER indicates an injury hazard immediately accessible asyou read the marking.
WARNING indicates an injury hazard not immediatelyaccessible as you read the marking.
CAUTION indicates a hazard to property including the product.
The following symbol(s) may appear on the product:
CAUTIONRefer to Manual Standby

YBA250 Antenna and Transmission Line Analyzer User Manual xiii
Environmental Considerations
This section provides information about the environmental impact ofthe product.
Product End-of-Life Handling
Observe the following guidelines when recycling an instrument orcomponent:
Equipment Recycling. Production of this equipment required theextraction and use of natural resources. The equipment may containsubstances that could be harmful to the environment or human healthif improperly handled at the product’s end of life. In order to avoidrelease of such substances into the environment and to reduce the useof natural resources, we encourage you to recycle this product in anappropriate system that will ensure that most of the materials arereused or recycled appropriately.
The symbol shown to the left indicates that thisproduct complies with the European Union’srequirements according to Directive 2002/96/ECon waste electrical and electronic equipment(WEEE). For information about recyclingoptions, check the Support/Service section of theTektronix Web site (www.tektronix.com).
Restriction of Hazardous Substances
This product has been classified as Monitoring and Controlequipment, and is outside the scope of the 2002/95/EC RoHSDirective.

Environmental Considerations
xiv YBA250 Antenna and Transmission Line Analyzer User Manual

YBA250 Antenna and Transmission Line Analyzer User Manual xv
Preface
The YBA250 Antenna and Transmission Line Analyzer is part of theNetTek Analyzer Platform BTS Field Tool family. This highperformance, portable, field-ready tester is optimized for fast troubleresolution and easy BTS antenna and tower mounted amplifier(TMA) performance verification.
Product Overview
The standard YBA250 configuration consists of two components; theYBA250 application module and the NetTek Analyzer Platform. Theapplication module contains the hardware and software needed toanalyze antenna characteristics and performance. The NetTekAnalyzer Platform provides the power and user interface to run theYBA250 application module software and hardware. The YBA250can be purchased separately to install on a NetTek Analyzer Platformthat you already have.
The YBA250 Antenna and Transmission Line Analyzer applicationfeatures include:
One-port Return Loss and VSWR measurements to quicklyanalyze a system
One-port Cable Loss measurement to analyze system cablecharacteristics
One-port distance-to-fault (DTF) measurement to identify thelocation
Two-port Insertion Gain and Loss measurements to analyze thecharacteristics of active components (such as TMAs anddirectional couplers) and passive devices (such as bandwidthfilters and cables)
Advanced calibration and normalization techniques to eliminatethe need to perform a calibration each time the frequency ordisplay range is changed

Preface
xvi YBA250 Antenna and Transmission Line Analyzer User Manual
User-defined calibration and normalization data sets for testingand measuring specific frequencies and power levels
User-defined test masks to provide fast pass/fail testing ofantenna, device, or system performance
The NetTek Analyzer Platform user interface uses the MicrosoftWindows CE operating system, so you spend less time learning theinstrument and more time troubleshooting the network. Key NetTekAnalyzer Platform features include:
High-visibility color display with a touch-screen interface
Extendible instrument architecture lets you add other NetTek-compatible measurement modules (up to three) as your testingand troubleshooting needs change
Ruggedized package for real-world testing conditions
Removable battery packs to extend in-field testing time
I/O ports connect the instrument to a printer, an externalkeyboard, and the Internet
Two PCMCIA card slots for adding storage memory, additionalmeasurement capabilities, and using PCMCIA Ethernet andmodem cards to connect to a network or the internet
Software applications and utilities that support communications,power management, instrument configuration, text editing, Webbrowsing and more

Preface
YBA250 Antenna and Transmission Line Analyzer User Manual xvii
Standard Accessories
Table i provides a list of the standard accessories supplied with theYBA250 Antenna and Transmission Line Analyzer Module. For acomplete list of standard and optional accessories, see Appendix B,beginning on page B--1.
Table i: Standard module accessories
N Connector Plastic Cover. Used to protect the TEST PORTsignal connector.
User Manual. Contains information on setup, basic operation,and taking measurements.
CD-ROM. Contains instrument software and an Adobe AcrobatPDF version of the User Manual.
About this Manual
This manual is divided into four sections: Getting Started, OperatingBasics, Reference and Appendices.
The Getting Started section explains how to set up and start usingyour YBA250 Antenna and Transmission Line Analyzer.
The Operating Basics section explains how to operate the YBA250.
The Reference section explains how to perform specific tests with theYBA250.
The Appendices contain specifications, a functional verificationprocedure, and other information that you might need occasionally.

Preface
xviii YBA250 Antenna and Transmission Line Analyzer User Manual
Additional Information
The YBA250 Antenna and Transmission Line Analyzer containsonline help to enable you to quickly get explanations of how to useyour YBA250. The online help is the first place you should look forinformation about operating the YBA250 or the NetTek AnalyzerPlatform.
Software Version
This manual supports YBA250 Antenna and Transmission LineAnalyzers running software version 1.448 or greater. To determineyour software version, select Tools > Software Info when theYBA250 application is running.
Preventing Personal Injury from the Effects of Lightning
WARNING. To prevent personal injury from the effects of lightning,exercise the following precautions when using this product:
Before connecting this product to any source
Check your local weather forecast for the possibility ofthunderstorms or lightning.
If weather conditions could allow thunderstorms or lightning todevelop, be sure to visually check the sky and weather conditionsin your area frequently.
If you can hear thunder or if you see lightning, do not connectthis product to any source which may be exposed to the effects oflightning.
Use your own good judgement and common sense. You mustprotect yourself from the effects of lightning.
You must assume that hazardous voltages will be present onexposed surfaces of this product if it is connected to a source

Preface
YBA250 Antenna and Transmission Line Analyzer User Manual xix
exposed to lightning. The insulation of this product will notprotect you from these hazardous voltages.
Do not connect this product to any source which might be subject tothe effects of lightning
If thunderstorms or lightning are in your vicinity:
When weather conditions that could lead to lightning activityexist in your area, you could be at risk of a lightning strike
before the cloud is close enough for you to hear thunder or seelightning.
When lightning strikes a structure or facility, current travelsthrough the rebar, concrete, pipes, cables, vent stacks, andelectrical system.
Lightning can induce electric and magnetic fields into structuresand portions of wiring. The length of a conductor affected by themagnetic field of a lightning strike may exceed two miles.
Be alert and aware of the effects of lightning
When lightning strikes a conductor, which in turn introduces thecurrent into an area some distance from the ground strike point,equipment can be damaged and personnel injured if theybecome an indirect path in the completion of the ground circuit.
Conductors such as the braided shields of cables or unshieldedwires will have significant transient currents flowing in them inregions exposed to the electric field effect of lightning.
Induced voltages may cause breakdown of insulation in wiring atconnectors and in electrical components or breakdown of air.

Preface
xx YBA250 Antenna and Transmission Line Analyzer User Manual

Getting Started


YBA250 Antenna and Transmission Line Analyzer User Manual 1- 1
Getting Started
This section describes the NetTek Y400 Analyzer Platform, onwhich the YBA250 Antenna and Transmission Line Analyzeroperates.
The NetTek Analyzer Platform
Figure 1--1 shows the NetTek Analyzer Platform layout. Figure 1--2shows the front-panel controls and indicators. Figure 1--3 shows theinput and output ports.
Batteries
Applicationmodules
PC card
Front panel
Externalpower
I/O portsTouchScreen
Figure 1- 1: NetTek Analyzer Layout

Getting Started
1- 2 YBA250 Antenna and Transmission Line Analyzer User Manual
CAUTION. Only use soft objects, such as plastic or your finger, to tapthe touch-screen display. Do not use metal or other abrasivematerials because they will damage the display surface.
1 2 3 4
Figure 1- 2: Front Panel Controls
1. Power/Suspend Switch. Push on; push off. See pages 1--11 and1--12 for additional information.
2. Reset Switch. Push to perform a hardware reset if a lock-upoccurs. All programs and data loaded into volatile memory sincestartup are lost.
3. Status Indicator. Green indicates that the instrument is poweredon. Amber indicates that the instrument is powered on but thedisplay is turned off (for power conservation).
4. Batteries Indicator. Green indicates that the instrument isconnected to an external power source (and charging anyinstalled batteries). Red indicates a low battery.

Getting Started
YBA250 Antenna and Transmission Line Analyzer User Manual 1- 3
1 2 3 4 5 6 7
Figure 1- 3: I/O ports (NetTek Y400 Analyzer Platform)
1. Microphone input
2. Headphone jack
3. Ethernet connector (RJ-45)
4. Serial port (RS-232)
5. PS/2 keyboard connector
6. USB Host connector
7. USB Slave connector
YBA250 Input Connector
Figure 1--4 shows the location of the YBA250 Application ModuleTEST PORT input connector.
TEST PORT
Figure 1- 4: YBA250 test port.

Getting Started
1- 4 YBA250 Antenna and Transmission Line Analyzer User Manual
Installing and Removing a Module
If you purchased the YBA250 as a separate item, you must install themodule on a NetTek Analyzer platform before you can takemeasurements. Refer to Figures 1--5 and 1--6 to install or remove theYBA250 module.
CAUTION. To prevent damage to the NetTek Analyzer Platform orYBA250 module, you must power down the NetTek Analyzer Platformand remove all cables or connectors before installing a YBA250module.
NetTek Analyzer Platform
Removebus cover
Bus connector
Figure 1- 5: Removing the bus cover

Getting Started
YBA250 Antenna and Transmission Line Analyzer User Manual 1- 5
Tighten thumbscrews (4)
module
Attach buscover
Bus connector
Figure 1- 6: Attaching the YBA250 module
NOTE. Tighten the screws by pressing in slightly on them and turningthem in a clockwise direction. Use the coin slot in the top of thethumb screw if you require additional torque. Tighten all screwsevenly, but do not overtighten. To recess the thumb screw heads, pushand turn each screw head 1/4 turn in a clockwise direction.
To install additional modules (up to three), remove the bus coverfrom the installed module and install the additional module as shownin the above figures.
To maintain the module or instrument seal integrity, reinstall the buscover onto the outermost module, or onto the NetTek Analyzer ifremoving a module.

Getting Started
1- 6 YBA250 Antenna and Transmission Line Analyzer User Manual
Connecting External Power Supplies
To power the NetTek Analyzer Platform from AC mains or DCvehicle voltage, or recharge installed batteries, connect the DesktopPower Supply or the In-Vehicle Adapter to the NetTek AnalyzerPlatform as shown in Figure 1--7. The Desktop Power Supplyoperates from 100 VAC to 240 VAC mains.
Power adapter connector(under bottom of strap)
Figure 1- 7: External power supplies

Getting Started
YBA250 Antenna and Transmission Line Analyzer User Manual 1- 7
Batteries
Installing or Removing a Battery
The NetTek Analyzer Platform comes standard with a single battery,which is not installed when the instrument is shipped. Refer toFigures 1--8 through 1--10 for battery installation or removal steps.
NOTE. Disconnect power supply cables from the NetTek AnalyzerPlatform before installing or removing batteries.
New batteries, or batteries that have not been used for an extendedperiod, must be charged before using them to power the instrument.Refer to Charging a Battery on page 1--9 for more information.
Figure 1- 8: Opening the battery compartment

Getting Started
1- 8 YBA250 Antenna and Transmission Line Analyzer User Manual
1. Push the batteryretainer tab down andtowards the back ofinstrument, then lift
2. Rotate thebattery retainerupward
Figure 1- 9: Opening the battery retainer
Battery retainerin open position
Lift battery by strap
Figure 1- 10: Installing/removing a battery

Getting Started
YBA250 Antenna and Transmission Line Analyzer User Manual 1- 9
NOTE. The battery electrical contacts, on the bottom of the battery,must face in the direction shown in Figure 1--10.
Close and latch the battery retainer and battery compartment doorafter installing or removing batteries.
You can add a second battery to increase the operating time. Replacea battery with the specified type only. To purchase a battery fromTektronix, please contact your Tektronix Service Center for thecorrect part number.
Charging a Battery
To charge batteries installed in the NetTek Analyzer Platform,connect the instrument to an external power supply (see Figure 1--7on page 1--6) and let the battery or batteries recharge in theinstrument. Table 1--1 lists the approximate charge times forfully--discharged batteries. You can also charge batteries in theoptional external battery charger.
Table 1- 1: Approximate battery charge times
Number of batteries ininstrument
Instrument poweredon
Instrument poweredoff
1 8 hours 3 hours
2 16 hours 6 hours
NOTE. To achieve optimum performance from a new battery, fullycharge the battery. Then fully discharge the battery by leaving theYBA250 running (see Start > Help > Settings > Power Management
for information on disabling the power saver function), then fullycharge the battery again.

Getting Started
1- 10 YBA250 Antenna and Transmission Line Analyzer User Manual
Batteries are partially charged and calibrated at the factory. Acalibrated battery allows the NetTek Analyzer Platform to moreaccurately estimate how much longer the YBA250 can operatebefore the instrument automatically powers off. The YBA250 alwayswarns you before it powers off, so that you can save important testresults or settings.
To verify the status of your batteries at any time:
1. Select Start > Settings > Control Panel.
2. Double-tap the Power Management icon. The Batteries tab liststhe status of each battery.
If the battery charge is low, connect the NetTek Analyzer Platform toan external power source and let the battery or batteries recharge inthe instrument for eight hours. For more information, select Start >Help > Settings > Power Management > Charging Batteries.
Maximizing Battery Operating Time
For tips on how to maximize battery operating time, selectStart > Help > Settings > Power Management > OptimizingBattery Life.
Transporting Lithium-Ion Batteries
Regulations regarding transportation of lithium-ion batteries onpassenger aircraft may subject this product to special handlingrestrictions. Consult your air carrier for applicability and determina-tion of any special lithium-ion battery transportation requirements.
Each NetTek Analyzer Platform lithium-ion battery pack containsless than 8 grams of lithium, with individual cells each containingless than 1.5 grams of lithium, as measured by International CivilAviation Organization (ICAO) standards.
Getting Started
YBA250 Antenna and Transmission Line Analyzer User Manual 1- 11
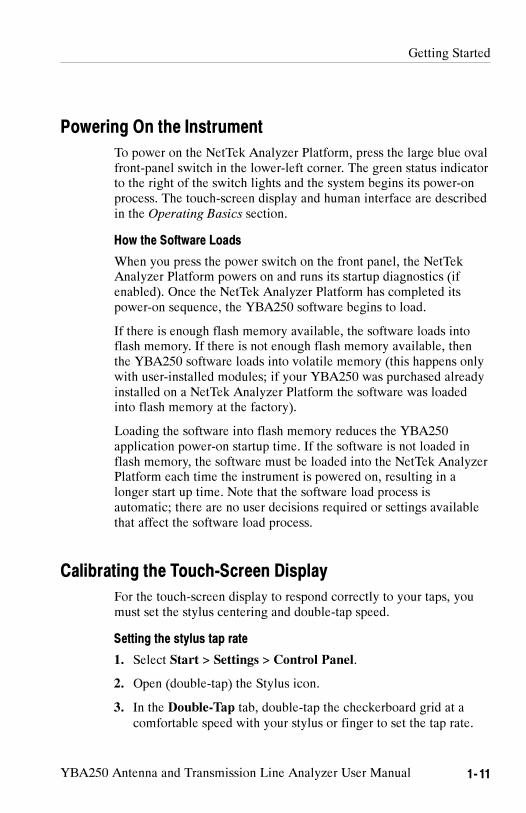
Powering On the Instrument
To power on the NetTek Analyzer Platform, press the large blue ovalfront-panel switch in the lower-left corner. The green status indicatorto the right of the switch lights and the system begins its power-onprocess. The touch-screen display and human interface are describedin the Operating Basics section.
How the Software Loads
When you press the power switch on the front panel, the NetTekAnalyzer Platform powers on and runs its startup diagnostics (ifenabled). Once the NetTek Analyzer Platform has completed itspower-on sequence, the YBA250 software begins to load.
If there is enough flash memory available, the software loads intoflash memory. If there is not enough flash memory available, thenthe YBA250 software loads into volatile memory (this happens onlywith user-installed modules; if your YBA250 was purchased alreadyinstalled on a NetTek Analyzer Platform the software was loadedinto flash memory at the factory).
Loading the software into flash memory reduces the YBA250application power-on startup time. If the software is not loaded inflash memory, the software must be loaded into the NetTek AnalyzerPlatform each time the instrument is powered on, resulting in alonger start up time. Note that the software load process isautomatic; there are no user decisions required or settings availablethat affect the software load process.
Calibrating the Touch-Screen Display
For the touch-screen display to respond correctly to your taps, youmust set the stylus centering and double-tap speed.
Setting the stylus tap rate
1. Select Start > Settings > Control Panel.
2. Open (double-tap) the Stylus icon.
3. In the Double-Tap tab, double-tap the checkerboard grid at acomfortable speed with your stylus or finger to set the tap rate.

Getting Started
1- 12 YBA250 Antenna and Transmission Line Analyzer User Manual
4. Double-tap the checkerboard grid to verify your settings.
Setting the stylus centering
1. Select Start > Settings > Control Panel.
2. Open the Stylus icon.
3. In the Calibration tab, select Recalibrate.
4. Follow the on-screen instructions to set the location and amountof pressure needed for the touch-screen to respond to your taps.Apply pressure to the touch-screen for approximately 5 secondsat each position, until the target moves.
5. Select OK to close the dialog box and save your settings.
Powering Off the Instrument
The NetTek Analyzer Platform has separate, but related, standby andpower off functions.
Suspend Mode
Use Suspend mode to place the NetTek Analyzer Platform in asuspended (standby or sleep) state. This is the typical power downmode that allows the YBA250 software to remain in volatilememory. If the NetTek Analyzer Platform remains in Suspend modefor an extended time (approximately two hours), it automaticallyenters Shutdown mode.
To suspend analyzer operation, choose one of the following methods:
Press the front-panel power switch.
Select Start > Programs > Shutdown. In the Shut Down dialogbox, select Suspend.
To cancel Suspend mode and wake up the NetTek AnalyzerPlatform, press the front-panel power switch. The instrument returnsto the state that existed before suspend mode was invoked.

Getting Started
YBA250 Antenna and Transmission Line Analyzer User Manual 1- 13
Shutdown Mode
To completely power down the NetTek Analyzer Platform, do thefollowing:
1. Select Start > Programs > Shutdown.
2. In the Shut Down dialog box, select Shutdown.
A shutdown clears volatile memory, including the YBA250 softwareif it is loaded in volatile memory, user setups, and measurement datanot saved to nonvolatile memory. For information on how to savethese items to nonvolatile memory:
1. Select Start > Help.
2. In the Help window select Tektronix Basics.
3. Select Store Data in Nonvolatile Memory.
The next time you press the front-panel power switch, the NetTekAnalyzer Platform cycles through the complete power up process,taking about 30 seconds to completely power up.
Restart (Software Reset)
If the NetTek Analyzer Platform or YBA250 application stopsresponding correctly, try performing a restart to clear the problem.
To restart the YBA250, do the following:
1. Select Start > Programs > Shutdown.
2. In the Shut Down dialog box, select Restart.
The display blanks for approximately five seconds. The YBA250software reloads and restarts. A restart does not empty volatilememory.
Getting Started
1- 14 YBA250 Antenna and Transmission Line Analyzer User Manual
Front-Panel Power Switch
Depending on the current state of the NetTek Analyzer Platform,pressing the front-panel power switch performs one of the followingfunctions:
If the NetTek Analyzer Platform is shut down: powers on theinstrument.
If the NetTek Analyzer Platform is operating: initiates Suspendmode.
If the NetTek Analyzer Platform is in Suspend mode: cancelsSuspend mode and activates the YBA250.
If the analyzer is in PowerSaver mode (touch-screen display off):activates the display.

Getting Started
YBA250 Antenna and Transmission Line Analyzer User Manual 1- 15
Attaching Accessories
Setting Up the Tilt Stand
For floor or desktop use, attach the tilt stand to the NetTek AnalyzerPlatform and fold into place. See Figure 1--11.
Attach tilt stand withthumb screws (3)
Bottom thumb screwlocated under Velcro flap
Tilt stand
Stylus holders
Figure 1- 11: NetTek Analyzer Platform tilt stand

Getting Started
1- 16 YBA250 Antenna and Transmission Line Analyzer User Manual
To install the tilt stand with two or more instrument modulesattached, use the provided storage pack spacers as shown inFigure 1--12.
Additionalinstrument module
Spacer(s)
Tilt stand
Velcro fastener
Instrumentmodule
Figure 1- 12: Installing the tilt stand on multiple instrument modules

Getting Started
YBA250 Antenna and Transmission Line Analyzer User Manual 1- 17
Installing the Shoulder Strap and Strand Hook
Use the shoulder strap to carry the NetTek Analyzer Platform to thejob site. Install the strap on the instrument as shown in Figure 1--13.You can also install the strap on the soft case.
Use the Strand hook to hang the instrument from a wire strand,ladder, or other support. Install the strand hook as shown inFigure 1--13.
CAUTION. The NetTek Analyzer Platform can weigh in excess of12 kg (25 lbs), depending on the number of batteries and instrumentmodules installed. Use caution when hanging the instrument fromany support.
Figure 1- 13: NetTek Analyzer Platform shoulder strap and strand hook

Getting Started
1- 18 YBA250 Antenna and Transmission Line Analyzer User Manual

Operating Basics

YBA250 Antenna and Transmission Line Analyzer User Manual 2- 1
Operating Basics
This section explains the essential things you need to know to beforeoperating the YBA250 Antenna and Transmission Line Analyzer.
Navigating the Desktop
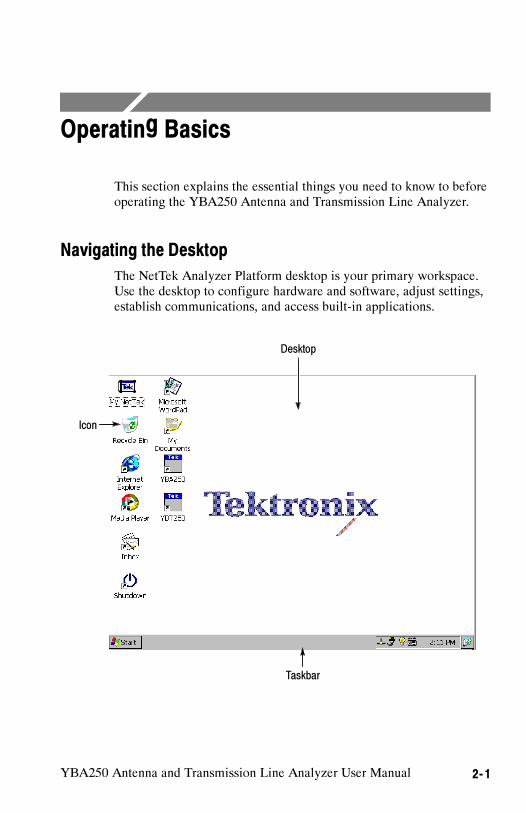
The NetTek Analyzer Platform desktop is your primary workspace.Use the desktop to configure hardware and software, adjust settings,establish communications, and access built-in applications.
Taskbar
Desktop
Icon

Operating Basics
2- 2 YBA250 Antenna and Transmission Line Analyzer User Manual
Icons
Double-tap desktop icons to open folders or to start programs.
Taskbar
The Taskbar contains the Start menu, buttons to identify theprograms you are running, a status area, and a desktop icon.
Desktop button
Program button Status area
Start menu
Start Menu.Use the Start menu to load and run other instrumentmodules and other programs, access settings, open documents, andobtain help. Select (tap) Start to open the menu; then select the entryyou want.
Tap Start to display the menu
Program Buttons. To hide a program that is running, tap its taskbarbutton. To restore the program, tap the button again.
Status Area. Icons and buttons appearing in this area indicate status,activate features, or open settings windows. Double-tap the icons forfurther information.

Operating Basics
YBA250 Antenna and Transmission Line Analyzer User Manual 2- 3
Table 2--1 describes the functions of some common status icons. Fora complete list and explanation of all status area icons, refer to theNetTek Analyzer Platform online help:
1. Select Start > Help.
2. In the Help window select Windows CE Basics
3. Select Understanding Taskbar Icons.
Table 2- 1: Status area icons
Tap thisicon Action Details
Double-tap to open the PowerManagement utility.
The analyzer is operatingon external AC power.
Double-tap to open the PowerManagement utility.
The analyzer is chargingbatteries.
Double-tap to open the PowerManagement utility.
The analyzer is operatingon battery power. Alsoindicates charge level.
Double-tap to open the Backlightutility.
Adjust the backlight bright-ness.
Single-tap to open the InputPanel soft keyboard.
Single-tap to close thekeyboard.
Double-tap to open the Date/Timeutility.
Set the date and time.
Single-tap to minimize all win-dows and display the desktop.
Tap again to restore allwindows.

Operating Basics
2- 4 YBA250 Antenna and Transmission Line Analyzer User Manual
Getting Help
To open the Help window and obtain general information onYBA250 topics, select Help from the Start menu. Select YBA250 toget help on the YBA250.
There are three ways to display Help when you are running theYBA250 software:
Tap the icon in the upper-right corner of the YBA250
display. This displays the top level of the YBA250 help.
Tap underlined text on the screen. This displays the Help topicfor the item selected.
Display Help from some dialog boxes by selecting the Help
button in the bottom-right corner of the dialog box.
The Help Window
Table 2--2 explains how to use the Help window buttons.
Table 2- 2: Help window buttons
Tap this button To
All Topics Display the main table of contents.
Back Return to the previous help screen.
Contents Display the current program or local table of contents.
Display full-screen help text.
Display the help text in its own window. Drag the Helpwindow title bar to move the window.
Minimize the Help window. To restore the window, tapthe Help button in the taskbar.
Close the Help window and quit help.
Display information farther up the window.
Display information farther down the window.

Operating Basics
YBA250 Antenna and Transmission Line Analyzer User Manual 2- 5
Starting the YBA250 Software
If you purchased your YBA250 installed on NetTek AnalyzerPlatform, it comes from the factory set to automatically start theYBA250 software when the NetTek Analyzer Platform is poweredup. If you added your YBA250 module to a NetTek AnalyzerPlatform you already own, you will need to start the YBA250software or set the software to load at startup.
To start the YBA250 software, double-tap the YBA250 icon on thedesktop or select Start > Programs > NetTek > YBA250.Figure 2--1 shows a typical YBA250 application display.
Figure 2- 1: The YBA250 display

Operating Basics
2- 6 YBA250 Antenna and Transmission Line Analyzer User Manual
Setting the YBA250 Software to Load at Startup
If you purchased your YBA250 as a module to use on an existingNetTek Analyzer Platform, you may want to set the YBA250 to loadat startup.
To set the YBA250 as the startup application:
1. Select Start > Programs > Tektronix Utilities > System
Configuration.
2. On the Software tab, select the StartUp checkbox for theYBA250. See Figure 2--2.
3. Close the System Configuration window.
The next time the NetTek Analyzer Platform is powered on, theYBA250 software will start up automatically.
Figure 2- 2: Setting the StartUp Application
Operating Basics
YBA250 Antenna and Transmission Line Analyzer User Manual 2- 7
YBA250 User Interface Elements
Instrument Area SharedControlArea
Tuning Controls
Command Bar
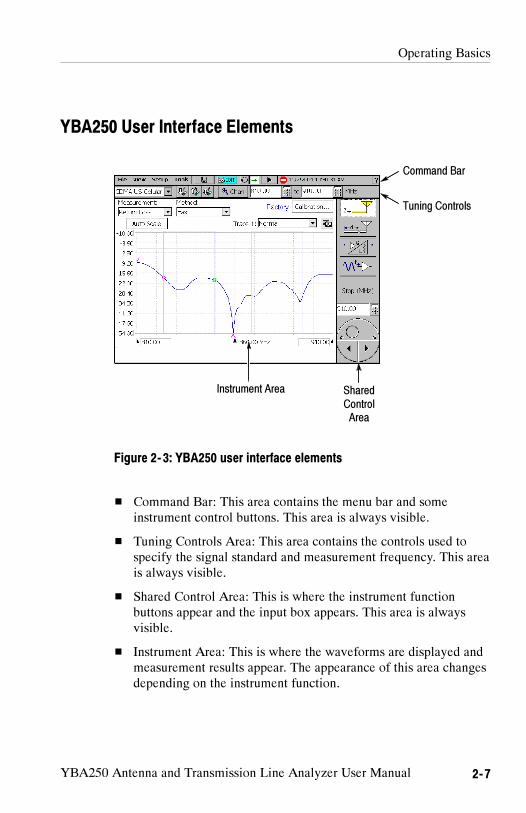
Figure 2- 3: YBA250 user interface elements
Command Bar: This area contains the menu bar and someinstrument control buttons. This area is always visible.
Tuning Controls Area: This area contains the controls used tospecify the signal standard and measurement frequency. This areais always visible.
Shared Control Area: This is where the instrument functionbuttons appear and the input box appears. This area is alwaysvisible.
Instrument Area: This is where the waveforms are displayed andmeasurement results appear. The appearance of this area changesdepending on the instrument function.

Operating Basics
2- 8 YBA250 Antenna and Transmission Line Analyzer User Manual
Command Bar Area
Table 2--3 describes the elements of the Command Bar Area of thedisplay.
Table 2- 3: Command bar area buttons and icons
Button/Icon Function
These are the application menus
Save button. Saves latest measurementresults to a file.
Edit button. Displays the Setup window,which enables you to edit the YBA250setup.
Open button. Displays the Open dialog box,which enables you to select a savedYBA250 setup to load. Replaces Edit buttonwhen Hide Setup Controls is selected.
Continuous measurement button. Sets theYBA250 to take continuous measurements.
Single measurement button. Sets theYBA250 to take a single measurement.
Pause button. Pauses trace acquisition(stops measurements).
Restart/Play button. Starts/Restarts traceacquisition.
Acquisition active bar. Shows that theYBA250 is acquiring measurements. Thenumber of vertical bars displayed cycles toindicate measurements are in progress.
Recalled data icon. Shown when displayingrecalled data.
Stop icon. Shown when the measurementsare paused.

Operating Basics
YBA250 Antenna and Transmission Line Analyzer User Manual 2- 9
Table 2- 3: Command bar area buttons and icons (Cont.)
Button/Icon Function
Timestamp. Shows the time and date thedisplayed results were acquired (not presenton live displays).
Displays the YBA250 Online Help.
Tuning Control Area
Table 2--4 describes the elements of the Tuning Control Area of thedisplay.
Table 2- 4: Tuning control area buttons and icons
Button Function
Standards list. This drop-down list selectsthe signal standard and channel table.
Forward Link button. Changes the start andstop frequency settings to the forward link(downlink) frequency for the selectedchannel.
Reverse Link button. Changes the start andstop frequency settings to the reverse link(uplink) frequency for the selected channel.
Both button. Changes the start and stopfrequency settings to cover both the forwardand reverse link frequencies for the selectedchannel.

Operating Basics
2- 10 YBA250 Antenna and Transmission Line Analyzer User Manual
Table 2- 4: Tuning control area buttons and icons (Cont.)
Button Function
Channel button. Selects the channel numberto measure. The frequency is set to theappropriate value for the selected channeland standard.
Frequency start/stop fields. Sets the startand stop frequencies. Tap the keypad buttonto use the numeric keypad; tap the box touse the knob.
Shared Control Area
Table 2--5 describes the elements of the Shared Control Area of thedisplay.
Table 2- 5: Shared control area buttons and icons
Button Function
Impedance button. Displays the Frequencywindow for measuring return loss, VSWRand cable loss versus frequency (one-portmeasurements).
DTF button. Displays the Distance to Faultwindow for measuring the distance to a fault(one-port measurements).
Insertion Gain/Loss button. Displays theInsertion Gain/Loss window for measuringinsertion gain or loss (in dB) of activedevices, such as filters, duplexers, splitters,combiners, and cable (two-port measure-ments). Requires that both a YBA250 andYBT250 module be installed on the NetTekAnalyzer.

Operating Basics
YBA250 Antenna and Transmission Line Analyzer User Manual 2- 11
Table 2- 5: Shared control area buttons and icons (Cont.)
Button Function
Carrier Wave button. Displays the CW Modewindow for outputting a CW signal.
This area shows the control assigned to theknob and the value of that control.
Keypad button. Enter numbers using anon-screen numeric keypad.
To use the keypad, tap the control or fieldwhose value is to be changed: this assignsthe field to the numeric keypad. Then tap thenumeric keypad button above the controlknob. Type the new value, including unitswhen present. Tap OK, when present, toaccept the new value.
Knob icon. The Knob icon lets you changethe value of the assigned control or field.
Tap the left/right arrows on the bottom halfof the control knob to make small changes.
Tap to the left or right of the small circle (onthe top half) to make larger changes.
Touch a finger inside the “circle” and drag ituntil the control is set to the desired value.

Operating Basics
2- 12 YBA250 Antenna and Transmission Line Analyzer User Manual
Instrument Area
Icons and buttons in the Instrument Area of the display changedepending on the selected function. Table 2--6 describes the buttonsand icons that appear in the instrument area. For descriptions ofmarker readouts and icons, see page 3--43.
Table 2- 6: Instrument area buttons and icons
Button Function
Measurement list. Lists the type of measure-ments available in the current window.
Auto Scale button. Automatically adjusts thevertical scale to achieve the best display.
Calibration/Normalization status. Shows thecurrent Calibration or Normalization status.
Calibration button. Displays the Calibrationdialog where you can create specify thecalibration set to be used for one-portmeasurements. Available when Impedenceor Distance measurement windows areselected.
Normalization button. Displays the normal-ization dialog where you can create or loadthe normalization set to be used for two--portmeasurements. Available when the InsertionGain/Loss measurement window isselected.
Trace order button. Rotates the order of thetraces in the display (and displays Trace 2 ifit is not already displayed).
Graph start field. Indicates and changes thestart frequency or distance of the graph.
Graph stop field. Indicates and changes thestop frequency or distance of the graph.

Operating Basics
YBA250 Antenna and Transmission Line Analyzer User Manual 2- 13
YBA250 Menus
The YBA250 menu bar has four menus. These menus are File, View,Setup, and Tools. Some menu commands have keyboard shortcutsfor use when an optional keyboard is attached to the NetTekAnalyzer Platform, but not all menu commends have keyboardshortcuts.
Tables 2--7 through 2--10 describe the YBA250 menus.
Table 2- 7: The File menu
Menu item Control key Description
Open Ctrl + O Displays Open Results dialog.
Save Results Ctrl + S Saves measurement results to afile. The file is automatically namedand stored in \BuiltIn-Disk\YBA250\AppData\Results.
Save Results As... ------ Saves measurement results to afile, displays Save As dialog so youcan name the file and specifywhere it is saved.
Compare Saved... ------ Displays two saved results forvisual comparison.
Export Results As... ------ Saves measurement results in a fileformat that can used by wordprocessing or spreadsheet applica-tions.
Export Screen ------ Stores an image of the display thatcan be used by word processing orimage editing applications. The fileis automatically named and storedin \BuiltInDisk\YBA250\AppDa-ta\Results.
Operating Basics
2- 14 YBA250 Antenna and Transmission Line Analyzer User Manual
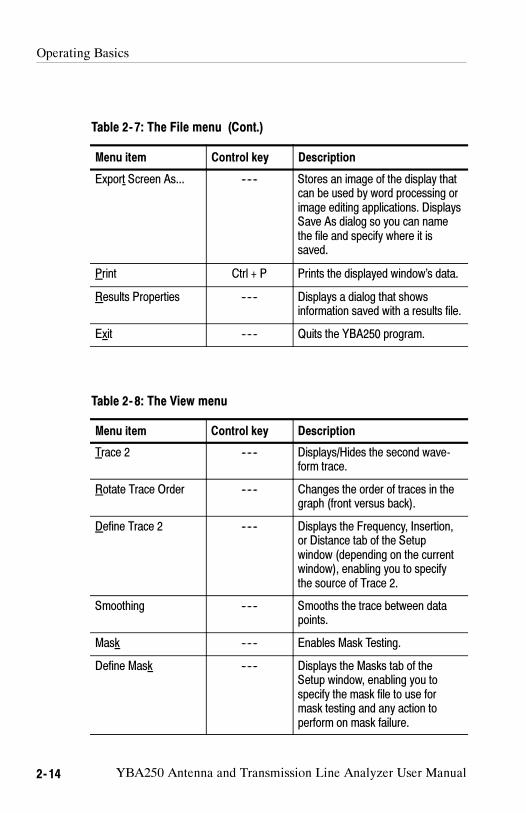
Table 2- 7: The File menu (Cont.)
Menu item DescriptionControl key
Export Screen As... ------ Stores an image of the display thatcan be used by word processing orimage editing applications. DisplaysSave As dialog so you can namethe file and specify where it issaved.
Print Ctrl + P Prints the displayed window’s data.
Results Properties ------ Displays a dialog that showsinformation saved with a results file.
Exit ------ Quits the YBA250 program.
Table 2- 8: The View menu
Menu item Control key Description
Trace 2 ------ Displays/Hides the second wave-form trace.
Rotate Trace Order ------ Changes the order of traces in thegraph (front versus back).
Define Trace 2 ------ Displays the Frequency, Insertion,or Distance tab of the Setupwindow (depending on the currentwindow), enabling you to specifythe source of Trace 2.
Smoothing ------ Smooths the trace between datapoints.
Mask ------ Enables Mask Testing.
Define Mask ------ Displays the Masks tab of theSetup window, enabling you tospecify the mask file to use formask testing and any action toperform on mask failure.

Operating Basics
YBA250 Antenna and Transmission Line Analyzer User Manual 2- 15
Table 2- 8: The View menu (Cont.)
Menu item DescriptionControl key
Markers Ctrl + M Displays/Hides marker controls andreadouts.
Marker Setup ------ Displays the Marker Setup dialogbox.
Band Edge Cursor ------ Displays/Hides band edge cursors.
Table 2- 9: The Setup menu
Menu item Control key Description
Edit.. Ctrl + T Displays the Setup window.
Open... ------ Displays the Open Setup dialog.
Save... ------ Saves current setup to a file.
<Saved Setup 1--N> Displays the name of most recentlyused setup files or files specified inTools > Options > Settings Menu.Up to 10 files can be displayed.
Table 2- 10: The Tools menu
Menu item Control key Description
Options... ------ Displays the Options window.
Keyboard Ctrl + K Displays/Hides the soft keyboard.
TouchscreenCalibration
------ Displays the Windows CE Stylusutility.
Mask Maker... ------ Displays the Mask Maker utility.

Operating Basics
2- 16 YBA250 Antenna and Transmission Line Analyzer User Manual
Table 2- 10: The Tools menu (Cont.)
Menu item DescriptionControl key
Factory Reset ------ Resets all YBA250 settings tooriginal factory values; overwritesexisting settings.
Upgrade Software ------ Displays the utility for enablingsoftware options or installing a newversion of the YBA250 application.
Technical Support ------ Displays technical support contactinformation.
Software Info ------ Displays the SW Propertieswindow which lists, among otherthings, the installed options, andOptions key.
Hardware Info ------ Displays the HW Propertieswindow which lists, among otherthings, serial number, hardwareversions and Global ID.

Operating Basics
YBA250 Antenna and Transmission Line Analyzer User Manual 2- 17
Entering Text
The Input Panel soft keyboard lets you type characters into textboxes or address fields without using an external keyboard.
To display and use the soft keyboard, tap the icon in the toolbar
status area. Figure 2--4 shows the default keyboard.
Figure 2- 4: The Soft Keyboard
To set soft keyboard properties, or switch between a large keyboard(default) and a smaller keyboard, select Start > Settings > ControlPanel. Open the Input Panel icon, and then select Options.
Operating Basics
2- 18 YBA250 Antenna and Transmission Line Analyzer User Manual

YBA250 Antenna and Transmission Line Analyzer User Manual 2- 19
Connecting a Signal
This section explains the importance of using precision cables andconnectors, how to connect the YBA250 to an antenna, and how tocalibrate the YBA250.
Use Precision Connectors and Cables
To ensure that your measurements are accurate, always use precisioncables and connectors. Quality of materials and construction is whatseparates a precision connector from a standard connector. Aprecision connector is manufactured with precisely machinedconnection surfaces and tight tolerances. Precision female centerconnectors often have six fingers instead of the four fingers commonon less expensive connectors.
Precision cables are specially constructed to have an exact 50--ohmimpedance. However, the only real way to tell if a connector is aprecision one is to know the VSWR and loss specifications over thefrequency range to be measured. While the loss specification isimportant to accurate measurements, the VSWR of the cable iscritical.
How cables and connectors affect measurements
Reflection measurements are usually made as a comparison of theunknown (device being measured) to a known standard. Thisstandard is assumed to be perfect.
Any non-precision cable can dramatically affect a reflectionmeasurement. The higher the frequency of measurement, the worsethe degradation will likely be. There are two distinct types of errorsintroduced by a cable.
The first error is simply the reflection and loss of the cable itself.This usually causes a device being tested to seem to have a worseVSWR or Return Loss than it really does.

Connecting a Signal
2- 20 YBA250 Antenna and Transmission Line Analyzer User Manual
The second type of error is the change in reflection, phase, or loss ofthe cable as it is flexed or bent. This causes readings to change as thejumper is bent (particularly for measurements of antennas with goodVSWR).
Any non-precision connector also affects reflection measurements.The effect non-precision connectors have is to decrease return lossby reflecting part of the signal. As with cables, the higher thefrequency of measurement, the worse the degradation will likely be.
Attaching and Removing Precision Connectors
There is a correct way to attach and remove precision connectors.Precision connectors are exceptionally sensitive to mishandling.
CAUTION. Attaching or removing a precision connector incorrectlywill damage the connector. You must attach and remove precisionconnectors using the proper procedure to avoid damaging theconnector.
Precision connectors that have been damaged by improper handingwill not provide dependable measurements.
Attaching Precision Connectors
To properly attach a precision connector to the YBA250:
1. Gently push the connector straight onto the Test Port. DO NOT
turn the body of the connector while pushing it onto the Test Port.
2. Hold the body of the connector still while turning the nut until itis finger-tight. Turn ONLY the nut to secure the connector. SeeFigure 2--5.

Connecting a Signal
YBA250 Antenna and Transmission Line Analyzer User Manual 2- 21
Hold body portion of the connectorsecure from turning.
Tighten connector by turning only thebottom, knurled portion of the connector.
Figure 2- 5: How to attach a precision connector
Removing Precision Connectors
To properly remove a precision connector from the YBA250:
1. Hold the body of the connector still while turning the nut toloosen it. Turn only the nut to remove the connector.
2. Gently pull the connector straight away from the RF input. Donot turn the body of the connector while pulling it off the TestPort.
Connecting an RF Signal
The YBA250 has a single RF signal input, labeled TEST PORT. Theinput impedance is 50 Ω. The input frequency range is 25 MHz to2500 MHz. Figure 2--6 shows the location of the TEST PORT.

Connecting a Signal
2- 22 YBA250 Antenna and Transmission Line Analyzer User Manual
Figure 2- 6: TEST PORT location
To connect an antenna to the YBA250:
WARNING. To prevent personal injury from the effects of lightning, donot connect this product to any source that might be subject to theeffects of lightning. Use your own good judgement and commonsense. You must protect yourself from the effects of lightning.
1. Following your standard practice, disconnect the antenna to betested from the transmitter or receiver.
2. Discharge the antenna (short the center conductor to the cableground shield).
3. Connect one end of a precision cable to the antenna.
4. Connect the other end of the precision cable to the TEST PORTon the YBA250.

YBA250 Antenna and Transmission Line Analyzer User Manual 2- 23
Measurement Overview
YBA250 measurements are divided into two categories; one--portand two-port measurements.
One-Port Measurements
One-port measurements, also known as reflection measurements, usea single port on the YBA250 module to measure return loss, VSWR,cable loss, and distance to fault (DTF). One-port measurementsconnect one end of a signal path to the YBA250 module, with theother end of the signal path connected to the device under test (suchas an antenna).
One-port insertion loss is best for measuring losses in signal pathsthat contain passive, low-loss components such as cables andattenuators. The one-port insertion loss measurement is not asaccurate as the two-port insertion loss measurement, but does notrequire access to both ends of a signal path.
Two-Port Measurements
Two-port measurements, also known as transmission measurements,provide insertion gain and loss measurements such as filter response(loss) versus frequency and tower-mounted amplifier (TMA) gainversus frequency. Both a YBA250 and YBT250 module must beinstalled on the NetTek Analyzer to perform two-port InsertionGain/Loss measurements. The YBA250 module injects a signal intothe device or system under test, and the YBT250 module receivesand measures the resultant signal.

Measurement Overview
2- 24 YBA250 Antenna and Transmission Line Analyzer User Manual
Two--port insertion gain and loss measurements are best formeasuring signal paths that contain active, wide--dynamic--rangecomponents, such as circulators, amplifiers, and directional couplers.Two--port loss measurements are more accurate than one--portmeasurements. Two--port measurements connect both ends of asignal path to the YBA250 and YBT250 modules to measureinsertion gain and insertion loss.

YBA250 Antenna and Transmission Line Analyzer User Manual 2- 25
Calibration and Normalization
To get the most accurate measurements, calibrate the YBA250before you begin to make measurements at a site. One--portmeasurements (return/cable loss, VSWR, and DTF) require acalibration process (described below). Two--port measurements(insertion gain/loss) require a normalization process (starting onpage 2--40).
Calibrating the YBA250
To get the most accurate one--port measurements, calibrate theYBA250 each time before taking measurements at a site.
There are two types of one--port measurement calibration: Factoryand User. The Factory calibration is a calibration data set generatedduring manufacture and saved in non--volatile memory that can berecalled at any time. The Factory calibration provides goodmeasurement accuracy without requiring the use of a calibration kit.
The User calibration is a calibration data set generated using theYBAC3 Calibration Kit (or an equivalent calibration kit) with theinstrument, and saved in non--volatile memory that can be recalled atany time. Using a User calibration data set compensates for changesin instrument temperature, power level and component aging, toensure the most accurate measurements.
The YBAC3 is a set of three high--precision measurement standards.You connect the appropriate temination to the YBA250 Test Port andrun a calibration procedure that normalizes measurements to theaccuracy of the calibration kit standards. See the YBAC3 CalibrationKit Instructions (Tektronix part number 071-1838-XX) for moreinformation.

Calibration and Normalization
2- 26 YBA250 Antenna and Transmission Line Analyzer User Manual
When to Calibrate the YBA250
Calibration is most sensitive to changes in temperature. When theYBA250 senses that its internal temperature has changed more than±10 C (±18 F) from its temperature at the last calibration, itchanges the calibration status to User Cal? to inform you that youshould perform a calibration to ensure the most accurate measure-ments. You can choose not to perform the calibration and still makemeasurements, but the results may not be as accurate as measure-ments performed with a valid calibration.
A calibration is performed across the entire frequency range of theYBA250, so if you change the measurement frequency range or thestart/stop frequencies, you do not need to recalibrate the YBA250.However, if you change the power level setting from that of thecurrent calibration set, you should perform a calibration.
Elements of the Calibration Window
To access the calibration window, tap the button.
The Calibration window lets you select which type of calibration touse (Factory or User), create a User calibration, save a Usercalibration, or load a saved User calibration set. SeeFigure 2--7.
Figure 2- 7: The Calibration window

Calibration and Normalization
YBA250 Antenna and Transmission Line Analyzer User Manual 2- 27
Table 2--11 describes the elements of the Calibration window.
Table 2- 11: Calibration window elements
Field Description
Factory Calibration Select this option button when you want to use theFactory Calibration set.
Date Date the Factory Calibration was performed.
User Calibration Select this option button when you want to use acalibration that you have performed.
Date The date and time the current calibration wasperformed.
Temperature (C) The internal temperature of the YBA250 at the timethe current calibration was performed.
Power level The output power setting when the currentcalibration was performed.
Calibrate at Test Port Select this button to perform a new calibration whenyou are not using an intermediate cable to connectto the antenna.
Calibrate with cable Select this button to perform a new calibration whenyou are using a cable (less than 10 feet or 3 meterslong) to connect to the antenna.
Load saved calibration Select this button to load a saved calibration set.
Save calibration Select this button after you have performed a newcalibration to save the calibration.

Calibration and Normalization
2- 28 YBA250 Antenna and Transmission Line Analyzer User Manual
What is the Current Calibration Status?
The YBA250 displays the current calibration status next to theCalibration button. There are three calibration status labels:
Factory: When this status is displayed, the YBA250 is using theFactory calibration set.
User: When this status is displayed, the YBA250 is using a Usercalibration set. A User calibration is listed as valid for sevendays.
User Cal?: This indicates that the YBA250 is using a UserCalibration set but either too much time has elapsed since the lastcalibration (more than seven days), the internal temperature haschanged more than ±10 Celsius (±18 Fahrenheit), or the powerlevel doesn’t match what it was at the last calibration.
Performing a User Calibration
To perform a User calibration, you must have a YBAC3 CalibrationKit (or an equivalent calibration kit). The YBAC3 consists of threeprecision terminations: an Open, a Short, and a Load. The termina-tions are calibrated and the connectors are precision connectors.
NOTE. The accuracy of the YBA250 cannot be guaranteed if youperform a new calibration with terminationsother than the YBAC3Calibration Kit (or an equivalent calibration kit).
There are two methods of User calibration: Calibrate at Test Port andCalibrate with cable. If you are using a precision cable to connect tothe antenna, you can use either method. If you are using a non-preci-sion cable to connect to the antenna, it is important to use theCalibrate with cable method.
When using the Calibrate at Test Port method, you attach thecalibration standards directly to the TEST PORT connector. Whenusing the Calibrate with cable method, you first connect the cableyou will use to connect to the antenna to TEST PORT connector ofthe YBA250, and then you connect the calibration standards to theother end of the cable. In this way, the YBA250 can compensate forthe loss in the cable, resulting in a more accurate measurement. Note

Calibration and Normalization
YBA250 Antenna and Transmission Line Analyzer User Manual 2- 29
that the Calibrate with cable method is valid only for cable lengthsup to 10 feet (3 meters).
Calibrate at Test Port. To perform a calibration at the test port:
1. In the main display, tap the Calibration button . This
displays the Calibration window.
2. Tap the Calibrate at Test Port button . Thisdisplays the Calibration at Test Port window. See Figure 2--8.
Figure 2- 8: Ready to perform calibration
3. Carefully attach the OPEN calibration standard to the TESTPORT using the procedure described on page 2--20.
You can perform steps 4 through 8 in any order. Note that the OKbutton is not selectable until all three steps have been completed.If you accidently tap the wrong button (for example, you tapOpen while you have the Short calibration standard connected),just repeat the step. To cancel the calibration, tap Cancel at anytime.
4. Tap the Open button in the Calibration at Test Port window.When the calibration is completed, Done appears above the Openbutton.
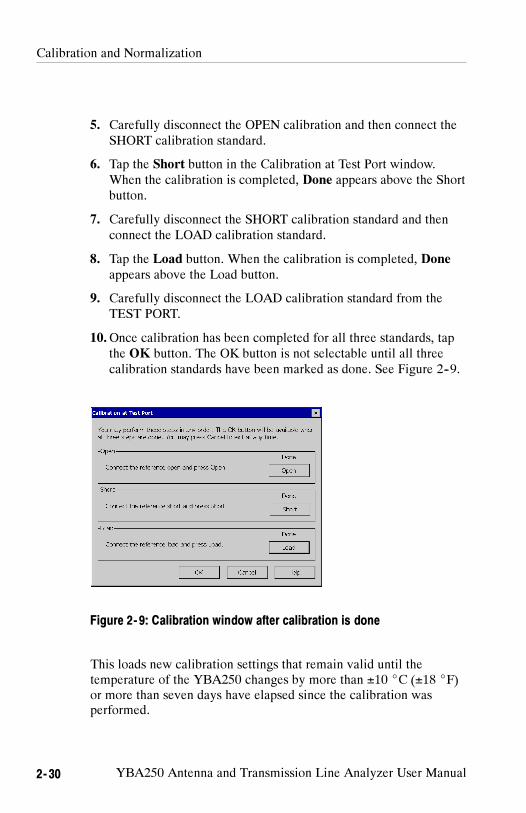
Calibration and Normalization
2- 30 YBA250 Antenna and Transmission Line Analyzer User Manual
5. Carefully disconnect the OPEN calibration and then connect theSHORT calibration standard.
6. Tap the Short button in the Calibration at Test Port window.When the calibration is completed, Done appears above the Shortbutton.
7. Carefully disconnect the SHORT calibration standard and thenconnect the LOAD calibration standard.
8. Tap the Load button. When the calibration is completed, Doneappears above the Load button.
9. Carefully disconnect the LOAD calibration standard from theTEST PORT.
10.Once calibration has been completed for all three standards, tapthe OK button. The OK button is not selectable until all threecalibration standards have been marked as done. See Figure 2--9.
Figure 2- 9: Calibration window after calibration is done
This loads new calibration settings that remain valid until thetemperature of the YBA250 changes by more than ±10 C (±18 F)or more than seven days have elapsed since the calibration wasperformed.

Calibration and Normalization
YBA250 Antenna and Transmission Line Analyzer User Manual 2- 31
Calibrate with Cable. To perform a calibration with a cable that is10 feet (3 meters) or less in length:
1. In the main display, tap the Calibration button . This
displays the Calibration window.
2. Tap the Calibrate with cable button . This
displays the Calibration with Cable window. See Figure 2--10.
Figure 2- 10: Ready to perform calibration with cable
3. Carefully attach the cable to the TEST PORT using the procedureon page 2--20. Note that this calibration method is valid only forcables up to 10 feet (3 meters) long.
You can perform steps 9 through 15 below in any order. Note thatthe OK button is not selectable until all three steps have beencompleted. If you accidently tap the wrong button (for example,you tap Open while you have the Short calibration standardconnected), just repeat the step. To cancel the calibration, tapCancel at any time.
4. Carefully connect the OPEN calibration standard to the end ofthe cable. You may need an adapter to connect the calibrationstandard to the end of the cable. If you need an adapter, becertain to use a precision adapter.

Calibration and Normalization
2- 32 YBA250 Antenna and Transmission Line Analyzer User Manual
5. Tap the Open button in the Calibration with cable window. Whenthe calibration is completed, (Done) appears above the Openbutton.
6. Carefully disconnect the OPEN calibration standard and thenconnect the SHORT calibration standard.
7. Tap the Short button in the Calibration with cable window. Whenthe calibration is completed, (Done) appears above the Shortbutton.
8. Carefully disconnect the SHORT calibration standard and thenconnect the LOAD calibration standard.
9. Tap the Load button. When the calibration is completed, (Done)appears above the Load button.
10.Carefully disconnect the LOAD calibration standard from thecable and remove the cable from the TEST PORT.
11. Once the calibration has been completed for all three standards,tap the OK button. The OK button is not selectable until all threecalibration standards have been marked as done.See Figure 2--11.

Calibration and Normalization
YBA250 Antenna and Transmission Line Analyzer User Manual 2- 33
Figure 2- 11: Calibration window after calibration is done
This loads new calibration settings into non-volatile memory thatremain valid (while using the cable with which the calibration wasperformed) until the temperature of the YBA250 changes by morethan ±10 Celsius (±18 Fahrenheit) or more than seven days haveelapsed since the calibration was performed.
Saving User Calibration Data Sets
User Calibration data sets can be saved in non-volatile memory sothat they can be loaded at another time. One reason to do this is sothat you do not have to carry a calibration kit with you in the field.
To save calibration sets for later recall:
1. Perform a new calibration as described starting on page 2--28.
2. Tap the Save calibration button in the Calibration window.

Calibration and Normalization
2- 34 YBA250 Antenna and Transmission Line Analyzer User Manual
3. Name the calibration set (for example, “Nehalem Mountain” todenote the location where the calibration was performed) and tapOK.
This saves the calibration set in non-volatile memory so that it canbe loaded at another time. Calibration data sets are stored within themodule, so that if the YBA250 module is moved to another NetTekAnalyzer Platform the calibration data set stays with the module.
Loading a Saved Calibration Set
If you are in the field and need to perform a calibration but do nothave the YBAC3 Calibration Kit with you, you can load a savedcalibration set.
To load a saved calibration set:
1. Tap the Calibration button . This displays the
Calibration window.
2. To load a saved calibration set, tap the Load saved calibration
button. This displays the Calibration Browser window. SeeFigure 2--12.
Figure 2- 12: Calibration browser window

Calibration and Normalization
YBA250 Antenna and Transmission Line Analyzer User Manual 2- 35
There is a line of text that appears below the list of savedcalibration sets. The line of text begins with Current condi-
tions:. It displays the the power level, temperature of theYBA250, and the date. This information is provided to help youdecide which calibration set to load. For details on how to usethis information, see Which Calibration Set Should You Use? onpage 2--37.
3. Select the saved calibration set you want to use and tap OK.
This loads the saved calibration set which will remain valid until thetemperature of the YBA250 changes by more than ±10 C (±18 F)or more than one week has elapsed since the calibration wasperformed.

Calibration and Normalization
2- 36 YBA250 Antenna and Transmission Line Analyzer User Manual
Using the Factory Calibration
A Factory Calibration is a special calibration performed with a set ofvery high-precision calibration standards at the factory. The FactoryCalibration set is saved in non-volatile memory so it can be recalledat any time. The Factory Calibration set cannot be changed.
To load the Factory Calibration set:
1. Tap the Calibration button . This displays the
Calibration window.
2. To load the Factory Calibration settings, select the FactoryCalibration checkbox. See Figure 2--13.
Figure 2- 13: The Calibration window
3. Tap OK.
This loads the calibration set stored at the factory. The FactoryCalibration can be used across the entire YBA250 operatingtemperature range. (For details on accuracy specifications, seeAppendix A, Specifications.)

Calibration and Normalization
YBA250 Antenna and Transmission Line Analyzer User Manual 2- 37
Which Calibration Set Should You Use?
There are three factors to consider when deciding which savedcalibration set you should use: temperature, power level, and lengthof time since the calibration was performed.
1. Temperature (that is, the internal temperature of the module) hasthe greatest effect on measurement accuracy; therefore, it shouldbe considered the most important factor when selecting amongsaved calibration sets. Choose the calibration set with thetemperature closest to the current temperature.
2. The next factor to consider is the power level. Always try to use acalibration set that was performed at the same power level.
3. The next factor to consider is the time since the calibration wasperformed. The most recent calibration is the best choice.
Elements of the Calibration Browser Window
The Calibration Browser window is used to select a saved calibrationto load. But, how do you know which calibration set to load? Thereare several fields of information in the browser window that can helpyou decide which calibration set to load.
Table 2- 12: Calibration Browser Fields
Field Description
Name The name given to the calibration set when it was saved.
Cable Either Yes or No. Yes indicates the calibration was performedusing Calibrate with cable. No indicates the calibration wasperformed with Calibrate at Test Port.
Valid Either Yes or No. If Yes, the temperature at the time of thecalibration was run is within ±10 °C (±18 °F) of the currenttemperature, less than a week has elapsed since thecalibration set was saved and the current power level is thatsame as that of the calibration set. If No, the temperature whenthe calibration set was saved is too different from the currenttemperature, more than one week has elapsed since thecalibration set was saved (possibly both), or the current powerlevel is different from the power level setting of the calibrationset.

Calibration and Normalization
2- 38 YBA250 Antenna and Transmission Line Analyzer User Manual
Table 2- 12: Calibration Browser Fields (Cont.)
Field Description
Power Either High or Low. The output power setting when thecalibration was performed.
Temp The internal temperature of the YBA250 at the time thecalibration was performed.
Date The date the calibration was performed.
CurrentConditions
A line below the list of saved calibration sets that lists currentconditions:
Output level: Either High or Low
Temperature: Current temperature in degrees Celsius.
Date: The current date set on the NetTek Analyzer Platform.
Time: The time on the NetTek Analyzer Platform when theCalibration Browser was opened.
Calibration Guidelines
Calibration is most sensitive to changes in temperature. When theYBA250 senses its internal temperature has changed more than±10 C (±18 F) from its temperature at the last calibration, itchanges the calibration status to User Cal? to inform you that youshould perform a calibration to ensure the most accuratemeasurements.
You can choose not to perform the calibration and still makemeasurements, but the results may not be as be accurate asmeasurements performed with a valid calibration.
A calibration is performed across the entire frequency range ofthe YBA250, so if you change the measurement frequency rangeor the start/stop frequencies, you do not need to recalibrate theYBA250.

Calibration and Normalization
YBA250 Antenna and Transmission Line Analyzer User Manual 2- 39
If you change the power level setting from that of the currentcalibration set, you should perform a calibration. See GeneralTab for information on changing the power level.
To achieve the most accurate results, always perform a Usercalibration before you begin taking measurements at a site.However, if this isn’t possible (for example, you don’t have aYBAC3 Calibration Kit or an equivalent calibration kit withyou), you can load saved user calibration sets or use the FactoryCalibration. Factory calibration is always available and providesreasonably accurate results.
If you have saved calibration sets, load the calibration set thatmost closely matches the current conditions. Saved calibrationsets will provide more accurate results than a Factory calibrationset or the User Cal? status.

Calibration and Normalization
2- 40 YBA250 Antenna and Transmission Line Analyzer User Manual
Normalizing the YBA250
Normalization generates measurement correction data to compensatefor signal source variations, test cable and attenuator losses, andcable/attenuator reflections, for two--port measurements. Normaliza-tion data (Default or User) must be loaded before you can performaccurate two--port insertion gain or loss measurements.
There are two types of normalization: Default and User. The Defaultnormalization data set covers the entire YBA250 frequency range(30 MHz to 2500 MHz) and all signal source levels (+3 dBm to--60 dBm). This provides a general baseline measurement referenceacross all frequencies and signal levels. Default normalizationprovides good measurement accuracy across all frequencies any timea User normalization is not available or is not valid.
The User normalization data set covers a specified frequency rangeand output power level, based on the instrument settings when theUser normalization data was created. A User normalization providesthe most accurate measurements.
Both Default and User normalizations generate correction data usingprecision cables and attenuators connected between the YBA250 andthe YBT250 modules. The normalization data, plus instrument stateinformation (such as date/time and internal module temperature), issaved to non--volatile memory.
The Normalization Window Elements
The Normalization window is where you select which type ofnormalization to use (Default or User), create a new Default or Usernormalization, save normalization data to a file, or load a savednormalization set.
To display the two--port Normalization window, tap the Normaliza-tion button while in the Insertion Gain/Loss window. Figure 2--14shows the Normalization window. Table 2--13 describes the contentsof the Normalization window.

Calibration and Normalization
YBA250 Antenna and Transmission Line Analyzer User Manual 2- 41
Figure 2- 14: Normalization window
Table 2- 13: Normalization window elements
Field/Button Description
Default Normalization Sets the Default normalization set as the currentNormalization.
User Normalization Sets the User normalization set (newly-created orloaded from a saved file) as the current Normalization.
Date Displays the date the normalization was created.
Temperature (C) Displays the internal temperature, in degrees Celsius,of the YBA250 at the time the normalization wascreated.
Start/Stop Freq Displays the start and stop frequencies of thenormalization.
Output Power Lvl Displays the output power setting of the normalization.
Current Temperature Displays the highest temperature of the two modules.

Calibration and Normalization
2- 42 YBA250 Antenna and Transmission Line Analyzer User Manual
Table 2- 13: Normalization window elements (Cont.)
Field/Button Description
Perform defaultnormalization
Creates a new default normalization set.
Create usernormalization
Creates a new User normalization based on theYBA250 current settings and conditions (frequencystart/stop, power level, date/time, and internal moduletemperature).
Additional information Opens a window to display more information about theselected Default or User normalization.
Load savednormalization
Loads a saved normalization set into the YBA250.
Save normalization Saves the current User normalization data to a file.
There are three possible normalization data status labels shown inthe Normalization window: Valid, Not Valid, and Unusable.
Valid: The specified data is within the accepted tolerances of thecurrent NetTek Analyzer/YBT250/YBA250 configuration orconditions.
Not Valid: The specified data is not within the acceptedtolerances of the current NetTek Analyzer/YBT250/YBA250configuration or conditions.
Unusable: The specified data was created on a different NetTekAnalyzer/YBT250/YBA250 configuration, or normalization datadoes not exist.

Calibration and Normalization
YBA250 Antenna and Transmission Line Analyzer User Manual 2- 43
Normalization Type Status
The YBA250 displays the current normalization type status next tothe Normalization button on the main Insertion Gain/Loss screen.
Normalizationstatus label
Figure 2- 15: Normalization type status label
There are four normalization status labels:
User indicates that the YBA250 is using a valid User normalizationset.
User? indicates that the YBA250 is using a non-valid Usernormalization set, and the measurements may not be as accurate aspossible. The YBA250 automatically changes normalization statusfrom User to User? under any of the following conditions (theYBA250 continues to use the current User normalization):
The User normalization is more than seven days old.
The internal temperature of either module has changed more than±5 C (±9 F) from the temperature values in the Usernormalization.
Default indicates that the YBA250 is using the Default normaliza-tion set. The YBA250 automatically replaces the current Usernormalization set with the Default normalization set, and changesthe normalization status from User or User? to Default, under any ofthe following conditions:
New frequency start and/or stop values were entered that aredifferent than those in the User normalization.
A new power output level value was entered that is different thanthe one in the User normalization.
Calibration and Normalization
2- 44 YBA250 Antenna and Transmission Line Analyzer User Manual
UnNormalized indicates one of the following:
Neither a User or Default normalization set is loaded.
Either or both YBA250 or YBT250 modules were replaced witha different serial numbered module.
The YBA250 module determines that the available Defaultnormalization is not usable with the current module configura-tion.
NOTE. The Default normalization is always usable, when used withthe same YBA250/YBT250 module combination used to create thedefault normalization. The Default normalization is also usable whenthe creation date is older than seven days or the module temperatureexceeds the above limits.
Creating a Default Normalization
To create a Default normalization, do the following:
1. Tap the Insertion Gain/Loss button to display the InsertionGain/Loss screen.
2. Tap the Normalization button to display the Normalizationwindow.
3. Tap the Perform default normalization button to display theDefault Normalization window.
4. Follow the on--screen instructions and diagram to connect theprecision cables and attenuators between the YBA250 andYBT250 modules. Make sure to use the same cables andattenuators during the Default normalization process that you willuse to take the insertion gain/loss measurements.
5. Tap the Normalize button. The instrument takes a minute or so togenerate the normalization data, and then saves the Defaultnormalization to memory, closes the window and returns you tothe Normalization window.

Calibration and Normalization
YBA250 Antenna and Transmission Line Analyzer User Manual 2- 45
NOTE. Note: The Default normalization data set is not accessible asa file; it is stored in memory and set as the current Defaultnormalization. To replace the existing Default normalization data,create a new Default normalization.
Creating a User Normalization
To create a User normalization, do the following:
1. Tap the Insertion Gain/Loss button to display the InsertionGain/Loss screen.
2. Select the measurement type (Insertion Loss or Insertion Gain).
3. Select the signal standard from the drop--down list located belowthe menu bar.
4. Set the specific start/stop frequencies using any of the followingmethods:
Tap the Channel button to set the frequency span to a specificchannel. The YBA250 centers the display at the centerfrequency of the selected channel and sets the span to twicethe bandwidth specified by the signal standard, or 1.5 MHz,whichever is greater. If a Forward/Reverse/Both button isselected, it is taken into account when the Start and Stopfrequencies are set. After you have selected a channel, tapOK.
Enter the Start and Stop frequencies in the frequency fieldsadjacent to the Channel button by using the numeric keypadsor the knob.
To measure across just the forward or reverse bands, tap theForward or Reverse button. To measure across both theForward and Reverse bands, tap the Both button.
5. Select the signal power output level from the Power OutputLevel: list.
6. Tap the Normalization button.

Calibration and Normalization
2- 46 YBA250 Antenna and Transmission Line Analyzer User Manual
7. Tap the Create User Normalization button to display the UserNormalization, Step 1 window. Verify the settings in the window;if they are incorrect, exit the window and enter the correctsettings.
8. If the settings are correct, tap Continue. Follow the UserNormalization, Step 2 window instructions and diagram toconnect the precision cables and attenuators between theYBA250 and YBT250 modules.
NOTE. Make sure to use the same cables and attenuators during theUser normalization process that you will use to take the on-siteinsertion gain/loss measurements. Using attenuators on the moduleports improves measurement accuracy by minimizing impedancemismatch errors between the module ports and the system or deviceunder test.
NOTE. If you are measuring an amplifier that requires the use of abias--tee, perform the normalization with the bias--tee in thenormalization setup if possible; otherwise, subtract the bias--teeabsolute loss value from the gain measurement value.
9. Tap the Normalize button. The instrument generates thenormalization data, and then closes the window and returns youto the Normalization window.
The newly--created User normalization is stored in memory and isset as the current User normalization, until explicitly overwritten bycreating a new User normalization or loading a saved Usernormalization.
Saving a User Normalization
To save a User normalization to a file, do the following:
1. Tap the Save Normalization button to display the NormalizationBrowser window.

Calibration and Normalization
YBA250 Antenna and Transmission Line Analyzer User Manual 2- 47
Figure 2- 16: Normalization Browser window
2. Select the file slot in which to save the normalization data.Unused slot are indicated with dashes. To replace an existingUser normalization file, select the file name to replace.

Calibration and Normalization
2- 48 YBA250 Antenna and Transmission Line Analyzer User Manual
3. Tap the Continue button to display the Save Normalizationwindow.
Figure 2- 17: Save Normalization window
4. Enter a file name in the Name: field. The file name can have amaximum of 31 alphanumeric characters, including spaces. Usean external keyboard, or tap the keyboard icon to display atouch--screen keyboard. Tap the keyboard icon in the task bar toclose the keyboard.
5. Enter any other necessary descriptive text in the AdditionalInformation field.
6. Tap OK to save the file to the specified name.
Loading a User Normalization
1. To load a User normalization file, do the following:
2. Tap the Insertion Gain/Loss button.
3. Tap the Normalization button.

Calibration and Normalization
YBA250 Antenna and Transmission Line Analyzer User Manual 2- 49
4. Tap the Load Saved Normalization button to display the LoadSaved Normalization window.
Figure 2- 18: Load Saved Normalization window
5. Select the file from which to load the normalization data. Tap theAdditional Information button to display more informationabout the file.
6. Tap OK to load the selected User normalization file into theinstrument.
NOTE. Loading a normalization sets the instrument start/stopfrequency and output power level values to those stored in thenormalization. Other instrument settings, including measurementstandard, measurement type, and measurement method, do notchange when loading a normalization.

Calibration and Normalization
2- 50 YBA250 Antenna and Transmission Line Analyzer User Manual
Normalization Guidelines
Two-port User normalizations created for a specific frequencyrange and power output provide the most accurate two-portinsertion gain and loss measurements.
The YBA250 does not ship with any User normalizations. Youcan create User normalizations any time before taking measure-ments. For best accuracy, create a new User normalization on sitebefore taking measurements.
The Default normalization is excellent for locating high--levelmalfunctions, such as testing an amplifier with low or no gain,isolating a transmission line problem, or testing a lightning-dam-aged filter.
The YBA250 does not ship with a Default normalization; youshould create one before performing any measurements. TheYBA250 can take measurements without a Default or Usernormalization loaded, but the measurements will not be accurate.For reasonable accuracy, create a new Default normalization onsite before taking measurements.
A User normalization is only valid for the frequency range andpower level used when the normalization data was collected. Thenormalization frequency and power information is shown in thenormalization screens.
Bias Tees, filters, and attenuators required to take a measurement(as opposed to filters and attenuators you are testing for correctoperation) should be connected to the attenuators on the NetTekAnalyzer ports, and a new normalization created to remove theireffects from the measurement path.
For maximum measurement accuracy, use the same cables andattenuators used to create the normalization data set to takemeasurements.

Calibration and Normalization
YBA250 Antenna and Transmission Line Analyzer User Manual 2- 51
The User normalization becomes less accurate and the YBA250automatically changes normalization status from User to User?
under the following conditions (the YBA250 continues to use thecurrent User normalization):
The User normalization is more than seven days old.
The internal temperature of either module changes by morethan ±5 C (±9 F) from the temperature values at which theUser normalization was created.
The YBA250 automatically replaces the current User normaliza-tion set with the Default normalization (if present) and changesthe normalization status from User or User? to Default under thefollowing conditions:
Frequency start and/or stop values were entered that aredifferent than those in the User normalization.
A power output level value was entered that is different thanthe one in the User normalization.
The YBA250 automatically changes the normalization statusfrom User, User?, or Default to UnNormalized, if either or bothYBA250 or YBT250 modules are replaced with a different serialnumbered module.
The Default normalization data is always usable when used withthe same YBT250/YBA250 module combination used to createthe default normalization, even when the data is older than sevendays or the module temperatures exceed the above limits.
If you use multiple frequency ranges or power levels to takemeasurements, it may be convenient to create and save a usernormalization entry for each of the measurements. Loading asaved User Normalization sets the instrument to the frequencyrange and power setting associated with that normalization.
Default and User normalization data sets work only with thespecific YBA250/YBT250 module pair used to create that data.The YBA250 reports the normalization set as not valid if you usethe normalization data with different YBT250 and/or YBA250modules.

Calibration and Normalization
2- 52 YBA250 Antenna and Transmission Line Analyzer User Manual

YBA250 Antenna and Transmission Line Analyzer User Manual 2- 53
Configuring the Instrument
Before you can use the YBA250 to take measurements, you shouldconfigure the following instrument settings.
Enabling Signal Standards
The currently selected signal standard controls the channels availablefrom the signal standard list. Before you begin using the YBA250,you need to enable the signal standards that you want to test.Enabled signal standards are added to the Signal Standardsdrop--down list.
To enable a signal standard (add it to the Signal Standards drop--down list):
1. Select Tools > Options.
2. Tap the Signal Standards tab. This displays the window shownin Figure 2--19. The standards supported in the YBA250 areshown in the list on the left side of the window.
Figure 2- 19: The Signal Standards tab of the Options window
Configuring the Instrument
2- 54 YBA250 Antenna and Transmission Line Analyzer User Manual
3. To enable a signal standard, tap the name of the standard youwant to enable and then tap Add>>.
4. When you have enabled all the standards you will be testing, tapOK.
Only enabled standards are displayed in the Signal Standardsdrop-down list.
Setting the Output Power Level
You can set the output power used for Calibration, Return Loss,Distance to Fault and Cable Loss measurements to either Low orHigh power. The default setting is High. The advantage of the Highpower setting is that it makes measurements more immune tointerference from other signal sources. The advantage of the Lowpower setting is that it is less likely to disrupt calls on othertransmitters.
The High power setting is also a good choice when testing longcables or cables with a high cable-loss value. If you are trying tomeasure cable with an active device on it, you may need to chose theLow power setting to avoid over driving the active device.
To set the Output Power level:
1. Tap the Edit button or select Setup > Edit from the
menu bar.
2. Tap the General tab.
3. Select the option button for Low power or High Power. SeeFigure 2--20.

Configuring the Instrument
YBA250 Antenna and Transmission Line Analyzer User Manual 2- 55
Figure 2- 20: Setting the output power level
NOTE. Each time the YBA250 is powered up, the Output Power is setto the level specified by Power up. The output power can be set toLow or High. The Low power level is approximately --20 dBm andthe High power level is about +3 dBm.
To set the default Output Power level, tap Low or High from thePower up drop-down list.
NOTE. Setting the Output Power Level does not affect the CW SignalMode output power setting.

Configuring the Instrument
2- 56 YBA250 Antenna and Transmission Line Analyzer User Manual
Setting Measurement Method
The Method setting allows you to choose between a faster measure-ment with fewer data points or a slower measurement that containsmore data points. The more data points in the measurement, thehigher the resolution of the measurement, but the longer it takes toacquire the measurement. Figure 2--21 shows the location of themeasurement Method function.
Method drop-down list
Figure 2- 21: Location of Method drop-down list
To change the method setting, select the desired setting from theMethod drop-down list. Table 2--14 shows how the Method settingaffects the resolution.
Table 2- 14: Performance versus Resolution
Method
Maximum Resolution for allmeasurements exceptInsertion Gain/Loss1
Average Resolution forInsertion Gain/Loss1
Fast 256 100
Normal 1024 200
High Resolution 4096 400
1 Resolution is the number of data points acquired per measurement. The actualnumber of data points depends on several interacting factors. The number of datapoints displayed may be less than the maximum.

Configuring the Instrument
YBA250 Antenna and Transmission Line Analyzer User Manual 2- 57
NOTE. The measurement method setting is not shared betweendifferent measurement modes. Impedence, DTF, and InsertionGain/Loss measurements can be set to different measurementmethods.
Setting Display Preferences
The YBA250 enables you to change the color scheme used in thedisplay. There are three color schemes, one monochrome scheme,and a black and white printout scheme. Color schemes specified inthe YBA250 do not affect standard Windows CE screen items. TheYBA250 color schemes affect only measurement graphs in thedisplay.
To specify the color scheme used by the YBA250:
1. Select Tools > Options.
2. Select the Preferences tab. This displays the window shown inFigure 2--22.
Figure 2- 22: Preferences tab showing available color schemes

Configuring the Instrument
2- 58 YBA250 Antenna and Transmission Line Analyzer User Manual
3. To display a list of the available color schemes, tap the ColorScheme list box. Available color schemes are Indoor Viewing,Outdoor Viewing, Dark on white, Monochrome grays, and Blackon White for Printer.
4. To select a color scheme, tap the name of the desired colorscheme.
5. To change the Windows CE display properties, tap Take Me
There. This displays the Windows CE Display Propertieswindow, where you can set the display background and windowcolor scheme.
6. Tap OK to save changes.
7. To view the changed color scheme, quit the YBA250 programand restart it.
Display Trace Smoothing
For DTF and Insertion Gain/Loss measurements, when increasingthe Start distance, decreasing the Stop distance, or reducing thefrequency measurement range, the graph trace may become “blocky”because there are fewer data points to display. You can use theView > Smoothing command to smooth the displayed trace betweendata points.
You can also set trace smoothing as the default for DTF andInsertion Gain/Loss measurements by selecting Smooth Waveformas needed for DTF and Insertion on the Setup > General tab.When a measurement has less than 128 data points, the YBA250automatically applies the smoothing function to the trace.
Changing Settings for Saved Files
The YBA250 enables you to specify settings for saved files such asprefixes for filenames, the name of a technician making a test, notesto be included in saved results files, and the default format forexported screens.

Configuring the Instrument
YBA250 Antenna and Transmission Line Analyzer User Manual 2- 59
Setting File Options
The Save & Export tab is where you specify saved file options.
To display the Save & Export tab:
1. Select Setup > Edit.
2. Tap the Save & Export tab. See Figure 2--23.
Figure 2- 23: The Save & Export tab
Setting the Filename Prefix
The YBA250 allows you to save a file, such as a results file, with aname you enter each time you save a file. You can also allow theYBA250 to automatically name files for you. When files are savedwithout a specified prefix, the file name is simply a number, forexample: 0004.r01. However, you can specify a prefix for automati-cally named files so that you can more easily identify saved files.Actual file names consist of the prefix you specify attached to anumber, which is generated when the file is saved. For example, ifyou are testing Site 5 you could set the prefix to s5, resulting in a filename of s50004.r01.

Configuring the Instrument
2- 60 YBA250 Antenna and Transmission Line Analyzer User Manual
NOTE. The length of a file name is variable, depending on the lengthof the path (where the file is located). The limit of the path and filename is 256 characters. The shorter the path to the file, the longerthe file name can be.
To specify the file name prefix:
1. Select Setup > Edit. This displays the Setup window.
2. Tap the Save & Export tab. See Figure 2--23.
3. Tap the box after File Prefix:.
4. Enter text (using the soft keyboard or an external keyboard) touse as the prefix of file names.
5. Tap OK to save your changes.
Setting the Technician Name
The YBA250 allows you to store the name of the technicianperforming a test in the results file for the test.
To specify the technician’s name:
1. Select Setup > Edit. This displays the Setup window.
2. Tap the Save & Export tab. See Figure 2--23.
3. Tap the box after Technician:.
4. Enter the technician name. You can also use this space foradditional test information instead of a technician name.
5. Tap OK to save the technician name field.
Entering Notes for Saved Results
The YBA250 lets you enter a note to be saved in results files. Thus,if there are any special conditions about a test, you can save noteswithin the results file. You can enter up to 254 characters in the notesfield.

Configuring the Instrument
YBA250 Antenna and Transmission Line Analyzer User Manual 2- 61
To specify notes for saved results:
1. Select Setup > Edit. This displays the Setup window.
2. Tap the Save & Export tab. See Figure 2--23.
3. Tap the box after Notes for saved results:.
4. Enter text (using the soft keyboard or an external keyboard) forthe note.
5. Tap OK to save the notes you entered.
Saving GPS Coordinates with your Results
You can connect a GPS (Global Positioning System) receiver to yourNetTek Analyzer to collect location coordinates that are saved withyour measurement results. The most recent position read from theGPS receiver is included with your results when you save or exportyour results.
NOTE. For correct coordinates when using the GPS function, save orexport your results while the GPS receiver is at the location whereyou made the test. If you take a measurement, move the instrument,and then save your results, you will not be saving the coordinates ofthe location where you took the test. You will be saving thecoordinates of your new location.
Selecting a Compatible GPS Receiver
You can use any GPS receiver that supports NMEA 0183 V2.0.Specifically, the GPS must output the $GPRMC sentence on aregular basis.
The YBA250 application reads the GPS position from the GPSreceiver once per second, or at the rate the GPS receiver sends the$GPRMC sentence, whichever is slower.
Connecting through the Serial Port. The GPS receiver can connect tothe serial port (4800 baud rate). The Garmin GPS III and GarminGPS III Plus have been tested with the YBA250 application.

Configuring the Instrument
2- 62 YBA250 Antenna and Transmission Line Analyzer User Manual
Connecting through the PCMCIA Slot. The GPS receiver can connectthrough the PCMCIA slot and emulate a serial port on COM4. TheTeletype GPS WorldNavigator (product #1351) has been tested withthe YBA250 application.
Setting Up YBA250/GPS receiver communications
To set up the GPS receiver to work with the YBA250:
1. Set your GPS receiver to regularly output NMEA sentences.
2. Connect the GPS receiver (by serial cable or through thePCMCIA slot) to the NetTek Analyzer platform.
3. In the YBA250 application, tap the Edit button and then theSave & Export tab.
4. Select the correct GPS receiver interface type (Serial orPCMCIA) from the GPS Receiver drop-down list.
The YBA250 displays the latitude and longitude just to the right ofthe drop-down list box a short time after the GPS receiver sends the$GPRMC sentence. Tap the Refresh button to update the displayedcoordinates.
You can also view the latest GPS position in the Results Propertiesdialog box (File > Results Properties). When you open a savedresults file, the Results Properties shows information about theresults file, including the GPS position at the time the results file wassaved.
Troubleshooting Your GPS Receiver
After you have selected the GPS receiver type in the Save & Exportdialog box, a position should appear immediately to the right of thelist box.
Error Message: Invalid Position. If, after you select the GPS receivertype in the Save & Export dialog, the message “Invalid Position”appears, then the communication connection to the receiver has beensuccessfully established, and the $GPRMC sentence is beingsuccessfully read from the receiver, but the position supplied in thatsentence is not valid. In this case, check your GPS receiver to see ifit does have a valid position, and, if not, refer to the GPS receiverdocumentation to resolve this problem.

Configuring the Instrument
YBA250 Antenna and Transmission Line Analyzer User Manual 2- 63
Error Message: Unable to Read Position Information If the instrumentdisplays an error dialog indicating that the application was unable toread position information from the GPS receiver, do the following:
Make sure the cable from the receiver to the serial port isconnected and that the PCMCIA card is firmly seated.
Ensure that the receiver is set to regularly output NMEAsentences.
If you have purchased the vxHpc terminal emulator, you canview the NMEA sentences being sent.
Open the vxHpc terminal emulator by tapping Start > Programs
> Communication > vxHpc.
To view the NMEA sentences being sent, you need to set upvxHpc to connect to the correct port:
For a serial port GPS receiver, set up vxHpc to connect toCOM1.
For the Teletype WorldNavigator, set up vxHpc to connect toTeletype_1358 (for Y350C NetTek Analyzer Platforms) orCOM4 (for Y400 NetTek Analyzer Platforms).
Configure the serial port as follows:
4800 baud
8 data bits
No parity
1 stop bit
No flow control
Open the session. You should see NMEA sentences being sent theGPS receiver.
If you do not see NMEA sentences, either the GPS receiver is notsending the sentences or the connection to the GPS receiver is notpassing them (check the cables again). Refer to your GPSreceiver documentation to find out how to output NMEAsentences regularly.

Configuring the Instrument
2- 64 YBA250 Antenna and Transmission Line Analyzer User Manual

Reference


YBA250 Antenna and Transmission Line Analyzer User Manual 3- 1
Setting the Signal Standards and TestFrequency Range
Selecting Signal Standards
The signal standards provide a fast way to specify the test frequencyrange available for taking measurements. Before you begin using theYBA250, you should add the signal standards you need for yourtesting to the standards list. Signal standards are selected from theOptions window.
To add a signal standard to the Signal Standard list:
1. Select Tools > Options.
2. Tap the Signal Standards tab to display the window shown inFigure 3--1. The Signal Standards supported list (left side ofwindow) lists all available standards.
Figure 3- 1: The Signal Standards tab
3. Tap the name of the standard to enable in the Signal Standardssupported list.

Setting the Signal Standards and Test Frequency Range
3- 2 YBA250 Antenna and Transmission Line Analyzer User Manual
4. Tap Add>>. This moves the standard name from one list to theother.
5. Repeat steps 3 and 4 until you have added all necessary signalstandards to the list.
6. When you have enabled all the standards you will be testing, tapOK.
Only enabled standards are listed in the signal standards list thatappears in the tuning controls area of the measurement displays.
NOTE. You can also double--tap on a standard to move it from one listto the other.
The Test Frequency Range
All measurements (except DTF) are made across a test frequencyrange. The test frequency range is defined by specifying a start and astop frequency. You must set the test frequency range before makinga measurement.
Figure 3--2 shows the location of the frequency information, as wellas the buttons and controls used to set the test frequency range.

Setting the Signal Standards and Test Frequency Range
YBA250 Antenna and Transmission Line Analyzer User Manual 3- 3
Start frequencySignal Standard list
Channel button
Center frequency
Start frequencyStop frequency
Forward/Reverse/Both buttons
Start frequency
Figure 3- 2: Frequency range controls
There are two ways to set the test frequency range:
Select the signal standard, channel, and direction
Set the start and stop frequencies manually (see page 3--5)
Setting the Test Frequency Range by Standard andDirection
The easiest way to set the test frequency range is to select the signalstandard and direction. This way you don’t have to remember thespecific frequencies for a signal standard. Setting the signal standardand direction sets the test frequency range so that it covers the spanof the entire selected standard plus 10% of the total span above andbelow.

Setting the Signal Standards and Test Frequency Range
3- 4 YBA250 Antenna and Transmission Line Analyzer User Manual
To set the test frequency range by selecting the signal standard anddirection:
1. Select the signal standard from the drop-down list. SeeFigure 3--2.
Only “enabled” signal standards are listed in the drop-down list.If a supported signal standard is not listed, you can add it byselecting More.. from the drop-down list. For more informationon enabling signal standards, see page 3--1.
2. To set the bandwidth, tap one of the Forward , Reverse ,
or Both buttons.
Setting the Test Frequency Range by Channel
To test a specific channel within a signal standard, use the Channelbutton. When you set the test frequency range using the Channelbutton, the center of the frequency display is set to the centerfrequency of the specified channel. The test frequency range is set attwice the channel bandwidth (with a minimum test frequency rangeof 1.5 MHz). The start frequency is set one channel bandwidth belowthe channel center frequency and the stop frequency is set onechannel bandwidth above the channel center frequency.
To set the test frequency range by selecting the Channel:
1. Select the signal standard from the drop-down list.
2. Tap the Channel button . This displays the Select
Channel dialog box. See Figure 3--3.

Setting the Signal Standards and Test Frequency Range
YBA250 Antenna and Transmission Line Analyzer User Manual 3- 5
Note that both uplink and downlinkfrequencies are listed. Be sure toselect the correct link directionwhen selecting a channel
Figure 3- 3: Select Channel dialog box
3. Scroll through the list until you find the channel to test and tapthe desired channel number to select it.
Note that the list shows both the uplink and downlink frequen-cies. Be sure to tap the correct direction when selecting achannel.
4. Tap OK.
You can customize the Channel Table contents to suit your specificmeasurement needs. See Customizing the Channel Table onpage G--1 for more information.
Setting the Test Frequency Range by Start and StopFrequency
To set the test frequency range by specifying the start and stopfrequencies:
1. Tap the numeric keypad next to the Start or Stop frequency entrybox located below the menu bar (see Figure 3--2). This displaysthe Enter Frequency dialog shown in Figure 3--4.

Setting the Signal Standards and Test Frequency Range
3- 6 YBA250 Antenna and Transmission Line Analyzer User Manual
Figure 3- 4: Entering the frequency with the keypad
2. Enter the desired frequency by tapping the keypad.
You enter a frequency by tapping a number followed by amultiplier. You must include the multiplier (GHz, MHz, KHz, orHz) to complete your input.
For example, to enter a frequency of 370 MHz, tap3 7 0 MHz.
To enter a frequency of 370.330 MHz, tap 3 7 0 . 3 3 0 MHz.
To correct a mistyped number, tap the backspace button . If
you enter a number that is outside the frequency range of theYBA250, the frequency is set to the maximum or minimum,depending on the value you entered.
To set the start and stop frequencies using the knob:
1. Tap the box at the bottom of the frequency display containing theStart or Stop frequency. This assigns the knob to the selectedfrequency. The label above the knob display will change to eitherStart (MHz) or Stop (MHz) .
2. Tap the knob to change the frequency.
Tap the top half of the knob to make large changes to thespecified frequency. Tapping the knob to the right of thecircle increases the frequency. Tapping the knob to the left ofthe circle decreases the frequency.
Tapping the arrow buttons on the lower half of the knobmakes smaller changes than tapping the top half.
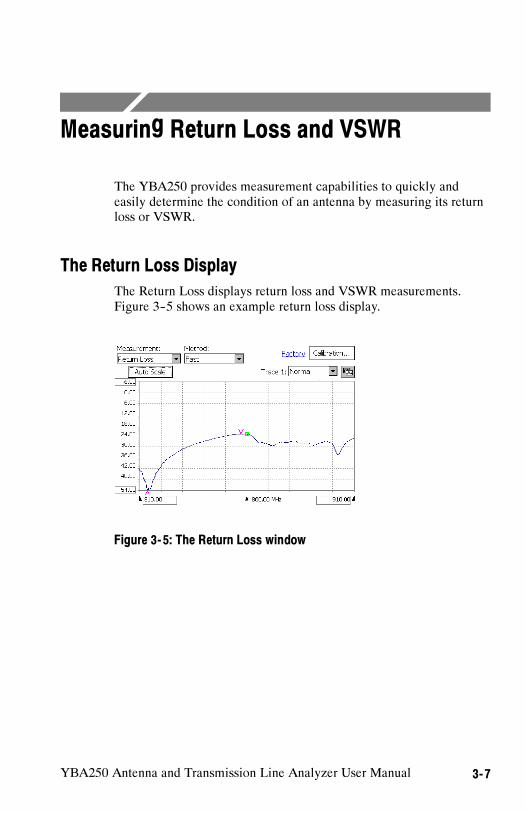
YBA250 Antenna and Transmission Line Analyzer User Manual 3- 7
Measuring Return Loss and VSWR
The YBA250 provides measurement capabilities to quickly andeasily determine the condition of an antenna by measuring its returnloss or VSWR.
The Return Loss Display
The Return Loss displays return loss and VSWR measurements.Figure 3--5 shows an example return loss display.
Figure 3- 5: The Return Loss window

Measuring Return Loss and VSWR
3- 8 YBA250 Antenna and Transmission Line Analyzer User Manual
Measuring Return Loss/VSWR
One way to measure the condition of an antenna system is tomeasure its Return Loss or VSWR. The YBA250 makes it easy tomeasure the Return Loss or VSWR of an antenna.
Return Loss is a ratio of the power sent to the antenna versus thepower reflected by the antenna. A larger Return Loss is betterbecause less power is reflected.
VSWR (Voltage Standing Wave Ratio) is a measure of the difference(ratio) of impedance between a transmission line and the attachedload. For VSWR, the lower the number, the better. The best possibleVSWR is 1.0, which means the impedance of a transmission line andits load match perfectly.
To measure Return Loss or VSWR:
NOTE. To ensure accurate measurements, calibrate the YBA250according to the procedures beginning on page 2--25. If possible, usethe Calibrate with cable procedure to achieve the best results.
1. Tap the Impedance button .
2. Select Return Loss or VSWR from the Measurement: drop--down list.
3. Connect the cable from the antenna to be tested to the YBA250Test Port connector.
4. Set the Output Power level, if needed.
5. Select the signal standard from the drop--down list located belowthe menu bar.
6. Set the start/stop frequencies using any of the following methods:
Tap the Channel button to set the frequency span to
a specific channel. The YBA250 centers the display at thecenter frequency of the selected channel and sets the span totwice the bandwidth specified by the signal standard, or1.5 MHz, whichever is greater.

Measuring Return Loss and VSWR
YBA250 Antenna and Transmission Line Analyzer User Manual 3- 9
If a Forward, Reverse, or Both button is selected, the bandinformation is taken into account when the Start and Stopfrequencies are set. After you have selected a channel, tapOK.
Enter the Start and Stop frequencies in the frequency fieldsadjacent to the Channel button by using the numeric keypadicons or the knob.
Tap either the Forward or Reverse button to
measure across just the forward or reverse bands. To measureacross both the Forward and Reverse bands, tap the Both
Both button.
7. Set the measurement mode to either Single measurement or
Continuous measurement .
NOTE. Continuous measurements consume more battery power thansingle-shot measurements. To extend battery-based operation, usesingle-shot mode whenever possible.
The YBA250 starts taking measurements. Figures 3--6 and 3--7 showexample measurements for return loss and VSWR measurements.
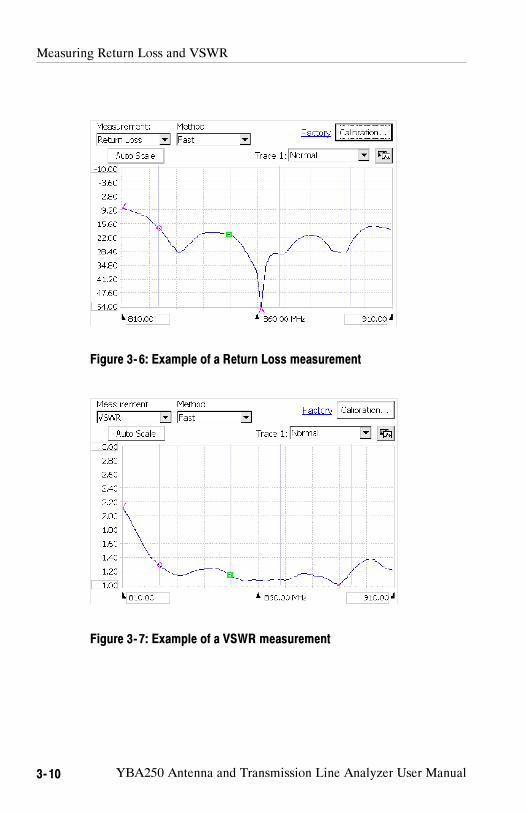
Measuring Return Loss and VSWR
3- 10 YBA250 Antenna and Transmission Line Analyzer User Manual
Figure 3- 6: Example of a Return Loss measurement
Figure 3- 7: Example of a VSWR measurement

Measuring Return Loss and VSWR
YBA250 Antenna and Transmission Line Analyzer User Manual 3- 11
Measuring Cable Loss
The YBA250 can measure the loss of a cable using a one--portmeasurement method. When measuring the loss of a cable, you mustterminate the other end of the cable with either a short or an opentermination. Cable loss measurements are not valid if the cable isconnected to a load.
To measure the loss of a cable:
1. Tap the Impedance button .
2. Select Cable Loss from the Measurement: drop--down list.
3. Connect one end of the cable to be tested to the YBA250 TestPort connector.
4. Connect either a short or an open termination to the other end ofthe cable.
5. Set the Output Power level, if needed.
6. Select the signal standard from the drop--down list located belowthe menu bar.
7. Set the start/stop frequencies using any of the following methods:
Tap the Channel button to set the frequency span to
a specific channel. The YBA250 centers the display at thecenter frequency of the selected channel and sets the span totwice the bandwidth specified by the signal standard, or1.5 MHz, whichever is greater.
If a Forward, Reverse, or Both button is selected, theassociated band information is taken into account when theStart and Stop frequencies are set. After you have selected achannel, tap OK.
Enter the Start and Stop frequencies in the frequency fieldsadjacent to the Channel button by using the numeric keypadicons or the knob.

Measuring Return Loss and VSWR
3- 12 YBA250 Antenna and Transmission Line Analyzer User Manual
Tap either the Forward or Reverse button to
measure across just the forward or reverse bands. To measureacross both the Forward and Reverse bands, tap the Both
Both button.
8. Set the measurement mode to either Single measurement or
Continuous measurement .
NOTE. Continuous measurements consume more battery power thansingle-shot measurements. To extend battery-based operation, usesingle-shot mode whenever possible.
Figure 3--8 shows an example cable loss measurement.
Figure 3- 8: Example of a cable loss measurement

YBA250 Antenna and Transmission Line Analyzer User Manual 3- 13
Measuring the Distance to a Fault
The YBA250 can measure the distance to a fault, enabling you toquickly locate faults on your antenna.
The Distance to Fault Display
The Distance to fault window shows distance to fault measurementresults. Figure 3--9 shows a typical distance to fault display.
Figure 3- 9: The Distance to Fault display

Measuring the Distance to a Fault
3- 14 YBA250 Antenna and Transmission Line Analyzer User Manual
Measuring the Distance to a Fault
WARNING. To prevent personal injury from the effects of lightning, donot connect this product to any source that might be subject to theeffects of lightning. Use your own good judgement and commonsense. You must protect yourself from the effects of lightning.
To measure the distance to a fault:
1. Following your standard practice, disconnect the antenna to betested from the transmitter.
2. Discharge the antenna line (short the center conductor to thecable ground shield).
CAUTION. Failure to discharge the antenna line can cause severedamage to the YBA250 from the static electrical charge, which maybe present on the antenna and cable.
3. Connect the cable/antenna assembly to be tested to the YBA250test port.
4. Tap the Distance button .
5. Set the Output Power level, if needed.
6. Specify the cable type to be tested:
a. Tap the Edit button .
b. Tap the Distance Options tab.
c. Select the cable type to be tested from the drop--down listnext to Type:. See Figure 3--10.

Measuring the Distance to a Fault
YBA250 Antenna and Transmission Line Analyzer User Manual 3- 15
Figure 3- 10: The Distance Options tab
NOTE. The cables listed in the Type drop-down list are defined in theCable Types list (Tools > Options > Cable Types tab).
d. The selected cable’s velocity and loss specifications areshown below the Type drop-down list. If the cable typeyou want to test is not listed, see Setting Cable Types onpage 3--19, Creating a User-Defined Cable Type onpage 3--19, and Customizing The Cable Standards Table
on page 3--10 for further information.
e. Tap OK.
7. The YBA250 begins taking distance to fault (DTF) measure-ments. Figure 3--11 shows an example DTF measurement.

Measuring the Distance to a Fault
3- 16 YBA250 Antenna and Transmission Line Analyzer User Manual
Figure 3- 11: An example of a distance to fault measurement
Changing the Vertical Scale Units
The default setting for Vertical Scale Units is dB. You can alsodisplay faults using VSWR as the vertical scale unit.
To change the vertical scale unit to VSWR, select VSWR from theMeasurement drop-down list.
Limiting the Bandwidth for a Bandpass Filter
The YBA250 automatically adjusts the frequencies it uses to makethe distance-to-fault measurement depending on the Method andCover Distance settings. If your antenna uses a bandpass filter tominimize interference from other sources, you will need to limit thebandwidth used by the YBA250 so its measurement signal can passthrough the filter.

Measuring the Distance to a Fault
YBA250 Antenna and Transmission Line Analyzer User Manual 3- 17
To set the bandwidth for the distance-to-fault measurement:
1. Tap the Edit button. This displays the Setup window.
2. Tap the Distance Options tab. See Figure 3--10.
3. Select the Limit Bandwidth option button.
4. Tap the numeric keypad next to the Limit Bandwidth box.
5. Enter the bandwidth of the filter.
6. Tap the numeric keypad next to the Center frequency box.
7. Enter the center frequency of the bandpass filter.
8. Tap OK to save your changes.
Note that values in the Values in use box will change as you changevalues for the Limit Bandwidth or the Center Frequency. Mostimportantly, by limiting the range of frequencies available for thedistance to fault measurement, the maximum distance that can bemeasured will be limited. The exact distance will depend on theLimit Bandwidth and method selected.
Setting Cable Types
It is essential to specify the cable type being tested to achieveaccurate measurements. It is impossible to determine the truedistance to a fault if the wrong cable type (propagation velocity andloss) is specified.
To select the cable types you will be testing:
1. Select Tools > Options menu item.
2. Tap the Cable Types tab to display the Cable Types window, asshown in Figure 3--12.

Measuring the Distance to a Fault
3- 18 YBA250 Antenna and Transmission Line Analyzer User Manual
Figure 3- 12: The Cable Types window
3. Select a cable type you use in your system from the Cablessupported list on the left side of the window.
4. Tap Add>> to add the selected cable to the list of enabled cables.
5. Continue to add cables to the Cables enabled list until you haveenabled all the cables which you use in your system.
6. Tap OK to close the window. The cable types you added are nowlisted in the cable Type field of the Distance Options tab.
NOTE. Double--tapping on a cable type moves the cable from one listto the other without needing to use the Add button.

Measuring the Distance to a Fault
YBA250 Antenna and Transmission Line Analyzer User Manual 3- 19
Creating a User-Defined Cable Type
If your system uses a cable type not listed in the Cable Typedrop-down list, you can define your own cable type. To create auser-defined cable type, you need to know the velocity of propaga-tion and cable loss characteristics of your cable.
To create a user-defined cable type:
1. Tap the Edit button .
2. Tap the Distance Options tab. See Figure 3--10.
3. On the Distance Options tab, select User defined from the Type:drop-down list.
4. Tap the Define... button to display the User Defined Cabledialog. See Figure 3--13.
Figure 3- 13: User Defined Cable window
5. To specify the velocity of propagation, tap the numeric keypadbutton next to the Velocity entry box. Enter a number between0.1 and 1. Tap OK when you have entered the number.
6. To specify the cable loss, first tap the numeric keypad button nextto the Loss: entry box. Enter a number between 0 and 100.Fractional values are acceptable. Tap OK when you have enteredthe number.

Measuring the Distance to a Fault
3- 20 YBA250 Antenna and Transmission Line Analyzer User Manual
7. To specify the distance at which the cable loss is specified, tapthe numeric keypad button to the right of “dB/”. Enter a numberfor the distance. Tap OK when you have entered the number.
8. Tap the drop-down list (there is only one) to specify the unitdistance, either ft (feet) or m (meters).
9. To specify the frequency at which the cable loss is specified, tapthe numeric keypad button next to MHz. Enter a numberbetween 1 and 10000. Tap OK when you have entered thenumber.
10.Tap OK when you have entered all the necessary numbers. Thesevalues are assigned to the User defined cable type in the list.
The specifications you entered for your cable type are shown belowthe Type drop-down list. These are the values that are used fordistance to fault measurements when you select User defined.
Customizing the Cable Standards Table
The Cable Standards Table is a plain text file used by the YBA250 tospecify the characteristics of the cable types that are tested. You cancustomize the Cable Standards Table to suit the specific needs ofyour system. For example, if there are cable types in your systemthat are not included in the default list of cable types, you could addthem to the cable standards table. This allows you to select yourcable types from the Type drop-down list whenever you want tomake a distance to fault measurement. You can also shorten the Typedrop-down list by deleting cables from the cable standards list if younever test those cable types.
The YBA250 looks for a file named CableStandards.txt in the\BuiltInDisk\NetTekApps\YBA250 folder when it starts up. You canedit this file to include cable types not originally included in the filefrom the factory.

Measuring the Distance to a Fault
YBA250 Antenna and Transmission Line Analyzer User Manual 3- 21
Customizing the Cable Standards Table
To customize the cable standards table:
1. Locate the existing CableStandards.txt file in either the\BuiltInDisk\NetTekApps\YBA250 folder or\NetTekApps\YBA250 folder (only if the application softwareloaded into volatile memory instead of flash memory).
2. Make a copy of the original file and store the copy in anotherlocation within the BuiltInDisk folder as a backup.
3. Use Pocket Word to edit the contents of the file to suit yoursystems settings. When saving the file, be certain to save the fileas a TEXT file (txt), not as a Pocket Word file (pwd).
When editing your CableStandards.txt file, it is more reliable to copya row and then edit the copied row to meet your requirements than tomodify an existing row.
Table 3--1 lists the elements of the CableStandards.txt file.
Table 3- 1: Channel table file contents
Column heading Description
Cable ID An identification number assigned to thecable.
Cable Name This is the name of the cable that appears inthe Type drop-down list.
Velocity The cable’s velocity of propagation.
Loss The loss of the cable per the loss distance,in dB.
Loss Distance The distance over which the cable loss isspecified.
Loss Frequency The frequency at which the cable loss isspecified.
Metric T/F Indicates whether the Loss distance ismetric on not. If True, the loss distance is inmeters.

Measuring the Distance to a Fault
3- 22 YBA250 Antenna and Transmission Line Analyzer User Manual
cable id cable name velocity loss Loss Distance Loss Frequency metric T/F
1 Air 1 0 100 1000 TRUE
2 None 1 0 100 1000 TRUE
3 RG8 0.659 0.262 1 1000 TRUE
4 RG8A 0.659 0.262 1 1000 TRUE
5 RG9 0.659 0.289 1 1000 TRUE
6 RG9A 0.659 0.289 1 1000 TRUE
7 RG17 0.659 0.18 1 1000 TRUE
8 RG17A 0.659 0.18 1 1000 TRUE
9 RG55 0.659 0.541 1 1000 TRUE
10 RG55A 0.659 0.541 1 1000 TRUE
11 RG55B 0.659 0.541 1 1000 TRUE
12 RG58 0.659 0.558 1 1000 TRUE
13 RG58B 0.659 0.558 1 1000 TRUE...
Figure 3- 14: A portion of the cablestandards text file
Improving the Display of Distance Measurements
The Distance to fault display will show a large main lobe at a faultlocation, surrounded by series of side lobes of decreasing amplitude.The YBA250 provides a choice of windowing functions that enableyou to make a tradeoff between resolution of the fault location andsuppression of waveform “noise” (side lobe magnitude).
To select a windowing function:
1. Tap the Edit button .
2. Tap the Distance Options tab. See Figure 3--10.
3. Select Rectangular or Blackman from the Windowingdrop-down list.
The Rectangular window produces a display with a narrow mainlobe and relatively higher side lobes (possibly making the mainlobe more difficult to spot), resulting in better distance resolutionbut a “noisier” waveform. The Blackman window produces adisplay with a wider main lobe and relatively smaller side lobes,which emphasizes the main lobe (making it easier to spot) butreduces distance resolution.

Measuring the Distance to a Fault
YBA250 Antenna and Transmission Line Analyzer User Manual 3- 23
Resolution of Distance to Fault Measurement
The resolution (distance between data points) shown in the Distancedisplay is based on several interacting factors. Resolution isimportant because it limits how accurately you can locate a fault.The resolution varies with the Method, the bandwidth used, and themaximum distance setting.
The maximum distance, bandwidth, and Method settings can bechanged. Normally, the only settings you need to adjust are themaximum distance and the Method. However, if your antenna has abandpass filter installed, you will need to limit the bandwidth on theYBA250 to make correct distance-to-fault measurements. Limitingthe bandwidth used by the YBA250 may limit the distance andresolution of the measurement.
To increase the resolution:
1. Tap the Edit button.
2. Tap the Distance Options tab. See Figure 3--10.
3. Tap the Cover Distance option button if it is not selected.
4. Tap the numeric keypad next to the Cover Distance box.
5. Enter the distance from the receiver to the antenna.
Review the displayed value for Resolution in the Values in use box.Note that as you shorten the Cover Distance sufficiently (withoutchanging the Method), the Resolution will improve, that is, thedistance between data points will shorten. When you change themethod to Normal or High Resolution (without changing the CoverDistance), the Approx Time will increase as will the Resolution.

Measuring the Distance to a Fault
3- 24 YBA250 Antenna and Transmission Line Analyzer User Manual

YBA250 Antenna and Transmission Line Analyzer User Manual 3- 25
Measuring Insertion Gain and Loss
The YBA250 can quickly and easily take two-port insertion gain andloss measurements. Two--port measurements, also known astransmission measurements, provide insertion gain and lossmeasurements by using two test ports; a signal source (the YBA250module) and a signal receiver (the YBT250 module). Results aredisplayed as a graph (level versus frequency) and a single numericreadout that shows the average gain or loss value over the specifiedfrequency span.
Insertion gain measures the gain (in dB) of active devices such astower-mounted amplifiers (TMA), repeaters, and boosters. Activedevices may be integrated with other components, including filters,duplexers, splitters, and combiners. You can also measure theinsertion gain of an entire RF path that includes amplifiers andpassive devices. Insertion loss measures the loss (in dB) of activedevices such as filters, duplexers, splitters, combiners, as well aspassive components such as cable.
Two--port insertion gain and loss measurements are best formeasuring signal paths that contain active, wide--dynamic--rangecomponents, such as circulators, filters, tower mounted amplifiers(TMA), and directional couplers. Two--port loss measurements aremore accurate than one--port measurements.

Measuring Insertion Gain and Loss
3- 26 YBA250 Antenna and Transmission Line Analyzer User Manual
The Insertion Gain/Loss Window
Tap the Insertion Gain/Loss button to display the Insertion
Gain/Loss window (Figure 3--15).
Figure 3- 15: The Return Gain/Loss window
Measuring Insertion Gain or Loss
Requirements:
Both a YBT250 and a YBA250 module must be installed on theNetTek Analyzer. The YBT250 should be the outermost-installedmodule.
The precision cables and attenuators used to create the Default orUser normalizations. See page 2--40 for information on creatingand using normalizations.
For testing cable insertion loss, you must have access to bothends of the cable to connect to the NetTek analyzer.

Measuring Insertion Gain and Loss
YBA250 Antenna and Transmission Line Analyzer User Manual 3- 27
To measure insertion gain or loss:
1. Connect the NetTek Analyzer to the device or system under test:
a. Using the same cable and attenuator that you used tocreate the normalization, connect the device or systemunder test signal input to the YBA250 TEST PORTconnector. Then connect the YBT250 RF INPUT to thedevice or system under test signal output connector.
b. If measuring cable loss only, use the same cable andattenuator that you used to create the normalization toconnect one end of the cable being tested to the YBA250TEST PORT connector. Then connect the other end of thecable being tested to the normalization cable/attenuatorattached to the YBT250 RF INPUT connector.
c. If measuring the gain of a tower-mounted amplifier(TMA), see Connecting to a Tower Mounted Amplifier
(TMA) on page 3--28 for information on connecting theNetTek analyzer to a TMA.
2. Tap the Insertion Gain/Loss button .
3. Select the measurement type (Insertion Loss or Insertion Gain).
4. Select the signal standard from the drop--down list located belowthe menu bar.
5. Set the start/stop frequencies using any of the following methods:
Preferred Method: Create or load a User normalization thatcontains the frequency start/stop values and output powerlevel required for the measurement. For maximum accuracy,create a User normalization on site before taking measure-ments.
Tap the Channel button to set the frequency span to
a specific channel to measure. The YBA250 centers thedisplay at the center frequency of the selected channel andsets the span to twice the bandwidth specified by the signalstandard, or 1.5 MHz, whichever is greater.
Measuring Insertion Gain and Loss
3- 28 YBA250 Antenna and Transmission Line Analyzer User Manual
If a Forward, Reverse, or Both button is selected, theassociated band information is taken into account when theStart and Stop frequencies are set. After you have selected achannel, tap OK.
Enter the Start and Stop frequencies in the frequency fieldsadjacent to the Channel button by using the numeric keypadicons or the knob.
Tap either the Forward or Reverse button to
measure across just the forward or reverse bands. To measure
across both the Forward and Reverse bands, tap the Both
button.
6. Select the signal power output level from the Power Output
Level: list.
7. Set the measurement mode to either Single measurement or
Continuous measurement .
8. If necessary, tap the Play button to start taking measurements.
NOTE. Continuous measurements consume more battery power thansingle-shot measurements. To extend battery-based operation, usesingle-shot mode whenever possible.
Connecting to a Tower Mounted Amplifier (TMA)
CAUTION. Please check your country’s laws regarding transmittersbefore using the NetTek Analyzer to transmit a test signal.
Measuring Insertion Gain and Loss
YBA250 Antenna and Transmission Line Analyzer User Manual 3- 29
To connect the NetTek Analyzer to a TMA to perform insertion gainor loss measurements, perform the following procedure:
Requirements:
A Bias Tee connector.
A Bias Tee power supply.
The same precision cables and attenuators used to create theDefault and/or User normalization.
NOTE. Bias tees designed for TMAs often contain 1/4--wave shortingstubs and gas discharge tubes for protection. These protectioncircuits can affect the accuracy of the measurement and can causepeaks and dips in the waveform. Use a wideband bias tee withoutprotection circuits (such as Tektronix part number 015-0718-00) toavoid or reduce this problem.
1. Connect the YBA250 TEST PORT to the TMA Antenna inputport, using the same cable and attenuator used to create thenormalization.
2. Connect the Bias Tee to the attenuator on the YBT250 RFINPUT. Use the same attenuator used to create the normalization.
3. Connect the Bias Tee to the BTS connector on the TMA usingthe same cable used to create the normalization.
4. Connect the Bias Tee power supply to the Bias Tee.
TMA Bias Tee Connection Notes:
Check that the bias tee power supply voltage and polarity ratingare compatible with the TMA before applying power.
Create a User normalization with the bias tee attached beforetaking measurements, unless you want to include the loss of thebias tee in the measurement.
You do not need to turn on the bias tee power supply to create theUser normalization.

Measuring Insertion Gain and Loss
3- 30 YBA250 Antenna and Transmission Line Analyzer User Manual

YBA250 Antenna and Transmission Line Analyzer User Manual 3- 31
Generating a Continuous Wave (CW) Signal
A continuous wave (CW) signal source, used in combination with atest receiver such as the Tektronix YBT250, can test a variety oftwo-port devices. The YBA250 can generate a CW signal that isadjustable across the entire YBA250 frequency band and over powerlevels from +3 dBm to --60 dBm.
To generate a CW signal:
1. Connect the cable from the device to be tested to the YBA250TEST PORT connector.
2. Tap the CW Signal Mode button . See Figure 3--16.
Figure 3- 16: Setting output power for CW signal mode

Generating a Continuous Wave (CW) Signal
3- 32 YBA250 Antenna and Transmission Line Analyzer User Manual
3. Select the signal standard from the drop-down list located belowthe menu bar.
4. Set the desired frequency using the frequency controls or theknob. A quick way to do this is to use the Channel button
to set the frequency to a channel.
5. Tap the appropriate Output Power option button to set the outputlevel.
6. Tap CW Signal On or Off to turn the signal on or off.
NOTE. The CW Signal Mode Output Power setting does not affect theOutput Power setting on the General tab of the Setup window.

YBA250 Antenna and Transmission Line Analyzer User Manual 3- 33
Working with Traces
The YBA250 enables you to control the display of traces severalways. You can set the type of trace display, whether or not a secondtrace is displayed, display saved traces and compare traces.
Setting the Trace Type
You can change how a trace is displayed to make it easier to analyze.There are five trace types you can choose from. See Table 3--2.
Table 3- 2: Trace type options
Trace type Description
Normal Each point in the trace represents a singleacquisition. Updates display with each newacquisition.
Average Each point in the trace represents an average of anumber of acquisitions. The number of acquisitionsaveraged is set on the General tab of the Setupwindow.
Min Each point in the trace represents the minimumamplitude measured at that frequency since theacquisition was started. Acquisition can be restartedby tapping the restart button. Updates displayedpoint only if new point < old point.

Working with Traces
3- 34 YBA250 Antenna and Transmission Line Analyzer User Manual
Table 3- 2: Trace type options (Cont.)
Trace type Description
Max Each point in the trace represents the maximumamplitude measured at that frequency since theacquisition was started. Acquisition can be restartedby tapping the the restart button. Updates displayedpoint only if new point > old point.
Min/Max This is a combination of Min and Max. Each point inthe trace has both a minimum and maximum valuethat correspond, respectively, to the minimum andmaximum values measured at that frequency sincethe acquisition was started. Acquisition can berestarted by tapping the restart button. Displays abar between Max and Min points.
The usual trace type is Normal. However, you can set the trace typeto any of the other four trace types.
To specify the trace type, select the desired trace type from theTrace drop-down list. See Figure 3--17.
Select Trace type from this list
Figure 3- 17: Setting the trace type
Working with Traces
YBA250 Antenna and Transmission Line Analyzer User Manual 3- 35
You can also set the trace type in the Setup window:
1. Select Setup > Edit.
2. Tap the appropriate tab to set the trace type for a particularmeasurement:
a. Tap the Frequency tab to set the trace type for ReturnLoss measurements
b. Tap the Insertion tab to set the trace type for the InsertionGain/Loss measurements.
c. Tap the Distance tab to set the trace type for Distance toFault measurements.
3. Select the desired trace type from the drop--down list.
If you select Average, you can also set the number of tracesaveraged together to create the trace display. The default numberof averages is 10. This number applies to both Trace 1 and 2.
a. To set the number of averages, tap the General tab. Thentap the keypad next to Number of Averages.
b. Enter the number of traces to average and then tap OK.
4. Tap OK to save your changes.
Changing the Units of the Distance to Fault Display
The units of distance in the Distance to Fault display can be set toeither feet or meters.
To change the distance units of the Distance to Fault display:
1. Tap the Edit button or select Setup > Edit.
2. Tap the General tab. See Figure 3--18.

Working with Traces
3- 36 YBA250 Antenna and Transmission Line Analyzer User Manual
Figure 3- 18: Setting the distance units
3. Change the distance units by tapping the appropriate DistanceUnits option button.
Saving Results
You can save a trace for later recall. For example, you can save anexample of a good trace for comparison with a live trace later.
To save a trace with an automatically generated file name, selectFile > Save Results.
Traces are saved in the \BuiltInDisk\YBA250\AppData\Resultsdirectory by default, but that can be changed for future saveoperations by selecting a different path in the Save Results Aswindow. Remember that only traces saved within the BuiltInDiskfolder (or removable storage such as a PC memory card) are storedin non-volatile memory. Traces saved outside the BuiltInDisk folderare lost when the NetTek Analyzer Platform is shutdown.

Working with Traces
YBA250 Antenna and Transmission Line Analyzer User Manual 3- 37
To save a trace with a name and location you specify:
1. Select File > Save Results As.... The Save As dialog boxappears.
2. Enter a name and location for the file and tap OK.
NOTE. Traces are saved with the settings in effect at the time thetrace is saved.
Displaying a Saved Trace
You can display a previously saved trace for review or comparisonwith another trace.
To display a saved trace:
1. Select File > Open. The Open dialog box appears.
2. Locate the saved trace, tap the name of the trace and then tapOK.
NOTE. Traces are saved with the settings in effect at the time thetrace is saved. When a saved trace is displayed, the stored settingsvalues will be shown for reference, though no actual instrument
settings will change. As soon as you press to return to making
new acquisitions, the settings will be restored to what they werebefore the saved trace was opened.

Working with Traces
3- 38 YBA250 Antenna and Transmission Line Analyzer User Manual
Comparing Traces
The YBA250 enables you to compare traces two ways. The firstallows you to compare a live trace to a reference trace. The secondway compares two saved traces.
Comparing a Live Trace to a Reference Trace
The YBA250 provides the ability for you to visually compare thecurrent live trace against a reference trace. The reference trace,called Trace 2, can be another current trace or a saved trace.
To display a second trace:
Select View >Trace 2.
or
Tap the Rotate Traces icon .
If Trace 2 is not enabled, selecting the Rotate Trace icon enables theTrace 2 display.
Defining Trace 2
Trace 2 can be a live trace (for example, an averaged display of thelatest acquisitions) or a saved trace.
To define Trace 2:
1. Select View > Define Trace 2.... The Setup window appearswhen you select the Frequency, Distance, or Insertion tab. SeeFigure 3--19.

Working with Traces
YBA250 Antenna and Transmission Line Analyzer User Manual 3- 39
Figure 3- 19: Defining Trace 2
2. By default, Trace 2 is a live trace. You can set the trace type for alive trace. Set the trace type for Trace 2 with the drop-down list.You can choose Normal, Average, Min, Max, or Min/Max.
3. To set Trace 2 to a saved trace, select Saved: from the drop-downlist. Enter the path to the saved trace in the input box, or tapBrowse. Select the desired results file from the Select SavedResult dialog box and tap OK.
4. Tap OK to save your changes and close the Setup window.
Comparing Two Results Files
The YBA250 provides the ability for you to compare two savedresults to each other. This would be useful in comparing previousantenna test results.

Working with Traces
3- 40 YBA250 Antenna and Transmission Line Analyzer User Manual
To compare two saved results:
1. Select File > Compare Saved.... The Open dialog appears. SeeFigure 3--20. For the first result selected, the dialog is labeledSelect first result file to compare.
Figure 3- 20: Selecting the first result file
There are four types of results files:
Return Loss and VSWR results files have a file extension of“a02”.
Distance to fault results files have a file extension of “a03”.
Insertion Loss results files have a file extension of “a05”.
Insertion Gain results files have a file extension of “a06”.
Note that both results file types are displayed for the first fileselection.
2. Select the first result file you wish to compare. Tap OK.
After you select the first result, the Open dialog is displayedagain for you to select the second result file. See Figure 3--21.Note the label Select second result file to compare.
Note that the only file type available to select are those thatmatch the results file you selected first. If you selected a ReturnLoss results file in the first dialog (a02 file extension), onlyReturn Loss results files are displayed for you to select as thesecond file to compare.

Working with Traces
YBA250 Antenna and Transmission Line Analyzer User Manual 3- 41
Figure 3- 21: Selecting the second result file
Once you have selected both traces, they are displayed. The twotraces are displayed in different colors so that they are easier tocompare. See Figure 3--22. You can use markers on the savedtraces to compare points on the traces.
Figure 3- 22: Two compared traces

Working with Traces
3- 42 YBA250 Antenna and Transmission Line Analyzer User Manual

YBA250 Antenna and Transmission Line Analyzer User Manual 3- 43
Using Markers and Band Edge Cursors
The YBA250 provides markers that let you easily take measure-ments on selected points of a waveform. Band Edge Cursorsgraphically identify on the display the frequency band of themeasured signal standard.
Markers
Markers are visual icons that let you measure signal values atspecific points on a waveform trace. You can use the markers tomeasure the value at a particular point on a waveform (absolute), tomeasure the difference between two markers (M1 and anothermarker), or to measure the difference between a point on a waveformand a mask (Delta Mask). Markers track the waveform levelchanges.
Up to six markers can be used with Return Loss, VSWR, andInsertion Gain/Loss measurements. Four of the markers can beplaced manually on a waveform trace. The other two markers areautomatically positioned on the maximum or minimum signal levelpoints of a waveform. If more than three markers are enabled, thescroll buttons at the right end of the marker display let you scroll upor down to show the other marker readouts.

Using Markers and Band Edge Cursors
3- 44 YBA250 Antenna and Transmission Line Analyzer User Manual
To View (Display) Markers
To enable the display of markers and marker readouts on themeasurement display, select View > Markers. Figure 3--23 showsthe Distance to Fault VSWR measurement display with markers.
Figure 3- 23: VSWR measurement with markers enabled
Each marker icon on a trace has an associated marker readoutdisplayed below the trace graph, as shown in Figure 3--24.
Marker icondisplayed on trace
Horizontal axismeasurement at marker
Marker label (M1-M4,Max, or Min)
Vertical axismeasurement at marker
Figure 3- 24: The Marker readout

Using Markers and Band Edge Cursors
YBA250 Antenna and Transmission Line Analyzer User Manual 3- 45
Marker Setup
To set up marker functions, select View > Marker Setup to displaythe Markers dialog box, shown in Figure 3--25. Table 3--3 describesthe function of each setting.
Figure 3- 25: The Markers setup dialog box
Table 3- 3: Markers dialog box settings
Setting Description
On Enables or disables the selected marker from displaying onthe measurement screen. Marker M1 is enabled by defaultwhen markers are enabled.
Absolute Enables marker readouts to display the actual measurementvalues of the signal at the marker position on the waveform.
Delta (M1) Enables the display of the difference (delta) between themeasurement values at marker M1 and the value at theselected marker (M2, M3, or M4).
Delta (Mask) Enables the display of the difference (delta) between themeasurement values at the selected marker and the value ofthe closest mask trace on the display.

Using Markers and Band Edge Cursors
3- 46 YBA250 Antenna and Transmission Line Analyzer User Manual
Table 3- 3: Markers dialog box settings (Cont.)
Setting Description
Front Places the marker on the trace that is currently in front onthe display.
Trace (1, 2) Places the marker on the selected trace regardless of whichtrace is in front on the display. Use this mode to comparemeasurements between two different waveform traces.
To Add or Move a Marker to a Waveform Trace
1. Use the Markers dialog box (see page 3--45) to enable themarkers to use on the display.
2. Tap the marker readout of the marker that you want to add ormove on the waveform trace. The marker readout border darkensto indicate that it is selected.
3. Tap the waveform where you want to add or move the marker.The marker is placed on the waveform and the readout shows themeasurement values at the specified location. Use the keypad orknob controls to fine-tune the position of the marker on thewaveform.
4. Read the measurement value in the marker readout.
To Measure Return Loss or VSWR Between Points on a Single Trace
1. Display the markers by selecting View > Markers.
2. Select View > Marker Setup (see page 3--45) to enable themarkers to measure the difference (delta) between two points onthe same signal trace. For example:
M1: Absolute, Trace 1
M2: On, Delta (M1), Trace 1
3. Tap the M1 readout.
4. Tap the display where you want to place the M1 marker. Use theknob or keypad to fine-tune the marker position if necessary.

Using Markers and Band Edge Cursors
YBA250 Antenna and Transmission Line Analyzer User Manual 3- 47
5. Tap the M2 readout.
6. Tap the display where you want to place the M2 marker. Use theknob or keypad to fine-tune the marker position if necessary.
7. Read the difference in Return Loss and VSWR between the twopoints in the M2-M1 marker display.
To Compare Values on Two Traces
1. Use the Markers dialog box (see page 3--45) to enable themarkers to measure the absolute value of two points on twosignal traces. For example:
M1: Absolute, Trace 1
M2: On, Absolute, Trace 2
2. Set the instrument to display the measurement waveform ofinterest.
3. Tap the Traces button to select Trace 1.
4. Tap the Trace 1 list button and then tap a trace type from thedrop-down list. The instrument applies the selected operation tothe input signal and displays the results as the Trace 1 waveform.
5. Place the M1 marker icon on the point of interest of the Trace 1waveform.
6. Tap the Traces button to select Trace 2.
7. Tap the Trace 2 list button and then tap a trace type from thedrop-down list. The instrument applies the selected operation tothe input signal and displays the results as the Trace 2 waveform.
8. Place the M2 marker icon on the point of interest of the Trace 2waveform.
9. Read the measurement values in the marker readouts.

Using Markers and Band Edge Cursors
3- 48 YBA250 Antenna and Transmission Line Analyzer User Manual
To Measure the Difference of Values on Two Traces
1. Use the Markers dialog box (see page 3--45) to enable themarkers to measure the difference (delta) between the M1 markerand another marker on two signal traces. All delta measurementsare referenced to the M1 marker. For example:
M1: Absolute, Trace 1
M2: On, Delta (M1), Trace 2
2. Set the instrument to display the measurement waveform ofinterest.
3. Tap the Traces button to select Trace 1.
4. Tap the Trace 1 list button and then tap a trace type from thedrop-down list. The instrument applies the selected operation tothe input signal and displays the results as the Trace 1 waveform.
5. Place the M1 marker icon on the point of interest of the Trace 1waveform.
6. Tap the Traces button to select Trace 2.
7. Tap the Trace 2 list button and then tap a trace type from thedrop-down list. The instrument applies the selected operation tothe input signal and displays the results as the Trace 2 waveform.
8. Place the M2 marker icon on the point of interest of the Trace 2waveform.
9. Read the difference in measurement values in the M2-M1 markerreadout.
Markers and Mask Testing
Markers are available when mask testing is enabled. There are twothings to note about markers when mask testing is enabled:
Markers cannot be placed on a mask.
When mask testing is enabled, the marker difference readoutdisplays the difference between the marker and the mask.

Using Markers and Band Edge Cursors
YBA250 Antenna and Transmission Line Analyzer User Manual 3- 49
Band Edge Cursors
The Band Edge cursors identify the start and stop frequencies for thetransmit and receive bands of the selected standard. See Figure 3--26.
Band Edge Cursors
Figure 3- 26: Band Edge cursor displayed
There are two parts to the cursors; the main part appears in the maintrace display and the second part appears along the top edge of thegraph. The portion in the main display can be switched off, but thepart along the top edge of the graph is always visible. SeeFigure 3--27.

Using Markers and Band Edge Cursors
3- 50 YBA250 Antenna and Transmission Line Analyzer User Manual
Band Edge Cursors
Figure 3- 27: Top edge Band Edge cursors are always visible
To turn on the display of Band Edge cursors:
Select View > Band Edge Cursor so that it is checked.
To turn off the display of Band Edge cursors:
Select View > Band Edge Cursor so that it is not checked.

YBA250 Antenna and Transmission Line Analyzer User Manual 3- 51
Mask Testing
Mask testing is used to determine if Impedance measurements(Return Loss, VSWR) or Insertion Gain/Loss measurements exceedspecified levels. The YBA250 can perform several actions when aninput signal exceeds limits defined by a mask. The default action is
to display an icon to the left of the graph (which cannot be
switched off) and sound a beep (which can be switched off). Ameasurement trace that exceeds limits can trigger additional actionssuch as pausing the display, exporting a screen and saving results toa file.
The Mask Maker Window
Masks are created with the Mask Maker utility. To display the MaskMaker dialog box, select Tools > Mask Maker. See Figure 3--28.
Figure 3- 28: The Mask Maker utility

Mask Testing
3- 52 YBA250 Antenna and Transmission Line Analyzer User Manual
Table 3- 4: Mask maker buttons and icons
Button/Icon Description
Creates a new mask.
Opens an existing mask for editing.
Saves changes to the current mask.
Save changes to the current mask with a differentname or to a different location.
Cursor arrows button. Tap to display the cursorarrows.
Cursor arrow. Tap to move the selected point in thedesired direction.
Keypad button. Tap to display the numeric keypad.
Done. Tap to exit the Mask Maker utility.
Rescale button. Tap to scale the current mask so allpoints are visible in the graph.
Delete Point. Tap to delete the selected point fromthe mask.
Delete Trace. Tap to delete the selected trace fromthe mask.
Trace Select list box. Tap to select which trace toedit.
Undo Delete. Tap to undo the last Delete Point orDelete Trace action.
Flat Trace button. Tap to add a 2-point trace to themask.
Rising Trace button. Tap to add a 4-point trace tothe mask.
Falling Trace button. Tap to add a 4-point trace tothe mask.

Mask Testing
YBA250 Antenna and Transmission Line Analyzer User Manual 3- 53
Table 3- 4: Mask maker buttons and icons (Cont.)
Button/Icon Description
Positive Pulse button. Tap to add a 6-point trace tothe mask.
Negative Trace button. Tap to add a 6-point trace tothe mask.
Using the Mask Maker
Defining Mask Frequency Range and Trace
Before creating a mask, you must define the mask start and stopfrequencies.
1. Tap the measurement button for which you want to create a mask
( Impedance or Insertion Gain/Loss ).
2. Select the measurement for which you want to create a maskfrom the Measurement drop-down list.
3. Set the frequency range of the display by selecting the signalstandard, band (Forward/Reverse/Both), selecting the channel,and/or by setting the Start and Stop frequencies.
4. If possible, use a known signal input to create a measurementtrace with the correct wave shape. You can use this as thereference trace for creating a mask.
Opening the Mask Maker
From the Tools menu, select Mask Maker to open the Mask Makerwindow. The Mask Maker trace window shows the currentmeasurement trace and one of two mask types:
If Mask testing was already defined (enabled), the selected maskis displayed in the Mask Maker window.
If Mask testing was not enabled, a new default mask (thepulse-shaped trace) is displayed.
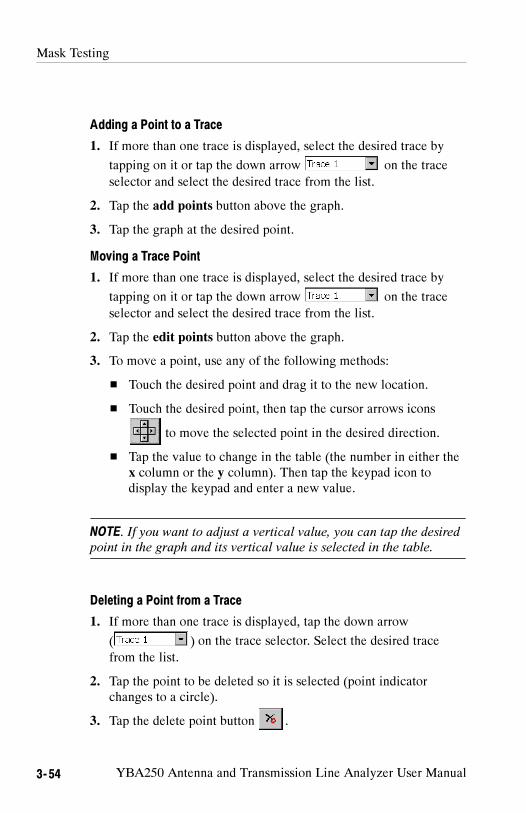
Mask Testing
3- 54 YBA250 Antenna and Transmission Line Analyzer User Manual
Adding a Point to a Trace
1. If more than one trace is displayed, select the desired trace by
tapping on it or tap the down arrow on the traceselector and select the desired trace from the list.
2. Tap the add points button above the graph.
3. Tap the graph at the desired point.
Moving a Trace Point
1. If more than one trace is displayed, select the desired trace by
tapping on it or tap the down arrow on the traceselector and select the desired trace from the list.
2. Tap the edit points button above the graph.
3. To move a point, use any of the following methods:
Touch the desired point and drag it to the new location.
Touch the desired point, then tap the cursor arrows icons
to move the selected point in the desired direction.
Tap the value to change in the table (the number in either thex column or the y column). Then tap the keypad icon todisplay the keypad and enter a new value.
NOTE. If you want to adjust a vertical value, you can tap the desiredpoint in the graph and its vertical value is selected in the table.
Deleting a Point from a Trace
1. If more than one trace is displayed, tap the down arrow
( ) on the trace selector. Select the desired tracefrom the list.
2. Tap the point to be deleted so it is selected (point indicatorchanges to a circle).
3. Tap the delete point button .

Mask Testing
YBA250 Antenna and Transmission Line Analyzer User Manual 3- 55
Adding a Trace to a Mask
To add a trace to the mask, tap one of the Add new trace buttons.A trace of the selected shape will appear on the graph.
Deleting a Trace from a Mask
1. Tap the down arrow on the trace selector.
2. Select the trace to delete from the list.
If the edit points button is selected, you can also select a trace bytouching it near one of its points.
3. Tap the delete trace button .
Setting Mask Violation Limits
1. Tap the down arrow on the trace selector.
2. Select the desired trace from the list.
3. Tap High limit to indicate a violation when a signal trace has avalue higher than the mask trace.
4. Tap Low limit to indicate a violation when a signal trace has avalue lower than the mask trace.

Mask Testing
3- 56 YBA250 Antenna and Transmission Line Analyzer User Manual
Saving a Mask
1. Tap the Save button. If this is a new mask that has not been savedbefore, the instrument opens the Save As window.
2. Enter the mask file name in the Name field.
3. Tap OK.
4. To save a mask to a different file name, tap the Save As... buttonand enter the new mask file name.
Loading a Mask
You can load a saved mask to use for mask testing or as the startingpoint for creating a new mask.
1. Tap the Open.. button to display the Open window.
2. Select the mask file to load from the displayed list.
3. Tap OK.
Mask Maker Guidelines
A mask consists of one or more traces, with each trace containingat least one point.
You can add as many points as you want to a mask trace.
You can place as many traces on a mask as you want.
The selected point on a mask trace is indicated by a circle. Otherpoints are indicated by a square.
A mask trace does not have to cover the entire test frequencyrange. Signal points at frequencies that don’t have associatedmask points are not tested for violations. This allows you tocheck only those parts of the signal that are critical to yourspecific measurement, for example the attenuation in adjacentchannels.
If you place points outside the visible area of the graph, tap the
rescale button to bring all points into view.
Mask Testing
YBA250 Antenna and Transmission Line Analyzer User Manual 3- 57
If you accidentally delete a point or a trace, you can undo the last
delete action by tapping the Undo Delete button .
Tap the numeric keypad to switch to the numeric keypad
from the cursor keys.
Tap the cursors keys button to switch to the cursor keys
from the numeric keypad.
Defining (Selecting) a Mask for Testing
Before you can perform a mask test, you must define (select) themask to be used. Defining a mask specifies the mask to used formask testing. If you have not yet created a mask, see Using the MaskMaker on page 3--53.
To define a mask:
1. Select View > Define Mask. This displays the Masks tab of theSetup window.
2. Decide which type of mask you want to use (Return Loss,VSWR, Cable Loss, Insertion Gain, or Insertion Loss) and tap theappropriate Browse button to display the Select mask file
window.
3. Select the mask you want to use for your mask test, and then tapOK.
4. Tap the Enable Mask Testing check box.
5. To have the YBA250 perform an action (in addition to displayingthe violation icon) when a mask violation occurs, tap theappropriate check box.
Tap Beep to sound an alarm when a violation occurs (this isselected by default).
Tap Pause to cause the YBA250 to pause when a violationoccurs.

Mask Testing
3- 58 YBA250 Antenna and Transmission Line Analyzer User Manual
Tap Export Screen to save the screen as a graphics file whena violation occurs.
Tap Save Results to cause the YBA250 to save the measure-ments results to a file when a violation occurs.
6. Tap OK to accept your changes.
Mask testing is enabled with the defined mask displayed.
Performing a Mask Test
To perform a mask test, Select View > Mask so that there is a checkmark next to Mask.
The defined mask is displayed. If the trace exceeds the mask, the
violation icon will appear on the left side of the spectrum
graph and the violated mask trace will change color (the specificcolor depends on the selected color scheme.
NOTE. A mask trace does not have to cover the entire test frequencyrange. Signal points at frequencies that don’t have associated maskpoints are not tested for violations. This allows you to check onlythose parts of the signal that are critical to your specific measure-ment, for example the attenuation in adjacent channels.
Mask Testing and Markers
When Mask testing is enabled, the marker difference readoutdisplays the difference between the marker and the mask. A positivevalue indicates a pass condition. A negative value indicates a failcondition. A positive value for an upper limit means the signal levelis lower than the mask level at the marker frequency. A negativevalue means the signal level is higher than the mask level, thusviolating the mask. For a lower limit mask, a positive differencemeans that the signal level is higher than the mask level and anegative difference means that the signal level is lower than themask level.

Mask Testing
YBA250 Antenna and Transmission Line Analyzer User Manual 3- 59
The YBA250 calculates the difference between the marker and themask using the preceding rule to determine the sign of the differ-ence. The YBA250 calculates the difference between the signal leveland the level of each of the traces in the mask. The YBA250 thendisplays the worst case difference between the signal level and allthe traces in the mask.
For example, suppose there are two traces in a mask: one is an upperlimit and the other is a lower limit. The upper limit mask trace levelat the marker frequency is 0 dB, the signal level is --10 dB, and thelower limit mask trace level is --30 dB. Thus, the difference betweenthe upper limit and the signal is 10 dB and the difference betweenthe signal level and the lower limit is 20 dB. The YBA250 willdisplay the M1 marker difference as 10 dB because the signal iscloser to the upper limit than it is to the lower limit.
Alternately, assume that the upper limit mask trace level is 0 dB, thesignal level is --30 dB, and the lower limit mask trace level is--25 dB. Thus, the difference between the upper limit and the signalis 30 dB and the difference between the signal level and the lowerlimit is --5 dB. The YBA250 will display the M1 marker differenceas --5 dB because the signal is closer to the lower limit than it is tothe upper limit. And because the signal is lower than the lower limit,the signal fails the mask test.
If the YBA250 displays dashes (--------) for the marker differenceinstead of a number, it means that there is no mask defined at themarker frequency.

Mask Testing
3- 60 YBA250 Antenna and Transmission Line Analyzer User Manual

YBA250 Antenna and Transmission Line Analyzer User Manual 3- 61
Saving and Recalling Results, Screens,and Setups
The YBA250 can save measurement results and screens (screencaptures) for later recall or for transfer to a PC. You can also set upthe YBA250 for specific tests and save the setup to a file for laterrecall, saving you time when making measurements in the field.
When saving files, it is important to save the files in the correctlocation. There are two types of memory in the YBA250. Volatilememory is memory that loses data when power is removed.Non-volatile memory retains data when power is removed. When theYBA250 is powered down, any data stored in volatile memory islost. Only data stored in non-volatile memory is retained when theYBA250 is powered down. On the YBA250, the BuiltInDisk folder(and associated sub-folders) is the only folder maintained innon-volatile memory.
When saving results, screens, or setups, be sure to save them to afolder located within the BuiltInDisk folder. The default folder forsaved results is \BuiltInDisk\YBA250\AppData\Results. The defaultfolder for saved screens is \BuiltInDisk\YBA250\AppData\Results.The default folder for saved setups is \BuiltInDisk\YBA250\AppDa-ta\Settings. Because these locations are all located within theBuiltInDisk directory, any data saved there is maintained after theNetTek Analyzer Platform is powered down.
Saving Measurement Results
The YBA250 enables you to save a measurement result to a file forlater recall. Saving measurement results is meant for use inreproducing a display at a later time. When results are recalled, theyappear in the display just as they did when saved. To use measure-ment data results in another program for analysis or generating areport, use the Export Results function; see page 3--64.
Saving and Recalling Results, Screens, and Setups
3- 62 YBA250 Antenna and Transmission Line Analyzer User Manual
To save measurement results:
1. Take the measurement you want to save.
2. Select File > Save Results. (Save Results appears only when theMeasure window is selected; Save Trace appears when theSpectrum and Interference windows are selected.)
3. Select the folder where you want to save the results.
4. Type a name for the file. Tap in the taskbar, to display the
soft keyboard. Tap again to hide the keyboard when you arefinished.
5. Tap OK to save the file.
What is Saved in a Measurement Results File
The following information is saved in the results file for eachincluded measurement:
Name of the measurement
Measurement results and units
Time and date of the measurement
Additional information saved in a results file includes:
Technician name
User notes
Setup information that is visible in the results display
Error information (if errors were present)

Saving and Recalling Results, Screens, and Setups
YBA250 Antenna and Transmission Line Analyzer User Manual 3- 63
Recalling Measurement Results
You can recall saved measurement results for display. When savedmeasurement results are displayed, the display appears just as it didwhen the measurement was saved except for the status area of thecontrol bar.
To recall measurement results for display:
1. Select File > Open.
2. Locate the directory that contains the measurement results file(the default is \BuiltInDisk\YBA250\AppData\Results).
3. Select the results file to recall and tap OK. The instrumentdisplays the saved results.
Saved Data icon indicates recalledresults are displayed
Date and timeresult was saved
To restart acquisition,tap the Start button
Figure 3- 29: Example of a recalled results display

Saving and Recalling Results, Screens, and Setups
3- 64 YBA250 Antenna and Transmission Line Analyzer User Manual
4. To restart measurements, tap the Play button .
When a recalled results file is displayed, the Saved Data icon isdisplayed at the top of the screen, next to the time and date the filewas saved.
Exporting Measurement Results
The YBA250 can save measurement results in a file for use in otherapplications, such as Microsoft Excel. The YBA250 exports files astab-separated or comma-separated files. Files that use tabs toseparate data fields are saved with a “txt” extension. Files that usecommas to separate data fields are saved with a “csv” extension.
To export measurement results:
1. Select File > Export Results.
2. Select a file format from the Type list.
3. Enter a name for the file.
4. Choose the location where the file should be saved.
5. Tap OK to save the file.
Figure 3--30 shows an exported results file.
Name Value Units Pass/Fail
Measurement Name Frequency
Timestamp 10/3/02 7:20:31 PM
Calibration in use Factory
Cal set name Factory cal set
Calibration timestamp 1/10/02 5:30:12 PM
Technician Trip Tucker
Note for saved results test of NX-01 primary antenna
Message
Output power High
Start Freq (Hz) 25000000
Stop Freq (Hz) 2500000000
Vert Scale Min (dB) -10
Vert Scale Max (dB) 40

Saving and Recalling Results, Screens, and Setups
YBA250 Antenna and Transmission Line Analyzer User Manual 3- 65
Trace 1 mode Normal
Trace 2 on False
Trace 2 mode Normal
Mask test enabled False
Mask Filename \BuiltInDisk\YBA250\AppData\Results\rlmask1.hdb
Mask Limit Test Pass
Measurement Return Loss
Method Fast
Trace 1 return loss data Trace 1 VSWR data
0.014 99.010
0.023 99.010
0.029 99.010...
Figure 3- 30: Sample Exported Results file
NOTE. The Technician name and User notes are entered from theSave & Export page of the Setup dialog box; see page 2--58.
Exporting a Screen
The YBA250 can export an image of the screen for use in otherprograms such as Microsoft Word. An exported screen is a graphicimage of the YBA250 display. A screen can be saved in threeformats: BMP, JPEG and PNG. An exported screen cannot bedisplayed by the YBA250, it can be viewed only by a program thatcan display graphic images.
To export a screen image:
1. Select File > Export Screen As....
2. Select the image format from the Type list.
3. Enter a name for the file.
4. Choose the location where the file should be saved.
5. Tap OK to save the file.

Saving and Recalling Results, Screens, and Setups
3- 66 YBA250 Antenna and Transmission Line Analyzer User Manual
Differences Between Exported Screens and Results
Although an exported screen and an exported results file might seemas though they are the same thing, they are significantly different.You can think of an exported screen as a photograph of the YBA250display. A saved or exported results file contains information aboutthe displayed signal. Table 3--5 shows the differences between anexported screen and a trace.
Table 3- 5: Differences between exported screens and traces
File type Menu commandRead by otherprograms File format
Exported Screen Export Screen Yes BMP, JPEGPNG
Export Screen As... Yes BMP, JPEGPNG
Saved Results Save Results No binary1
Save Results As... No binary1
Exported Results Export Results As... Yes tab or comma-separated text
1Binary files can be read only by the YBA250

Saving and Recalling Results, Screens, and Setups
YBA250 Antenna and Transmission Line Analyzer User Manual 3- 67
Exported Screen File Formats
BMP is an uncompressed format and uses a lot of space, butmaintains sharp images. JPEG is a compressed format and uses farless space than BMP, but can blur lines and text. PNG is a com-pressed format and maintains sharp lines and text. Table 3--6compares the relative features of each of the export file formats.
Table 3- 6: Comparison of file formats for exporting screens
Format Export speed File Size Quality
BMP Medium Large Very Good
JPEG Very Slow Medium Medium/Poor
PNG Fast Small Good
An exported results file contains information about the YBA250settings and data that represents the trace. Figure 3--31 shows anexample of an exported trace saved as a tab-separated text file. Thenumbers at the end (following “Trace 1 data”) represent the datapoints of the trace on the display. To save space, only a few numbersare shown in this example.
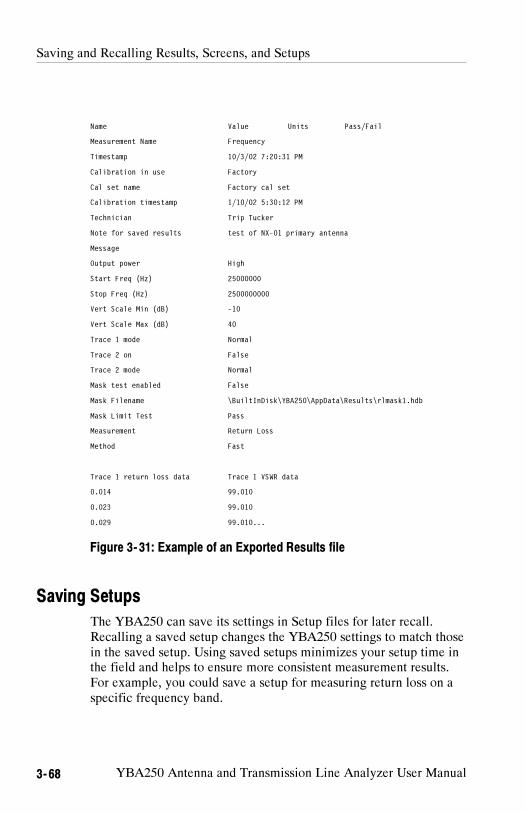
Saving and Recalling Results, Screens, and Setups
3- 68 YBA250 Antenna and Transmission Line Analyzer User Manual
Name Value Units Pass/Fail
Measurement Name Frequency
Timestamp 10/3/02 7:20:31 PM
Calibration in use Factory
Cal set name Factory cal set
Calibration timestamp 1/10/02 5:30:12 PM
Technician Trip Tucker
Note for saved results test of NX-01 primary antenna
Message
Output power High
Start Freq (Hz) 25000000
Stop Freq (Hz) 2500000000
Vert Scale Min (dB) -10
Vert Scale Max (dB) 40
Trace 1 mode Normal
Trace 2 on False
Trace 2 mode Normal
Mask test enabled False
Mask Filename \BuiltInDisk\YBA250\AppData\Results\rlmask1.hdb
Mask Limit Test Pass
Measurement Return Loss
Method Fast
Trace 1 return loss data Trace 1 VSWR data
0.014 99.010
0.023 99.010
0.029 99.010...
Figure 3- 31: Example of an Exported Results file
Saving Setups
The YBA250 can save its settings in Setup files for later recall.Recalling a saved setup changes the YBA250 settings to match thosein the saved setup. Using saved setups minimizes your setup time inthe field and helps to ensure more consistent measurement results.For example, you could save a setup for measuring return loss on aspecific frequency band.
Saving and Recalling Results, Screens, and Setups
YBA250 Antenna and Transmission Line Analyzer User Manual 3- 69
The saved setup contains the measurement settings as well as allother instrument control settings. Once the setup is saved, it can becopied to other YBA250 instruments to save setup time in the field.
To save YBA250 setups:
1. Set all the YBA250 settings the way you want them.
2. Select Setup > Save....
3. Enter a name for the file.
4. Choose the location where the file should be saved (the default is\BuiltInDisk\YBA250\AppData\Settings).
5. Tap OK to save the setup file.
Recalling Setups
Recalling a saved setup changes the YBA250 settings to match thosein the saved setup file.
To recall setups:
1. To recall a setup, select Setup > Open...
2. Locate the directory that contains the setup file (the default is\BuiltInDisk\YBA250\AppData\Settings).
3. Select the setup file to recall and tap OK.

Saving and Recalling Results, Screens, and Setups
3- 70 YBA250 Antenna and Transmission Line Analyzer User Manual
Customizing the Setup menu
The YBA250 allows you to customize the Setup menu to include alist of standard setups and to prevent accidental changes to existingsetup files.
Preventing Changes to Saved Setups
The YBA250 enables you to hide setup controls so that accidentalchanges to saved setups cannot occur.
To hide setup controls:
1. Select Tools > Options... .
2. Select the Setup Menu tab. See Figure 3--32.
Figure 3- 32: Setup menu controls
3. To prevent a user from changing saved setups, select Hide Setup
controls.
4. Tap OK to save the Setup Menu changes.

Saving and Recalling Results, Screens, and Setups
YBA250 Antenna and Transmission Line Analyzer User Manual 3- 71
When Hide Setup controls is selected, the Edit button changes to
the Open button. Tapping the Open button displays the
Open dialog box instead of the Setup window. This allows the user toselect a saved setup for recall, but not to edit any settings or save anysetups. Additionally, when Hide Setup controls is selected, theSetup > Edit and Setup > Save menu items are disabled.
Enabling Changes to Saved Setups
If setup controls have been hidden, you cannot create new setupfiles. You must show setup controls so you can create new setupfiles.
To show setup controls:
1. Select Tools > Options... .
2. Select the Setup Menu tab. See Figure 3--32.
3. Select Show Setup Controls.
Once setup controls are visible, you can create new setup files.
Specifying the List of Saved Setups
The YBA250 enables you to specify the list of saved setups thatappears in the Setup menu. You can choose to either list the 10 mostrecently used saved setups or display a custom list of setups. Acustom list of saved setups provides consistent and quick access to astandard group of setup files.
To specify the list of setups in the Setup menu:
1. Copy or move all the setup files you want to list in the Setupmenu to the \BuiltInDisk\YBA250\AppData\Settings folder. TheYBA250 will allow you to select only setups located in the\BuiltInDisk\YBA250\AppData\Settings folder for display in theSetup menu.
2. Select Tools > Options... .
3. Select the Setup Menu tab. See Figure 3--33.
4. To display the 10 most recently used saved setups in the Setupmenu, select 10 most--recently used saved Setups.

Saving and Recalling Results, Screens, and Setups
3- 72 YBA250 Antenna and Transmission Line Analyzer User Manual
Figure 3- 33: Specifying the List of Setups
5. To display only a selected list of saved setups, select CustomList.
a. Select a setup from the list on the left and tap Add>> toadd the selected setup to the Setup menu.
b. Select additional setups until you have selected all thesetups you want in the Setup menu. (You can select up to10 setups to appear in the Setup menu.)
To remove a setup from the Setup menu list, select the setupto remove from the Setup menu List window and tap<<Delete.
6. Once you have selected all the setups you want listed in the Setupmenu, tap OK.

Appendices


YBA250 Antenna and Transmission Line Analyzer User Manual A-1
Appendix A: Specifications
This section lists the electrical, environmental, and physicalspecifications of the YBA250 Antenna and Transmission LineAnalyzer. All specifications are guaranteed unless labeled “typical”.Typical specifications are provided for your convenience and are notguaranteed.
The specifications in this section apply to the YBA250 module,unless otherwise specified. For NetTek Analyzer Platform specifica-tions, please refer to the NetTek Analyzer Platform User Manual.
Table A- 1: Measurement characteristics
Frequency Characteristic Description
Frequency Range 25 MHz -- 2500 MHz
Frequency Accuracy ± 75 ppm
Accuracy specifications guaranteed after 5 minutewarm-up period.
Frequency Resolution 100 kHz
Return Loss Characteristics Description
Return Loss Measurement Return loss is defined as:
20 log ( Reflection Coefficient )
Where:
Reflection Coefficient =(Z− Z
0)
(Z+ Z0)
and:
Z is the measured impedance
Z0 is the YBA250 characteristic impedance
Return Loss Display Range 0 to 54.00 dB
Return Loss Resolution 0.01 dB

Appendix A: Specifications
A-2 YBA250 Antenna and Transmission Line Analyzer User Manual
Table A- 1: Measurement characteristics (Cont.)
Return Loss Characteristics Description
Return Loss Accuracy with
Factory Calibration
≤1 dB typical (from 0 to 40 °C up to 2 GHz, measuring a17 dB return loss).
Return Loss Accuracy withUser Calibration
< 0.05+ | 20 log ( 1 10RLREL
20) | dB
Where RLREL is defined as:
(measured return loss value -- calibration standard returnloss value)
Return loss is dependent on the quality of the calibrationstandards used. Tektronix recommends the use of theYBAC3 Calibration Kit for the most accurate results.
Voltage Standing Wave Ratio(VSWR) Characteristics Description
Voltage Standing Wave Ratio(VSWR) Measurement
VSWR is defined as:
1+| Reflection Coefficient |
1−| Reflection Coefficient |
VSWR Display Range 1.00 to 65.00
VSWR Display Resolution 0.01
Cable Insertion Loss(One Port) Characteristics Description
Cable Insertion Loss Measure-ment Method
An estimation of the cable’s insertion loss is made bymeasuring its Return Loss with the cable’s otherterminals open or shorted. The estimated CableInsertion Loss is one-half of the Return Loss at any givenfrequency.
Cable Insertion Loss Resolution 0.01 dB
Cable Insertion LossDisplay Range
0.0 to 27.00 dB

Appendix A: Specifications
YBA250 Antenna and Transmission Line Analyzer User Manual A-3
Table A- 1: Measurement characteristics (Cont.)
Distance to Fault (DTF)Characteristics Description
Distance to Fault Measurement The YBA250 displays Return Loss versus distance orVSWR versus distance.
Distance to Fault Range Coaxial lines up to 1486¯Vrel meters in length can betested. Vrel is the relative signal velocity in the coaxialline with respect to the speed of light.
Distance to Fault Resolution Incremental distances of ≤ 6.1¯Vrel centimeters at adistance of 200¯Vrel meters can be resolved.
This resolution is available only in situations where theinstrument’s entire frequency range can be used to makethe measurement. If a device with a narrow bandwidthlimits the system under test, the distance resolution islimited by physics to:
1.5 108 VREL
ΔF
whereF is the frequency range the measurements aremade over. Vrel is the relative signal velocity in thecoaxial line with respect to the speed of light.
Distance to Fault AmplitudeCorrection
The measured value of a broad band discontinuity iscorrected using information based on the knowncharacteristics of the cable being tested.
Insertion LossCharacteristics (Two-Port) Description
Measurement The dBm power measured without the device in thesignal path minus the dBm power measured with thedevice in the signal path. The Normalization measure-ment provides the power measurement without thedevice under test in the signal path.
The test signal is generated by the YBA250. The testsignal is measured by the YBT250 under control of theYBA250 application.
Frequency Range 30 to 2500 MHz
Display Range +100 dB to --100 dB

Appendix A: Specifications
A-4 YBA250 Antenna and Transmission Line Analyzer User Manual
Table A- 1: Measurement characteristics (Cont.)
Insertion LossCharacteristics (Two-Port) Description
Resolution 0.01 dB
Accuracy, Typical (Average InsertionLoss measurement)
1.0 dB for components with VSWR < 1.5:10.5 dB for components with VSWR < 1.15:1
Reflections in the signal path create standing waveswhen operating at a fixed frequency. When frequency isswept, these reflections cause ripple in the measurementwaveform.
The average loss measurement indicates the averageloss over the displayed frequency range.
Insertion GainCharacteristics (Two-Port) Description
Measurement The dBm power measured with the device in the signalpath minus the dBm power measured with the deviceremoved from the signal path. The Normalizationmeasurement provides the power measurement withoutthe device under test in the signal path.
The test signal is generated by the YBA250. The testsignal is measured by the YBT250 under control of theYBA250 application.
Frequency Range 30 to 2500 MHz
Display Range +100 dB to --100 dB
Resolution 0.01 dB
Accuracy, Typical (Average InsertionGain measurement)
1.0 dB for components with VSWR < 1.5:1
When using a bias--T with voltage above 12 Volts, avoidexceeding the voltage rating of attenuators in the signalpath. This risk is present when the bias--T is part of thenormalization signal path without the amplifier.
Reflections in the signal path create standing waveswhen operating at a fixed frequency. When frequency isswept, these reflections cause ripple in the measurementwaveform. The average insertion gain reading indicatesthe average gain over the frequency range displayed.

Appendix A: Specifications
YBA250 Antenna and Transmission Line Analyzer User Manual A-5
Table A- 2: Measurement port characteristics
Impedance Test Port Description
Connector Type-N Female.
Nominal Impedance 50 Ω
Impedance Port Match ² 9.5 dB return loss
Output signal Amplitude +3 dBm, --20 dBm
Maximum Applied Signal Ampli-tude
±+20 dBm without damage
Maximum Interfering SignalAmplitude
+11 dBm
Working Voltage 40 V (DC + peak AC)
Table A- 3: Calibration characteristics
Characteristic Description
Maximum Cable Length forCalibration
10.0 feet (3.05 meters)
Calibration Temperature Range User calibration is accurate within ± 10 C (18 F)from the temperature at which the calibration wasperformed.
Warm-up time All specifications are valid after a 5 minutewarm-up period.
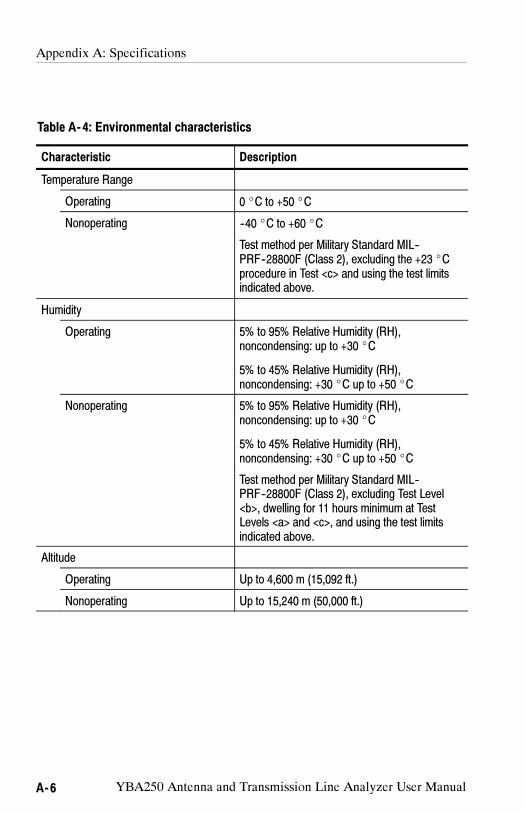
Appendix A: Specifications
A-6 YBA250 Antenna and Transmission Line Analyzer User Manual
Table A- 4: Environmental characteristics
Characteristic Description
Temperature Range
Operating 0 C to +50 C
Nonoperating --40 C to +60 C
Test method per Military Standard MIL--PRF--28800F (Class 2), excluding the +23 Cprocedure in Test <c> and using the test limitsindicated above.
Humidity
Operating 5% to 95% Relative Humidity (RH),noncondensing: up to +30 C
5% to 45% Relative Humidity (RH),noncondensing: +30 C up to +50 C
Nonoperating 5% to 95% Relative Humidity (RH),noncondensing: up to +30 C
5% to 45% Relative Humidity (RH),noncondensing: +30 C up to +50 C
Test method per Military Standard MIL--PRF--28800F (Class 2), excluding Test Level<b>, dwelling for 11 hours minimum at TestLevels <a> and <c>, and using the test limitsindicated above.
Altitude
Operating Up to 4,600 m (15,092 ft.)
Nonoperating Up to 15,240 m (50,000 ft.)

Appendix A: Specifications
YBA250 Antenna and Transmission Line Analyzer User Manual A-7
Table A- 5: Physical characteristics
Characteristic Description
Dimensions Height: 24.1 cm. (9.50 in)Width: 18.75 cm. (7.38 in)Depth: 3.18 cm. (1.25 in)
Weight ±1 kg (2.2 lbs) YBA250 module only
4.1 kg (9 lbs), NetTek Analyzer Platform only,with one battery
Table A- 6: Miscellaneous characteristics
Characteristic Description
Battery Life
One battery installed 2 hours with measurements active
4 hours in suspend mode
Two batteries installed 4 hours with measurements active
8 hours in suspend mode
Recommended Calibration Interval 1 year

Appendix A: Specifications
A-8 YBA250 Antenna and Transmission Line Analyzer User Manual
Table A- 7: Safety compliance
Category Standards or description
SafetyCompliance
ANSI/ISA 82.02.01:2004Safety Requirements for Electrical Equipment for Measurement,Control, and Laboratory Use.
CAN/CSA C22.2 No. 61010--1--04Safety Requirements for Electrical Equipment forMeasurement, Control, and Laboratory Use.
EN 61010-1Safety Requirements for Electrical Equipment forMeasurement, Control, and Laboratory Use.
IEC61010-1Safety Requirements for Electrical Equipment forMeasurement, Control, and Laboratory Use.
UL61010--1Safety Requirements for Electrical Equipment for Measurement,Control, and Laboratory Use.

Appendix A: Specifications
YBA250 Antenna and Transmission Line Analyzer User Manual A-9
Table A- 8: Electromagnetic compatibility (EMC)
Category Standards or description
EC Declaration ofConformity -- EMC
Meets intent of Directive 2004/108/EEC for ElectromagneticCompatibility. Compliance was demonstrated to the followingspecifications as listed in the Official Journal of the EuropeanCommunities:
EN 61326:1997. EMC requirements for Class A electrical equipmentfor measurement, control, and laboratory use. 1, 2,3,4
IEC 61000-4-2:1999. Electrostatic Discharge Immunity (Performancecriterion C)
IEC 61000-4-3:2002. RF electromagnetic field immunity (Performancecriterion A
IEC 61000-4-4:2004. Electrical fast transient/burst immunity(Performance criterion B)
IEC 61000-4-5:2005. Power line surge immunity (Performancecriterion B)
IEC 61000-4-6:2003. Conducted RF immunity (Performancecriterion A)
IEC 61000-4-11:2004.Voltage dips and short interruptionsimmunity, (Performance criterion B)
EN 61000-3-2:2000. AC power line harmonic emissions
EN 61000-3-3:1995 Voltage changes, fluctuations, and flicker
European Contact. For further information in Europe, contact:Tektronix UK, Ltd.Western PeninsulaWestern RoadBracknell, RG12 1RFUnited Kingdom

Appendix A: Specifications
A-10 YBA250 Antenna and Transmission Line Analyzer User Manual
Table A- 8: Electromagnetic compatibility (EMC) (cont.)
Category Standards or description
Australia/NewZealandDeclaration ofConformity -- EMC
Complies with the EMC provision of the Radiocommunications Act perthe following standard, in accordance with ACMA:
EN 61326:1997. EMC requirements for Class A electrical equipmentfor measurement, control, and laboratory use
1 This product is intended for use in nonresidtential areas only. Use in residential areas may
cause electromagnetic interference.
2 Emissions that exceed the levels required by this standard may occur when this equipment
is connected to a test object.
3 To ensure compliance with the EMC standards listed here, high quality shielded interface
cables should be used.
4 Minimum immunity test requirement.

YBA250 Antenna and Transmission Line Analyzer User Manual B-1
Appendix B: Accessories
This section lists the YBA250 Antenna and Transmission LineAnalyzer standard and optional accessories.
Standard Accessories
Table B--1 lists the accessories that come standard with yourYBA250 Antenna and Transmission Line Analyzer.
Table B- 1: Standard accessories
Quantity Part number Description
1 each 016--1868--00 Accessory Pouch
1 each 200--4728--00 Connector Dust Cover
1 each 020-2428-XX Documentation kit containing YBA250Antenna and Transmission Line AnalyzerUser manual, English, with CD-ROMcontaining software and User Manual inPDF format.
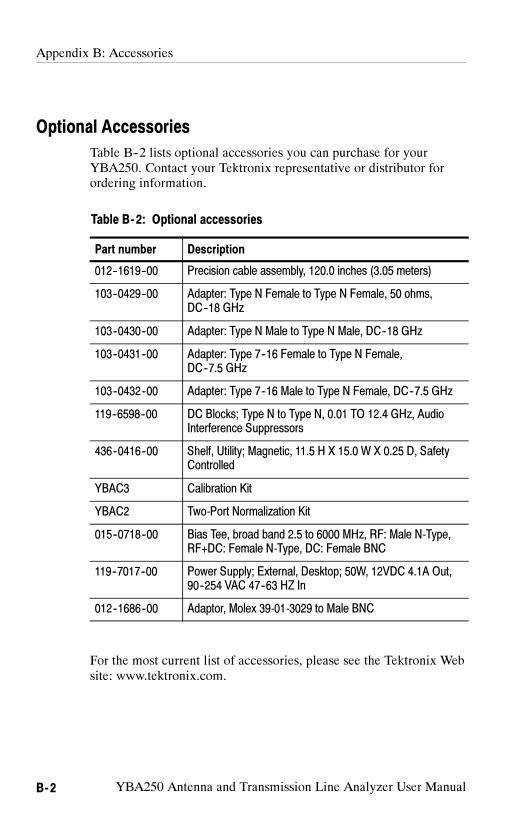
Appendix B: Accessories
B-2 YBA250 Antenna and Transmission Line Analyzer User Manual
Optional Accessories
Table B--2 lists optional accessories you can purchase for yourYBA250. Contact your Tektronix representative or distributor forordering information.
Table B- 2: Optional accessories
Part number Description
012--1619--00 Precision cable assembly, 120.0 inches (3.05 meters)
103--0429--00 Adapter: Type N Female to Type N Female, 50 ohms,DC--18 GHz
103--0430--00 Adapter: Type N Male to Type N Male, DC--18 GHz
103--0431--00 Adapter: Type 7--16 Female to Type N Female,DC--7.5 GHz
103--0432--00 Adapter: Type 7--16 Male to Type N Female, DC--7.5 GHz
119--6598--00 DC Blocks; Type N to Type N, 0.01 TO 12.4 GHz, AudioInterference Suppressors
436--0416--00 Shelf, Utility; Magnetic, 11.5 H X 15.0 W X 0.25 D, SafetyControlled
YBAC3 Calibration Kit
YBAC2 Two-Port Normalization Kit
015--0718--00 Bias Tee, broad band 2.5 to 6000 MHz, RF: Male N-Type,RF+DC: Female N-Type, DC: Female BNC
119--7017--00 Power Supply; External, Desktop; 50W, 12VDC 4.1A Out,90--254 VAC 47--63 HZ In
012--1686--00 Adaptor, Molex 39-01-3029 to Male BNC
For the most current list of accessories, please see the Tektronix Website: www.tektronix.com.

YBA250 Antenna and Transmission Line Analyzer User Manual C-1
Appendix C: Options
Table C--1 lists the configuration option available for the YBA250.
Table C- 1: Configuration option
Option Description
Option 88 Add NetTek Y400 Analyzer Platform
Appendix C: Options
C-2 YBA250 Antenna and Transmission Line Analyzer User Manual

YBA250 Antenna and Transmission Line Analyzer User Manual D-1
Appendix D: Upgrading/ReinstallingSoftware
To upgrade or reinstall software for your YBA250, you will need aWindows PC. On-screen installation instructions will guide youthrough connecting to the NetTek Analyzer Platform and upgradingor reinstalling the YBA250 software.
To upgrade or reinstall software for your YBA250:
1. Insert the YBA250 Installation SW CD-ROM (Tektronix partnumber, 063-3554-XX) into your PC and follow the on-screeninstructions that appear.
2. If no instructions appear after you insert the CD-ROM, useWindows Explorer to display the contents of the CD-ROM anddouble-click the setup.exe file to begin the installation. Followthe on-screen instructions.
3. If you received new software as part of an upgrade kit, place thelabel supplied in the kit on the bottom edge of your YBA250module.
Appendix D: Upgrading/Reinstalling Software
D-2 YBA250 Antenna and Transmission Line Analyzer User Manual

YBA250 Antenna and Transmission Line Analyzer User Manual E- 1
Appendix E: Functional VerificationProcedure
This appendix provides a functional verification procedure. Theprocedure verifies the basic functionality of the YBA250. Thefunctional verification procedure can be used for incominginspection purposes.
NOTE. The functional verification procedure in this appendix doesnot confirm that the YBA250 meets or exceeds the performancerequirements for the specifications listed in Appendix A.
There are two parts to this procedure:
Self Tests: provides instructions for performing the internaldiagnostic self-tests.
Functional Tests: provides instructions for verifyingcapabilities not completely covered by the diagnosticself-tests. Requires the use of a signal generator.
Self Tests
Equipment Required
None.
Prerequisite
None.
To run the internal diagnostics self-tests:
1. Power up the NetTek Analyzer Platform.
2. Press File > Exit to quit the YBA250 application, if it is running.
3. Press Start > Programs > Tektronix Utilities>Diagnostics in thetaskbar.

Appendix E: Functional Verification Procedure
E- 2 YBA250 Antenna and Transmission Line Analyzer User Manual
4. Tap the + box next to All Modules, All Tests to expand theselection tree.
5. Tap the check box next to Platform to deselect the platformdiagnostics.
6. Verify that Module 1: Digital and Module 1: Analog areselected. See Figure E--1.
Figure E- 1: Settings to run diagnostics
7. Select LOOP, set the loop count to 1.
8. Tap Run.
9. Verify that each test executes and passes.
NOTE. If you encounter any errors, you can tap the Failure Log tabto display more information. If the YBA250 fails any of its diagnostictests, contact your local Tektronix service representative.
10.Tap Close to exit the diagnostic system.

Appendix E: Functional Verification Procedure
YBA250 Antenna and Transmission Line Analyzer User Manual E- 3
Functional Tests
In the following test, you will perform a User calibration and thenmeasure the return loss of a 50 Ω load from a calibration kit.
Equipment Required
Calibration Kit (Tektronix YBAC3 or equivalent)
Prerequisite
None
NOTE. These procedures verify only that the YBA250 is operatingcorrectly. They do not verify that the YBA250 meets warrantedspecifications.
To perform the functional test:
1. Power up the NetTek Analyzer Platform.
2. If necessary, launch the YBA250 application by double-tappingthe YBA250 icon on the desktop or selecting Start >
Programs > NetTek > YBA250 from the Taskbar.
3. Select Return Loss from the Measurement drop-down list.
4. Tap the Continuous mode button .
5. Allow the NetTek Analyzer Platform to run for five to tenminutes to warm up.
6. In the main display, tap the Calibration... button .
This displays the Calibration window. See Figure E--2.

Appendix E: Functional Verification Procedure
E- 4 YBA250 Antenna and Transmission Line Analyzer User Manual
Figure E- 2: Calibration window prior to calibration
7. Tap the Calibrate at Test Port... button . This
displays the Calibration at Test Port window. See Figure E--3.
Figure E- 3: Ready to perform calibration

Appendix E: Functional Verification Procedure
YBA250 Antenna and Transmission Line Analyzer User Manual E- 5
8. Carefully attach the OPEN calibration standard to the Test Portconnector using the procedure described on page 2--20.
9. Tap the Open button in the Calibration at Test Port window.When the calibration is completed, Done appears above the Openbutton.
10.Remove the OPEN calibration standard from the Test Portconnector.
11. Carefully attach the SHORT calibration standard to the Test Portconnector.
12.Tap the Short button in the New Calibration window. When thecalibration is completed, Done appears above the Short button.
13.Remove the SHORT calibration standard from the Test Portconnector.
14.Carefully attach the LOAD calibration standard to the Test Portconnector.
15.Tap the Load button. When the calibration is completed, Doneappears above the Load button.
16.Carefully remove the LOAD calibration standard from the TestPort connector.
17.Once calibration has been completed for all three standards, tapthe OK button. The OK button is not selectable until all threecalibration standards have been marked as done. See Figure E--4.

Appendix E: Functional Verification Procedure
E- 6 YBA250 Antenna and Transmission Line Analyzer User Manual
Figure E- 4: Calibration window after calibration is done
18.Tap OK to accept the new calibration.
19.Attach the 50 Ω load from the calibration kit to the TEST PORT
connector.
20.Tap the Impedance button to measure return loss.
21. If necessary, tap the Start frequency label and set the startfrequency to 25 MHz.
22. If necessary, tap the Stop frequency label and set the stopfrequency to 2500 MHz.
23. If necessary, select View > Markers to display the markerreadout.
24.Verify that the Min marker readout is greater than 45 dB.
This completes the Incoming Inspection procedure. If your YBA250completed the procedure with errors, contact your local Tektronixservice representative.

YBA250 Antenna and Transmission Line Analyzer User Manual F- 1
Appendix F: Supported Signal Standards
This appendix lists the signal standards on which measurements canbe made by the YBA250.
Table F- 1: Cellular standards supported
Standard Channel numbers
US CDMA-Cellular 1--799
TIA/EIA-95 990--1023
TIA/EIA-97C
US CDMA-PCS 1--1199
TIA/EIA-95
TIA/EIA-97C
CDMA Korea-PCS 1--598
CDMA Japan/ARIB 1--799
801--1039
1041--1199
CDMA China-1 0--1000
1329--2047
CDMA China-2 0--1000
1329--2047
CDMA2000 Class 0, Korea Cellular 1--799
990--1023
CDMA2000 Class 0, N. A. Cellular 1--799
990--1023
CDMA2000 Class 1, N. A. PCS 0--1199

Appendix F: Supported Signal Standards
F- 2 YBA250 Antenna and Transmission Line Analyzer User Manual
Table F- 1: Cellular standards supported (Cont.)
Standard Channel numbers
CDMA2000 Class 2 (TACS Band) 0--1000
1329--2047
CDMA2000 Class 3 (JTACS Band) 1--799( )
801--1039
1041--1199
1201--1600
CDMA2000 Class 4, Korea PCS 0--599
CDMA2000 Class 5, (NMT-450W25 kH )
1--300(25 kHz)
539--871
CDMA2000 Class 5, (NMT-450N20 kH )
1039--1473(20 kHz)
1792--2016
CDMA2000 Class 6, IMT-2000 0--1199
CDMA2000 Class 7, N. A. 700 MHzCell Band
0--359
CDMA2000 Class 8, GSM Band 0--1499
CDMA2000 Class 9, GSM Band 0--699
CDMA2000 Class 10, SMR 800 Band 0--719
720--919
W-CDMA (UMTS) 9612--9888
10562--10838
W-CDMA (NA--PCS) 9262--9538( )
9662--9938
W-CDMA (NA--Addl. PCS) 12--287( )
412--687

Appendix F: Supported Signal Standards
YBA250 Antenna and Transmission Line Analyzer User Manual F- 3
Table F- 1: Cellular standards supported (Cont.)
Standard Channel numbers
W-CDMA (DCS1800) 8562--8913( )
9037--9388
NADC IS-136 Cellular 1--799
990--1023
NADC--PCS / IS-136 1--1999
SMR 800 -- 25kHz 1--600
SMR 800 -- 12.5kHz 1--1199
SMR 1500 1--479
GSM 450 259--293
GSM 480 306--340
GSM 850 128--251
GSM--E 900 0--124
975--1023
GSM--P 900 1--124
GSM--R 900 0--124
955--1023
GSM 1800 512--885
GSM 1900 512--810
PDC1500 (JDC) 0--960
PHS 1--77
AMPS / EIA 553 1--799
990--1023
N-AMPS / IS-88 1--799 (NM,NL, and NU)
990--1023 (NM,NL, and NU)
TACS 1--1000

Appendix F: Supported Signal Standards
F- 4 YBA250 Antenna and Transmission Line Analyzer User Manual
Table F- 1: Cellular standards supported (Cont.)
Standard Channel numbers
ETACS 0--1000
1329--2047
NTACS 1--799
800--1039
1040--1199
JTACS 0--798 (even chan. only)
800--1038 (even chan. only)
1040--1198 (even chan. only)
PDC 800 Analog 0--1680
NMT-411-25 kHz 539--871
NMT-450-25 kHz 1--300
NMT-450-20 kHz 1039--1473
NMT-470-20 kHz 1792--2016
NMT-900 1--1000
NMT-900 (offset) 1025--2023
MATS-E 1--1000
C-450 (SA) 1--247
C-450 (P) 1--887
1xEVDO-10 SMR 800 Band 0--919
CDMA2000 1xEVDO Class 0 NAC ll l
1--799Cellular
990--1023
CDMA2000 1xEVDO Class 0 Korea 1--799
990--1023
CDMA2000 1xEVDO Class 1 N.A.PCS
0--1199

Appendix F: Supported Signal Standards
YBA250 Antenna and Transmission Line Analyzer User Manual F- 5
Table F- 1: Cellular standards supported (Cont.)
Standard Channel numbers
CDMA2000 1xEVDO Class 2 TACSB d
0--1000Band
1329--2047
CDMA2000 1xEVDO Class 3 JTACSB d
1--799Band
801--1039
1041--1199
1201--1600
CDMA2000 1xEVDO Class 4 KoreaPCS
0--599
CDMA2000 1xEVDO Class 5NMT 25k 450
1--300NMT--25k--450
539--871
CDMA2000 1xEVDO Class 5NMT 20k 450
1039--1473NMT--20k--450
1792--2016
CDMA2000 1xEVDO Class 6IMT--2000
0--1199
CDMA2000 1xEVDO Class 7 N.A.700 MHz Cellular
0--359
CDMA2000 1xEVDO Class 8 GSMBand
0--1499
CDMA2000 1xEVDO Class 9 GSMBand
0--699
CDMA2000 1xEVDO Class 10 SMR800 B d
0--719800 Band
720--919
TD-SCDMA (A Band) 9504-10121
TD-SCDMA (B Band) 9254-9946
TD-SCDMA (C Band) 9554-9646
iDEN_1 800 MHz (Standard) 1-4AF (1-1199)
iDEN_2 800 MHz (Extended) 1-5EF (1-1519)

Appendix F: Supported Signal Standards
F- 6 YBA250 Antenna and Transmission Line Analyzer User Manual
Table F- 1: Cellular standards supported (Cont.)
Standard Channel numbers
iDEN_4 900 MHz 1-18E (1-398)
iDEN_5 1.5 GHz 1-1DF (1-479)

YBA250 Antenna and Transmission Line Analyzer User Manual G-1
Appendix G: Customizing the ChannelTable
This appendix describes how to modify the Channel Table to meetyour testing needs.
Customizing the Channel Table
The Channel Table is a file used by the YBA250 to specify thecharacteristics of the channels assigned to a signal standard. You cancustomize the Channel Table to suit the specific needs of yoursystem. For example, if you have set the bandwidth of your channelsto be wider than the standard bandwidth, you can specify the widerbandwidth in a customized Channel Table. If your system’s channelbandwidth is non-standard and the YBA250 is using the standardChannel Table, the test frequency range based on the standardchannel bandwidth will not be accurate for your system.
The YBA250 looks for a file named UserStandards.txt in the\BuiltInDisk folder when it starts up. If it does not find the file, theYBT250 then looks for the standard channel table file, SignalStan-dards.txt, in the NetTekApps\YBA250 folder. If that file is not found,a dialog box will be displayed informing you that no standards filewas found, so a new channel table will be generated using internaldefault values.
Creating a Custom Channel Table
To create a custom channel table:
1. Locate the existing SignalStandards.txt file in either the\BuiltInDisk\NetTekApps\YBA250 folder or\NetTekApps\YBA250 folder (only if the application softwareloaded into volatile memory instead of flash memory).
2. Copy the SignalStandards.txt file to the \BuiltInDisk folder.
The YBA250 will look only in the \BuiltInDisk folder for acustom channel table.

Appendix G: Customizing the Channel Table
G-2 YBA250 Antenna and Transmission Line Analyzer User Manual
3. Rename SignalStandards.txt to UserStandards.txt.
4. Edit the contents of the file to suit your systems settings.
When editing your UserStandards.txt file, it is safer to copy a rowand then edit the copied row to meet your requirements than tomodify an existing row.
Table G--1 lists the elements of the Channel Table file.
Table G- 1: Channel table file contents
Column heading Description
Standard Text Name The text string used to identify the standard. This nameis what appears in the Signal Standard list.
Each line in the channel table should describe a singlegroup of channels for a standard. If a standard is madeup of multiple groups or blocks of channels then youshould make an entry for each group. When multiplegroups are required, they should be ordered in channelnumber sequence and contiguous. To tie the groupstogether, the Unique Standard ID must be the same foreach group.
Forward Base Frequency Forward base frequency for each signal standard. Theactual frequency for each channel is calculated.
For signal standards that specify a single frequency foreach channel (for example, the UTRA/FDD schemeused by WCDM(UMTS)), each row in the file willdescribe a group of forward or reverse channels. Therow that describes forward channels should specify zerofor the reverse base frequency.
Reverse Base Frequency Reverse base frequency for each signal standard. Theactual frequency for each channel is calculated.
For signal standards that specify a single frequency foreach channel (for example, the UTRA/FDD schemeused by WCDM(UMTS)), each row in the file willdescribe a group of forward or reverse channels. Therow that describes reverse channels should specify zerofor the forward base frequency.

Appendix G: Customizing the Channel Table
YBA250 Antenna and Transmission Line Analyzer User Manual G-3
Table G- 1: Channel table file contents (Cont.)
Column heading Description
Signal Bandwidth The signal bandwidth. If the signal to be measured is100 kHz wide but the channels are spaced 200 kHzapart then this field should contain 100000.
Starting Channel Number The starting channel number for a block of channels.
Ending Channel Number The ending channel number for a block of channels.
Channel Increment Amount If the channels increment by 1, then a 1 goes in here. Ifby 2, then a 2 goes in here. If by 5...
Channel Spacing Sets the spacing between channels. For instance, if youhave a standard that has signals that are 100 kHz widebut the channels in you system are spaced 200 kHzapart, then this field should contain 200000.
Channel Offset Offset applied to channel number before calculating thechannel frequency from the channel number.
Unique Standard ID Must be between 0 and 400. It is used to tie multipleblocks of channels together into a single standard. Ablock of channels is a single row in the channel tablefile.
Signal Type 1 = CDMAOne2 = AMPS3 = TDMA IS1364 = GSM/EDGE5 = W-CDMA (UMTS)6 = CDMA 200010 = 1xEVD011 = TD--SCDMA12 = iDEN998 = NO_MEAS_ANALOG999 = NO_MEAS_DIGITAL
Forward / Reversefrequency separation
For signal standards that specify a single frequency foreach channel (for example, the UTRA/FDD schemeused by WCDM(UMTS)), this entry specifies thedifference in frequency between a forward channel andits corresponding reverse channel. For signal standardsthat specify forward and reverse frequencies for eachchannel (most standards), this entry is left blank.

Appendix G: Customizing the Channel Table
G-4 YBA250 Antenna and Transmission Line Analyzer User Manual
How Channel Frequencies are Calculated
The frequency for a specific channel is calculated with a formulabased on the current channel number, the base frequency, the channelspacing and the channel offset:
If (Channel Offset ≥ 0)
Chan Freq = ( (Chan Num -- Channel Offset)× Channel Spacing) + Base Frequency
If (Channel Offset < 0)
Chan Freq= Base Frequency -- ( ( --Channel Offset -- Chan Num)× Channel Spacing)
Where:
Base Frequency: Either forward or reverse base frequency dependingon current user selection, from the Channel Table file (UserStan-dards.txt when present or SignalStandards.txt).
Chan Num: The current user selected channel number.
Chan Freq: The frequency associated with the Chan Num.
Channel Spacing: The distance between channels, from the ChannelTable file.
Channel Offset: From the Channel Table file.

Glossary


YBA250 Antenna and Transmission Line Analyzer User Manual Glossary- 1
Glossary
BMP -- Graphics File Format. BMP is one of the file formats availablefor saving screen captures. BMP is the standard Windows graphicimage format. The filename extension is “bmp”.
BTS.Acronym for Base Transceiver Station.
Cable Loss.As a signal travels down a cable, some of its energy islost due to losses in the conductors and dielectrics. This reduction insignal level is called cable loss. Cable loss is specified in decibelsper distance at a specified frequency. For example, the cable loss forRG58 cable is 0.558 dB/1 m @ 1,000 MHz.
Flash Memory. Flash memory is a form of non--volatile memory. Whenthe YBT250 software is stored in flash memory, the YBT250 loadsmore quickly at power on.
Forward Frequency. The frequency the base station uses to transmit tothe mobile unit. Also called Downlink Frequency.
JPEG -- Graphics File Format. JPEG, an acronym for Joint PhotographicExperts Group, is one of the file formats available for saving screencaptures. Files saved in JPEG format can be much smaller in sizethan files saved in BMP format. The filename extension is “jpg”.
One-Port Measurement.One-port measurements, also known asreflection measurements, use a single port on the YBA250 module tomeasure return loss, VSWR, cable loss, and distance to fault (DTF).One-port measurements connect one end of a signal path or device tothe YBA250 module, with the other end of the signal path connectedto the device under test (such as an antenna).
PNG -- Graphics File Format. PNG, an acronym for Portable NetworkGraphics, is one of the file formats available for saving screencaptures. PNG is a new format developed primarily for use on theWorld Wide Web. PNG files are usually much smaller than BMPfiles. The filename extension is “png”.
Reference Level. The power level at the top of the display.

Glossary
Glossary- 2 YBA250 Antenna and Transmission Line Analyzer User Manual
Return Loss. Return Loss is a ratio of the power sent to the antennaversus the power reflected by the antenna. A larger Return Loss isbetter because less power is reflected.
Reverse Frequency. The frequency the mobile unit uses to transmit tothe base station. Also called uplink frequency, reverse channel oruplink channel.
Span. The frequency range covered by the display graph.
TMA.Acronym for Tower-Mounted Amplifier.
Two-Port Measurement. Two-port measurements, also known astransmission measurements, provide insertion gain and lossmeasurements such as filter response (loss) versus frequency andtower-mounted amplifier (TMA) gain versus frequency. Both aYBA250 and YBT250 module must be installed on the NetTekAnalyzer to perform two-port Insertion Gain/Loss measurements.The YBA250 module injects a signal into the device or system undertest, and the YBT250 module receives and measures the resultantsignal.
Velocity of Propagation. The Velocity of Propagation is the velocity atwhich a signal travels through the cable. Velocity of propagation isexpressed as a fraction of the speed of light. A Velocity of Propaga-tion equal to 1 means that the signal is traveling down the cable atthe speed of light. A Velocity of Propagation equal to 0.5 means thatthe signal is traveling down the cable at half the speed of light.
VSWR.VSWR (Voltage Standing Wave Ratio) is a measure of theratio of the maximum resultant voltage to the minimum resultantvoltage along a transmission line. It represents the amount ofimpedance mismatch between the transmission line and the load. ForVSWR, the lower the number, the better. The best possible VSWR is1.0, which means the impedance of a transmission line and its loadmatch perfectly.

Index


YBA250 Antenna and Transmission Line Analyzer User Manual Index- 1
Index
A
a02 and a03 file extensions, 3--40Absolute (marker settings), 3--45Add a marker to waveform, 3--46attaching precision connectors and
cables, 2--20Average, trace type, 3--33
B
Band Edge Cursor, 3--49View menu, 2--15
BATTERIES indicator, 1--2battery, installing, 1--7battery life, A--7bias teeconnection notes, 3--29connector and power supply,
3--29BMP, Glossary--1BTS, Glossary--1button, rotate traces, 3--38buttonsChan, 3--4command bar area, 2--8help, 2--4program, 2--2shared control area, 2--10tuning control area, 2--9, 2--12
C
cable loss, 3--11, Glossary--1cable standards table, customizing,
3--20cable type, user defined, 3--19
Cable Types tab, 3--17calibration, 2--25calibration guidelines, 2--38calibration interval, A--7cellular standards supported, F--1Center frequency setting, 3--16Chan button, 3--4changing vertical scale units, 3--16channel table, G--1customizing, G--1
Compare Save... command, Filemenu, 2--13
Compare Saved command, 3--39comparing traces, 3--38connecting to an antenna, 2--21connecting to TMA, 3--28connector, input, 1--3Continuous button, 2--8controls, front panel, 1--1Coordinates, saving GPS data,
2--61Cover Distance setting, 3--23creating a default normalization,
2--44creating a user normalization, 2--45customizing the cable standards
table, 3--20CW signal mode, 3--31CW Signal Mode button, 2--11
D
DC power adapter, 1--6Default (normalization), 2--43default normalization, creating,
2--44Define Mask, View Menu, 2--14
Index
Index- 2 YBA250 Antenna and Transmission Line Analyzer User Manual
Define Trace 2, View Menu, 2--14Define Trace 2 tab, 3--38Delta M1 (marker settings), 3--45Delta Mask (marker settings), 3--45Delta of two traces (markers), 3--48Desktopicons, 2--3overview, 2--1status area, 2--2
desktopicon, 2--2program button, 2--2Start menu, 2--2taskbar, 2--2
desktop AC power supply, 1--6dimensions, external, A--7display, preferences, 2--57displaying, saved traces, 3--37Distance button, 2--10distance to a fault, 3--13distance units, setting, 3--35
E
Edit command, Setup menu, 2--15enabling signal standards, 2--53,
3--1Exit command, File menu, 2--14Export Results command, File
menu, 2--13Export Screen As command, File
menu, 2--14Export Screen command, File
menu, 2--13exportingresults, 3--64screens, 3--65
external power supplies, 1--6
F
Factory calibration status, 2--28Factory Reset command, Tools
menu, 2--16file extensions, results files, 3--40File menu, 2--13file options, setting, 2--58file prefix, setting, 2--59filename length, 2--60find information, start Help, 2--4flash memory, Glossary--1floppy disk button, 2--8Folder icon, 2--8forward frequency, Glossary--1Frequency button, 2--10Front (marker settings), 3--45front--panel controls, 1--1functional verification, E--1
G
GPS receiver set up, 2--61guidelinescalibration, 2--38normalization, 2--50
H
Hardware Info command, Toolsmenu, 2--16
Helpfind information, 2--4icon, 2--4
help icon, 2--9hide program, 2--2

Index
YBA250 Antenna and Transmission Line Analyzer User Manual Index- 3
I
Icon, status, 2--3icons?, 2--4command bar area, 2--8desktop, 2--2, 2--3shared control area, 2--10tuning control area, 2--9, 2--12
in--vehicle DC adapter, 1--6incoming inspection, E--1information, getting help, 2--4input connector, 1--3, 2--21Input panel, enter keyboard charac-
ters, 2--17insertion gain, 3--26insertion gain or loss, measuring,
3--27Insertion Gain/Loss button, 2--10insertion loss, 3--26Installingshoulder strap, 1--17strand hook, 1--17
installing, YBA250 module, 1--4
J
JPG, Glossary--1
K
Keyboard, (soft) input panel, 2--17Keyboard command, Tools menu,
2--15keypad button, 2--11knob, 2--11
L
length of filename, 2--60Limit Bandwidth setting, 3--16loading a user normalization, 2--48Location data, saving GPS coordi-
nates, 2--61Lock-up, recovering from, 1--2
M
Marker Setup, View menu, 2--15Markersabsolute, 3--45add a marker to waveform, 3--46Delta M1, 3--45Delta Mask , 3--45Front , 3--45mask testing, 3--48measure between two points,
3--46measure delta of two traces, 3--48measure on two traces, 3--47settings, 3--45Trace (1,2), 3--45View menu, 2--15viewing, 2--15
Mask, View Menu, 2--14Mask Maker... command, Tools
menu, 2--15Mask testing and markers, 3--48Max trace type, 3--34Measure between two points
(markers), 3--46Measure on two traces (markers),
3--47measurement overview, 2--23measurementscable loss, 3--11distance to fault, 3--13insertion gain, 3--26
Index
Index- 4 YBA250 Antenna and Transmission Line Analyzer User Manual
insertion loss, 3--26return loss, 3--8VSWR, 3--8
measuring insertion gain or loss,3--27
MenusFile, 2--13Help, 2--4Setup, 2--15Start, 2--2Tools, 2--15View, 2--14
Method setting, 2--56Min trace type, 3--33Min/Max trace type, 3--34
N
Normal, trace type, 3--33normalizationcreating a default normalization,
2--44creating a user normalization,
2--45default, 2--40dialog elements, 2--40dialog status labels, 2--42displaying normalization dialog,
2--40guidelines, 2--50loading a user normalization,
2--48overview, 2--40saving a user normalization, 2--46type status labels, 2--43Default, 2--43UnNormalized, 2--44User, 2--43User?, 2--43
user, 2--40Not Valid (normalization), 2--42
notes, entering, 2--60numeric keypad button, 2--11
O
On (marker settings), 3--45On--Off button, 1--2one--port measurement, 2--23,
Glossary--1Open button, 2--8Open commandFile menu, 2--13Setup menu, 2--15
Options, C--1Options command, Tools menu,
2--15output power, setting, 2--54
P
Pause button, 2--8PNG, Glossary--1power supplies, external, 1--6power switch, 1--2, 1--14precision connectors and cables,
2--19Preferences tab, 2--57Print command, File menu, 2--14program button, 2--2
Q
question mark icon, 2--9
R
recalling results, 3--63recalling setups, 3--69reference level, Glossary--1

Index
YBA250 Antenna and Transmission Line Analyzer User Manual Index- 5
removing precision connectors andcables, 2--20
Resethardware, 1--2software, 1--13
reset switch, 1--2Restart button, 2--8resultsexporting, 3--64recalling, 3--63saving, 3--61
Results Properties command, Filemenu, 2--14
return loss, 3--8, Glossary--2reverse frequency, Glossary--2Rotate Trace Order, View menu,
2--14rotate traces button, 3--38Running indicator, 2--8
S
Save & Export tab, 2--59Save command, Setup menu, 2--15Save Results command, File menu,
2--13Save Results As command, File
menu, 2--13Save Results As command, File
Menu, 3--36save results button, 2--8Save Results command, File menu,
3--36saved trace, displaying, 3--37Saving, GPS coordinates, 2--61saving a user normalization, 2--46saving results, 3--61screensexporting, 3--65file formats, 3--67
settingdisplay colors, 2--57distance units, 3--35file options, 2--58file prefix, 2--59note text, 2--60startup application, 2--6technician name, 2--60trace type, 3--33
setting cable types, 3--17Setup Menu, customizing, 3--70Setup menu, 2--15setupsrecalling, 3--69saving, 3--68
Shoulder strap, 1--17signal standardsenabling, 2--53, 3--1supported, F--1
Single measurement button, 2--8Smoothing, View Menu, 2--14smoothing, 2--58Software, load process, 1--11softwarereinstalling, D--1upgrading, D--1
Software Info, Tools menu, 2--16software version, xviiispan, Glossary--2specifications, A--1Start, menu, 2--2Start and Stop frequency, setting,
3--5startup application, setting, 2--6Statusarea, desktop, 2--2icons, 2--3
STATUS indicator, 1--2Status indicator, 1--2Stop icon, 2--8

Index
Index- 6 YBA250 Antenna and Transmission Line Analyzer User Manual
Strand hook, 1--17suspend mode, 1--12
T
taskbar, desktop, 2--2technician name, setting, 2--60test frequency range, 3--3tilt stand, 1--15timestamp readout, 2--9TMA, Glossary--2Tools menu, 2--15touch--screen calibration, 1--11Touchscreen Calibration command,
Tools menu, 2--15tower mounted amplifier (TMA),
3--28Trace 1,2 (marker settings), 3--45Trace 2, View Menu, 2--14trace display options, 3--39Trace2, 3--38Troubleshooting, GPS receiver,
2--62two--port measurement, 2--23,
Glossary--2
U
UnNormalized (normalization),2--44
Unusable (normalization), 2--42Upgrade Software command, Tools
menu, 2--16User (normalization), 2--43User Cal? calibration status, 2--28User calibration status, 2--28user normalizationcreating, 2--45loading, 2--48saving, 2--46
User? (normalization), 2--43user--defined cable type, 3--19
V
Valid (normalization), 2--42velocity of propagation, Glossa-
ry--2View menu, 2--14VSWR, 3--8, Glossary--2
W
weight, A--7Windowing setting, 3--22