Embed Size (px)
Citation preview
New Network AnalyzerMethodologies inAntenna/RCSMeasurements
White Paper
2
ABSTRACT
This paper is designed to illustrate the technical advances in network analyzersand how they can be effectively utilized in an RCS test range. The Hewlett-Packard 8530A [1 - 4] has been utilized in antenna test ranges since the1980’s and will be used as a reference comparison. Advances in network analyzer hardware and software provide increased functionality, speed andaccuracy for RCS measurements. A typical RCS full polarization matrix imaging measurement will be used to illustrate these advances in technology.Range gating, digital and down-range resolution and alias-free range topicswill be discussed illustrating the technical advances that can be utilized in anRCS test range. Flexibility of network analyzer hardware will also illustratethe effectiveness of reducing measurement hardware complexity resulting inan increase in measurement speed and accuracy.
1.0 RCS Full Polarization Matrix Imaging Measurement
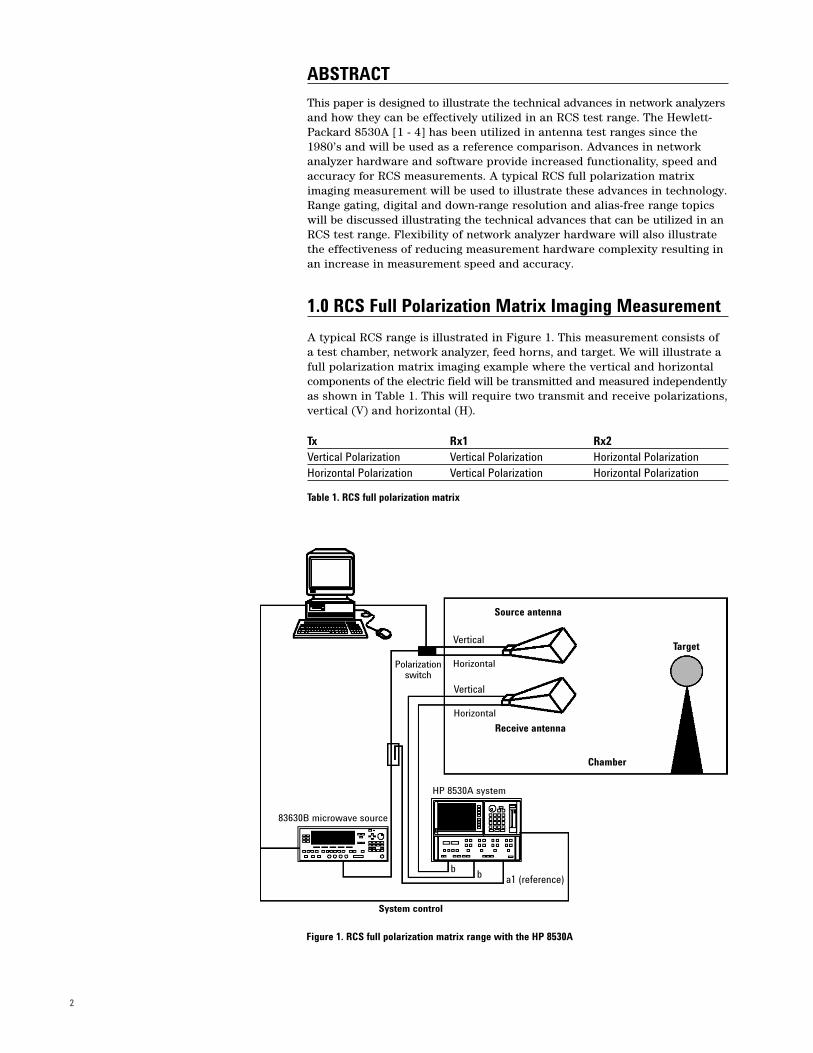
A typical RCS range is illustrated in Figure 1. This measurement consists ofa test chamber, network analyzer, feed horns, and target. We will illustrate afull polarization matrix imaging example where the vertical and horizontalcomponents of the electric field will be transmitted and measured independentlyas shown in Table 1. This will require two transmit and receive polarizations,vertical (V) and horizontal (H).
Tx Rx1 Rx2Vertical Polarization Vertical Polarization Horizontal PolarizationHorizontal Polarization Vertical Polarization Horizontal Polarization
Table 1. RCS full polarization matrix
Source antenna
Receive antenna
Chamber
TargetVertical
HorizontalPolarizationswitch
Vertical
Horizontal
83630B microwave source
HP 8530A system
System control
b b a1 (reference)
Figure 1. RCS full polarization matrix range with the HP 8530A
3
2.0 RCS Measurement Resolution Enhancements
When performing RCS measurements utilizing a network analyzer there arethree resolution terms to be concerned with, cross-range, down-range anddigital resolutions.
Cross-range resolution depends on the incremental angle of rotation of thetarget and is independent of the network analyzer hardware utilized.
RCS down-range resolution refers to the minimum separation between targetscatters that can be resolved in the time domain impulse of the test system. The RCS down-range resolution depends on the measurement frequency spanand the window that is selected on the network analyzer. The windowing feature is used to modify the frequency domain data before time domaintransform. Utilizing different window shapes provides the user flexibility in modifying the resulting time domain impulse. Maximizing down-range resolution can be obtained by increasing the frequency span on the networkanalyzer in conjunction with the chosen window that is applied to the requency domain data prior to transforming into the time domain.
Digital resolution is defined as the ability to locate a single response in time.In other words, if only one response is present, this is how closely you canpinpoint the peak of that response. The digital response of the time domaintrace is determined by the number of points measured in the frequencydomain and by the time span that is displayed. One can therefore increasethe digital resolution by reducing the displayed time span. This was themethod commonly used on the HP 8530A because the maximum number ofpoints that could be used was 801. On newer network analyzer platforms,such as the Agilent PNA [5 - 8], the number of points can be increased to16,001. Therefore, digital resolution on the PNA can be increased while stillmaintaining the displayed time span by increasing the number of points forup to 20 times increase in digital resolution
4
3.0 RCS Alias-Free Range Enhancements
Alias-free range is the length of time that a measurement can be made without encountering a repetition of the desired response in the timedomain. The repetition of the time domain response occurs at regular intervalsand is a consequence of the frequency domain response being measured atdiscrete frequency intervals. To prevent aliasing during RCS measurementsthe alias-free range should be greater than twice the RCS chamber length.The alias free range is given by:
On the HP 8530A a typical measurement scenario would be:
The length of the RCS range from the range antennas to the chamber backwall must be 28.5 meters or less (one half of alias free range). To increasethe alias free range one can either increase the number of points or decreasethe frequency span. Reducing the frequency span also reduces the down-rangeresolution which is undesirable. This was a common tradeoff when using theHP 8530A because of it’s limitation of 801 points. The Agilent PNA Seriesnetwork analyzer can have a maximum 1 of 16,001 points per trace providingup to 20 times increase in alias-free range at an equivalent frequency spanthus not affecting the down-range resolution. In this example the length of theRCS test range could be increased to 570 meters while still maintaining analias-free zone and maintaining the down-range resolution. RCS ranges thatdo not require this large alias-free range but require improved down-rangeresolution can increase the frequency span that is swept while utilizing thefull 16,001 points. For example, if 57 meters is the desired alias-free range,the frequency span may be increased in this example from 4.2 GHz to 84 GHzagain a 20 times improvement. Large frequency spans may require the utilization of multiple banded antennas.
1. Minimum number of points is 2.
Alias free range= 1 = (Number of points –1)
∆F Frequency span
801 points8.2 GHz to 12.4 GHz
Alias free range = (801 - 1)
= 190 ns or 57 meters(12.4 - 8,2)* 10 9
Alias free range = 190 ns or 57 meters
Frequency span = (16001 - 1)
= 84 GHz190* 10-9
5
4.0 RCS Test System Hardware Enhancements Utilizing Synthetic Time Domain
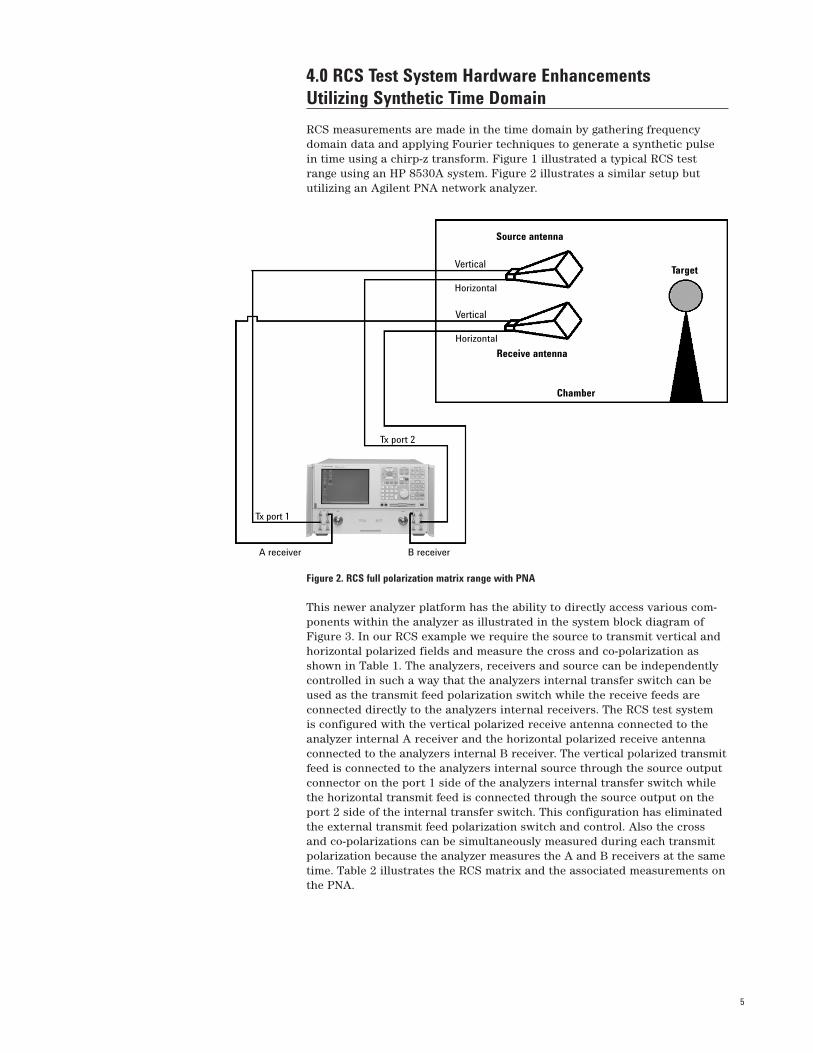
RCS measurements are made in the time domain by gathering frequencydomain data and applying Fourier techniques to generate a synthetic pulsein time using a chirp-z transform. Figure 1 illustrated a typical RCS testrange using an HP 8530A system. Figure 2 illustrates a similar setup but utilizing an Agilent PNA network analyzer.
Figure 2. RCS full polarization matrix range with PNA
This newer analyzer platform has the ability to directly access various com-ponents within the analyzer as illustrated in the system block diagram ofFigure 3. In our RCS example we require the source to transmit vertical andhorizontal polarized fields and measure the cross and co-polarization asshown in Table 1. The analyzers, receivers and source can be independentlycontrolled in such a way that the analyzers internal transfer switch can beused as the transmit feed polarization switch while the receive feeds are connected directly to the analyzers internal receivers. The RCS test system is configured with the vertical polarized receive antenna connected to theanalyzer internal A receiver and the horizontal polarized receive antennaconnected to the analyzers internal B receiver. The vertical polarized transmitfeed is connected to the analyzers internal source through the source outputconnector on the port 1 side of the analyzers internal transfer switch whilethe horizontal transmit feed is connected through the source output on theport 2 side of the internal transfer switch. This configuration has eliminatedthe external transmit feed polarization switch and control. Also the crossand co-polarizations can be simultaneously measured during each transmitpolarization because the analyzer measures the A and B receivers at the sametime. Table 2 illustrates the RCS matrix and the associated measurements onthe PNA.
Source antenna
Receive antenna
Chamber
TargetVertical
Horizontal
Vertical
Horizontal
Tx port 2
B receiverA receiver
Tx port 1
6
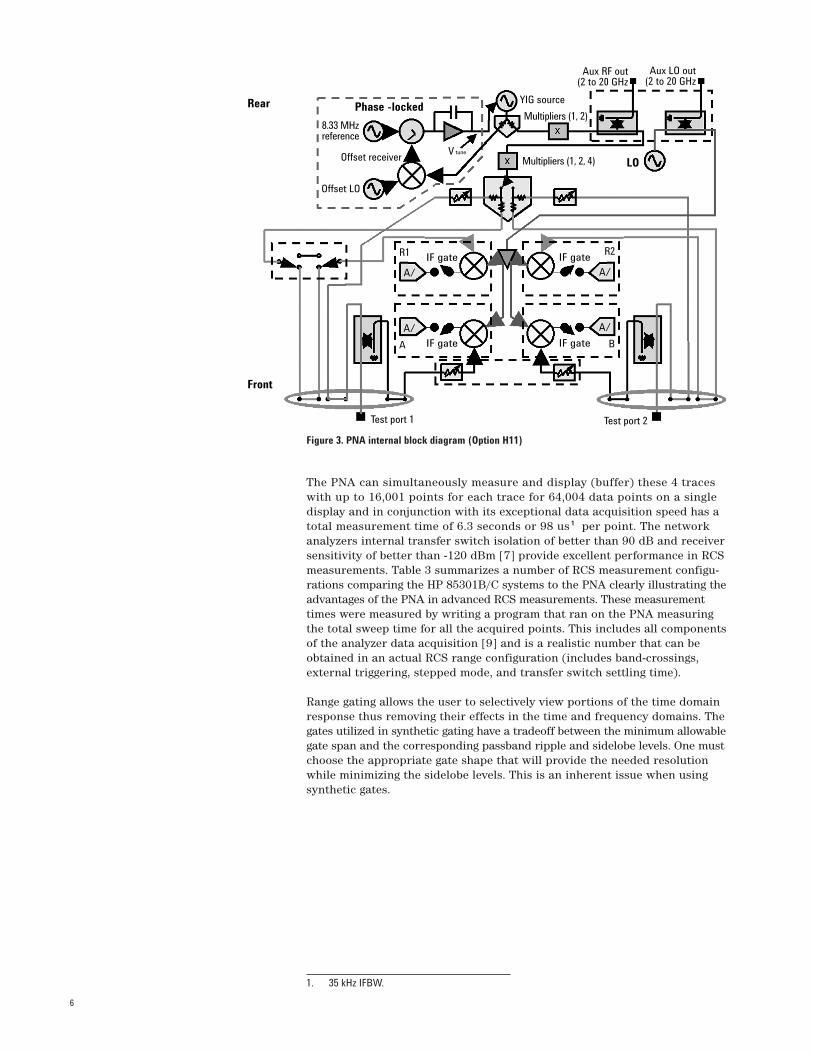
Figure 3. PNA internal block diagram (Option H11)
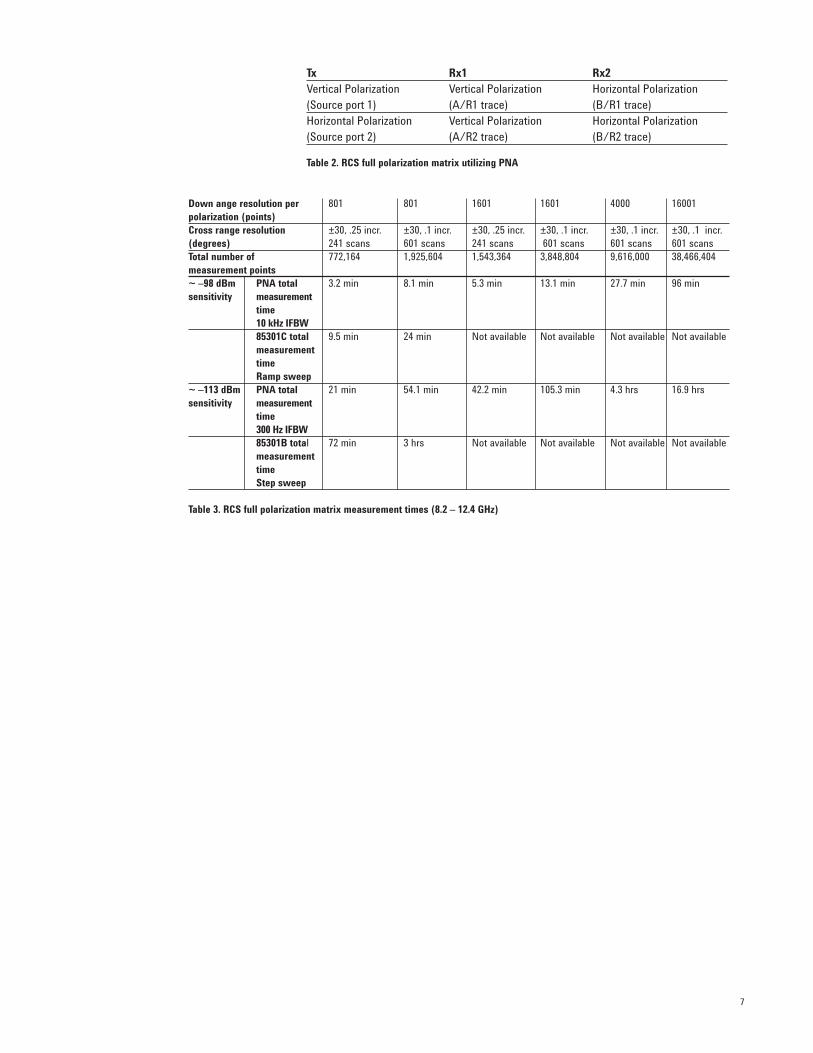
The PNA can simultaneously measure and display (buffer) these 4 traceswith up to 16,001 points for each trace for 64,004 data points on a single display and in conjunction with its exceptional data acquisition speed has atotal measurement time of 6.3 seconds or 98 us 1 per point. The network analyzers internal transfer switch isolation of better than 90 dB and receiversensitivity of better than -120 dBm [7] provide excellent performance in RCSmeasurements. Table 3 summarizes a number of RCS measurement configu-rations comparing the HP 85301B/C systems to the PNA clearly illustrating theadvantages of the PNA in advanced RCS measurements. These measurementtimes were measured by writing a program that ran on the PNA measuringthe total sweep time for all the acquired points. This includes all componentsof the analyzer data acquisition [9] and is a realistic number that can beobtained in an actual RCS range configuration (includes band-crossings,external triggering, stepped mode, and transfer switch settling time).
Range gating allows the user to selectively view portions of the time domainresponse thus removing their effects in the time and frequency domains. Thegates utilized in synthetic gating have a tradeoff between the minimum allowablegate span and the corresponding passband ripple and sidelobe levels. One mustchoose the appropriate gate shape that will provide the needed resolutionwhile minimizing the sidelobe levels. This is an inherent issue when usingsynthetic gates.
1. 35 kHz IFBW.
Rear
LO
Phase -locked
Front
Test port 1
Offset receiverV tune
YIG source
Aux RF out(2 to 20 GHz
Aux LO out(2 to 20 GHz
Multipliers (1, 2)
Multipliers (1, 2, 4)
Offset LO
8.33 MHzreference
Test port 2
R1
A/ A/
A/ A/
IF gate IF gate
IF gate IF gate
R2
A B
7
Down ange resolution per 801 801 1601 1601 4000 16001polarization (points)Cross range resolution ±30, .25 incr. ±30, .1 incr. ±30, .25 incr. ±30, .1 incr. ±30, .1 incr. ±30, .1 incr. (degrees) 241 scans 601 scans 241 scans 601 scans 601 scans 601 scansTotal number of 772,164 1,925,604 1,543,364 3,848,804 9,616,000 38,466,404measurement points~ –98 dBm PNA total 3.2 min 8.1 min 5.3 min 13.1 min 27.7 min 96 minsensitivity measurement
time10 kHz IFBW85301C total 9.5 min 24 min Not available Not available Not available Not available measurementtimeRamp sweep
~ –113 dBm PNA total 21 min 54.1 min 42.2 min 105.3 min 4.3 hrs 16.9 hrssensitivity measurement
time300 Hz IFBW85301B total 72 min 3 hrs Not available Not available Not available Not available measurementtimeStep sweep
Table 3. RCS full polarization matrix measurement times (8.2 – 12.4 GHz)
Tx Rx1 Rx2Vertical Polarization Vertical Polarization Horizontal Polarization(Source port 1) (A/R1 trace) (B/R1 trace)Horizontal Polarization Vertical Polarization Horizontal Polarization(Source port 2) (A/R2 trace) (B/R2 trace)
Table 2. RCS full polarization matrix utilizing PNA
8
5.0 RCS Test System Hardware Enhancements UtilizingNatural Time Domain
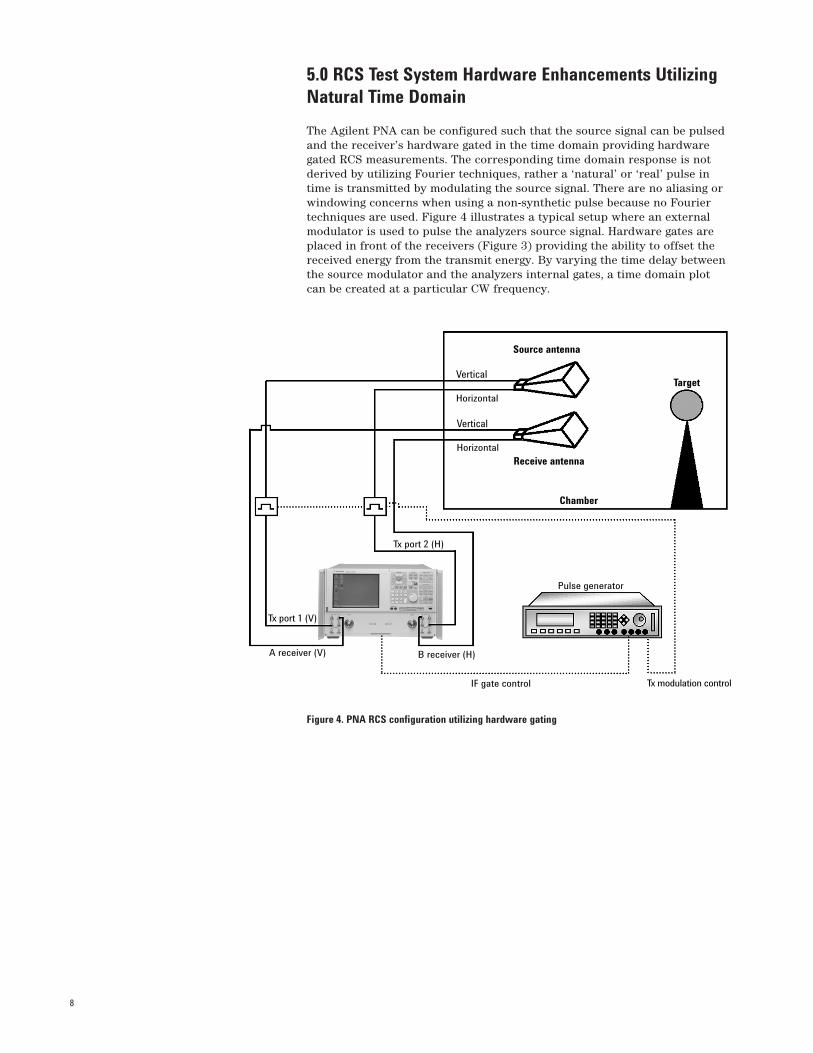
The Agilent PNA can be configured such that the source signal can be pulsedand the receiver’s hardware gated in the time domain providing hardwaregated RCS measurements. The corresponding time domain response is notderived by utilizing Fourier techniques, rather a ‘natural’ or ‘real’ pulse intime is transmitted by modulating the source signal. There are no aliasing orwindowing concerns when using a non-synthetic pulse because no Fouriertechniques are used. Figure 4 illustrates a typical setup where an externalmodulator is used to pulse the analyzers source signal. Hardware gates areplaced in front of the receivers (Figure 3) providing the ability to offset thereceived energy from the transmit energy. By varying the time delay betweenthe source modulator and the analyzers internal gates, a time domain plotcan be created at a particular CW frequency.
Figure 4. PNA RCS configuration utilizing hardware gating
Source antenna
Receive antenna
Chamber
TargetVertical
Horizontal
Vertical
Horizontal
Tx port 2 (H)
B receiver (H)
IF gate control Tx modulation control
Pulse generator
A receiver (V)
Tx port 1 (V)
9
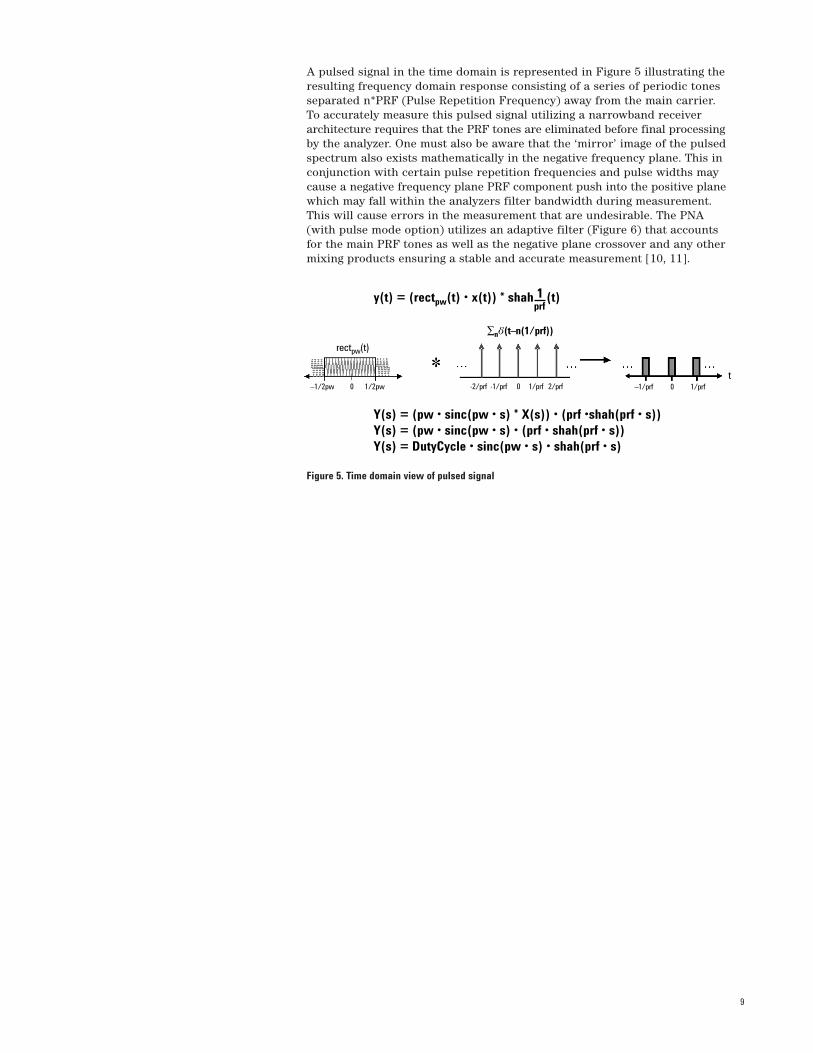
A pulsed signal in the time domain is represented in Figure 5 illustrating theresulting frequency domain response consisting of a series of periodic tonesseparated n*PRF (Pulse Repetition Frequency) away from the main carrier.To accurately measure this pulsed signal utilizing a narrowband receiverarchitecture requires that the PRF tones are eliminated before final processingby the analyzer. One must also be aware that the ‘mirror’ image of the pulsedspectrum also exists mathematically in the negative frequency plane. This inconjunction with certain pulse repetition frequencies and pulse widths maycause a negative frequency plane PRF component push into the positive planewhich may fall within the analyzers filter bandwidth during measurement.This will cause errors in the measurement that are undesirable. The PNA(with pulse mode option) utilizes an adaptive filter (Figure 6) that accountsfor the main PRF tones as well as the negative plane crossover and any othermixing products ensuring a stable and accurate measurement [10, 11].
Figure 5. Time domain view of pulsed signal
–1/2pw 0 1/2pw -2/prf -1/prf 0 1/prf 2/prf –1/prf 0 1/prf
rectpw(t)
∑nd(t–n(1/prf))
t
y(t) = (rectpw(t) • x(t)) * shah 1 (t)prf
Y(s) = (pw • sinc(pw • s) * X(s)) • (prf •shah(prf • s))Y(s) = (pw • sinc(pw • s) • (prf • shah(prf • s))Y(s) = DutyCycle • sinc(pw • s) • shah(prf • s)
10
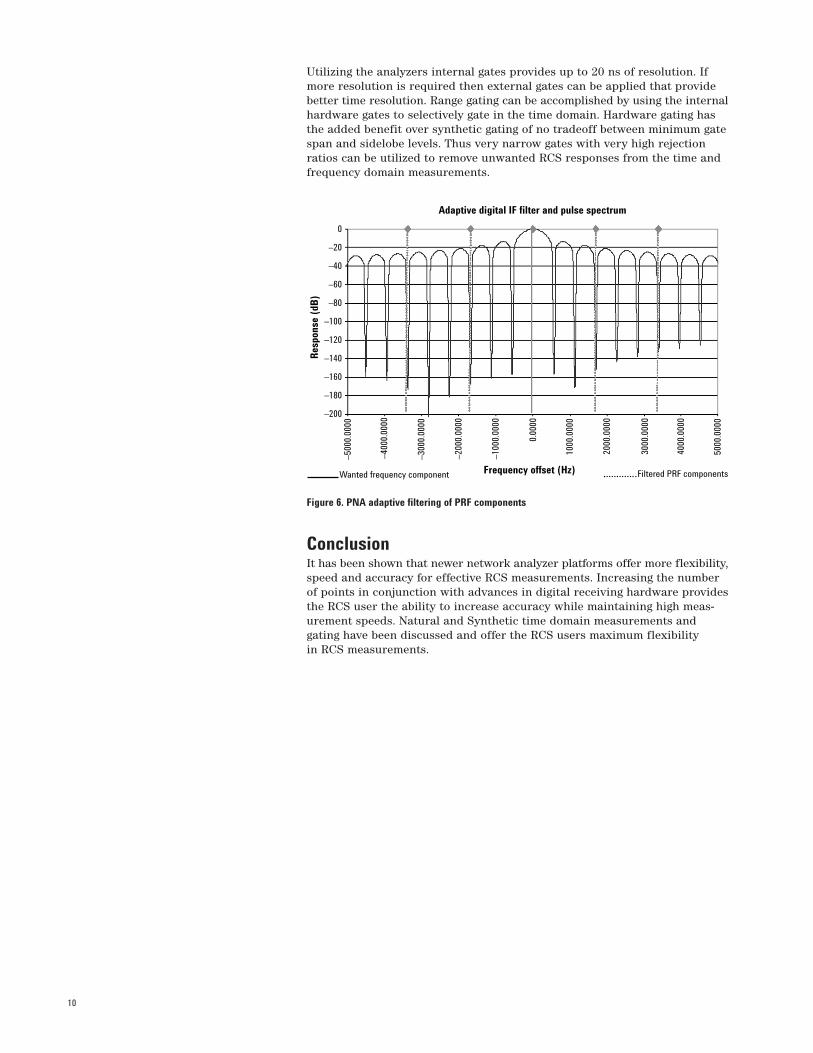
Utilizing the analyzers internal gates provides up to 20 ns of resolution. Ifmore resolution is required then external gates can be applied that providebetter time resolution. Range gating can be accomplished by using the internalhardware gates to selectively gate in the time domain. Hardware gating hasthe added benefit over synthetic gating of no tradeoff between minimum gatespan and sidelobe levels. Thus very narrow gates with very high rejectionratios can be utilized to remove unwanted RCS responses from the time andfrequency domain measurements.
Figure 6. PNA adaptive filtering of PRF components
ConclusionIt has been shown that newer network analyzer platforms offer more flexibility,speed and accuracy for effective RCS measurements. Increasing the numberof points in conjunction with advances in digital receiving hardware providesthe RCS user the ability to increase accuracy while maintaining high meas-urement speeds. Natural and Synthetic time domain measurements and gating have been discussed and offer the RCS users maximum flexibility in RCS measurements.
Adaptive digital IF filter and pulse spectrum
Frequency offset (Hz)
Res
pons
e (d
B)
–500
0.00
00
–400
0.00
00
–300
0.00
00
–200
0.00
00
–100
0.00
00
1000
.000
0
2000
.000
0
3000
.000
0
4000
.000
0
5000
.000
0
0.00
00
0
–20
–40
–60
–80
–100
–120
–140
–160
–180
–200
Wanted frequency component Filtered PRF components
11
10. References[1] R. Balaberta, and Shatnu R. Mishra, On the use of the HP 8510 NetworkAnalyzer for Antenna Pattern Measurements, 1986 AMTA proceedings.
[2] Dan Slater, and Greg Hindman, Nearfield Systems, Inc. “A Low-cost,Portable Near-field Antenna Measurement System,” 1989 AMTA proceedings.
[3] John Swanstrom and Robert Shoulders, Pulsed Antenna Measurementswith the HP 8530A Microwave Receiver, 1994 AMTA proceedings.
[4] 85301B/C Antenna Measurement System Configuration Guide, literature number 5967-6042E.
[5] Antenna Test Solutions Catalog, literature number 5968-6759E.
[6] PNA Series RF and Microwave Network Analyzer, brochure, literature number 5968-8472EN.
[7] Agilent PNA Series Microwave Network Analyzers Data Sheet, literature number 5988-7988EN.
[8] Triggering the PNA Series Network Analyzer for AntennaMeasurements, White paper, literature number 5988-9518EN.
[9] Swanstrom, J., Puri, J., Anderson, K., Kwan, B., Antenna and RCSMeasurement Configurations Using Agilent’s New PNA Network Analyzers,2003 AMTA Symposium.
[10] Accurate Pulsed Measurements, Agilent PNA Microwave Network Analyzers,literature number 5988-0563EN.
[11] Betts, L., Make Accurate Pulsed S-Parameter Measurements,Microwaves & RF, November 2003, Vol. 42, No. 11.
Web ResourcesFor additional PNA Series product information visit our web site: www.agilent.com/find/pna
Agilent Technologies’ Test and Measurement Support, Services, and AssistanceAgilent Technologies aims to maximize the value you receive, while minimizing your risk and problems. Westrive to ensure that you get the test and measurement capabilities you paid for and obtain the support you need. Our extensive support resources and services can help you choose the right Agilent products foryour applications and apply them successfully. Every instrument and system we sell has a global warranty.Support is available for at least five years beyond the production life of the product. Two concepts underlieAgilent’s overall support policy: “Our Promise” and “Your Advantage.”
Our PromiseOur Promise means your Agilent test and measurement equipment will meet its advertised performanceand functionality. When you are choosing new equipment, we will help you with product information,including realistic performance specifications and practical recommendations from experienced test engineers. When you receive your new Agilent equipment, we can help verify that it works properly and help with initial product operation.
Your AdvantageYour Advantage means that Agilent offers a wide range of additional expert test and measurement services,which you can purchase according to your unique technical and business needs. Solve problems efficientlyand gain a competitive edge by contracting with us for calibration, extra-cost upgrades, out-of-warrantyrepairs, and onsite education and training, as well as design, system integration, project management, andother professional engineering services. Experienced Agilent engineers and technicians worldwide can helpyou maximize your productivity, optimize the return on investment of your Agilent instruments and systems,and obtain dependable measurement accuracy for the life of those products.
www.agilent.com/find/emailupdatesGet the latest information on the products and applications you select.
Agilent T&M Software and ConnectivityAgilent’s Test and Measurement software and connectivity products, solutions and developer networkallows you to take time out of connecting your instruments to your computer with tools based on PC standards,so you can focus on your tasks, not on your connections. Visit www.agilent.com/find/connectivityfor more information.
For more information on Agilent Technologies’ products, applications or services, please contact your localAgilent office. The complete list is available at:
www.agilent.com/find/contactus
Product specifications and descriptions in this document subject to change without notice.
© Agilent Technologies, Inc. 2004Printed in USA, November 30, 20045989-1937EN
Phone or Fax
United States:(tel) 800 829 4444(fax) 800 829 4433Canada:(tel) 877 894 4414(fax) 800 746 4866China:(tel) 800 810 0189(fax) 800 820 2816
Europe:(tel) 31 20 547 2111Japan:(tel) (81) 426 56 7832(fax) (81) 426 56 7840Korea:(tel) (080) 769 0800(fax) (080)769 0900Latin America:(tel) (305) 269 7500
Taiwan:(tel) 0800 047 866 (fax) 0800 286 331Other Asia Pacific Countries:(tel) (65) 6375 8100 (fax) (65) 6755 0042Email: [email protected] revised: 9/17/04
Agilent Email Updates


![Rich Communication Suite 5.0 Advanced Communications ...€¦ · RCS 5.0 builds on the fundamentals from RCS Release 1 to 4 and RCS-e (RCS-enhanced) 1.2 (see [RCSe12]) that are succeeded](https://img.pdfslide.us/doc/110x75/5ed9a866186b8d62dd017224/rich-communication-suite-50-advanced-communications-rcs-50-builds-on-the-fundamentals.jpg)