Embed Size (px)
Citation preview
XBeach-G
Introduction to the model
• Background • Model hydrodynamics
• Model description • Model validation • Model application
• Model morphodynamics • Model description • Model results and sensitivity
CONTENTS
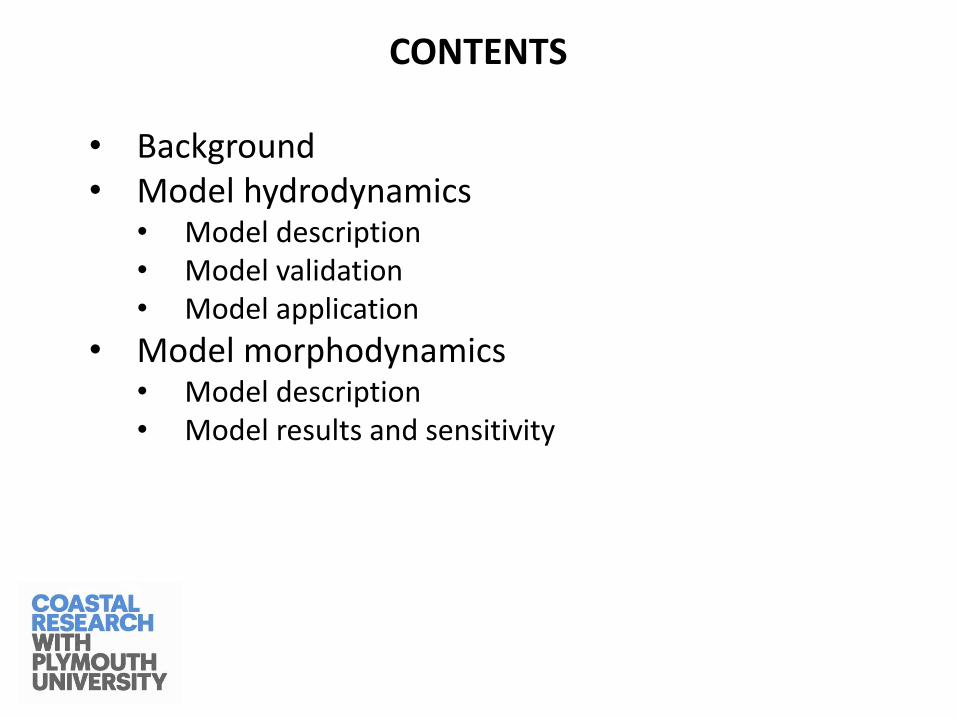
XBeach-G(ravel)
BACKGROUND
BACKGROUND
Problem
XBeach-G
• Compared to sandy beaches, relatively little is known about processes occurring on gravel beaches, particularly during storms
• Few (if any) tools available to coastal managers of gravel beaches to assess flood risk and increase preparedness
• Tools currently used in the UK (SHINGLE; Barrier Inertia Model) have limitations in their applicability
BACKGROUND
Objective (NUPSIG)
XBeach-G
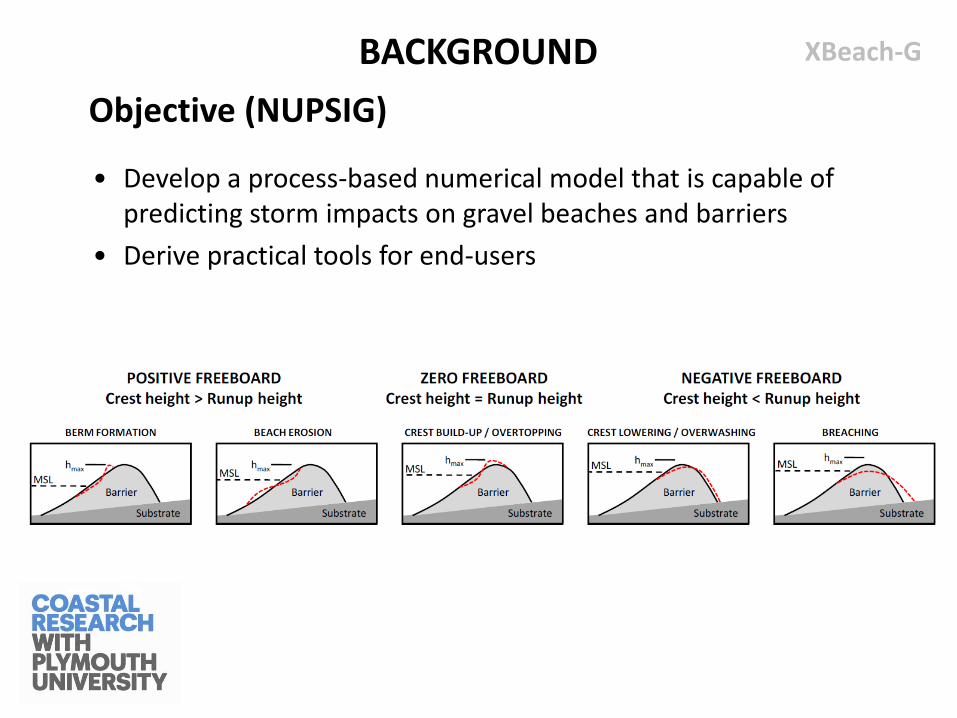
• Develop a process-based numerical model that is capable of predicting storm impacts on gravel beaches and barriers
• Derive practical tools for end-users
BACKGROUND
Objective (NUPSIG)
XBeach-G
• Develop a process-based numerical model that is capable of predicting storm impacts on gravel beaches and barriers
• Derive practical tools for end-users
Method
• Do not start from scratch
• Use data collected in physical model experiments, as well in the field to modify the XBeach model to correctly simulate storm processes on gravel beaches
BACKGROUND
The XBeach model
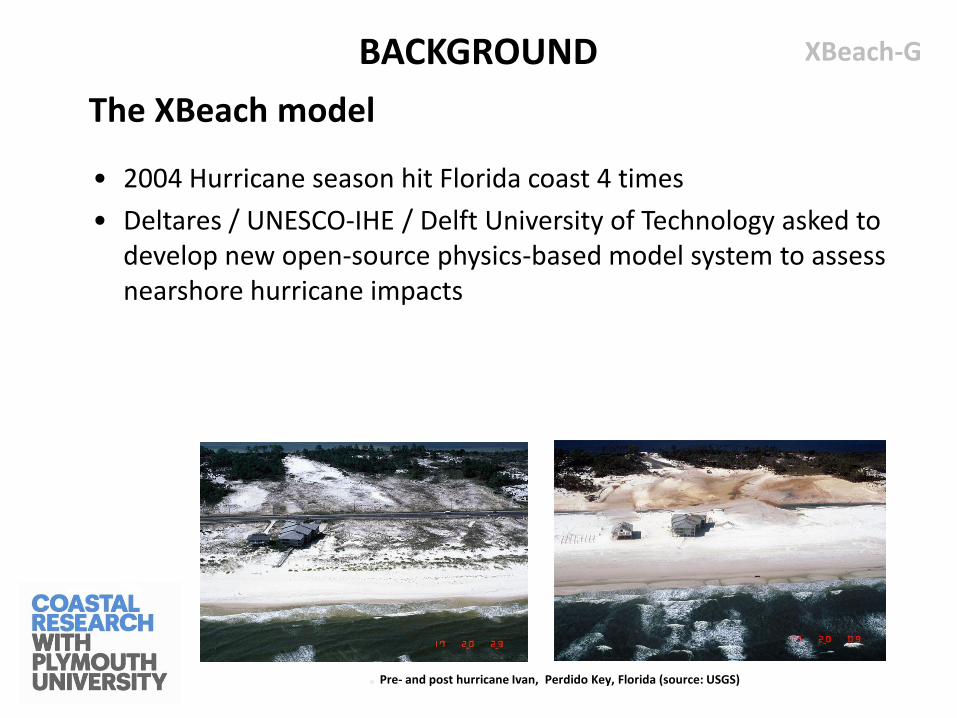
• 2004 Hurricane season hit Florida coast 4 times
• Deltares / UNESCO-IHE / Delft University of Technology asked to develop new open-source physics-based model system to assess nearshore hurricane impacts
Pre- and post hurricane Ivan, Perdido Key, Florida (source: USGS)
XBeach-G
BACKGROUND
XBeach model validation
• Model well validated for use on sandy coasts
• 27 organisations world-wide are involved with Deltares / UNESCO-IHE / Delft University in developing and validating the XBeach model, as well as applying the model to Coastal Zone Management issues
• 300+ users world-wide
• 80+ journal publications using XBeach; 140+ citations of XBeach model
XBeach-G
BACKGROUND
Model modifications required for gravel
• Waves • Incident wind / swell waves are not negligible compared to
infragravity waves on gravel beaches and contribute significantly to wave run-up, overtopping, etc. Solve waves explicitly in model.
• Hydrology
• Sediment transport and morphology
XBeach-G
BACKGROUND
Model modifications required for gravel
• Waves • Incident wind / swell waves are not negligible compared to
infragravity waves on gravel beaches and contribute significantly to wave run-up, overtopping, etc. Solve waves explicitly in model.
• Hydrology • Infiltration effects significant for swash dynamics if K > 1 cm/s. Model
required to solve infiltration and exfiltration.
• Sediment transport and morphology • Bed load and sheet load sediment transport in the swash is
dominant sediment transport mechanism. Model required to solve bed load transport in the swash-zone.
XBeach-G
• Background • XBeach • XBeach-G
• Model hydrodynamics • Model description • Model validation • Model application
• Model sediment morphodynamics • Model description • Model results and sensitivity
CONTENTS
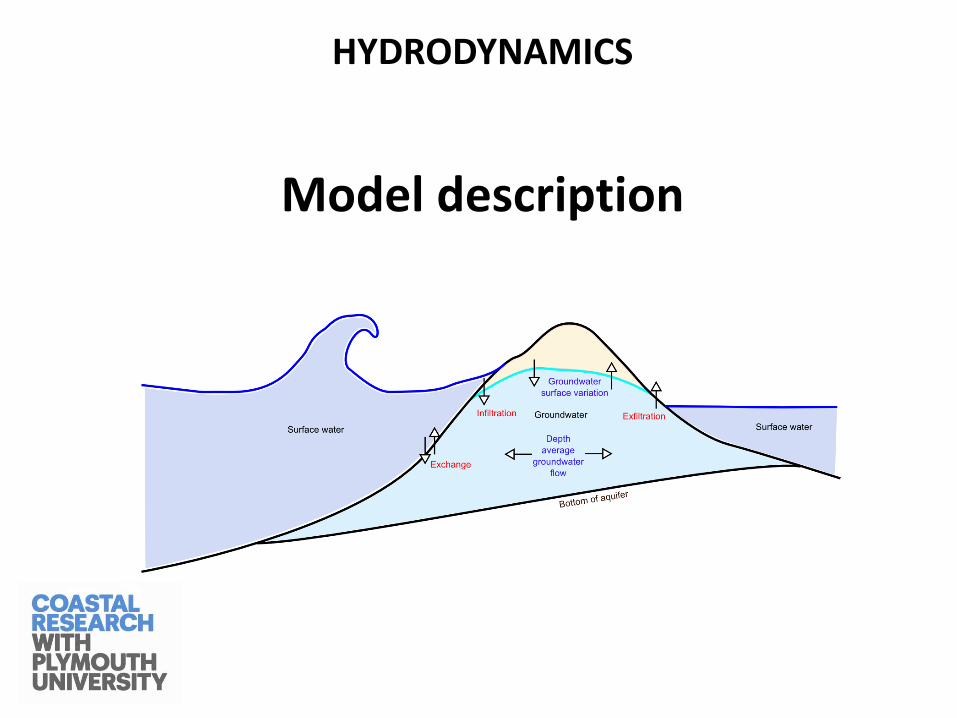
Model description
HYDRODYNAMICS
Basic equations
Description
• Depth-average currents (tidal, wave-driven, intra-wave) are solved using the non-linear shallow water equations (NLSWE)
• A non-hydrostatic pressure correction term is added to the NLSWE to allow the model to solve short waves
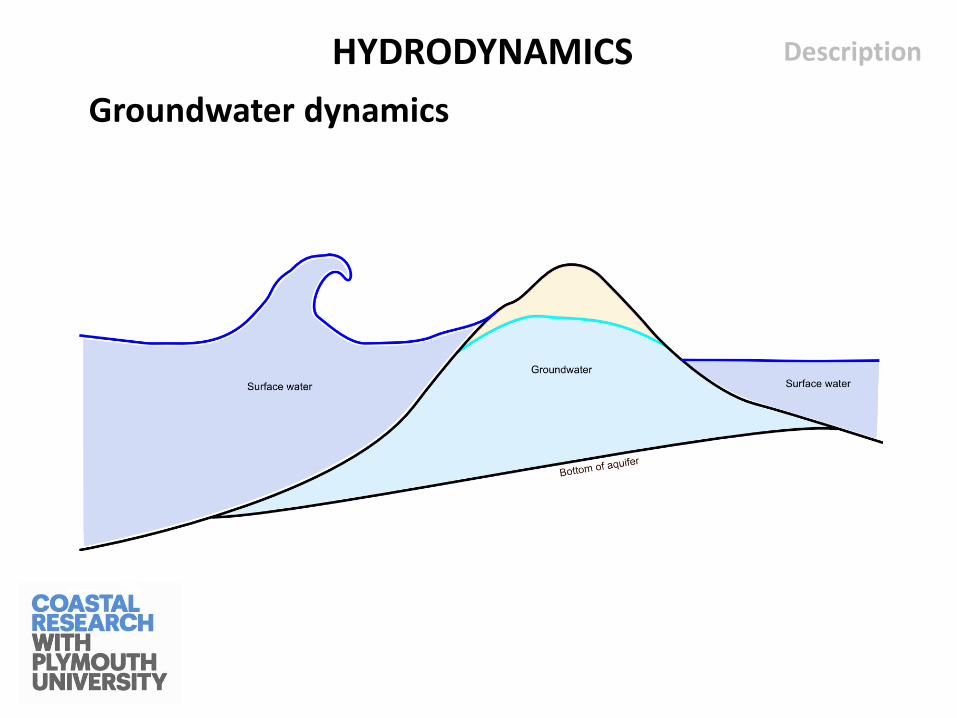
• Depth-average groundwater dynamics are solved separately to surface water dynamics
• Groundwater dynamics are computing using Darcy-type equation with non-hydrostatic pressure approximation
• Interaction between surface water and groundwater accounted for with infiltration and exfiltration terms
HYDRODYNAMICS
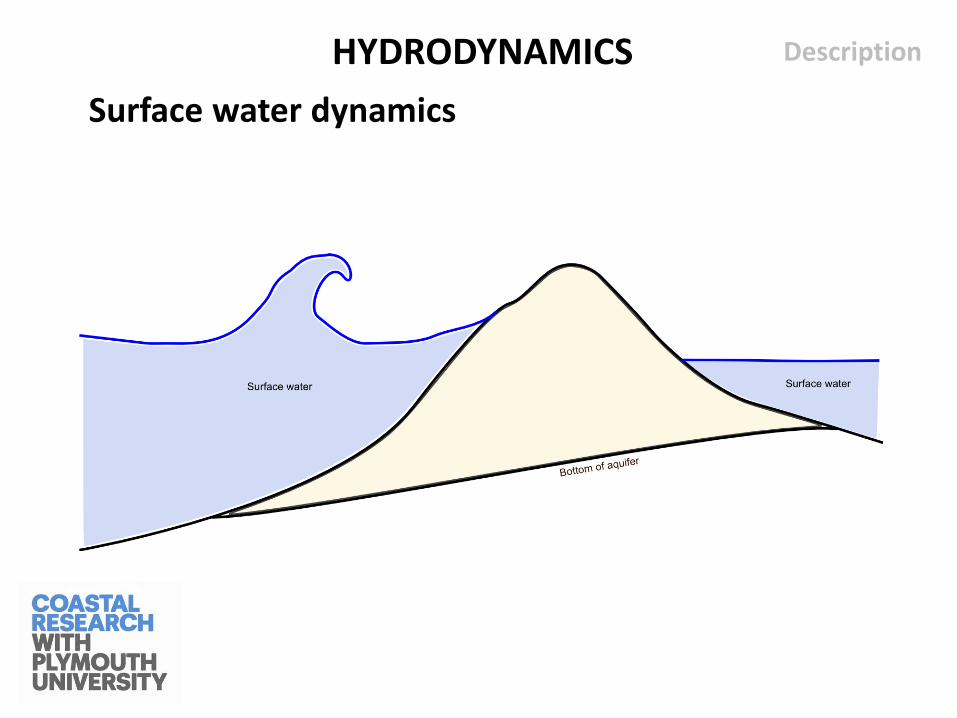
Surface water dynamics
Description HYDRODYNAMICS
Surface water dynamics
Description
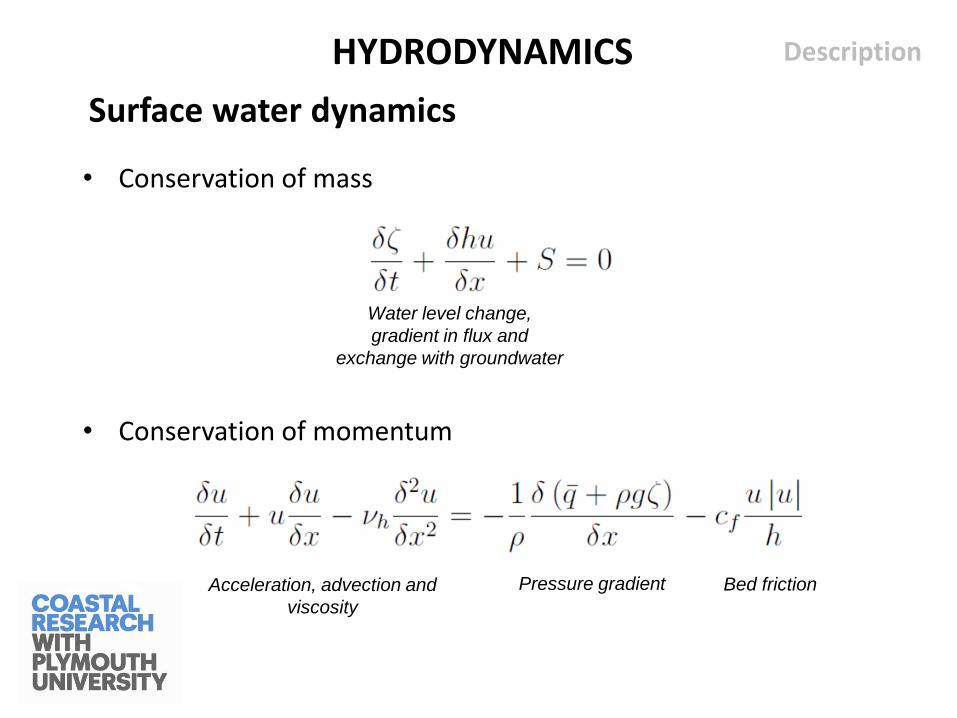
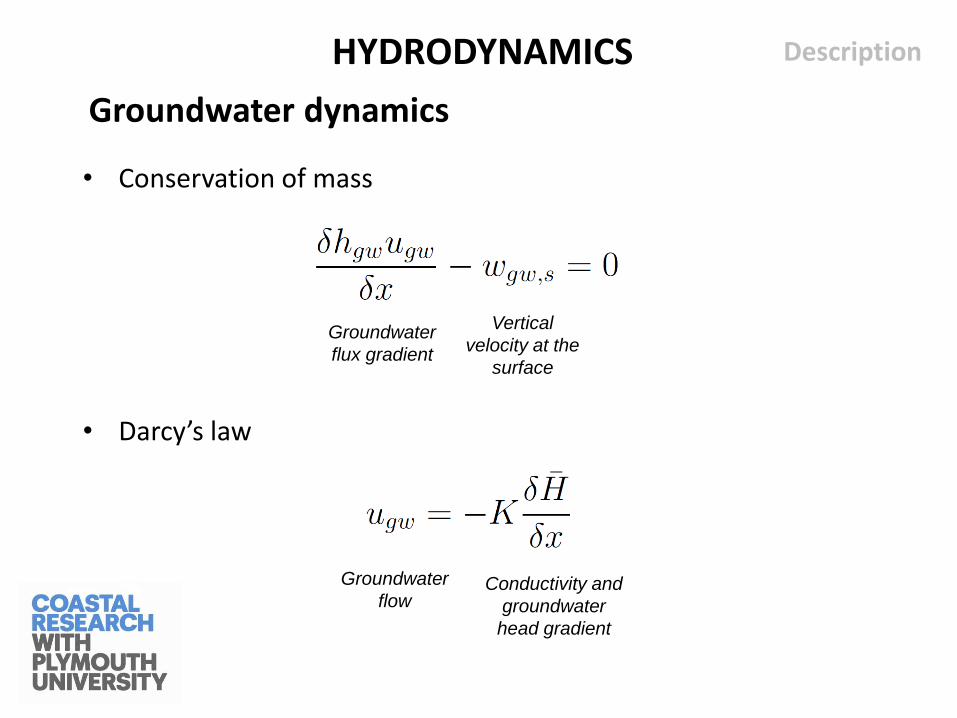
• Conservation of mass
• Conservation of momentum
HYDRODYNAMICS
Bed friction Pressure gradient Acceleration, advection and
viscosity
Water level change,
gradient in flux and
exchange with groundwater
Surface water dynamics
Description
• Pressure gradient • Dynamic pressure solved at the bed and given at the surface
(atmospheric pressure) (Smit et al., 2010)
• Similar implementation to a one-layer version of the Delft University of Technology SWASH model (Zijlema et al., 2011)
• Allows dispersion to be solved with minimal errors (<5%) in intermediate and shallow water (kd<3)
• Similar effect as a Boussinesq model, but fewer paramaters
HYDRODYNAMICS
Surface water dynamics
Description
• Boundary conditions • The model is forced at the offshore boundary with a time-series of
water level and cross-shore velocity of the incident band waves
• This time series is typically a random realisation of an offshore wave spectrum
• On top of this time series, the model computes the bound subharmonic (infragravity) wave field at the model boundary
• A slowly-varying tidal water level variation is maintained at the boundary based on the input tide signal
HYDRODYNAMICS
Groundwater dynamics
Description HYDRODYNAMICS
Groundwater dynamics
Description
• Conservation of mass
• Darcy’s law
HYDRODYNAMICS
Conductivity and
groundwater
head gradient
Groundwater
flow
Groundwater
flux gradient
Vertical
velocity at the
surface
Groundwater dynamics
Description
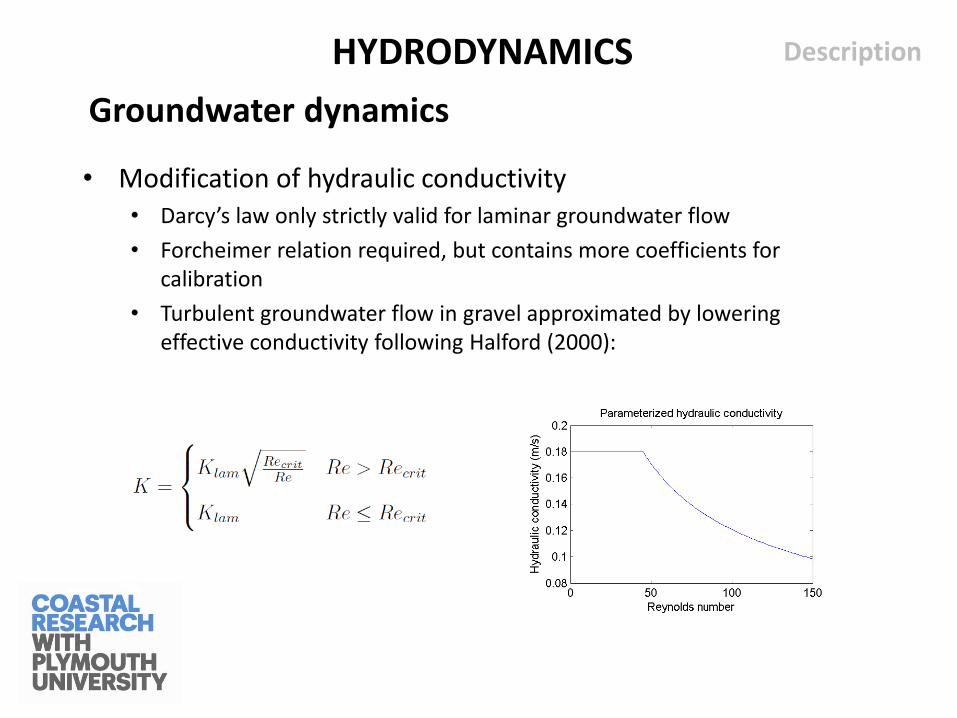
• Modification of hydraulic conductivity • Darcy’s law only strictly valid for laminar groundwater flow
• Forcheimer relation required, but contains more coefficients for calibration
• Turbulent groundwater flow in gravel approximated by lowering effective conductivity following Halford (2000):
HYDRODYNAMICS
Coupled surface water - groundwater
Description HYDRODYNAMICS
Coupled surface water – groundwater dynamics
Description
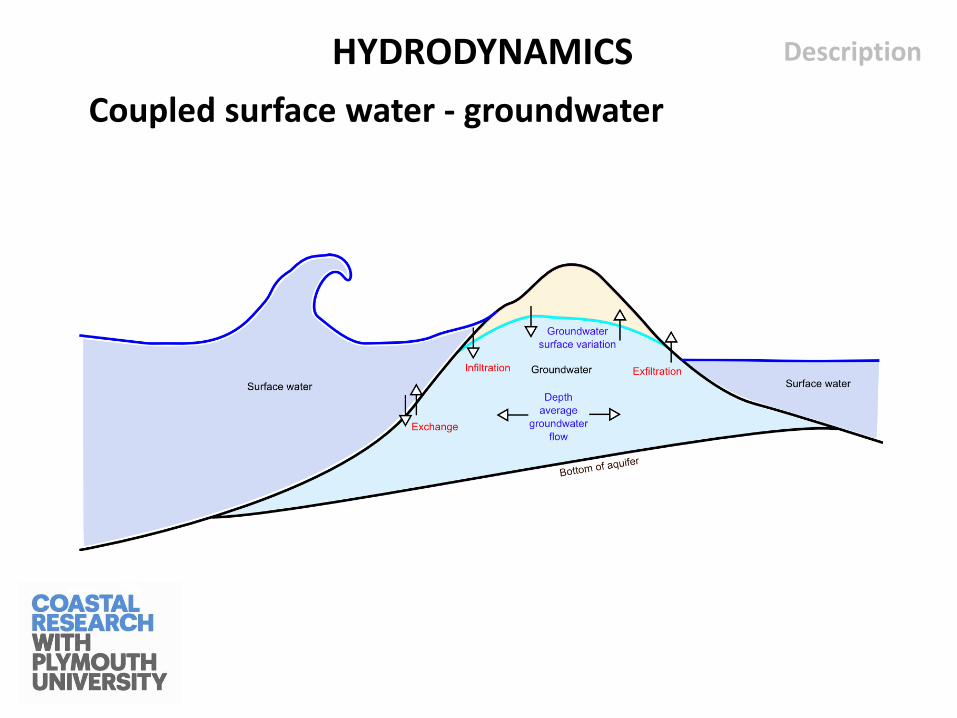
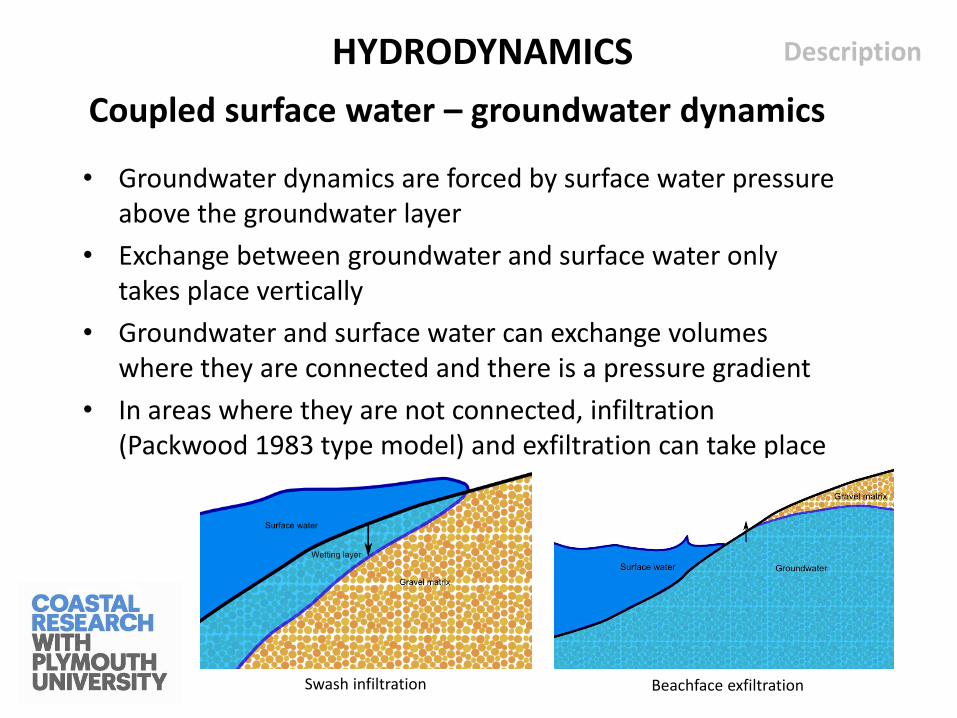
• Groundwater dynamics are forced by surface water pressure above the groundwater layer
• Exchange between groundwater and surface water only takes place vertically
• Groundwater and surface water can exchange volumes where they are connected and there is a pressure gradient
• In areas where they are not connected, infiltration (Packwood 1983 type model) and exfiltration can take place
HYDRODYNAMICS
Swash infiltration Beachface exfiltration
Model validation
HYDRODYNAMICS
Model – measurement data comparison
Validation
• Groundwater dynamics: BARDEX physical model experiment
• Wave transformation : BARDEX experiment and Loe Bar experiment
• Wave run-up: BARDEX experiment, Loe Bar experiment and storm surveys 2012 – 2013
• Wave overtopping: BARDEX experiment
HYDRODYNAMICS
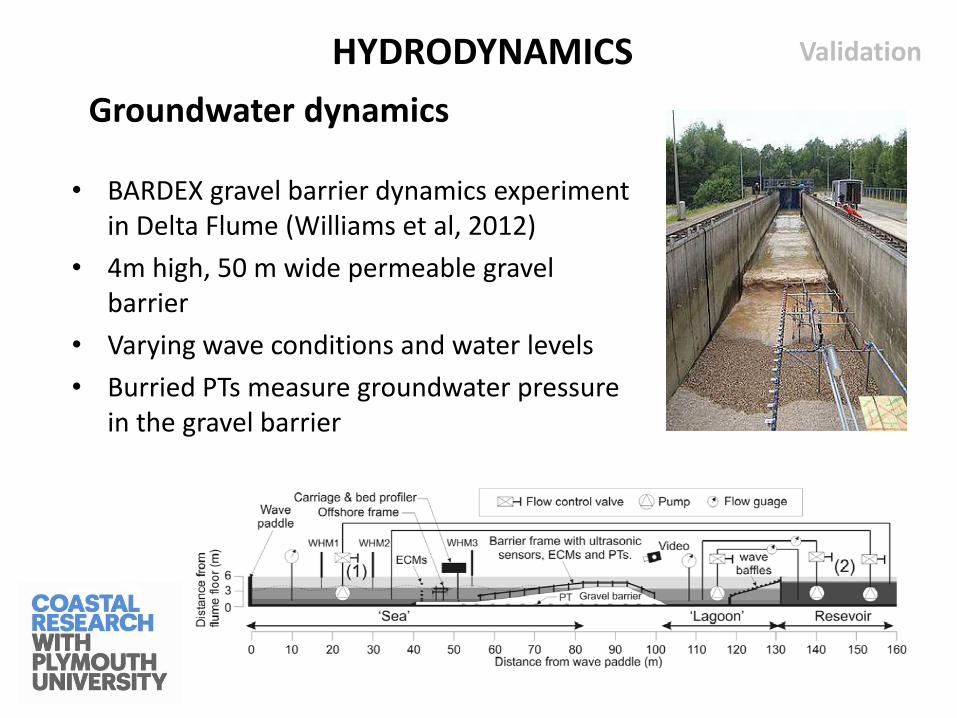
Groundwater dynamics
Validation HYDRODYNAMICS
• BARDEX gravel barrier dynamics experiment in Delta Flume (Williams et al, 2012)
• 4m high, 50 m wide permeable gravel barrier
• Varying wave conditions and water levels
• Burried PTs measure groundwater pressure in the gravel barrier
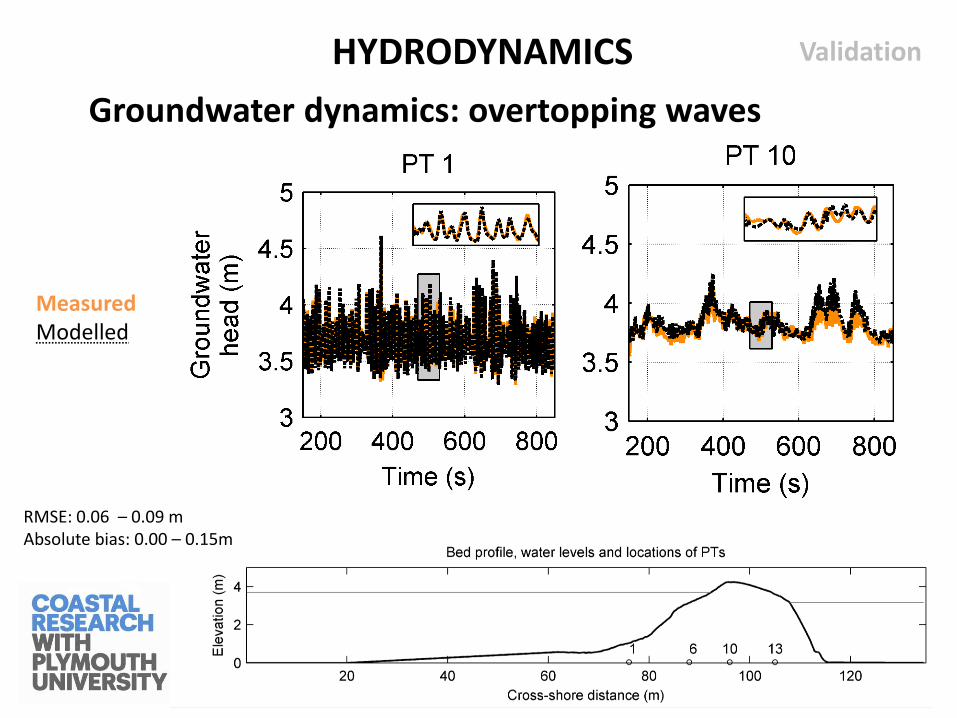
Groundwater dynamics: overtopping waves
Validation HYDRODYNAMICS
Measured Modelled
RMSE: 0.06 – 0.09 m Absolute bias: 0.00 – 0.15m
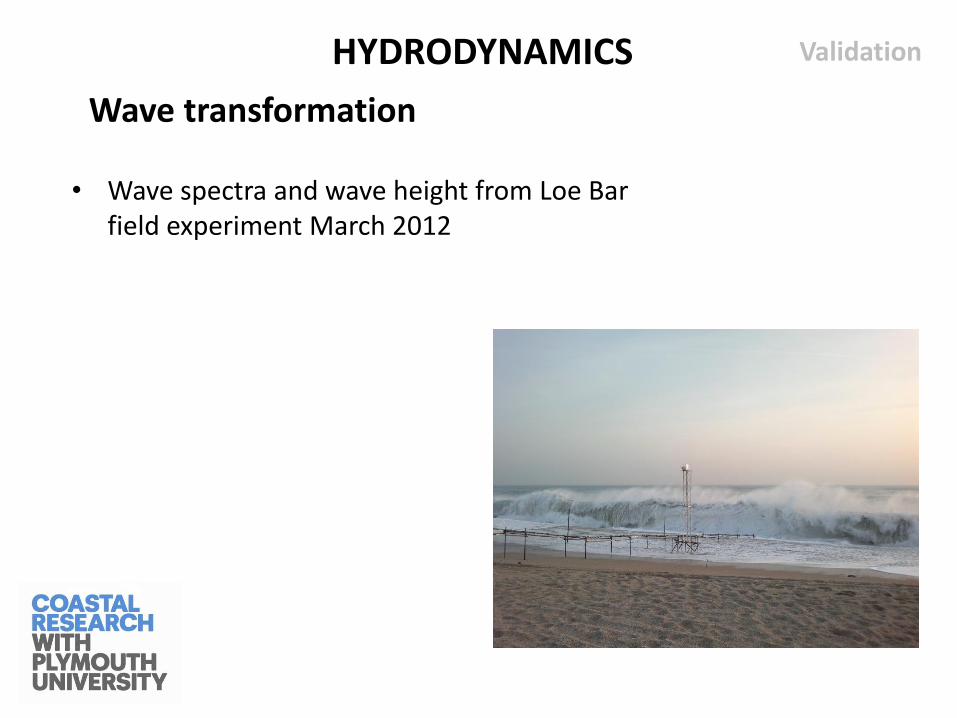
Wave transformation
Validation HYDRODYNAMICS
• Wave spectra and wave height from Loe Bar field experiment March 2012
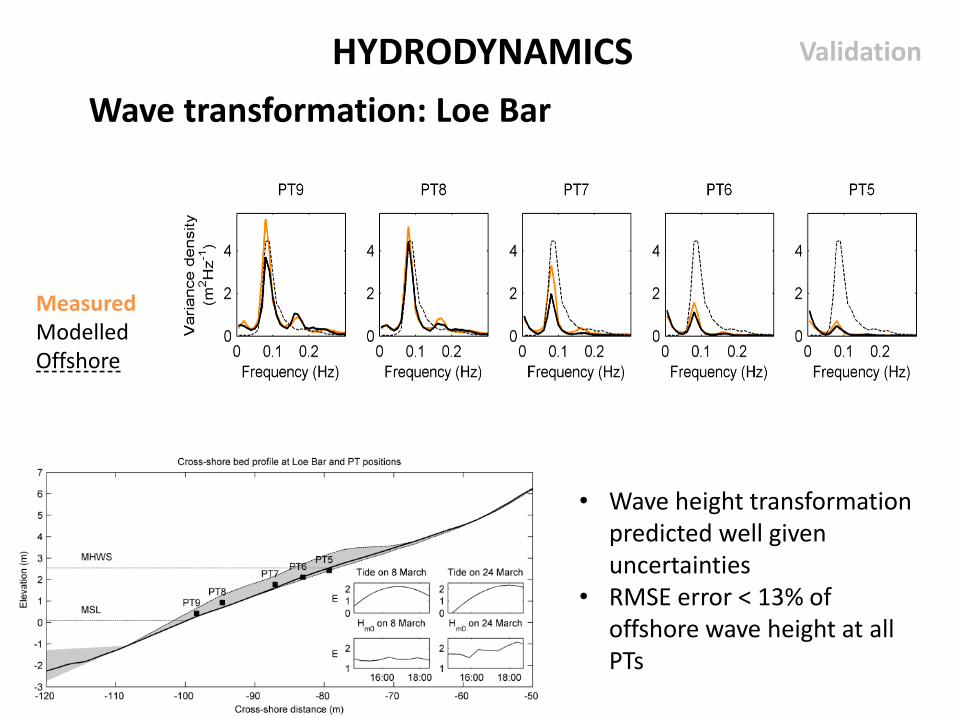
Wave transformation: Loe Bar
Validation HYDRODYNAMICS
Measured Modelled Offshore
• Wave height transformation predicted well given uncertainties
• RMSE error < 13% of offshore wave height at all PTs
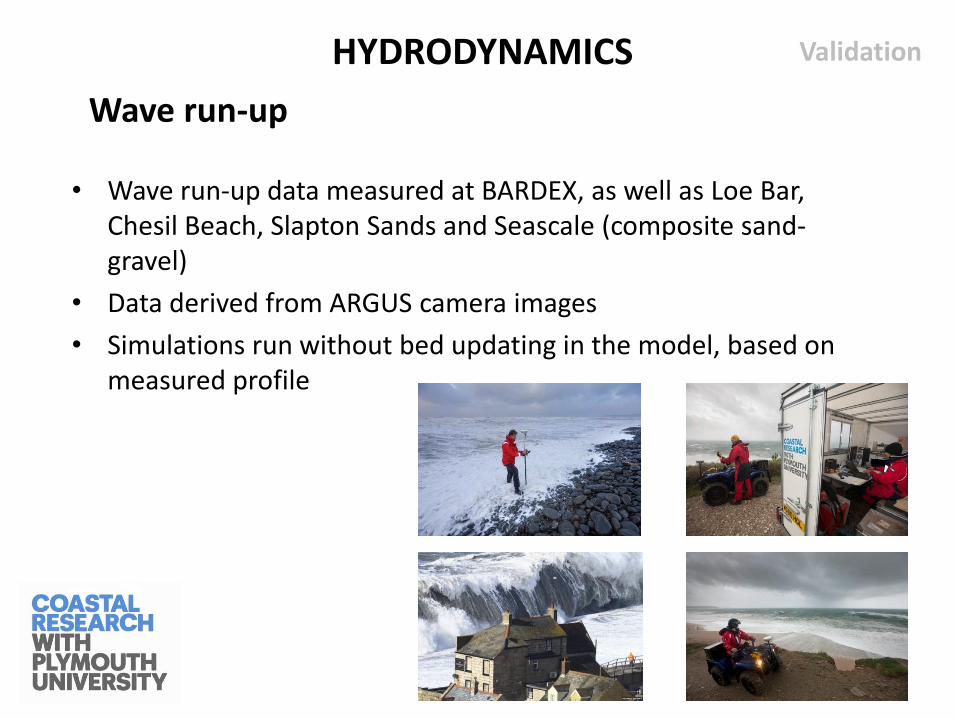
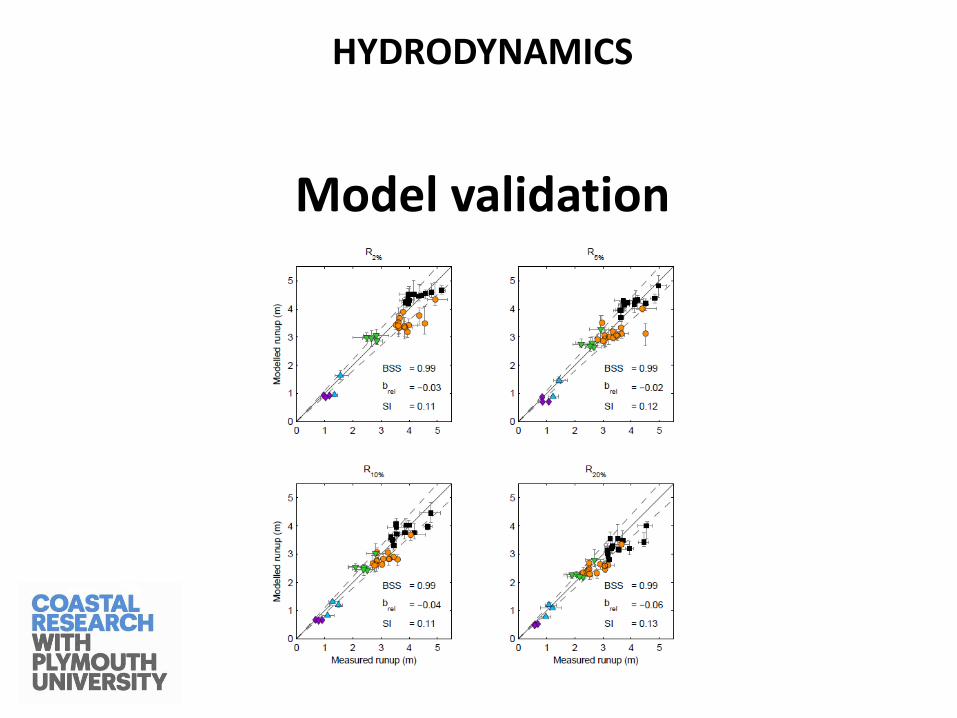
Wave run-up
Validation HYDRODYNAMICS
• Wave run-up data measured at BARDEX, as well as Loe Bar, Chesil Beach, Slapton Sands and Seascale (composite sand-gravel)
• Data derived from ARGUS camera images
• Simulations run without bed updating in the model, based on measured profile
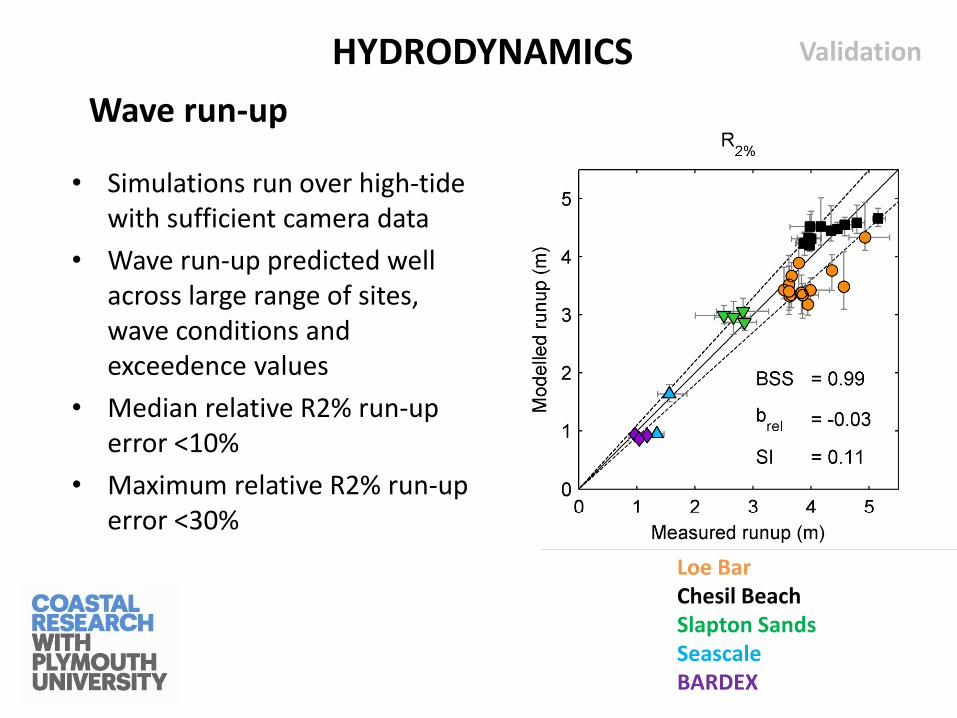
Wave run-up
Validation HYDRODYNAMICS
Loe Bar Chesil Beach Slapton Sands Seascale BARDEX
• Simulations run over high-tide with sufficient camera data
• Wave run-up predicted well across large range of sites, wave conditions and exceedence values
• Median relative R2% run-up error <10%
• Maximum relative R2% run-up error <30%
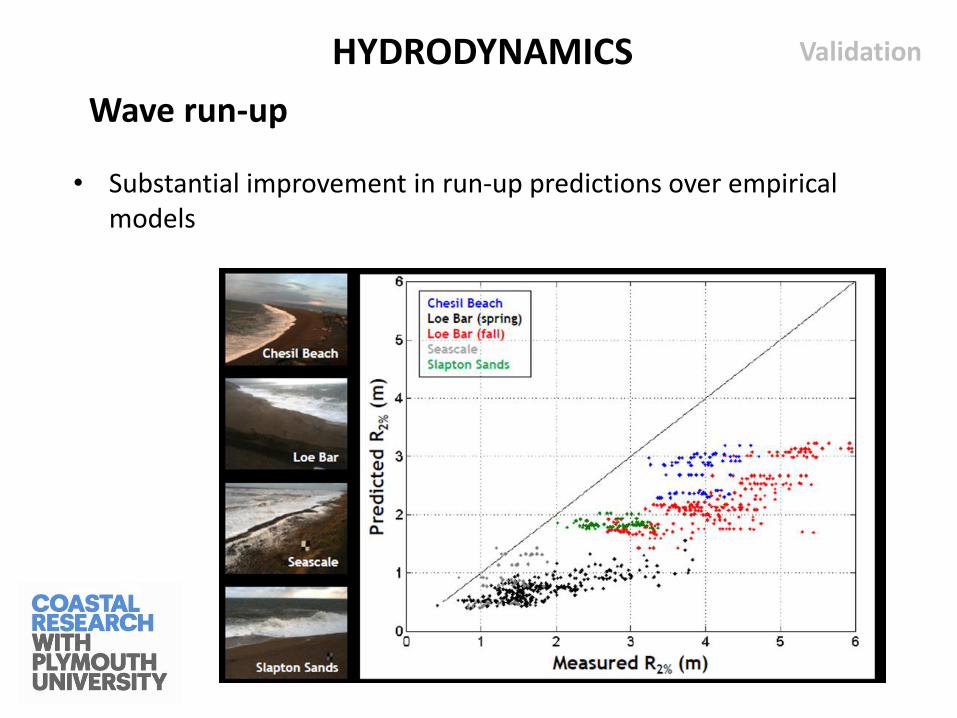
• Substantial improvement in run-up predictions over empirical models
Wave run-up
Validation HYDRODYNAMICS
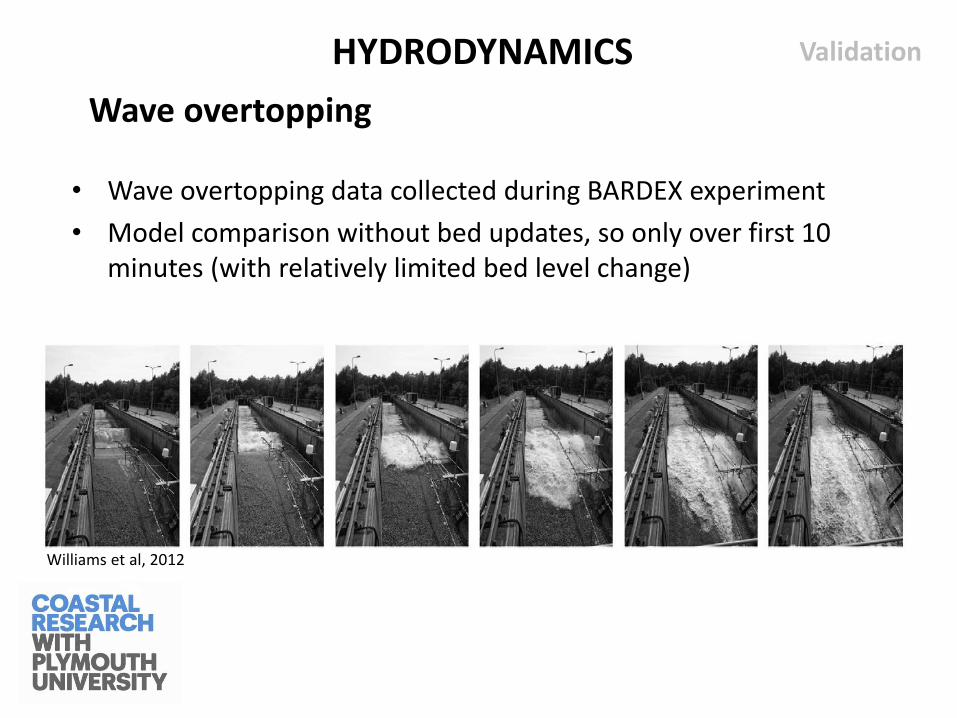
Wave overtopping
Validation HYDRODYNAMICS
• Wave overtopping data collected during BARDEX experiment
• Model comparison without bed updates, so only over first 10 minutes (with relatively limited bed level change)
Williams et al, 2012
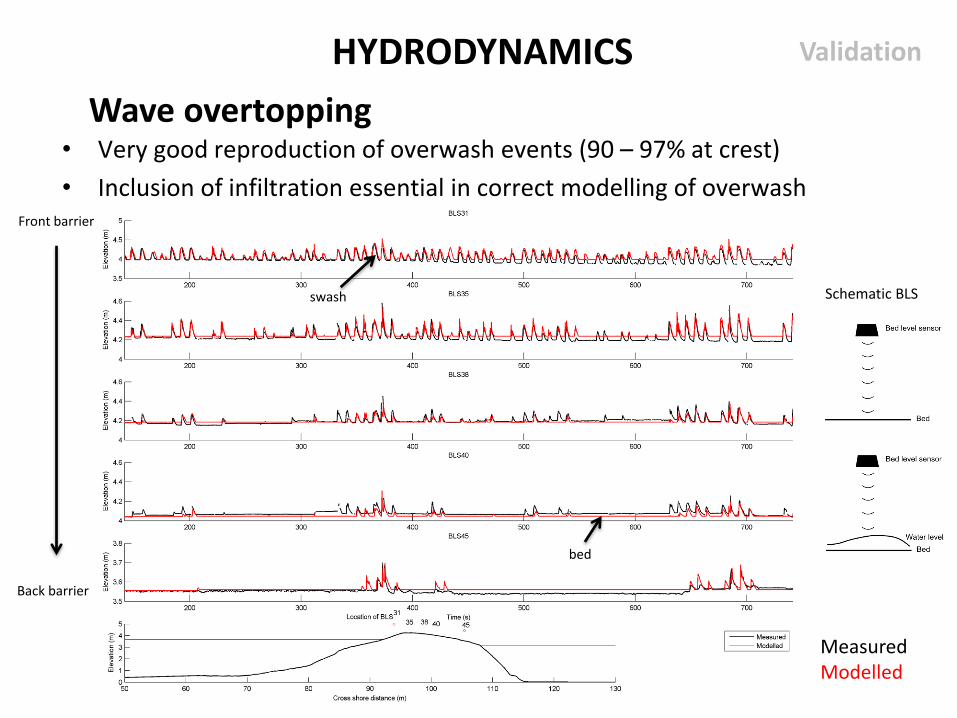
Wave overtopping
Validation HYDRODYNAMICS
Front barrier
Back barrier
Schematic BLS swash
bed
• Very good reproduction of overwash events (90 – 97% at crest)
• Inclusion of infiltration essential in correct modelling of overwash
Measured Modelled
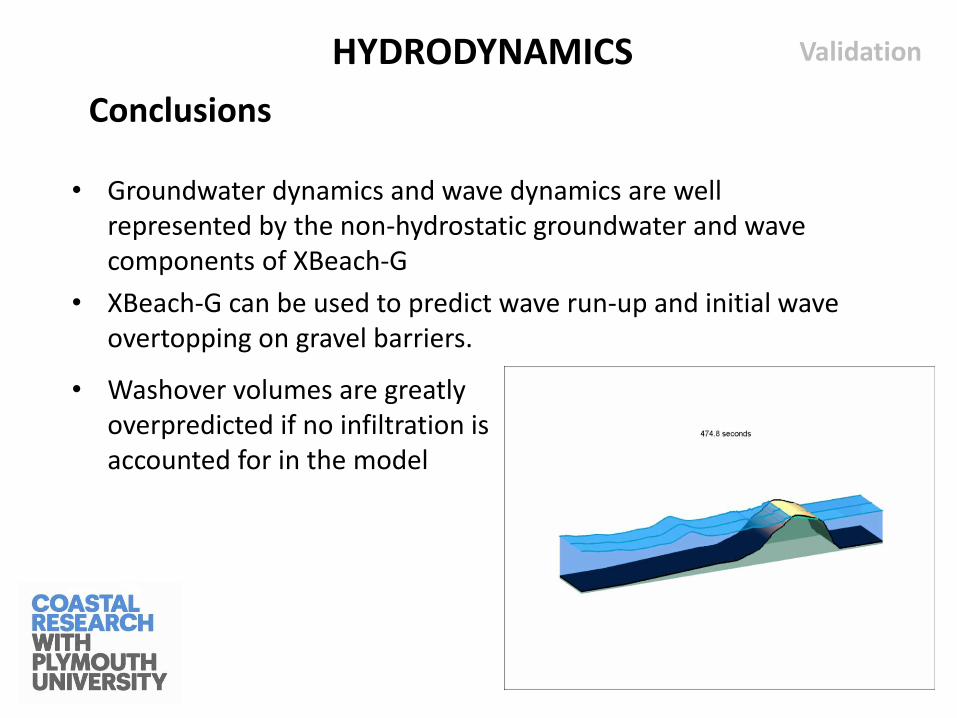
Conclusions
Validation HYDRODYNAMICS
• Groundwater dynamics and wave dynamics are well represented by the non-hydrostatic groundwater and wave components of XBeach-G
• XBeach-G can be used to predict wave run-up and initial wave overtopping on gravel barriers.
• Washover volumes are greatly overpredicted if no infiltration is accounted for in the model
Model application
HYDRODYNAMICS
Barrier Inertia Model
Application HYDRODYNAMICS
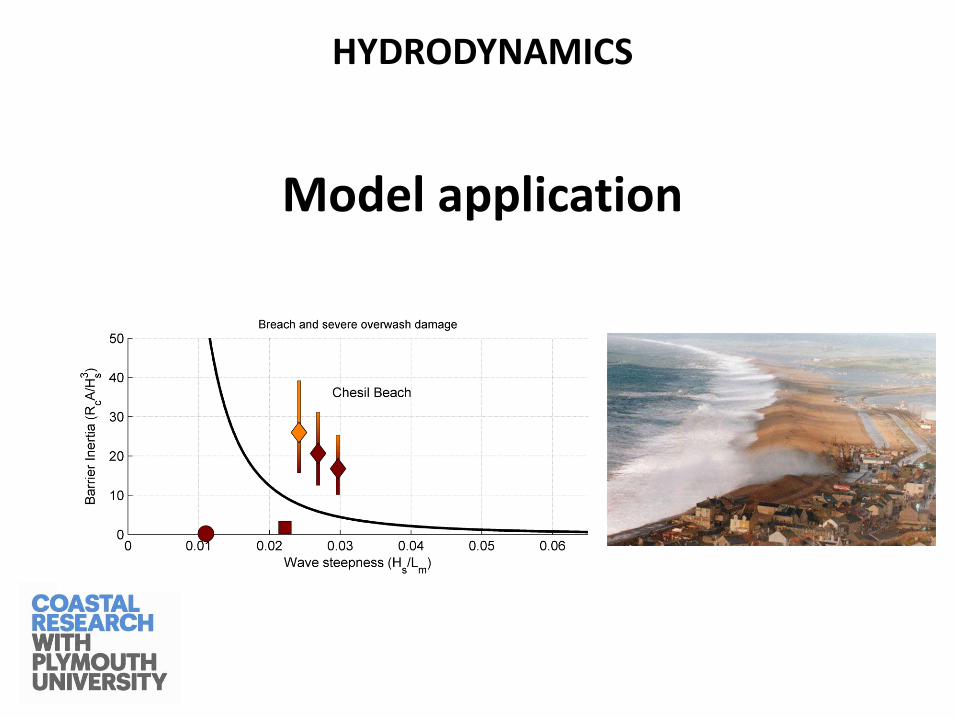
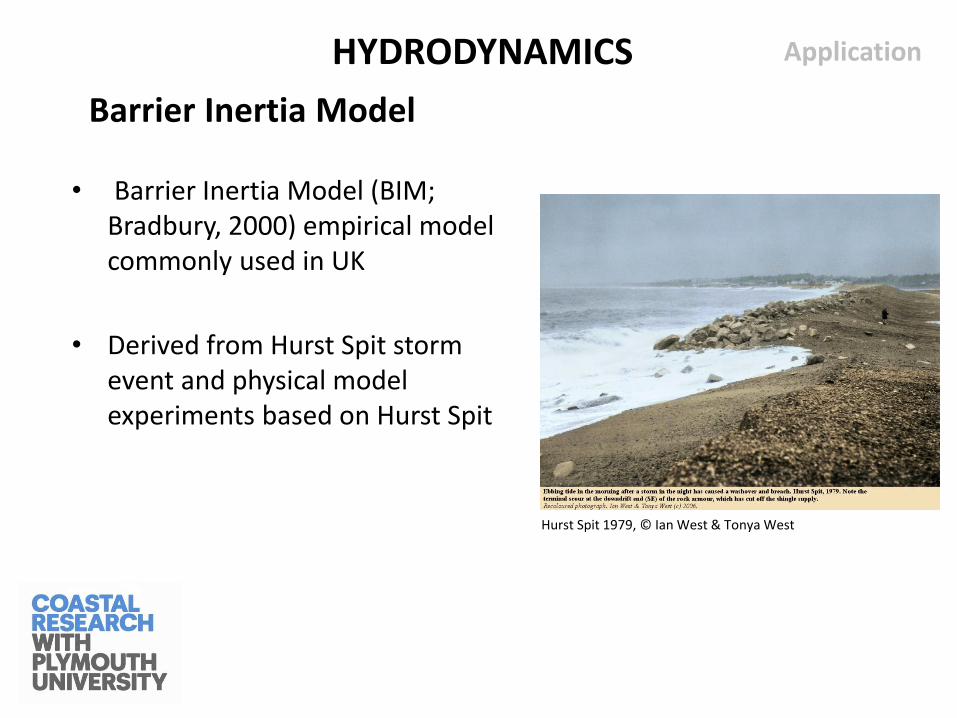
• Barrier Inertia Model (BIM; Bradbury, 2000) empirical model commonly used in UK
• Derived from Hurst Spit storm event and physical model experiments based on Hurst Spit
Hurst Spit 1979, © Ian West & Tonya West
Barrier Inertia Model
Application HYDRODYNAMICS
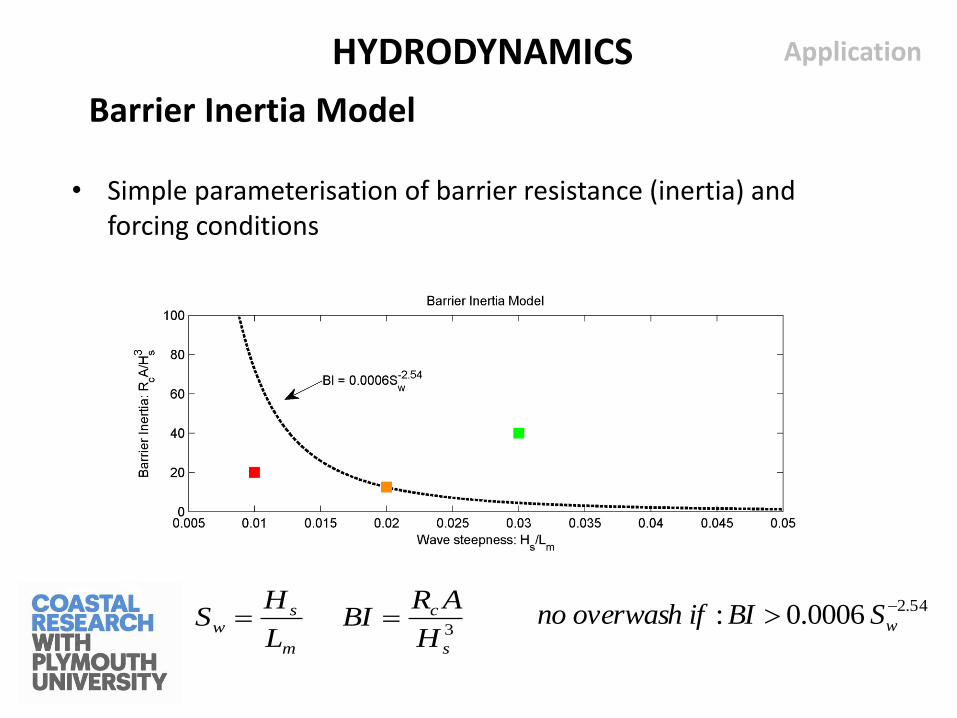
• Simple parameterisation of barrier resistance (inertia) and forcing conditions
3
s
c
m
sw
H
ARBI
L
HS
54.2 0006.0 : wSBIh ifno overwas
Barrier Inertia Model
Application HYDRODYNAMICS
• Assess differences between BIM and XBeach-G for data on which BIM is based, as well as on 24 other storm events on other gravel barriers
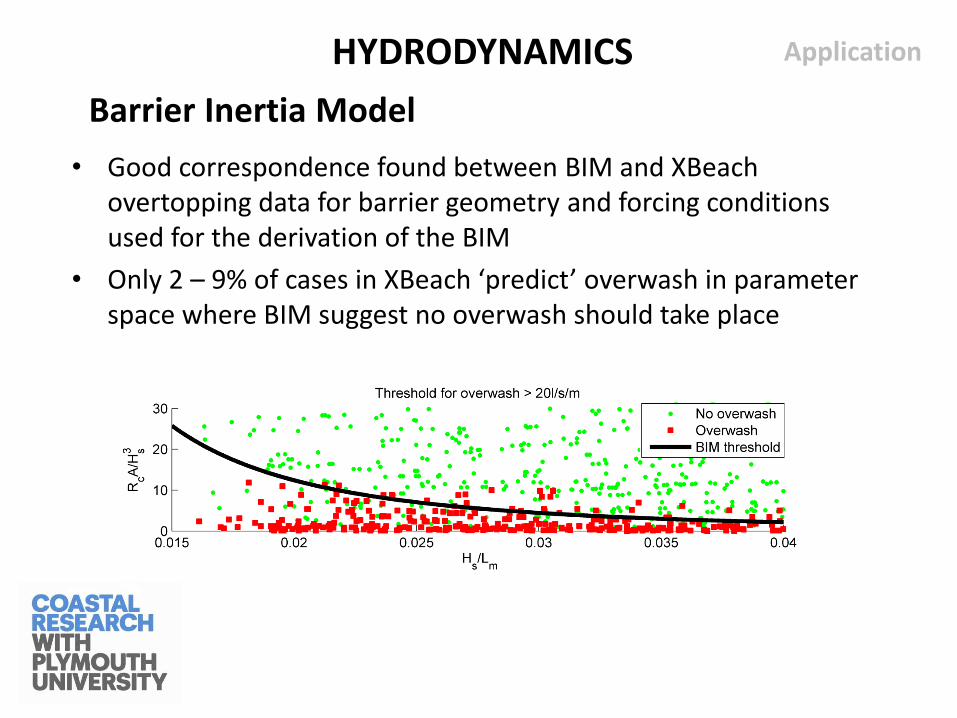
• Since model is hydrodynamic only, relation is assumed between hydrodynamic overtopping and overwash morphology (q>20l/s/m)
Barrier Inertia Model
Application HYDRODYNAMICS
• Good correspondence found between BIM and XBeach overtopping data for barrier geometry and forcing conditions used for the derivation of the BIM
• Only 2 – 9% of cases in XBeach ‘predict’ overwash in parameter space where BIM suggest no overwash should take place
Barrier Inertia Model
Application HYDRODYNAMICS
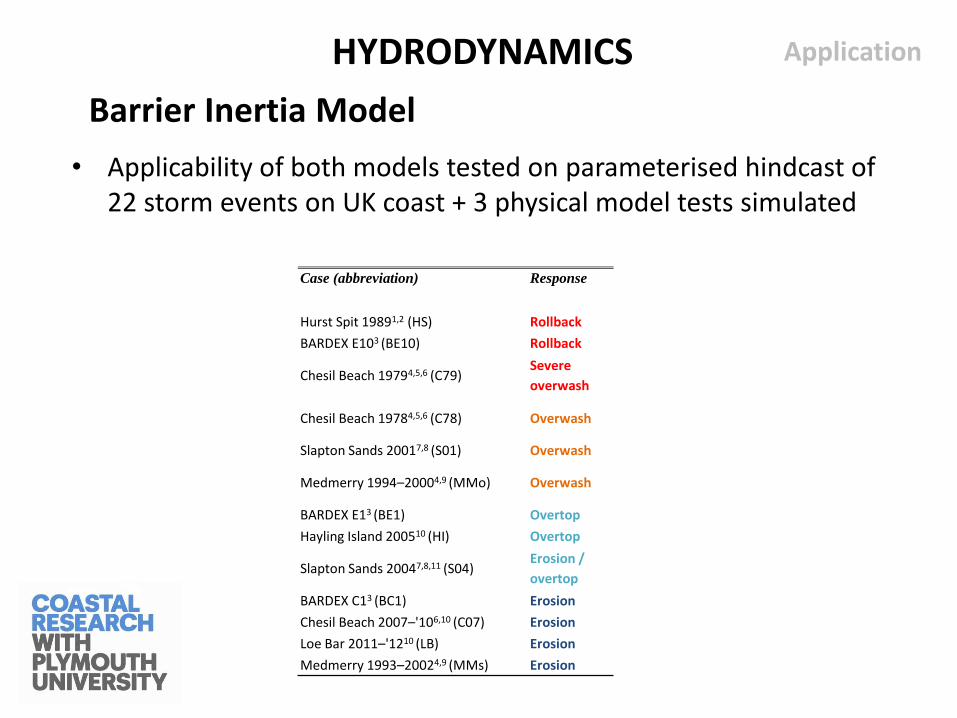
• Applicability of both models tested on parameterised hindcast of 22 storm events on UK coast + 3 physical model tests simulated
Case (abbreviation) Response
Hurst Spit 19891,2 (HS) Rollback
BARDEX E103 (BE10) Rollback
Chesil Beach 19794,5,6 (C79) Severe
overwash
Chesil Beach 19784,5,6 (C78) Overwash
Slapton Sands 20017,8 (S01) Overwash
Medmerry 1994–20004,9 (MMo) Overwash
BARDEX E13 (BE1) Overtop
Hayling Island 200510 (HI) Overtop
Slapton Sands 20047,8,11 (S04) Erosion /
overtop
BARDEX C13 (BC1) Erosion
Chesil Beach 2007–'106,10 (C07) Erosion
Loe Bar 2011–'1210 (LB) Erosion
Medmerry 1993–20024,9 (MMs) Erosion
Barrier Inertia Model
Application HYDRODYNAMICS
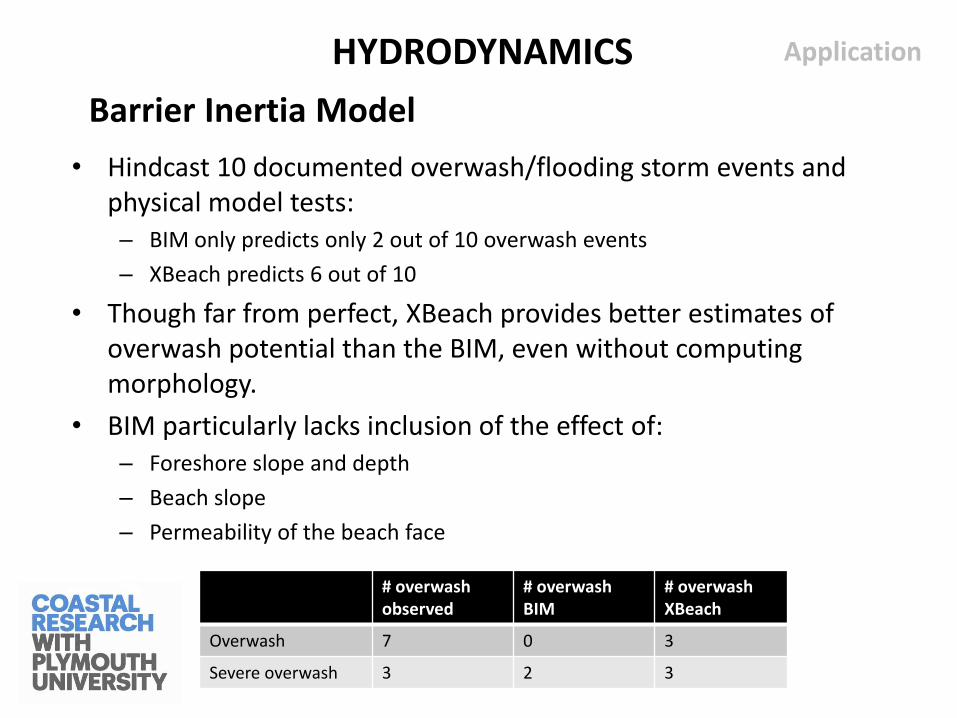
• Hindcast 10 documented overwash/flooding storm events and physical model tests: – BIM only predicts only 2 out of 10 overwash events
– XBeach predicts 6 out of 10
• Though far from perfect, XBeach provides better estimates of overwash potential than the BIM, even without computing morphology.
• BIM particularly lacks inclusion of the effect of: – Foreshore slope and depth
– Beach slope
– Permeability of the beach face
# overwash observed
# overwash BIM
# overwash XBeach
Overwash 7 0 3
Severe overwash 3 2 3
• Background • XBeach • XBeach-G
• Model hydrodynamics • Model description • Model validation • Model application
• Model morphodynamics • Model description • Model results and sensitivity
CONTENTS
Model description
MORPHODYNAMICS
Basic equations
Description
• Depth-average (intra-wave) currents are used as input in the free stream velocity
• Parameterisation of the boundary layer velocity to compute velocity at the bed
• Velocity at the bed used to compute Shields value
• Modification of Meyer-Peter-Müller transport equation predicts bed load transport rate
• Steep slopes collapse if they exceed the angle of repose
• No suspended sediment transport (yet?)
MORPHODYNAMICS
Computing sediment transport
Description
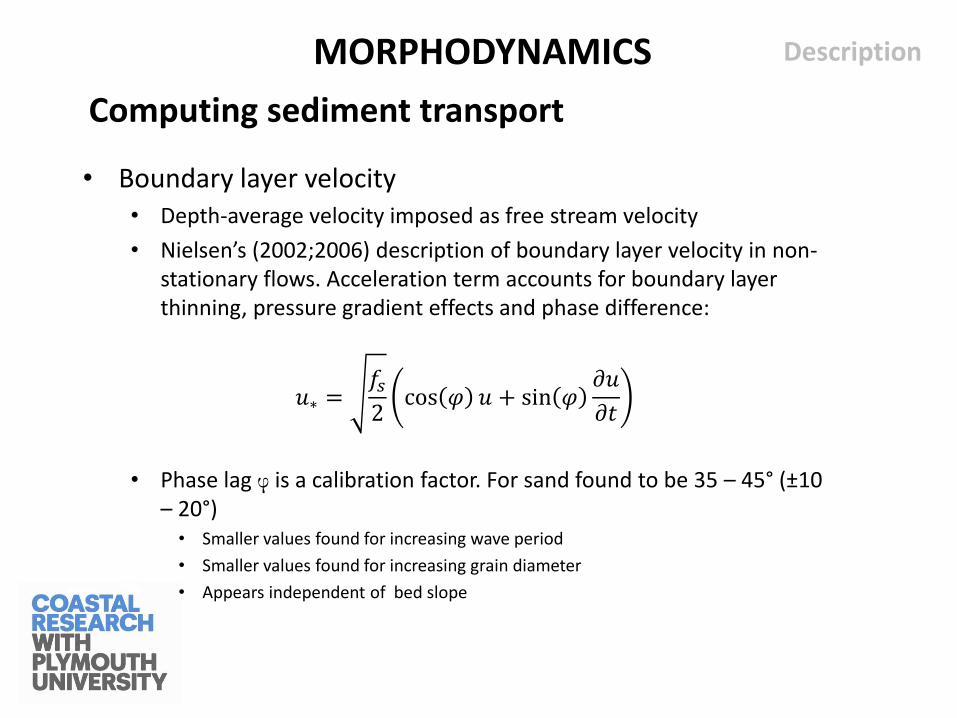
• Boundary layer velocity • Depth-average velocity imposed as free stream velocity
• Nielsen’s (2002;2006) description of boundary layer velocity in non-stationary flows. Acceleration term accounts for boundary layer thinning, pressure gradient effects and phase difference:
• Phase lag φ is a calibration factor. For sand found to be 35 – 45° (±10 – 20°) • Smaller values found for increasing wave period
• Smaller values found for increasing grain diameter
• Appears independent of bed slope
MORPHODYNAMICS
𝑢∗ =𝑓𝑠2
cos 𝜑 𝑢 + sin 𝜑𝜕𝑢
𝜕𝑡
Computing sediment transport
Description
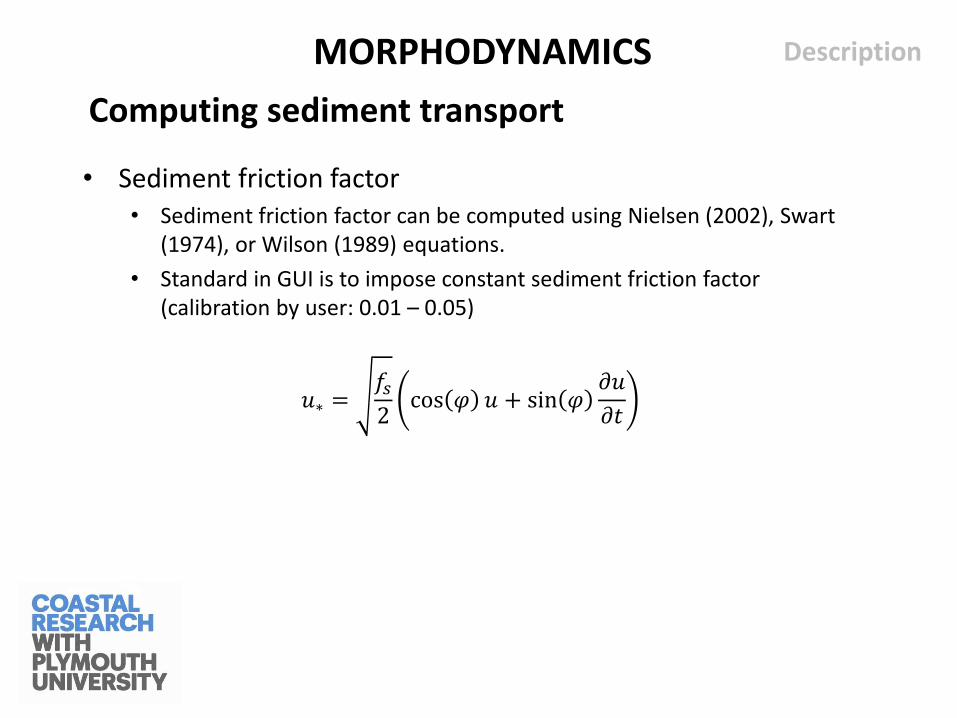
• Sediment friction factor • Sediment friction factor can be computed using Nielsen (2002), Swart
(1974), or Wilson (1989) equations.
• Standard in GUI is to impose constant sediment friction factor (calibration by user: 0.01 – 0.05)
MORPHODYNAMICS
𝑢∗ =𝑓𝑠2
cos 𝜑 𝑢 + sin 𝜑𝜕𝑢
𝜕𝑡
Computing sediment transport
Description
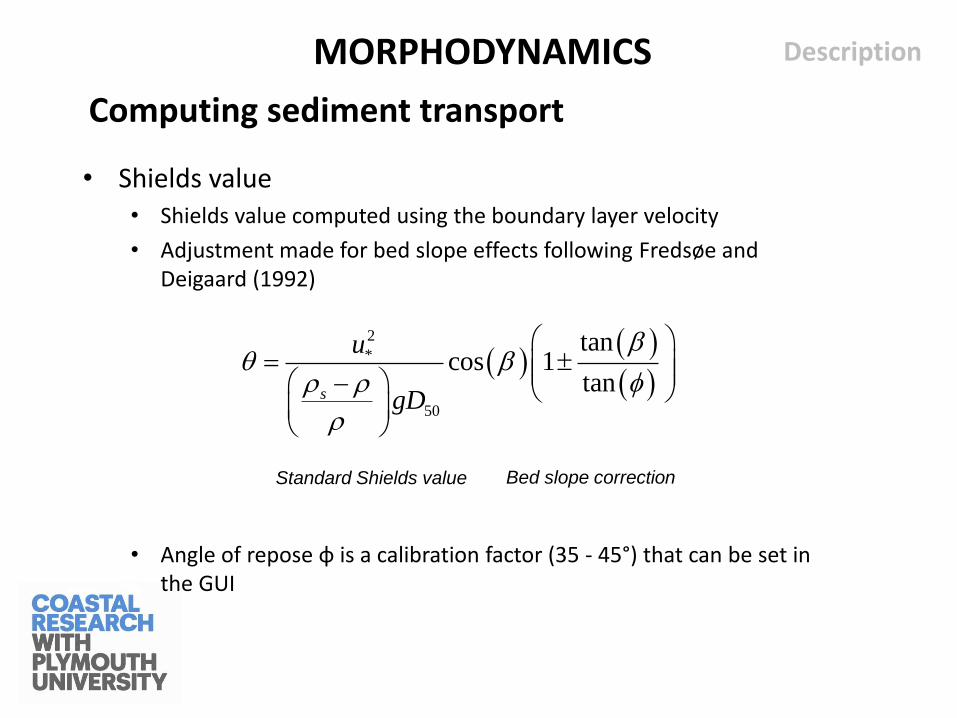
• Shields value • Shields value computed using the boundary layer velocity
• Adjustment made for bed slope effects following Fredsøe and Deigaard (1992)
• Angle of repose φ is a calibration factor (35 - 45°) that can be set in the GUI
MORPHODYNAMICS
2
*
50
tancos 1
tans
u
gD
Bed slope correction Standard Shields value
Computing sediment transport
Description
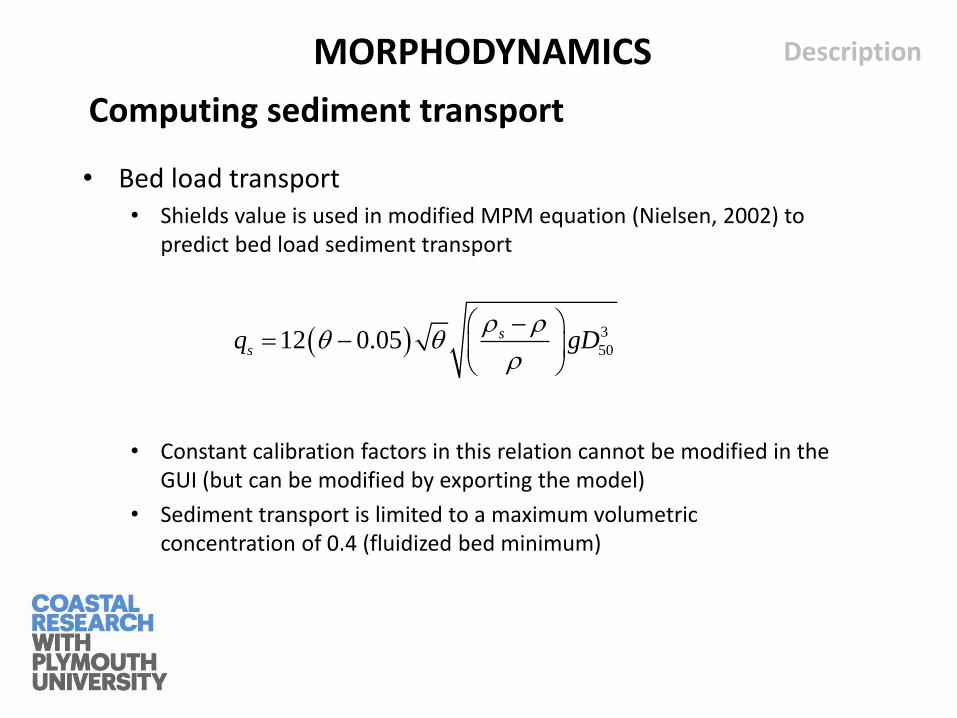
• Bed load transport • Shields value is used in modified MPM equation (Nielsen, 2002) to
predict bed load sediment transport
• Constant calibration factors in this relation cannot be modified in the GUI (but can be modified by exporting the model)
• Sediment transport is limited to a maximum volumetric concentration of 0.4 (fluidized bed minimum)
MORPHODYNAMICS
3
5012 0.05 ssq gD
Computing bed level change
Description
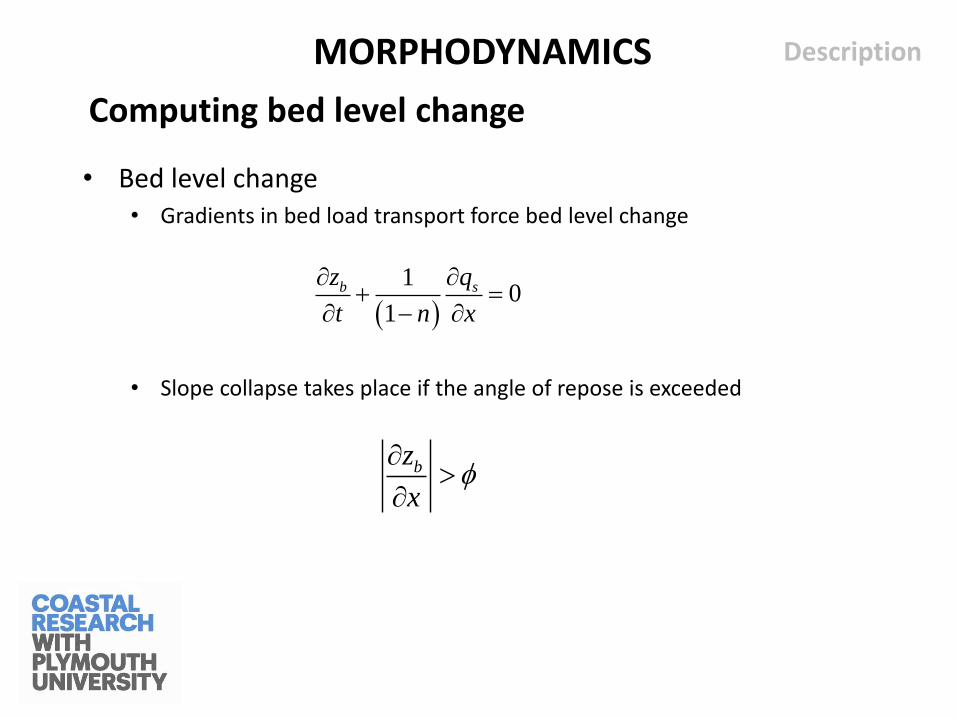
• Bed level change • Gradients in bed load transport force bed level change
• Slope collapse takes place if the angle of repose is exceeded
MORPHODYNAMICS
1
01
b sz q
t n x
bz
x
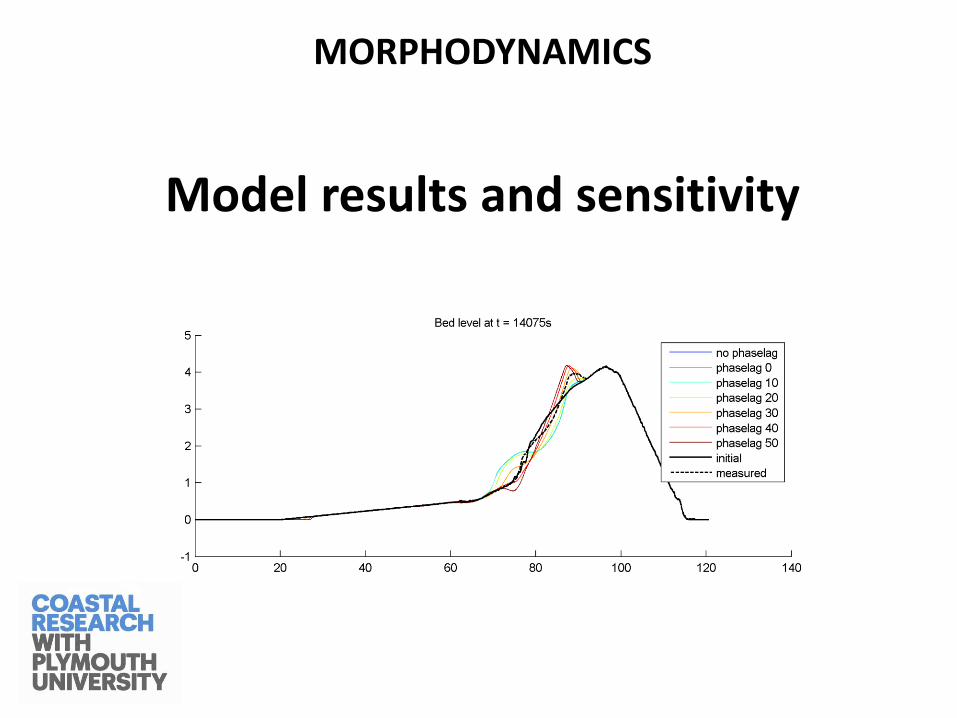
Model results and sensitivity
MORPHODYNAMICS
Model comparisons
Description
• Berm-building conditions during BARDEX
• Berm-eroding / crest build-up during BARDEX
• Overtopping / overwash during BARDEX
• Beach erosion at Slapton (Oct. 2013)
• Beach erosion at Chesil (Feb. 2014)
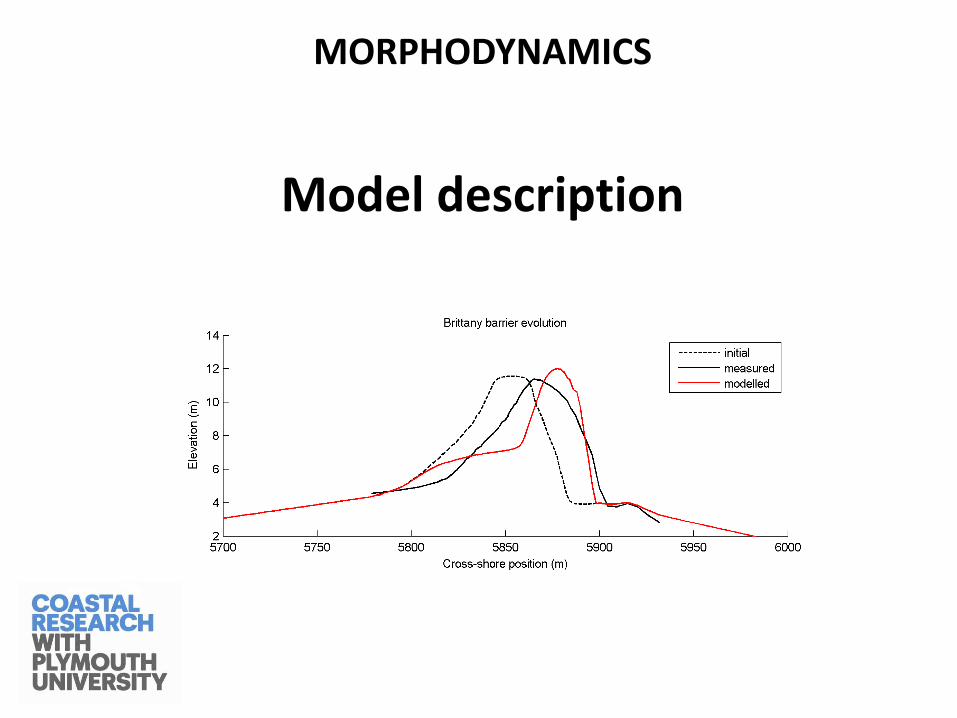
• Barrier roll-over at Sillon de Talbert spit, Brittany (Mar. 2008)
MORPHODYNAMICS
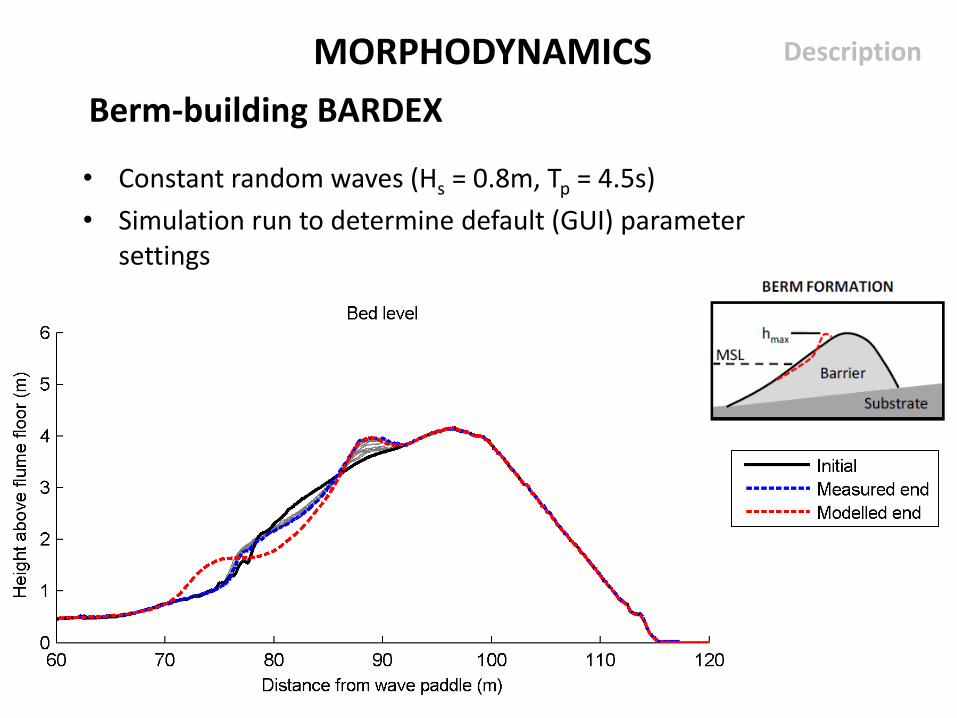
Berm-building BARDEX
Description
• Constant random waves (Hs = 0.8m, Tp = 4.5s)
• Simulation run to determine default (GUI) parameter settings
MORPHODYNAMICS
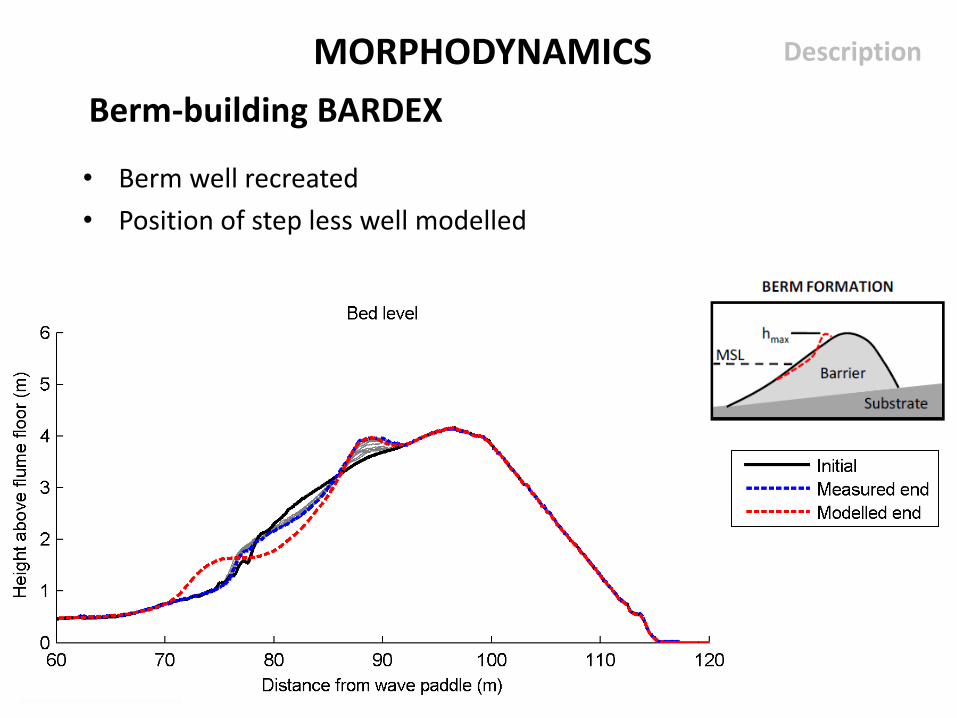
Berm-building BARDEX
Description
• Berm well recreated
• Position of step less well modelled
MORPHODYNAMICS
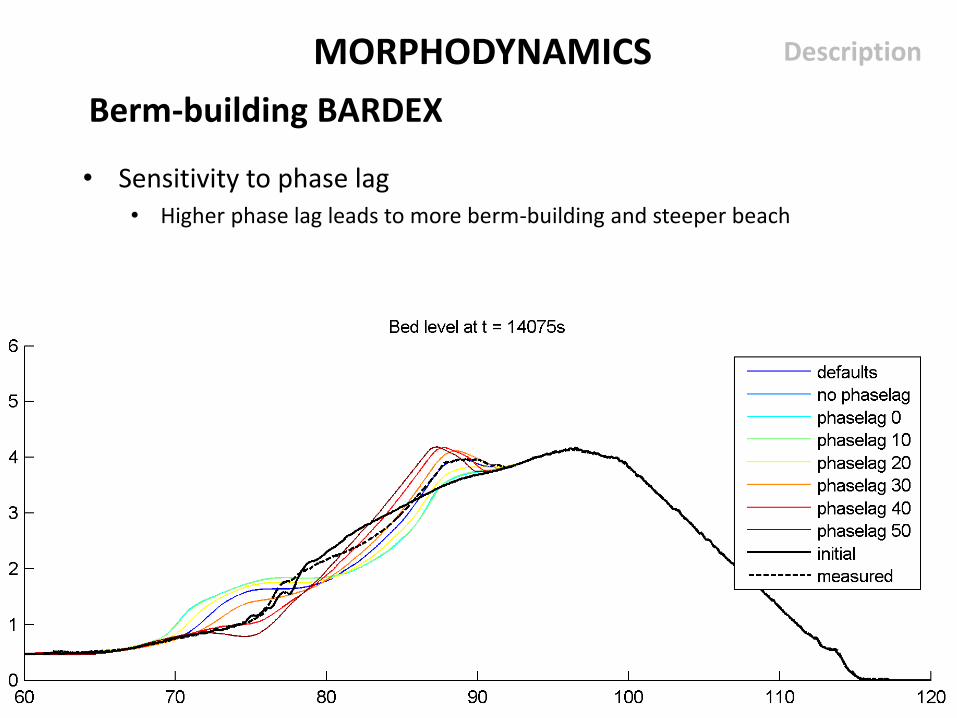
Berm-building BARDEX
Description
• Sensitivity to phase lag • Higher phase lag leads to more berm-building and steeper beach
MORPHODYNAMICS
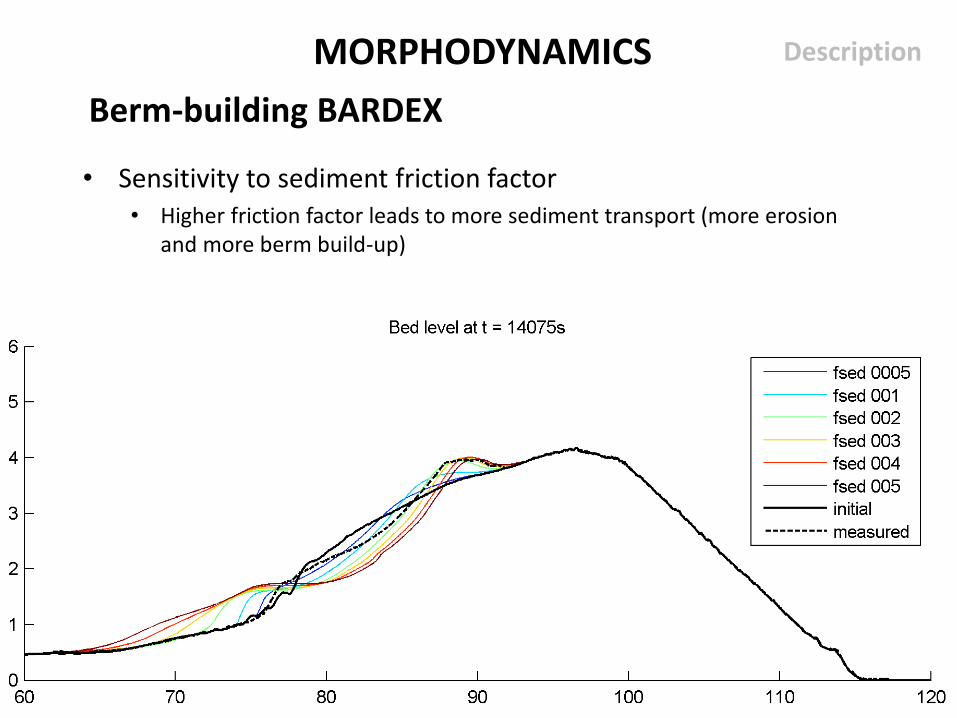
Berm-building BARDEX
Description
• Sensitivity to sediment friction factor • Higher friction factor leads to more sediment transport (more erosion
and more berm build-up)
MORPHODYNAMICS
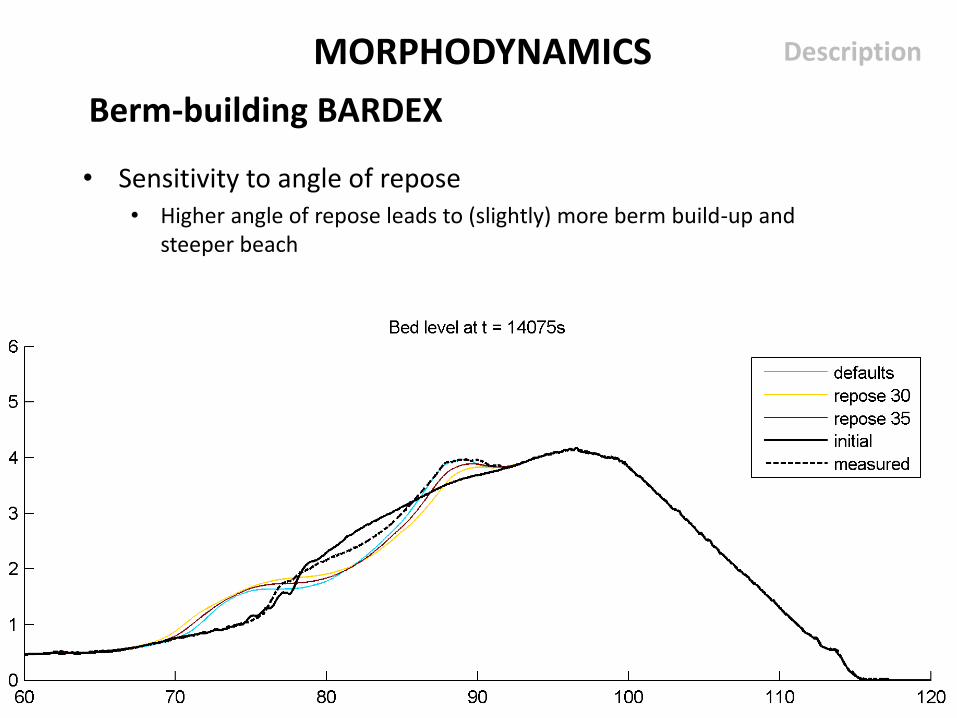
Berm-building BARDEX
Description
• Sensitivity to angle of repose • Higher angle of repose leads to (slightly) more berm build-up and
steeper beach
MORPHODYNAMICS
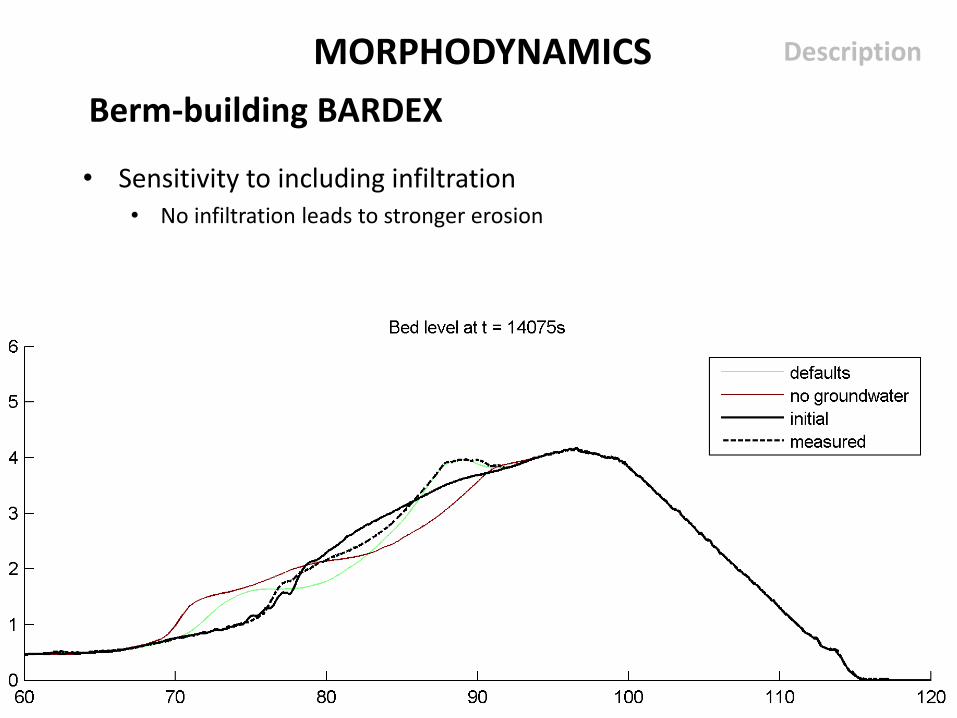
Berm-building BARDEX
Description
• Sensitivity to including infiltration • No infiltration leads to stronger erosion
MORPHODYNAMICS
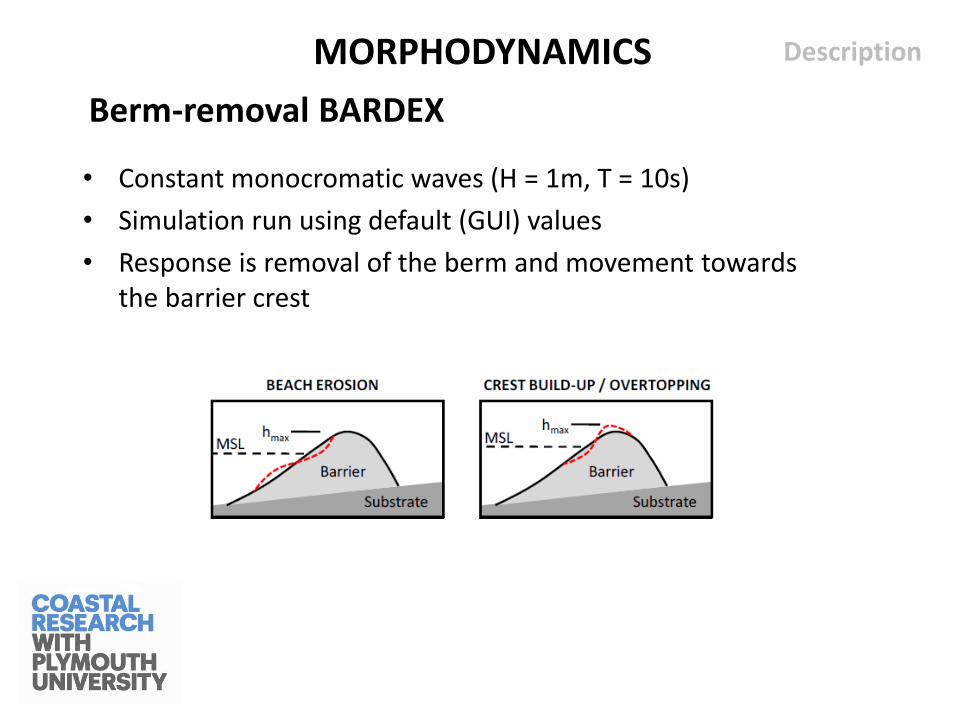
Berm-removal BARDEX
Description
• Constant monocromatic waves (H = 1m, T = 10s)
• Simulation run using default (GUI) values
• Response is removal of the berm and movement towards the barrier crest
MORPHODYNAMICS
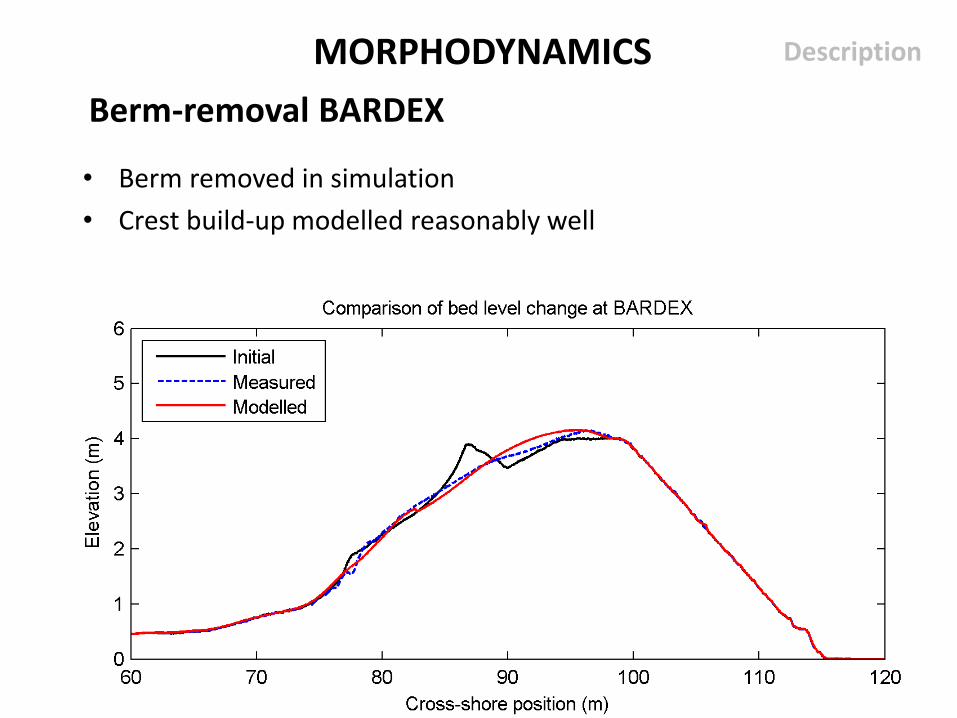
Berm-removal BARDEX
Description
• Berm removed in simulation
• Crest build-up modelled reasonably well
MORPHODYNAMICS
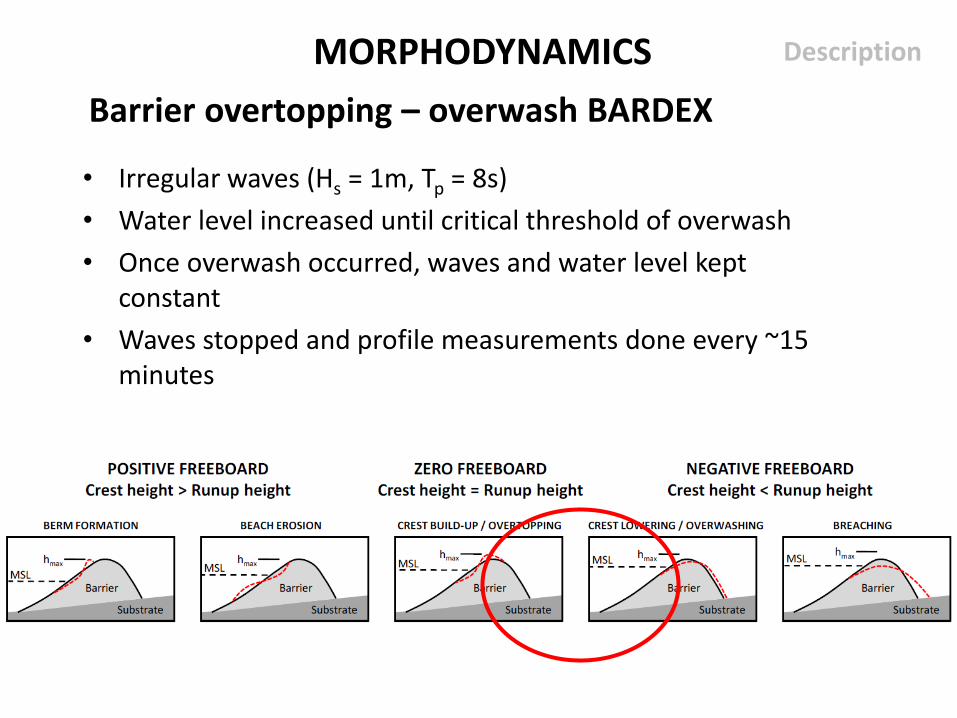
Barrier overtopping – overwash BARDEX
Description
• Irregular waves (Hs = 1m, Tp = 8s)
• Water level increased until critical threshold of overwash
• Once overwash occurred, waves and water level kept constant
• Waves stopped and profile measurements done every ~15 minutes
MORPHODYNAMICS
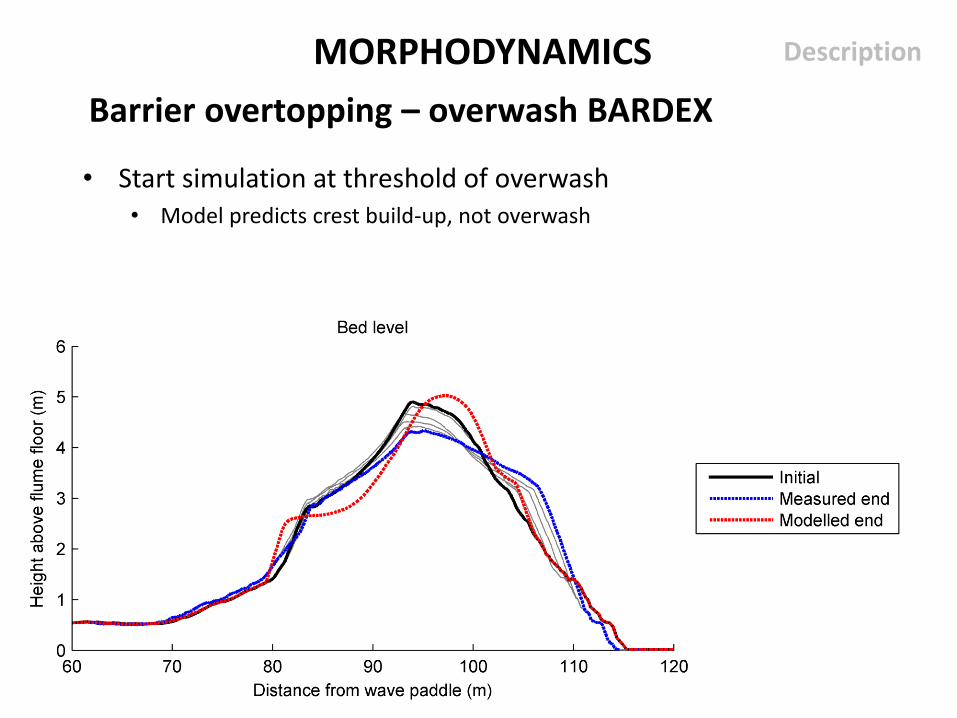
Barrier overtopping – overwash BARDEX
Description
• Start simulation at threshold of overwash • Model predicts crest build-up, not overwash
MORPHODYNAMICS
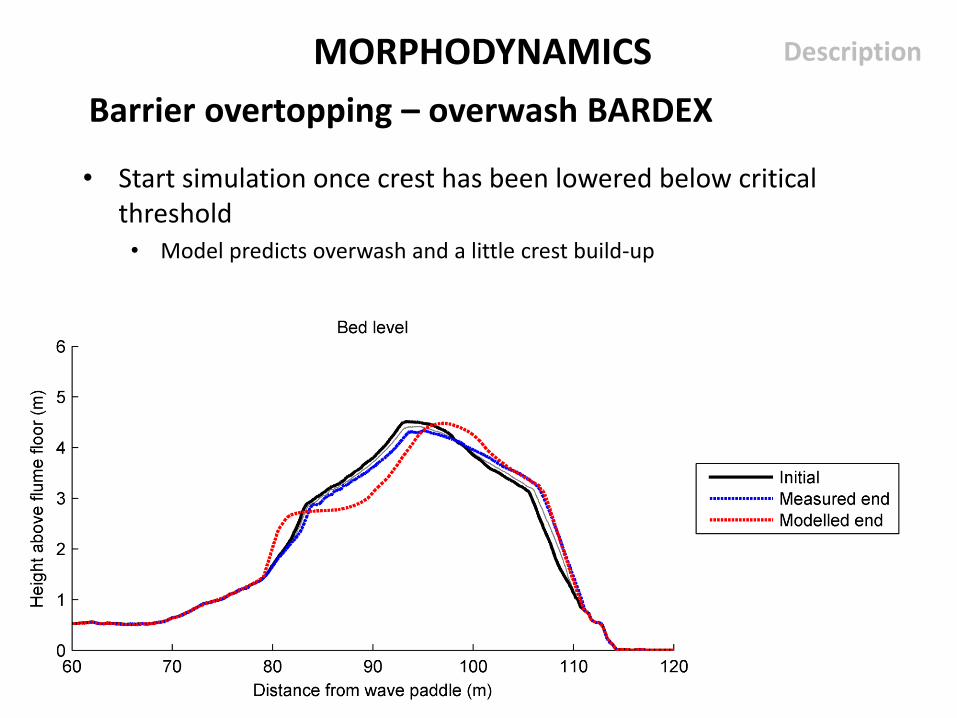
Barrier overtopping – overwash BARDEX
Description
• Start simulation once crest has been lowered below critical threshold • Model predicts overwash and a little crest build-up
MORPHODYNAMICS
Barrier overtopping – overwash BARDEX
Description
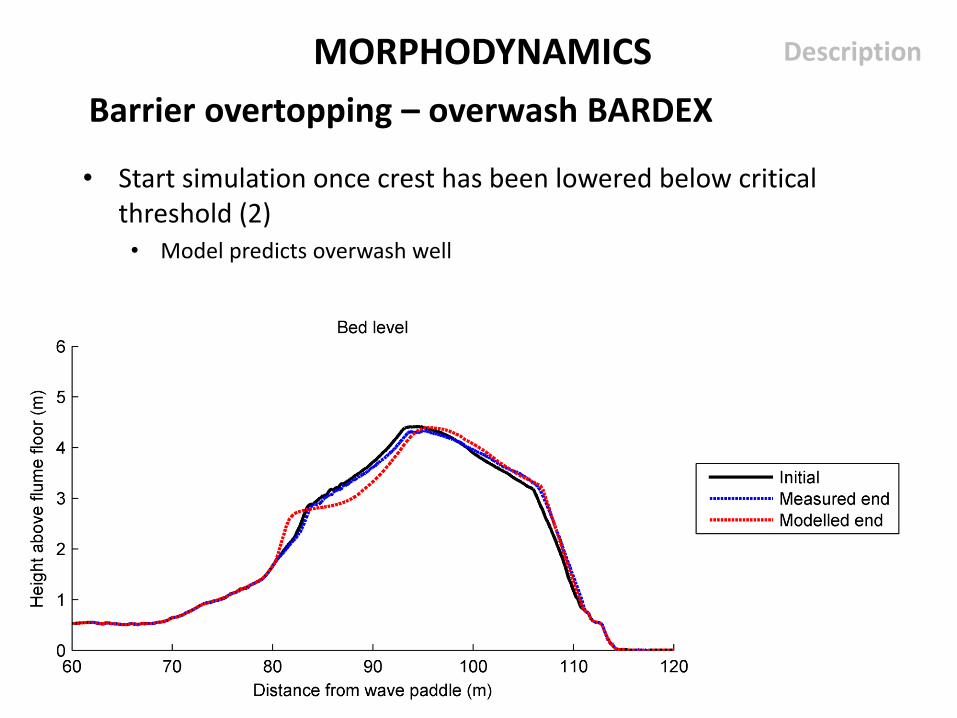
• Start simulation once crest has been lowered below critical threshold (2) • Model predicts overwash well
MORPHODYNAMICS
BARDEX conclusions
Description
• XBeach-G can predict and model the build-up and removal of berms reasonably well
• XBeach-G can predict barrier overwash reasonably well if there is significant overwash
• The transition from overtopping to overwash is very sensitive in the model • Expected to improve through model development and better
parameter calibration
• XBeach-G is very sensitive to the selection of the phase lag and the sediment friction factor
MORPHODYNAMICS
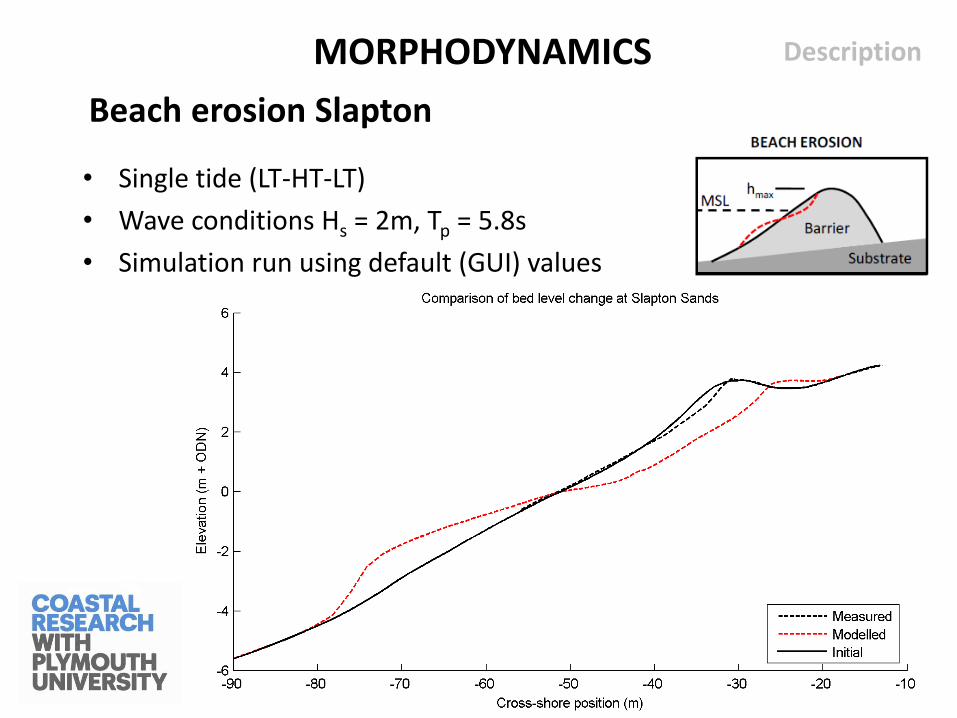
Beach erosion Slapton
Description
• Single tide (LT-HT-LT)
• Wave conditions Hs = 2m, Tp = 5.8s
• Simulation run using default (GUI) values
MORPHODYNAMICS
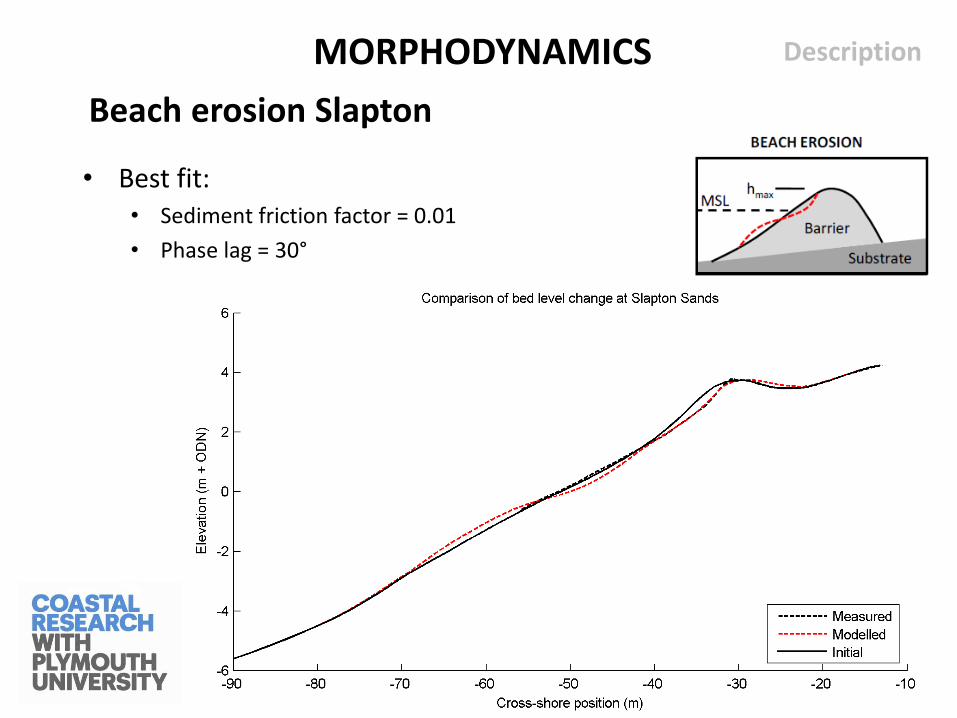
Beach erosion Slapton
Description
• Best fit: • Sediment friction factor = 0.01
• Phase lag = 30°
MORPHODYNAMICS
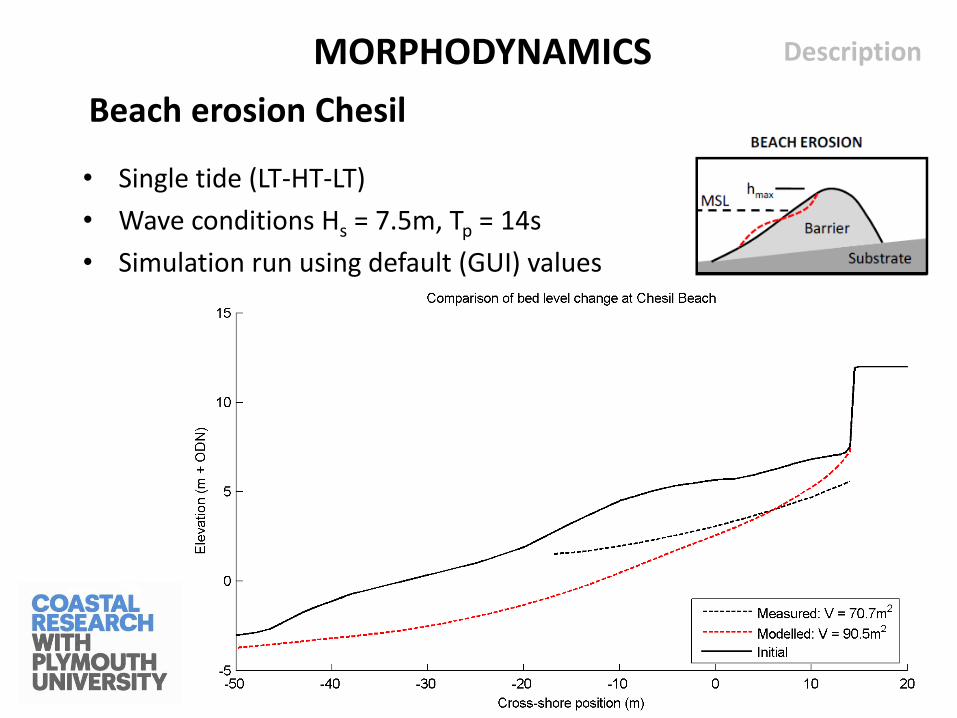
Beach erosion Chesil
Description
• Single tide (LT-HT-LT)
• Wave conditions Hs = 7.5m, Tp = 14s
• Simulation run using default (GUI) values
MORPHODYNAMICS
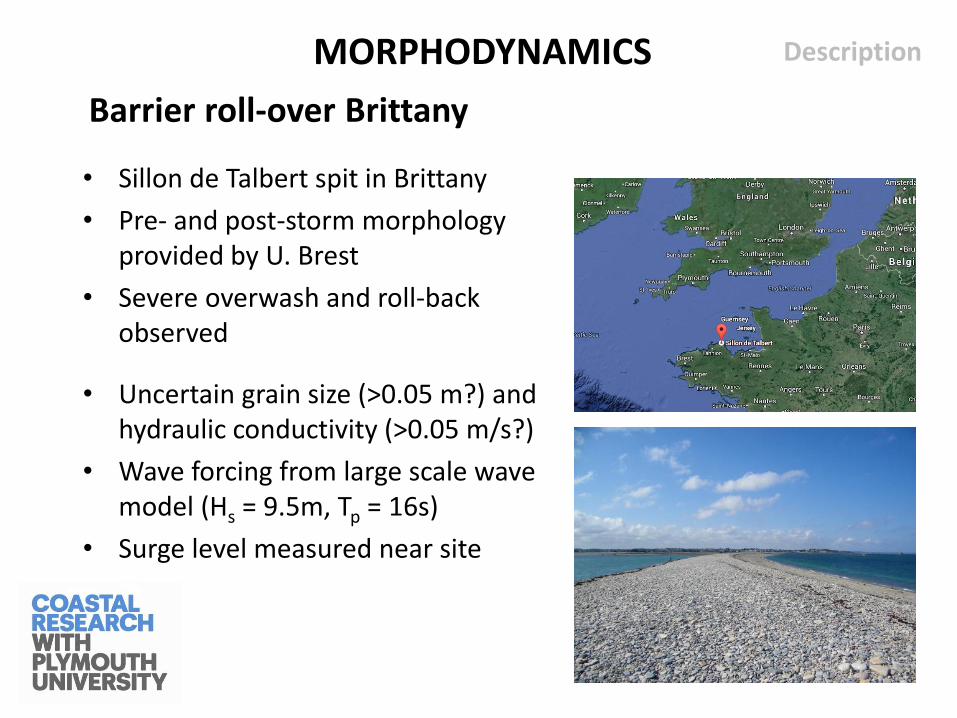
Barrier roll-over Brittany
Description
• Sillon de Talbert spit in Brittany
• Pre- and post-storm morphology provided by U. Brest
• Severe overwash and roll-back observed
• Uncertain grain size (>0.05 m?) and hydraulic conductivity (>0.05 m/s?)
• Wave forcing from large scale wave model (Hs = 9.5m, Tp = 16s)
• Surge level measured near site
MORPHODYNAMICS
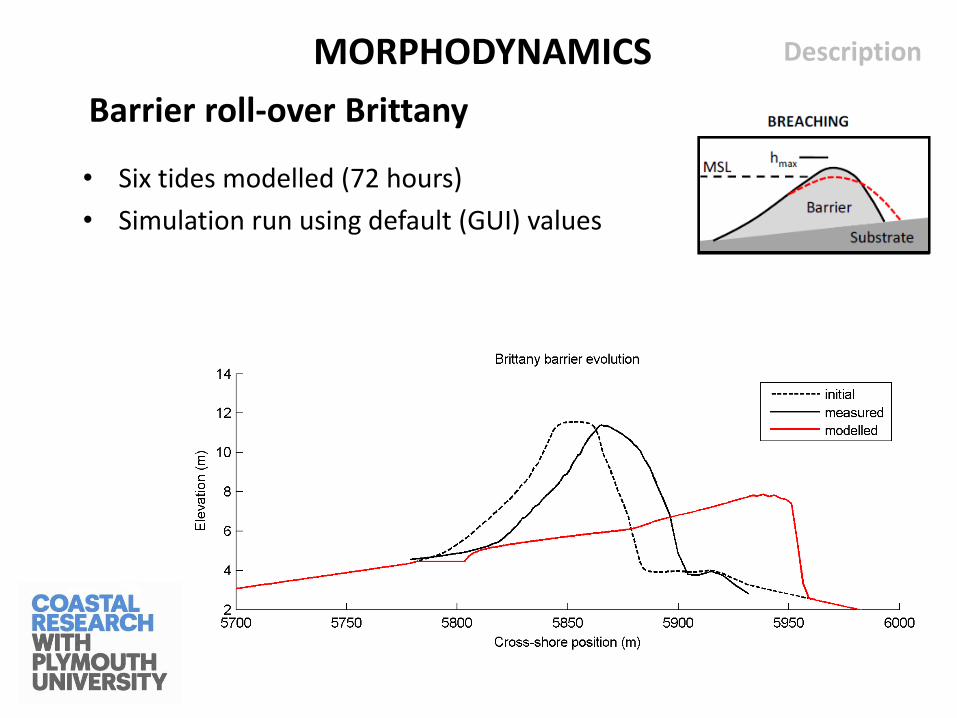
Barrier roll-over Brittany
Description
• Six tides modelled (72 hours)
• Simulation run using default (GUI) values
MORPHODYNAMICS
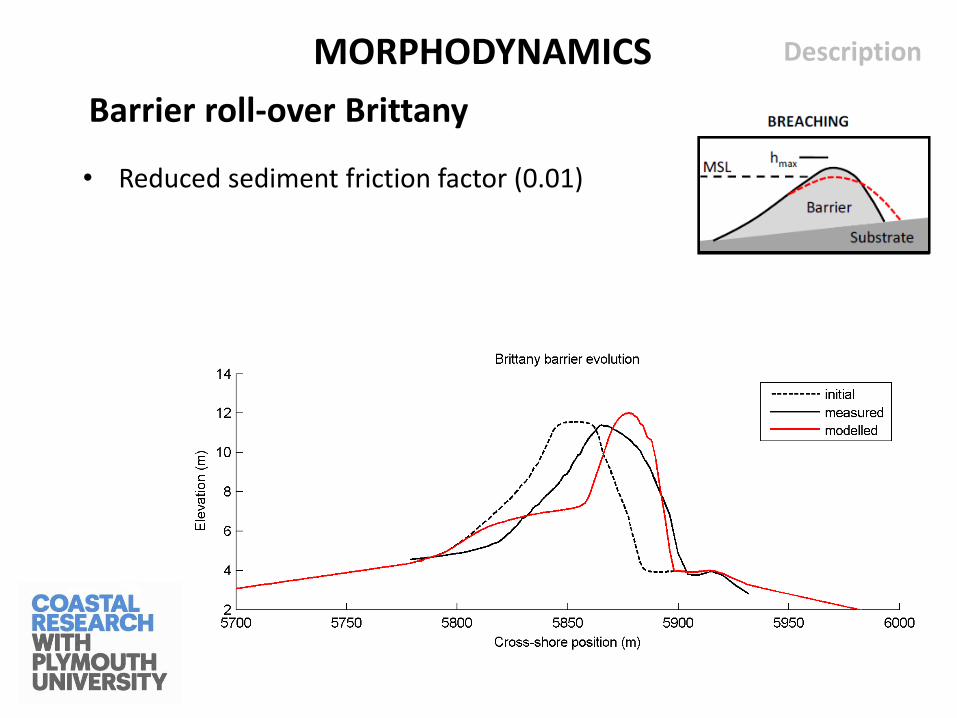
Barrier roll-over Brittany
Description
• Reduced sediment friction factor (0.01)
MORPHODYNAMICS
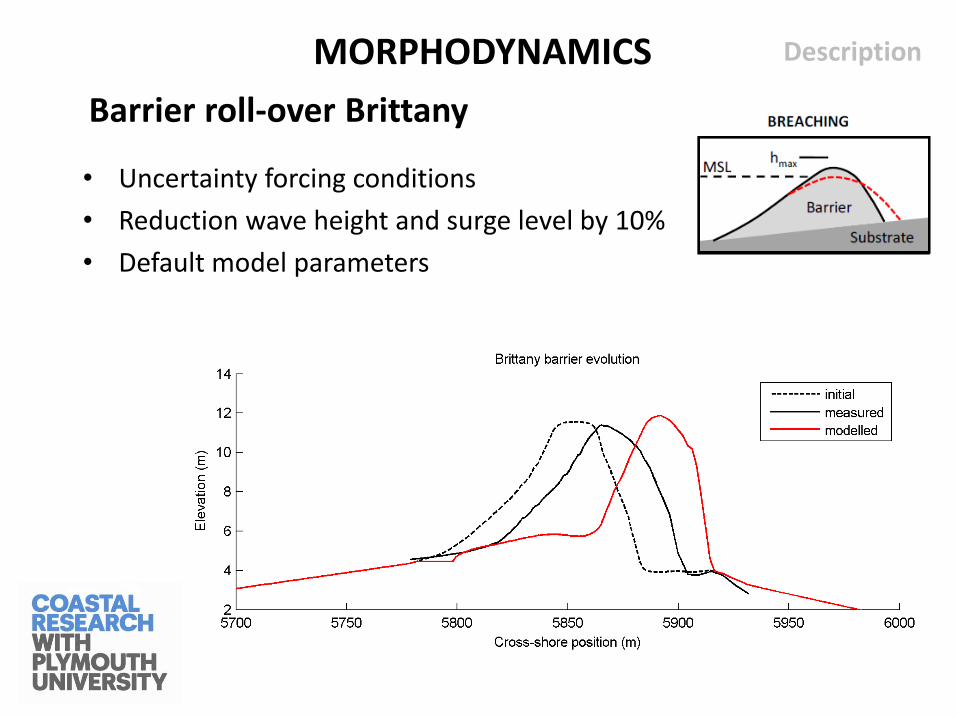
Barrier roll-over Brittany
Description
• Uncertainty forcing conditions
• Reduction wave height and surge level by 10%
• Default model parameters
MORPHODYNAMICS
Field site conclusions
Description
• XBeach-G can predict beach and barrier morphology in qualitative sense using default parameters • Field cases did not include situation of limited overtopping. This may
still be incorrectly predicted, as in the BARDEX simulations
• Quantitative prediction of morphological change requires calibration of sediment transport parameters.
• All field sites had lower optimal value for sediment friction factor than the BARDEX simulations.
MORPHODYNAMICS