Embed Size (px)
Citation preview
(WRE #328)TECHNICAL PUBLICATION 95-03
COMPUTATION OFFLOW-THROUGH WATER CONTROL STRUCTURES
by
Jose' Maria Otero, P.E.
September, 1995
Hydrologic Data Management DivisionWater Resources Evaluation DepartmentSouth Florida Water Management District
West Palm Beach, Florida
EXECUTIVE SUMMARY
This publication details the procedures used in the discharge computation (Flow)computer program for calculating discharge through water control structuresoperated by the South Florida Water Management District. The Flow program,which is maintained by the Hydrologic Data Management Division, calculatesdischarge for more than 200 structures in the Kissimmee-Okeechobee-Evergladescanal and water body network. The discharge computations performed by the Flowprogram are averaged into daily values and stored in DBHYDRO, the District'shydrologic database. Daily flow values stored in DBHYDRO are used by District staff;by local, state and federal agencies; and by companies involved in environmentaland water resources projects in South Florida.
In 1985, Andrew Fan documented the discharge computation for gated culverts.Other procedures have been partially documented utilizing comment linesintermixed with the source code of the Flow program. Outside the District,procedures for discharge computation of various types of water control structuresare found scattered throughout the literature. However, a comprehensivedocument which addresses discharge computation for all types of water controlstructures operated by the District is not found. This document addresses dischargecomputation for pumps, gated spillways, weirs, gated culverts, flumes andunregulated open channel reaches.
FLOW PROGRAM
Flow equations in the Flow program are mostly a function of the upstream stage, thedownstream stage, and the level of control (e.g., gate opening). Flow equations forall control structures, including the various flow regimes that occur at each structure,are presented here. The coefficients, parameters, exponents, logical flags, andvariables in each equation are explained. For flow calculations which requiremultiple equations, the relationship between the equations is outlined.
The information pertaining to each structure include the physical characteristics ofthe structure and the calibration coefficients, parameters, and exponents for theequations. The Flow program retrieves this information by querying DBHYDRO.
An input file must be provided to the Flow program. Each input record in the inputfile contains a structure identifier, the date and time, the upstream stage, thedownstream stage, the number of devices in the structure, and the value for thelevel of control in each device. Qualifying tags may accompany the stage andcontrol values. For example, an "E" tag accompanies a value which is estimated.
An output file is produced by the Flow program and includes one output record forevery input record. Each output record contains a structure identifier, the date and
time, and the resulting discharge. A qualifying tag may be attached to the dischargevalue, if warranted, based upon the input record tags.
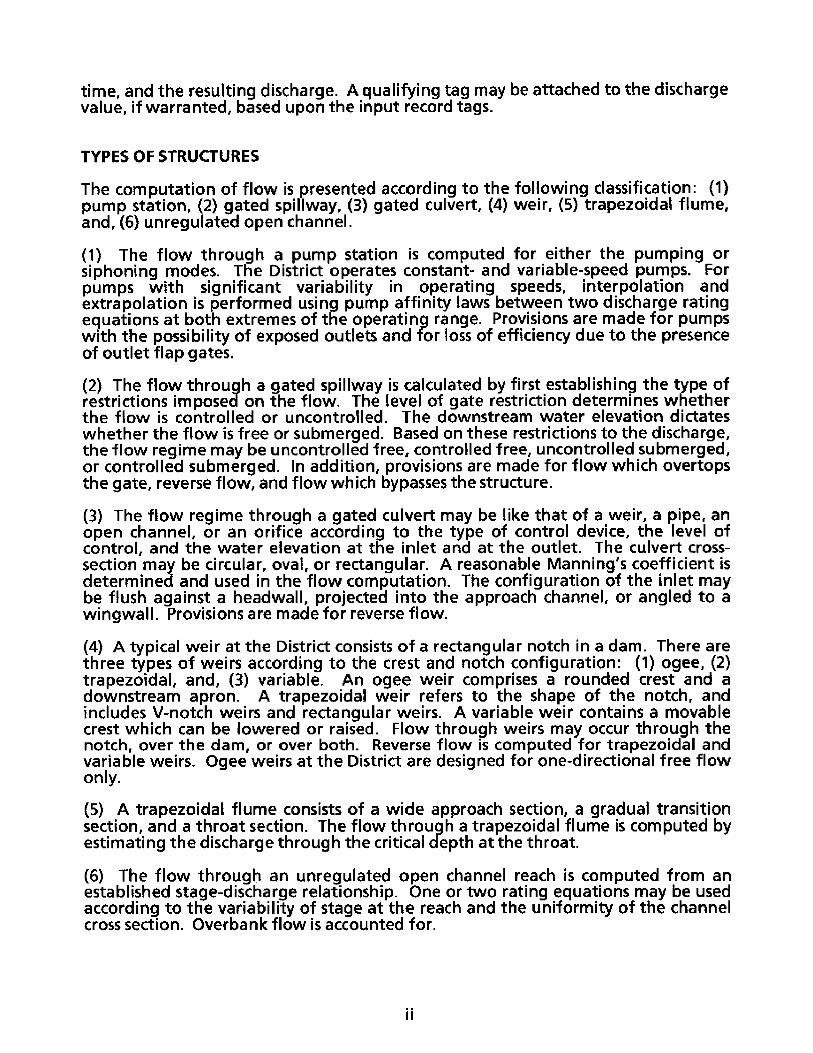
TYPES OF STRUCTURES
The computation of flow is presented according to the following classification: (1)pump station, (2) gated spillway, (3) gated culvert, (4) weir, (5) trapezoidal flume,and, (6) unregulated open channel.
(1) The flow through a pump station is computed for either the pumping orsiphoning modes. The District operates constant- and variable-speed pumps. Forpumps with significant variability in operating speeds, interpolation andextrapolation is performed using pump affinity laws between two discharge ratingequations at both extremes of the operating range. Provisions are made for pumpswith the possibility of exposed outlets and for loss of efficiency due to the presenceof outlet flap gates.
(2) The flow through a gated spillway is calculated by first establishing the type ofrestrictions imposed on the flow. The level of gate restriction determines whetherthe flow is controlled or uncontrolled. The downstream water elevation dictateswhether the flow is free or submerged. Based on these restrictions to the discharge,the flow regime may be uncontrolled free, controlled free, uncontrolled submerged,or controlled submerged. In addition, provisions are made for flow which overtopsthe gate, reverse flow, and flow which bypasses the structure.
(3) The flow regime through a gated culvert may be like that of a weir, a pipe, anopen channel, or an orifice according to the type of control device, the level ofcontrol, and the water elevation at the inlet and at the outlet. The culvert cross-section may be circular, oval, or rectangular. A reasonable Manning's coefficient isdetermined and used in the flow computation. The configuration of the inlet maybe flush against a headwall, projected into the approach channel, or angled to awingwall. Provisions are made for reverse flow.
(4) A typical weir at the District consists of a rectangular notch in a dam. There arethree types of weirs according to the crest and notch configuration: (1) ogee, (2)trapezoidal, and, (3) variable. An ogee weir comprises a rounded crest and adownstream apron. A trapezoidal weir refers to the shape of the notch, andincludes V-notch weirs and rectangular weirs. A variable weir contains a movablecrest which can be lowered or raised. Flow through weirs may occur through thenotch, over the dam, or over both. Reverse flow is computed for trapezoidal andvariable weirs. Ogee weirs at the District are designed for one-directional free flowonly.
(5) A trapezoidal flume consists of a wide approach section, a gradual transitionsection, and a throat section. The flow through a trapezoidal flume is computed byestimating the discharge through the critical depth at the throat.
(6) The flow through an unregulated open channel reach is computed from anestablished stage-discharge relationship. One or two rating equations may be usedaccording to the variability of stage at the reach and the uniformity of the channelcross section. Overbank flow is accounted for.
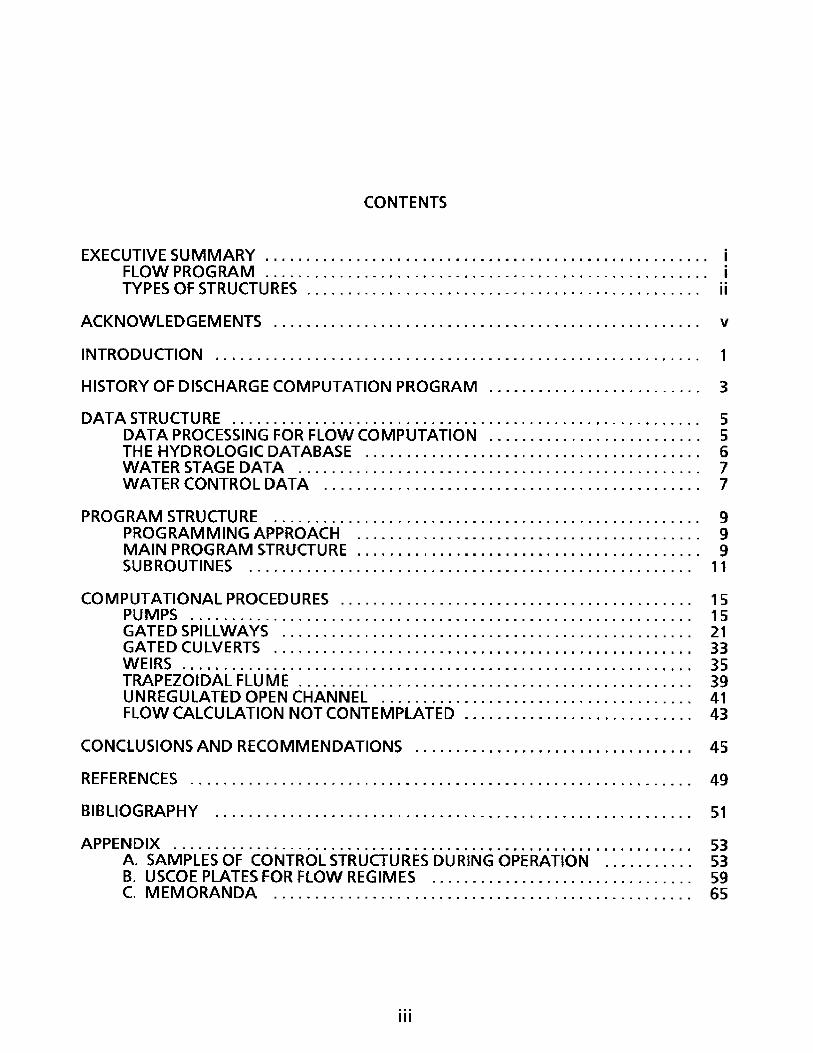
CONTENTS
EXECUTIVE SUM MARY .................................. .................... iFLOW PRO GRA M ...................................................... iTYPES OF STRUCTURES .............................. .................. ii
ACKNOW LEDGEM ENTS .................................................... v
INTRODUCTION ............... ............................................ 1
HISTORY OF DISCHARGE COMPUTATION PROGRAM ....................... 3
DATA STRUCTURE .................... ..... ............................... 5DATA PROCESSING FOR FLOW COMPUTATION .................. 5THE HYDROLOGIC DATABASE ........................................ 6WATER STAGE DATA ................................................. 7WATER CONTROL DATA ............................................. 7
PROGRAM STRUCTURE .................................................... 9PROGRAM M ING APPROACH .......................................... 9MAIN PROGRAM STRUCTURE .......................................... 9SUBRO UTINES ..................................................... 11
COMPUTATIONAL PROCEDURES .................................................. 15PUM PS ...................... ........................ . ... ..... ..... 15GATED SPILLWAYS ........................................................ 21GATED CULVERTS .................................................. 33WEIRS .... ................................................ 35TRAPEZOIDA L FLUM E ................................... .......... . 39UNREGULATED OPEN CHANNEL ................................... ... 41FLOW CALCULATION NOT CONTEMPLATED ............................ 43
CONCLUSIONS AND RECOMMENDATIONS ................................. 45
REFEREN CES .......... ................................................... 49
BIBLIOGRAPHY ............................................................ 51
A PPEN D IX ........................... ......... .................... ...... 53A. SAMPLES OF CONTROL STRUCTURES DURING OPERATION ........... 53B. USCOE PLATES FOR FLOW REGIMES .............................. 59C. MEMORANDA .................................................. 65
iii
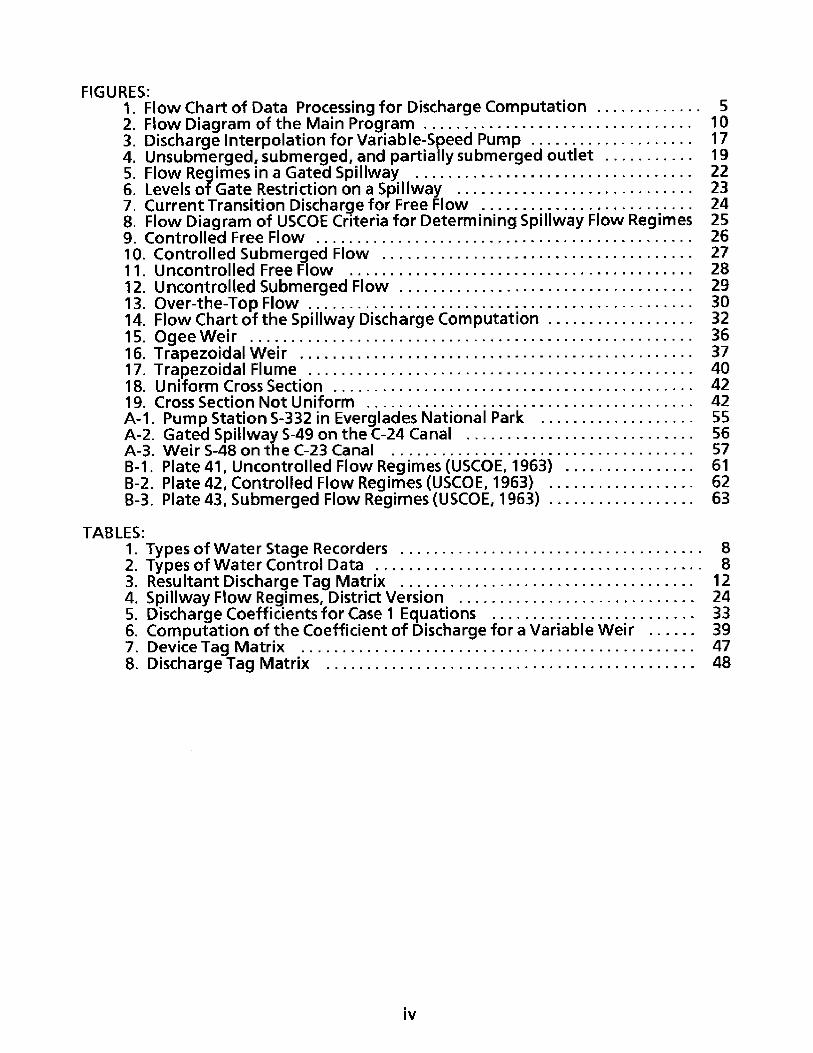
FIGURES:1. Flow Chart of Data Processing for Discharge Computation ............ 52. Flow Diagram of the Main Program ............................... 103. Discharge Interpolation for Variable-Speed Pump .................... 174. Unsubmerged, submerged, and partially submerged outlet ........... 195. Flow Regimes in a Gated Spillway .. ............................. 226. Levels of Gate Restriction on a Spillway ............................ 237. Current Transition Discharge for Free Flow .... .... ............ 248. Flow Diagram of USCOE Criteria for Determining Spillway Flow Regimes 259. Controlled Free Flow ..... ...................................... 2610. Controlled Submerged Flow ...................................... 2711. Uncontrolled Free Flow ......................................... 2812. Uncontrolled Submerged Flow .................................... 2913. Over-the-Top Flow ..... ................ ..................... 3014. Flow Chart of the Spillway Discharge Computation ................. 3215. Ogee W eir ...... ............................................. 3616. Trapezoidal W eir ..... ........................................ 3717. Trapezoidal Flume ..... ....................................... 4018. Uniform Cross Section ..... .................................... 4219. Cross Section Not Uniform ..................................... 42A-1. Pump Station 5-332 in Everglades National Park ................... 55A-2. Gated SpillwayS-49 on the C-24 Canal ........................... 56A-3. W eir S-48 on the C-23 Canal ..................................... 57B-1. Plate 41, Uncontrolled Flow Regimes (USCOE, 1963) .............. 61B-2. Plate 42, Controlled Flow Regimes (USCOE, 1963) ................. 62B-3. Plate 43, Submerged Flow Regimes (USCOE, 1963) .................. 63
TABLES:1. Types of Water Stage Recorders ... ............................... 82. Types of Water Control Data ... .................................. 83. Resultant Discharge Tag Matrix .. ............................... 124. Spillway Flow Regimes, District Version .......................... 245. Discharge Coefficients for Case 1 Equations ...................... 336. Computation of the Coefficient of Discharge for a Variable Weir ...... 397. Device Tag Matrix ................................................ 478. Discharge Tag Matrix ............................................ 48
ACKNOWLEDGEMENTS
Thanks to Sharon Ettinger and Carol Goff for revising the draft documents.
Thanks to Duane Dunn, John Fazio, Trudy Morris, and Kenneth Perla for their insightand assistance on data processing.
Thanks to Terry Clark, Vinio Floris, Jim Gross, and David Thatcher for their supportand encouragement.
Thanks to Wossenu Abtew, Luis Cadavid, Emile Damisse, Mariano Guardo, SiakaKone, Steve Lin, Davies Mtundu, Garth Redfield, Leslie Wedderburn, Mark Wilsnack,and Eric Zhang; Kevin Kotun, John Sloat, and Eric Swain (USGS); and W.M.Woodham (SJRWMD) for contributing comments on the draft documents.
Special thanks to Robb Startzman and Brian Turcotte for suggesting the topic of thispublication, providing comments on the draft documents, and for their continuedsupport and encouragement.

INTRODUCTION
The South Florida Water Management District (SFWMD) operates control structuresto regulate the movement of surface water either by gravitational or mechanicalforce. The amount of water moved through a particular location per unit of time iscalled the flow rate and is expressed in cubic feet per second (cfs). A dischargecomputation program (Flow) was developed to calculate the instantaneous flow atany pump, gated spillway, weir, gated culvert, flume, or unregulated open channelreach. The instantaneous values are subsequently time-averaged into daily meanvalues and stored in the SFWMD's corporate hydrologic database, DBHYDRO. Insideand outside the SFWMD, scientists, engineers, planners, and managers use the dailymean flows to obtain the best estimates of volumes of water and loadings of waterquality parameters throughout South Florida.
In 1963, the U.S. Army Corps of Engineers published a report suggesting genericequations and discharge coefficients for the computation of discharge through atypical gated spillway structure in South Florida. In 1977, Collins documentedvarious flow computation procedures utilized by the U.S. Geological Survey. In 1985,Andrew Fan documented the procedures for computation of discharge throughculverts equipped with control devices. Other procedures have been partiallydocumented utilizing comment lines intermixed with the source code of the Flowprogram. Procedures for discharge computation of various types of water controlstructures are found scattered throughout the literature. However, acomprehensive document which addresses discharge computation for all types ofwater control structures operated by the SFWMD is not found.
The main intent of this publication is to document the current form of the dischargeequations in the Flow program. It is not the intent to explain the hydraulics of theequations or to analyze their statistical significance. The English system of units(feet-pound-second) is used throughout this document.

HISTORY OF DISCHARGE COMPUTATION PROGRAM
The Flow program is based on the E034 program that was written in FORTRAN onthe District's Cyber computer. This program was used to calculate instantaneousflow. The instantaneous flows were averaged into daily values and stored into theDBHYDRO database. However, updating the program became very inefficientbecause discharge equations for each flow station were coded into the program.Every new flow station was added as a new subroutine and the whole program wasrecompiled. These subroutine additions made E034 a tremendously large andcumbersome program with which to work. As new flow stations were added, theprogram size continued to grow.
In 1991, the Hydrologic Data Management Division migrated all its computerprocessing and storage from the Cyber to the VAX computer. The E034 program wasextensively modified during this migration and is now called the Flow program. TheFlow program in the VAX applies a more structured programming approach thanthe old E034 program, but flow computation algorithms are the same. The interfacewith the District't corporate hydrologic database (DBHYDRO) and the developmentof generic flow equations minimize the frequency of code changes in the Flowprogram. In 1995, the Flow program and DBHYDRO were moved from the Vax to aUnix computer.
The computation of discharge through a culvert equiped with a control device, suchas a riser, offers the most challenging problem of all types of water control structuresin the District. The control devices for culverts used in the District are not commonoutside of South Florida. A special subroutine was required to establish ageneralized and simplified way to compute flow through District culverts. AndrewFan (1985) wrote the culvert subroutine in FORTRAN. This subroutine represents athorough approach to the theoretical calculation of discharge through a gatedculvert considering all flow regimes and all types of control devices. This subroutinewas incorporated into the E034 program in the Cyber computer in 1985. The core ofthe culvert subroutine remains part of the Flow program in its original form.
The required input to the Flow program are instantaneous values of water elevationupstream and downstream of the structure, the level of control (e.g., gate opening)for each device within the structure, and a structure identifier. The DBHYDROdatabase holds information about the type of water control structure (pump, gatedspillway, gated culvert, weir, flume, or unregulated open channel reach), thedimensions and shape of the structure, the loss coefficients associated with the flowthrough the structure, and the coefficients and exponents of generic flow equations.The DBHYDRO tables have been populated with information for more than 200water control structures. The database is designed to accommodate increases in thenumber of control structures for which flow is computed.

DATA STRUCTURE
DATA PROCESSING FOR FLOW COMPUTATION
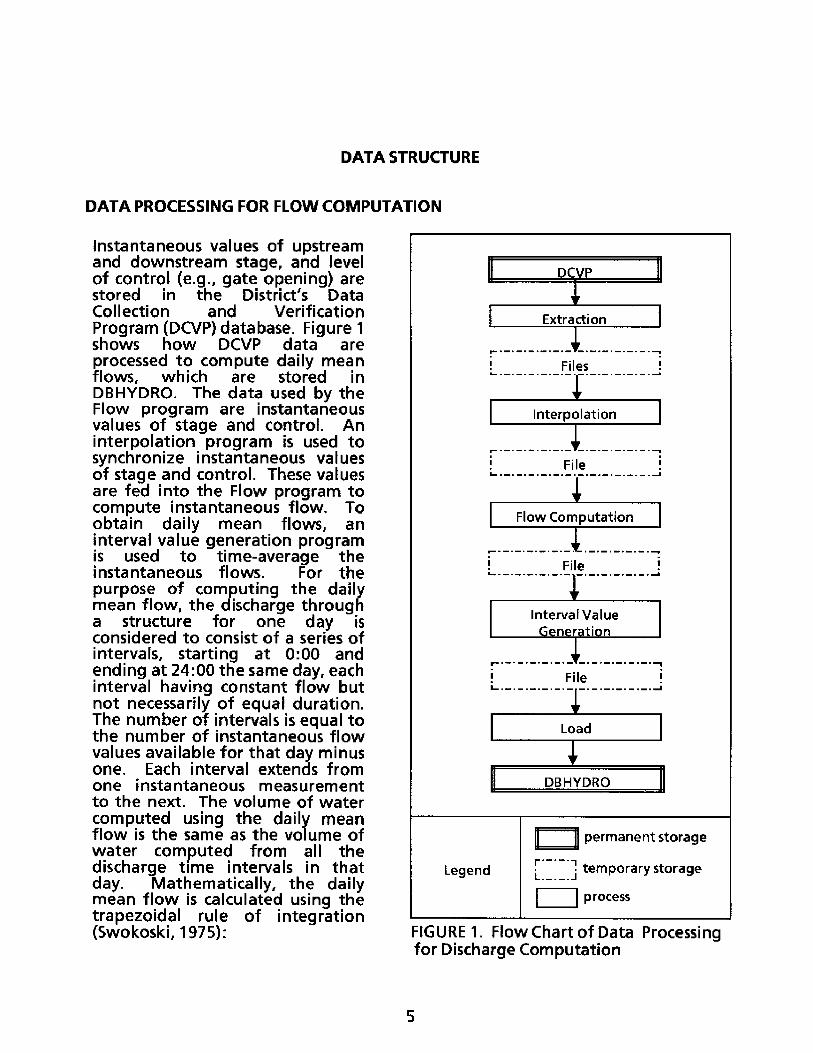
Instantaneous values of upstreamand downstream stage, and levelof control (e.g., gate opening) arestored in the District's DataCollection and VerificationProgram (DCVP) database. Figure 1shows how DCVP data areprocessed to compute daily meanflows, which are stored inDBHYDRO. The data used by theFlow program are instantaneousvalues of stage and control. Aninterpolation program is used tosynchronize instantaneous valuesof stage and control. These valuesare fed into the Flow program tocompute instantaneous flow. Toobtain daily mean flows, aninterval value generation programis used to time-average theinstantaneous flows. For thepurpose of computing the dailymean flow, the discharge througha structure for one day isconsidered to consist of a series ofintervals, starting at 0:00 andending at 24:00 the same day, eachinterval having constant flow butnot necessarily of equal duration.The number of intervals is equal tothe number of instantaneous flowvalues available for that day minusone. Each interval extends fromone instantaneous measurementto the next. The volume of watercomputed using the daily meanflow is the same as the volume ofwater computed from all thedischarge time intervals in thatday. Mathematically, the dailymean flow is calculated using thetrapezoidal rule of integration(Swokoski, 1975):
DCVP
Extraction
Files '
Interpolation
-- File .File
.=.I Flow Computation
! File !
i File 'L. .... ....... --.-- -...-
Load
DBHYDRO
®I 1permanent storage
Legend .. temporary storage
| process
FIGURE 1. Flow Chart of Data Processingfor Discharge Computation
n-1 q+ qi+1
i=1
tn - ti
n-1°- 1 1=E- ( qi + qi+1)(ti+l - ti )
- $ 1 ( i q i+ ) (ti+1 - ti ) (1)
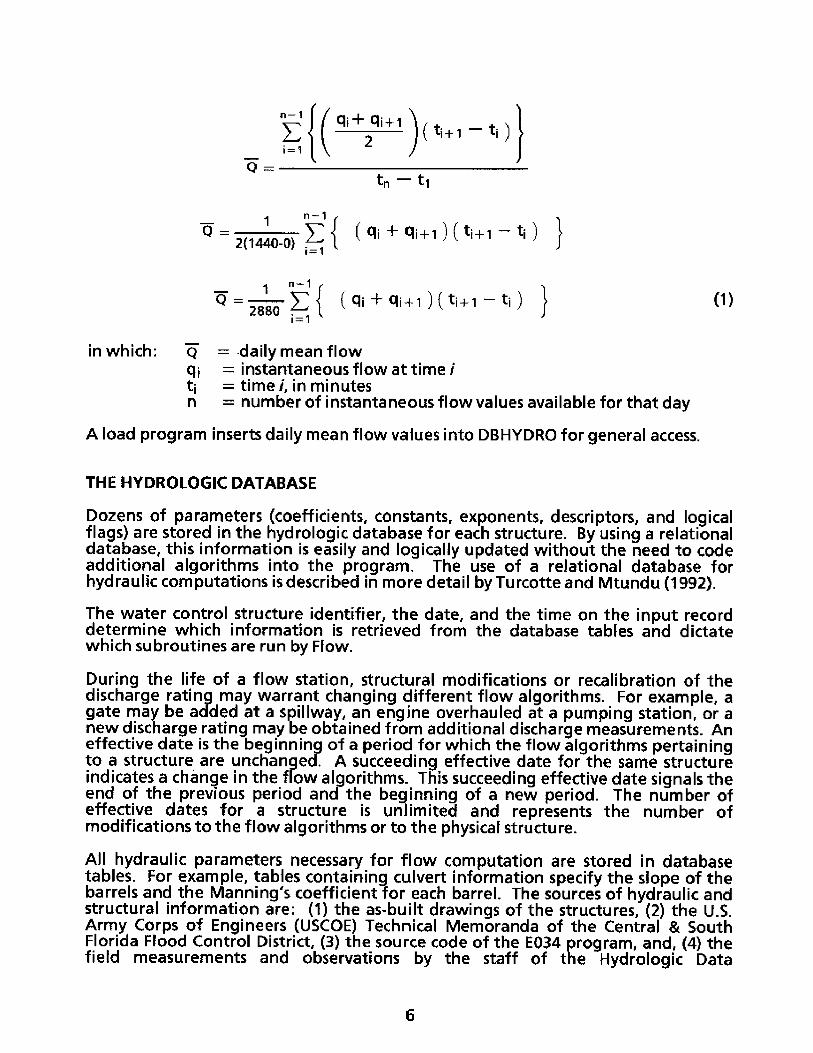
in which: i = daily mean flowqi = instantaneous flow at time iti = time i, in minutesn = number of instantaneous flow values available for that day
A load program inserts daily mean flow values into DBHYDRO for general access.
THE HYDROLOGIC DATABASE
Dozens of parameters (coefficients, constants, exponents, descriptors, and logicalflags) are stored in the hydrologic database for each structure. By using a relationaldatabase, this information is easily and logically updated without the need to codeadditional algorithms into the program. The use of a relational database forhydraulic computations is described in more detail by Turcotte and Mtundu (1992).
The water control structure identifier, the date, and the time on the input recorddetermine which information is retrieved from the database tables and dictatewhich subroutines are run by Flow.
During the life of a flow station, structural modifications or recalibration of thedischarge rating may warrant changing different flow algorithms. For example, agate may be added at a spillway, an engine overhauled at a pumping station, or anew discharge rating may be obtained from additional discharge measurements. Aneffective date is the beginning of a period for which the flow algorithms pertainingto a structure are unchanged. A succeeding effective date for the same structureindicates a change in the flow algorithms. This succeeding effective date signals theend of the previous period and the beginning of a new period. The number ofeffective dates for a structure is unlimited and represents the number ofmodifications to the flow algorithms or to the physical structure.
All hydraulic parameters necessary for flow computation are stored in databasetables. For example, tables containing culvert information specify the slope of thebarrels and the Manning's coefficient for each barrel. The sources of hydraulic andstructural information are: (1) the as-built drawings of the structures, (2) the U.S.Army Corps of Engineers (USCOE) Technical Memoranda of the Central & SouthFlorida Flood Control District, (3) the source code of the E034 program, and, (4) thefield measurements and observations by the staff of the Hydrologic Data
Management Division. Most of this information is compiled in the Structureinformation Binders, held by the Hydrologic Data Management Division.
The sources of the discharge rating information contained in the database tablesare: (1) the pump performance curves developed by the pump manufacturers, (2)the discharge capacity curves for spillways, developed by the USCOE, (3) thedischarge rating calibration from flow measurements performed by the U.S.Geological Survey (USGS) and the District, and, (4) the source code of the E034program.
WATER STAGE DATA
Water stage is the elevation, above mean sea level or NGVD, of the water upstreamor downstream of a control structure. The head is the difference between theupstream stage and the higher of: (1) the downstream stage or (2) the elevation atthe bottom of the outlet (Cheremisinoff, 1981). For example, the head for free flowover a weir is the difference between the upstream stage and the elevation at thebottom of the outlet, which is the crest elevation. All discharge computationalgorithms used in Flow are primarily a function of the head.
Instantaneous stage data are available from various recorders. Table 1 summarizesthe types of stage recorders, the typical recording frequency, and the processingrequired before utilizing the data.
WATER CONTROL DATA
Water control information is the level of control for a device within a structure. Theengine speed in revolutions per minute (rpm) is the control information for a pumpunit within a pump station. The gate opening in feet is the control information for agate within a spillway or a culvert. The crest elevation in feet NGVD (NationalGeodetic Vertical Datum) is the control information for a stop log in a barrel within aculvert, or a notch in a bay within a weir.
Instantaneous water control data are available from fewer sources than stage data.The sources of water control data are: telemetry, graphic, solid state, and manuallog sheets. Telemetry data are available for all remotely operated structures, as wellas for major pumps, spillways, and culverts. Log sheets are available for all manuallyoperated structures. Table 2 summarizes the types of water control data for eachtype of structure.
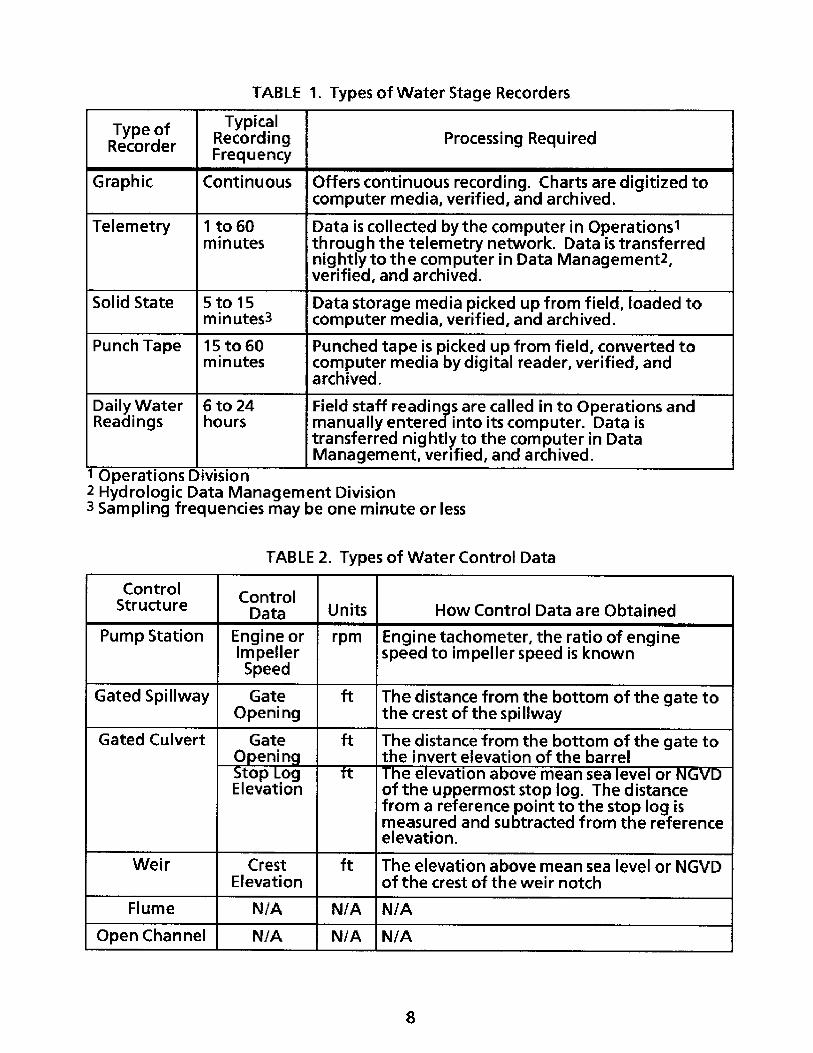
TABLE 1. Types of Water Stage Recorders
Type of TypicalRecorder Recording Processing Required
Frequency
Graphic Continuous Offers continuous recording. Charts are digitized tocomputer media, verified, and archived.
Telemetry 1 to 60 Data is collected by the computer in Operations1
minutes through the telemetry network. Data is transferrednightly to the computer in Data Management 2,verified, and archived.
Solid State 5 to 15 Data storage media picked up from field, loaded tominutes3 computer media, verified, and archived.
Punch Tape 15 to 60 Punched tape is picked up from field, converted tominutes computer media by digital reader, verified, and
archived.
Daily Water 6 to 24 Field staff readings are called in to Operations andReadings hours manually entered into its computer. Data is
transferred nightly to the computer in DataManagement, verified, and archived.
Operations Division2 Hydrologic Data Management Division3 Sampling frequencies may be one minute or less
TABLE 2. Types of Water Control Data
ControlStructure ControlStructure Data Units How Control Data are Obtained
Pump Station Engine or rpm Engine tachometer, the ratio of engineImpeller speed to impeller speed is knownSpeed
Gated Spillway Gate ft The distance from the bottom of the gate toOpening the crest of the spillway
Gated Culvert Gate ft The distance from the bottom of the gate toOpening the invert elevation of the barrelStop Log ft The elevation above mean sea level or NGVDElevation of the uppermost stop log. The distance
from a reference point to the stop log ismeasured and subtracted from the referenceelevation.
Weir Crest ft The elevation above mean sea level or NGVDElevation of the crest of the weir notch
Flume N/A N/A N/A
Open Channel N/A N/A N/A
PROGRAM STRUCTURE
The flow computation program is contained in one single source file. It is written inFORTRAN with embedded SQL statements. These embedded SQL statements enablethe program to retrieve information from the hydrologic database. The hydrologicdatabase contains information such as the values of the physical characteristics ofcontrol structures, and the parameters and coefficients for the flow equations.
PROGRAMMING APPROACH
The basic principles of structured programming are: (1) sequence structures, (2)decision structures, and, (3) loop structures (Ageloff, 1981). These principles arefollowed for the most part in the FLOW program. Instructions occur one after theother following a sequence structure. Branching is done only for exiting fromsubprograms. Block IF statements are used as decision structures. Loop structuresare also used. Explicit DO-WHILE and DO-UNTIL loop structures in the FORTRANlanguage are not used because they are specific to the operating system. However,implicit versions of these loop structures are used, such as the loop to read everyrecord of the input file. The culvert subroutine is the only subprogram which doesnot follow the principles of structured programming because it predates the FLOWprogram.
The following are the desired properties of a module: (1) it acts like a "black box"; ithas one point of entry and one point of exit, (2) it is independent from othermodules, and, (3) it is not too large (Ageloff, 1981). For the most part, thesubprograms in FLOW adhere to the first property. They have a single point of entryand a single point of exit. However, subroutines are not independent from eachother because they share global variables defined in COMMON blocks. Also, somesubroutines are longer than 100 lines of code, and they cannot be considered small.
MAIN PROGRAM STRUCTURE
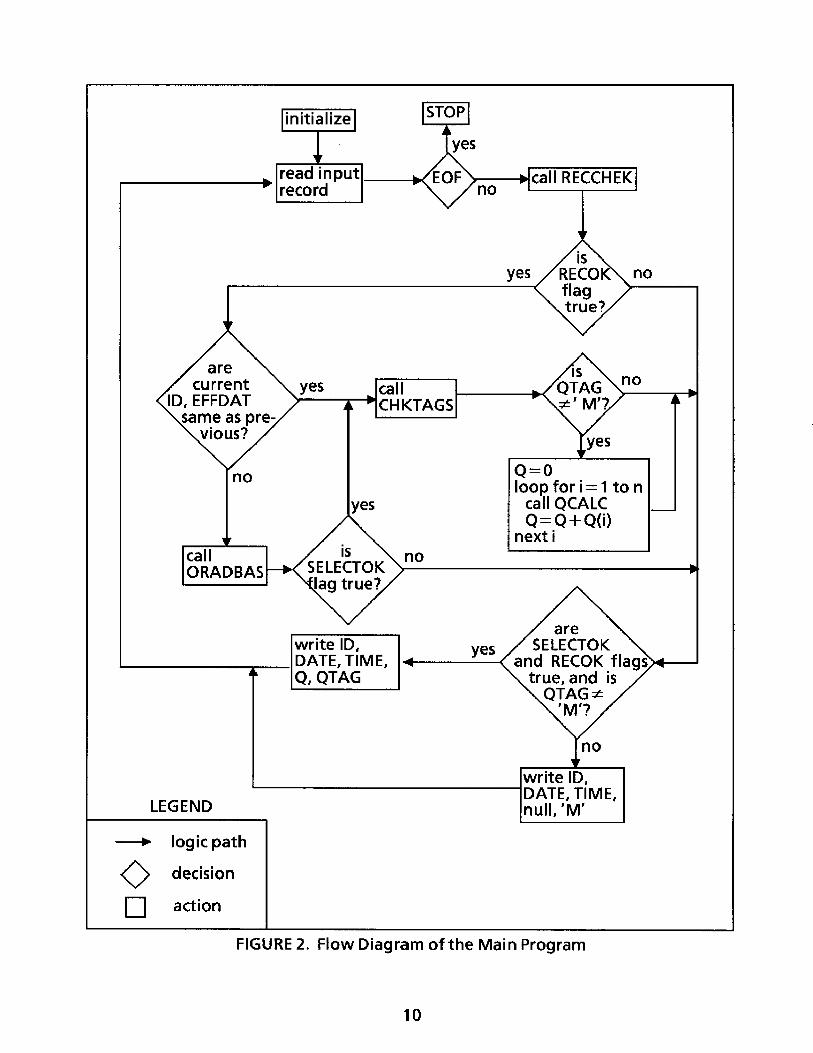
The main program follows a structured approach. The logic path begins at the topand ends at the bottom. Calls are made to subroutines where specialized functionsare needed. Figure 2 is a flow diagram of the main program.
The main program reads one input record at a time and checks it. Subroutines arecalled to perform validation procedures on the input data. The database tables arequeried to retrieve the pertinent information about the control structure. If theinput record refers to the same structure as the previous input record, and the inputdate falls within the effective dates of the previous record, the database is notaccessed and the information already available is used.
The discharge computation is accomplished by a single call from the main programto the discharge computation subroutine. However, because a control structure may
LEGEND
- logic path
Sdecision- action
FIGURE 2. Flow Diagram of the Main Program
contain multiple control devices (e.g., multiple pumps), the discharge is computedindividually for each control device. The discharge values for all control devices aresummed to obtain the total discharge through the structure.
There is one output record written for every input record read. The validationprocedures set flags to establish the validity of the input record. If all the validationflags accept the input record, then the output record includes a discharge value anda corresponding qualifying tag. Otherwise, the output record contains a null valuefor discharge and an "M" qualifying tag, indicating the discharge value is missing.The main program continues to process input records until the end of the input file.
SUBROUTINES
Seven subroutines are called from the main program. Only a few arguments arepassed to the subroutines. Most of the information is passed to the subroutines viacommon blocks, because of the large number of variables used.
RECCHEK. The input record is checked for a valid input date. Check that the date isan actual calendar date (e.g., day is between 1 and 31) and that the time is an actualclock time (e.g., minutes are between 0 and 59). Also, check that the input date andtime are not greater than the computer's clock date and time.
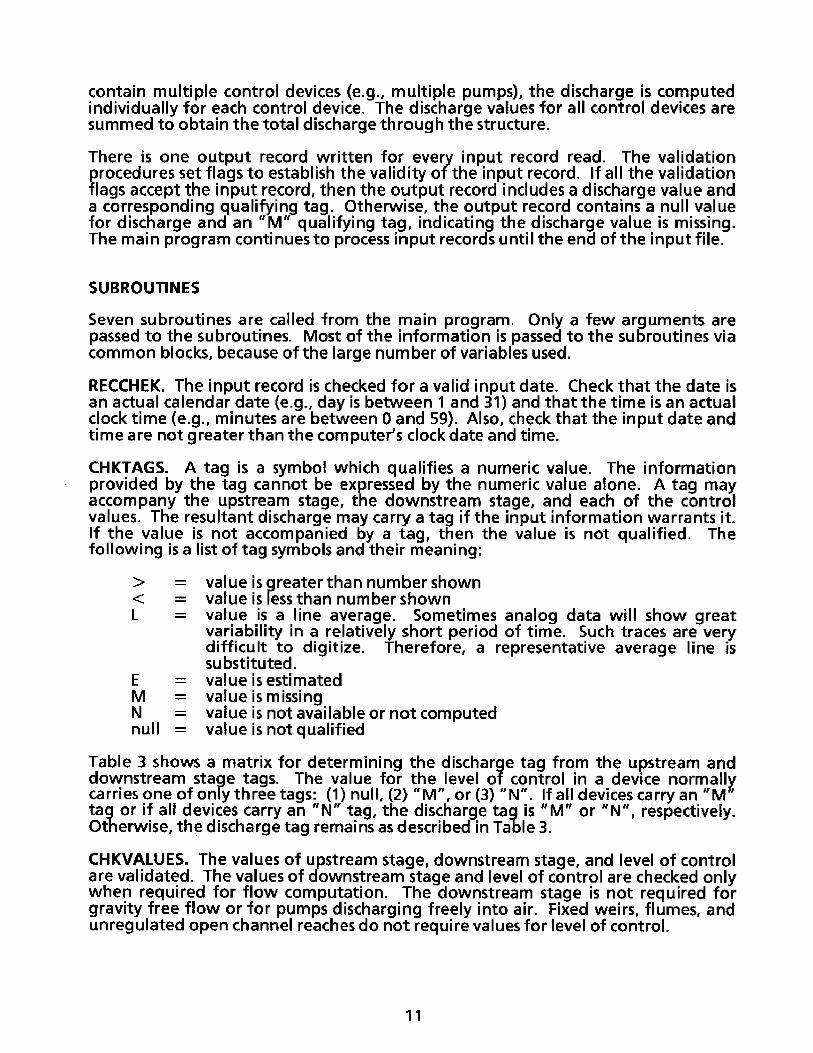
CHKTAGS. A tag is a symbol which qualifies a numeric value. The informationprovided by the tag cannot be expressed by the numeric value alone. A tag mayaccompany the upstream stage, the downstream stage, and each of the controlvalues. The resultant discharge may carry a tag if the input information warrants it.If the value is not accompanied by a tag, then the value is not qualified. Thefollowing is a list of tag symbols and their meaning:
> = value is greater than number shown< = value is less than number shownL = value is a line average. Sometimes analog data will show great
variability in a relatively short period of time. Such traces are verydifficult to digitize. Therefore, a representative average line issubstituted.
E = value is estimatedM = value ismissingN = value is not available or not computednull = value is not qualified
Table 3 shows a matrix for determining the discharge tag from the upstream anddownstream stage tags. The value for the level of control in a device normallycarries one of only three tags: (1) null, (2) "M", or (3) "N". If all devices carry an "Mtag or if all devices carry an "N" tag, the discharge tag is "M" or "N", respectively.Otherwise, the discharge tag remains as described in Table 3.
CHKVALUES. The values of upstream stage, downstream stage, and level of controlare validated. The values of downstream stage and level of control are checked onlywhen required for flow computation. The downstream stage is not required forgravity free flow or for pumps discharging freely into air. Fixed weirs, flumes, andunregulated open channel reaches do not require values for level of control.
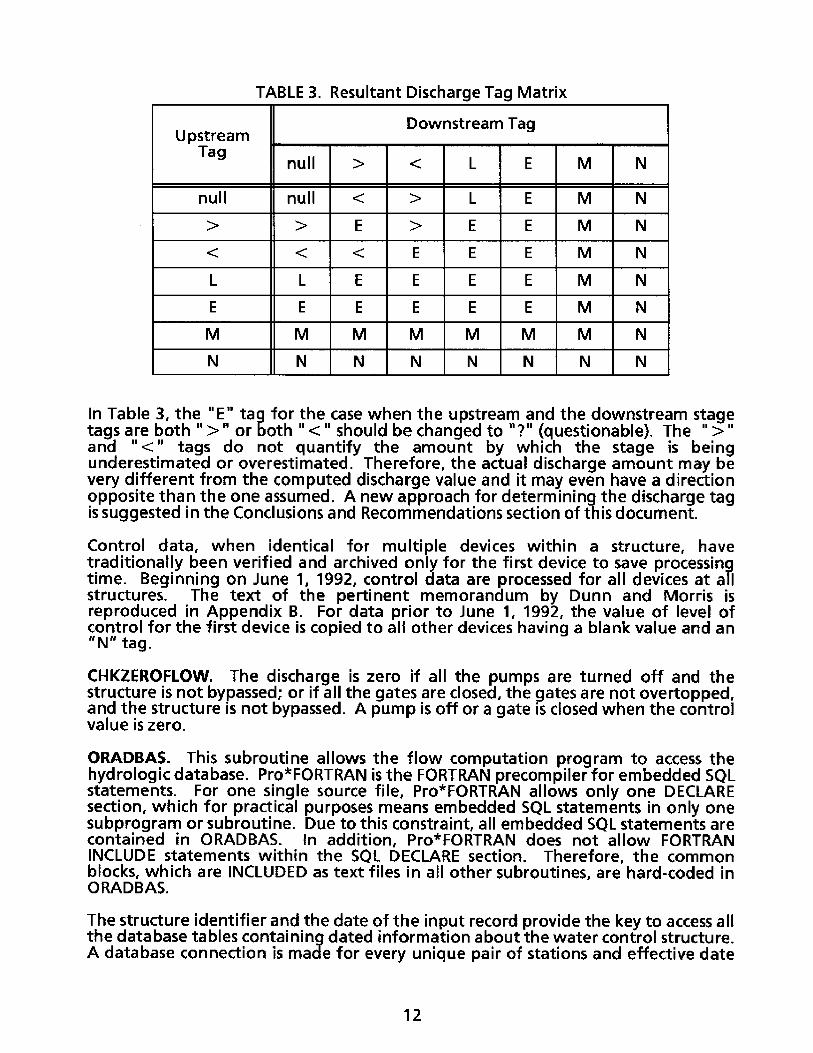
TABLE 3. Resultant Discharge Tag Matrix
Downstream TagUpstream ---
Tagnull > < L E M N
null null < > L E M N
> > E > E E M N
< < < E E E M N
L L E E E E M N
E E E E E E M N
M M M M M M M N
N N N N N N N N
In Table 3, the "E" tag for the case when the upstream and the downstream stagetags are both " > " or both " < " should be changed to "?" (questionable). The " > "and "<" tags do not quantify the amount by which the stage is beingunderestimated or overestimated. Therefore, the actual discharge amount may bevery different from the computed discharge value and it may even have a directionopposite than the one assumed. A new approach for determining the discharge tagis suggested in the Conclusions and Recommendations section of this document.
Control data, when identical for multiple devices within a structure, havetraditionally been verified and archived only for the first device to save processingtime. Beginning on June 1, 1992, control data are processed for all devices at allstructures. The text of the pertinent memorandum by Dunn and Morris isreproduced in Appendix B. For data prior to June 1, 1992, the value of level ofcontrol for the first device is copied to all other devices having a blank value and an"N" tag.
CHKZEROFLOW. The discharge is zero if all the pumps are turned off and thestructure is not bypassed; or if all the gates are closed, the gates are not overtopped,and the structure is not bypassed. A pump is off or a gate is closed when the controlvalue is zero.
ORADBAS. This subroutine allows the flow computation program to access thehydrologic database. Pro*FORTRAN is the FORTRAN precompiler for embedded SQLstatements. For one single source file, Pro*FORTRAN allows only one DECLAREsection, which for practical purposes means embedded SQL statements in only onesubprogram or subroutine. Due to this constraint, all embedded SQL statements arecontained in ORADBAS. In addition, Pro*FORTRAN does not allow FORTRANINCLUDE statements within the SQL DECLARE section. Therefore, the commonblocks, which are INCLUDED as text files in all other subroutines, are hard-coded inORADBAS.
The structure identifier and the date of the input record provide the key to access allthe database tables containing dated information about the water control structure.A database connection is made for every unique pair of stations and effective date
identified in the input file. For further explanation on how the database tables areconfigured for hydraulic computations, refer to Turcotte and Mtundu (1992).
ERRDIS. This subroutine handles all the reporting of error conditions detected bythe program. Error reporting encompasses various levels of error conditions. Someerrors cause the program to stop execution, other errors cause the program to stopprocessing an input record and skip to the next, while still others are only warnings.Whatever the action taken by the error trapping logic in the program, the errorreporting subroutine informs the user of what is happening.
QCALC. If no error condition exists after the input record is validated and thedatabase is queried, then the discharge is computed. The QCALC subroutine calls theappropriate discharge computation algorithm according to the structure type. TheQCALC subroutine returns the value of the instantaneous discharge for one controldevice. The main program sums the discharges for all control devices at a structure.
The next section explains in detail the computational procedures followed by thealgorithms in QCALC.

COMPUTATIONAL PROCEDURES
The algorithms used in the flow computation program are mathematicalsimplifications of physical phenomena. The number of variables involved in waterflow is so great as to defy a rigorous analytical approach for each type of structure.Flow equations are defined for each particular case of each type of control structure.For example, flow equations are defined for each of five cases of flow through agated spillway: (1) controlled free, (2) controlled submerged, (3) uncontrolled free,(4) uncontrolled submerged, and (5) over-the-top. Certain assumptions arenecessary to define flow equations:
1. It is possible to obtain a satisfactory approximation of the true value of floweither through a theoretical approach, such as the energy equation; orthrough applying regression techniques to field measurements.
2. Steady-state flow. The rate of change of flow with time is assumed to bezero for each input record.
3. A transition zone ensures continuity between flow equations for differentcases. A transition zone exists where flow equations for two separate casesapply.
PUMPS
Flow computation for pumps is divided into two major categories, pumping andsiphoning. Pumping is the normal mode of operation of a pump station, wherewater is pumped from a lower stage to a higher stage. There are cases (e.g. S-331)where water is pumped from a higher stage to a lower stage for a short period oftime before the stages reverse and normal pumping continues. Siphoning is analternate mode of operation where gravity moves water through the pump from ahigher stage to a lower stage.
The head is the difference between the upstream stage and the downstream stage.The engine speed is the angular velocity of the engine. The discharge rating curvesare based on the hydraulic characteristics of the pump and account for the gear ratiobetween the engine and the impeller as well as any losses in the piping andappurtenances. Figure A-1 shows station 5-332 during a pumping operation. Thisstructure pumps water from Taylor Slough to Everglades National Park.
When a pump station is built, a set of performance curves is provided by the pumpmanufacturer. The discharge performance curve provides the discharge rate if theengine speed and the head are known. It is possible to describe performance curvesmathematically in the form of an equation. Discharge rating curve(s) can beproduced for a pump by calibrating the performance curve equation(s) withdischarge measurements thus improving the accuracy of flow estimation.
The USCOE, directed the construction of most of the pump stations at the District,and developed and calibrated the rating equations for the pumps. The District
inherited these rating equations and has continued to recalibrate them with newdischarge measurements. The District has also developed and calibrated ratingequations for pump stations constructed under its direction.
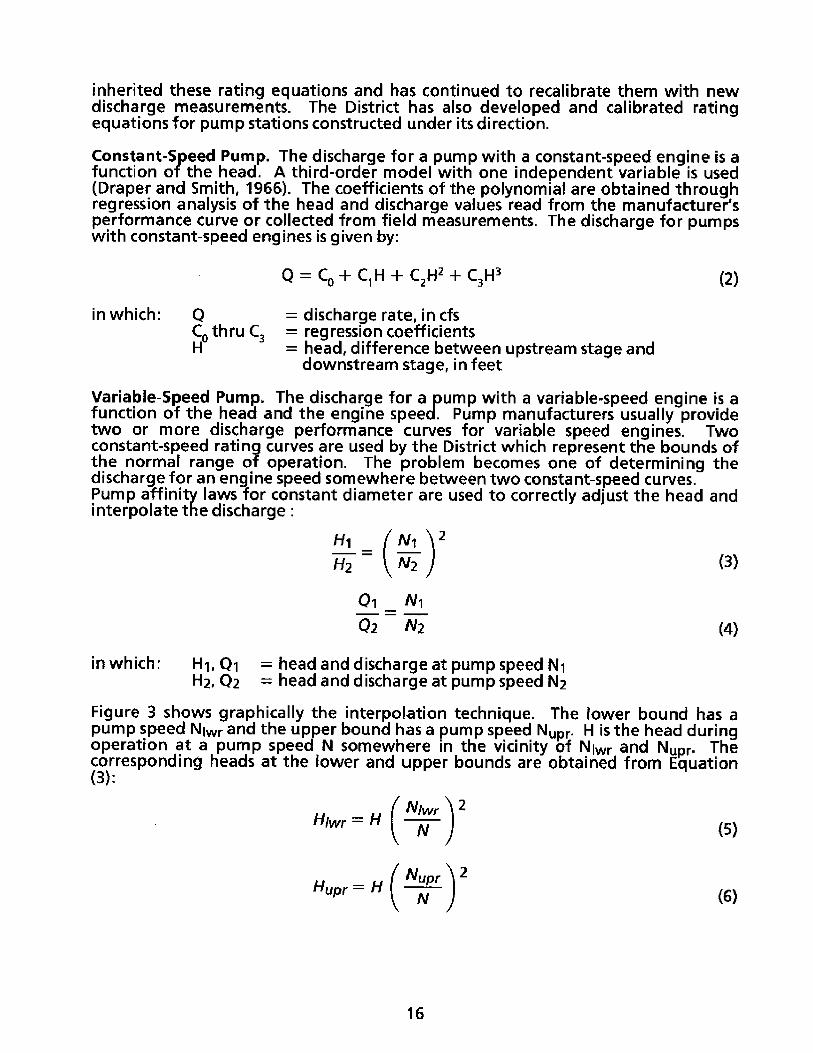
Constant-Speed Pump. The discharge for a pump with a constant-speed engine is afunction of the head. A third-order model with one independent variable is used(Draper and Smith, 1966). The coefficients of the polynomial are obtained throughregression analysis of the head and discharge values read from the manufacturer'sperformance curve or collected from field measurements. The discharge for pumpswith constant-speed engines is given by:
Q = C + C1H + C2H2 C3 H3 (2)
in which: Q = discharge rate, in cfsC0thru C3 = regression coefficientsH = head, difference between upstream stage and
downstream stage, in feet
Variable-Speed Pump. The discharge for a pump with a variable-speed engine is afunction of the head and the engine speed. Pump manufacturers usually providetwo or more discharge performance curves for variable speed engines. Twoconstant-speed rating curves are used by the District which represent the bounds ofthe normal range of operation. The problem becomes one of determining thedischarge for an engine speed somewhere between two constant-speed curves.Pump affinity laws for constant diameter are used to correctly adjust the head andinterpolate the discharge :
H1 NI 2
H2 2 (3)
01 N1
Q2 N2 (4)
in which: H1, Q1 = head and discharge at pump speed N1H2 , Q2 = head and discharge at pump speed N2
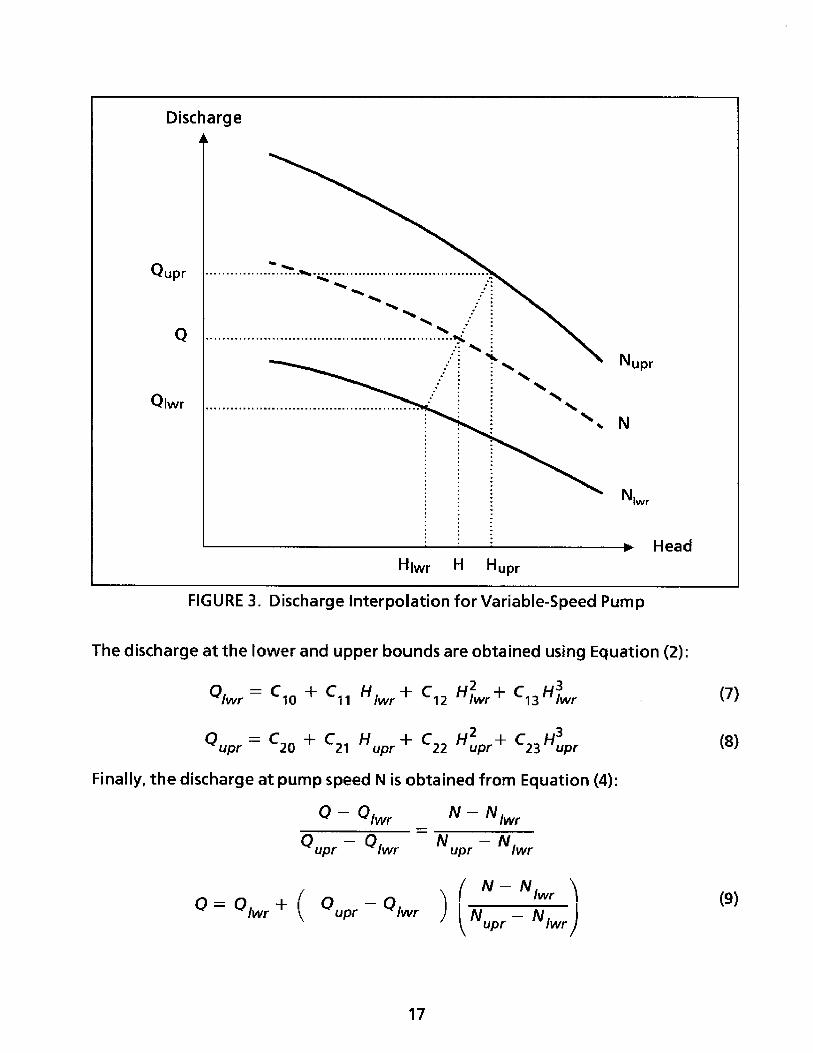
Figure 3 shows graphically the interpolation technique. The lower bound has apump speed NIwr and the upper bound has a pump speed Nupr. H is the head duringoperation at a pump speed N somewhere in the vicinity of Niwr and Nupr. Thecorresponding heads at the lower and upper bounds are obtained from Equation(3):
Hlwr = H (Nr (5)
Hupr =H 2 2)
DischargeI.
.......................... .......................... . .
HIwr H
Nupr
N
Niwr
a HeadHupr
FIGURE 3. Discharge Interpolation for Variable-Speed Pump
The discharge at the lower and upper bounds are obtained using Equation (2):
iwr 10 +C 1 1 Hwr +C 1 2 'Hlwr+ C1 3 Iwr
upr =C 2 0 + C2 1 Hupr C 22 Hupr C 23 H upr
Finally, the discharge at pump speed N is obtained from Equation (4):
QO- Qlwr N- N wr
Qupr Iwr upr Iwr
Owr +( upr - Qlwr ) N - Nl wruNupr Nwr
A
Qupr
Q
Qlwr
.__._ ._
Care should be exercised when applying Equation (9). If N is outside the rangebetween Niwr and Nupr, application of Equation (9) will result in extrapolation.Extrapolation does not necessarily result in less accurate estimates thaninterpolation. However, if the minimum or maximum pump speeds are well outsidethe interpolation range, extrapolation should be checked for accuracy.
Two-Variable Polynomial. Used for pump station 5-9, a variable-speed pump, wherethe engine speed varies considerably during operation. The discharge equation is athird order model with two independent variables (Draper and Smith, 1966):
Q = Co+ C X+C 2 Y+C3X2+C 4XY+Csy2 + C6X3+ C7YX2 + CsXY2 + c 9 (10)
in which: Q = discharge rate in cfsC thru C9 = coefficientsX= dimensionless head parameter, H/HfactH = head, in feetHfact = head factor, in feetY = dimensionless engine speed parameter expressed as
fraction of effective range, (N-Nmin)/NfactN = engine speed, in rpmNmax = maximum engine speed, in rpmNmin = minimum engine speed necessary to move water, in rpmNfact = engine speed factor, Nmax - Nmin, in rpm
The head and engine speed parameters are the dimensionless, normalized values ofhead and engine speed ranging from 0 to 1. They are normalized by subtracting theminimum value possible and dividing by the difference between the maximum andminimum values possible -- for head, the minimum value is zero. By normalizing thehead and engine speed, the domain of these parameters is confined between zeroand one. In this way, the use of large values for head and engine speed is avoided,the magnitude of each of the coefficients Co through C9 is minimized, and thehandling of the two-variable polynomial is simplified.
The head parameter X is obtained by dividing the head value H by the head factorHfact. For example, Hfact at pump station 5-13 is the maximum possible head, or ninefeet. For an H of five feet, X is 5/9 = 0.556.
To obtain the engine speed parameter Y, the minimum engine speed necessary tomove water, Nmin, is subtracted from the engine speed value N. The result is dividedby the engine speed factor Nfact. For example, Nmin at 5-13 is 300 rpm, Nmax is 1200rpm, and Nfact is 1200 - 300 = 900 rpm. For an N of 1050 rpm, Y is (1050-300)/900= 0.833.
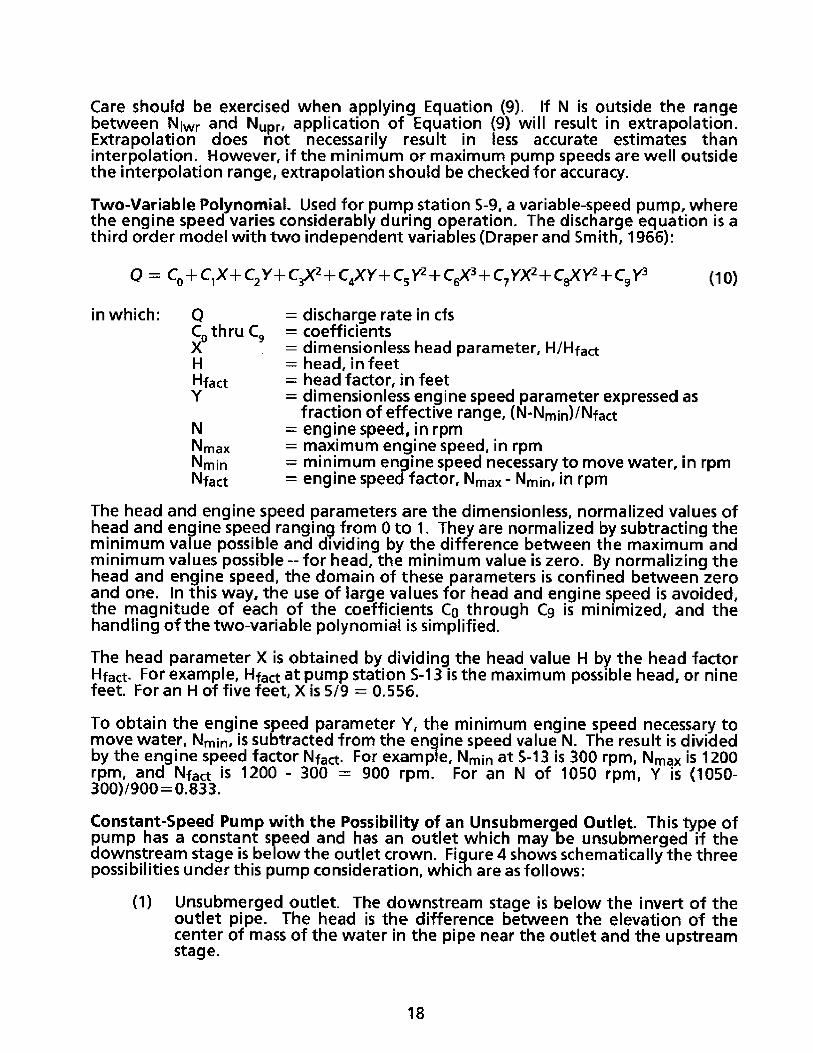
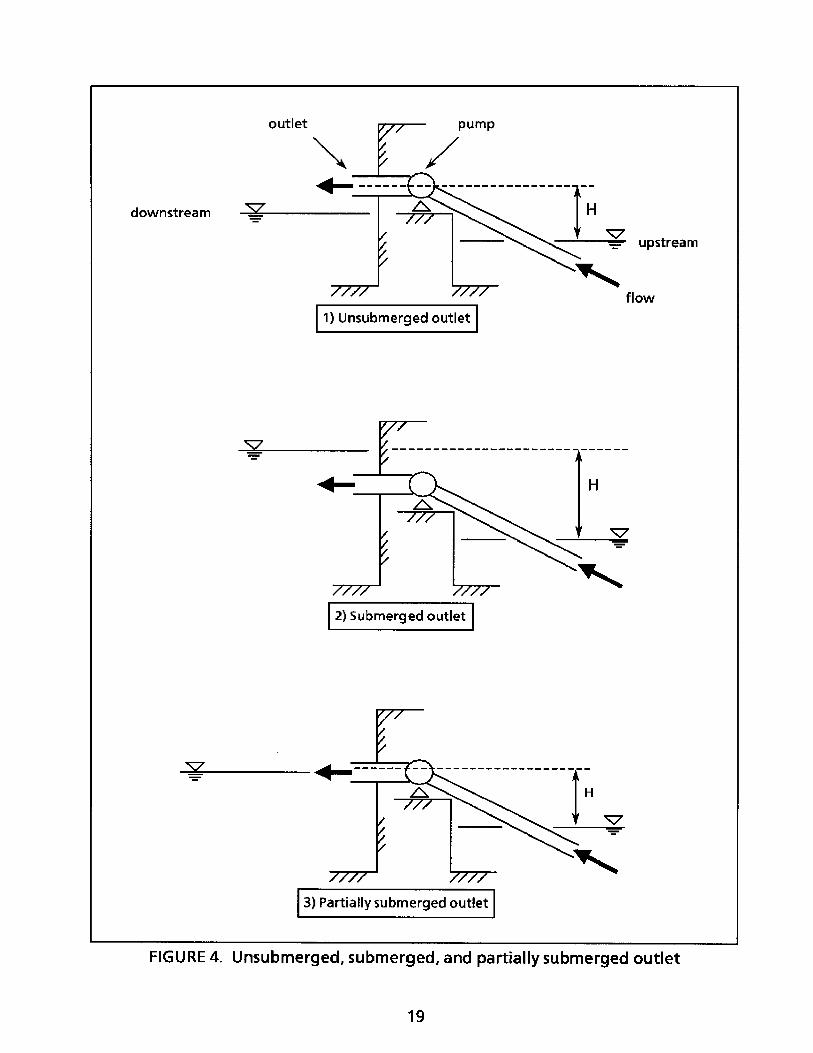
Constant-Speed Pump with the Possibility of an Unsubmerged Outlet. This type ofpump has a constant speed and has an outlet which may be unsubmerged if thedownstream stage is below the outlet crown. Figure 4 shows schematically the threepossibilities under this pump consideration, which are as follows:
(1) Unsubmerged outlet. The downstream stage is below the invert of theoutlet pipe. The head is the difference between the elevation of thecenter of mass of the water in the pipe near the outlet and the upstreamstage.
downstream
upstream
fln.I IYow
1) Unsubmerged outlet I
2) Submerged outlet
3) Partially submerged outlet
FIGURE 4. Unsubmerged, submerged, and partially submerged outlet
'
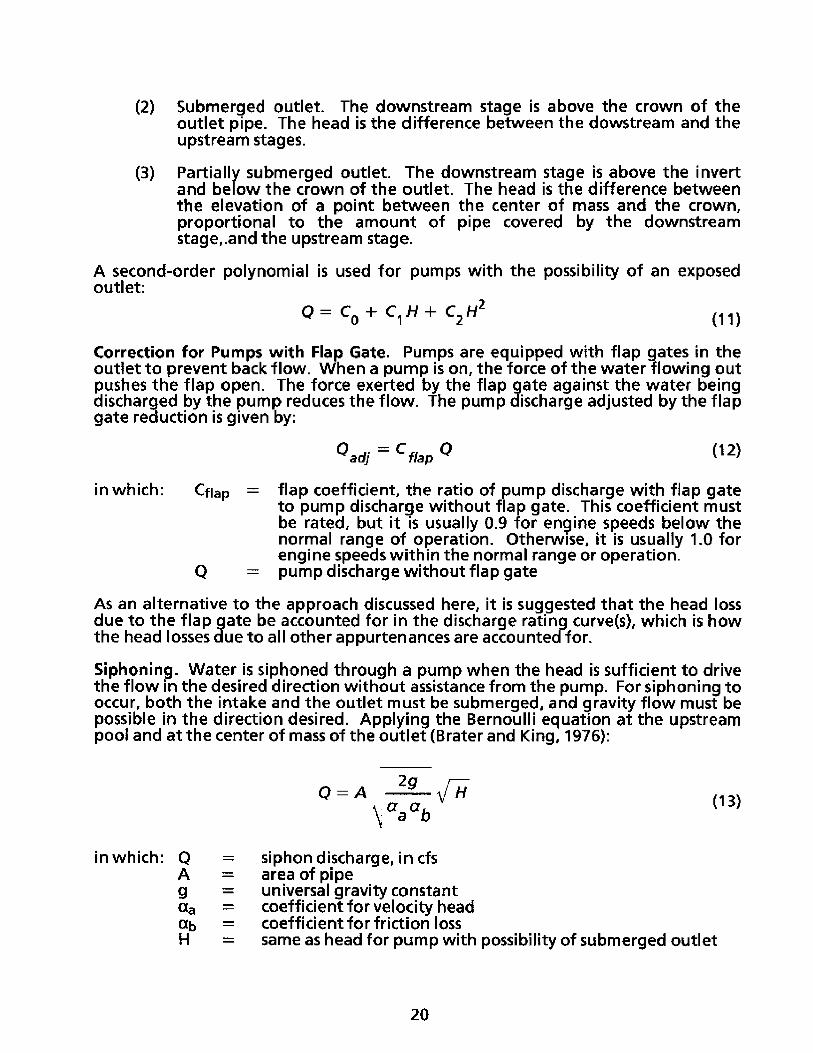
(2) Submerged outlet. The downstream stage is above the crown of theoutlet pipe. The head is the difference between the dowstream and theupstream stages.
(3) Partially submerged outlet. The downstream stage is above the invertand below the crown of the outlet. The head is the difference betweenthe elevation of a point between the center of mass and the crown,proportional to the amount of pipe covered by the downstreamstage,.and the upstream stage.
A second-order polynomial is used for pumps with the possibility of an exposedoutlet:
Q= Co + C1 H + C2 H 2(11)
Correction for Pumps with Flap Gate. Pumps are equipped with flap gates in theoutlet to prevent back flow. When a pump is on, the force of the water flowing outpushes the flap open. The force exerted by the flap gate against the water beingdischarged by the pump reduces the flow. The pump discharge adjusted by the flapgate reduction is given by:
Qadj = C flap
in which: Cflap
(12)
= flap coefficient, the ratio of pump discharge with flap gateto pump discharge without flap gate. This coefficient mustbe rated, but it is usually 0.9 for engine speeds below thenormal range of operation. Otherwise, it is usually 1.0 forengine speeds within the normal range or operation.
= pump discharge without flap gate
As an alternative to the approach discussed here, it is suggested that the head lossdue to the flap gate be accounted for in the discharge rating curve(s), which is howthe head losses due to all other appurtenances are accounted for.
Siphoning. Water is siphoned through a pump when the head is sufficient to drivethe flow in the desired direction without assistance from the pump. For siphoning tooccur, both the intake and the outlet must be submerged, and gravity flow must bepossible in the direction desired. Applying the Bernoulli equation at the upstreampool and at the center of mass of the outlet (Brater and King, 1976):
Q=A 2g H
aab
in which:
(13)
siphon discharge, in cfsarea of pipeuniversal gravity constantcoefficient for velocity headcoefficient for friction losssame as head for pump with possibility of submerged outlet
Since siphon discharge is a secondary concern at the District, aa and ab are notestimated but rather combined with A and (2g)0.5 into a single coefficient, C. Thesiphoning discharge is expressed as a regression equation from field measurementsand is given by:
Q = cHn (14)
in which: Q = discharge rate, in cfsC = regression coefficient, estimate of A {(2g)/(aaab)}° .5
n = regression exponent, usually expected to be 0.5H = head, in feet
GATED SPILLWAYS
A gated spillway, or simply a spillway, is a water control structure which allowsdischarge into a passage and through a gate opening by means of gravity. Aspillway may have one or more gates or passages. Figure A-2 shows spillway S-49 onthe C-24 canal operating under controlled free flow conditions. The two gates arepartially open and water falls over the crest of the spillway into the downstreamside.
History of Spillway Equations
From September 1960 to December 1961, the U.S. Army Engineer WaterwaysExperiment Station conducted a model study of the typical District (then Central andSouthern Florida Project) gated spillway structure (Corps of Engineers, 1963). Thedischarge characteristics of free and submerged, controlled and uncontrolled flowswere satisfied by certain equations. These equations were stated, the dischargecoefficients evaluated, and the limits of each flow regime established in terms ofdimensionless quantities.
The District has applied the USCOE equations and calibrated them for eachindividual structure. The District has also simplified accordingly the limits of the flowregimes (Steve Lin, September 29, 1992). In reviewing this publication, importantcomments regarding the improvement of the gated spillway equations were madein a memorandum by Damisse and Cadavid (1993) reproduced in Appendix B. It issuggested that these comments are studied for their implementation in the Flowprogram.
Gate and Pool Restrictions
Flow through a spillway may be controlled or uncontrolled, depending on theposition of the gate with reference to the upstream stage. When the bottom of thegate is lower than the upstream stage, the flow through the spillway is controlled.When the bottom of the gate is higher than the upstream stage, the flow throughthe spillway is uncontrolled.
Flow through a spillway may be free or submerged depending on the downstreamstage. When the flow is not restricted by the downstream pool and the downstreamstage is below the sill elevation, the flow is said to be free. Submerged flow refers toa downstream stage which is above the sill elevation and a downstream pool whichpartially restricts the flow. Figure 5 is a schematic of the longitudinal profile of a
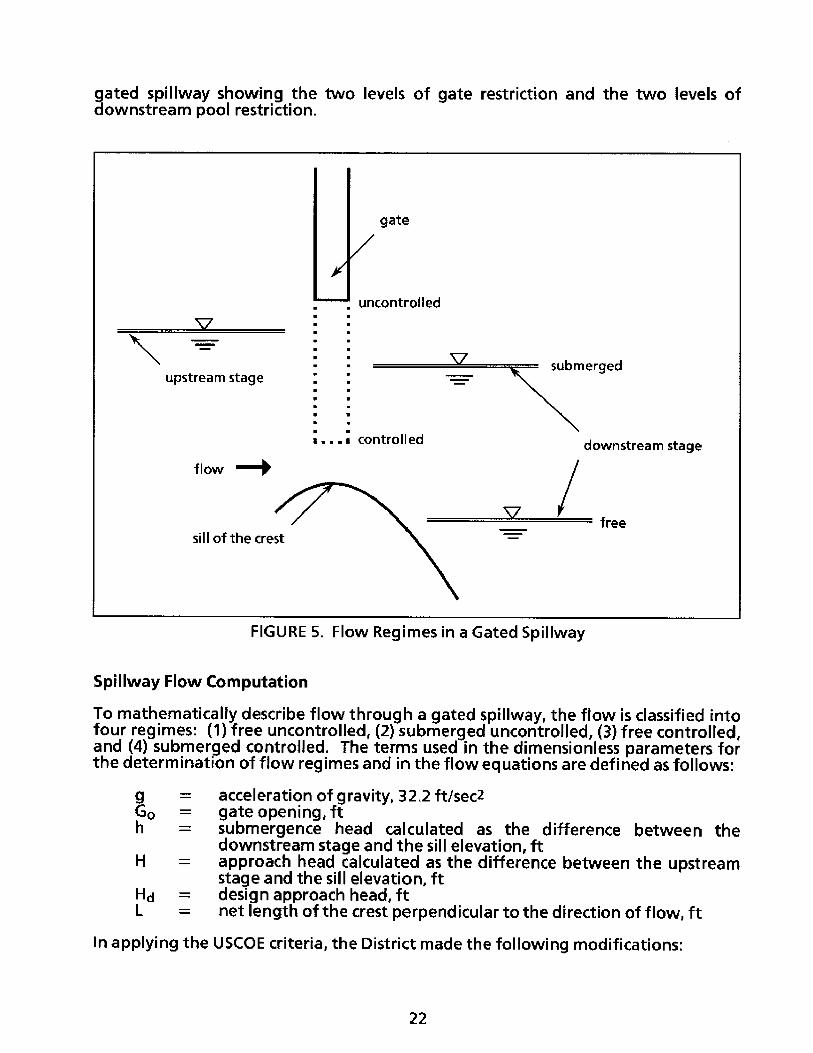
gated spillway showing the two levels of gate restriction and the two levels ofdownstream pool restriction.
gate
uncontrolled
upstream stage
flow
submeraed
z...i controlled
'S J-
downstream stage
freesill of the cre
FIGURE 5. Flow Regimes in a Gated Spillway
Spillway Flow Computation
To mathematically describe flow through a gated spillway, the flow is classified intofour regimes: (1) free uncontrolled, (2) submerged uncontrolled, (3) free controlled,and (4) submerged controlled. The terms used in the dimensionless parameters forthe determination of flow regimes and in the flow equations are defined as follows:
g = acceleration of gravity, 32.2 ft/sec2Go = gate opening, fth = submergence head calculated as the difference between the
downstream stage and the sill elevation, ftH = approach head calculated as the difference between the upstream
stage and the sill elevation, ftHd = design approach head, ftL = net length of the crest perpendicular to the direction of flow, ft
In applying the USCOE criteria, the District made the following modifications:
Y
Y
P
--
7
1. The controlled flow criteria was reduced from H/Go > 2.0 to H/Go > 1.7.2. The uncontrolled flow criteria was reduced from H/Go < 2.0 to H/Go < 1.0.3. The boundary between uncontrolled free and uncontrolled submerged
flow was fixed at h/H = 0.5. The USCOE boundary varies between h/Hvalues of 0.2 and 0.6, according to H/Hd.
4. The boundary between controlled free and controlled submerged flow wasfixed at h/Go = 0.5. The USCOE boundary varies between h/H values of 0.2and 0.6, according to H/Go.
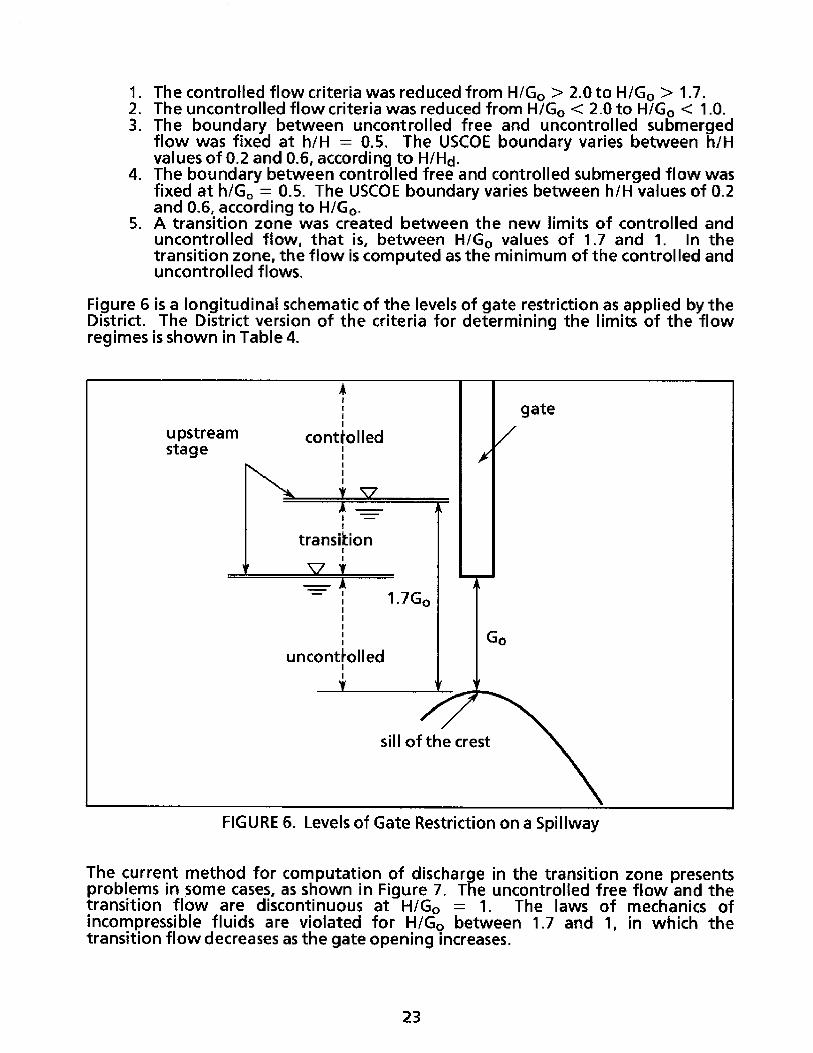
5. A transition zone was created between the new limits of controlled anduncontrolled flow, that is, between H/Go values of 1.7 and 1. In thetransition zone, the flow is computed as the minimum of the controlled anduncontrolled flows.
Figure 6 is a longitudinal schematic of the levels of gate restriction as applied by theDistrict. The District version of the criteria for determining the limits of the flowregimes is shown in Table 4.
FIGURE 6. Levels of Gate Restriction on a Spillway
The current method for computation of discharge in the transition zone presentsproblems in some cases, as shown in Figure 7. The uncontrolled free flow and thetransition flow are discontinuous at H/Go = 1. The laws of mechanics ofincompressible fluids are violated for H/Go between 1.7 and 1, in which thetransition flow decreases as the gate opening increases.
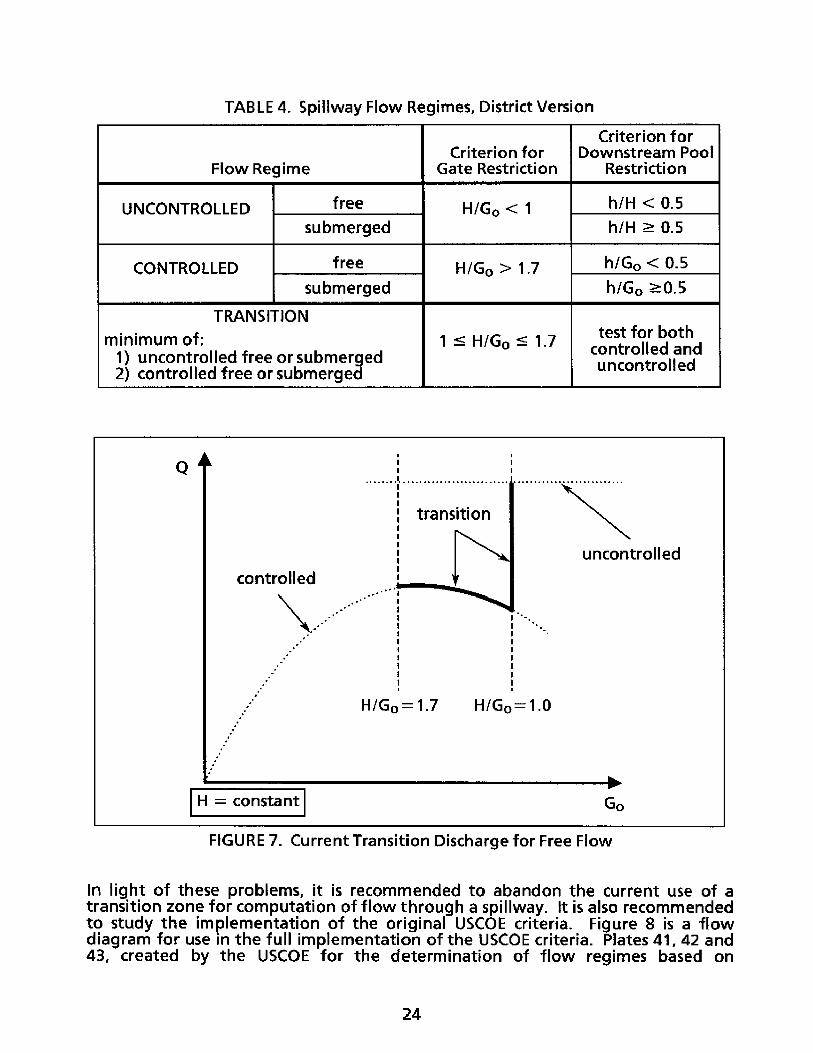
TABLE 4. Spillway Flow Regimes, District Version
Criterion forCriterion for Downstream Pool
Flow Regime Gate Restriction Restriction
UNCONTROLLED free H/Go < 1 h/H < 0.5
submerged h/H 2 0.5
CONTROLLED free H/Go > 1.7 h/Go < 0.5
submerged h/Go >0.5
TRANSITIONtest for bothminimum of: 1 s HIGo - 1.7 controlled and
1) uncontrolled free or submerged uncontrolled2) controlled free or submerged
Q
IIcontrlleduncontrolled
I
111
l oo.
o1
H/Go=1.7 H/Go=1.0
H = constant Go
FIGURE 7. Current Transition Discharge for Free Flow
In light of these problems, it is recommended to abandon the current use of atransition zone for computation of flow through a spillway. It is also recommendedto study the implementation of the original USCOE criteria. Figure 8 is a flowdiagram for use in the full implementation of the USCOE criteria. Plates 41, 42 and43, created by the USCOE for the determination of flow regimes based on
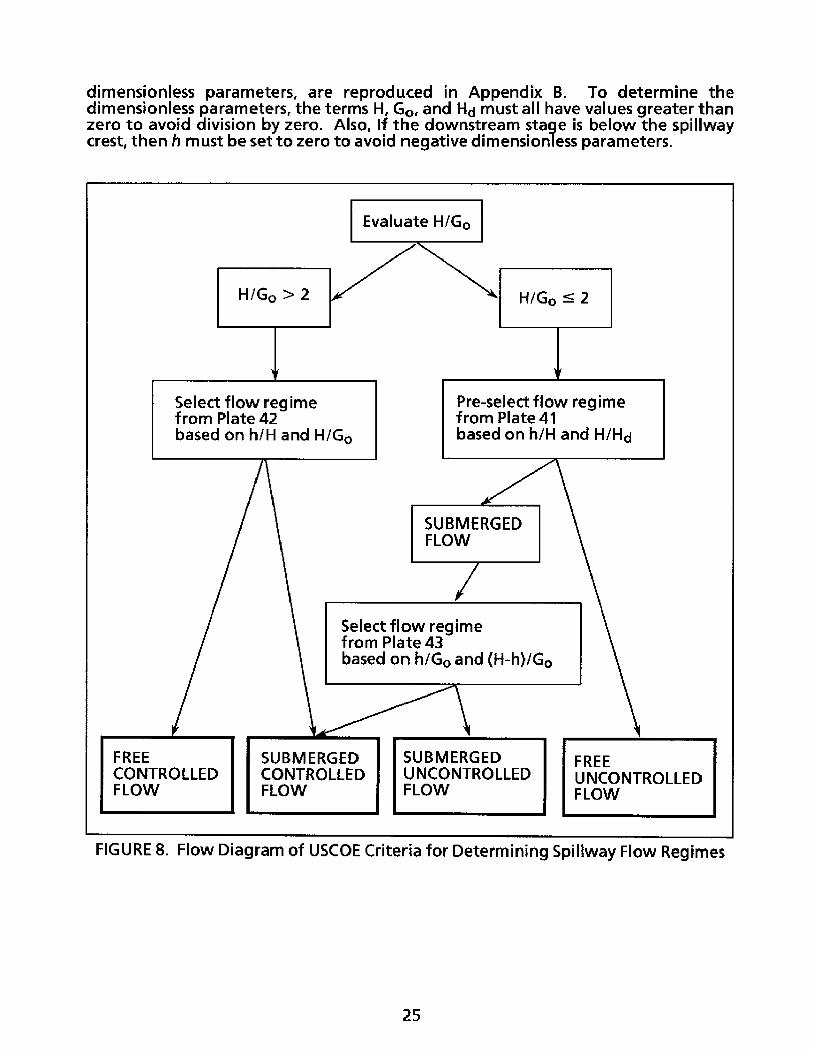
dimensionless parameters, are reproduced in Appendix B. To determine thedimensionless parameters, the terms H, Go, and Hd must all have values greater thanzero to avoid division by zero. Also, If the downstream stage is below the spillwaycrest, then h must be set to zero to avoid negative dimensionless parameters.
FIGURE 8. Flow Diagram of USCOE Criteria for Determining Spillway Flow Regimes
~_~~__~~ _
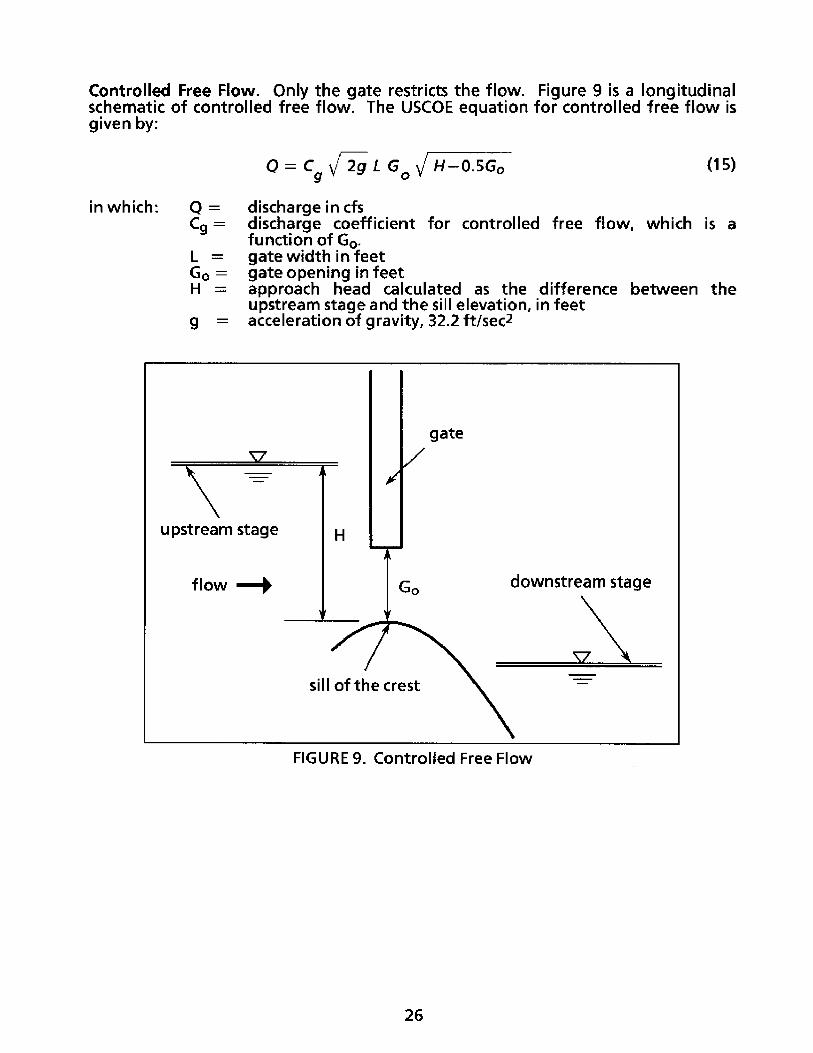
Controlled Free Flow. Only the gate restricts the flow. Figure 9 is a longitudinalschematic of controlled free flow. The USCOE equation for controlled free flow isgiven by:
Q = C 2gL G H-0.Go (15)
Q = discharge in cfsCg = discharge coefficient for controlled free flow, which is a
function of Go.L = gate width in feetGo = gate opening in feetH = approach head calculated as the difference between the
upstream stage and the sill elevation, in feetg = acceleration of gravity, 32.2 ft/sec2
FIGURE 9. Controlled Free Flow
in which:
gate
upstream stage
lownstream stageflow --
sil
__77\
\Illq
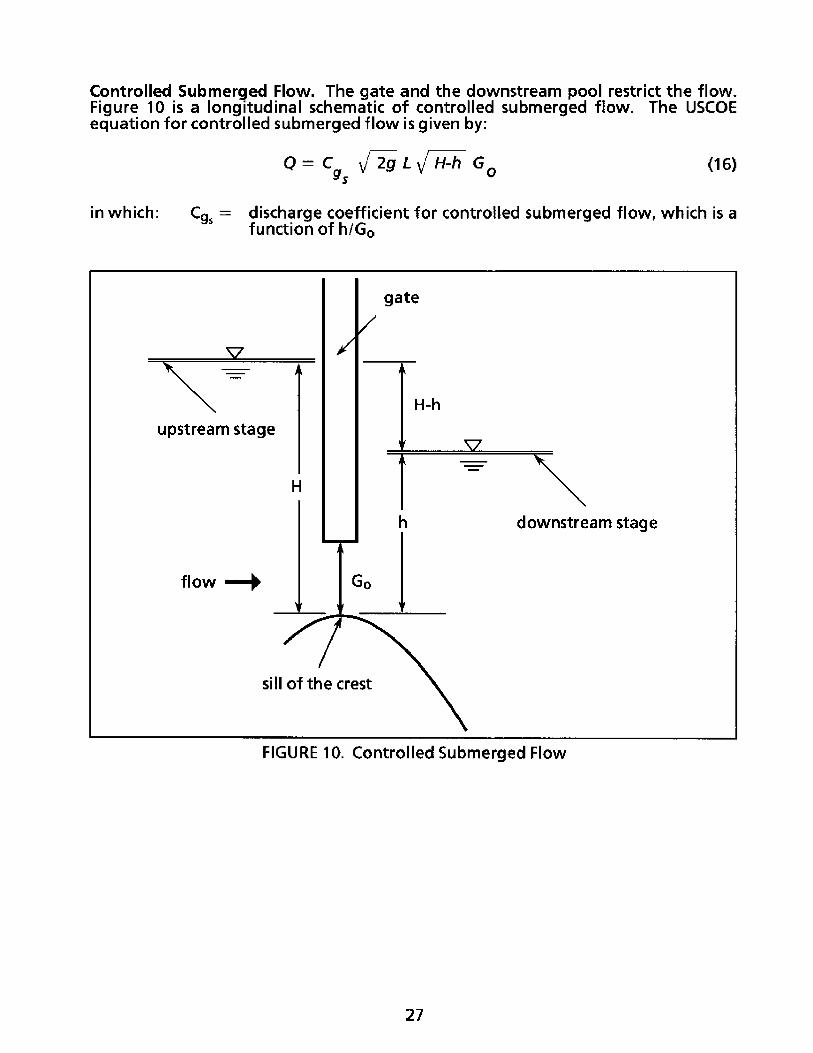
Controlled Submerged Flow. The gate and the downstream pool restrict the flow.Figure 10 is a longitudinal schematic of controlled submerged flow. The USCOEequation for controlled submerged flow is given by:
Q= Cg 2g L H-h Gs0 (16)
Cgs = discharge coefficient for controlled submerged flow, which is afunction of h/Go
upstream stage
flow -- )
gate/
7downstream stage
downstream stage
si
FIGURE 10. Controlled Submerged Flow
in which:
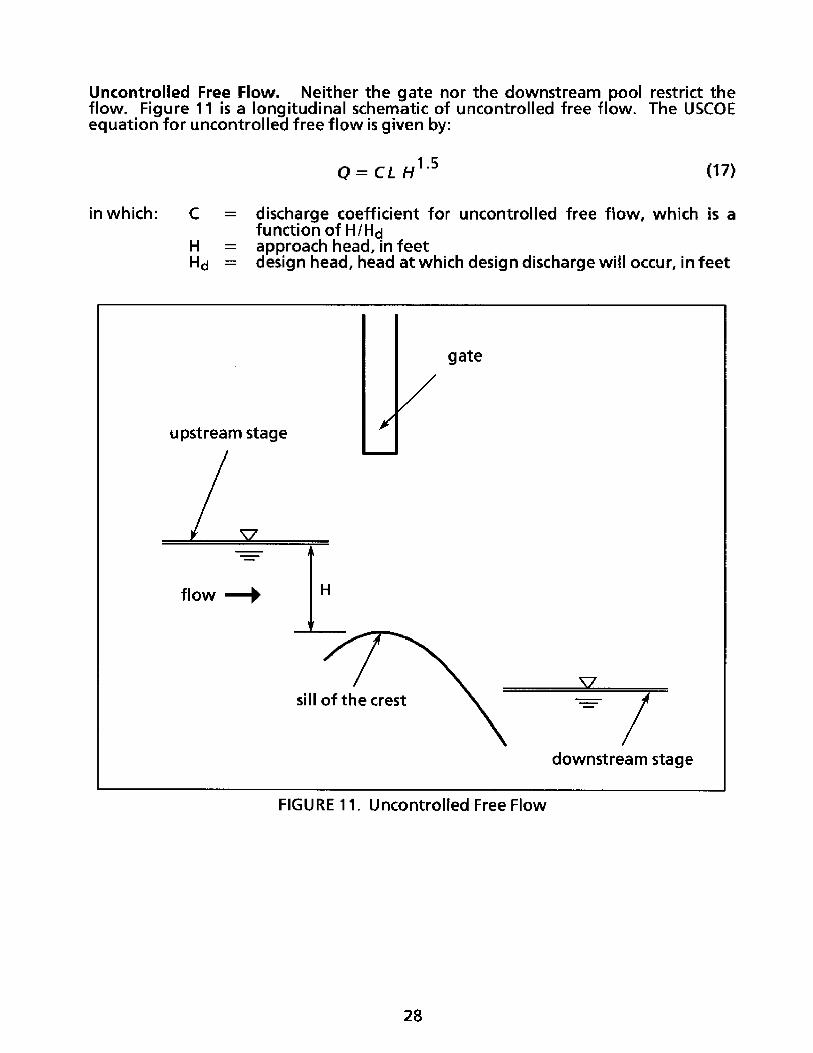
Uncontrolled Free Flow. Neither the gate nor the downstream pool restrict theflow. Figure 11 is a longitudinal schematic of uncontrolled free flow. The USCOEequation for uncontrolled free flow is given by:
Q = CL H 1 .5 (17)
= discharge coefficient for uncontrolled free flow, which is afunction of H/Hd
= approach head, in feet= design head, head at which design discharge will occur, in feet
FIGURE 11. Uncontrolled Free Flow
in which:
gate
upstream stage
flow -)
sill
-downstream stagedownstream stage
1
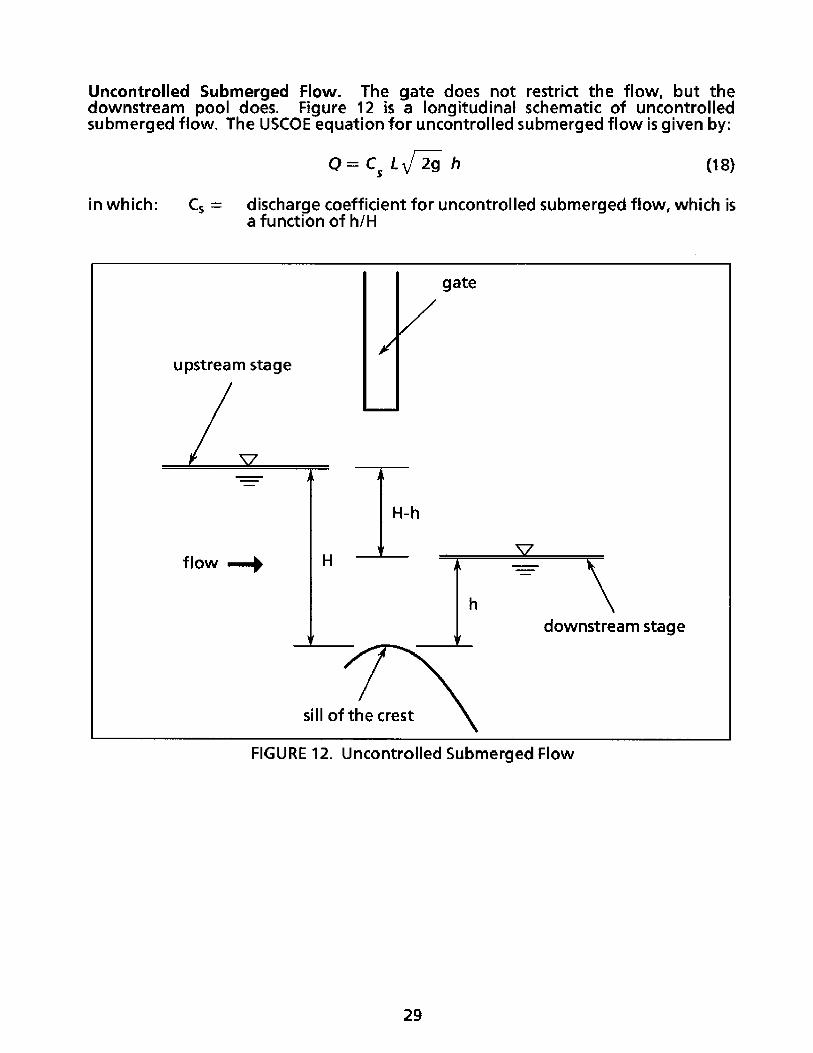
Uncontrolled Submerged Flow. The gate does not restrict the flow, but thedownstream pool does. Figure 12 is a longitudinal schematic of uncontrolledsubmerged flow. The USCOE equation for uncontrolled submerged flow is given by:
Q = C L 2g h
in which:
(18)
Cs = discharge coefficient for uncontrolled submerged flow, which isa function of h/H
upstream stage/
flow "-
hdownstream stage
FIGURE 12. Uncontrolled Submerged Flow
gate
/
H
sill o1
/ 7
V-
1si II
of
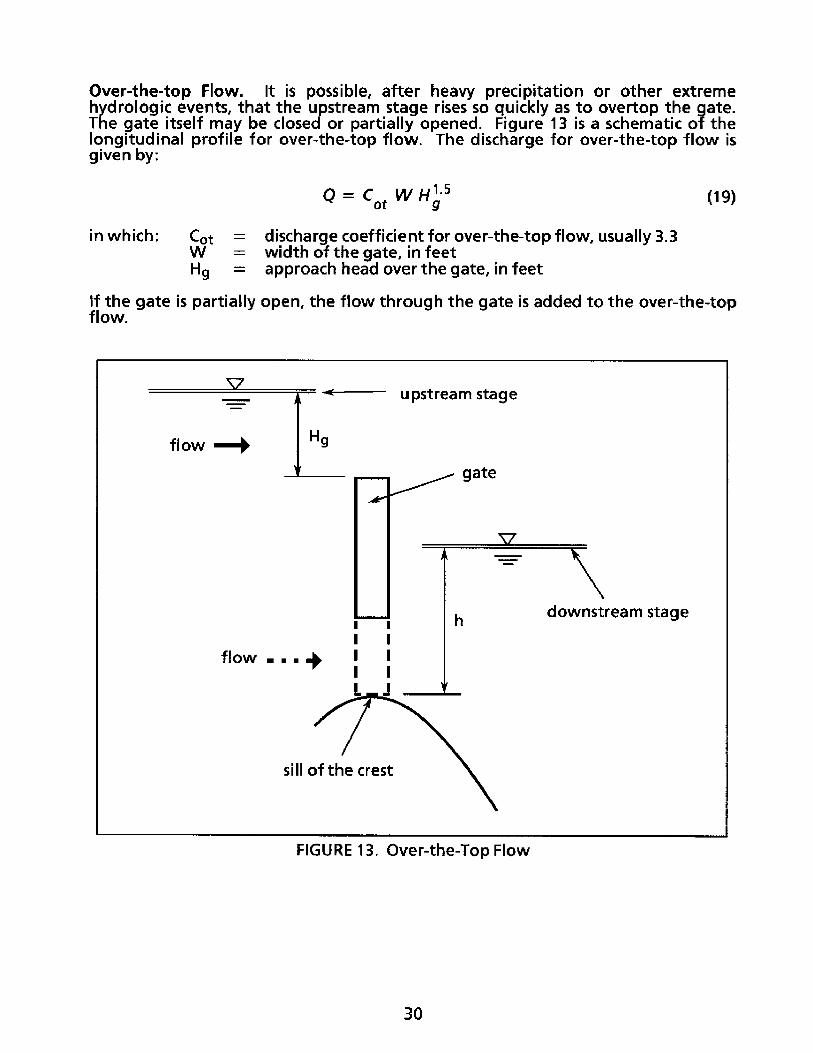
Over-the-top Flow. It is possible, after heavy precipitation or other extremehydrologic events, that the upstream stage rises so quickly as to overtop the gate.The gate itself may be closed or partially opened. Figure 13 is a schematic of thelongitudinal profile for over-the-top flow. The discharge for over-the-top flow isgiven by:
Q = Cot W H1.5org (19)
in which: CotWHg
If the gate is partiflow.
= discharge coefficient for over-the-top flow, usually 3.3= width of the gate, in feet= approach head over the gate, in feet
ally open, the flow through the gate is added to the over-the-top
flow
- - upstream stage
Hg
g .. ate
-
I II Iflow ... I I
I I
h downstream stage
sill c
FIGURE 13. Over-the-Top Flow
V
gate
Reverse Flow. When a coastal gated spillway is operated under uncontrolledsubmerged conditions to drain a basin after a heavy storm, it is not unusual for arising tide to flow inland for a short period of time. In this case, and in any othercase where the downstream stage is found to be higher than the upstream stage,reverse flow occurs. For computational purposes, the upstream and downstreamstage values are interchanged and a negative sign precedes the resultant flow.
Discharge measurements for reverse flow conditions at spillways are rarely carriedout due to the lack of advance notice, the short duration of these conditions, andthe unconventional flow patterns present in the stream during reverse flow.Whenever verification is not available, it is suggested that a reverse flow estimate(negative flow) at a spillway be interpreted as an indicator of flow direction or as awarning of a possible gauge datum error, rather than an estimate of reverse flowquantity.
Bypassing the Spillway. The bypass stage is the elevation above which part or all ofthe flow circumvents the spillway. For example, if a spillway is built on a levee, theelevation of the crown of the levee is the bypass stage. The flow dischargingthrough the spillway and the flow overtopping the spillway can be estimated.However, the flow bypassing the spillway cannot be estimated. Therefore, theactual flow under these conditions is greater than what can be estimated with theflow equations. Nevertheless, the appropriate flow equations are applied and a">" (greater than) tag is attached to the resultant flow.
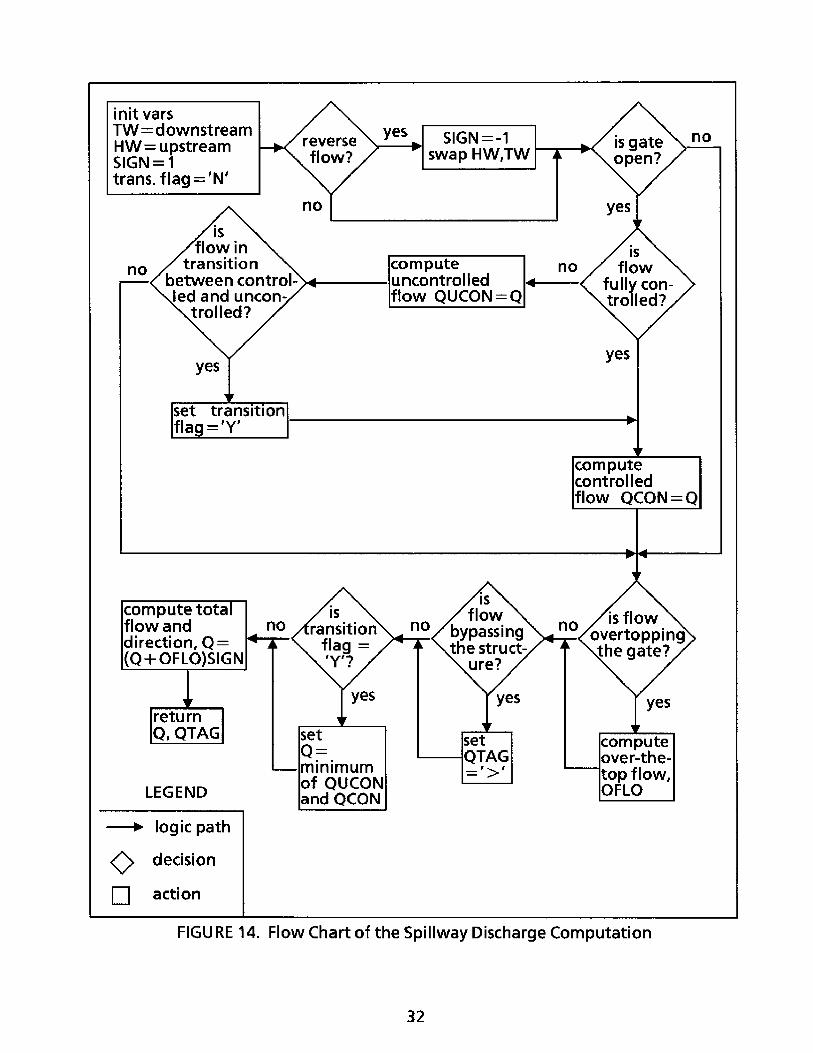
Total Flow. The total flow through a gated spillway, computed by the flowprogram, considers the direction of the flow, the restrictions imposed by the gateand the downstream pool, and the provisions for overtopping and bypassing. Figure14 is a flow chart of the discharge computation. The logic is structured from top tobottom in a simple and concise path.
District Use of USCOE Spillway Equations
The District applies the USCOE spillway equations to the computation of dischargeby calibrating the equations with discharge measurements. In applying theequations, the District has classified its spi Illways into three cases according to: (1) thedegree of similarity between the spillway and the typical spillway (S-71) used by theUSCOE in developing its equations, (2) the availability of discharge measurements atthe spillway, and (3) the level of calibration accomplished.
Case 1. The USCOE spillway equations are used in their original form except for thedischarge coefficient, which is a constant. Case 1 is used when the spillway ishydraulically similar to S-71 and no relationship is found between the dischargecoefficient and any of the hydraulic variables (H, h or Go), in any of the flow regimes.Median values of the discharge coefficient most often used at the District and therange of values used are shown in Table 5 for each flow regime. For example, thedischarge coefficients for the G-56 spillway in the Hillsboro Canal are as follows:
1) Controlled free: Cg = 0.752) Controlled submerged: Cgs= 0.723) Uncontrolled free: C = 2.904) Uncontrolled submerged: Cs = 0.90
Case 2. The USCOE spillway equations are used in their original form. However, thedischarge coefficient may be a constant or a function of one or more hydraulic
- logic path
decision
I action
FIGU RE 14. Flow Chart of the Spillway Discharge Computation
32
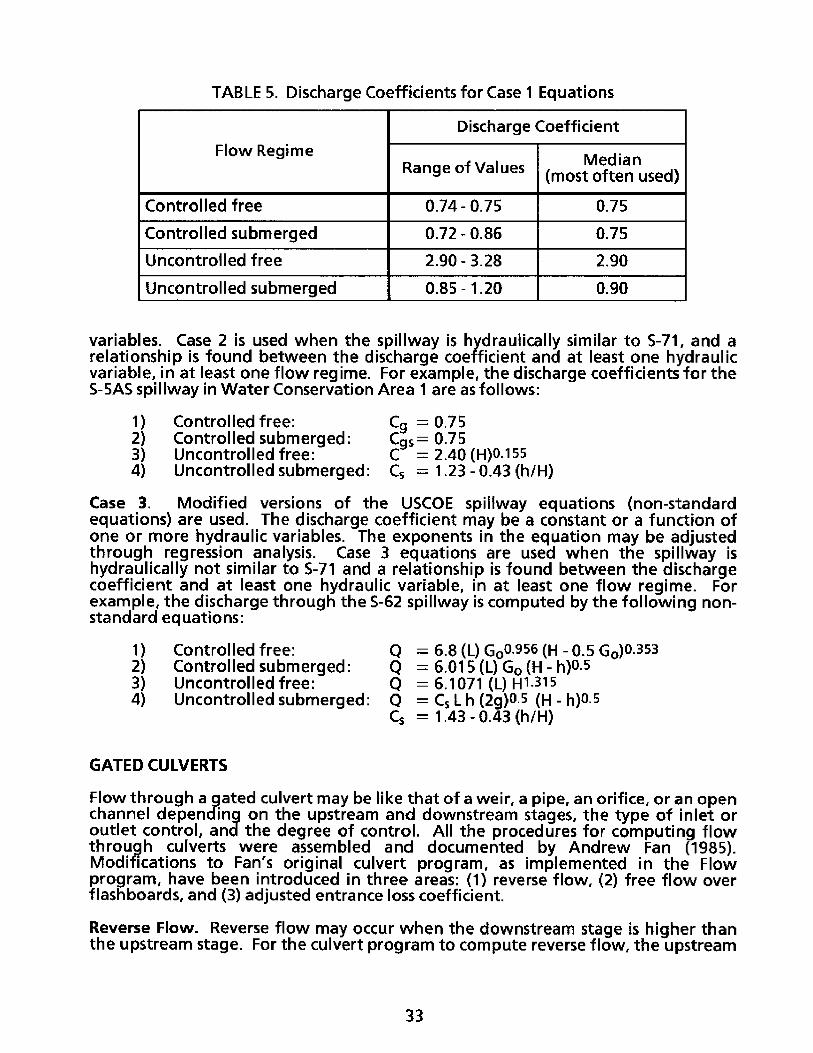
TABLE 5. Discharge Coefficients for Case 1 Equations
Discharge Coefficient
Flow Regime MedianRange of Values (most often used)
Controlled free 0.74- 0.75 0.75
Controlled submerged 0.72 - 0.86 0.75
Uncontrolled free 2.90 - 3.28 2.90
Uncontrolled submerged 0.85 - 1.20 0.90
variables. Case 2 is used when the spillway is hydraulically similar to 5-71, and arelationship is found between the discharge coefficient and at least one hydraulicvariable, in at least one flow regime. For example, the discharge coefficients for theS-5AS spillway in Water Conservation Area 1 are as follows:
Controlled free:Controlled submerged:Uncontrolled free:Uncontrolled submerged:
C = 0.75Cgs= 0.75C = 2.40 (H)0.155Cs = 1.23 - 0.43 (h/H)
Case 3. Modified versions of the USCOE spillway equations (non-standardequations) are used. The discharge coefficient may be a constant or a function ofone or more hydraulic variables. The exponents in the equation may be adjustedthrough regression analysis. Case 3 equations are used when the spillway ishydraulically not similar to S-71 and a relationship is found between the dischargecoefficient and at least one hydraulic variable, in at least one flow regime. Forexample, the discharge through the 5-62 spillway is computed by the following non-standard equations:
Controlled free:Controlled submerged:Uncontrolled free:Uncontrolled submerged:
6.8 (L) Goo0. 9 56 (H - 0.5 Go)0.3536.015 (L) Go (H - h).56.1071 (L) H1.315Cs L h (2g)0.5 (H- h)o.s1.43 - 0.43 (h/H)
GATED CULVERTS
Flow through a gated culvert may be like that of a weir, a pipe, an orifice, or an openchannel depending on the upstream and downstream stages, the type of inlet oroutlet control, and the degree of control. All the procedures for computing flowthrough culverts were assembled and documented by Andrew Fan (1985).Modifications to Fan's original culvert program, as implemented in the Flowprogram, have been introduced in three areas: (1) reverse flow, (2) free flow overflashboards, and (3) adjusted entrance loss coefficient.
Reverse Flow. Reverse flow may occur when the downstream stage is higher thanthe upstream stage. For the culvert program to compute reverse flow, the upstream
stage and the inlet invert elevation must be interchanged with the downstreamstage and the outlet invert elevation, respectively. In Fan's version, the head overthe inlet invert and the head over the outlet invert are computed before the stageand invert elevations are interchanged. Consequently, the heads are incorrectlycalculated. This results in an incorrect flow estimate since the heads are usedthroughout the culvert program for selecting flow regimes, calculating depths offlow, and adjusting the entrance loss coefficient. The problem is corrected in Flow'sversion by first interchanging the stages and invert elevations and then computingthe heads.
Although the stage and invert elevations at either end of the gated culvert arecorrectly interchanged for reverse flow computation, the entrance loss properties ofthe outlet are assumed to be the same as those of the inlet. Since the outlet isusually not designed as an entrance, it is likely that the entrance losses under reverseflow are greater than under normal flow conditions. Therefore, it is suggested toassign appropriate entrance loss properties to the outlet and to use these whenreverse flow is computed.
Free Flow Over Flashboards. Flashboards are sometimes used at culverts instead ofgates. A flash board elevation that is lower than the upstream stage, but higher thanthe downstream stage, enables a discharge condition known as free flow. As long asfree flow exists and the flow over the flashboard does not exceed the culvertcapacity, the discharge through the culvert is estimated by computing the dischargeover the flashboard. Fan's original version incorrectly assigns zero flows to certainfree flow circumstances. The Flow program correctly computes free flow over aflashboard. The memorandum by Otero documenting the problem and its solutionis reproduced in Appendix B.
Adjusted Entrance Loss Coefficient. The entrance loss coefficient, K, accounts forthe head loss due to sudden contraction at the inlet. K has a range from 0.1 to 0.9.The head loss is higher for lower values of K.
Fan recognized that the entrance loss coefficient is not the same for different flowregimes such as open channel, weir, or pipe flow. Therefore, an adjusted entranceloss coefficient, Ke, is defined for each flow regime. Differences in computing Kebetween Fan's and Flow's versions suggest that fine-tuning was performed between1982 and 1990.
A study was performed on the applicability of the culvert program to a wide rangeof culvert types. The study concluded that the calculation of the Ke for differentflow regimes should be further improved. (Straley, August 1991)
It is recommended that a study be performed to evaluate the entrance losscoefficient for the three main inlet shapes found in the District: (1) projecting inlet,(2) flush headwall, and (3) wingwall. The coefficients should be evaluated forculverts flowing under the following regimes: (1) full pipe flow, (2) open channelflow, and (3) orifice flow. In addition, the entrance loss coefficient should beevaluated for small inlet gate restrictions where the flow regime is not shifted butthe coefficient is adjusted.
Miscellaneous Modifications. Some array elements are used in the main section ofFlow's version instead of the simple variables used in Fan's version. Array elementsare necessary to handle database information on multiple barrels at a culvertstructure. This does not affect the logic of the culvert program. Array elements fromthe main section are passed as simple variables to internal subroutines.
WEIRS
A typical weir at the District consists of a rectangular notch in a dam. There are threetypes of weirs according to the crest and notch configuration: (1) ogee, (2)trapezoidal, and (3) variable. Figure A-3 in Appendix A shows free flow conditions atweir 5-48.
The terms used in the flow equations for weirs are defined as follows:
B = width of the channel, in feetd = depth of the notch, in feeth = submergence head over the crest, difference between the
downstream stage and the crest elevation, in feetH = approach head over the crest, difference between the upstream stage
and the crest elevation, in feetL = measured length of the crest perpendicular to the flow, in feetn = exponent, usually expected to be 1.5We = width of the crest in the direction of flow, in feet
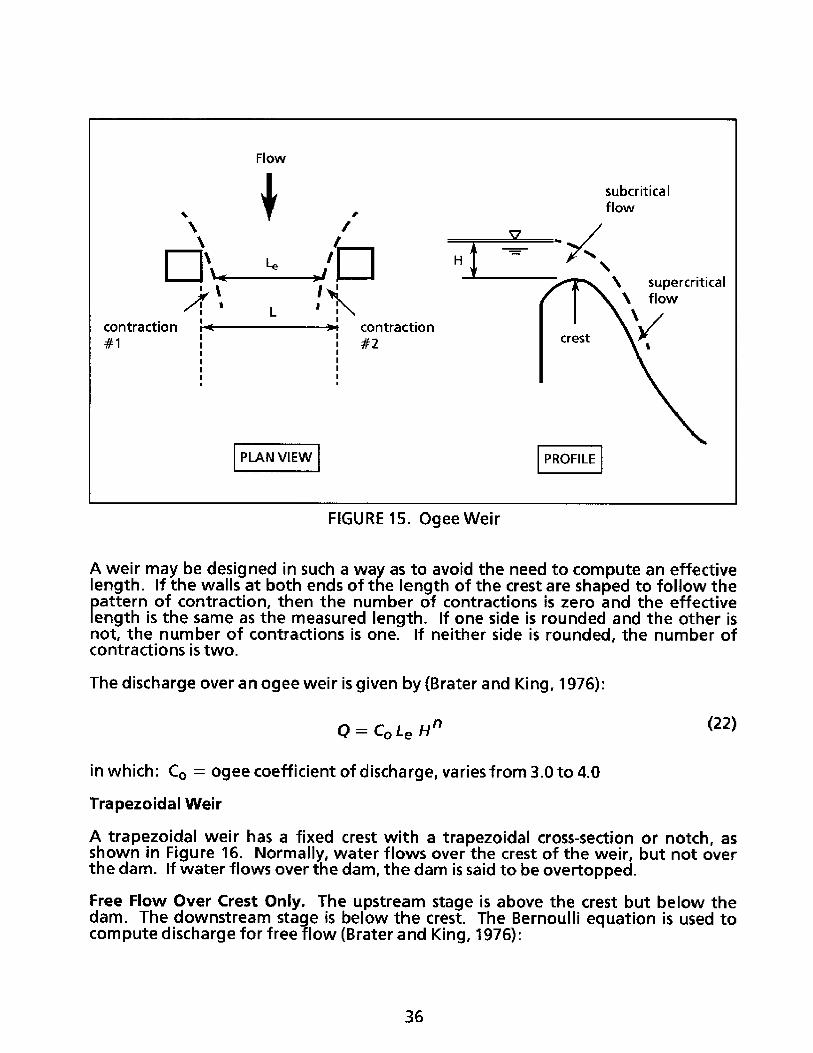
Ogee Weir
An ogee, or parabolic, weir is a spillway structure without a gate. There are only twoogee weirs at the District, 5-48 and S-50. Both are coastal structures whose crestelevations are 8 and 12 ft above m.s.l., respectively. Submerged flow or reverse flowcan only occur during a tidal surge high enough to overtop the crest elevation. Inaddition, ogee weirs lack downstream stage recorders. Therefore, submerged flowor reverse flow are not contemplated in ogee weir discharge computations.
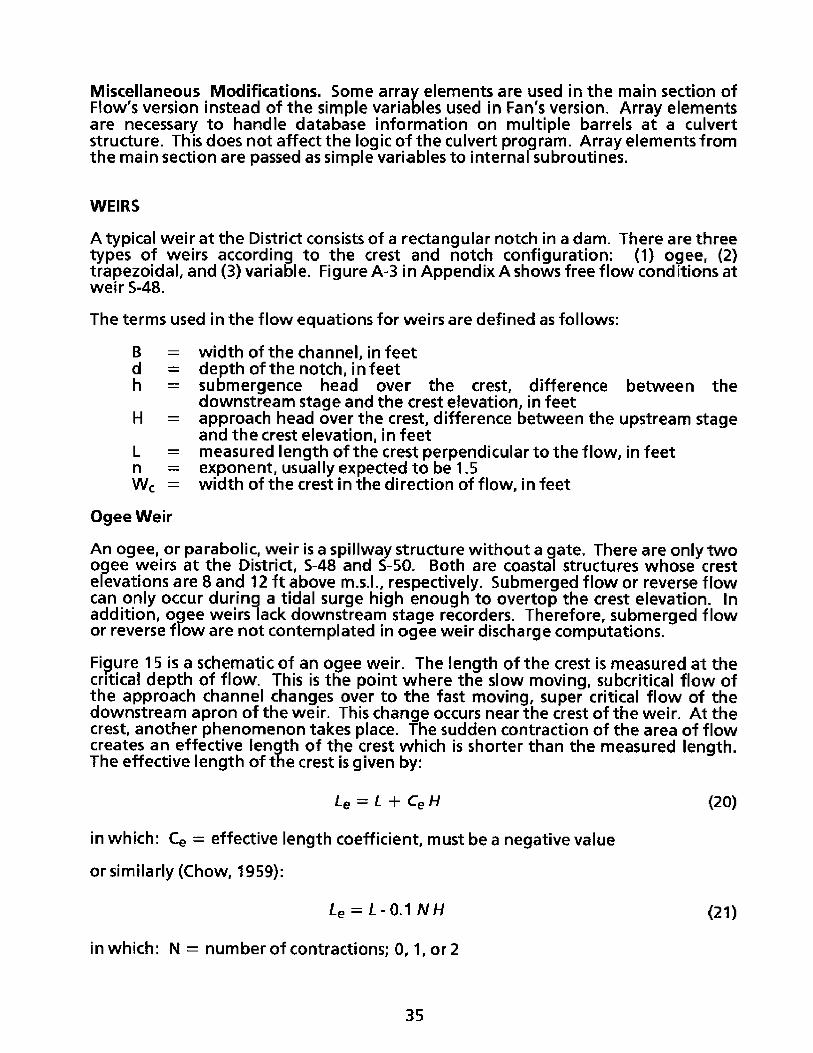
Figure 15 is a schematic of an ogee weir. The length of the crest is measured at thecritical depth of flow. This is the point where the slow moving, subcritical flow ofthe approach channel changes over to the fast moving, super critical flow of thedownstream apron of the weir. This change occurs near the crest of the weir. At thecrest, another phenomenon takes place. The sudden contraction of the area of flowcreates an effective length of the crest which is shorter than the measured length.The effective length of the crest is given by:
Le = L + Ce H (20)
in which: Ce = effective length coefficient, must be a negative value
or similarly (Chow, 1959):
Le = L-0.1 NH (21)
in which: N = number of contractions; 0, 1, or 2
contracti#1
Flow
4C subcriticalflow
v /H
cal
' L I
I I
on o #2
PRQFILE
FIGURE 15. Ogee Weir
A weir may be designed in such a way as to avoid the need to compute an effectivelength. If the walls at both ends of the length of the crest are shaped to follow thepattern of contraction, then the number of contractions is zero and the effectivelength is the same as the measured length. If one side is rounded and the other isnot, the number of contractions is one. If neither side is rounded, the number ofcontractions is two.
The discharge over an ogee weir is given by (Brater and King, 1976):
Q = Co Le Hn (22)
in which: Co = ogee coefficient of discharge, varies from 3.0 to 4.0
Trapezoidal Weir
A trapezoidal weir has a fixed crest with a trapezoidal cross-section or notch, asshown in Figure 16. Normally, water flows over the crest of the weir, but not overthe dam. If water flows over the dam, the dam is said to be overtopped.
Free Flow Over Crest Only. The upstream stage is above the crest but below thedam. The downstream stage is below the crest. The Bernoulli equation is used tocompute discharge for free flow (Brater and King, 1976):
ntraction
|
I PLAN VIEW I
III
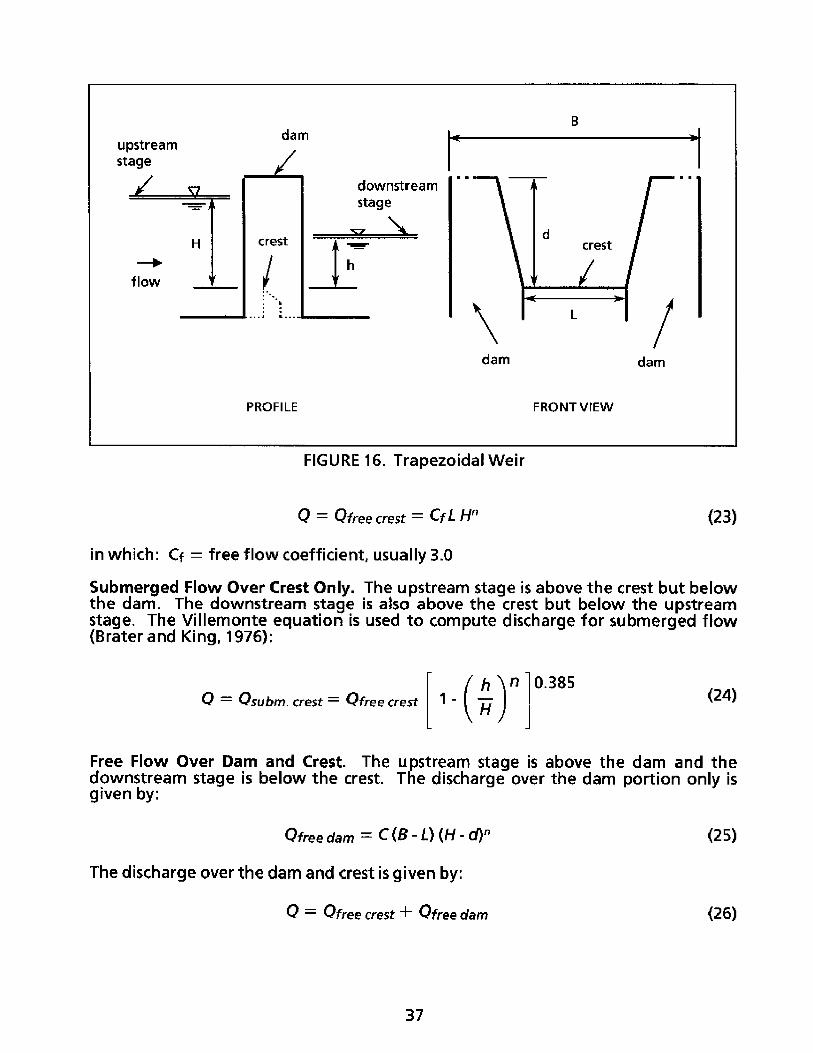
FIGURE 16. Trapezoidal Weir
Q = Qfree crest = CfL H" (23)
in which: Cf = free flow coefficient, usually 3.0
Submerged Flow Over Crest Only. The upstream stage is above the crest but belowthe dam. The downstream stage is also above the crest but below the upstreamstage. The Villemonte equation is used to compute discharge for submerged flow(Brater and King, 1976):
Q = Qsubm. crest = Qfree crest 1 - ) (24)
Free Flow Over Dam and Crest. The upstream stage is above the dam and thedownstream stage is below the crest. The discharge over the dam portion only isgiven by:
Qfree dam = C (B - L) (H - d)" (25)
The discharge over the dam and crest is given by:
0 = Qfree crest + Qfree dam (26)
Free Flow Over Dam, Submerged Flow Over Crest. The upstream stage is above thedam. The downstream stage is above the crest but below the dam. The discharge isgiven by:
Q = Qsubm. crest+ Qfree dam (27)
Submerged Flow Over Dam and Crest. The upstream stage is above the dam. Thedownstream stage is above the dam but below the upstream stage. The dischargeover the dam portion only is given by:
Qsubm. dam = Qfree dam 1- H-d (28)
The discharge over the dam and crest is given by:
0 = Q subm. crest + Q subm. dam (29)
Reverse Flow. Reverse flow occurs when the downstream stage is higher than theweir crest and the upstream stage. To account for reverse flow, the upstream anddownstream stages are interchanged and the discharge computation is performedas shown in Equations (23) through (29). A negative sign is added to the resultantdischarge value.
It is suggested that reverse flow computation be checked with dischargemeasurements, as weir coefficients may not be applicable in reverse flow.
Variable Weir
A variable crest weir is a dam in which the depth of the notch can be regulated byraising or lowering the crest.
Crest width. The width of the crest of a variable weir is measured in the direction offlow. The width of a variable weir with stop logs is the width of the stop logs. Thewidth of a thin-plate weir depends on the position of the movable plate. If the plateis sufficiently raised above the fixed part of the weir, the width is the thickness of theplate. However, if the plate is nearly flush with the fixed part of the weir, the widthof the crest is the sum of the thickness of the plate and the width of the fixed part ofthe weir. A "transition elevation" of the crest is determined empirically below whichthe plate is considered flush with the fixed part of the weir.
Discharge coefficient. The discharge coefficient for a variable weir depends onwhether the weir is sharp-crested, broad-crested, or somewhere in between. Asharp crest is sufficiently narrow so that water flowing over the weir is detachedfrom the crest. A broad crest is rectangular in section and acts like a sharp crestwhen the head over the crest is one and one half times the width of the crest, in thedirection of flow. Table 6 summarizes the computation of the discharge coefficient.
Free flow. The upstream stage is above the crest but below the dam. Thedownstream stage is below the crest. The discharge is given by:
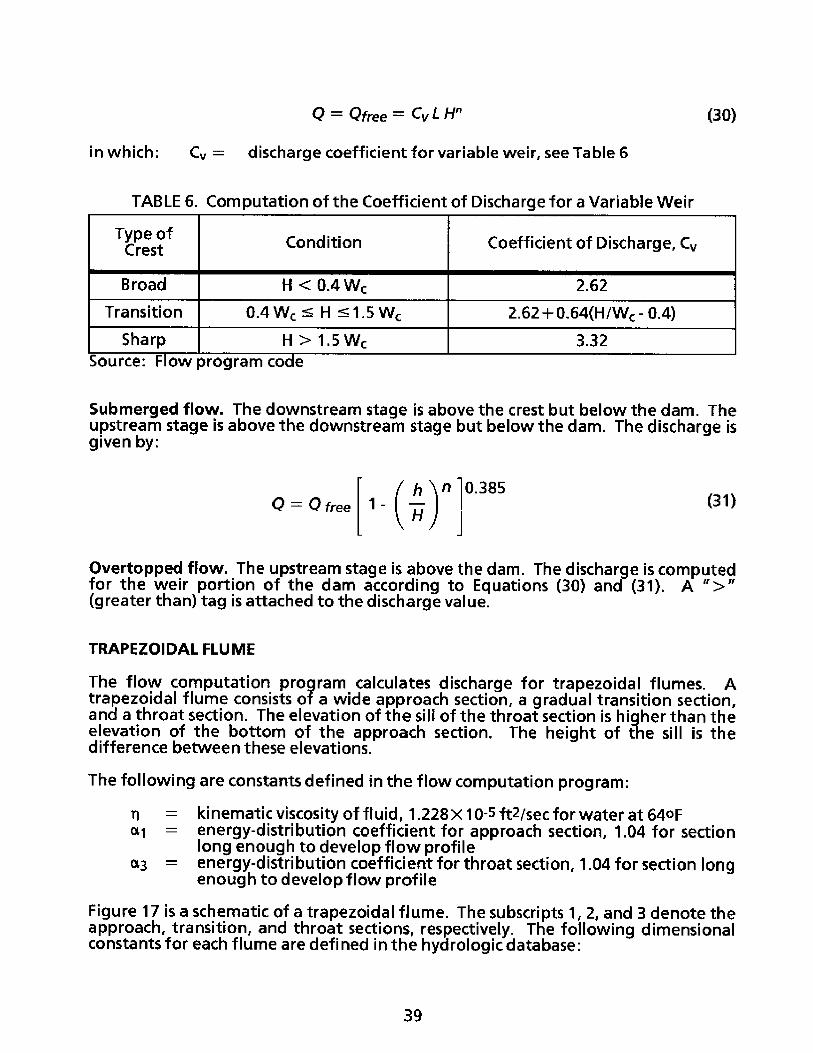
Q = Qfree = CvL H" (30)
in which: C, = discharge coefficient for variable weir, see Table 6
TABLE 6. Computation of the Coefficient of Discharge for a Variable Weir
Type of Condition Coefficient of Discharge, CvCrest
Broad H < 0.4 Wc 2.62
Transition 0.4 Wc SH < 1.5 Wc 2.62+0.64(H/W -0.4)
Sharp H > 1.5 Wc 3.32Source: Flow program code
Submerged flow. The downstream stage is above the crest but below the dam. Theupstream stage is above the downstream stage but below the dam. The discharge isgiven by:
=Qfree 1 - (31)
Overtopped flow. The upstream stage is above the dam. The discharge is computedfor the weir portion of the dam according to Equations (30) and (31). A ">"(greater than) tag is attached to the discharge value.
TRAPEZOIDAL FLUME
The flow computation program calculates discharge for trapezoidal flumes. Atrapezoidal flume consists of a wide approach section, a gradual transition section,and a throat section. The elevation of the sill of the throat section is higher than theelevation of the bottom of the approach section. The height of the sill is thedifference between these elevations.
The following are constants defined in the flow computation program:
n = kinematic viscosity of fluid, 1.228 x 10⁻⁵ ft 2/sec for water at 640Fal = energy-distribution coefficient for approach section, 1.04 for section
long enough to develop flow profilea3 = energy-distribution coefficient for throat section, 1.04 for section long
enough to develop flow profile
Figure 17 is a schematic of a trapezoidal flume. The subscripts 1,2, and 3 denote theapproach, transition, and throat sections, respectively. The following dimensionalconstants for each flume are defined in the hydrologic database:
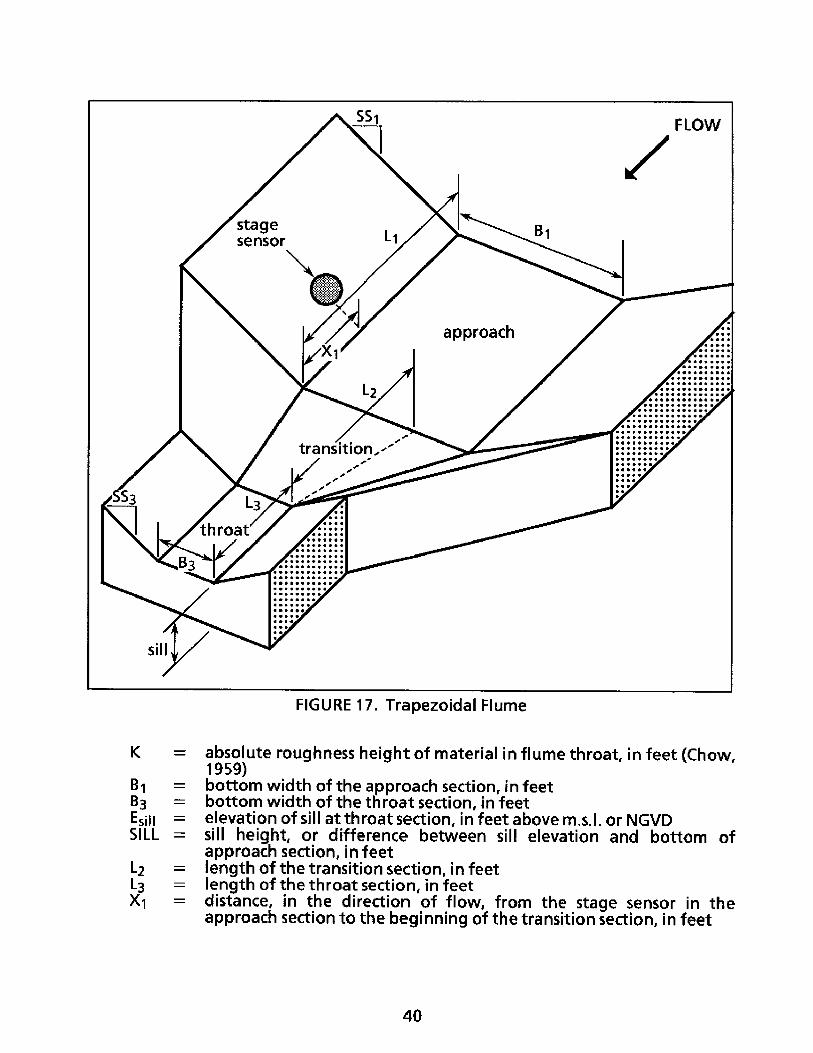
FIGURE 17. Trapezoidal Flume
K = absolute roughness height of material in flume throat, in feet (Chow,1959)
B1 = bottom width of the approach section, in feet83 = bottom width of the throat section, in feetEsill = elevation of sill at throat section, in feet above m.s.I. or NGVDSILL = sill height, or difference between sill elevation and bottom of
approach section, in feetL2 = length of the transition section, in feetL3 = length of the throat section, in feetX1 = distance, in the direction of flow, from the stage sensor in the
approach section to the beginning of the transition section, in feet
The explanation of the algorithms used for flow computation of trapezoidal flumesis beyond the scope of this publication. A detailed discussion of these algorithms isfound in Replogle (1975) and Schlichting (1960).
UNREGULATED OPEN CHANNEL
An unregulated open channel is a stream such as a canal or a river. To compute theflow through a reach of an unregulated open channel, a relationship is establishedbetween the upstream stage, the downstream stage, and the discharge. Thisrelationship is known as a rating curve. At least three discharge measurements mustbe performed at varying stages to establish the rating curve. The rating curveshould only be applied within the range of discharge measurements.
The terms used in the flow equations for unregulated open channels are defined asfollows:
A = constant for fixed stage difference between Edwn and Eup, in feetC = regression coefficientE = stage, in feetEo = base stage, in feetEdwn = downstream stage, in feetEup upstream stage, in feetn = regression exponent
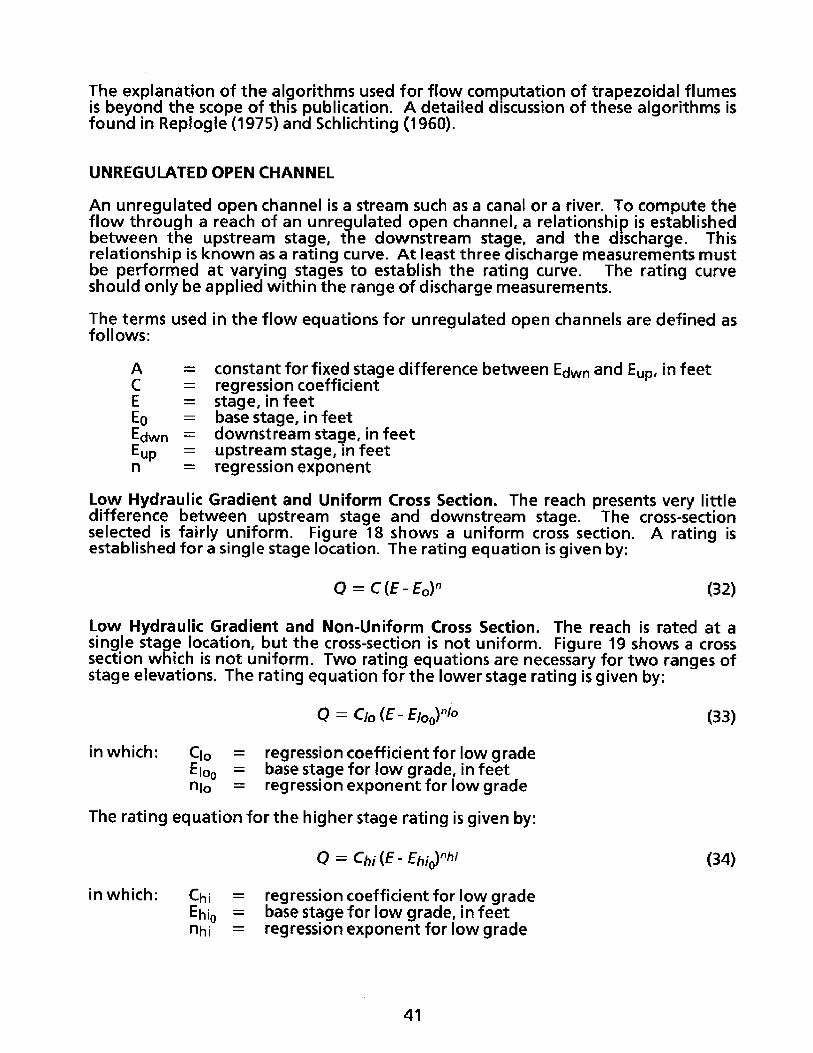
Low Hydraulic Gradient and Uniform Cross Section. The reach presents very littledifference between upstream stage and downstream stage. The cross-sectionselected is fairly uniform. Figure 18 shows a uniform cross section. A rating isestablished for a single stage location. The rating equation is given by:
Q = C (E- Eo)" (32)
Low Hydraulic Gradient and Non-Uniform Cross Section. The reach is rated at asingle stage location, but the cross-section is not uniform. Figure 19 shows a crosssection which is not uniform. Two rating equations are necessary for two ranges ofstage elevations. The rating equation for the lower stage rating is given by:
0 = Clo (E - Elo n lo (33)
in which: Clo = regression coefficient for low gradeEloo = base stage for low grade, in feetnlo = regression exponent for low grade
The rating equation for the higher stage rating is given by:
Q = Chi (E- Ehi)nht (34)
in which: Chi = regression coefficient for low gradeEhi0 = base stage for low grade, in feetnhi = regression exponent for low grade
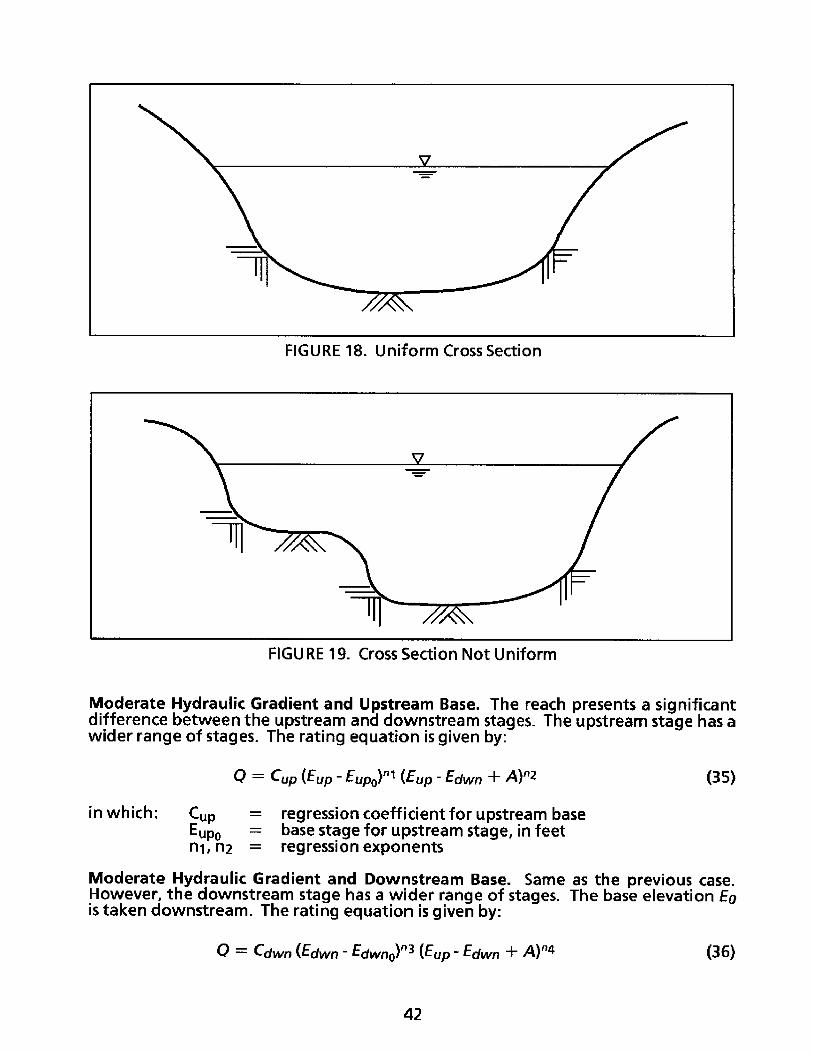
FIGURE 18. Uniform Cross Section
FIGURE 19. Cross Section Not Uniform
Moderate Hydraulic Gradient and Upstream Base. The reach presents a significantdifference between the upstream and downstream stages. The upstream stage has awider range of stages. The rating equation is given by:
Q = Cup (Eup - Eupo) " I (Eup - Edwn + A)"2 (35)
in which: Cup = regression coefficient for upstream baseEupo = base stage for upstream stage, in feetnl, n2 = regression exponents
Moderate Hydraulic Gradient and Downstream Base. Same as the previous case.However, the downstream stage has a wider range of stages. The base elevation Eois taken downstream. The rating equation is given by:
Q = Cdwn (Edwn - Edwno) " 3 (Eup - Edwn + A)n4 (36)
in which: Cdwn = regression coefficient for upstream baseEdwno = base stage for upstream stage, in feetn3, n 4 = regression exponents
Overbank Flow. The stage is higher than the bank, flow is computed for a stageequal to the bank elevation and a tag of " >" is attached to the discharge value.
FLOW CALCULATION NOT CONTEMPLATED
There are several flow conditions which are not contemplated due to the lack ofmethods for estimation or because the estimation method is not implemented in theFlow program. These include:
1. Water discharged through navigational locks during lock operation.2. Leakage of water through the separation between a closed gate, a
flashboard, or a set of stop logs and the fixed parts of a control structure.Also, leakage through the separation between stop logs stacked on top ofeach other. Gate leakage computation is addressed by Collins (1977) andcould be implemented in the Flow program.
3. Flow through slot gates. In the past, gates in some spillway structures werefitted with smaller slot gates which enabled the release of a relatively smalldischarge while the main gates remained closed. At present, all slot gatesare permanently closed.
4. Flow through weirs equipped with a multiple-width notch. The width of thenotch increases in a stepwise fashion as the stage rises.

CONCLUSIONS AND RECOMMENDATIONS
Calculation of surface water discharge rates for water control structures in the SouthFlorida Water Management District is performed using the Flow program. Theroutine data processing activities of the Hydrologic Data Management Division usethe Flow program to calculate instantaneous flow values. Instantaneous valuescomputed by Flow are time-averaged by the Interval Value Generation program toobtain daily mean flow values. The daily mean flows are stored in DBHYDRO.
The Flow rprogram equires a text file as input. The length of the input and outputfiles are only limited by the available mass storage. It is convenient to arrange therecords in the input file chronologically, although this is not a requirement. TheFlow program can be used with archived or simulated data. Simulated data may beused for modeling or calibration purposes.
Currently, the discharge at any structure may be computed from several establishedcombinations of stage and control data. Therefore, DBHYDRO contains one or moretime series of daily mean flow data for each structure. Seldom is any one time seriescomplete nor is any particular time series always the best estimate of flow. Adecision-making system is being developed by the Hydrologic Data ManagementDivision to produce a single time series of flow, called preferred flow, from the mostaccurate combination of stage and control data available for each structure. Thissystem will eliminate redundant or contradictory flow data, while improving thequality and consistency of the resulting flow time series.
Certain changes specific to topic areas are suggested below:
PROGRAMMING. The database access subroutine, ORADBAS, should connect to thedatabase only once for the duration of the Flow program's execution.
The culvert subroutine should be rewritten to conform to the principles of structuredprogramming and modular programming, to provide far easier methods ofdebugging and fine-tuning this major subroutine.
The principles of modular programming should be implemented throughout theprogram. COMMON blocks should be eliminated and all variables should be passedas arguments. Subroutines larger than 100 lines of code should be identified andfurther subdivided, if warranted, so that the size of each resulting subprogram is nomore than 100 lines of code. (Ageloff, 1981)
PUMP SUBROUTINE. In the QPUMP subroutine, when the downstream stage isbelow the outlet invert elevation, the downstream elevation used for dischargecomputations should be the outlet invert elevation.
Care should be exercised when applying the interpolation equation (Eq. 9). If N isoutside the range between Nlwr and Nupr, application of this equation will result inextrapolation. Extrapolation does not necessarily result in less accurate estimates
than interpolation. However, if the minimum or maximum pump speeds are welloutside the interpolation range, extrapolation should be checked for accuracy.
As an alternative to the current approach for estimating the head loss due to theflap gate, it is suggested to account for this loss in the discharge rating curve(s),which is how the head losses due to all other appurtenances are accounted for.
GATED SPILLWAY SUBROUTINE. The use of a transition zone for spillway flowregimes should be avoided. Instead, the implementation of the USCOE criteria, asshown in the flow diagram in Figure 7, should be studied (U.S. Army Corps ofEngineers, 1963).
It is suggested that a reverse flow estimate (negative flow) at a spillway beinterpreted as an indicator of flow direction or as a warning of a possible gaugedatum error, rather than an estimate of reverse flow quantity.
GATED CULVERT SUBROUTINE. It is recommended that a study be performed toevaluate the entrance loss coefficient for the three main inlet shapes found in theDistrict: (1) projecting inlet, (2) flush headwall, and (3) wingwall. The coefficientsshould be evaluated for the following flow regimes: (1) full pipe flow, (2) openchannel flow, and (3) orifice flow. In addition, the entrance loss coefficient shouldbe evaluated for small inlet gate restrictions where the flow regime is not shifted butthe coefficient is adjusted.
The study may involve model testing, or it may use the discharge measurementsavailable from the Hydrologic Data Management Division through its Stream GagingProject. Another source of discharge measurement data is the U.S. GeologicalSurvey. The entrance loss coefficient should be correlated with dimensionlessvariables, plotted, and expressed in mathematical terms.
It is suggested to assign appropriate enhance loss properties to the outlet and to usethese when reverse flow is completed.
TRAPEZOIDAL WEIR. It is suggested that reverse flow computation be checked withdischarge measurements, as weir coefficients may not be applicable in reverse flow.
VARIABLE WEIR SUBROUTINE. The variable weir subroutine, QVARWEI, should bemodified to limit the value of the discharge coefficient, for transition betweensharp- and broad-crested weirs, to a maximum value of 3.32, which is the dischargecoefficient for a sharp-crested weir.
FLOW CALCULATIONS NOT CONTEMPLATED. Gate leakage computation isaddressed by Collins (1977) and could be implemented in the Flow program.
CHECK TAGS SUBROUTINE. The CHKTAGS subroutine should be modified asfollows:
Three matrices for tag computation are necessary. The configuration of thesematrices should be developed in close cooperation between computerprogrammers, engineering technicians, and users. The computer programmersdeveloped the data processing software which tags the data. The seniorengineering technicians and engineering technician supervisors are intimatelyfamiliar with the data processing techniques which result in tagged data. The users
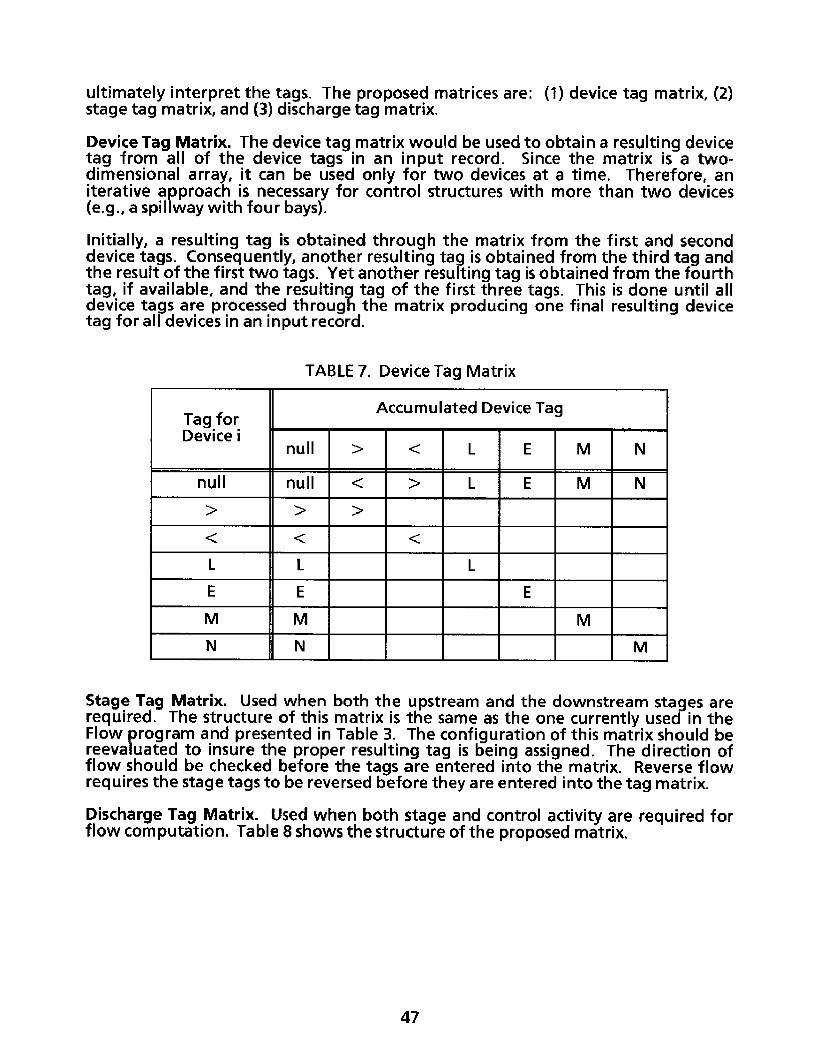
ultimately interpret the tags. The proposed matrices are: (1) device tag matrix, (2)stage tag matrix, and (3) discharge tag matrix.
Device Tag Matrix. The device tag matrix would be used to obtain a resulting devicetag from all of the device tags in an input record. Since the matrix is a two-dimensional array, it can be used only for two devices at a time. Therefore, aniterative approach is necessary for control structures with more than two devices(e.g., a spillway with four bays).
Initially, a resulting tag is obtained through the matrix from the first and seconddevice tags. Consequently, another resulting tag is obtained from the third tag andthe result of the first two tags. Yet another resulting tag is obtained from the fourthtag, if available, and the resulting tag of the first three tags. This is done until alldevice tags are processed through the matrix producing one final resulting devicetag for all devices in an input record.
TABLE 7. Device Tag Matrix
Tag for Accumulated Device Tag
Device inull > < L E M N
null null < > L E M N
L L L
E E E
M M M
N N M
Stage Tag Matrix. Used when both the upstream and the downstream stages arerequired. The structure of this matrix is the same as the one currently used in theFlow program and presented in Table 3. The configuration of this matrix should bereevaluated to insure the proper resulting tag is being assigned. The direction offlow should be checked before the tags are entered into the matrix. Reverse flowrequires the stage tags to be reversed before they are entered into the tag matrix.
Discharge Tag Matrix. Used when both stage and control activity are required forflow computation. Table 8 shows the structure of the proposed matrix.
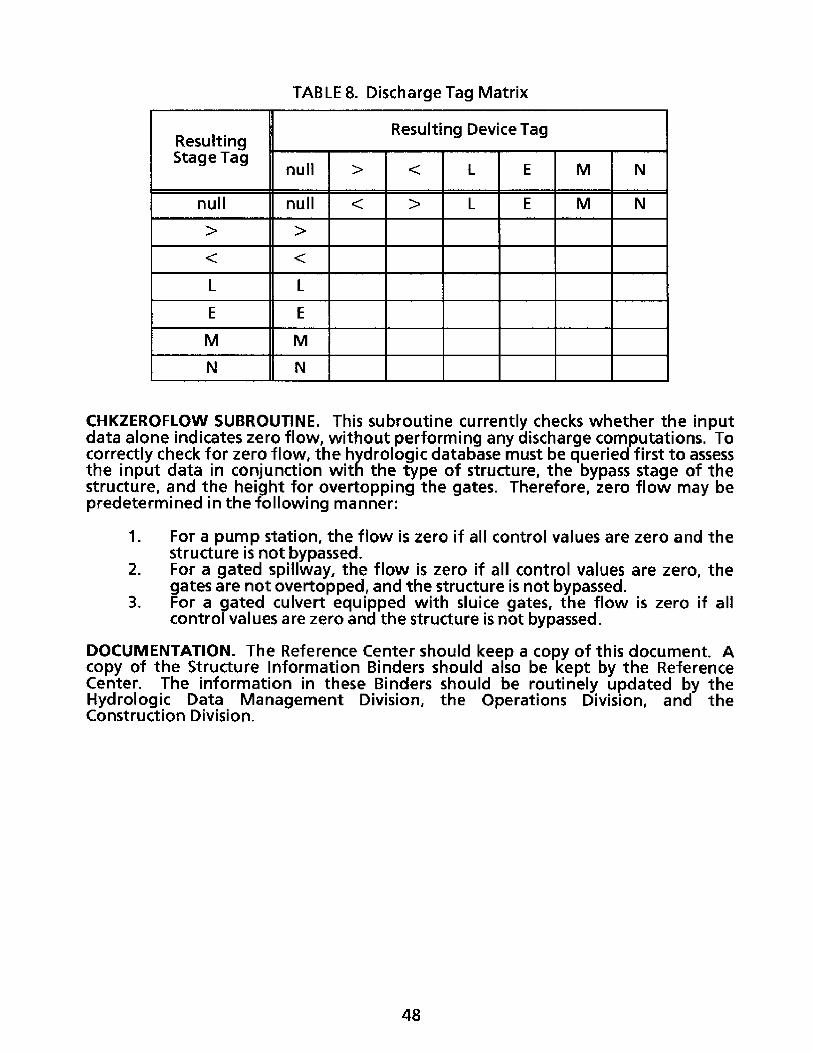
TABLE 8. Discharge Tag Matrix
Resulting Device TagResultingStage Tag
null > < L E M N
null null < > L E M N
> >
L L
E E
M M
N N
CHKZEROFLOW SUBROUTINE. This subroutine currently checks whether the inputdata alone indicates zero flow, without performing any discharge computations. Tocorrectly check for zero flow, the hydrologic database must be queried first to assessthe input data in conjunction with the type of structure, the bypass stage of thestructure, and the height for overtopping the gates. Therefore, zero flow may bepredetermined in the following manner:
1. For a pump station, the flow is zero if all control values are zero and thestructure is not bypassed.
2. For a gated spillway, the flow is zero if all control values are zero, thegates are not overtopped, and the structure is not bypassed.
3. For a gated culvert equipped with sluice gates, the flow is zero if allcontrol values are zero and the structure is not bypassed.
DOCUMENTATION. The Reference Center should keep a copy of this document. Acopy of the Structure Information Binders should also be kept by the ReferenceCenter. The information in these Binders should be routinely updated by theHydrologic Data Management Division, the Operations Division, and theConstruction Division.
REFERENCES
Ageloff, R. and R. Mojena. (1981). Applied FORTRAN 77: featuring structuredprogramming. Belmont, California: Wadsworth.
Brater, E.F. and H.W. King. (1976). Handbook of hydraulics (6th ed). New York:McGraw-Hill.
Cheremisinoff, N.P. (1981). Fluid flow. Pumps, pipes and channels. Ann Arbor,Michigan: Ann Arbor Science.
Chow, V.T. (1959). Open-channel hydraulics. New York: McGraw-Hill.
Draper, N.R. and H. Smith. (1966). Applied Regression Analysis. New York: Wiley.
Fan, A. (October 1985). A general program to compute flow through culverts:program documentation. West Palm Beach, Florida: South Florida WaterManagement District.
Lin, S. SFWMD, West Palm Beach, Florida. Personal communication, 29 September1992.
Replogle, A. (1975). Critical flow flumes with complex cross section. In, Irrigationand drainage in an age of competition for resources, (pp. 366-388). Logan, Utah:American Society of Civil Engineers.
Schlichting, H. (1960). Boundary layer theory. New York: McGraw-Hill.
Straley, B. (August 1991). Gated culvert study for the South Florida WaterManagement District. Unpublished engineer internship report, S.F.W.M.D., WestPalm Beach, Florida.
Swokowski, E.W. (1975). Calculus with analytic geometry. Boston, Massachusetts:Prindle, Weber, and Schmidt.
Turcotte, B.R. and N.D. Mtundu. (January 1992). Linking data bases to hydrauliccomputations. Journal of Computing in Civil Engineering. 6(1), 63-71.
U.S. Army Corps of Engineers. (September 1963). Typical spillway structure forCentral and Southern Florida water-control project. (U.S. Army Engineer WaterwaysExperiment Station Technical Report No. 2-633). Vicksburg, Mississippi.

BIBLIOGRAPHY
Central and Southern Florida Project. General and Detailed Design Memoranda.Jacksonville, Florida: U.S. Army Corps of Engineers, 1951-1962.
Collins, D.L. Computation of Records of Streamflow at Control Structures (ReportNo. USGS/WRD/WRI/-77/028). Bay St. Louis, Mississippi: U.S. Geological Survey,Water Resources Division, May, 1977.
Karassik, I.J., W.C. Krutzsch, W.H. Fraser, and J.P. Messina. Pumps Handbook.(Second edition). New York: McGraw-Hill, 1966.
Kone, S. Evaluation of Rating Curves for Everglades Agricultural Area Pump StationsS-5A, 5-6, 5-7, and 5-8, with Further Calibration of Rating Curves for S-8. TechnicalPublication. West Palm Beach, Florida: South Florida Water Management District,January 1993.
Petersen, M.S. River Engineering. Englewood Cliffs, New Jersey: Prentice-Hall, 1986.
Structure Information Binders. West Palm Beach, Florida: South Florida WaterManagement District.

APPENDIX A
SAMPLES OF CONTROL STRUCTURES DURING OPERATION

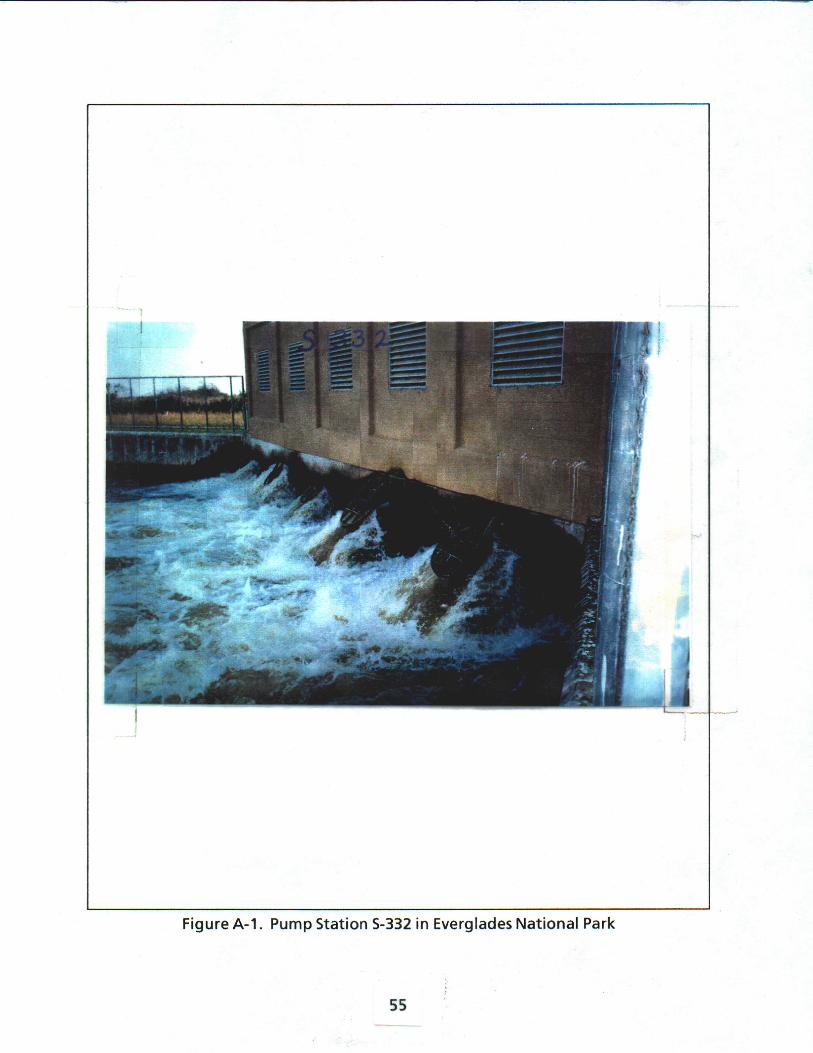
Figure A-1. Pump Station S-332 in Everglades National Park
55
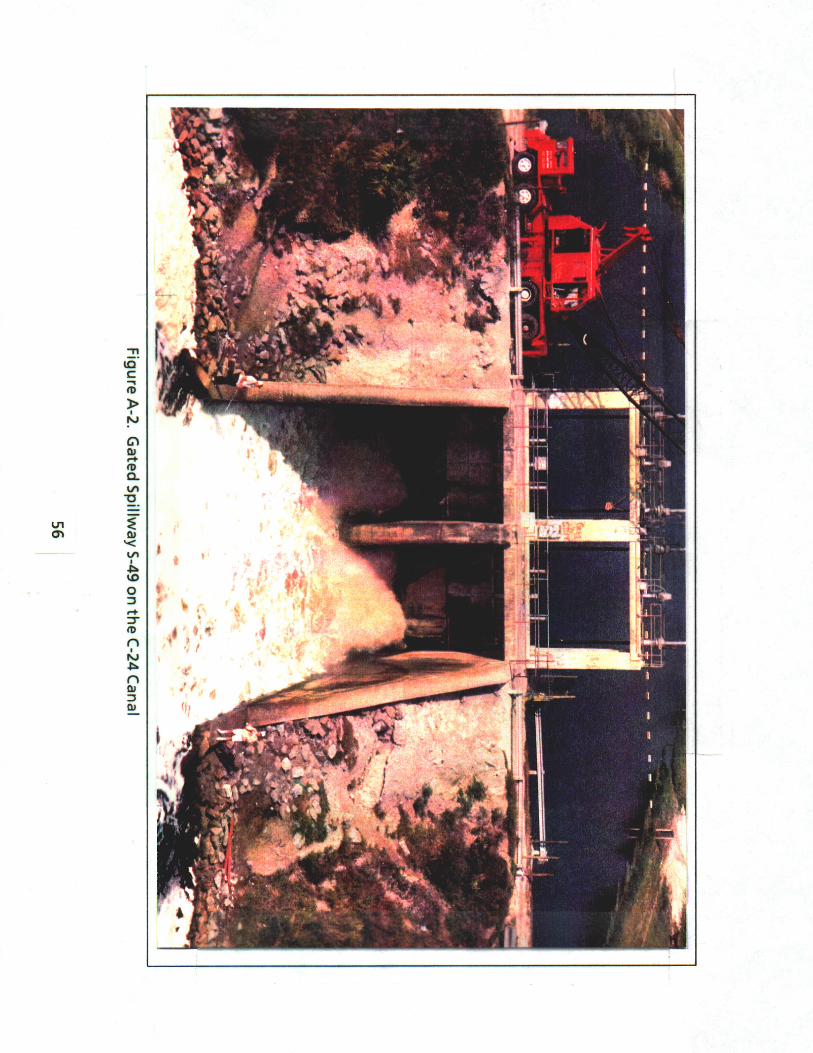
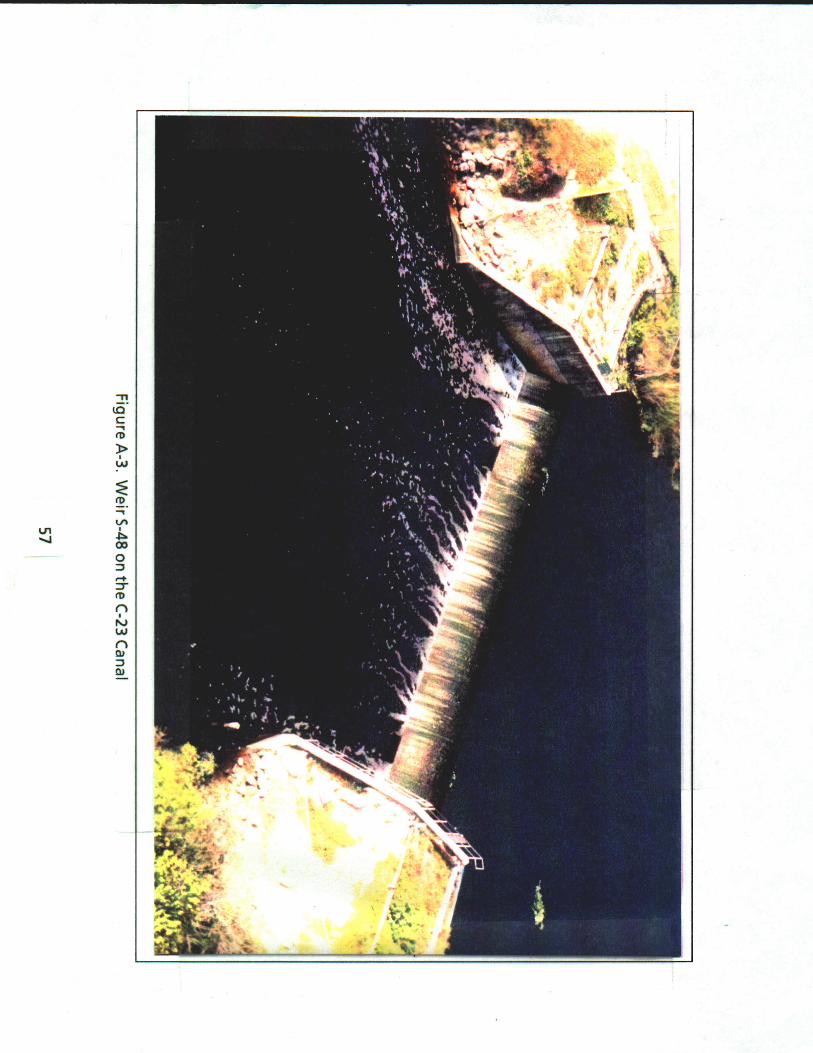


APPENDIX B
USCOE PLATES FOR FLOW REGIMES

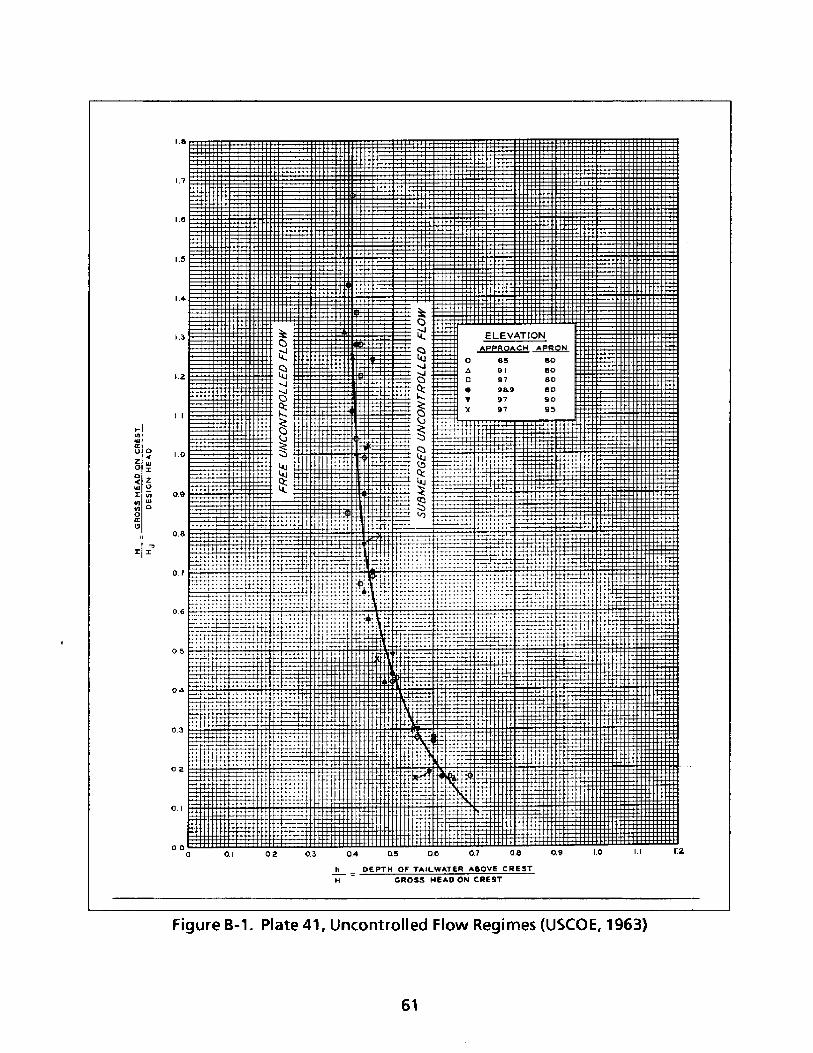
3
-I
D
Lu'-J0K
0Q
-- 4..
-t1 -
S.-~-rtt'
U i-*iit
t"ic~
* t f
:t t"Fi
:
} 41
ii tv-f
+1 ra
.uE
. -
Y -_
rt-
OI 02 0.3 04 a5 0
+1
F--
U~--
a:~ir
ELEVATIONAPPROACH APRON
0 65 80
. 1 BO
* sao sov 97 90
x 97 95
it
liit-
.
Ia-.i
-- ir
;Mr,iTLIteUc-J I--'
ar
0.7 O 0.9 1.0 1.1 I-~
b _ DEPTH OF TAILWATER ABOVE CRESTH GROSS HEAD ON CREST
Figure B-1. Plate 41, Uncontrolled Flow Regimes (USCOE, 1963)
61
1.4.
r t
Lr -- i
Y:::T
Hii:
««
41
rte.
HE ---1
,,
__
F
• ..-
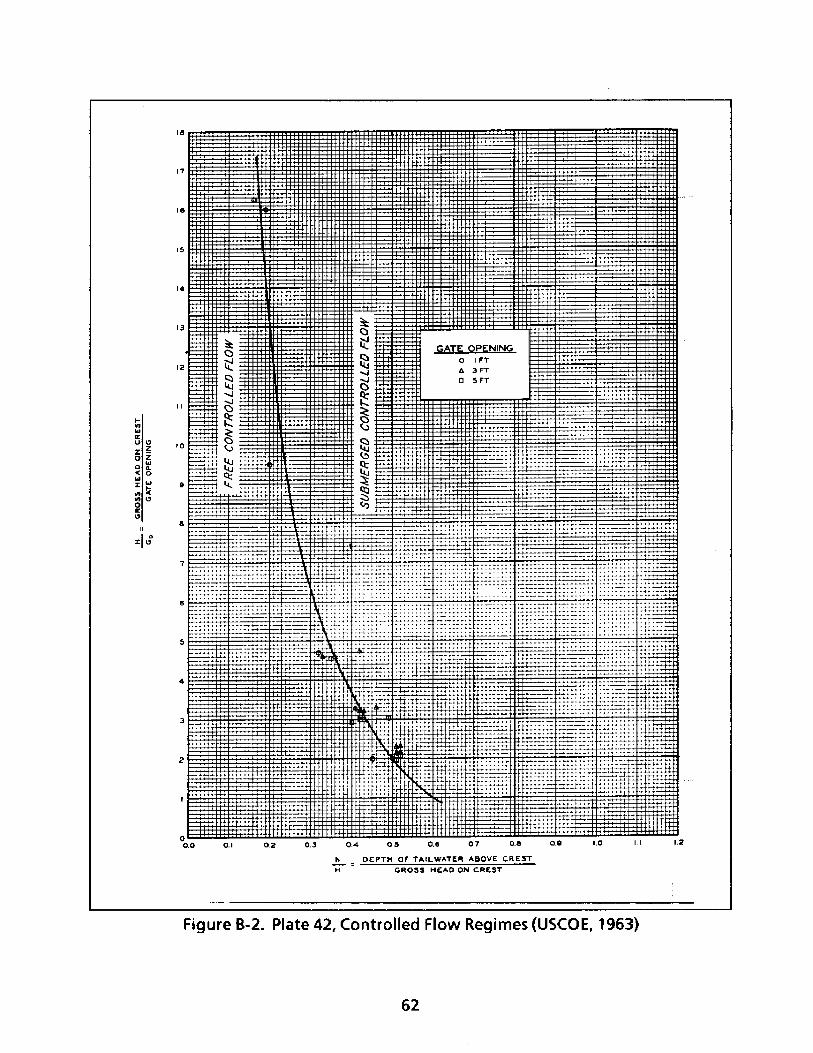
0
0
k
'41
0
0i
ka
C,
TiL
'41V ;
GATE OPENINGO IFT
a 3FTO 5 FT
TIIII ILZ1LrV 1 [i'
4~.*I~1
*444
.. 1
S: . L.::
.t.44htiiz2.: M
:22 ;ZU
j '"
, Mlff
xr--
'Y
U~--
ETTT+
I- :
t+
tt
1 rr
0.0 0.1 02 0.3 04 05 0.6 07 0.a 0.9 1.0 II 1.2
h DEPTH OF TAILWATER ABOVE CREST
H GROSS HEAD ON CREST
Figure B-2. Plate 42, Controlled Flow Regimes (USCOE, 1963)
62
.7
6
4
3
2
-Ic~th~
~w=~-
.c ~,~
I
[
N
tl.;-11.:
+t i:
Yrt ...
1+
c-~,1..- i-
:r::
I---,
---- r----- ~~------ .. .~i.
F-
Il 1 M4 t
I :.sY+i~~i~I-~
1 }# YLI 1 + I
111{ il +lY li. 'r ti t
[ r " F F
::t~
} It
.ii.
m
Mh
-c
ctr,
f-IT!-tti-F
LL --
=W:
t~f
r
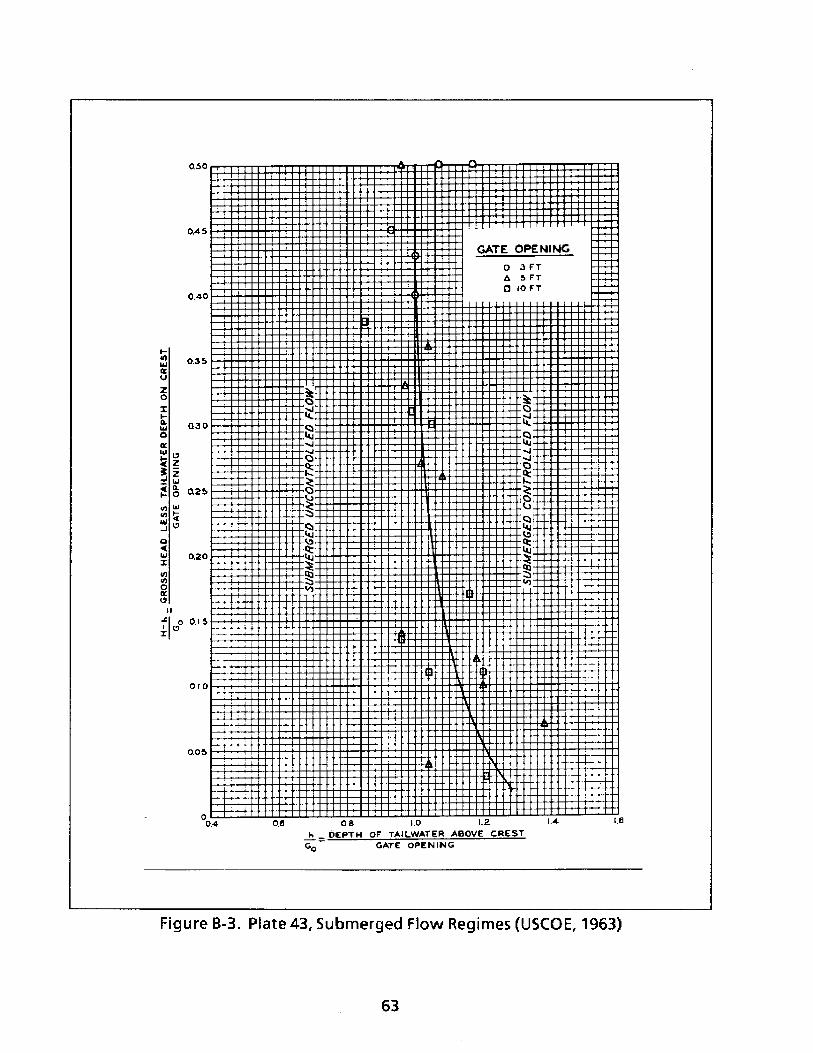
W
uJ
z0In-w
4
W
1-z
-Jr3
W
4
,w
I
1 o
Ito
mH0rc
I 1
II I c
_, DEPTH OF TAILWATER ABOVE CREST
Go GATE OPENING
Figure B-3. Plate 43, Submerged Flow Regimes (USCOE, 1963)


APPENDIX C
MEMORANDA

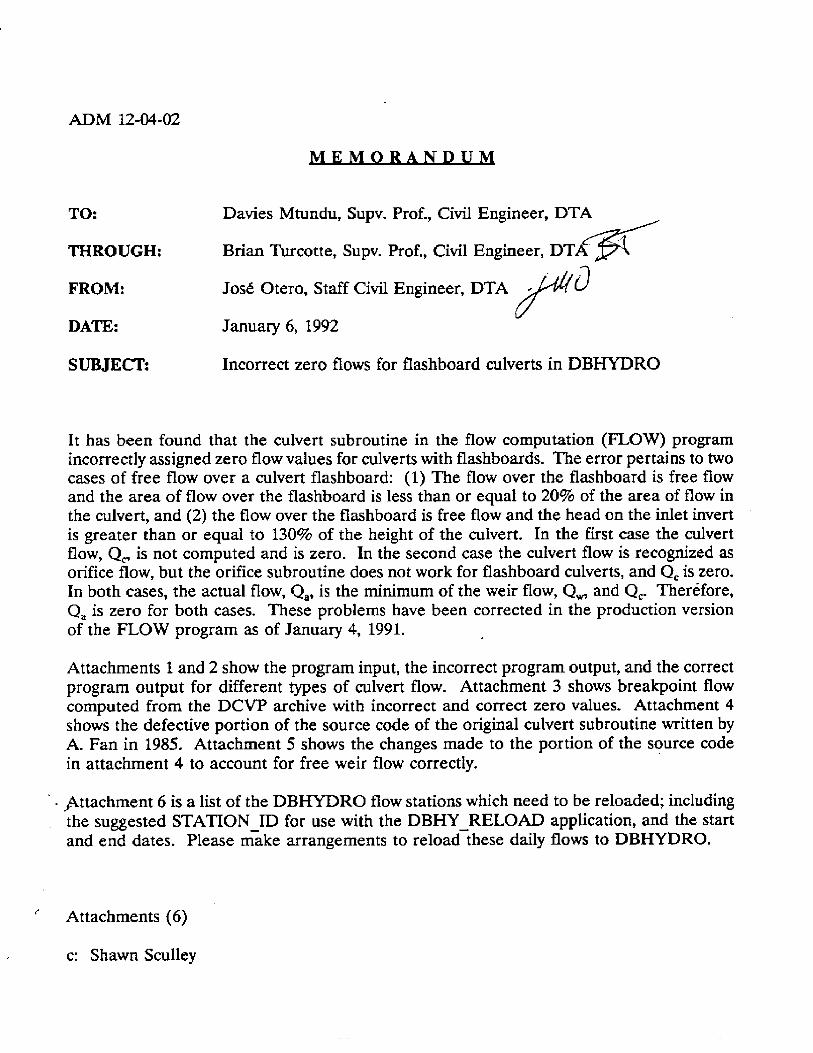
ADM 12-04-02
MEMORANDUM
TO: Davies Mtundu, Supv. Prof., Civil Engineer, DTA
THROUGH: Brian Turcotte, Supv. Prof., Civil Engineer, DTA
FROM: Jos6 Otero, Staff Civil Engineer, DTA- j
DATE: January 6, 1992
SUBJECT: Incorrect zero flows for flashboard culverts in DBHYDRO
It has been found that the culvert subroutine in the flow computation (FLOW) programincorrectly assigned zero flow values for culverts with flashboards. The error pertains to twocases of free flow over a culvert flashboard: (1) The flow over the flashboard is free flowand the area of flow over the flashboard is less than or equal to 20% of the area of flow inthe culvert, and (2) the flow over the flashboard is free flow and the head on the inlet invertis greater than or equal to 130% of the height of the culvert. In the first case the culvertflow, Qc, is not computed and is zero. In the second case the culvert flow is recognized asorifice flow, but the orifice subroutine does not work for flashboard culverts, and QO is zero.In both cases, the actual flow, Qa, is the minimum of the weir flow, Q, and Qc. Therefore,
Q, is zero for both cases. These problems have been corrected in the production versionof the FLOW program as of January 4, 1991.
Attachments 1 and 2 show the program input, the incorrect program output, and the correctprogram output for different types of culvert flow. Attachment 3 shows breakpoint flowcomputed from the DCVP archive with incorrect and correct zero values. Attachment 4shows the defective portion of the source code of the original culvert subroutine written byA. Fan in 1985. Attachment 5 shows the changes made to the portion of the source codein attachment 4 to account for free weir flow correctly.
Attachment 6 is a list of the DBHYDRO flow stations which need to be reloaded; includingthe suggested STATION_ID for use with the DBHY_RELOAD application, and the startand end dates. Please make arrangements to reload these daily flows to DBHYDRO.
Attachments (6)
c: Shawn Sculley
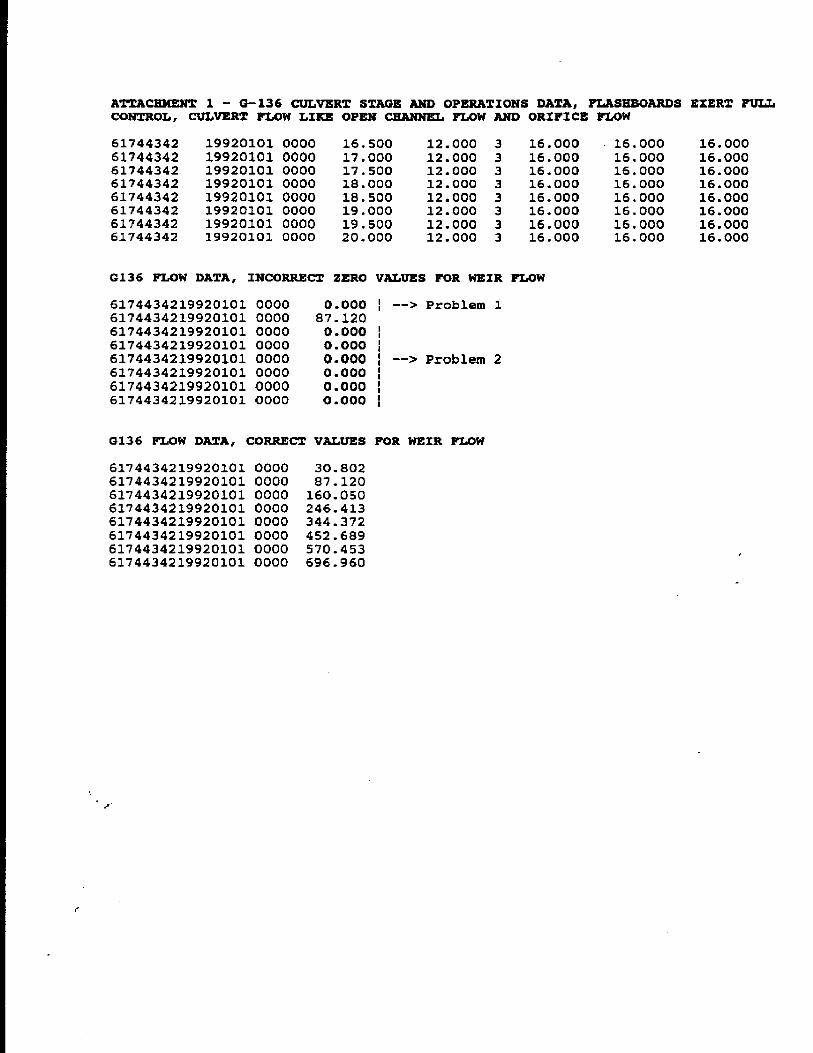
ATTACMENT 1 - 0-136 CULVERT STAGE AND OPERATIONS DATA, FLASHEBOARDS EXERT FULLCONTROL, CULVERT FLOW LIKE OPEN CHANNEL FLOW AND ORIFICE FLOW
19920101 000019920101 000019920101 000019920101 000019920101 000019920101 000019920101 000019920101 0000
0136 FLOW DATA, INCORRECT ZERO VALUES FOR WEIR FLOW
6174434219920101 00006174434219920101 00006174434219920101 00006174434219920101 00006174434219920101 00006174434219920101 00006174434219920101 00006174434219920101 0000
0.00087.1200.0000.0000.0000.0000.0000.000
-- > Problem 1
--> Problem 2
G136 FLOW DATA, CORRECT VALUES FOR WEIR FLOW
6174434219920101 0000 30.8026174434219920101 0000 87.1206174434219920101 0000 160.0506174434219920101 0000 246.4136174434219920101 0000 344.3726174434219920101 0000 452.6896174434219920101 0000 570.4536174434219920101 0000 696.960
6174434261744342617443426174434261744342617443426174434261744342
16.50017.00017.50018.00018.50019.00019.50020.000
12.00012.00012.00012.00012.00012.00012.00012.000
16.00016.00016.00016.00016.00016.00016.00016.000
16.00016.00016.00016.00016.00016.00016.00016.000
16.00016.00016.00016.00016.00016.00016.00016.000
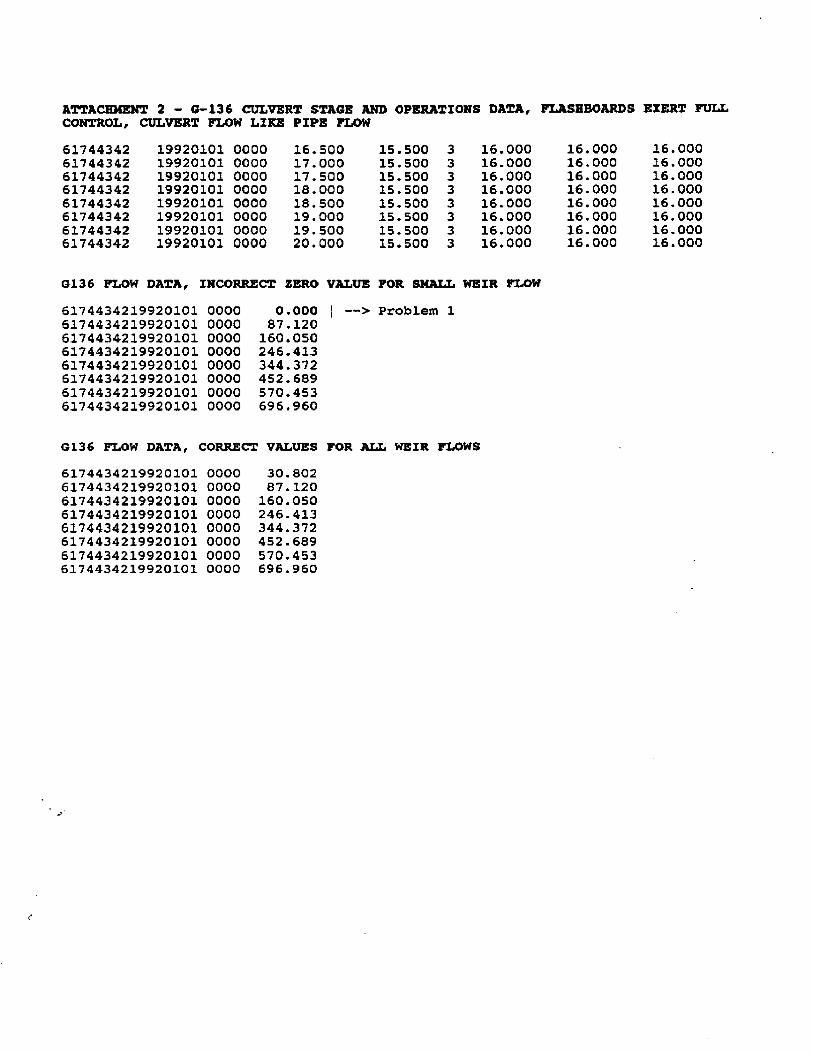
ATTACHMENT 2 - G-136 CULVERT STAGE AND OPERATIONS DATA, FLASHBOARDS EXERT FULLCONTROL, CULVERT FLOW LIKE PIPE FLOW
19920101 000019920101 000019920101 000019920101 000019920101 000019920101 000019920101 000019920101 0000
16.50017.00017.50018.00018.50019.00019.50020.000
15.50015.50015.50015.50015.50015.50015.50015.500
16.00016.00016.00016.00016.00016.00016.00016.000
16.00016.00016.00016.00016.00016.00016.00016.000
16.00016.00016.00016.00016.00016.00016.00016.000
0136 FLOW DATA, INCORRECT ZERO VALUE FOR SMALL WEIR FLOW
6174434219920101 00006174434219920101 00006174434219920101 00006174434219920101 00006174434219920101 00006174434219920101 00006174434219920101 00006174434219920101 0000
0.00087.120160.050246.413344.372452.689570.453696.960
I -- > Problem 1
0136 FLOW DATA, CORRECT VALUES FOR ALL WEIR FLOWS
6174434219920101 0000 30.8026174434219920101 0000 87.1206174434219920101 0000 160.0506174434219920101 0000 246.4136174434219920101 0000 344.3726174434219920101 0000 452.6896174434219920101 0000 570.4536174434219920101 0000 696.960
6174434261744342617443426174434261744342617443426174434261744342
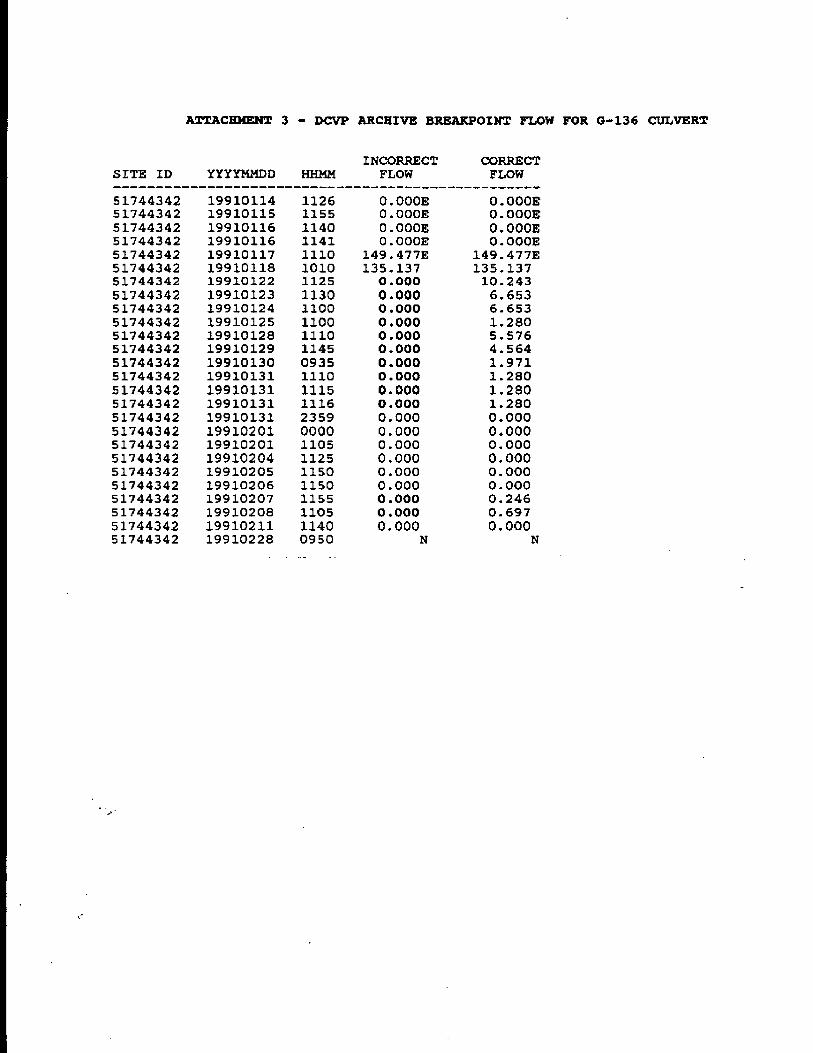
ATTACHMENT 3 - DCVP ARCHIVE BREAKPOINT FLOW FOR G-136 CULVERT
INCORRECT CORRECTSITE ID YYYYMMDD HHMM FLOW FLOW
5174434251744342517443425174434251744342517443425174434251744342517443425174434251744342517443425174434251744342517443425174434251744342517443425174434251744342517443425174434251744342517443425174434251744342
1991011419910115199101161991011619910117199101181991012219910123199101241991012519910128199101291991013019910131199101311991013119910131199102011991020119910204199102051991020619910207199102081991021119910228
11261155114011411110101011251130110011001110114509351110111511162359000011051125115011501155110511400950
0.000E0.000E0.000E0.000K
149.477E135.1370.0000.0000.0000.0000.0000.0000.0000.0000.0000.0000.0000.0000.0000.0000.0000.0000.0000.0000.000
0.000E0.000EO.000E0.000E
149.477E135.13710.2436.6536.6531.2805.5764.5641.9711.2801.2801.2800.0000.0000.0000.0000.0000.0000.2460.6970.000
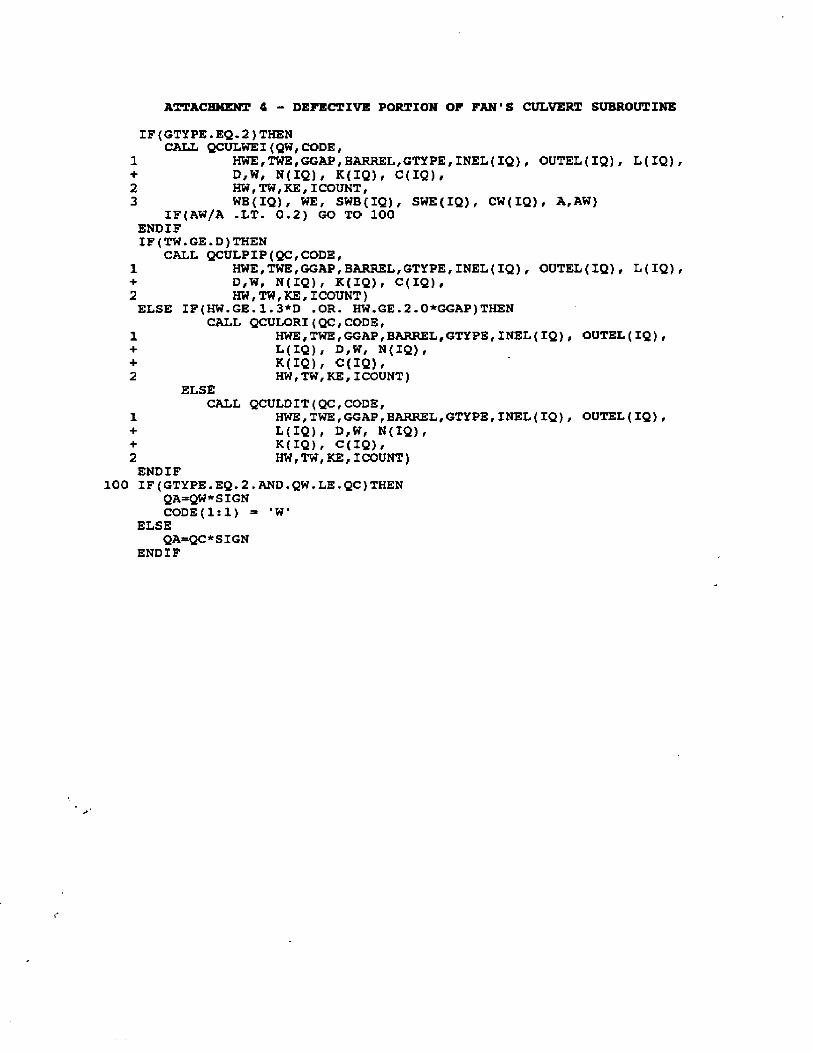
ATTACHMENT 4 - DEFECTIVE PORTION OF PFAN'S CULVERT SUBROUTINE
IF(GTYPE.EQ.2)THENCALL QCULWEI (QW, CODE,
HWE,TWE,GGAP,BARREL,GTYPE,INEL(IQ), OUTEL(IQ), L(IQ),DW. NI)Ol. K(TOI. C(IO.HW,TW,KE,ICOUNT,WB(IQ), WE, SWB(IQ), SWE(IQ), CW(IQ), A,AW)
IF(AW/A .LT. 0.2) GO TO 100ENDIFIF(TW.GE.D)THEN
CALL QCULPIP(QC,CODE,1 HWE,TWE,GGAP,BARREL,GTYPE,INEL(IQ), OUTEL(IQ), L(IQ+ D,W, N(IQ), K(IQ), C(IQ),2 HW,TW,KE,ICOUNT)ELSE IF(HW.GE.1.3*D .OR. HW.GE.2.0*GGAP)THEN
CALL QCULORI(QC,CODE,1 HWE,TWE,GGAP,BARREL,GTYPE,INEL(IQ), OUTEL(IQ),+ L(IQ), D,W, N(IQ),+ K(IQ), C(IQ),2 HW,TW,KE,ICOUNT)
ELSECALL QCULDIT(QC,CODE,
HWE,TWE,GGAP,BARREL,GTYPE,INEL(IQ), OUTEL(IQ),
L(IQ), D,W, N(IQ),K(IQ), C(IQ),HW,TW,KE,ICOUNT)
ENDIF100 IF(GTYPE.EQ.2.AND.QW.LE.QC)THEN
QA=QW*SIGNCODE(1:1) = 'W'
ELSEQA=QC*SIGN
ENDIF
rr rr
),
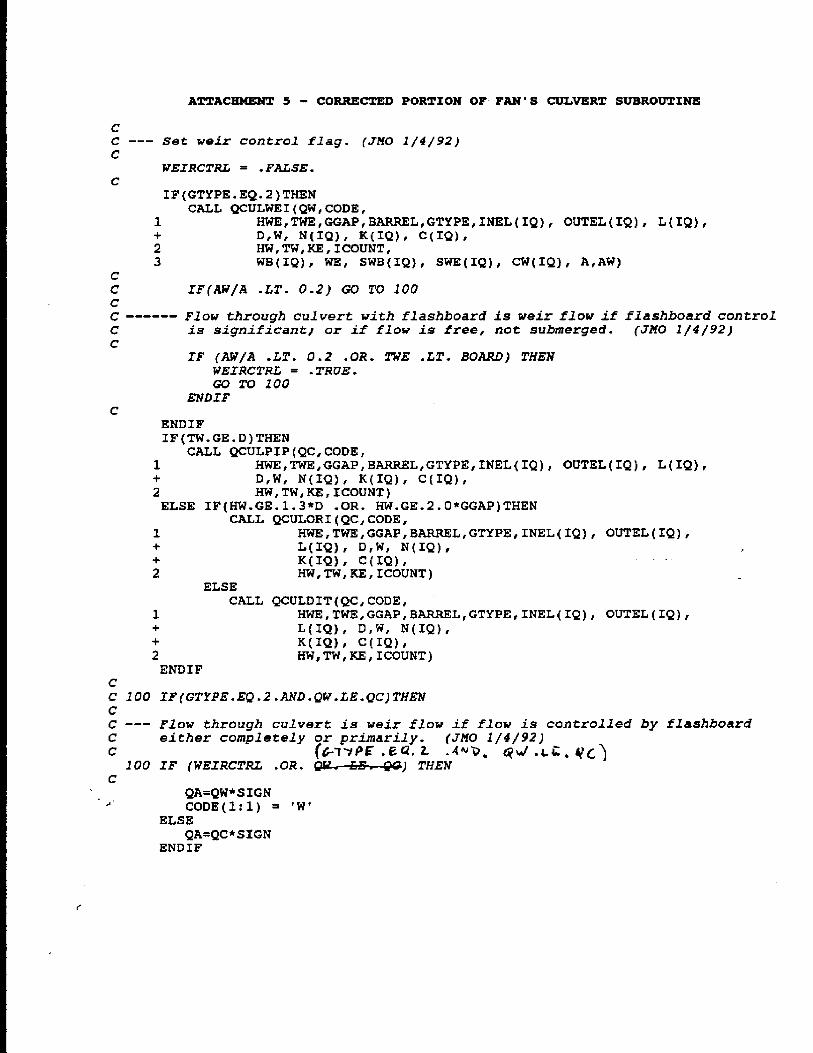
ATTACHMENT 5 - CORRECTED PORTION OF FAN'S CULVERT SUBROUTINE
CC --- Set weir control flag. (JMO 1/4/92)
WEIRCTRL = .FALSE.
IF(GTYPE.EQ.2)THENCALL QCULWEI(QW,CODE,
HWE,TWE,GGAP,BARREL,GTYPE,INEL(IQ), OUTEL(IQ), L(IQ),D,W, N(IQ), K(IQ), C(IQ),HW,TW,KE,ICOUNT,WB(IQ), WE, SWB(IQ), SWE(IQ), CW(IQ), A,AW)
IF(AW/A .LT. 0.2) GO TO 100
------ Flow through culvert with flashboard is weir flow if flashboard controlis significant; or if flow is free, not submerged. (JMO 1/4/92)
IF (AW/A .LT. 0.2 .OR. TWE .LT. BOARD) THENWEIRCTRL = .TRUE.GO TO 200
ENDIF
ENDIFIF(TW.GE.D)THEN
CALL QCULPIP(QC,CODE,1 HWE,TWE,GGAP,BARREL,GTYPE,INEL(IQ), OUTEL(IQ), L(IQ),+ D,W, N(IQ), K(IQ), C(IQ),2 HW,TW,KE,ICOUNT)ELSE IF(HW.GE.1.3*D .OR. HW.GE.2.0*GGAP)THEN
CALL QCULORI(QC,CODE,1 HWE,TWE,GGAP,BARREL,GTYPE,INEL(IQ), OUTEL(IQ),+ L(IQ), D,W, N(IQ),+ K(IQ), C(IQ),2 HW,TW,KE,ICOUNT)
ENDIF
ELSECALL QCULDIT(QC,CODE,
HWE,TWE,GGAP,BARREL,GTYPE,INEL(IQ), OUTEL(IQ),L(IQ), D,W, N(IQ),
K(IQ), C(IQ),HW,TW,KE,ICOUNT)
100 IF(GTYPE.EQ.2.AND.QW.LE.QC)THEN
--- Flow through culvert is weir flow if flow is controlled by flashboardeither completely or primarily. (JMO 1/4/92)
100 IF (WEIRCTRL .OR. OEL G) THEN
QA=QW*SIGNCODE(1:1) = 'W'
ELSEQA=QC*SIGN
ENDIF
IF(GTYPE.EQ.2)THENCALL
QCULWEI(QWCODE,
HWETWGGAPARRELGTYPENEL(IQ, OUTL(IQ),L(IQ)
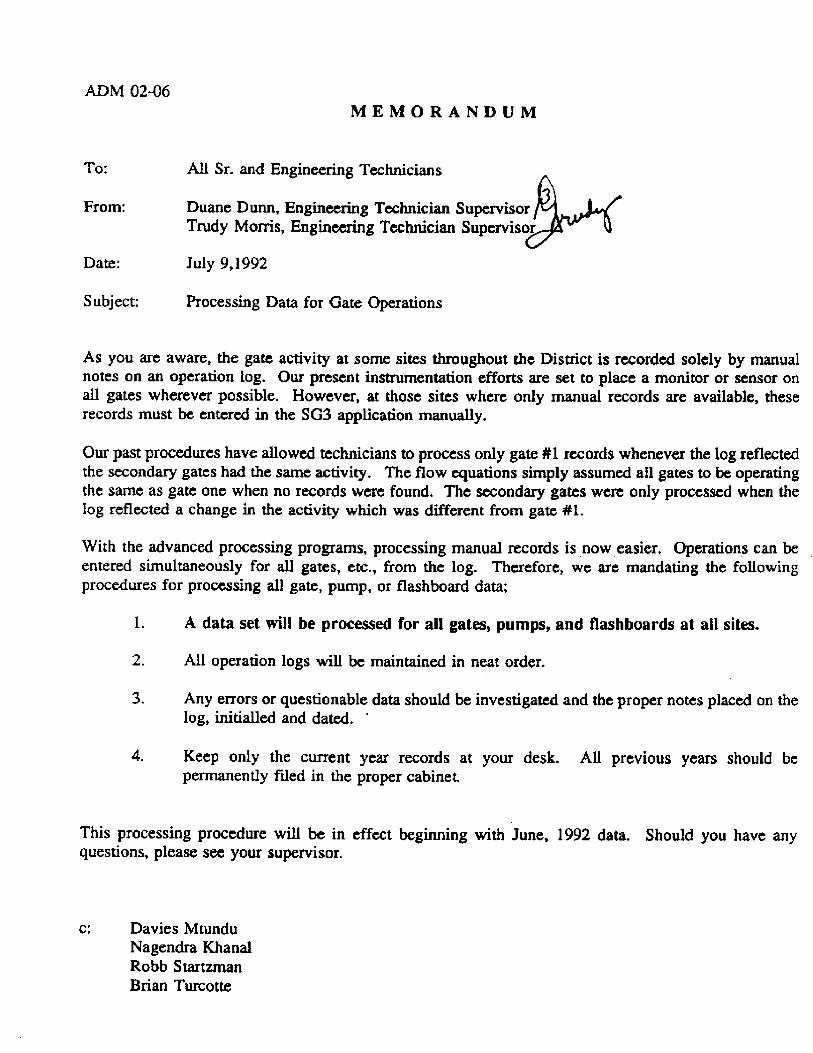
ADM 02-06
MEMORANDUM
To: All Sr. and En~ineerinu Tprhniinnq
From: Duane Dunn, Engineering Technician SuperviscTrudy Morris, Engineering Technician Supervis
Date: July 9,1992
Subject: Processing Data for Gate Operations
As you are aware, the gate activity at some sites throughout the District is recorded solely by manualnotes on an operation log. Our present instrumentation efforts are set to place a monitor or sensor onall gates wherever possible. However, at those sites where only manual records are available, theserecords must be entered in the SG3 application manually.
Our past procedures have allowed technicians to process only gate #1 records whenever the log reflectedthe secondary gates had the same activity. The flow equations simply assumed all gates to be operatingthe same as gate one when no records were found. The secondary gates were only processed when thelog reflected a change in the activity which was different from gate #1.
With the advanced processing programs, processing manual records is now easier. Operations can beentered simultaneously for all gates, etc., from the log. Therefore, we are mandating the followingprocedures for processing all gate, pump, or flashboard data;
1. A data set will be processed for all gates, pumps, and flashboards at all sites.
2. All operation logs will be maintained in neat order.
3. Any errors or questionable data should be investigated and the proper notes placed on thelog, initialled and dated.
4. Keep only the current year records at your desk. All previous years should bepermanently filed in the proper cabinet.
This processing procedure will be in effect beginning with June, 1992 data. Should you have anyquestions, please see your supervisor.
c: Davies MtunduNagendra KhanalRobb StartzmanBrian Turcotte


MEMORANDUM
TO: Jose Otero
THROUGH: Nagendra Khanal
FROM: Emile Damisse ALuis G. Cadavid L-.cG
DATE: April 12, 1993
RE: Flow Computation - Technical Publication
Thanks for the opportunity to review your technical publication. You have been assigned
the not easy task of putting together what many people and many organizations have
done in the past, perhaps without any connection among them, and give coherence and
organization to those materials. We certainly enjoyed reading your document. It is going
to be a valuable asset for the District. Congratulations on a well done job.
We would like to offer some comments and suggestions. They are aimed to improving
the information the document conveys. Many of the points we discuss below are not
included in your original scope of work. They are results from previous works. A
fundamental basis to the flow computation program is the research work conducted by
the COE. Many of the coefficients used by the algorithm appear to be derived from this
study, like for instance the values of 1.7 and 2.0 given in Table 5. It will be a good idea
to mention the source of these coefficients as they appear in the text, along with notes
on whether the derivation is theoretical or empirical. We believe that the issues we
present below should be emphasized or at least mentioned in the report so that they can
be reexamined and probably modified in the future.
1 - Stastical and Physical Sigificance of Equations
First, we would like to address the statistical and physical significance of some of the
equations and procedures presented in the text. The first example covers equation (3)
which is used to compute discharge as function of pump speed and available head. The
equation is extremely heavy, with ten coefficients which were probably determined using
regression analysis. In order for equation (3) to convey any significance, a total of 50
points would be required, i.e. an average of 5 points per coefficient. In case regression
analysis was used, what was the sample size ? We see the model in equation (3) as a
difficult one to justify from a practical and physical point of view. In our opinion, a simpler
and more attractive approach in this case would be to work with a double entry table,
head and speed versus discharge, formed with the experimental data points.
Some other models, like equation (2), applicable to pumps with constant speed engines,
are simpler, although they still present a relatively high number of coefficients. It will be
an improvement for the document if an example of this type of model were presented.
The graph should show both the data points and the resulting fitted cubic equation.
Where the coefficients statistically tested for significance ? For instance, was the
possibility of C3=0 checked against the possibility of not being zero ? How different is the
third order polynomial from the second order polynomial ? We believe all these are
important questions which should be referred in the document. If these questions have
not been addressed in the past, they should be investigated by the Data Management
Division, within the general objective of improving hydrologic data quality.
Most of the discharge equations used by the flow computation program are amenable of
physical derivation. General coefficients and exponents are introduced to increase
generality, to account for unknown factors and to ease presentation. Values for these
coefficients and exponents are derived from regression analysis. We have found difficult
to justify the generalization of exponents which appear as one (1) or as zero (0) into a
value n. Cases like these are observed in equation (18), where Go is risen to a power
n, and h is risen to a power n2. We would leave the gate opening as a linear term and
leave h out of the equation, unless it can be shown, through an adequate set of data
points, that the discharge coefficient is a function of these two variables. In this case, a
more appropriate approach would be to present C, as function of Go and h. In case it
is decided to leave and calibrate, for instance, the exponent n1 , a measure of the benefit
in doing so should be provided.
2 - Transition Zone Definition
The definition of the transition zone as stated in page 36, marking the change from
controlled to uncontrolled flow and vice versa could be modified. Under free and
uncontrolled flow conditions, we can expect the maximum discharge over a spillway for
a given approach head. The transition zone or more precisely the transition point is
reached when the operating condition is such that the gate is lowered to the extent that
the maximum discharge is maintained. The gate opening (Go) is such that any decrease
in Go would create the backwater effect upstream of the control structure. Hence, the
flow is controlled by the gate and the actual discharge is less than that (Qmax) computed
from the uncontrolled flow equation.
Strictly speaking, the transition point would be reached when the gate opening Go
approaches the critical depth Ycr = 2/3H (or H = 1.5 Go). Because of energy loss
through the control structures, the studies conducted by the COE seem to indicate that
the critical point would be reached when H = 1.7Go. Hence, the criteria for level of gate
restriction summarized in table 4, page 37, could be simplified. For H >= 1.7Go, the flow
would be considered as controlled by the gate and uncontrolled otherwise. From this
discussion, it looks that the transition criterion H/Go = 1.7 is the most appropriate, as
compared to 2.0.
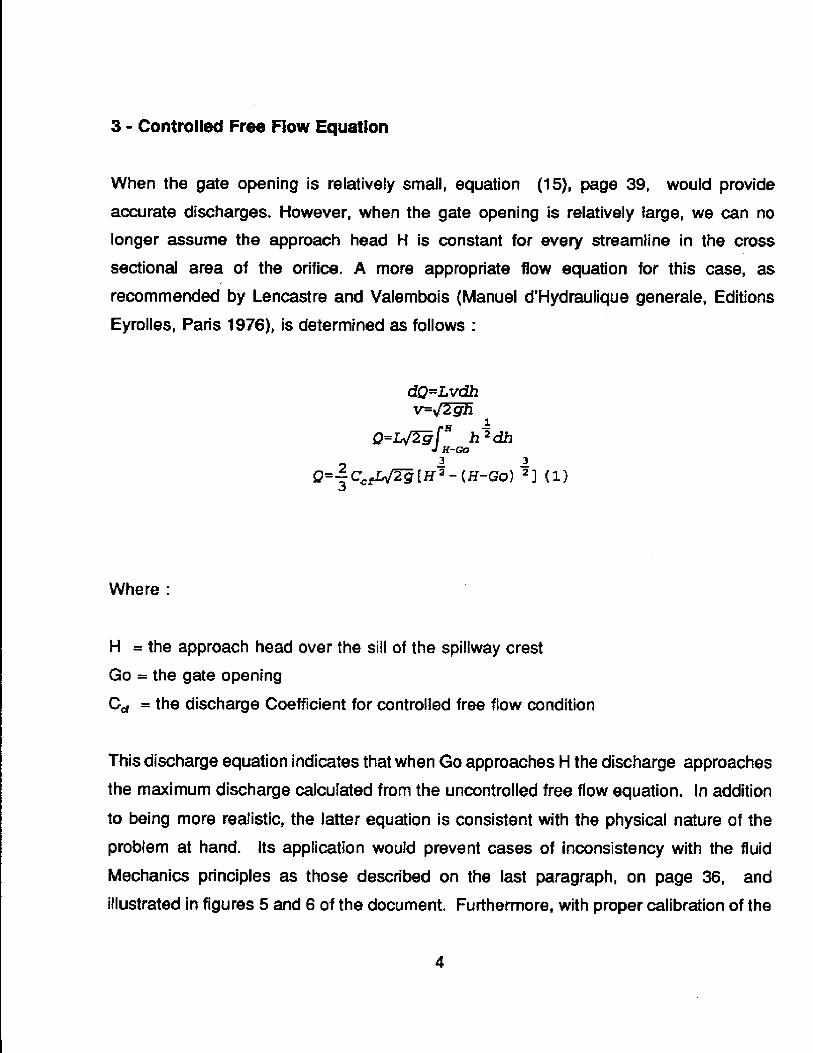
3 - Controlled Free Flow Equation
When the gate opening is relatively small, equation (15), page 39, would provide
accurate discharges. However, when the gate opening is relatively large, we can no
longer assume the approach head H is constant for every streamline in the cross
sectional area of the orifice. A more appropriate flow equation for this case, as
recommended by Lencastre and Valembois (Manuel d'Hydraulique generale, Editions
Eyrolles, Paris 1976), is determined as follows :
dQ= Lvdhv=VL-h
(1Q=/Eg h 2 4
3 3
Q= C,Lg [H 2 - (H-Go) 2 11)
Where :
H = the approach head over the sill of the spillway crest
Go = the gate opening
Cd = the discharge Coefficient for controlled free flow condition
This discharge equation indicates that when Go approaches H the discharge approaches
the maximum discharge calculated from the uncontrolled free flow equation. In addition
to being more realistic, the latter equation is consistent with the physical nature of the
problem at hand. Its application would prevent cases of inconsistency with the fluid
Mechanics principles as those described on the last paragraph, on page 36, and
illustrated in figures 5 and 6 of the document. Furthermore, with proper calibration of the
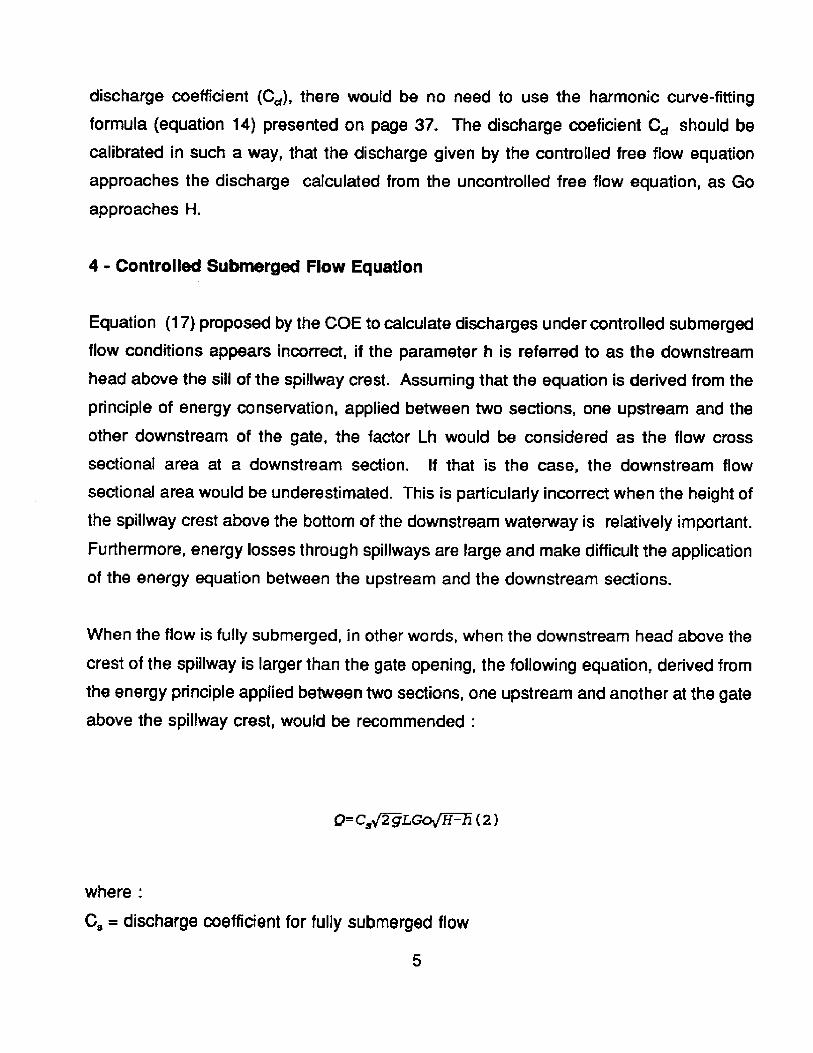
discharge coefficient (C,), there would be no need to use the harmonic curve-fitting
formula (equation 14) presented on page 37. The discharge coeficient Cd should be
calibrated in such a way, that the discharge given by the controlled free flow equation
approaches the discharge calculated from the uncontrolled free flow equation, as Go
approaches H.
4 - Controlled Submerged Flow Equation
Equation (17) proposed by the COE to calculate discharges under controlled submerged
flow conditions appears incorrect, if the parameter h is referred to as the downstream
head above the sill of the spillway crest. Assuming that the equation is derived from the
principle of energy conservation, applied between two sections, one upstream and the
other downstream of the gate, the factor Lh would be considered as the flow cross
sectional area at a downstream section. If that is the case, the downstream flow
sectional area would be underestimated. This is particularly incorrect when the height of
the spillway crest above the bottom of the downstream waterway is relatively important.
Furthermore, energy losses through spillways are large and make difficult the application
of the energy equation between the upstream and the downstream sections.
When the flow is fully submerged, in other words, when the downstream head above the
crest of the spillway is larger than the gate opening, the following equation, derived from
the energy principle applied between two sections, one upstream and another at the gateabove the spillway crest, would be recommended :
0= C,, (-2L oWf ( 2)
where :
C, = discharge coefficient for fully submerged flow
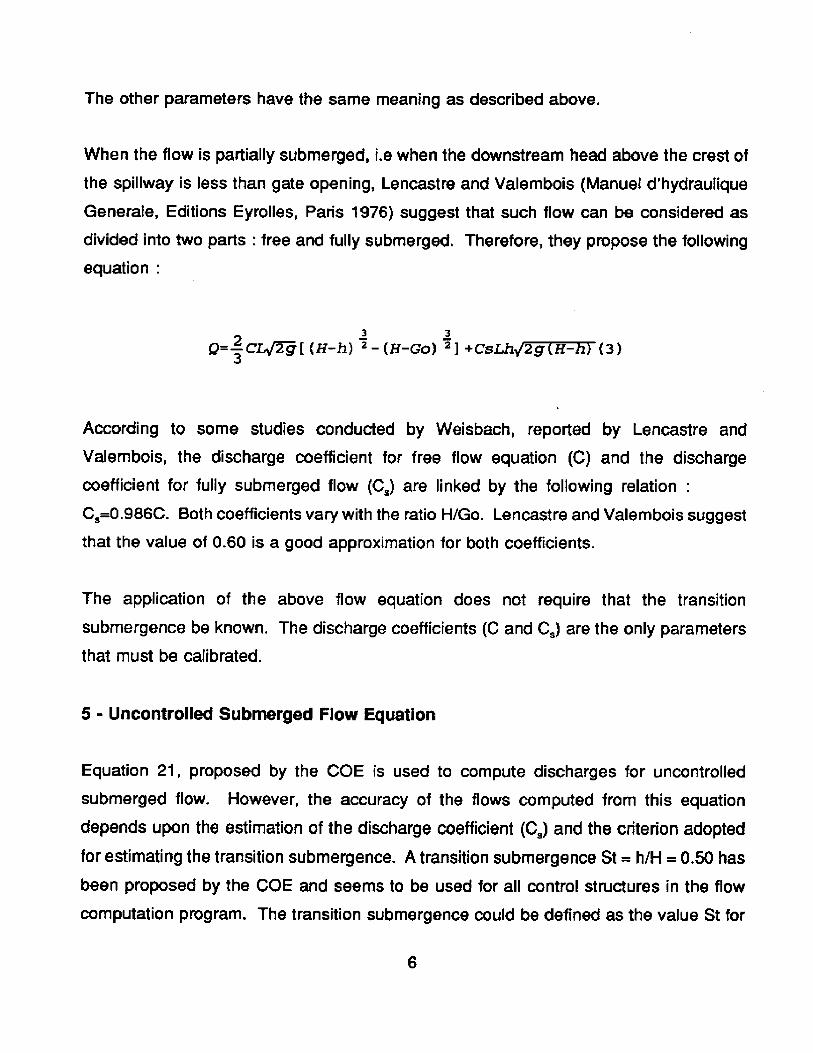
The other parameters have the same meaning as described above.
When the flow is partially submerged, i.e when the downstream head above the crest of
the spillway is less than gate opening, Lencastre and Valembois (Manuel d'hydraulique
Generale, Editions Eyrolles, Paris 1976) suggest that such flow can be considered as
divided into two parts : free and fully submerged. Therefore, they propose the following
equation :
3 3
Q=- C2g [ (H-h) 2 - (H-Go) 2] +CsLh2g(H-h) (3)
According to some studies conducted by Weisbach, reported by Lencastre and
Valembois, the discharge coefficient for free flow equation (C) and the discharge
coefficient for fully submerged flow (C,) are linked by the following relation
C,=0.986C. Both coefficients vary with the ratio H/Go. Lencastre and Valembois suggest
that the value of 0.60 is a good approximation for both coefficients.
The application of the above flow equation does not require that the transition
submergence be known. The discharge coefficients (C and C3) are the only parameters
that must be calibrated.
5 - Uncontrolled Submerged Flow Equation
Equation 21, proposed by the COE is used to compute discharges for uncontrolled
submerged flow. However, the accuracy of the flows computed from this equation
depends upon the estimation of the discharge coefficient (C,) and the criterion adopted
for estimating the transition submergence. A transition submergence St = h/H = 0.50 has
been proposed by the COE and seems to be used for all control structures in the flow
computation program. The transition submergence could be defined as the value St for
which the discharge given by the free-flow equation is approximately the same as that
given by the submerged-flow equation.
The value of St computed from the application of the above definition is highly sensitive
to errors in the discharge coefficients or exponents of either equation. Therefore, a
generalized value for St would not be recommended. In some cases, the calibration
approach proposed by the COE or used by the District may generate inconsistent results.The case of Spillway S-63 is a typical illustration . A value of C, = 0.646 is suggested
for this spillway (page 43) and a free discharge coefficient of C = 2.9 is generally
adopted by the District. To examine what would happen when the transition
submergence point (H= 2h as proposed by the COE) is reached, let H = 6 ft and h =
3 ft. The free discharge would be q = 42.6 cfs / ft of the spillway crest width and
submerged discharge qs = 26.9 cfs / ft of the spillway crest width. Hence, the
submerged discharge is only 63% of that given by the free-flow equation at the transition
point. This is not satisfactory.
We would like to illustrate a procedure that could be used to compute the transition
submergence. The following approach is developped for the case where the flow
equtions for both, uncontrolled free and uncontrolled submerged flow conditions, are
derived from the energy conservation principle. The approach is still valid for general
flow equations. But, when n is different from n1 + n2, where n, n1 and n2 are the
exponent of H in the uncontrolled free flow equation, and the exponents of the terms (H-
h) and h in the uncontrolled submerged flow equation, respectively, the value of St is
dertermined by trial and error.
If discharge equations are known for both the free-flow and the submerged-flow
conditions, a definite value of the transition submergence can be obtained by setting the
equations equal to one another and solve for St. With S = h/H or h = SH, equation 21,becomes :
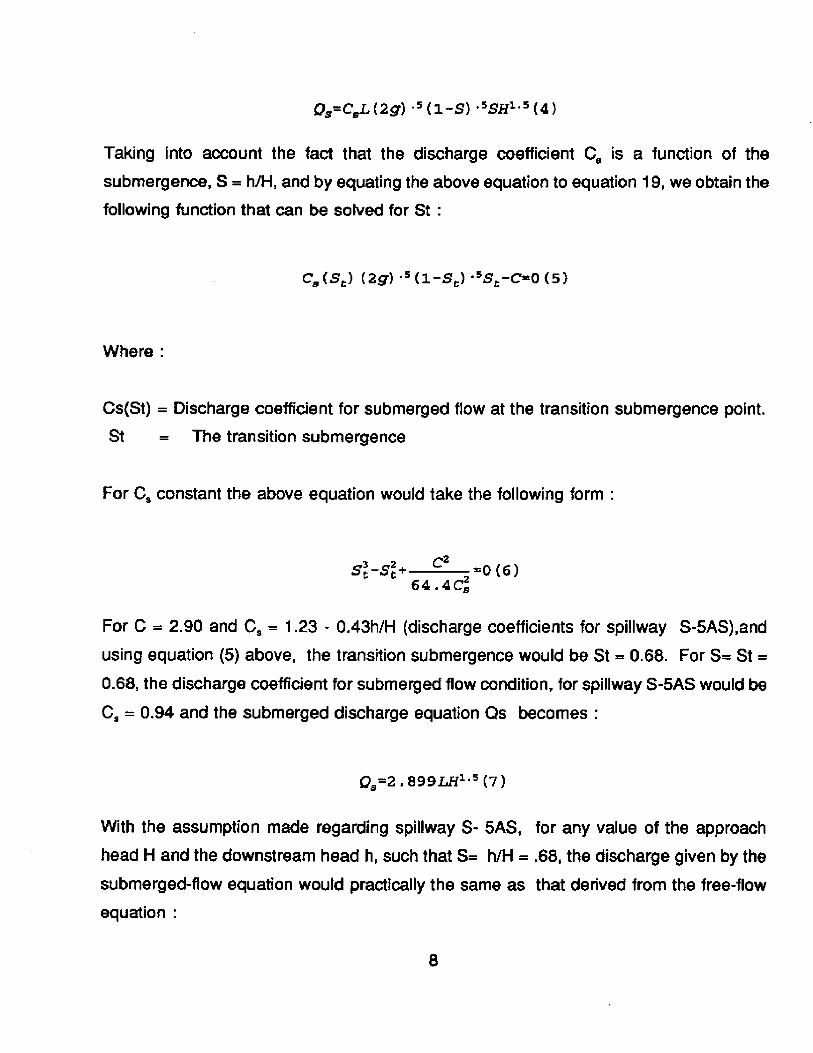
QsCL (2g) .5(1-S) .sSH1 5 (4)
Taking into account the fact that the discharge coefficient C, is a function of the
submergence, S = h/H, and by equating the above equation to equation 19, we obtain the
following function that can be solved for St :
C, (sC) (2g) 5 (1-Se) '5S,-C=O (5)
Where:
Cs(St) = Discharge coefficient for submerged flow at the transition submergence point.
St = The transition submergence
For C, constant the above equation would take the following form :
St-S2+ C2 =0 (6)64 .4CH
For C = 2.90 and C, = 1.23 - 0.43h/H (discharge coefficients for spillway S-5AS),and
using equation (5) above, the transition submergence would be St = 0.68. For S= St =
0.68, the discharge coefficient for submerged flow condition, for spillway S-5AS would be
C, = 0.94 and the submerged discharge equation Qs becomes :
O,=2 .899LH1' 5 (7)
With the assumption made regarding spillway S- 5AS, for any value of the approach
head H and the downstream head h, such that S= h/H = .68, the discharge given by the
submerged-flow equation would practically the same as that derived from the free-flow
equation :
Q=2.9o0 H s (8)
It follows that the transition submergence is directly related to the discharge coefficients
for both free and submerged flow conditions. Since those coefficients are not the same
for all control structures, the transition submergence may vary from one structure to
another. If the discharge coefficients are properly calibrated and the transition
submergence carefully estimated, the continuity or more precisely the equality between
discharges computed from the submerged and free flow equations at the submergence
point would no longer be a concern. Depending on the values assigned to the discharge
coefficients C and C,, equations (5) and (6) above may not have positive real roots.
c. Dr. Leslie Wedderbum
Robb Startzman
Brian Turcotte