Embed Size (px)
Citation preview
S
FIELB TEST~N@ OFEXFILTRATION SYSfEMS
:1
7ECtlNICAb PUBLICATION 87-5
Becgmlber 1987
TECHNICAL PUBLICATION 87-5
FIELD TESTING OF EXFILTRATION SYSTEMS
by
Joycelyn BranscomeRichard S. Tomasello
DR E-236
December 1987
Water Resources DivisionResource Planning Department
South Florida Water Management District
TABLE OF CONTENTS
Page
Executive Summary ...........................................
Acknowledgments ................ ...... ........................... iii
List of Figures .................................................. iv
List of Tables .................................................... iv
A bstract ....................................................... v
Introduction ........................... .......................... 1
Scope .................................................... . 2
Field Testing ................... .................................. 3
Hydraulic Conductivity Tests ............................... 3Procedure ............... ........................... 3R esults ............................................... 6A nalysis ............................................... 7
Trench Test ................ ................................ 10Procedure ............................................. 10Results and Discussion ................................... 13
Comparison Between Computed and Observed Discharges ............ 27
Review of Volume IV Design Method .............................. 29
Hydraulic Conductivity ...................................... 29
Trench Design Formula ...................................... 30
A lternate Procedure .............................................. 32
Determ ination of K ........... .............................. 32
Trench Length .............................................. 34
M ounding .................................................. 36
M ethod of Testing ............................ ....................... 37
Sources of Error .................................................. 41
Conclusions and Recommendations ............ ...................... 42
References ........... ............................................ 43
Appendix A Field Measurement of Effective Porosity ................. 44
Appendix B Design Example ...................................... 48
EXECUTIVE SUMMARY
Water quality research indicates that the initial half inch of stormwater runoff
known as the 'first flush' carries the highest concentration of surface pollutants
occurring during a storm event. It has been found that most of these pollutants are
substantially removed as the stormwater flows over or percolates through
unsaturated soil. Exfiltration trenches are commonly used in commercial
developments to retain the 'first flush' of stormwater runoff. The retained water is
allowed to percolate through the trench gravel into the surrounding soil as a means
of improving the quality of the water.
The linear dimensions of the trench are determined by the volume of water to
be treated by retention and percolation. A procedure for design of exfiltration
trenches is recommended by the South Florida Water Management District
(District). This trench design methodology was developed using an entirely
theoretical approach which, until this study, had not been tested in the field. The
purpose of this study was to evaluate the ability of exfiltration trenches, designed
according to recommended procedures, to treat the required volume of stormwater
and to improve upon the design procedures if necessary.
Two test exfiltration trenches were constructed at the District headquarters in
West Palm Beach. A number of field tests were conducted to measure the average
exfiltration rates from the trenches during the design period (one hour). The
measured exfiltration rates were compared with computed exfiltration rates
obtained using the recommended design method. The computed exfiltration rates
were found to be greater than observed rates by 32%-158%.
The measured exfiltration rates were also compared with computed rates
obtained using an alternate design procedure. The alternate method was found to

give fairly accurate estimates of trench exfiltration rates (within 13% of measured
rates).
The alternate method can be extended to predict the impact of exfiltration from
trenches on groundwater elevations close to the trench (mounding). This can be very
useful in determining the most efficient layout for trenches. The available data is
not sufficient to determine the accuracy of the mounding predictions of this method
and further investigation is recommended.
Field test results indicate that the alternate method gives better predictions of
exfiltration rates than the currently recommended procedure. Although further
testing is appropriate, it is recommended that the alternate procedure be adopted for
future exfiltration trench designs.
ACKNOWLEDGE MENTS
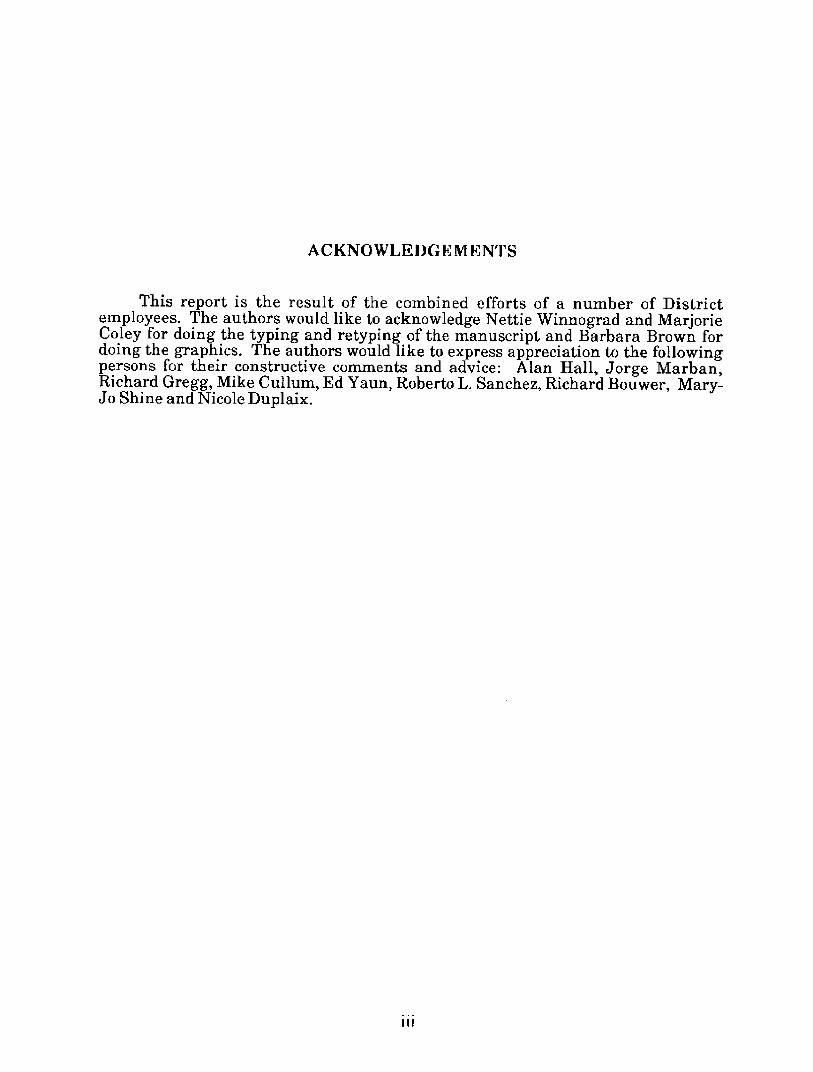
This report is the result of the combined efforts of a number of Districtemployees. The authors would like to acknowledge Nettie Winnograd and MarjorieColey for doing the typing and retyping of the manuscript and Barbara Brown fordoing the graphics. The authors would like to express appreciation to the followingpersons for their constructive comments and advice: Alan Hall, Jorge Marban,Richard Gregg, Mike Cullum, Ed Yaun, Roberto L. Sanchez, Richard Bouwer, Mary-Jo Shine and Nicole Duplaix.
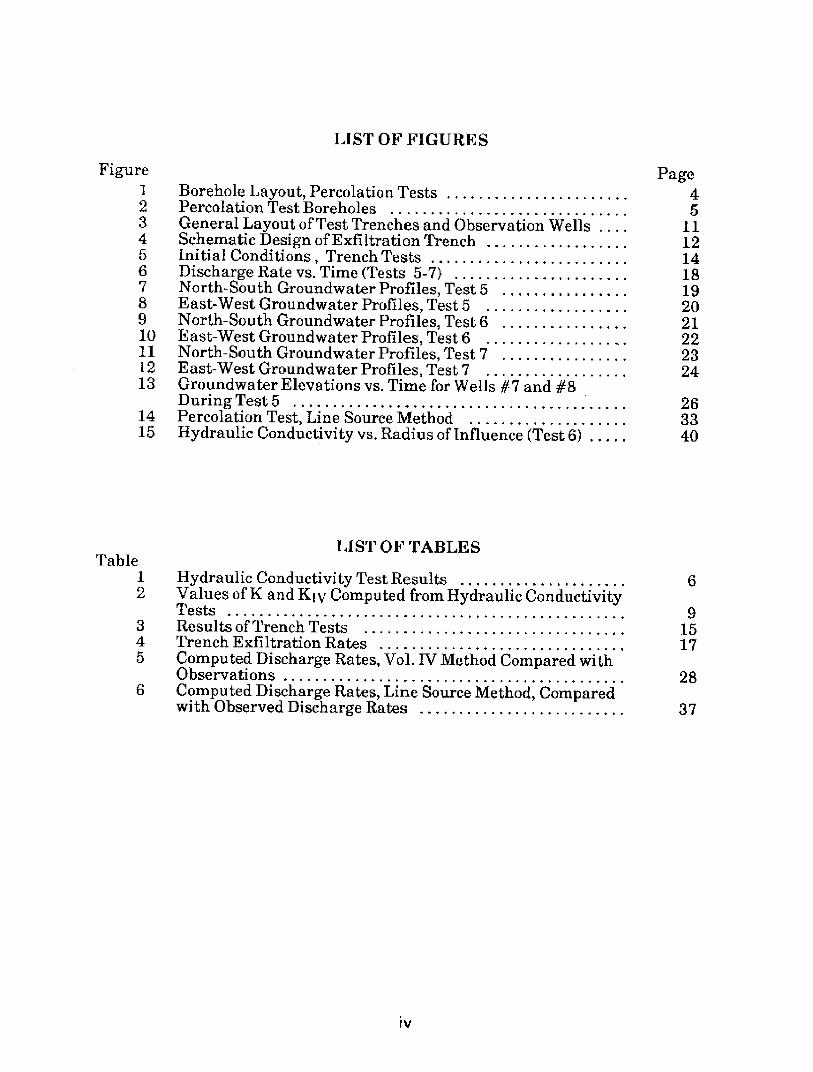
LIST OF FIGURES
Figure Page1 Borehole Layout, Percolation Tests ...................... 42 Percolation Test Boreholes .................. ......... 53 General Layout of Test Trenches and Observation Wells . ... 114 Schematic Design of Exfiltration Trench .................. 125 Initial Conditions, Trench Tests ................... . 146 Discharge Rate vs. Time (Tests 5-7) ...................... 187 North-South Groundwater Profiles, Test 5 ................ 198 East-West Groundwater Profiles, Test 5 .................. 209 North-South Groundwater Profiles, Test 6 ................ 2110 East-West Groundwater Profiles, Test6 ................. 2211 North-South Groundwater Profiles, Test 7 ................ 2312 East-West Groundwater Profiles, Test 7 ..................... 2413 Groundwater Elevations vs. Time for Wells #7 and #8
During Test 5 ................ ................. ... 2614 Percolation Test, Line Source Method ................... 3315 Hydraulic Conductivity vs. Radius of Influence (Test 6) ..... 40
LIST OF TABLESTable
1 Hydraulic Conductivity Test Results .... . ....... 62 Values of K and KIV Computed from Hydraulic Conductivity
Tests .................................................. 93 Results of Trench Tests .................. ............ 154 Trench Exfiltration Rates ............................... 175 Computed Discharge Rates, Vol. IV Method Compared with
Observations .......................... ......... 286 Computed Discharge Rates, Line Source Method, Compared
with Observed Discharge Rates ..........................

ABSTRACT
Exfiltration trenches are used in many commercial developments to retain the
'first flush' ofstormwater runoff, for water quality purposes. A field testing program
was conducted to evaluate the performance of the exfiltration trench design
methodology currently employed by the South Florida Water Management District
(District). Comparison between measured trench exfiltration rates and rates
predicted by the current design method indicates that this design procedure
significantly overestimates the exfiltration capabilities of trenches. An alternate
exfiltration trench design procedure was proposed and tested. Field test results
indicate close agreement between measured and design exfiltration rates when the
alternate method is used. The alternate method is analytical and can be extended to
predict changes in the water table elevation (mounding) around an exfiltration
trench during operation. Further testing is recommended; however, field tests
indicate that the alternate method is superior to the current exfiltration trench
design method.
Key Words: Hydraulic Conductivity, Exfiltration Trench, French Drain, Line Source
INTRODUCTION
The initial half inch of stormwater runoff known as the 'first flush' contains the
highest concentration of surface pollutants during a storm event. Research indicates
that a substantial portion of these pollutants are removed as the stormwater flows
over or through unsaturated soil. Exfiltration systems are employed throughout the
District as a means of removing the 'first flush' of stormwater from surface runoff. A
typical trench system comprises an inlet structure which leads to a horizontal
perforated pipe, surrounded by gravel. Designs generally include a weir structure at
the outfall end which retains the stormwater and surcharges the perforated pipe and
trench to induce exfiltration into the soil.
The volume of water to be treated by retention and exfiltration under the
District water quality criteria is 50% of the greater of the first inch of runoff from the
total project or 2.5 inches of runoff from the project's impervious areas. The trench
systems are designed such that the volume of storage and exfiltration for one hour is
equal to the design volume. The recommended procedure for design of exfiltration
trenches is described in Permit Information Manual, Volume IV (1984) (referred to
as Volume IV).
The trench design methodology described in the manual (referred to as Volume
IV Methodology) is based on a purely theoretical approach which, until this study,
had not been tested in the field.
The purpose of this study was to evaluate the ability of exfiltration systems to
function as designed under the Volume IV Methodology and to improve upon the
design procedures if necessary.

SCOPE
The Volume IV design procedure can, for convenience, be considered as two
independent procedures. The first is the determination of hydraulic conductivity of
the soil in which the trench is to operate. The second is the computation of
minimum trench dimensions for a given hydraulic conductivity and required trench
capacity. Trench capacity refers to the total volume of water which can be stored in
and exfiltrated from the trench in one hour.
The scope of the study included the following:
* Field measurement of soil hydraulic conductivity.
* Construction of two exfiltration trenches and measurement of trench
capacities under different flow conditions.
* Comparison of measured exfiltration trench capacities with computed
values
* Assessment of the Volume IV design procedures and recommendations
for future designs
FIELD TESTING
Field tests were conducted to measure soil hydraulic conductivity and
exfiltration trench capacities. Testing procedures and results are presented in this
section. The test area is located in the northwest portion of the District property in
West Palm Beach, approximately 300 feet south of the C-51 canal. Because of the
large distance between the canal and the test site and the relatively small volumes of
flow involved in the field tests, the impact of the canal on test results was ignored.
Hydraulic Conductivity Tests
Two types of hydraulic conductivity tests are described in Volume IV, the
falling head percolation test and the constant head percolation test. In the falling
head test, the water level in a borehole is raised above the water table, by adding
water, and then allowed to subside. Hydraulic conductivity is computed from the
rate of fall of water level in the borehole. In areas of relatively high soil hydraulic
conductivities, the rate of fall is so rapid that accurate measurement is difficult. In
the constant head test, hydraulic conductivity is computed from Qp, the rate of
inflow of water required to maintain a constant head above the water table in a
borehole. Because of the greater likelihood of personal error in the falling head test,
only constant head tests were performed.
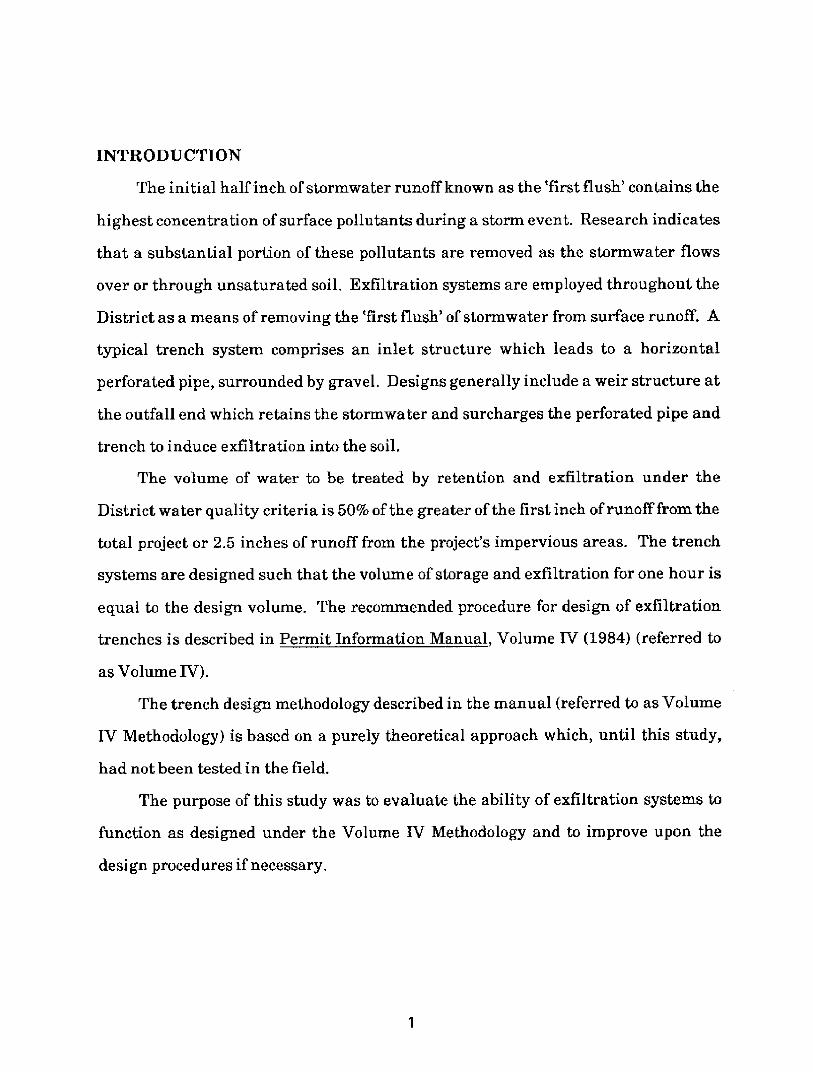
A total of seven constant head percolation tests were performed in 6" augered
cased boreholes. Figure 1 shows the layout of the boreholes.
Procedure
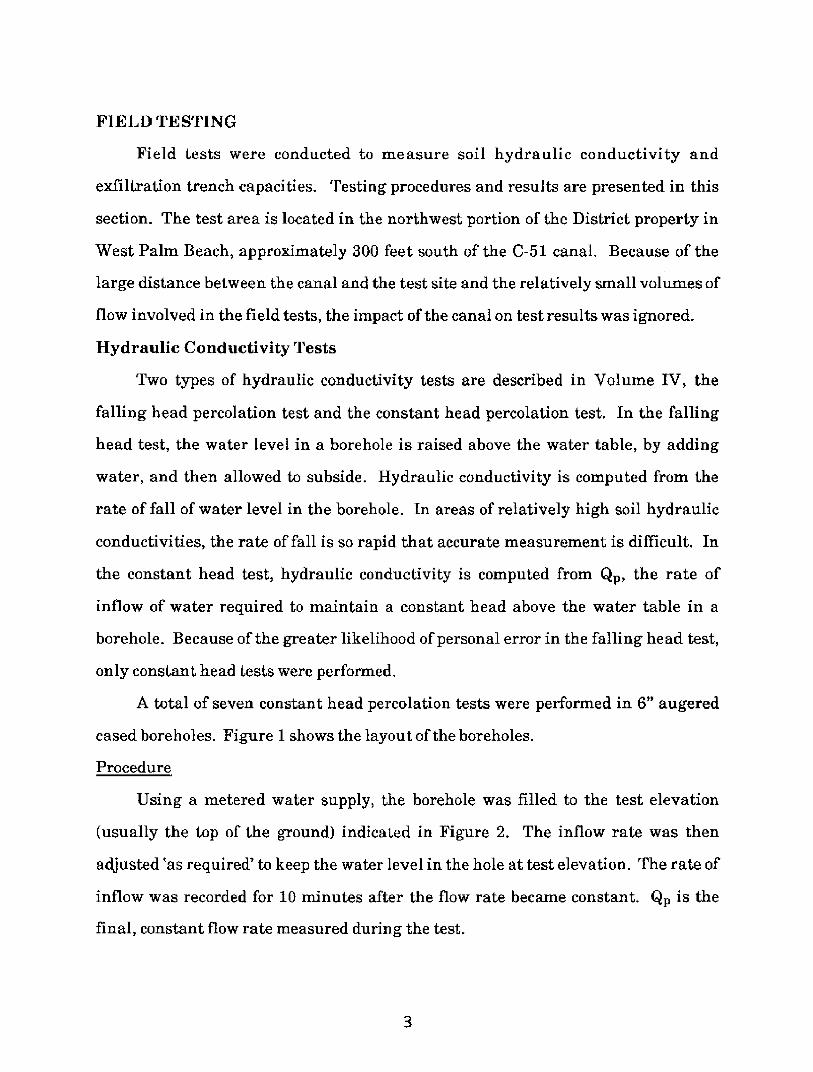
Using a metered water supply, the borehole was filled to the test elevation
(usually the top of the ground) indicated in Figure 2. The inflow rate was then
adjusted 'as required' to keep the water level in the hole at test elevation. The rate of
inflow was recorded for 10 minutes after the flow rate became constant. Qp is the
final, constant flow rate measured during the test.
AtD"
O
LiJ2WN
m h
c
W W r-
m
O
W
O tm 1
aN
r
m
U
W
0
W -X N
w
4-
c4
O
43 u i k--
L6
4
LL)
Ca 'V, °f >
.N u 3 L UQ fl' ov v o C _
Q Qp O v U, p
E-- o o Qn --- --
r- CDco E .8'Z -ilE LZ - I E .Z E 'I r f1
-i Ed-4JV 0 J
W - - a - - -10 In --...- - ! - - V)
m .97 tz ,S'£ II I
O ---
F- i AT <-- O.z£ Q .4'0cc
C...
cm 11'------q) oss H .e99 EL
ICI - - - - c~nw
cllLn
__ - ---
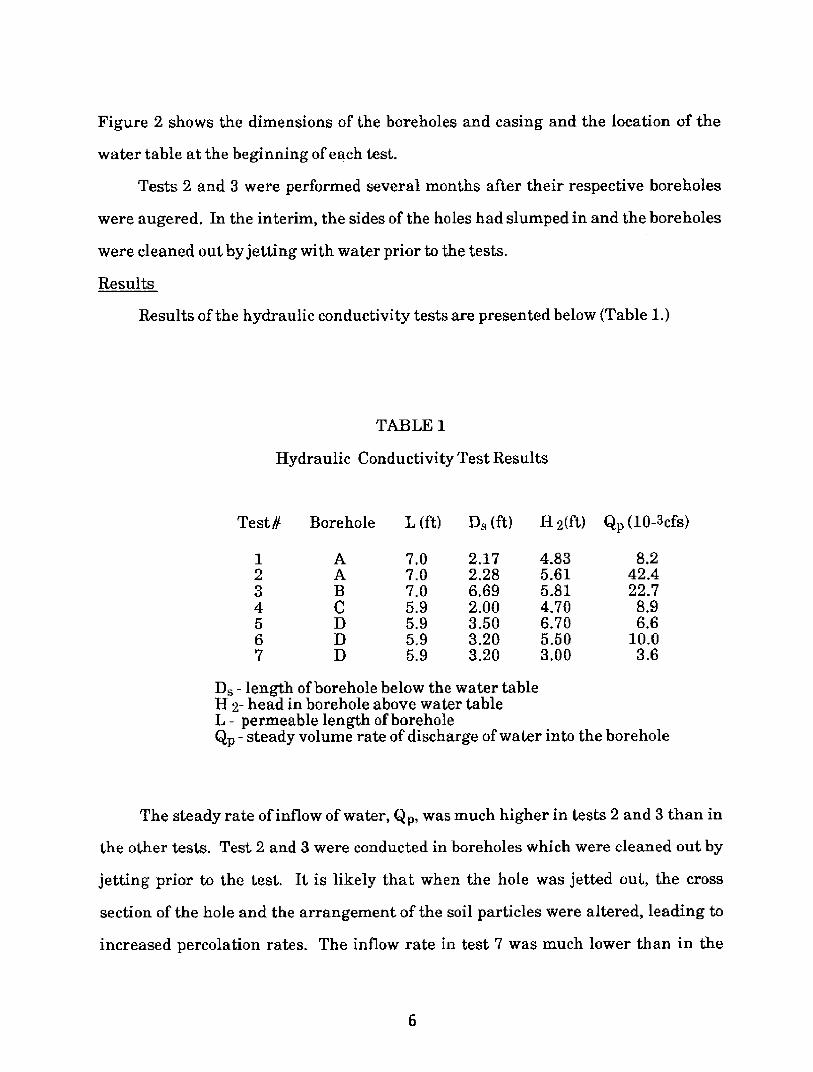
Figure 2 shows the dimensions of the boreholes and casing and the location of the
water table at the beginning of each test.
Tests 2 and 3 were performed several months after their respective boreholes
were augered. In the interim, the sides of the holes had slumped in and the boreholes
were cleaned out by jetting with water prior to the tests.
Results
Results of the hydraulic conductivity tests are presented below (Table 1.)
TABLE 1
Hydraulic Conductivity Test Results
Test# Borehole L (ft) Ds (ft) H 2 (ft) Qp (10- 3 cfs)
1 A 7.0 2.17 4.83 8.22 A 7.0 2.28 5.61 42.43 B 7.0 6.69 5.81 22.74 C 5.9 2.00 4.70 8.95 D 5.9 3.50 6.70 6.66 D 5.9 3.20 5.50 10.07 D 5.9 3.20 3.00 3.6
D - length of borehole below the water tableH 2- head in borehole above water tableL - permeable length of boreholeQp - steady volume rate of discharge of water into the borehole
The steady rate of inflow of water, Qp, was much higher in tests 2 and 3 than in
the other tests. Test 2 and 3 were conducted in boreholes which were cleaned out by
jetting prior to the test. It is likely that when the hole was jetted out, the cross
section of the hole and the arrangement of the soil particles were altered, leading to
increased percolation rates. The inflow rate in test 7 was much lower than in the
other tests. This is probably a result of the lower head maintained in the borehole
during test 7.
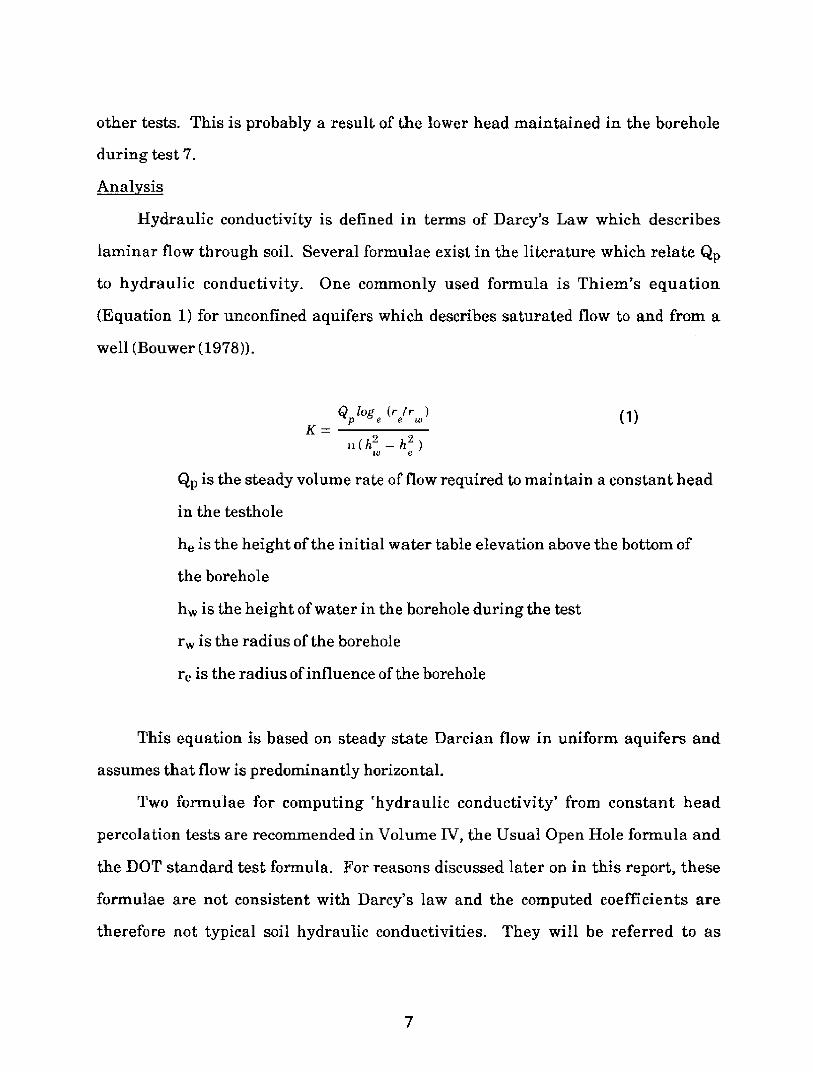
Analysis
Hydraulic conductivity is defined in terms of Darcy's Law which describes
laminar flow through soil. Several formulae exist in the literature which relate Qp
to hydraulic conductivity. One commonly used formula is Thiem's equation
(Equation 1) for unconfined aquifers which describes saturated flow to and from a
well (Bouwer (1978)).
Qp log (rer ) (1)
K=n(h 2 _ h2 )
W e
Qp is the steady volume rate of flow required to maintain a constant head
in the testhole
he is the height of the initial water table elevation above the bottom of
the borehole
hw is the height of water in the borehole during the test
rw is the radius of the borehole
re is the radius of influence of the borehole
This equation is based on steady state Darcian flow in uniform aquifers and
assumes that flow is predominantly horizontal.
Two formulae for computing 'hydraulic conductivity' from constant head
percolation tests are recommended in Volume IV, the Usual Open Hole formula and
the DOT standard test formula. For reasons discussed later on in this report, these
formulae are not consistent with Darcy's law and the computed coefficients are
therefore not typical soil hydraulic conductivities. They will be referred to as
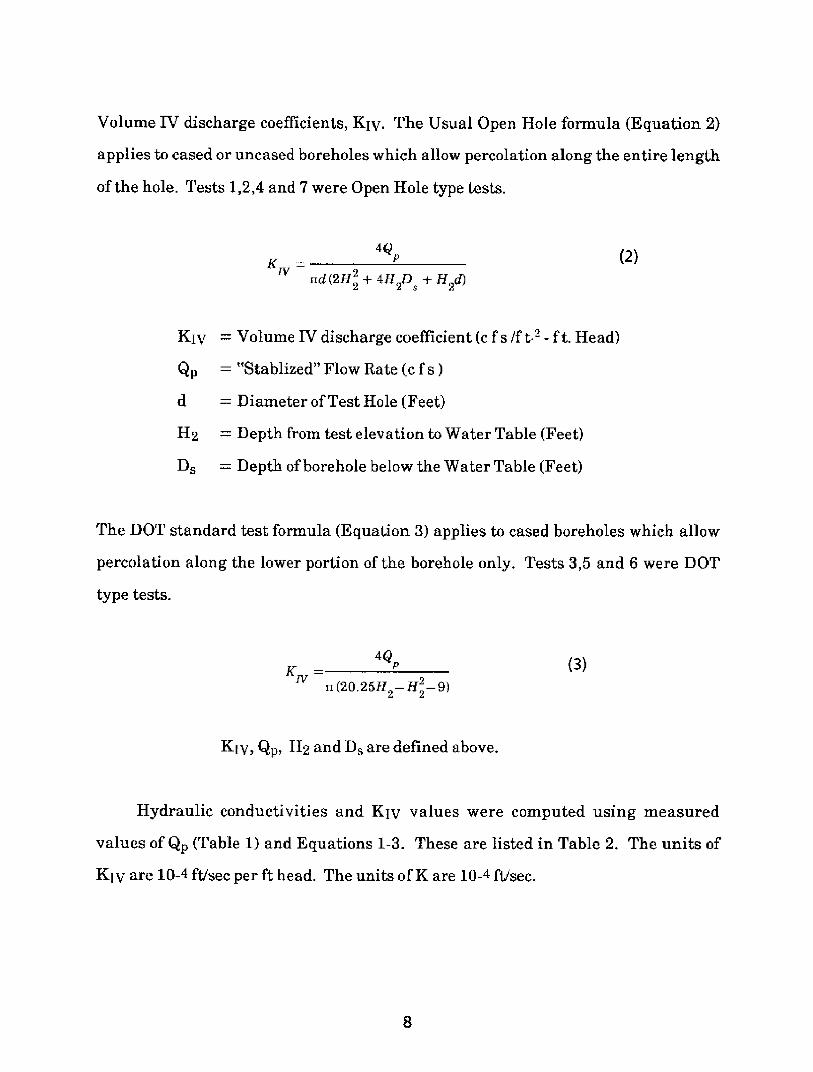
Volume IV discharge coefficients, KIV. The Usual Open Hole formula (Equation 2)
applies to cased or uncased boreholes which allow percolation along the entire length
of the hole. Tests 1,2,4 and 7 were Open Hole type tests.
i = 4QP (2)
iid(2H2 + 4H2Ds + H2d)
KIV = Volume IV discharge coefficient (c f s /f t-2 - ft. Head)
Qp = "Stablized" Flow Rate (c f s )
d = Diameter of Test Hole (Feet)
H2 = Depth from test elevation to Water Table (Feet)
Ds = Depth of borehole below the Water Table (Feet)
The DOT standard test formula (Equation 3) applies to cased boreholes which allow
percolation along the lower portion of the borehole only. Tests 3,5 and 6 were DOT
type tests.
4Qp (3)K-
Iv 2n (20.251 -H -9)
KIv, Qp, H2 and Ds are defined above.
Hydraulic conductivities and KIv values were computed using measured
values of Qp (Table 1) and Equations 1-3. These are listed in Table 2. The units of
KIV are 10-4 ft/sec per ft head. The units of K are 10-4 ft/sec.
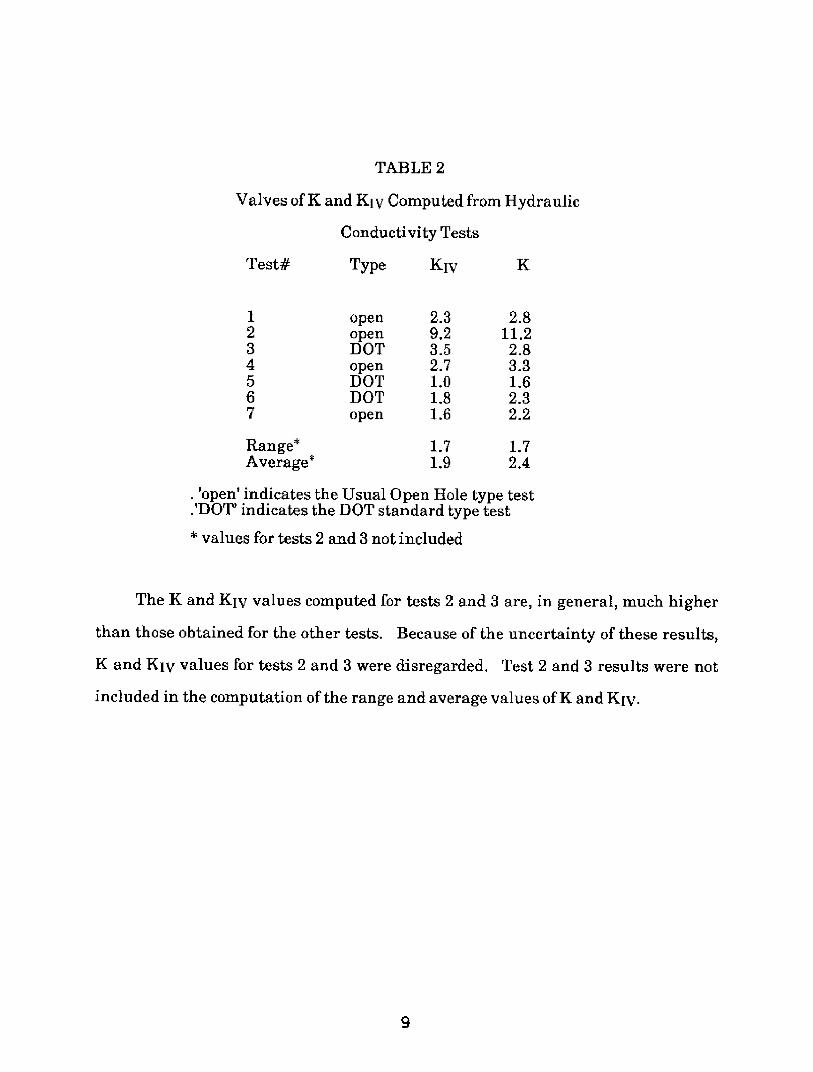
TABLE 2
Valves of K and Kiw Computed from Hydraulic
Conductivity Tests
Test# Type KIV K
1 open 2.3 2.82 open 9.2 11.23 DOT 3.5 2.84 open 2.7 3.35 DOT 1.0 1.66 DOT 1.8 2.37 open 1.6 2.2
Range* 1.7 1.7Average* 1.9 2.4
. 'open' indicates the Usual Open Hole type test
.'DOT' indicates the DOT standard type test
* values for tests 2 and 3 not included
The K and KIV values computed for tests 2 and 3 are, in general, much higher
than those obtained for the other tests. Because of the uncertainty of these results,
K and KIV values for tests 2 and 3 were disregarded. Test 2 and 3 results were not
included in the computation of the range and average values of K and KIv.
Trench Test
Procedure
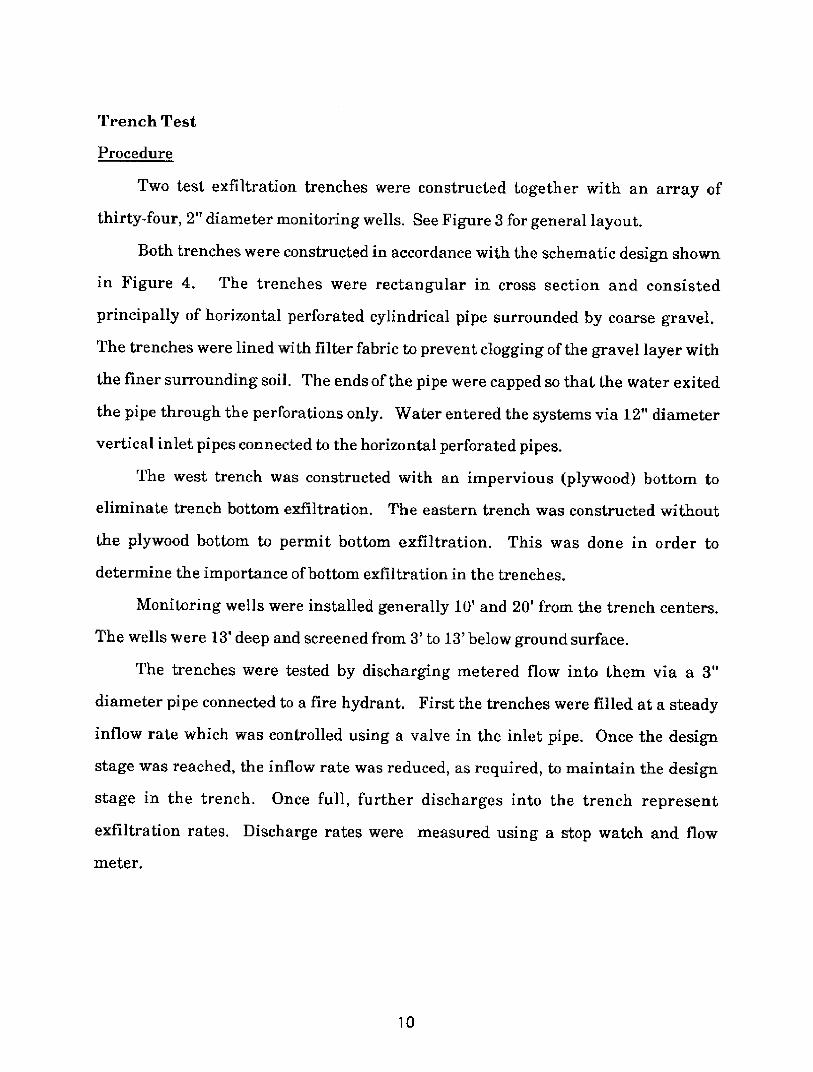
Two test exfiltration trenches were constructed together with an array of
thirty-four, 2" diameter monitoring wells. See Figure 3 for general layout.
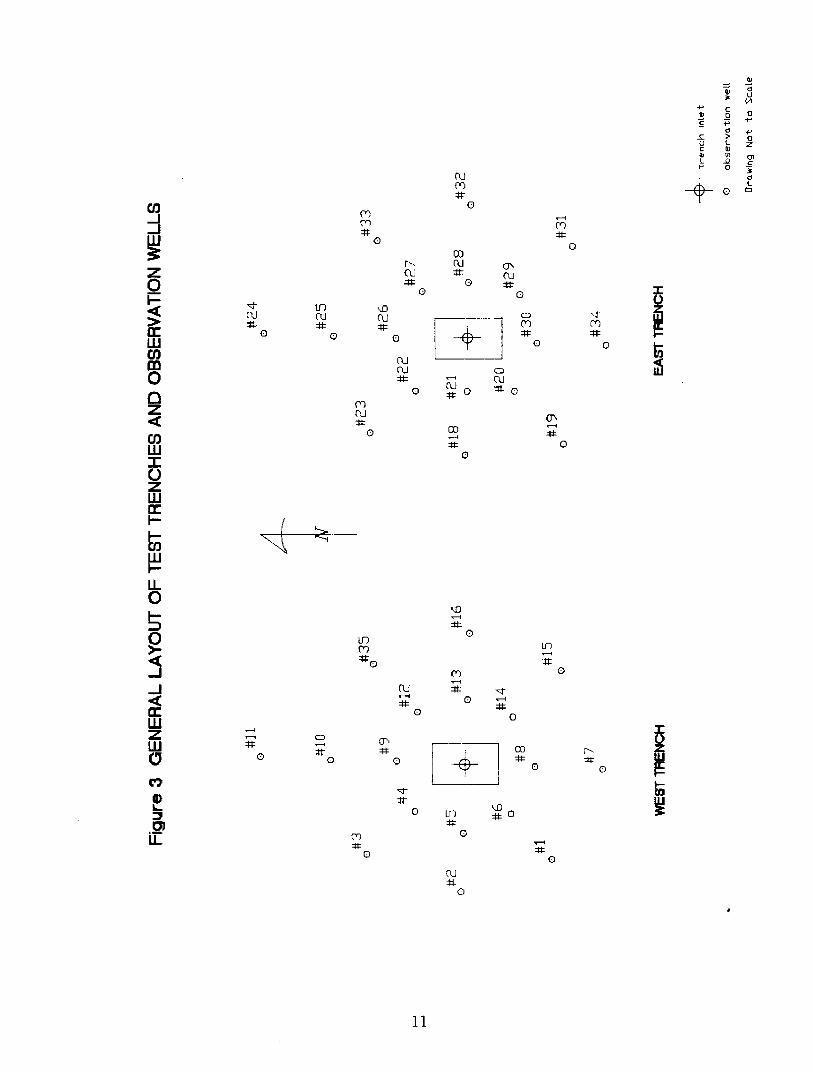
Both trenches were constructed in accordance with the schematic design shown
in Figure 4. The trenches were rectangular in cross section and consisted
principally of horizontal perforated cylindrical pipe surrounded by coarse gravel.
The trenches were lined with filter fabric to prevent clogging of the gravel layer with
the finer surrounding soil. The ends of the pipe were capped so that the water exited
the pipe through the perforations only. Water entered the systems via 12" diameter
vertical inlet pipes connected to the horizontal perforated pipes.
The west trench was constructed with an impervious (plywood) bottom to
eliminate trench bottom exfiltration. The eastern trench was constructed without
the plywood bottom to permit bottom exfiltration. This was done in order to
determine the importance of bottom exfiltration in the trenches.
Monitoring wells were installed generally 10' and 20' from the trench centers.
The wells were 13' deep and screened from 3' to 13' below ground surface.
The trenches were tested by discharging metered flow into them via a 3"
diameter pipe connected to a fire hydrant. First the trenches were filled at a steady
inflow rate which was controlled using a valve in the inlet pipe. Once the design
stage was reached, the inflow rate was reduced, as required, to maintain the design
stage in the trench. Once full, further discharges into the trench represent
exfiltration rates. Discharge rates were measured using a stop watch and flow
meter.
I Ul
6Z
0YJ
IfJ
C]m
flfl
t1J o
o o ooj c r
a
o LA ° o# #
_ aa# u
oc 4
a +'
{Sj L ZG G
L Ua c
3
L0 G
CD mO O 4 O 0
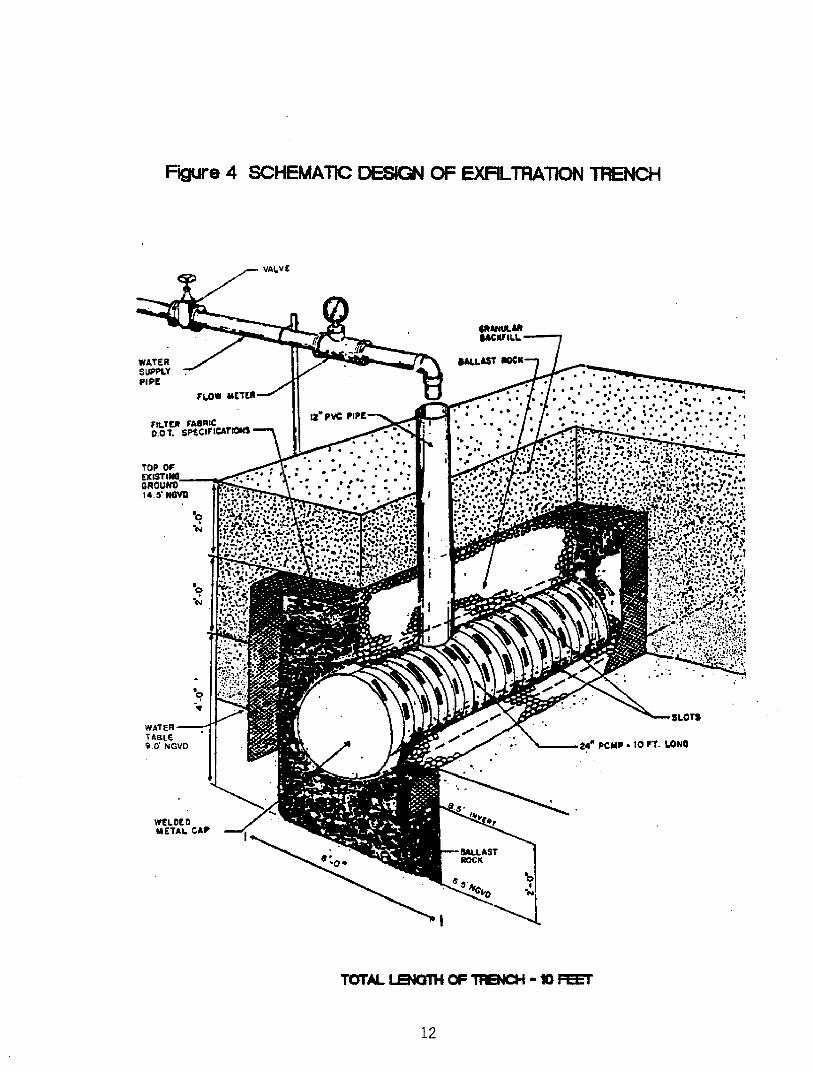
Figure 4 SCHEMATIC DESIGN OF EXFILTRATION TRENCH
TOTAL LENGTH OF TENCH -10 FEET

Preliminary tests (numbered 1-4) were run to determine the filling time of
trench (the time required to achieve the design stage, given a steady inflow rate) and
to estimate the total volume of water the trenches could handle in 1 hour (the design
period). The main objectives of the preliminary tests were to check the workability
of test procedures, to measure trench exfiltration rates and to determine the need for
further testing. The design stage during the preliminary tests was the top of the
ground.
Subsequent tests (numbers 5-7) were run with a more sophisticated monitoring
system in which groundwater elevations in the wells were recorded throughout the
test. Groundwater elevations were recorded using either insitu water level monitors
or weighted tapes. Since the trenches exfiltrate best when they are full (i.e.,with the
design head), during the final tests, the trenches were filled as quickly as possible.
The design stage for tests 5 and 6 was the top of the ground. For test 7 the design
stage was the top of the trench.
The primary purpose of these final tests was to provide the necessary
information to evaluate current and alternative design procedures.
Results and Discussion
The results of the trench tests are given in Table 3. Initial groundwater levels
relative to trench elevations are shown in Figure 5.
Lo
ri
Nom--- 10
UO
L
gC
aCA
n I *zW
C
I--P.f
b
ll
I'
i
I
D
M'Y
S
0
coP-itl
d
li
Q
LnCv
I
cil
C
z8Ez
mLM
U-
CLCL
Vd
LL eJ
IA 'P N
7 N M
CV
r
.4 3 --- ID
e+S
rt""--O ---- i
cnN
tl
_ -1
D
ri1f
±l]N
IIf -iw
b
I d. '
tla
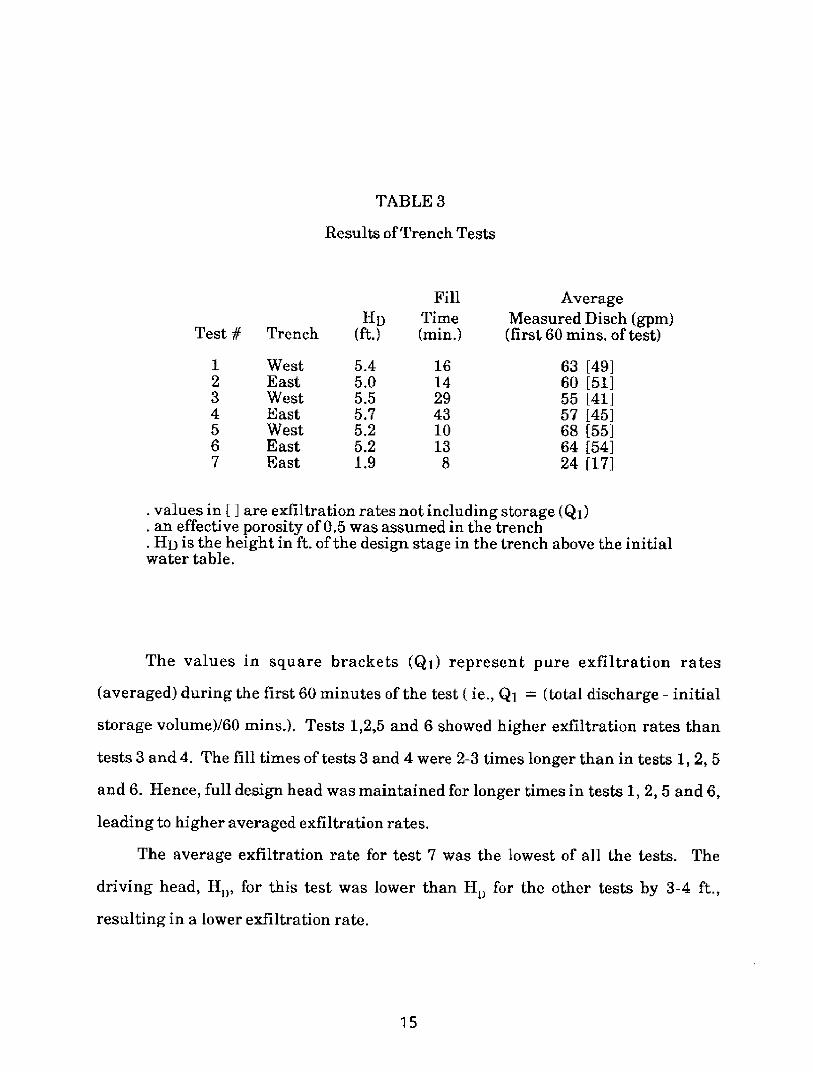
TABLE 3
Results of Trench Tests
Fill AverageHD Time Measured Disch (gpm)
Test # Trench (ft.) (min.) (first 60 mins., of test)
1 West 5.4 16 63 [49]2 East 5.0 14 60 [51]3 West 5.5 29 55 [41]4 East 5.7 43 57 [45]5 West 5.2 10 68 [55]6 East 5.2 13 64 [54]7 East 1.9 8 24 [17]
. values in [ ] are exfiltration rates not including storage (Q1)
. an effective porosity of 0.5 was assumed in the trench
. HD is the height in ft. of the design stage in the trench above the initialwater table.
The values in square brackets (Q1) represent pure exfiltration rates
(averaged) during the first 60 minutes of the test ( ie., Q1 = (total discharge initial
storage volume)/60 mins.). Tests 1,2,5 and 6 showed higher exfiltration rates than
tests 3 and 4. The fill times of tests 3 and 4 were 2-3 times longer than in tests 1, 2, 5
and 6. Hence, full design head was maintained for longer times in tests 1, 2, 5 and 6,
leading to higher averaged exfiltration rates.
The average exfiltration rate for test 7 was the lowest of all the tests. The
driving head, HD, for this test was lower than HD for the other tests by 3-4 ft.,
resulting in a lower exfiltration rate.
The observed discharge rates presented in Table 3 are averaged over the first
60 minutes of the test. These rates do not represent pure exfiltration since the
volume of water stored in the trench is included in the total inflow volume. Pure
exfiltration rates for the first 60 minutes of the test (Q1) include exfiltration before
the trench was completely full. Average discharge rates during the first 60 minutes
after filling (Q2) are presented in Table 4 for tests 4-7 (tests 1-3 were terminated 60
minutes after the beginning of the test). Q2 represents pure exfiltration rates under
full design head.
Q2 is 1 gpm higher than Q1 for tests 4 and 7. This is not surprising, since Q1
includes exfiltration while the trench is partially full and the driving head is less
than design head. Q2 is lower than Q1 for tests 5 and 6. This is probably due to a
reduction in exfiltration rates resulting from a progressively increasing
groundwater mound. Changes in groundwater elevations with time are discussed
later in this section.
Test 5 (west trench) and test 6 (east trench) were conducted with the same head
above the water table. The exfiltration rate in test 5 is 1 gpm lower than in test 6.
The difference in exfiltration rates is probably because the east trench allows bottom
exfiltration while the west trench does not. This suggests that bottom exfiltration
accounts for about 2% of the total trench exfiltration and is therefore not significant.
The fill time and design head appear to be the dominant influences on exfiltration
rates.
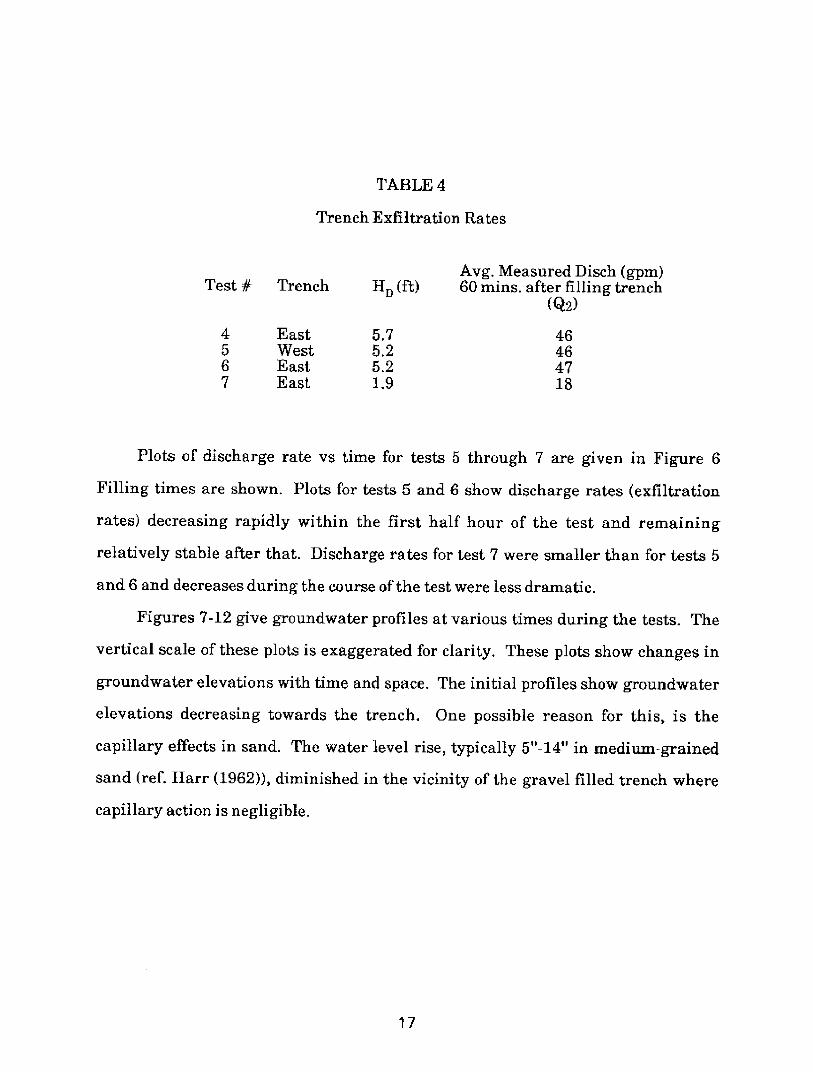
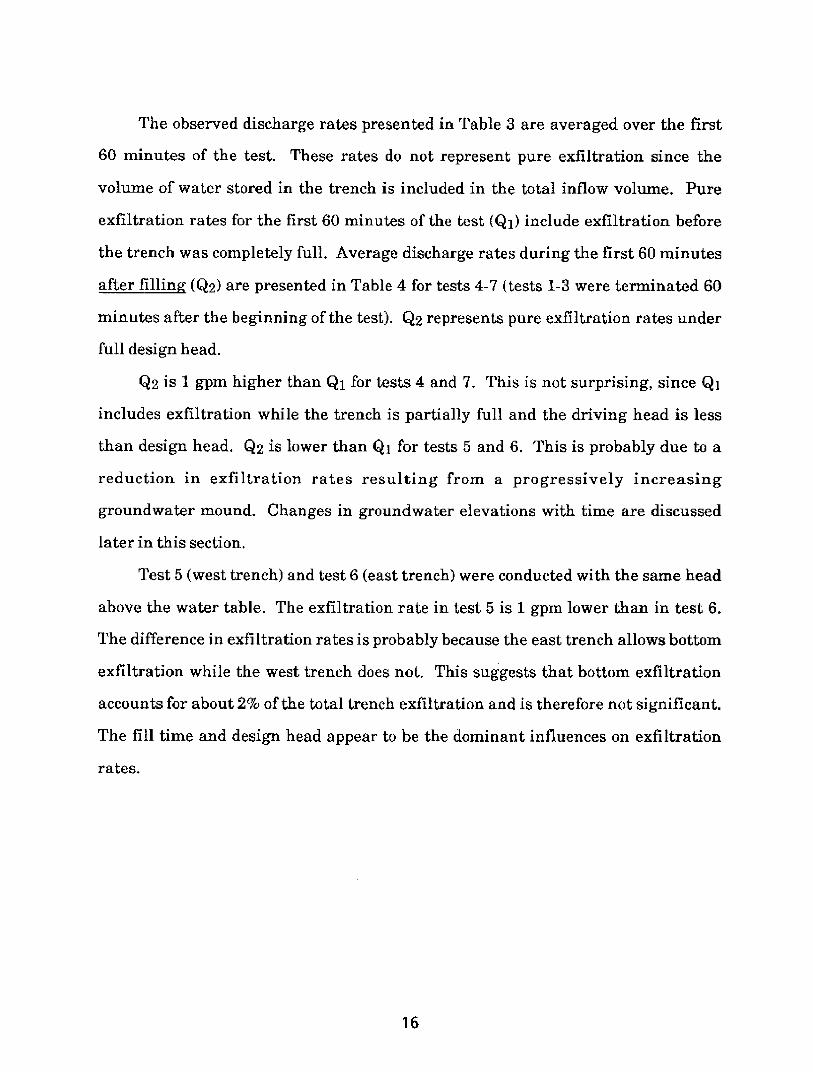
TABLE 4
Trench Exfiltration Rates
Avg. Measured Disch (gpm)Test # Trench HD (ft) 60 mins. after filling trench
(Q2)
4 East 5.7 465 West 5.2 466 East 5.2 477 East 1.9 18
Plots of discharge rate vs time for tests 5 through 7 are given in Figure 6
Filling times are shown. Plots for tests 5 and 6 show discharge rates (exfiltration
rates) decreasing rapidly within the first half hour of the test and remaining
relatively stable after that. Discharge rates for test 7 were smaller than for tests 5
and 6 and decreases during the course of the test were less dramatic.
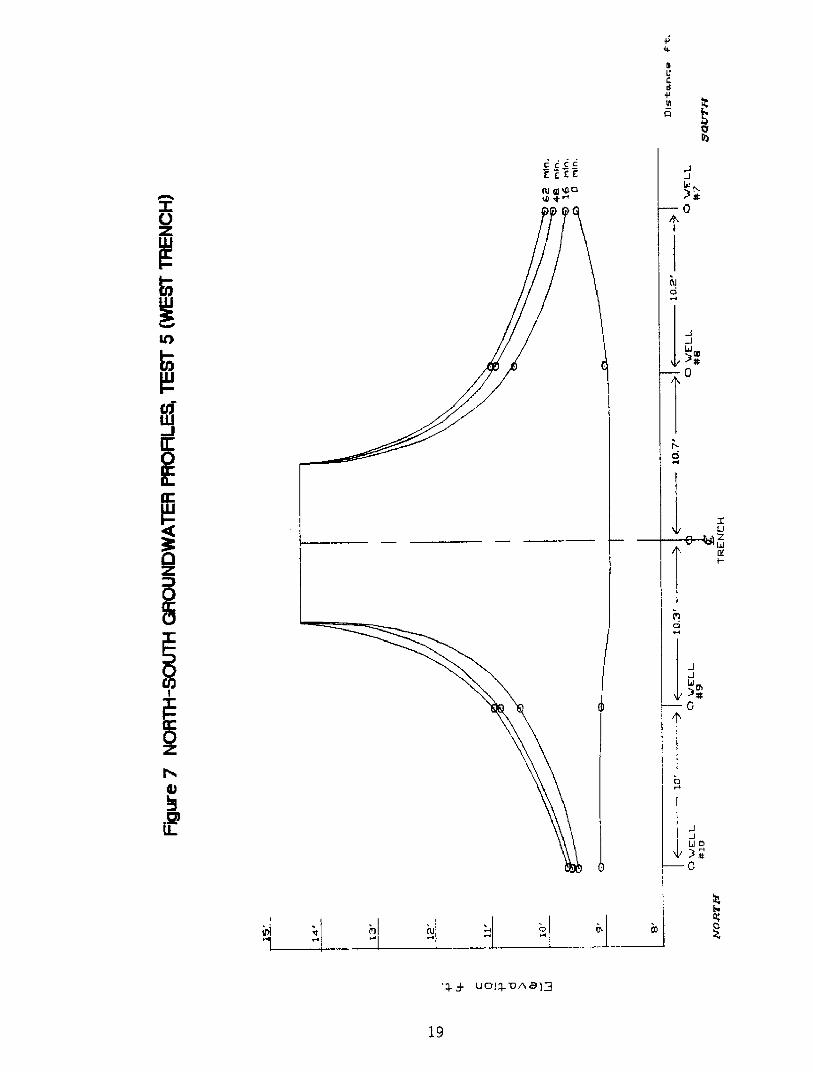
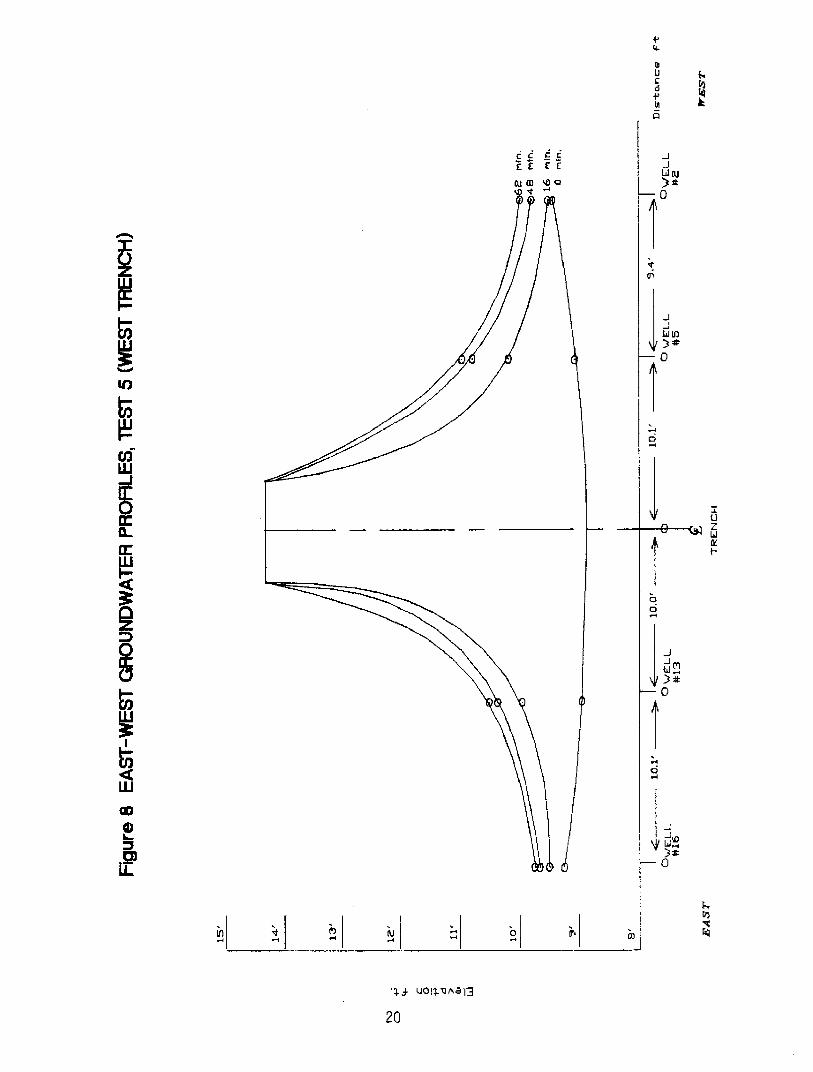
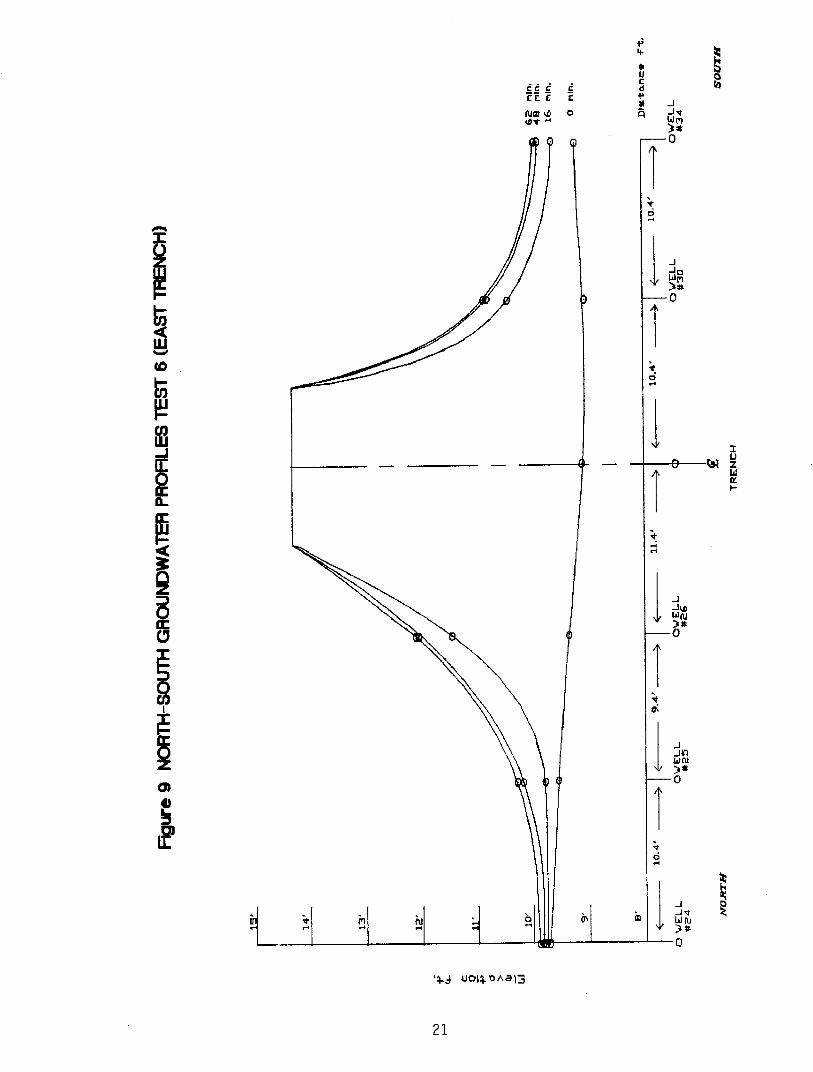
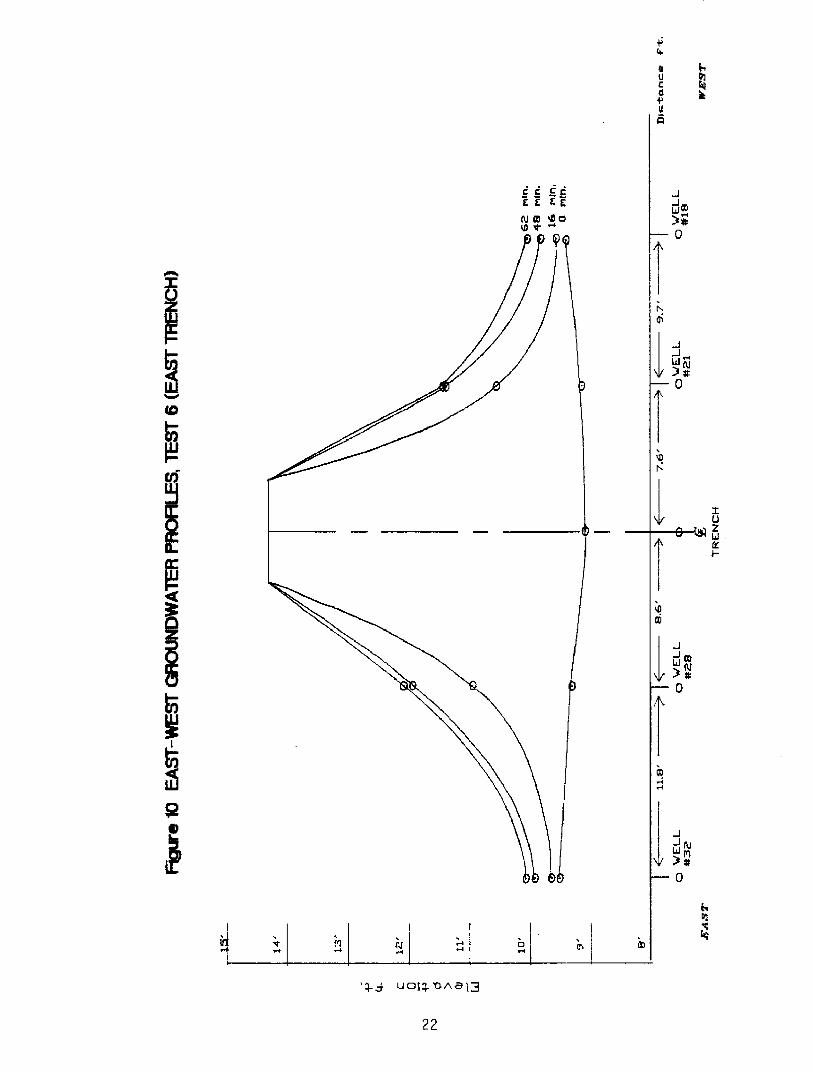
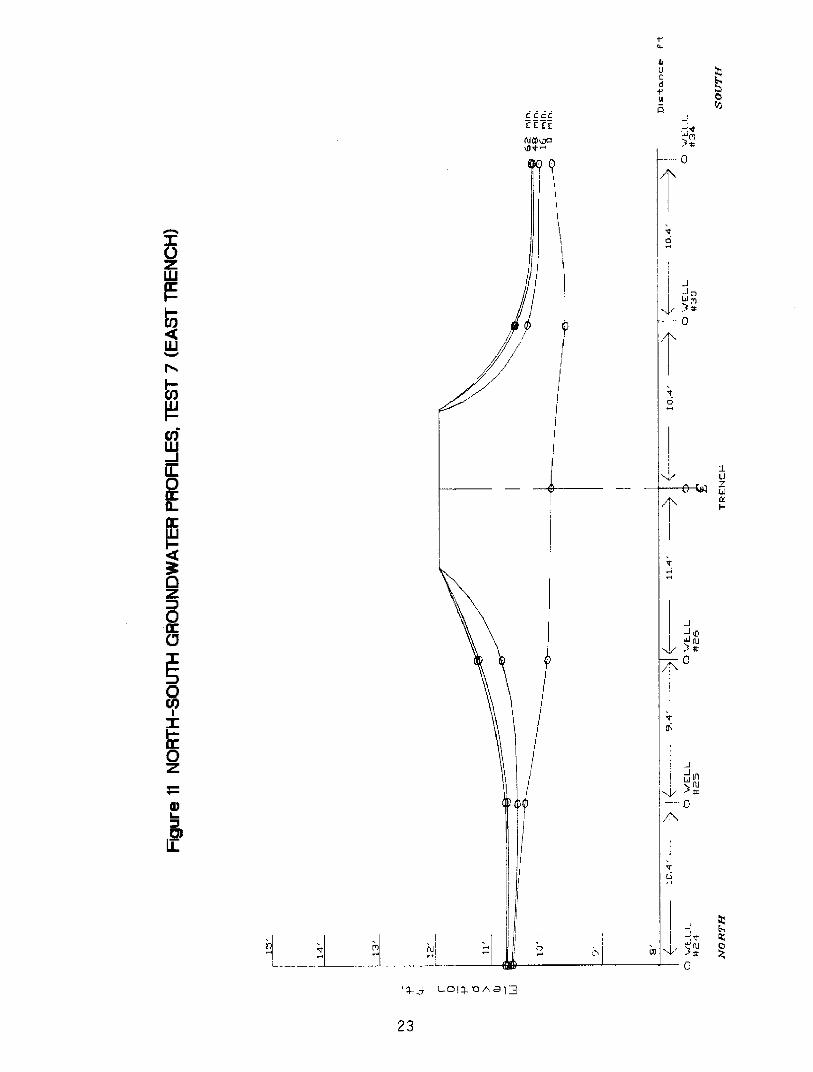
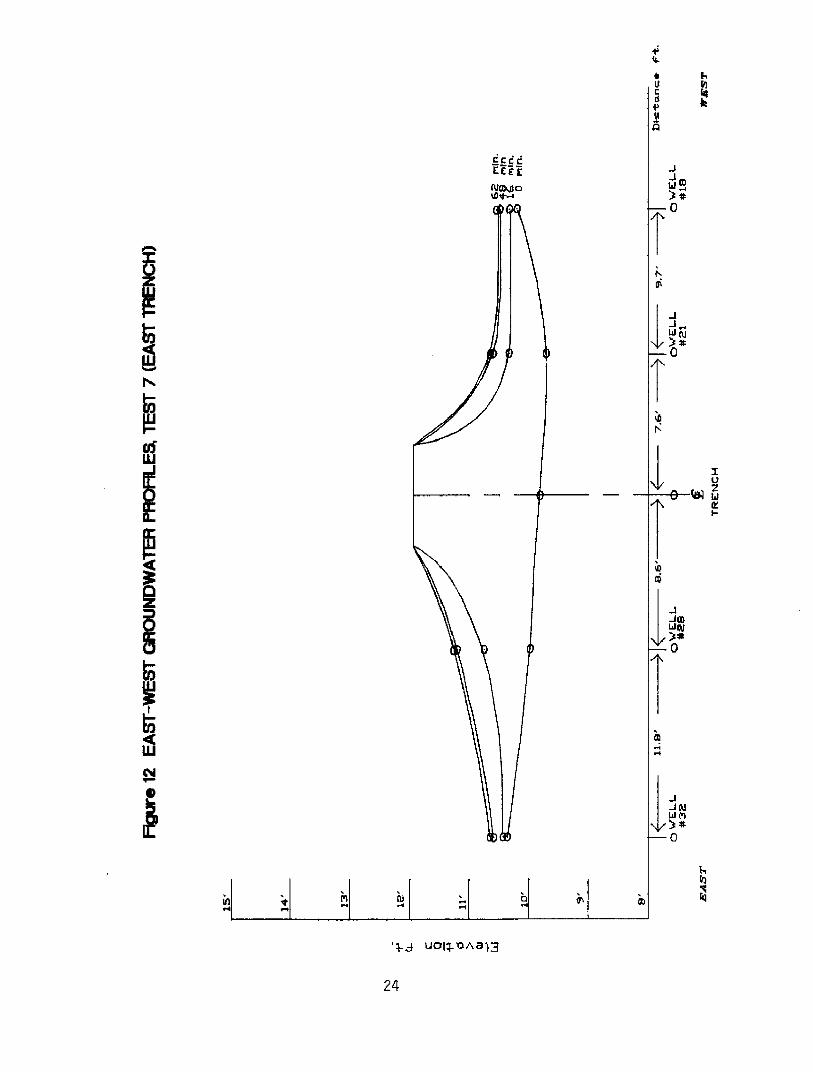
Figures 7-12 give groundwater profiles at various times during the tests. The
vertical scale of these plots is exaggerated for clarity. These plots show changes in
groundwater elevations with time and space. The initial profiles show groundwater
elevations decreasing towards the trench. One possible reason for this, is the
capillary effects in sand. The water level rise, typically 5"-14" in medium-grained
sand (ref. Harr (1962)), diminished in the vicinity of the gravel filled trench where
capillary action is negligible.
Figu
20
re 6 DISCHARGE RATE VS TIMETEST 5 - WEST TRENCH
40
nme (min.)
0
TEST 6 - EAS TREC
0 20 40 0 E
Tn.R (Mh)
o 20 40
ime (min,)
--
4i,
i
--
- J
1
7
nucdJJAa
c ccEE E
I\ 10 .+
aJW
ro
9to
ro
V2
WJ
0
Ea:
Q
Zm0a/
:
0
N
.1p!
LL
7
r
E4
U
4 4 Go
Nu LA"4-,f ua!4-nna]3
L1.
o!4- O!a,-l
20
c cd
cuw mWOC
C6z
I0
Lr
0
0
C
6.
wi
+'
u 69
cas D
-Ac
0
a,,
-0
k-4
70
6
4;occ C c d
E E +'
(Um %0 p
'5J U0D~Aa13
44
Lu
a2
IIQ.
[L
IU2Iii
I-
C C dF
e 7 £rN a totD * .
s"
v
la
W
f^
wJ
l
S+,V
ZW
F-
k
'4- -4 uot:: nna13
,114-
mu
Y Oa
cc cE E FL ¢
NfOwo W
j n
zW
FraWv
NF-U]
U1WJLLOaCncc
a3zOf=O
Oz
4)
iTL
amuz
F
xaa
uojq.nna13
23
Efl jCIEEEI
'I-d UOI4.1taBV
I
05
LU
L
2
I2
ii
The inflow to the trenches during the tests resulted in increases to the
groundwater levels in a mounding fashion. The wells closer to the trench (nominal
10 feet) show more pronounced and variable increases than those further away
(nominal 20 feet).
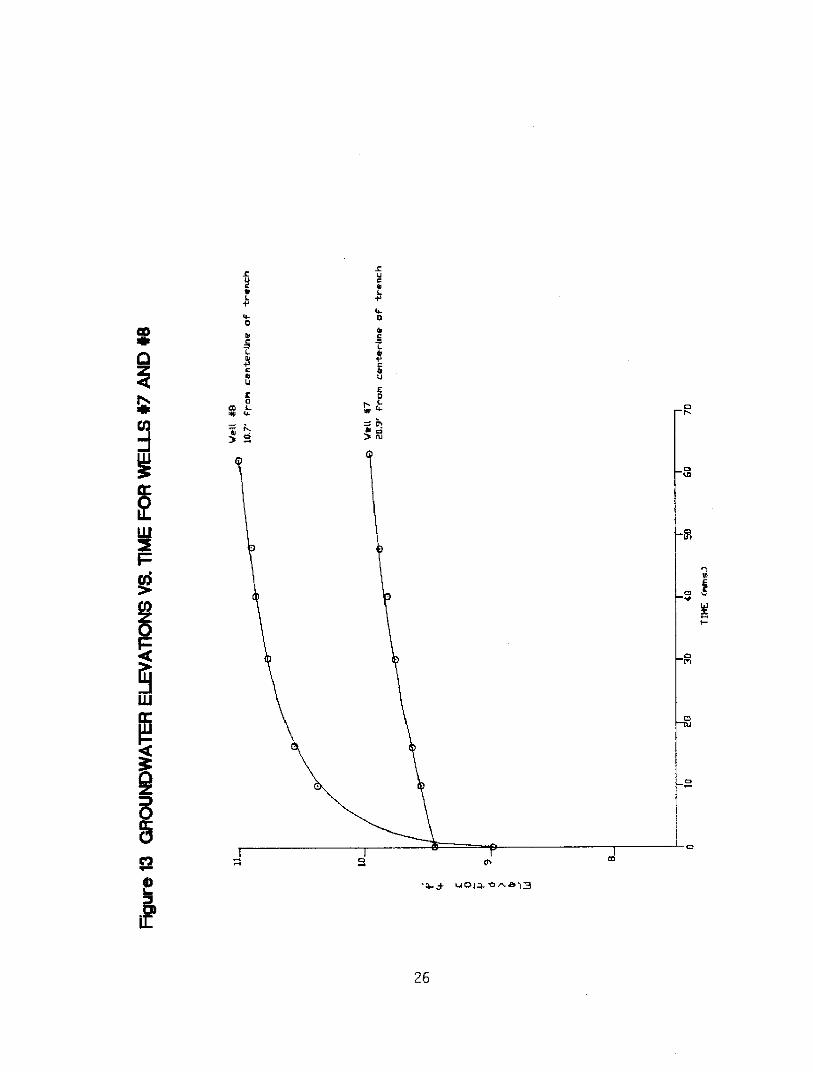
Figure 13 shows time varying plots of water elevations in wells #7 and #8
during test 5. Well #8 is 10.7' from the trench center. In well #8 groundwater
elevations increase rapidly in the first 15 minutes of the test (75% of the total
increase in 15 minutes) and then taper off to a more gradual increase with time (25%
of total increase in 45 minutes). Groundwater elevation increases in well #7 (20.9'
from trench center) were smaller in magnitude and relatively steady with time.
a £
'*:& uammnal3
Ca

COMPARISON BETWEEN COMPUTED AND OBSERVED DISCHARGES
In order to test the accuracy of the Volume IV trench design methodology,
design discharge rates computed using Volume IV formulae were compared with
observed discharge rates in tests 1-7. An average Volume IV discharge coefficient
(KIv) of 1.9 x 10⁻⁴ sec 1 was obtained using results from two types of Volume IV
recommended constant head percolation tests, the DOT standard test and the Usual
Open Hole test.(See Table 2). This KIV value, together with the test trench
dimensions, was substituted in the Volume IV trench design formula and design
discharge rates were obtained.
End wall exfiltration, usually neglected because of the large length to width
ratio in most trenches, was included in these computations because of the relatively
short lengths of the test trenches. Bottom exfiltration was excluded from the
computations for the west trench, since it has an impervious bottom.
Computed discharge rates obtained using Volume IV design formula are shown
in Table 5 together with averaged discharge rates measured during the trench tests.
The computed discharge rates obtained from the Volume IV method are greater
than observed discharge rates by 32-158%. It is interesting to note that for the west
trench (trench bottom exfiltration excluded) there was better agreement between
computed and observed discharge rates.
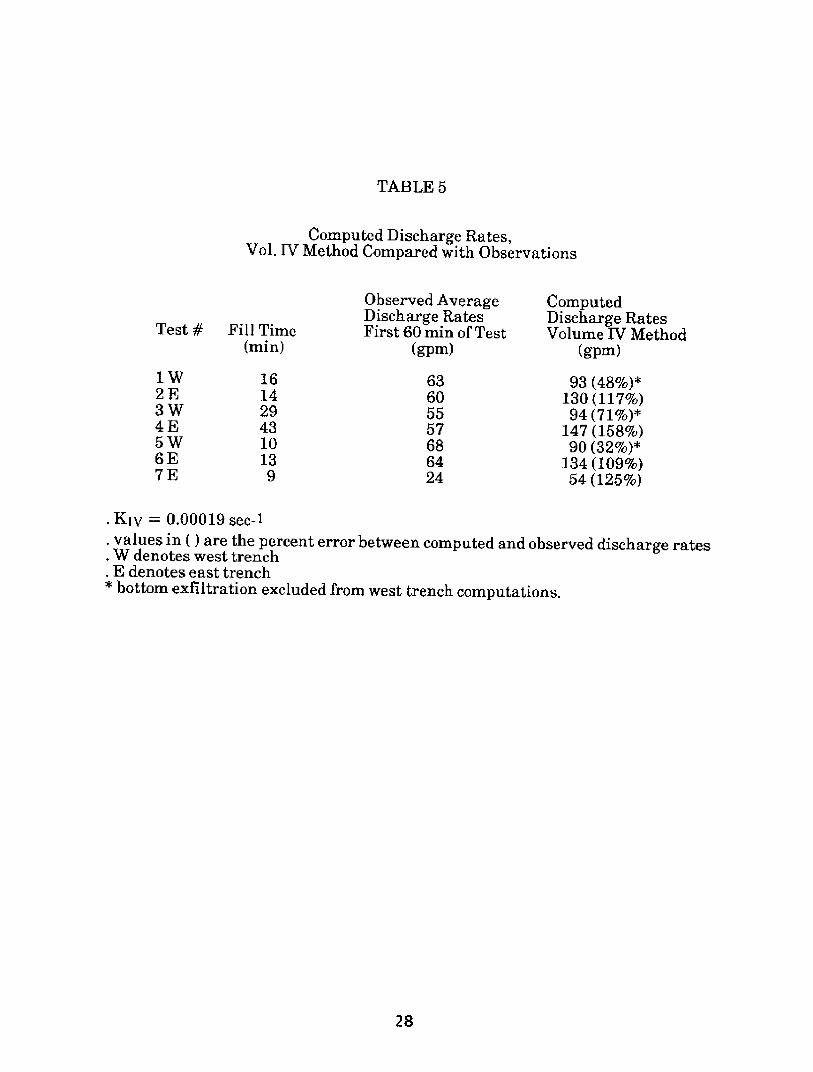
TABLE 5
Computed Discharge Rates,Vol. IV Method Compared with Observations
Observed Average ComputedDischarge Rates Discharge Rates
Test # Fill Time First 60 min of Test Volume IV Method(min) (gpm) (gpm)
1 W 16 63 93 (48%)*2 E 14 60 130 (117%)3 W 29 55 94 (71%)*4 E 43 57 147 (158%)5 W 10 68 90 (32%)*6 E 13 64 134 (109%)7 E 9 24 54 (125%)
.Kiv = 0.00019 sec-1. values in ( ) are the percent error between computed and observed discharge rates. W denotes west trench. E denotes east trench* bottom exfiltration excluded from west trench computations.
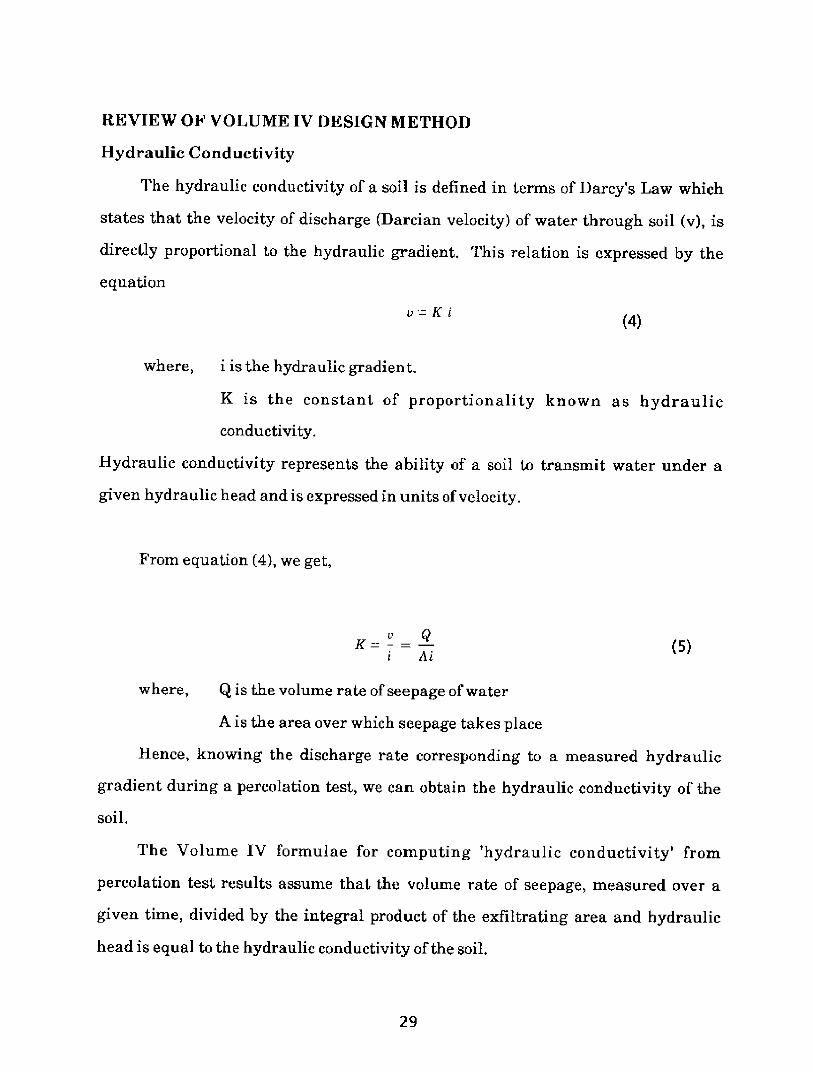
REVIEW OF VOLUME IV DESIGN METHOD
Hydraulic Conductivity
The hydraulic conductivity of a soil is defined in terms of Darcy's Law which
states that the velocity of discharge (Darcian velocity) of water through soil (v), is
directly proportional to the hydraulic gradient. This relation is expressed by the
equation
v K i (4)
where, i is the hydraulic gradient.
K is the constant of proportionality known as hydraulic
conductivity.
Hydraulic conductivity represents the ability of a soil to transmit water under a
given hydraulic head and is expressed in units of velocity.
From equation (4), we get,
v QK - (5)i Ai
where, Q is the volume rate of seepage of water
A is the area over which seepage takes place
Hence, knowing the discharge rate corresponding to a measured hydraulic
gradient during a percolation test, we can obtain the hydraulic conductivity of the
soil.
The Volume IV formulae for computing 'hydraulic conductivity' from
percolation test results assume that the volume rate of seepage, measured over a
given time, divided by the integral product of the exfiltrating area and hydraulic
head is equal to the hydraulic conductivity of the soil.
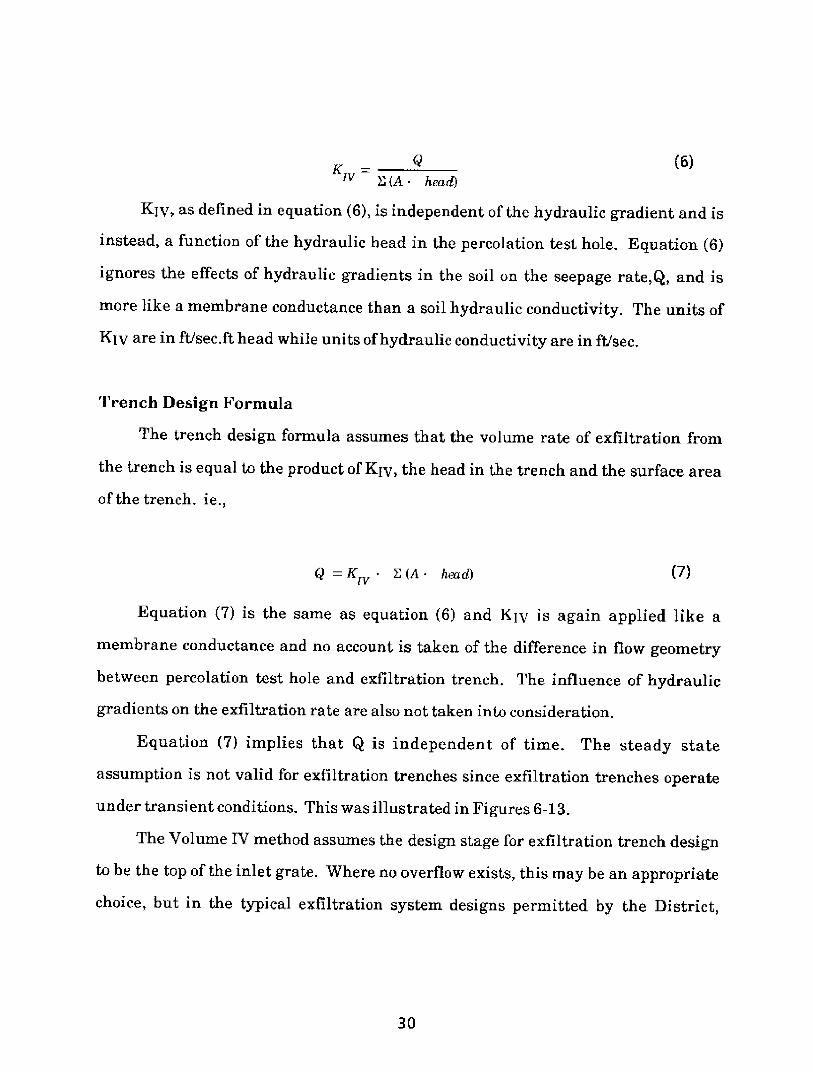
KQ (6)IV E (A " head)
KIV, as defined in equation (6), is independent of the hydraulic gradient and is
instead, a function of the hydraulic head in the percolation test hole. Equation (6)
ignores the effects of hydraulic gradients in the soil on the seepage rate,Q, and is
more like a membrane conductance than a soil hydraulic conductivity. The units of
KIv are in ft/sec.ft head while units of hydraulic conductivity are in ft/sec.
Trench Design Formula
The trench design formula assumes that the volume rate of exfiltration from
the trench is equal to the product of Kiv, the head in the trench and the surface area
of the trench. ie.,
Q = K - E (A head) (7)
Equation (7) is the same as equation (6) and KIV is again applied like a
membrane conductance and no account is taken of the difference in flow geometry
between percolation test hole and exfiltration trench. The influence of hydraulic
gradients on the exfiltration rate are also not taken into consideration.
Equation (7) implies that Q is independent of time. The steady state
assumption is not valid for exfiltration trenches since exfiltration trenches operate
under transient conditions. This was illustrated in Figures 6-13.
The Volume IV method assumes the design stage for exfiltration trench design
to be the top of the inlet grate. Where no overflow exists, this may be an appropriate
choice, but in the typical exfiltration system designs permitted by the District,
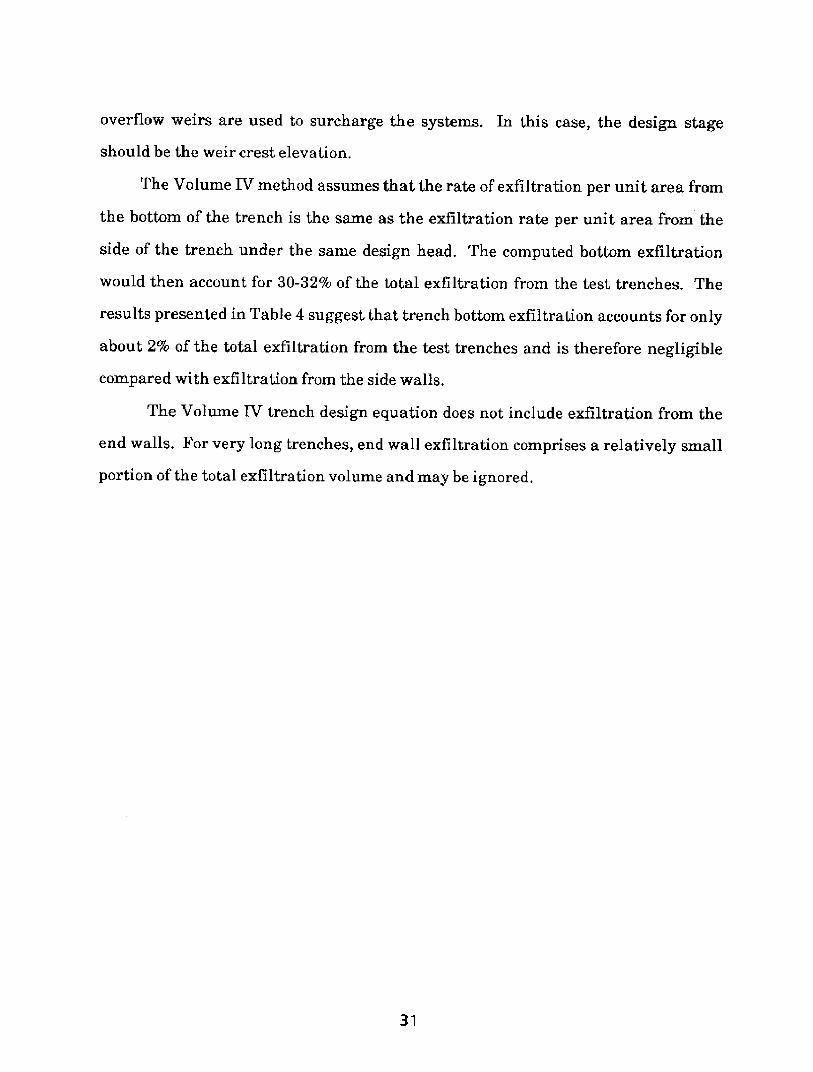
overflow weirs are used to surcharge the systems. In this case, the design stage
should be the weir crest elevation.
The Volume IV method assumes that the rate of exfiltration per unit area from
the bottom of the trench is the same as the exfiltration rate per unit area from the
side of the trench under the same design head. The computed bottom exfiltration
would then account for 30-32% of the total exfiltration from the test trenches. The
results presented in Table 4 suggest that trench bottom exfiltration accounts for only
about 2% of the total exfiltration from the test trenches and is therefore negligible
compared with exfiltration from the side walls.
The Volume IV trench design equation does not include exfiltration from the
end walls. For very long trenches, end wall exfiltration comprises a relatively small
portion of the total exfiltration volume and may be ignored.
ALTERNATE PROCEDURE
The Volume IV Methodology overestimates trench exfiltration rates which
leads to an underestimation of trench lengths. An alternate design procedure is
presented and tested against field measurements of tests 1 -7. This procedure treats
the trench as a line source and will be referred to as the "line-source" method.
The line-source method is a two part design procedure involving
1. the determination of soil hydraulic conductivity, K
2. the determination of minimum trench dimensions to
provide the required trench capacity.
Determination of K
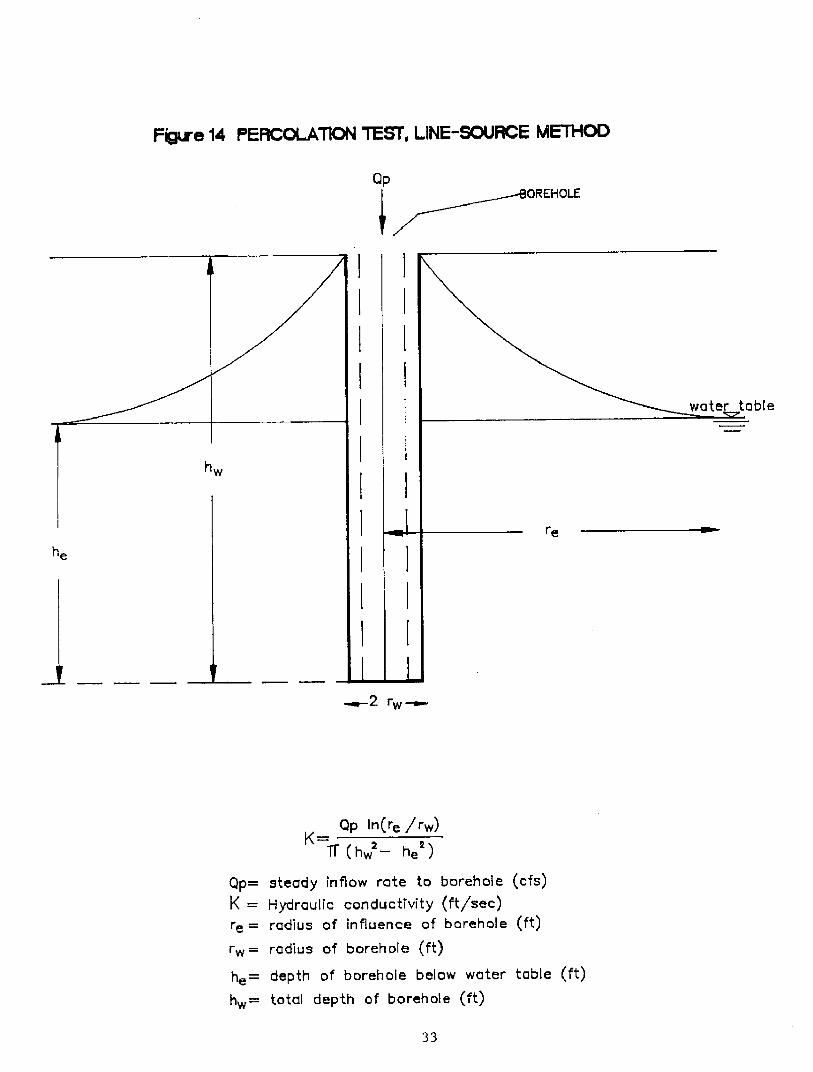
The proposed alternate method determines hydraulic conductivity, K, using a
constant head percolation test. The field procedure for the percolation test is the
same as the Usual Open Hole test described in Volume IV. Qp, the steady rate of
discharge into the borehole and hw, the initial water table elevation are measured. K
is then computed using Thiem's equation (Illustrated in Figure 14).
In order to apply Thiem's equation, the radius of influence, re, of the borehole
must be determined. This can be done using observation wells placed at varying
distances from the borehole. The minimum distance from the borehole at which no
change in groundwater elevation is observed during the test is the radius of
influence, re.
Observation wells are expensive to install and if an array of observation wells
is required for each percolation test, the cost of field testing would increase
significantly. Even when observation wells are installed, the chances of placing an
observation well at a distance equal to re from the borehole are relatively small. The
Figre 14 PERCOLATION TEST, LINE-SOURCE METHOD
OREHOLE
water table
-2 rw -
CK=
Qp= steady inflK = Hydraulicre = radius of
rw= radius of
he= depth oft
hw= total dept
Qp Iln(re /rw)
(hw 2 - he 2 )
ow rate to borehole (cfs)
conductivity (ft/sec)influence of borehole (ft)
borehole (ft)
borehole below water table (ft)
h of borehole (ft)
he
]I1
!2-
d1
Lu
SI
h
h,
I
CI
choice of re depends on the judgement of the designer and the value chosen is,
therefore, approximate. Because of this, it is acceptable to determine a typical re
from observation wells during one percolation test on the site and apply it to all other
percolation tests conducted on site. Alternatively, typical values of re may be
specified for use in various areas in the District.
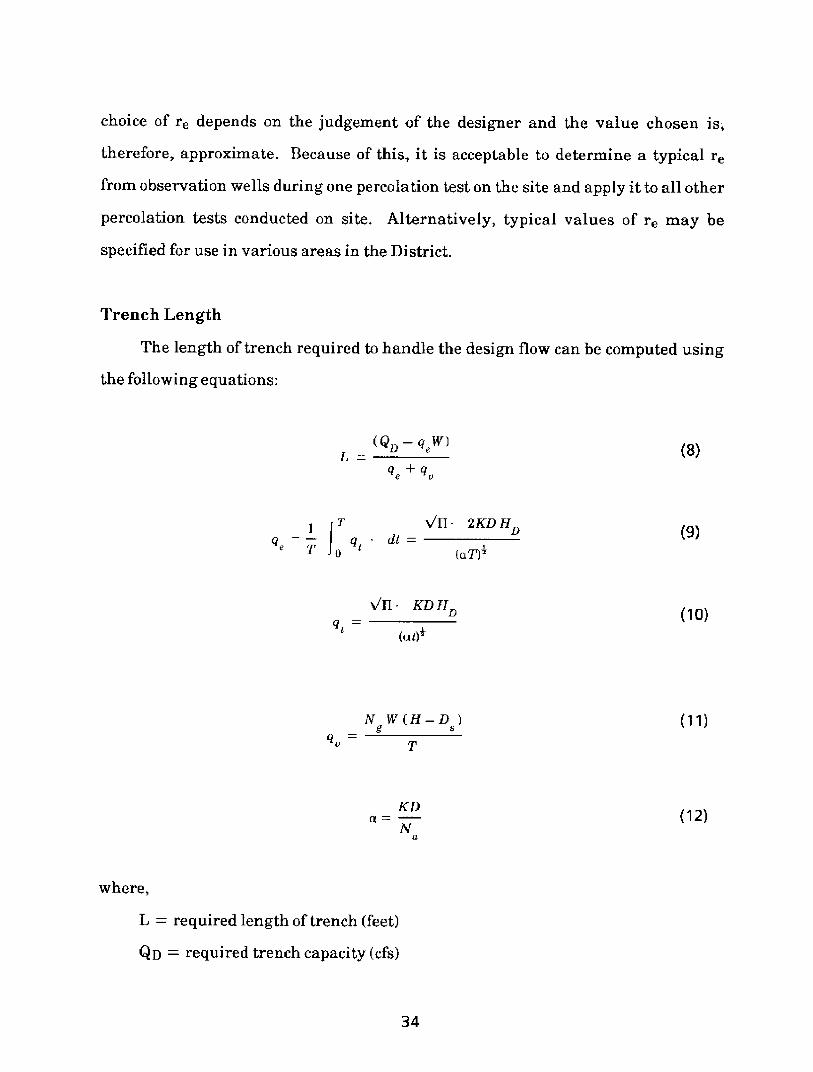
Trench Length
The length of trench required to handle the design flow can be computed using
the following equations:
L Q - qeW) (8)
qe + qu
T vtI - 2KD (9)q - - q t = d (n !
(a T)
1/ . KD D (10)t (at)
N W(H-D ) (11)g s
q T
KD- (12)N
a
where,
L = required length of trench (feet)
QD = required trench capacity (cfs)
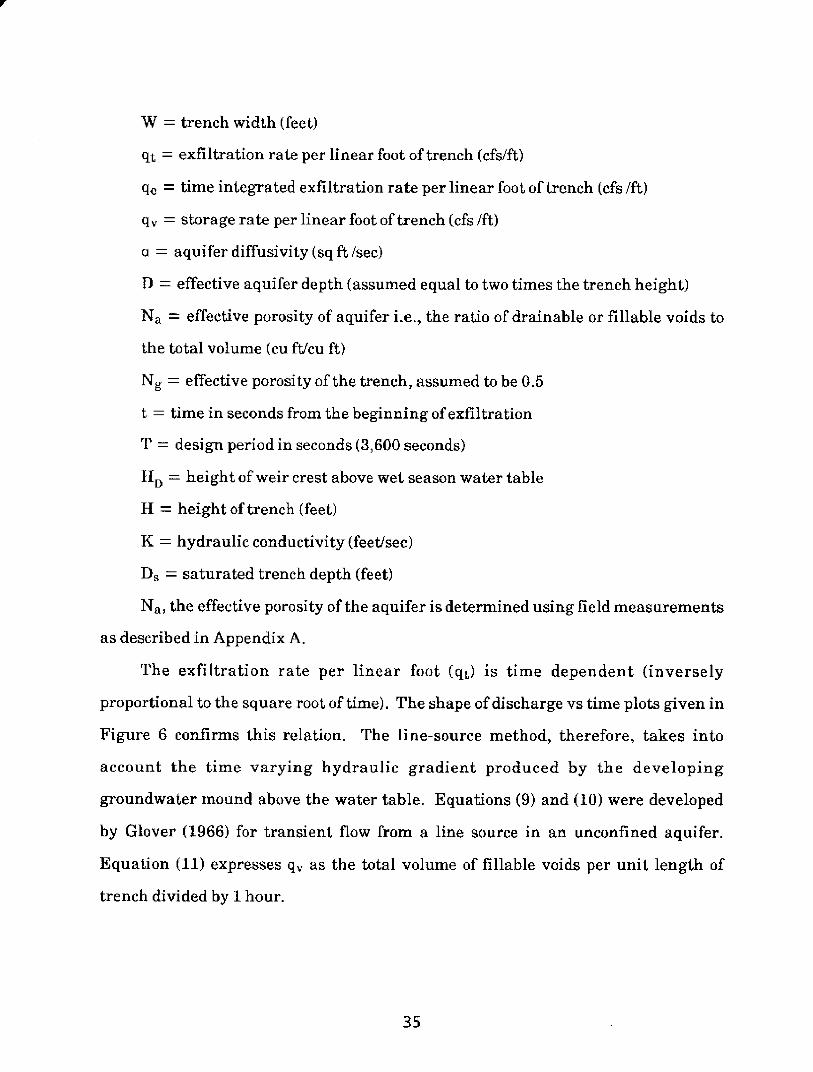
W = trench width (feet)
qt = exfiltration rate per linear foot of trench (cfs/ft)
qe = time integrated exfiltration rate per linear foot of trench (cfs /ft)
qv = storage rate per linear foot of trench (cfs /ft)
a = aquifer diffusivity (sq ft lsec)
D = effective aquifer depth (assumed equal to two times the trench height)
Na = effective porosity of aquifer i.e., the ratio of drainable or fillable voids to
the total volume (cu ft/cu ft)
Ng = effective porosity of the trench, assumed to be 0.5
t = time in seconds from the beginning of exfiltration
T = design period in seconds (3,600 seconds)
H D = height of weir crest above wet season water table
H = height of trench (feet)
K = hydraulic conductivity (feet/sec)
Ds = saturated trench depth (feet)
Na, the effective porosity of the aquifer is determined using field measurements
as described in Appendix A.
The exfiltration rate per linear foot (qt) is time dependent (inversely
proportional to the square root of time). The shape of discharge vs time plots given in
Figure 6 confirms this relation. The line-source method, therefore, takes into
account the time varying hydraulic gradient produced by the developing
groundwater mound above the water table. Equations (9) and (10) were developed
by Glover (1966) for transient flow from a line source in an unconfined aquifer.
Equation (11) expresses qv as the total volume of fillable voids per unit length of
trench divided by 1 hour.
Mounding
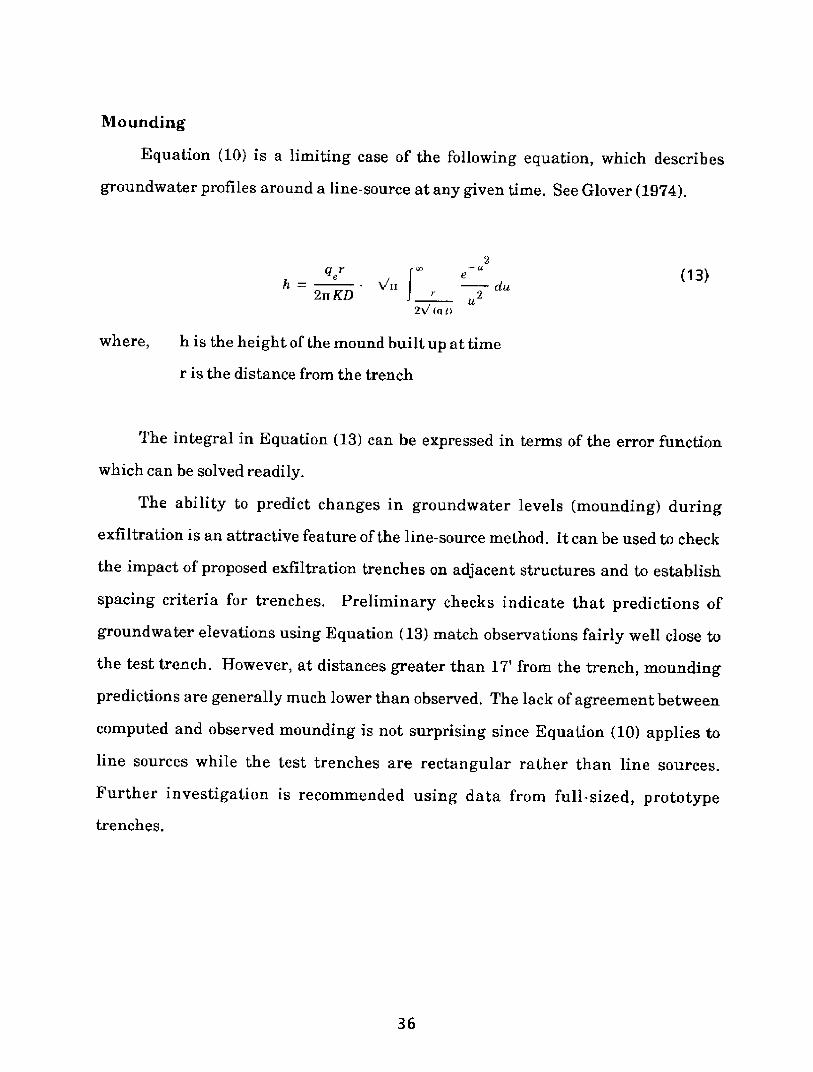
Equation (10) is a limiting case of the following equation, which describes
groundwater profiles around a line-source at any given time. See Glover (1974).
2qr e (13)
h - JII - du2n KD r 2u
2- (a I
where, h is the height of the mound built up at time
r is the distance from the trench
The integral in Equation (13) can be expressed in terms of the error function
which can be solved readily.
The ability to predict changes in groundwater levels (mounding) during
exfiltration is an attractive feature of the line-source method. It can be used to check
the impact of proposed exfiltration trenches on adjacent structures and to establish
spacing criteria for trenches. Preliminary checks indicate that predictions of
groundwater elevations using Equation (13) match observations fairly well close to
the test trench. However, at distances greater than 17' from the trench, mounding
predictions are generally much lower than observed. The lack of agreement between
computed and observed mounding is not surprising since Equation (10) applies to
line sources while the test trenches are rectangular rather than line sources.
Further investigation is recommended using data from full-sized, prototype
trenches.
Method of Testing
The accuracy of the line-source method was tested by checking the accuracy
with which equations (1) and (8) could be used to predict exfiltration for the test
trenches.
Exfiltration rates were computed for the test trenches, using the experimental
conditions of tests 1 through 7. The average K value of 2.4 x 10⁻⁴ ft/sec obtained
using the Thiem's equation was used as the hydraulic conductivity in equations (9)
and (12). QD was then obtained from equation (8). Computed and measured
exfiltration rates are presented for comparison in Table 6.
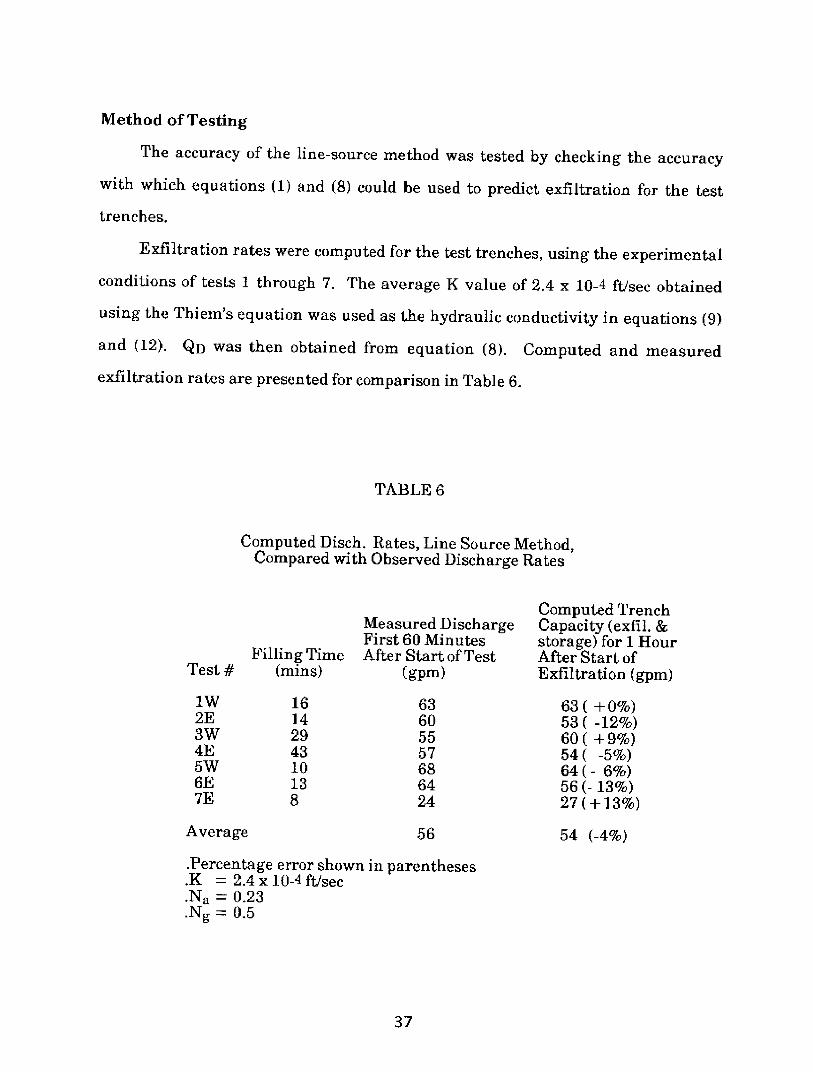
TABLE 6
Computed Disch. Rates, Line Source Method,Compared with Observed Discharge Rates
Measured DischargeFirst 60 Minutes
Filling Time After Start of TestTest # (mins) (gpm)
1W 16 632E 14 603W 29 554E 43 575W 10 686E 13 647E 8 24
Average 56
.Percentage error shown in parentheses.K = 2.4 x 10⁻⁴ ft/sec.Na = 0.23.Ng = 0.5
Computed TrenchCapacity (exfil. &storage) for 1 HourAfter Start ofExfiltration (gpm)
63 ( + 0%)53 ( -12%)60 ( +9%)54( -5%)64(- 6%)56 (- 13%)27 ( + 13%)
54 (-4%)
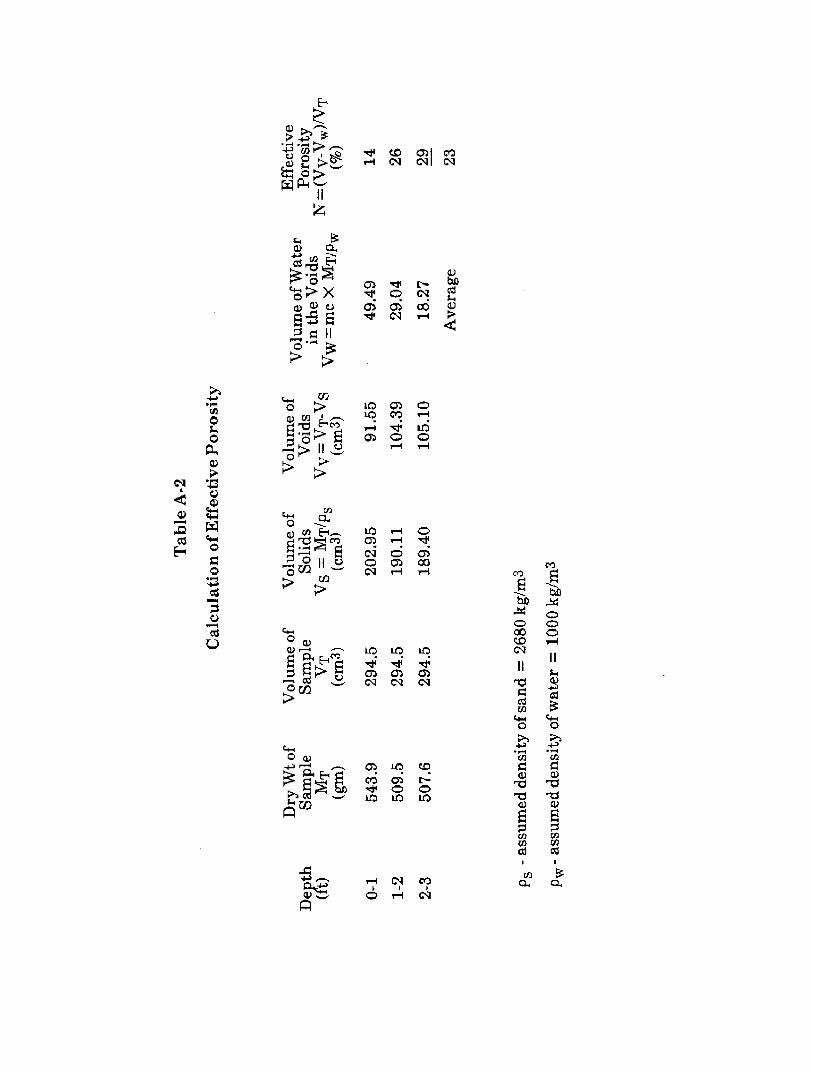
An aquifer effective porosity of 0.23 was used. (See Appendix A.) The effective
depth of aquifer, D, was assumed equal to 12', i.e., twice the height the trench. It was
assumed that exfiltration under full design head started after the trench was half
full.
The results given in Table 6 show that, the line-source method estimated
discharge rates within 13% of the observed rates. The variation in accuracy can be
attributed to experimental variations between tests.
The line-source method gives fairly accurate estimates of trench exfiltration
rates and could be an acceptable alternative to the Volume IV procedure.
Application of the line source method is very similar to the Volume IV method
(Design example given in Appendix B) and changing from one procedure to the next
should not present any problems.
There are a number of potential drawbacks to the line-source method which
should be pointed out. Values of effective porosity of aquifer, Na, effective aquifer
depth, D, and radius of influence of the percolation test borehole, re, must be
determined in order to use the line-source method. Field determination of aquifer
effective porosity would lead to additional costs to the developer but this is not
expected to be significant. An alternative would be to use typical values of Na for
ranges of soil types or particle size distributions (if known).
The application of a typical radius of influence, re, (determined from one
percolation test) to all percolation tests performed on the site is an approximation
which introduces some uncertainty in the computed hydraulic conductivity, K.
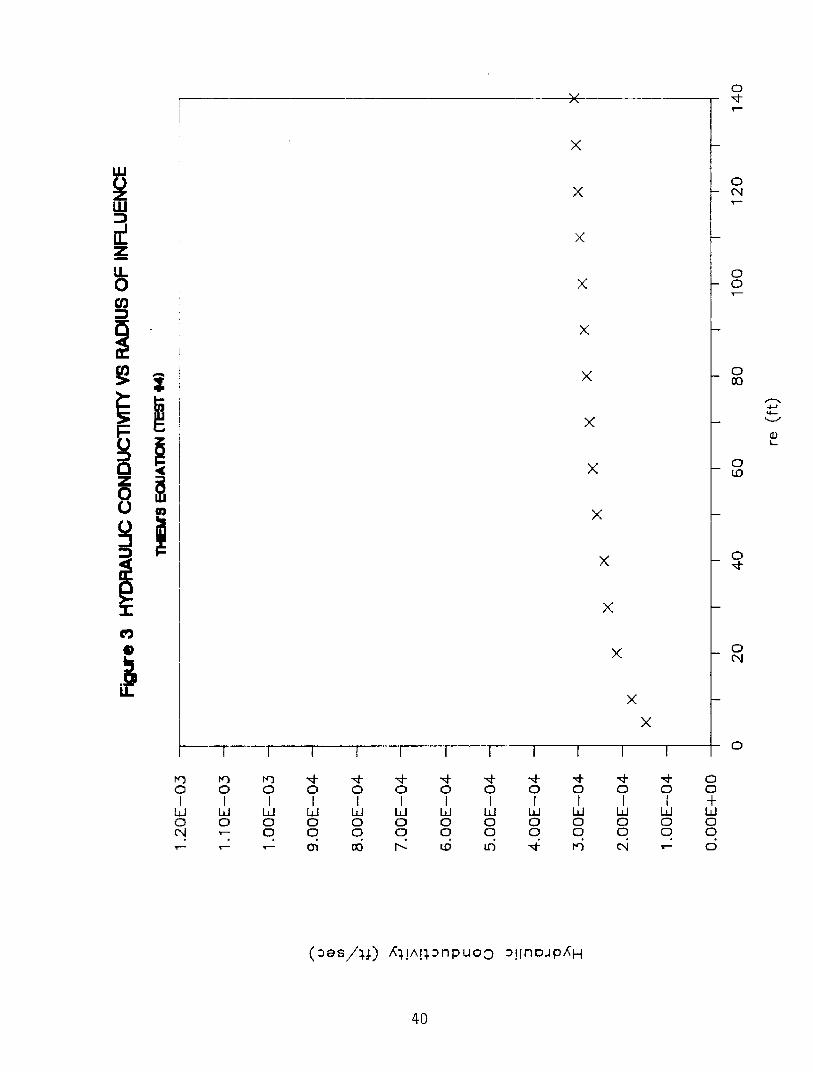
Figure 15 shows a plot of K vs. re for percolation test 6. (This plot is typical of all the
percolation tests which were performed.) The values of K increase as re increases.
When re is greater than 20', K does not appear to be very sensitive to the changes in
re. Errors in K due to uncertainties in the value of re are therefore not critical.
The effective aquifer depth, D, is the depth of aquifer below the initial water
table which is affected by the exfiltration trench in one hour. This is usually
unknown and D was used as a calibration factor in our tests. The closest agreement
between observed and computed trench capacities was obtained when D was set
equal to 12', twice the height of the trench. There is no theoretical justification for
this and further investigation of this aspect of the line-source method is
recommended.
tjF
I
hB
I I I 1 I I I I I I I
o O 0 0 0 0 0 0 0 0 0 0I i I I I I
o o 0 0 0 0 0 0 0 0 0 0
(nes/J ) f j!AIplnpuo3 3 !lnopAH
0
0
O- N
O-o- 0
O
00
O
0
'
O
SOURCES OF ERROR
Discharge rates were obtained by recording the change of flow meter reading
over a given time. This method is subject to personal error especially during times of
large flow.
In general, the equations which were used to estimate exfiltration rates apply
to trenches which are much longer than they are wide. These equations were applied
to test trenches which are almost as wide (6') as they are long (10'). The shape of the
trench is expected to influence the hydraulic gradients around the trench which will
in turn impact the exfiltration rates. It would be instructive to check the current and
proposed design formulae using data from a full scale exfiltration trench.
CONCLUSIONS AND RECOMMENDATIONS
Comparison between computed and measured exfiltration rates showed that
the Volume IV Method substantially overestimates exfiltration trench capacities.
Thus, shorter trenches than actually required to meet retention criteria are being
designed and constructed using this method.
Examination of the derivation of the KIV formula and the application of Kiv to
the trench design formula indicates that the flow through a unit area of the trench
wall is assumed to be equal to the flow through a unit area of the percolation
borehole wall under the same head condition, without regard for the effects of
hydraulic gradients or flow geometries. Accordingly, in cases where the gradient
becomes important to the exfiltration rate, the formula will over-estimate discharge
capacity.
An alternate design procedure, the line-source method, was examined. Using
this method, exfiltration trench capacities were predicted to within 13% of measured
trench capacities. This represents a significant improvement over the Volume IV
method, which over estimates trench capacities by 32 to 158%. In addition, this
method may be extended to predict the impact of exfiltration on groundwater
elevations (mounding) which can be very useful in determining the most efficient
layout for trenches. Although some aspects of this procedure may warrant further
investigation, it is recommended that the line-source method be adopted for future
exfiltration trench designs.
REFERENCES
1. Bouwer, Herman.1978. Groundwater Hydrology. Mc Graw Hill..
2. Cedergren, Harry R. 1977. Seepage, Drainage and Flow Nets. John Wiley and
Sons.
3. Dachler, R. 1936. Grundwasserstromung (Flow of Groundwater). Julius
Springer, Wien.
4. Glover, R. E. 1966. Groundwater Movement. Engineering Monograph No.
31, U.S. Department of the Interior, Bureau of Reclamation.
5. Glover, Robert E. 1974. Transient Groundwater Hydraulics. Department of
Civil Engineering, Colorado State University.
6. Harr, M.E. 1962. Groundwater and Seepage. Mc Graw Hill.
7. Hvorslev, M. Juul. 1951. Time Lag and Soil Permeability in Ground Water
Observations. Bulletin No.36, U.S. Army Corps of Engineers, Waterways
Experiment Station, Vicksburg, Mississippi.
8. Olson, R.E. and Daniel, D.E. 1981. Measurement of the Hydraulic
Conductivity of Fine Grained Soils. ASTM STP 746. American Society for
Testing and Materials, pp. 18-64.
9. Sutton, B.H.C. 1975. Solutions of Problems in Soil Mechanics. Pitman
Publishing.
10. Todd, David Keith. 1980. Groundwater Hydrology. John Wiley and Sons.
APPENDIX A
Field Measurement of Effective Porosity
Effective porosity, n, is defined as the ratio of the total volume of fillable voids
in a soil sample to the total volume of the sample. In terms of the soil phase diagram
in Figure A-1,
N = VA/VT
Effective porosity was computed using field measurements of
1. the wet weight (Mw) of an undisturbed soil sample of
known volume
2. the moisture content of the soil (mc)
Undisturbed samples were obtained by hammering an open ended metal sleeve of
known weight into the soil until the sleeve was completely filled with soil. The soil
filled sleeve was weighed.
Mw = Ms - weight of empty sleeve
where, Ms is the weight of the soil and sleeve together.
The moisture content of the soil (mc) was measured. Mw and me were then used
to compute the aquifer effective porosity, N, as shown in Tables A-1 and A-2.
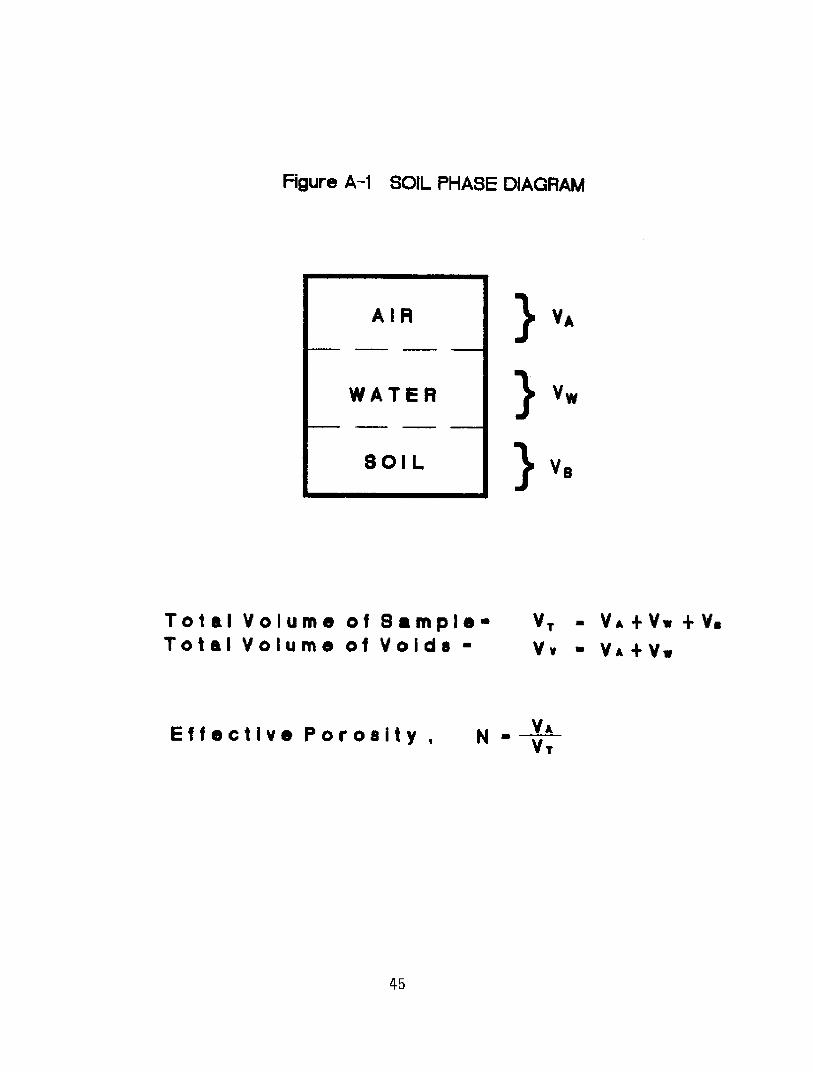
Figure A-1 SOIL PHASE DIAGRAM
}}}
VA
Vw
Vs
Total Volume of Sample-Total Volume of Voids -
Effective Porosity , N
VT - Va+Vw +V,VV, V + Vw
Vr
AIR
WATER
SOIL
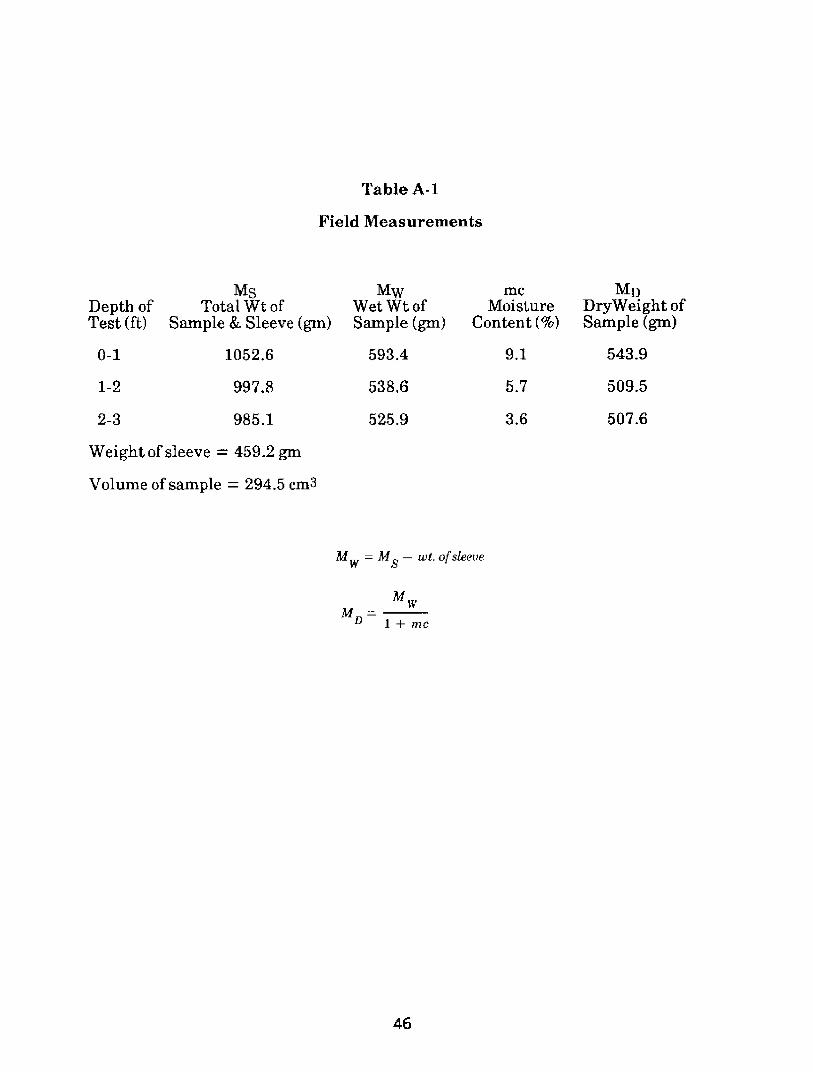
Table A-1
Field Measurements
MsDepth of Total Wt ofTest (ft) Sample & Sleeve (gm)
0-1 1052.6
1-2 997.8
2-3 985.1
Weight of sleeve = 459.2 gm
Volume of sample = 294.5 cm 3
MwWet Wt ofSample (gm)
593.4
538.6
525.9
mcMoisture
Content (%)
9.1
5.7
3.6
MDDryWeight ofSample (gm)
543.9
509.5
507.6
MW = MS - wt. of sleeve
MwMD
1+ mc
F
O-q C11 01
W 1i
as CL,
d
14, cq
4.0
G O
0
GV a.,U
W N )
m 00d O U} i N cr)
Uo 00 °c
Qj °4 icy Lo Lo
cd rn rn rn II0 CA
Cdm 3
0 0
0) 10 Cfl . .
Itj
U)
4J r--l C-1 co
v o , GVA
APPENDIX B
Design Example
The line source trench design equation may be simplified to the following
equation for a one hour design period if an effective aquifer depth equal to twice the
trench height is assumed, and if the effective porosity of the trench is set equal to 0.5.
1.01 V - 0.084 D W/(KHN )
0.084D V(KHN ) + 1.39 x 10 - 4 WDul a. ii
where L
V
Du
K
H
Na
W
length of trench (ft)
design trench capacity (acre-inches)
unsaturated depth of trench (ft)
hydraulic conductivity (ft/sec)
height of trench (ft)
effective porosity of aquifer
width (ft)
Design Example
An exfiltration system is to be designed for an 8 acre shopping complex with 7.5
acres impervious. Percolation tests indicate a hydraulic conductivity of 2.4 X 10⁻⁴
ft/sec. Soil tests indicate an effective porosity of 0.23. Average ground elevation is
14.0' NGVD. Mean wet season water table elevation is 9.0' NGVD.
Field Test Results
Na = 0.23
K = 2.4 x 10⁻⁴
SFWMD volume retention criterion specifies a design runoff of 2.5" times the
percentage of imperviousness; i.e.,
7.5R = 2.5 X -- =2.34
8.0
Total design volume = R X area of site (acres)
= 2.34 X 8.0 = 18.75 acre-inches
Assume
Trench height H = 6'
Trench width W = 10'
Du = 4'
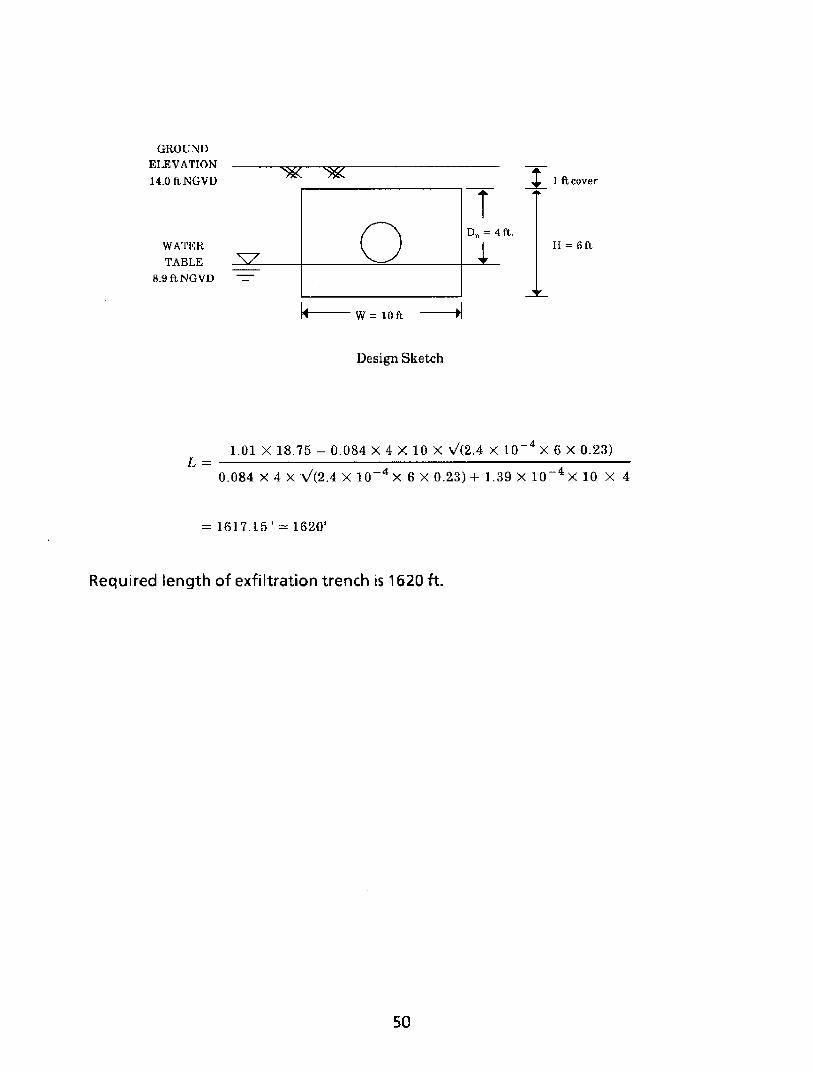
1 ft cover
T= 4D~ = 4 ft.
1 II = 6ft
t- W= loft
Design Sketch
1.01 X 18.75 - 0.084 x 4 x 10 x v(2.4 x 10 - 4 X 6 X 0.23)
0.084 4 x (2.4 X 10 - 4 x 6 X 0.23)+ 1.39 X 10 - 4 X 10 x 4
=1617.15' = 1620'
Required length of exfiltration trench is 1620 ft.
GROUND
ELEVATION
14.0 ftNGVD
WATER
TABLE
8.9ftNGVD
N---
_I_ _I
Y I TL