Embed Size (px)
Citation preview
Surface Water Resources Assessment Report Wakal River Basin, Rajasthan, India
Integrated Management of Coastal and Freshwater Systems Program

Surface Water Resources Assessment Report Wakal River Basin, Rajasthan, India
Funding for the Surface Water Resources Assessment Report for the Wakal River Basin, Rajasthan, India was
provided by the people of the United States of America through the U.S. Agency for International Development
(USAID), as a component of the Integrated Management of Coastal and Freshwater Systems Leader with Associates
(LWA) Agreement No. EPP-A-00-04-00015-00. The views and opinions of authors expressed herein do not
necessarily state or reflect those of the United States Agency for International Development of the United States
Government or Florida International University.
Copyright © Global Water for Sustainability Program – Florida International University
This publication may be reproduced in whole or in part and in any form for educational or non-profit
purposes without special permission from the copyright holder, provided acknowledgement of the source is
made. No use of the publication may be made for resale or for any commercial purposes whatsoever without the
prior permission in writing from the Florida International University - Global Water for Sustainability Program.
Any inquiries can be addressed to the same at the following address:
Global Water for Sustainability Program
Florida International University
Biscayne Bay Campus 3000 NE 151 St. ACI-267
North Miami, FL 33181 USA
Email: [email protected]
Website: www.globalwaters.net
For bibliographic purposes, this document should be cited as:
GLOWS-FIU. 2008. Surface Water Resources Assessment Report: Wakal River Basin, India. 2008. Global Water
Sustainability Program, Florida International University. 36p.
ISBN:
Cover Photograph: Tributary of Wakal River, Rajasthan, India. (John M. Steifel).
i
Table of Contents 1 INTRODUCTION...................................................................................................................... 1
1.1 Present Scenario ............................................................................................................ 2
1.2 Need of the study .......................................................................................................... 4
2 OBJECTIVES OF THE STUDY .................................................................................................... 5
3 SITUATIONAL ANALYSIS ......................................................................................................... 6
3.1 Climate ........................................................................................................................... 6
3.1.1 Temperature .......................................................................................................... 6
3.1.2 Humidity ................................................................................................................ 6
3.1.3 Cloudiness .............................................................................................................. 6
3.1.4 Winds ..................................................................................................................... 6
3.1.5 Rainfall ................................................................................................................... 7
3.2 Topography ...................................................................................................................... 11
3.5 Status of soil and water conservation measures .............................................................. 14
4 SURFACE RUNOFF ................................................................................................................ 14
5 SURFACE WATER STORAGE .................................................................................................. 17
5.1 Location of water storage reservoirs ............................................................................... 17
5.2 Description of different rainwater harvesting structures ................................................. 17
5.3 Design parameter of water harvesting structures ........................................................... 19
5.4 Management aspect and water withdrawals ................................................................... 20
6 SURFACE WATER QUALITY ................................................................................................... 20
6.1 Collection of Water Samples ............................................................................................ 20
6.2 Water Quality Parameters ............................................................................................... 21
7 STATUS OF SOIL EROSION .................................................................................................... 33
8 CONCLUSIONS ...................................................................................................................... 35
9 RECOMMENDATIONS .......................................................................................................... 36
1
1 INTRODUCTION
The rivers of India are classified as Himalayan, peninsular, coastal, and
inland-drainage basin rivers. Himalayan rivers are snow fed and maintain a high to
medium rate of flow throughout the year. The heavy annual average rainfall levels in
the Himalayan catchment areas further add to their rates of flow. During the monsoon
months of June to September, the catchment areas are prone to flooding.
India is endowed with a rich and vast diversity of natural resources, water
being one of them. Its development and management plays a vital role in agriculture
production. Integrated water management is vital for poverty reduction,
environmental sustenance and sustainable economic development. National Water
Policy (2002) envisages that the water resources of the country should be developed
and managed in an integrated manner.
India is a land of rivers. There are 14 major, 44 medium and 55 minor river
basins in the country. Major rivers have a catchment area of 20,000 square kilometres
or above, medium between 2,000 and 20,000 square kilometres and minor systems
have a catchment area of 2,000 square kilometres or less. But, in some dry areas of
Rajasthan, every inch of land contributes water through runoff to these rivers.
The major river basins constitute about 83-84% of the total drainage area.
This, along with the medium river basins, accounts for 91% of the country's total
drainage. Though only the last 4,000 kilometres of the Brahmaputra pass through
Indian territory, the river carries 31% of all the water carried by Indian rivers. By
contrast, the Ganges carries about 30%. In all, a total of 1,645 cubic kilometres of
water flows through our river system every year. Given this extensive river system,
our country's planners have been justified in storing the water for hydroelectric power
generation as well as irrigation. Consequently, India ranks amongst the most
important dam-building nations in the world. The Register of Large Dams in India
lists 3,600 completed dams, and between 300-400 in varying stages of construction.
Rajasthan is the most dry state of the country and surface water resources form
only 1.16 percent of the countries resources. The groundwater resources of the state
are most precious and it contributes only 2.9 percent of the total groundwater
resources of the country. In Rajasthan, 90 per cent of the population is dependent on
groundwater for drinking and 60 per cent for irrigation purposes. The groundwater
2
table is going down at the rate of approximately one meter per year due to scanty
rainfall and the situation has reached alarming proportions in some part of the state.
The per capita water availability is only 900 m3
and it is expected that by the year
2045 it will reduced upto 436 m3
only.
1.1 Present Scenario
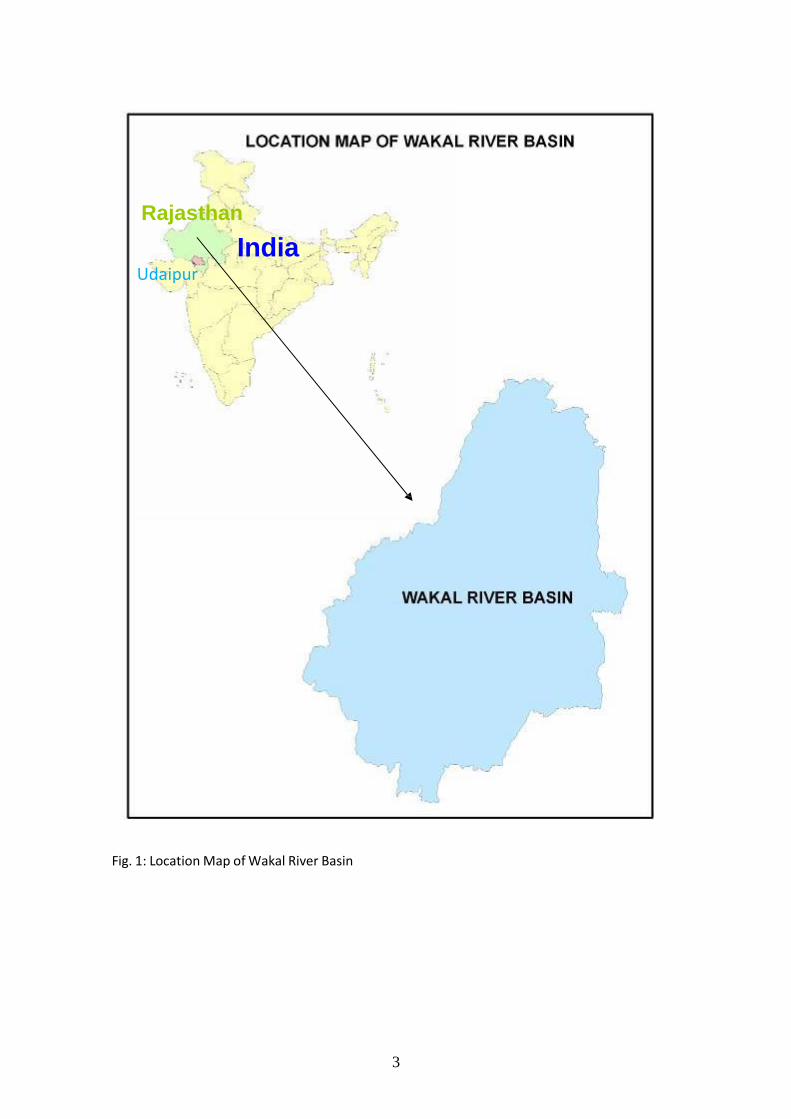
Wakal River originates northwest of Udaipur near Sran village. The river
flows in a generally south direction up to Manpur village in Udaipur district, where it
turns northeast and after a distance of about 90km leaves Rajasthan near the Gaupipli
village and joins Sabarmati river near Eitarwar village in Gujrat. The Wakal River
Basin lies on the Western part of India between latitudes 24°8' 49.41" N to 24°46’
34.65" N and longitudes of 73°6' 23.41" E to 73°35' 54.18" E and spread across the
state of Rajasthan and Gujrat. Total catchment area of Wakal River Basin is 1914.32
km2
in which 98 per cent of the total area falls in the Udaipur district of Rajasthan.
The main tributaries of Wakal are Manshi and Parvi rivers. The total length of the
basin is 71.22 km whereas the maximum width is 41.01 km. The location map of the
basin is shown in Fig. 1.
The Wakal River Basin lies in Rajasthan state of India’s most water-
stressed regions. For example, the principle city of Udaipur receives 630 mm of
average rainfall in a year, and 95% of precipitation occurs during monsoon season
between the months of June to September. This extreme seasonal to drought and flood
conditions; long-term records suggest that region has experienced 41 drought
conditions during past 50 years. Because most rivers or streams in the region are
ephemeral, groundwater provides the main source of supply for human communities.
Looking to the magnitude of the problem of land degradation and water
scarcity in the Wakal River Basin, World Vision India and GLOWS, U.S.A. has taken
initiative to conduct water resources study of the basin which will provide a guide line
to mitigate the drought and also to enhance the crop yield of the area through
sustainable interventions of surface water management. They have identified various
institutions to address various problems of the region including College of
Technology and Engineering, MPUAT, Udaipur.
3
Rajasthan
India Udaipur
Fig. 1: Location Map of Wakal River Basin
4
1.2 Need of the study
Rivers of the inland system, centered in Rajasthan state, are few and
frequently disappear in years of scant rainfall. The problems that river basin
institutions in the developed world successfully address-such as pollution, sediment
buildup in rivers and the degradation of wetlands-are not the top priorities for Indian
policy makers and people. The items that do top Indian agendas-providing access to
water for drinking and growing food, eradicating poverty, and stopping groundwater
overexploitation-are either unresolved in the developed world or have become
irrelevant due to their economic development. At Independence, only 6% of rural
India had access to safe drinking water. This figure has gone up to 82%. The water
table is rapidly falling with unregulated over-exploitation of groundwater. By 2025,
water scarcity in India will be acute. Big dams, mega river-linking projects or
privatized water distribution may not help to solve water scarcity problem.
With an average annual rainfall of 1,170 mm, India is one of the wettest
countries in the world. At one extreme are areas like Cherrapunji, in the north-east,
which is drenched each year with 11,000 mm of rainfall, and at the other extreme are
places like Jaisalmer, in the west, which receives barely 200 mm of rain. Though the
average rainfall is adequate, nearly three-quarters of the rain pours down in less than
120 days, from June to September. The country gets about 420 million hectare-meters
(mha-m) of precipitation annually, of which 20 mha-m is contributed by rivers
flowing in from neighboring countries. Net evapo-transpiration losses are nearly 200
mham. About 135 mha-m is available on the surface and the remaining recharges
groundwater.
Water stress is becoming acute in both urban and rural situations. Not only the
quantity but also the quality of water supplied or available is being questioned. At one
extreme, water is being wasted in urban areas and by industries; at the other, the rural
poor lack access to safe water. According to experts, the usable water resources in
several river basins will eventually be exhausted, most surface water will be polluted,
and environmental deprivation will be universal. Water scarcity has led to the
emergence of the bottled water industry worth over Rs 1,000 Crores.
Water scarcity presents an immense threat to the lives and livelihood of
communities in the Wakal River of southern Rajasthan. Subsistence frequently
5
experience crop failure and livestock kills as a result of insufficient water supply for
agriculture. Workers of the region have to walk several kilometers daily just to obtain
water for household uses, leaving them little time to their income-generating
activities. In sufficient control over groundwater pumping has resulted in an
inequitable access to water as well as rapid depletion of existing supplies. Problems
were water quality, are also common parts of the region. Low annual rainfall in the
Wakal Basin of southern Rajasthan has resulted in scarce surface water and declining
groundwater levels. People rely on groundwater for the bulk of their domestic water
supplies. Groundwater quality problems, such as elevated concentrations of fluoride
and high salinity in the water supplies, also occur in the area. Baseline surveys and
research to determine the quantity and quality, as well as the sustainability of water
resources in the program area are therefore, crucial to water resources exploitation
and management in the area.
2 OBJECTIVES OF THE STUDY
• Assessment of surface water resources of Wakal river basin.
• To study the design details and description of different rainwater harvesting
structures used in the basin.
• To analyze rainfall records and demarcate the location of gauging station.
• To study the water quality of surface water resources.
• To study erosion status of Wakal river basin.
6
3 SITUATIONAL ANALYSIS
3.1 Climate
The Indian Meteorological Department has divided Rajasthan into two
meteorological sub divisions i.e. West Rajasthan and East Rajasthan, with the Wakal
basin falling within the East Rajasthan sub division. There is no any existing
meteorological station in Wakal basin. The nearest station being Udaipur located
outside the basin.
3.1.1 Temperature
The period from March to June is marked by a continuous increase in
temperatures, May is generally the hottest month of the year with a mean daily
maximum and minimum temperature of 39.5°C and 27.3°C respectively. The summer
is milder than in the desert regions. January is the coldest month with daily maximum
and minimum temperature of 22.2°C and 7.3°C respectively.
3.1.2 Humidity
Relative Humidity during the southwest monsoon is generally about 70% or
more. During the rest of the year, air is normally dry.
3.1.3 Cloudiness
Skies are generally moderately to heavily clouded during the southwest
monsoon season especially in July and August, being overcast on some days. During
the rest of the year, skies are normally clear to highly clouded.
3.1.4 Winds
Winds are generally light to moderate except in the latter half of summer and
during the southwest monsoon season. In summer winds blows from directions
running from west to south. Mean wind speed is highest in June (8.8 km/hr) and
lowest in November (2.6 km/hr).
7
3.1.5 Rainfall
The area is characterized by sub-humid climate with an average annual rainfall
of 630 mm. Kharif crops are mainly dependent on the rainfall and thereby subjected
to either complete or partial failures in either case of excessive or shortage of rainfall
during monsoon. More than 95% of the rainfall received during monsoon months of
June to September. Uneven and erratic rainfall distributions marked by prolong rain
less days is a common phenomenon is this region.
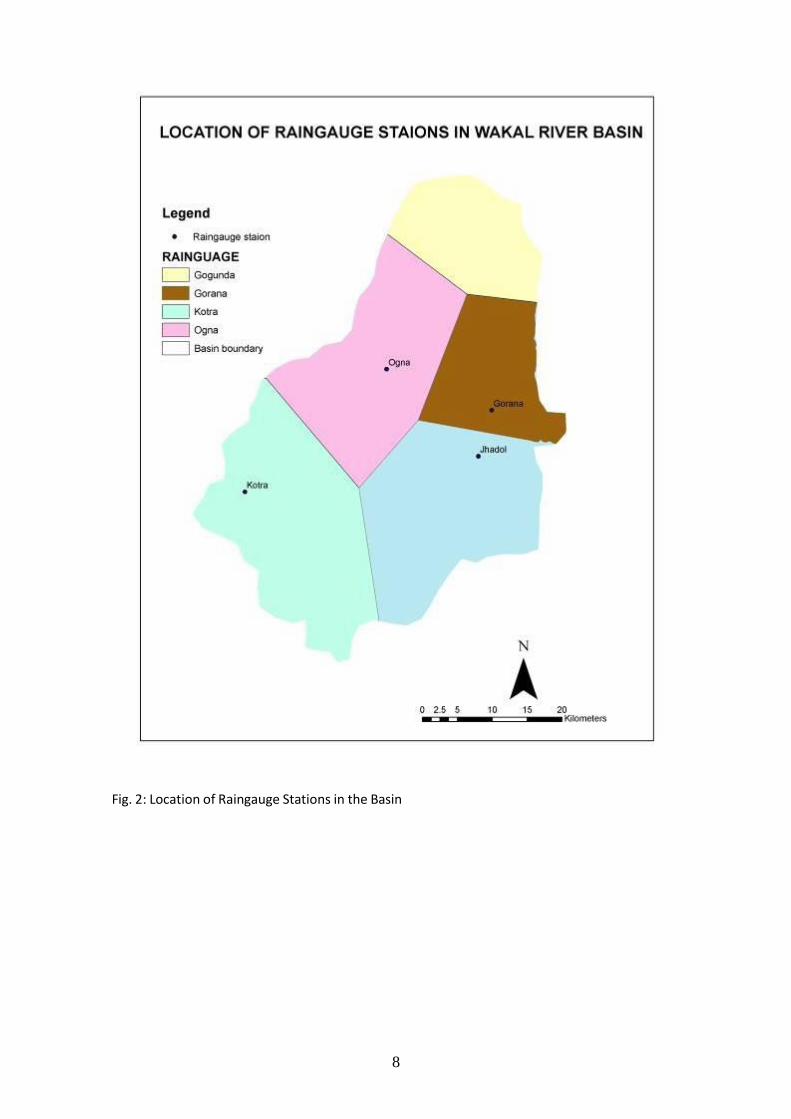
3.1.5.1 Location of raingauge stations
In Wakal River Basin there are five raingauge stations which are located in
Gogunda, Jhadol, Gorana, Kotda and Ogana. On these stations daily rainfall is
measured using non recording type raingauges. The daily rainfall data of last fifteen
years (1992-2006) were collected from these stations. The raingauge station of
Gogunda is situated at outside near the basin boundary. The locations of all the
raingauge stations are shown in Fig. 2.
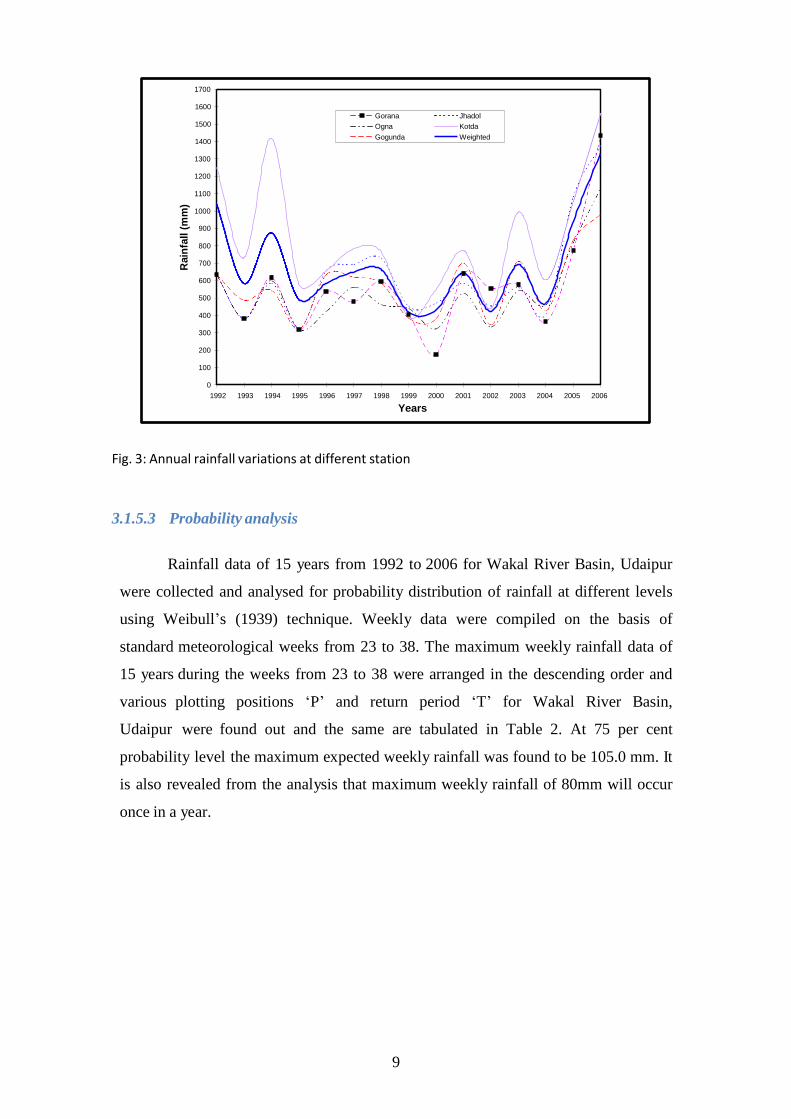
3.1.5.2 Rainfall variation at different station
The annual rainfall variation of various raingauge stations (1992-2006)
presented in the Fig. 3 reveals that Kotda received the highest annual rainfall whereas
Gorana received the lowest annual rainfall in the Wakal Basin. Maximum 1564mm
rainfall was recorded in the Kotda during the year 2006 while minimum rainfall of
175mm was recorded at Gorana during the year 2000. Annual rainfall of different
raingauge stations along with weighted average is shown in Table 1.
8
Fig. 2: Location of Raingauge Stations in the Basin
9
Rain
fall (
mm
)
1700
1600
1500
1400
Gorana Jhadol
Ogna Kotda
Gogunda Weighted
1300
1200
1100
1000
900
800
700
600
500
400
300
200
100
0
1992 1993 1994 1995 1996 1997 1998 1999 2000 2001 2002 2003 2004 2005 2006
Years
Fig. 3: Annual rainfall variations at different station
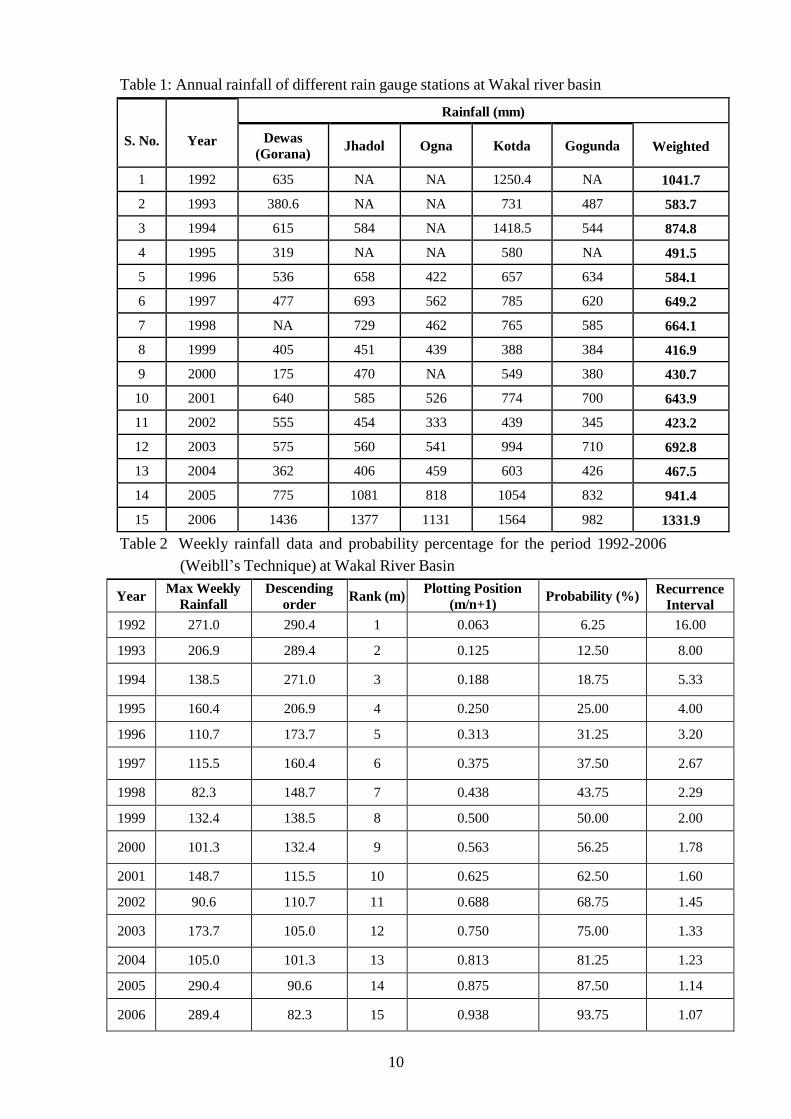
3.1.5.3 Probability analysis
Rainfall data of 15 years from 1992 to 2006 for Wakal River Basin, Udaipur
were collected and analysed for probability distribution of rainfall at different levels
using Weibull’s (1939) technique. Weekly data were compiled on the basis of
standard meteorological weeks from 23 to 38. The maximum weekly rainfall data of
15 years during the weeks from 23 to 38 were arranged in the descending order and
various plotting positions ‘P’ and return period ‘T’ for Wakal River Basin,
Udaipur were found out and the same are tabulated in Table 2. At 75 per cent
probability level the maximum expected weekly rainfall was found to be 105.0 mm. It
is also revealed from the analysis that maximum weekly rainfall of 80mm will occur
once in a year.
10
Table 1: Annual rainfall of different rain gauge stations at Wakal river basin
S. No.
Year
Rainfall (mm)
Dewas
(Gorana)
Jhadol
Ogna
Kotda
Gogunda
Weighted
1 1992 635 NA NA 1250.4 NA 1041.7
2 1993 380.6 NA NA 731 487 583.7
3 1994 615 584 NA 1418.5 544 874.8
4 1995 319 NA NA 580 NA 491.5
5 1996 536 658 422 657 634 584.1
6 1997 477 693 562 785 620 649.2
7 1998 NA 729 462 765 585 664.1
8 1999 405 451 439 388 384 416.9
9 2000 175 470 NA 549 380 430.7
10 2001 640 585 526 774 700 643.9
11 2002 555 454 333 439 345 423.2
12 2003 575 560 541 994 710 692.8
13 2004 362 406 459 603 426 467.5
14 2005 775 1081 818 1054 832 941.4
15 2006 1436 1377 1131 1564 982 1331.9
Table 2 Weekly rainfall data and probability percentage for the period 1992-2006
(Weibll’s Technique) at Wakal River Basin
Year Max Weekly
Rainfall
Descending
order
Rank (m) Plotting Position
(m/n+1)
Probability (%) Recurrence
Interval
1992 271.0 290.4 1 0.063 6.25 16.00
1993 206.9 289.4 2 0.125 12.50 8.00
1994
138.5
271.0
3
0.188
18.75
5.33
1995 160.4 206.9 4 0.250 25.00 4.00
1996 110.7 173.7 5 0.313 31.25 3.20
1997
115.5
160.4
6
0.375
37.50
2.67
1998 82.3 148.7 7 0.438 43.75 2.29
1999 132.4 138.5 8 0.500 50.00 2.00
2000
101.3
132.4
9
0.563
56.25
1.78
2001 148.7 115.5 10 0.625 62.50 1.60
2002 90.6 110.7 11 0.688 68.75 1.45
2003
173.7
105.0
12
0.750
75.00
1.33
2004 105.0 101.3 13 0.813 81.25 1.23
2005 290.4 90.6 14 0.875 87.50 1.14
2006
289.4
82.3
15
0.938
93.75
1.07
11
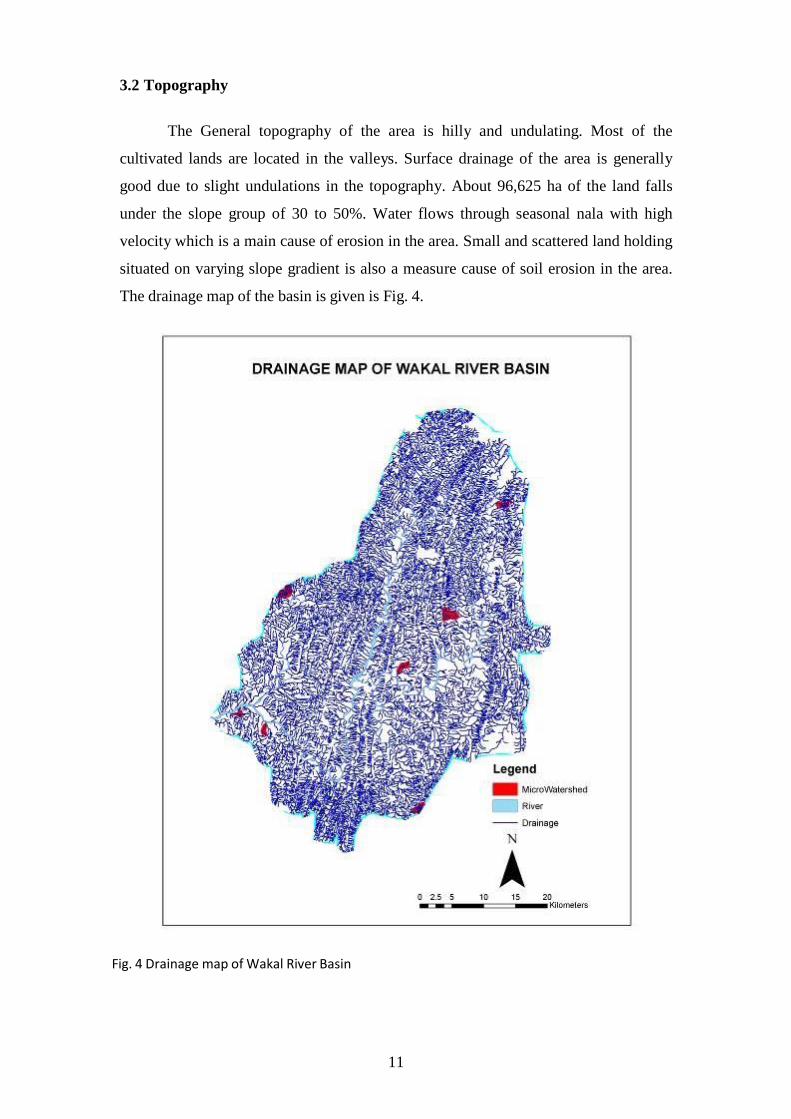
3.2 Topography
The General topography of the area is hilly and undulating. Most of the
cultivated lands are located in the valleys. Surface drainage of the area is generally
good due to slight undulations in the topography. About 96,625 ha of the land falls
under the slope group of 30 to 50%. Water flows through seasonal nala with high
velocity which is a main cause of erosion in the area. Small and scattered land holding
situated on varying slope gradient is also a measure cause of soil erosion in the area.
The drainage map of the basin is given is Fig. 4.
Fig. 4 Drainage map of Wakal River Basin
12
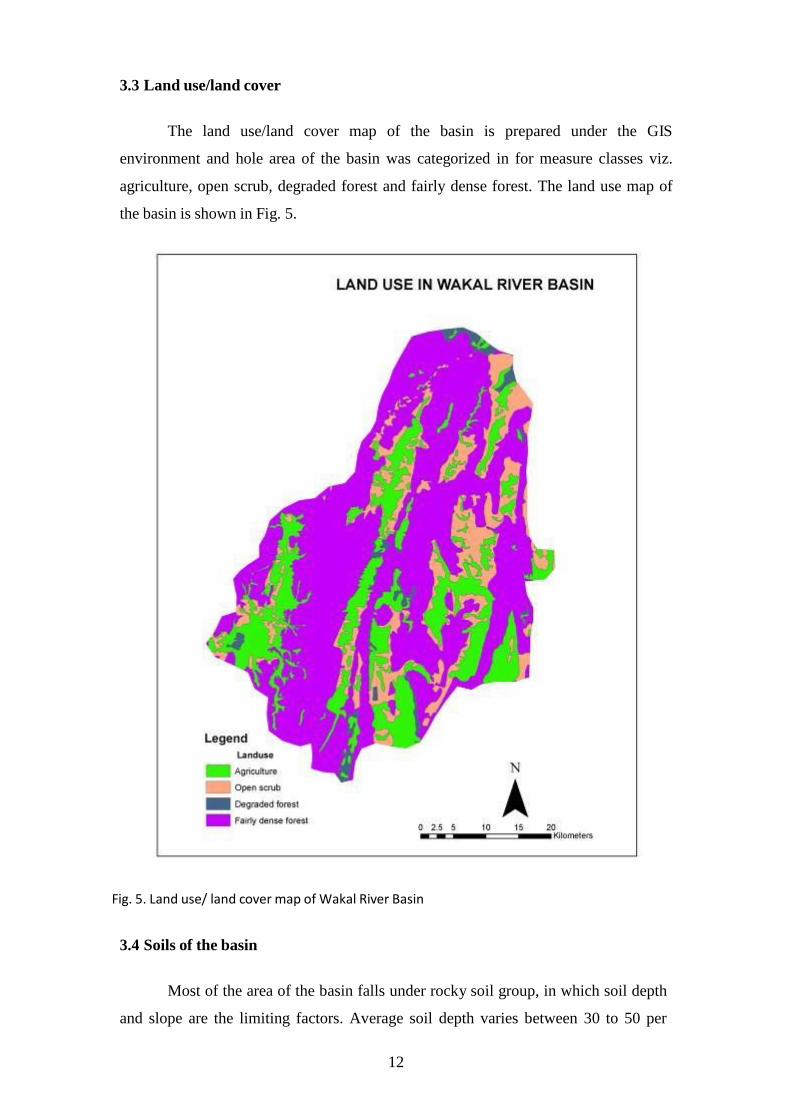
3.3 Land use/land cover
The land use/land cover map of the basin is prepared under the GIS
environment and hole area of the basin was categorized in for measure classes viz.
agriculture, open scrub, degraded forest and fairly dense forest. The land use map of
the basin is shown in Fig. 5.
Fig. 5. Land use/ land cover map of Wakal River Basin
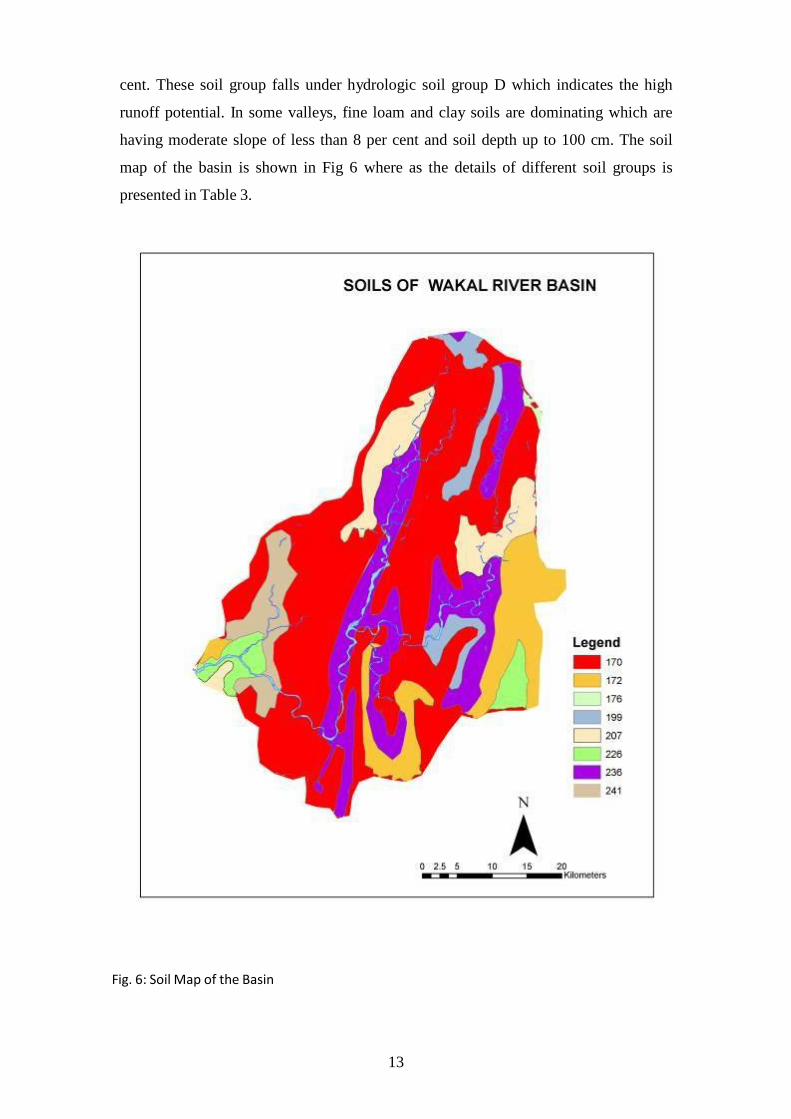
3.4 Soils of the basin
Most of the area of the basin falls under rocky soil group, in which soil depth
and slope are the limiting factors. Average soil depth varies between 30 to 50 per
13
cent. These soil group falls under hydrologic soil group D which indicates the high
runoff potential. In some valleys, fine loam and clay soils are dominating which are
having moderate slope of less than 8 per cent and soil depth up to 100 cm. The soil
map of the basin is shown in Fig 6 where as the details of different soil groups is
presented in Table 3.
Fig. 6: Soil Map of the Basin
14
Table 3: Soil details of the basin
S.No. Soil
Unit
Slope
%
Soil Depth
(cm)
Soil Type Hydrological
Unit
Area
(ha)
1 170 30-50 25-50 LSK - R D 94624.54
2. 172 3-8 50-75 FL - R C 9007.15
3. 176 1-3 >100 LSK C 433.37
4. 199 5-15 50-75 FL B 7193.06
5. 207 8-15 <25 FL - LSK B 6925.23
6. 226 3-12 50-75 FL - CL B 5916.47
7. 236 2-8 50-100 FL A 30894.50
8. 241 3-15 10-100 FL - CL B 13916.83
LSK- Gravelly Skelton, R – Rocky, FL – Fine Loam and CL - Clay
3.5 Status of soil and water conservation measures
Some of the farmers have minimized soil erosion and attempted for in situ
moisture conservation in their arable lands with small earthen/stone bunds, which are
stabilized by naturally occurring grasses. The area needs suitable soil and water
conservation measures both on arable and non arable areas and extensive efforts are
required to be done for extending improved dryland agriculture practices. Non-arable
lands are completely devoid of any kind of in-situ moisture conservation measures.
Very limited treatment measures are done on drainage lines.
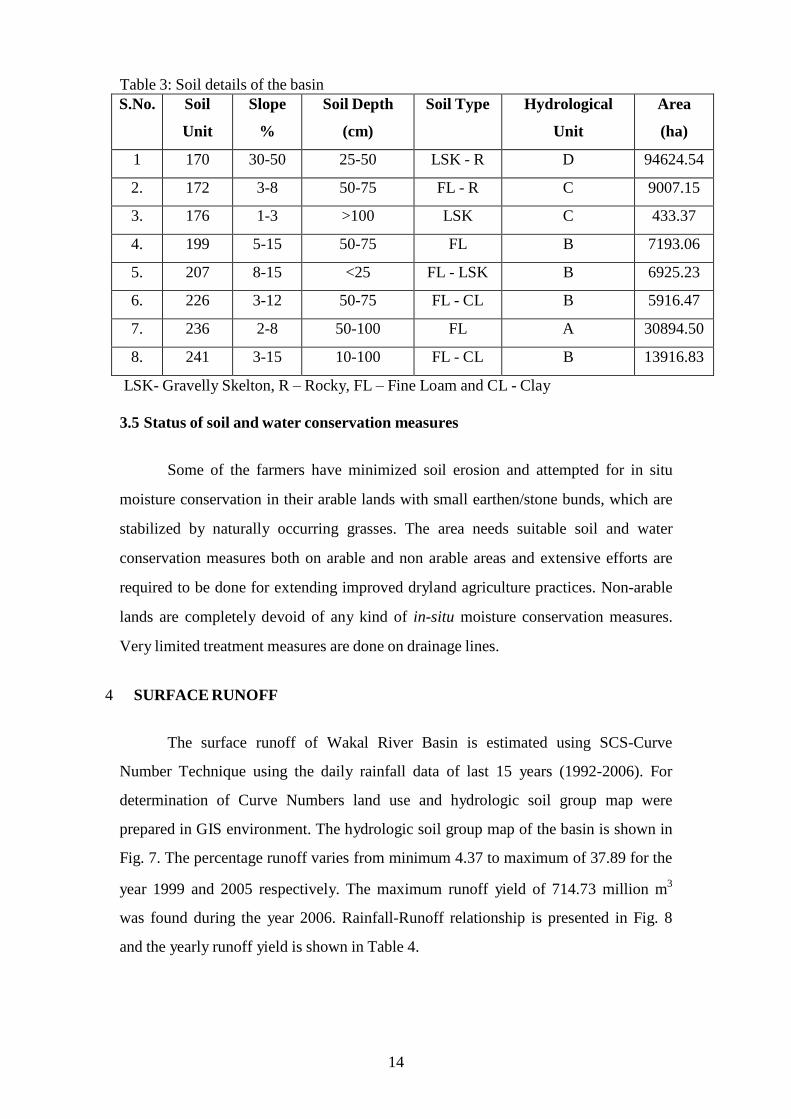
4 SURFACE RUNOFF
The surface runoff of Wakal River Basin is estimated using SCS-Curve
Number Technique using the daily rainfall data of last 15 years (1992-2006). For
determination of Curve Numbers land use and hydrologic soil group map were
prepared in GIS environment. The hydrologic soil group map of the basin is shown in
Fig. 7. The percentage runoff varies from minimum 4.37 to maximum of 37.89 for the
year 1999 and 2005 respectively. The maximum runoff yield of 714.73 million m3
was found during the year 2006. Rainfall-Runoff relationship is presented in Fig. 8
and the yearly runoff yield is shown in Table 4.
15
Fig. 7: Hydrologic Soil Group of the basin
16
S.No.
Year
Rainfall (mm)
Runoff (mm)
% Runoff
Runoff Yield
(Million m3)
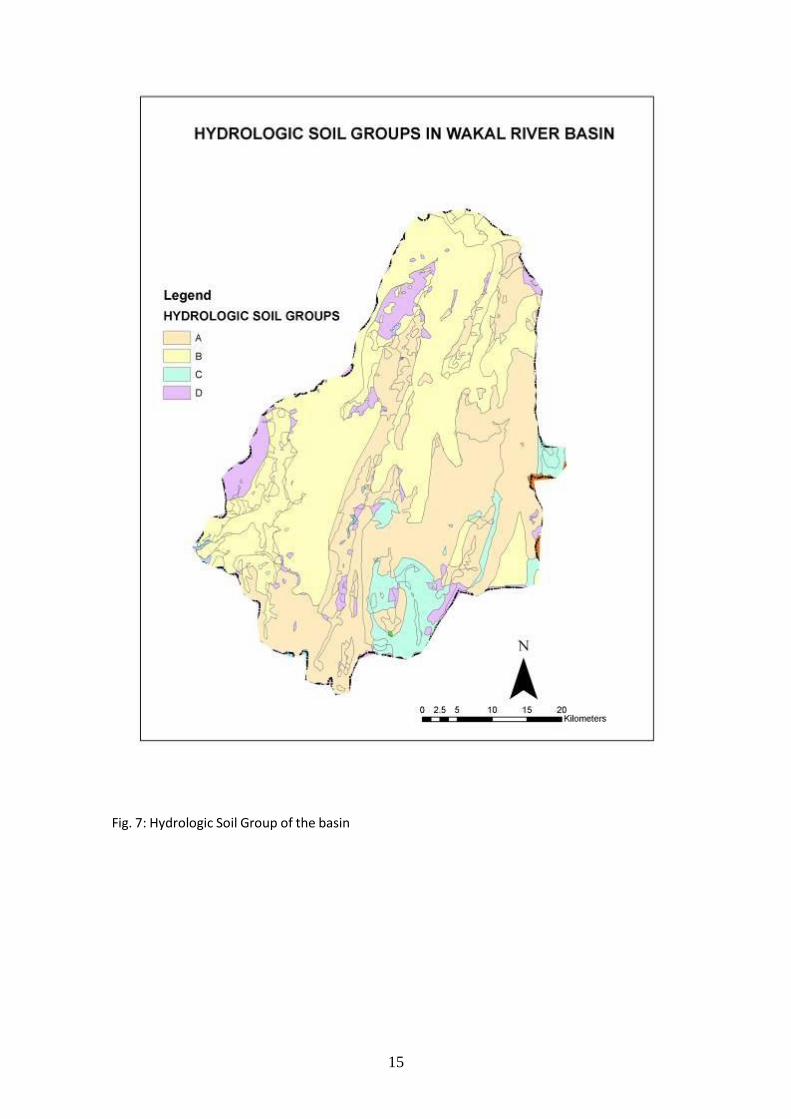
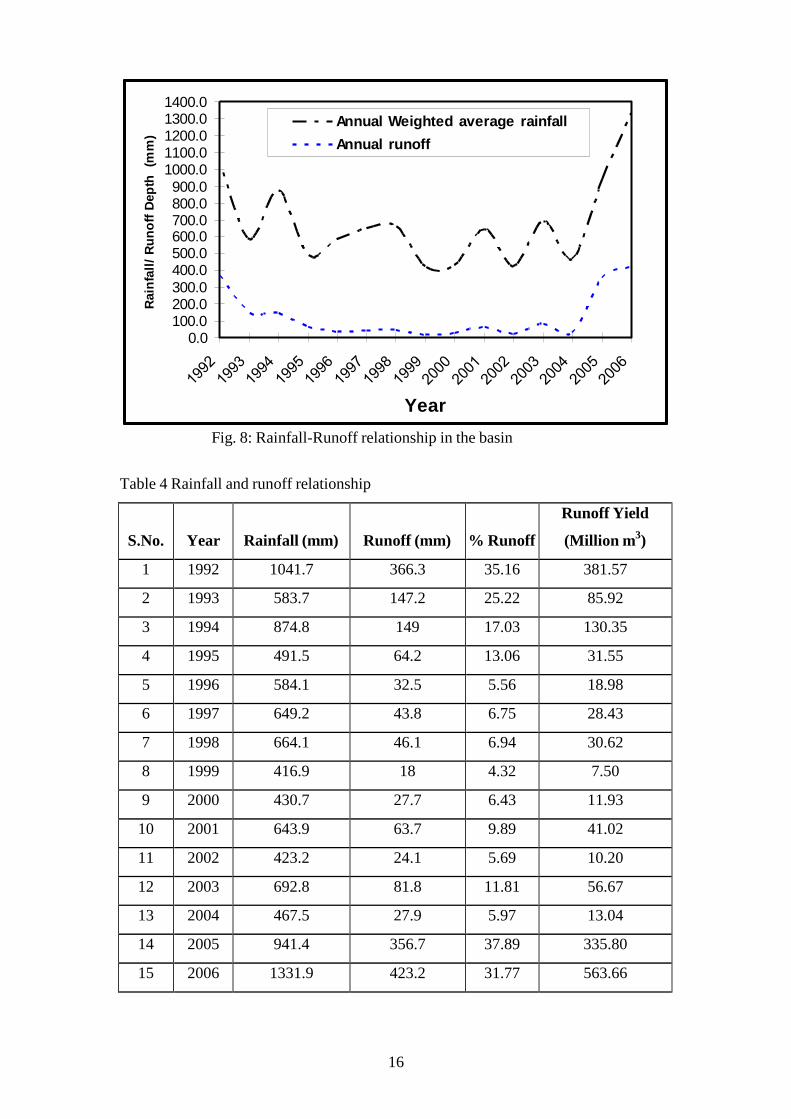
1 1992 1041.7 366.3 35.16 381.57
2 1993 583.7 147.2 25.22 85.92
3 1994 874.8 149 17.03 130.35
4 1995 491.5 64.2 13.06 31.55
5 1996 584.1 32.5 5.56 18.98
6 1997 649.2 43.8 6.75 28.43
7 1998 664.1 46.1 6.94 30.62
8 1999 416.9 18 4.32 7.50
9 2000 430.7 27.7 6.43 11.93
10 2001 643.9 63.7 9.89 41.02
11 2002 423.2 24.1 5.69 10.20
12 2003 692.8 81.8 11.81 56.67
13 2004 467.5 27.9 5.97 13.04
14 2005 941.4 356.7 37.89 335.80
15 2006 1331.9 423.2 31.77 563.66
Ra
infa
ll/
Ru
no
ff D
ep
th
(mm
)
1400.0 1300.0 1200.0 1100.0 1000.0
900.0 800.0 700.0 600.0 500.0 400.0
300.0 200.0 100.0
0.0
Annual Weighted average rainfall
Annual runoff
Year
Fig. 8: Rainfall-Runoff relationship in the basin
Table 4 Rainfall and runoff relationship
17
5 SURFACE WATER STORAGE
To store the surface water potential of the Wakal River Basin various
rainwater harvesting structures has already been constructed by Govt. and Non-Govt.
Organizations. Presently Irrigation Department, Watershed Development Department,
Rural Development Department and NGO’s are constructing low and medium height
earthen dams/anicuts.
5.1 Location of water storage reservoirs
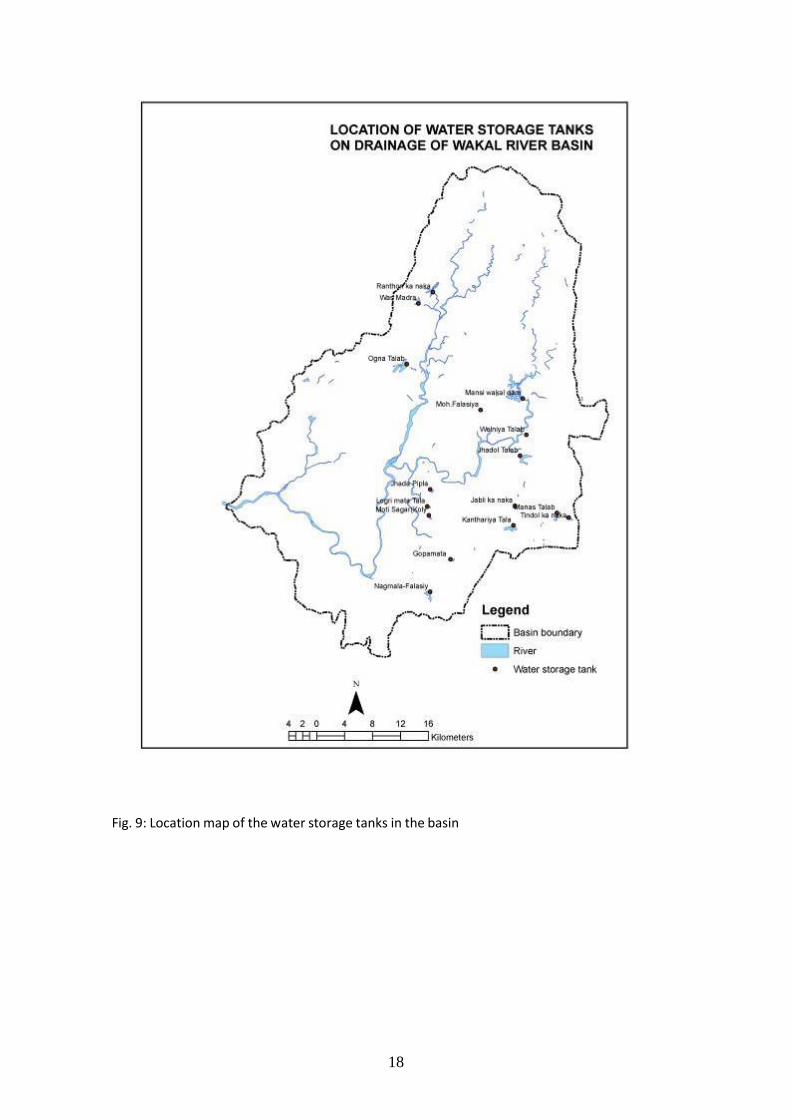
In the Wakal River Basin 17 major rainwater harvesting structures were
constructed by Irrigation Department and Rural Development Department. Mansi
Wakal Dam is the biggest dam constructed in the basin which is having the gross
storage capacity of 863 MCFt. This dam was mainly constructed to fulfill the drinking
water need of the Udaipur City. The location of the different dams is shown in Fig. 9.
The water storage capacity along with ownership of the various dams is given in
Table 5. The longitude and latitude of the water storage reservoirs are taken using
GPS.
5.2 Description of different rainwater harvesting structures
The rainwater harvesting structures constructed in the basin are mostly used
for irrigation, ground water recharging and drinking purposes for human and live
stock. Most of the measure dams in the basin is managed by village panchayat/
irrigation department. Masonry Anicut of one meter to four meter height is vary
popular rainwater harvesting structure that has been constructed in the basin by
various government and non government organizations. Earthen Nadi/ Sunken pond
and low cost dry stone masonry type rainwater harvesting structure are also common
and it is being constructed in the basin by various organizations.
18
Fig. 9: Location map of the water storage tanks in the basin
19
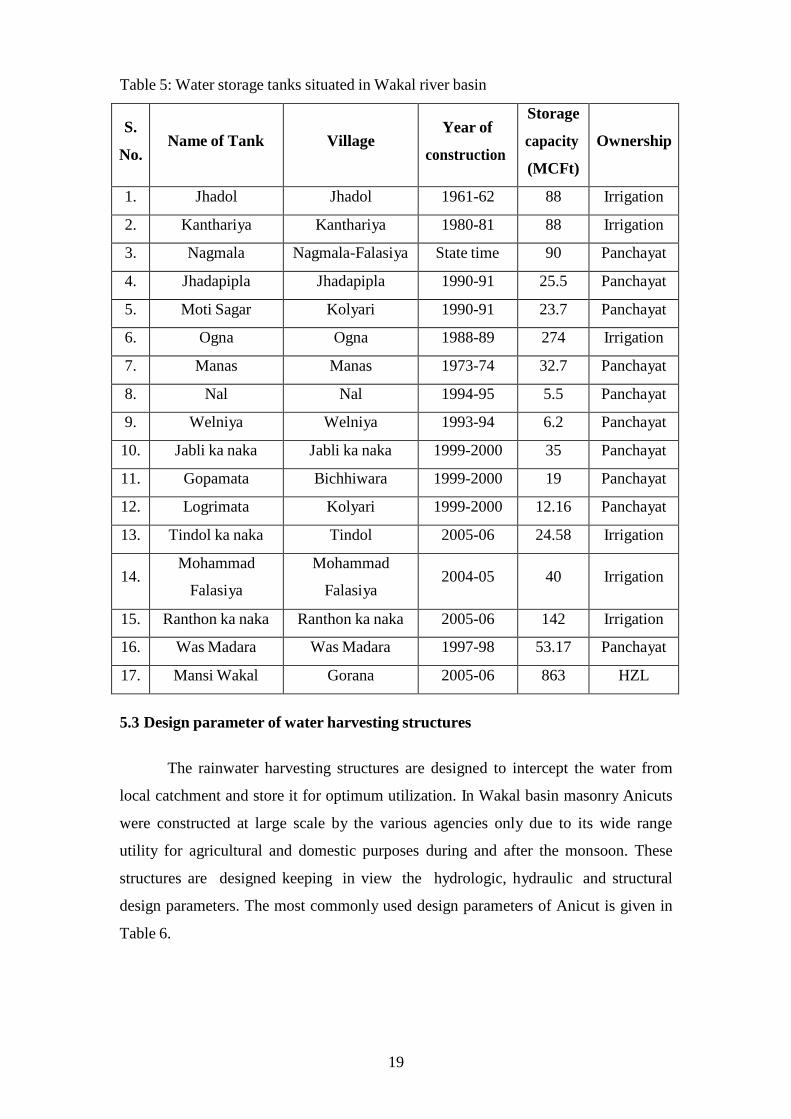
Table 5: Water storage tanks situated in Wakal river basin
S.
No.
Name of Tank
Village
Year of
construction
Storage
capacity
(MCFt)
Ownership
1. Jhadol Jhadol 1961-62 88 Irrigation
2. Kanthariya Kanthariya 1980-81 88 Irrigation
3. Nagmala Nagmala-Falasiya State time 90 Panchayat
4. Jhadapipla Jhadapipla 1990-91 25.5 Panchayat
5. Moti Sagar Kolyari 1990-91 23.7 Panchayat
6. Ogna Ogna 1988-89 274 Irrigation
7. Manas Manas 1973-74 32.7 Panchayat
8. Nal Nal 1994-95 5.5 Panchayat
9. Welniya Welniya 1993-94 6.2 Panchayat
10. Jabli ka naka Jabli ka naka 1999-2000 35 Panchayat
11. Gopamata Bichhiwara 1999-2000 19 Panchayat
12. Logrimata Kolyari 1999-2000 12.16 Panchayat
13. Tindol ka naka Tindol 2005-06 24.58 Irrigation
14. Mohammad
Falasiya
Mohammad
Falasiya
2004-05
40
Irrigation
15. Ranthon ka naka Ranthon ka naka 2005-06 142 Irrigation
16. Was Madara Was Madara 1997-98 53.17 Panchayat
17. Mansi Wakal Gorana 2005-06 863 HZL
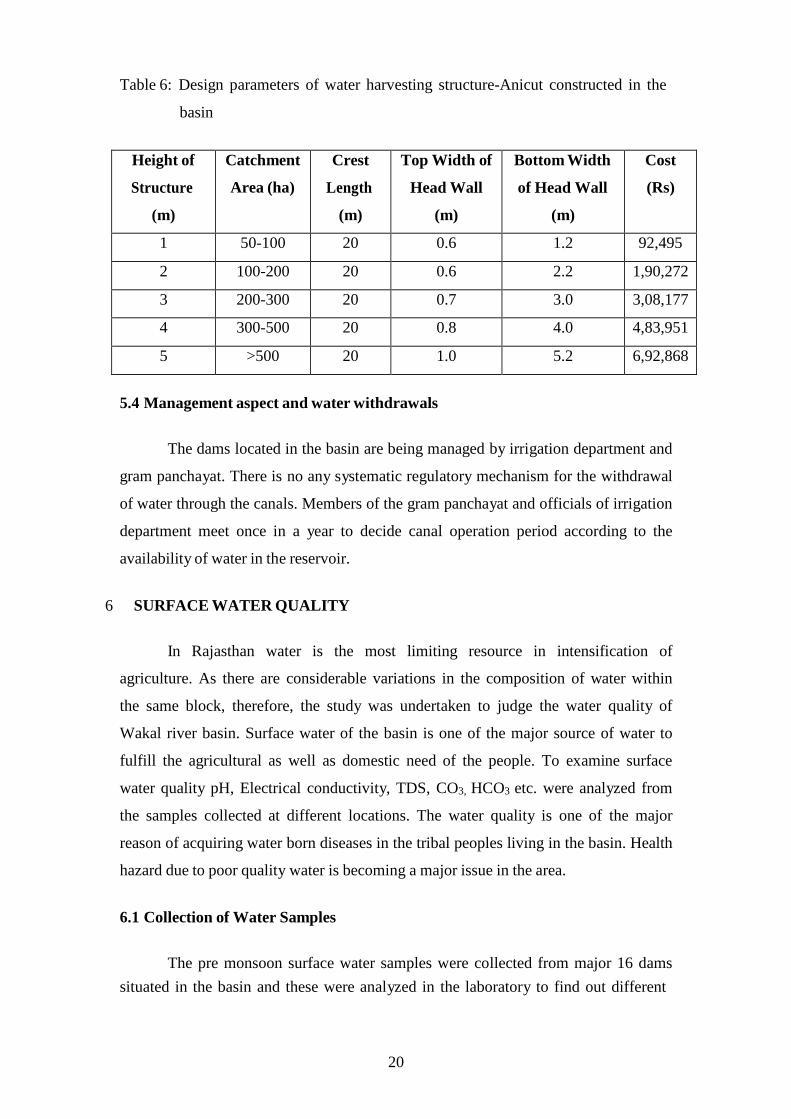
5.3 Design parameter of water harvesting structures
The rainwater harvesting structures are designed to intercept the water from
local catchment and store it for optimum utilization. In Wakal basin masonry Anicuts
were constructed at large scale by the various agencies only due to its wide range
utility for agricultural and domestic purposes during and after the monsoon. These
structures are designed keeping in view the hydrologic, hydraulic and structural
design parameters. The most commonly used design parameters of Anicut is given in
Table 6.
20
Table 6: Design parameters of water harvesting structure-Anicut constructed in the
basin
Height of
Structure
(m)
Catchment
Area (ha)
Crest
Length
(m)
Top Width of
Head Wall
(m)
Bottom Width
of Head Wall
(m)
Cost
(Rs)
1 50-100 20 0.6 1.2 92,495
2 100-200 20 0.6 2.2 1,90,272
3 200-300 20 0.7 3.0 3,08,177
4 300-500 20 0.8 4.0 4,83,951
5 >500 20 1.0 5.2 6,92,868
5.4 Management aspect and water withdrawals
The dams located in the basin are being managed by irrigation department and
gram panchayat. There is no any systematic regulatory mechanism for the withdrawal
of water through the canals. Members of the gram panchayat and officials of irrigation
department meet once in a year to decide canal operation period according to the
availability of water in the reservoir.
6 SURFACE WATER QUALITY
In Rajasthan water is the most limiting resource in intensification of
agriculture. As there are considerable variations in the composition of water within
the same block, therefore, the study was undertaken to judge the water quality of
Wakal river basin. Surface water of the basin is one of the major source of water to
fulfill the agricultural as well as domestic need of the people. To examine surface
water quality pH, Electrical conductivity, TDS, CO3, HCO3 etc. were analyzed from
the samples collected at different locations. The water quality is one of the major
reason of acquiring water born diseases in the tribal peoples living in the basin. Health
hazard due to poor quality water is becoming a major issue in the area.
6.1 Collection of Water Samples
The pre monsoon surface water samples were collected from major 16 dams
situated in the basin and these were analyzed in the laboratory to find out different
21
quality parameters. Three samples were collected from each reservoir at different
locations.
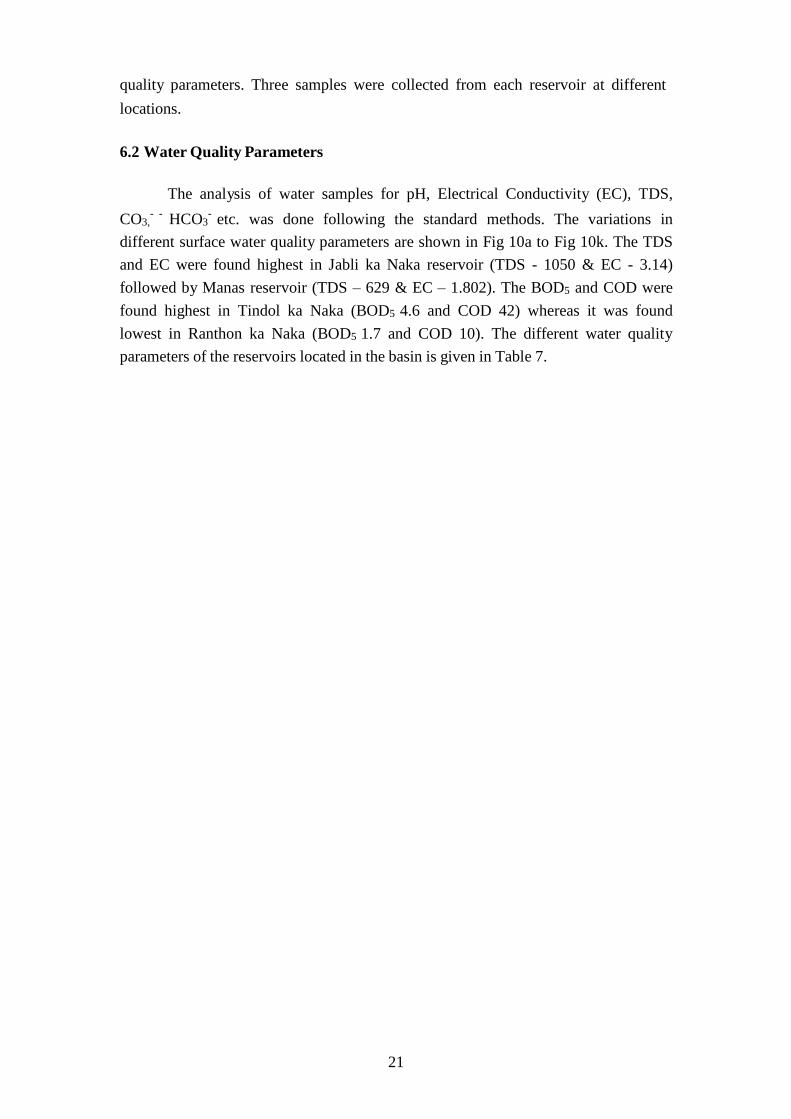
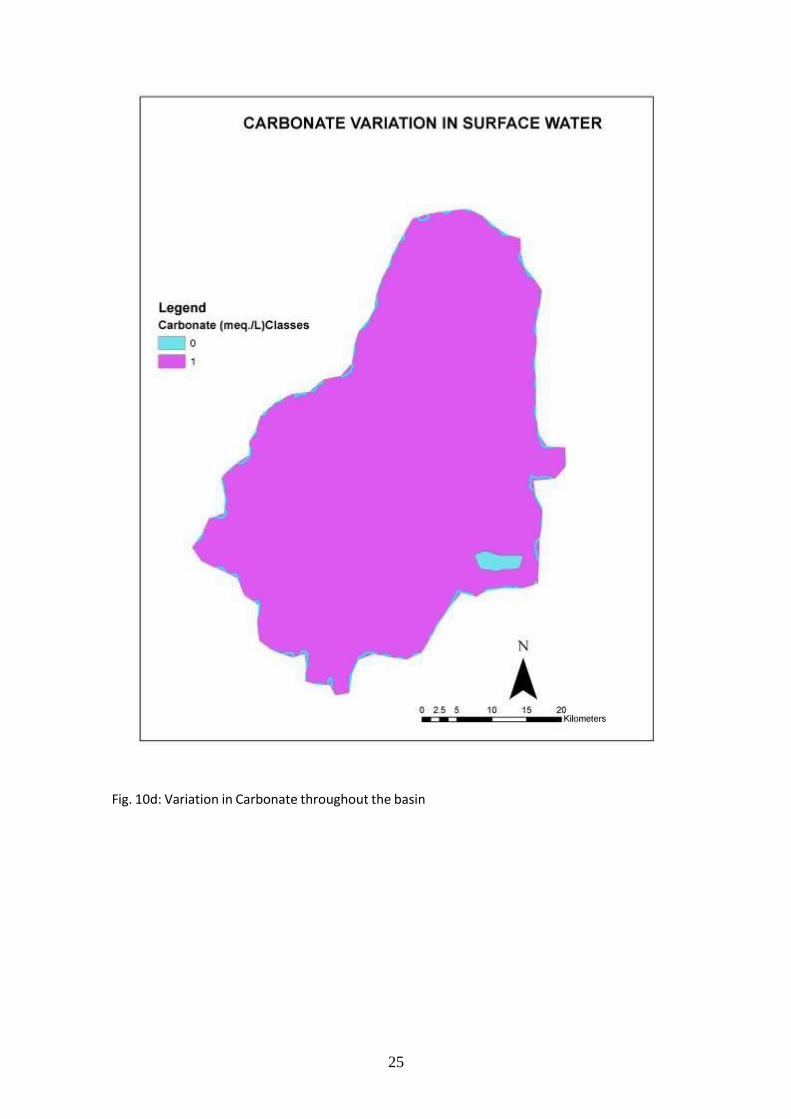
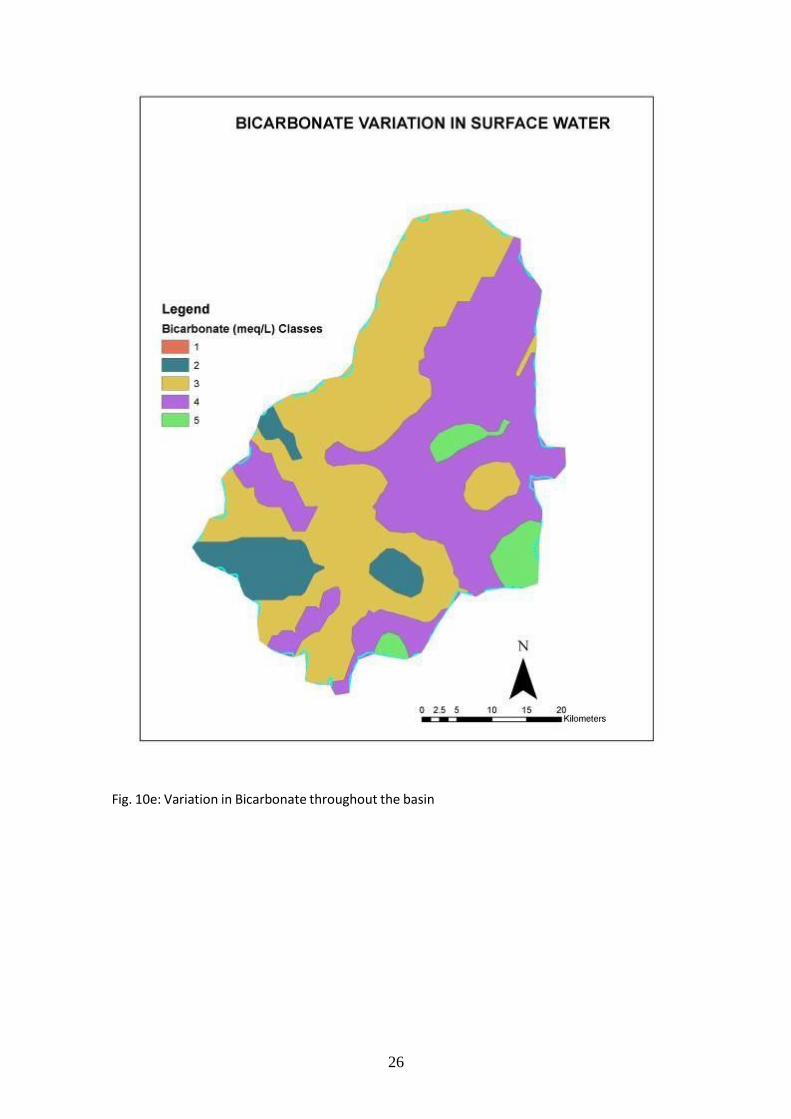
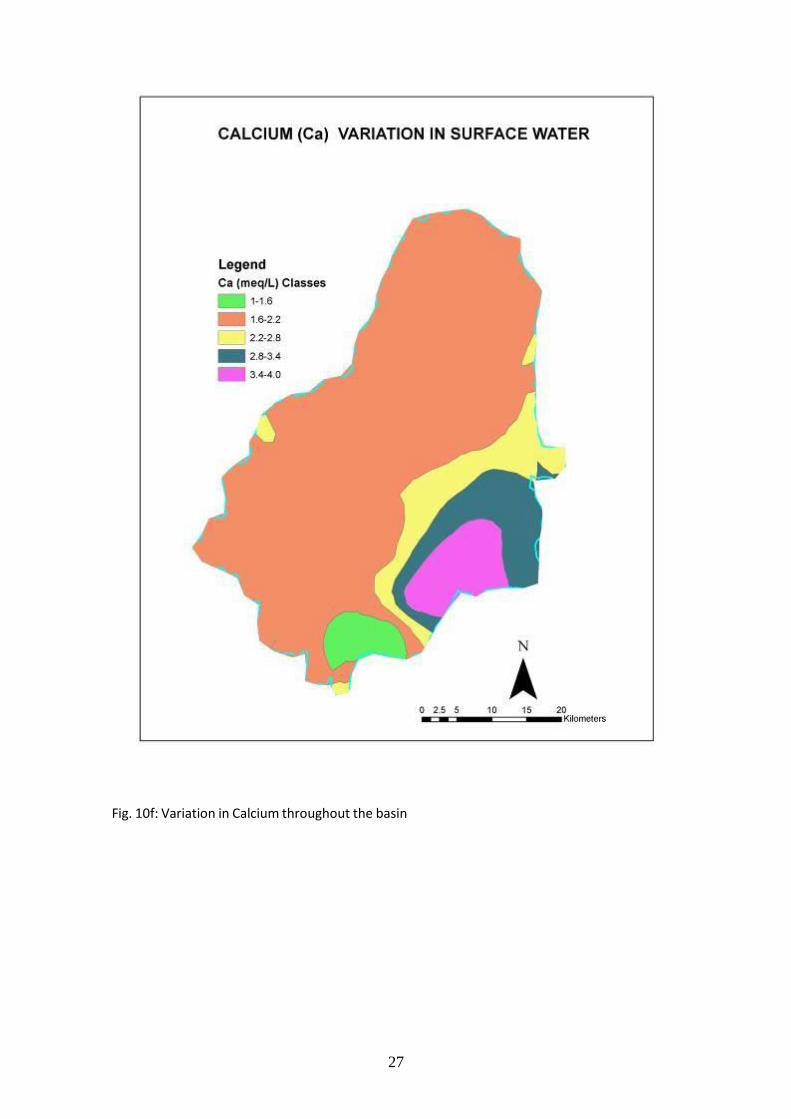
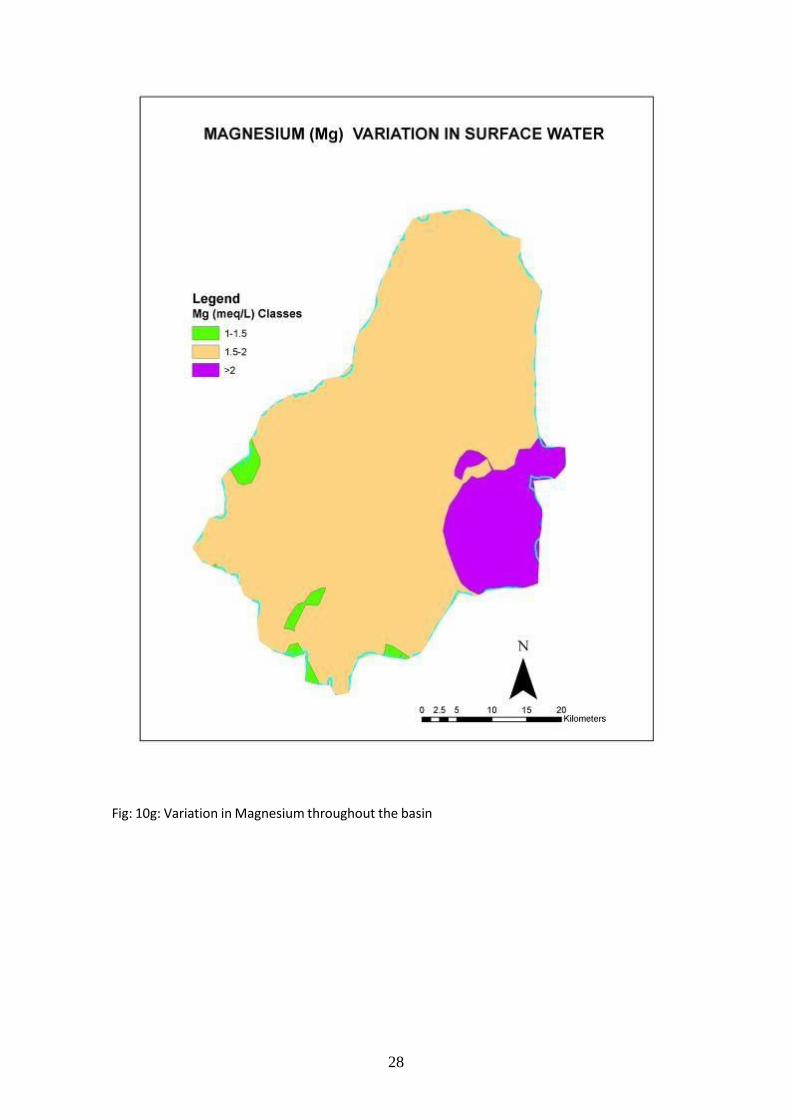
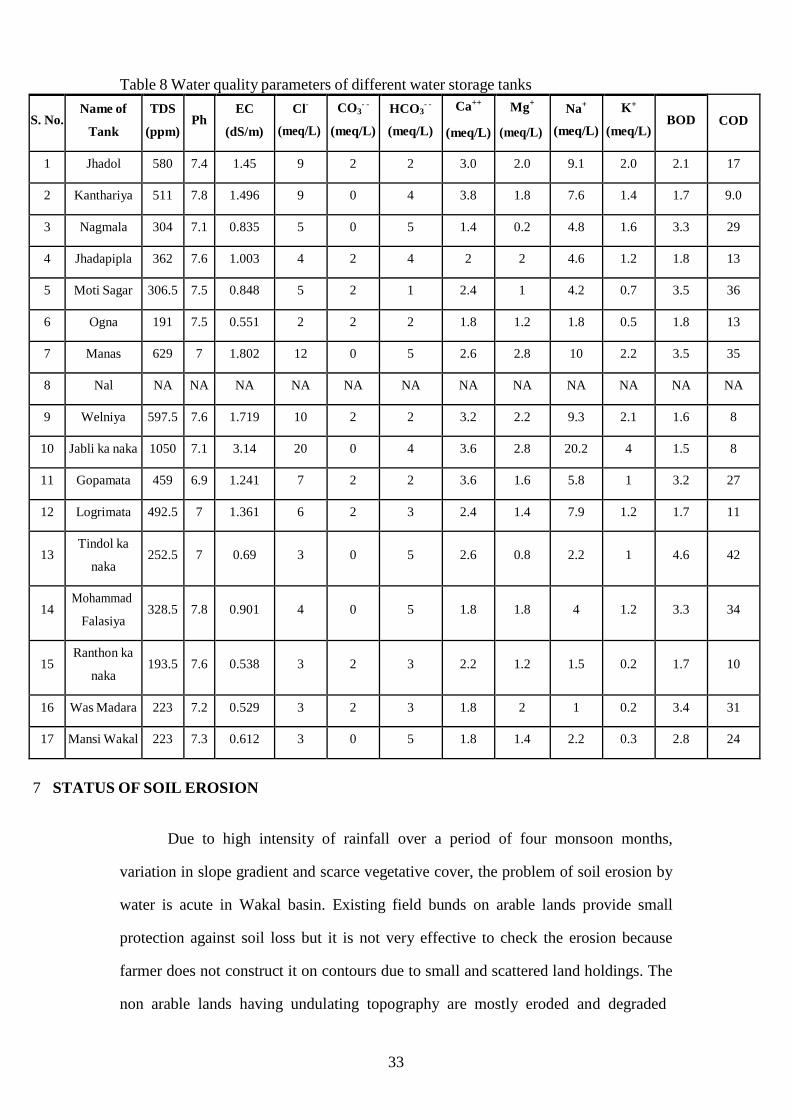
6.2 Water Quality Parameters
The analysis of water samples for pH, Electrical Conductivity (EC), TDS,
CO3,- -
HCO3-
etc. was done following the standard methods. The variations in
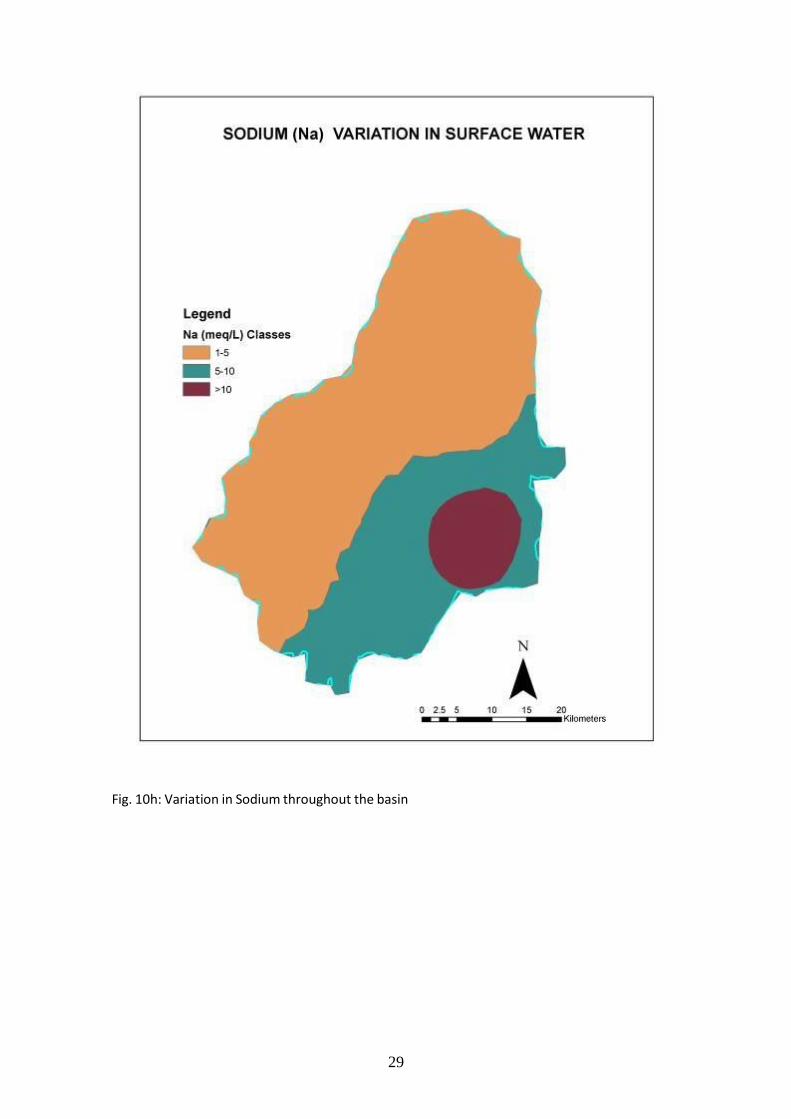
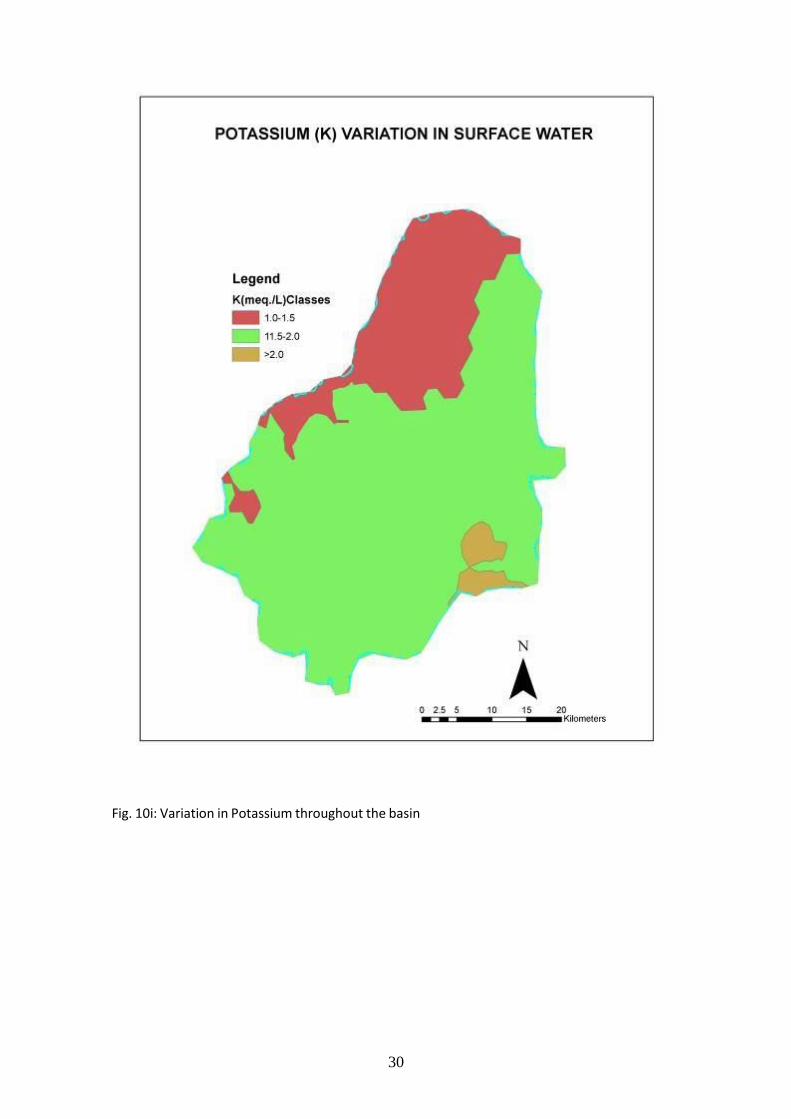
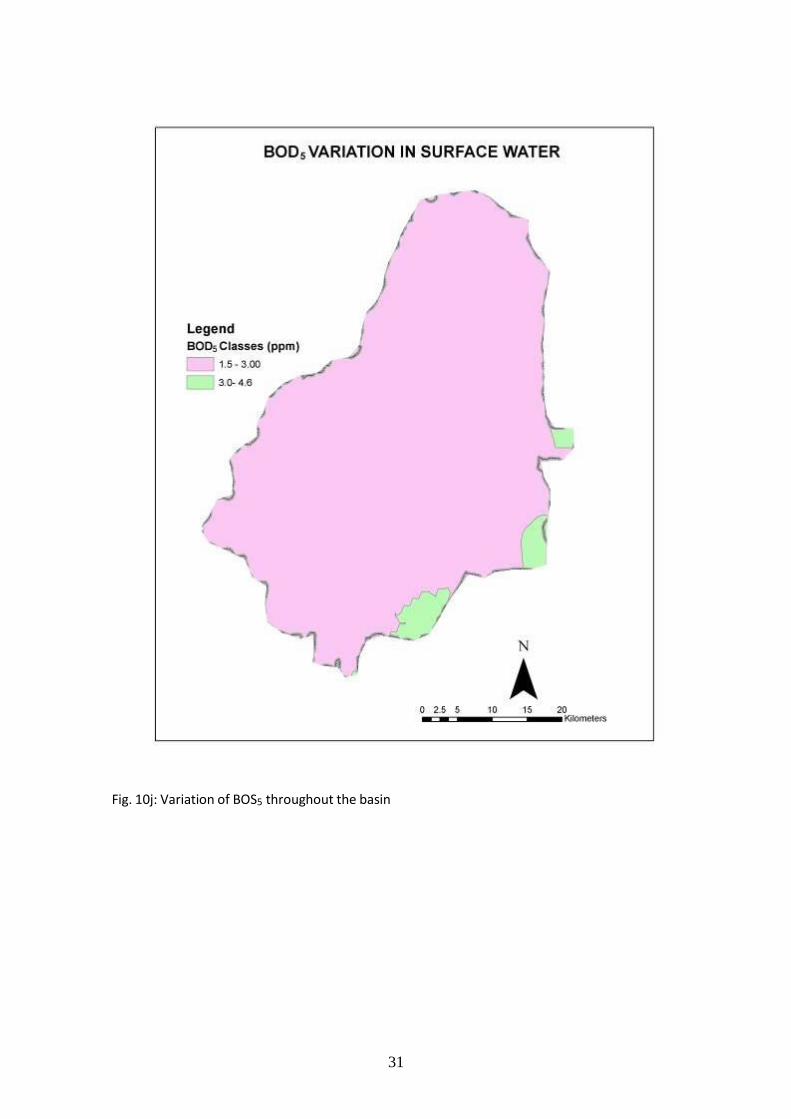
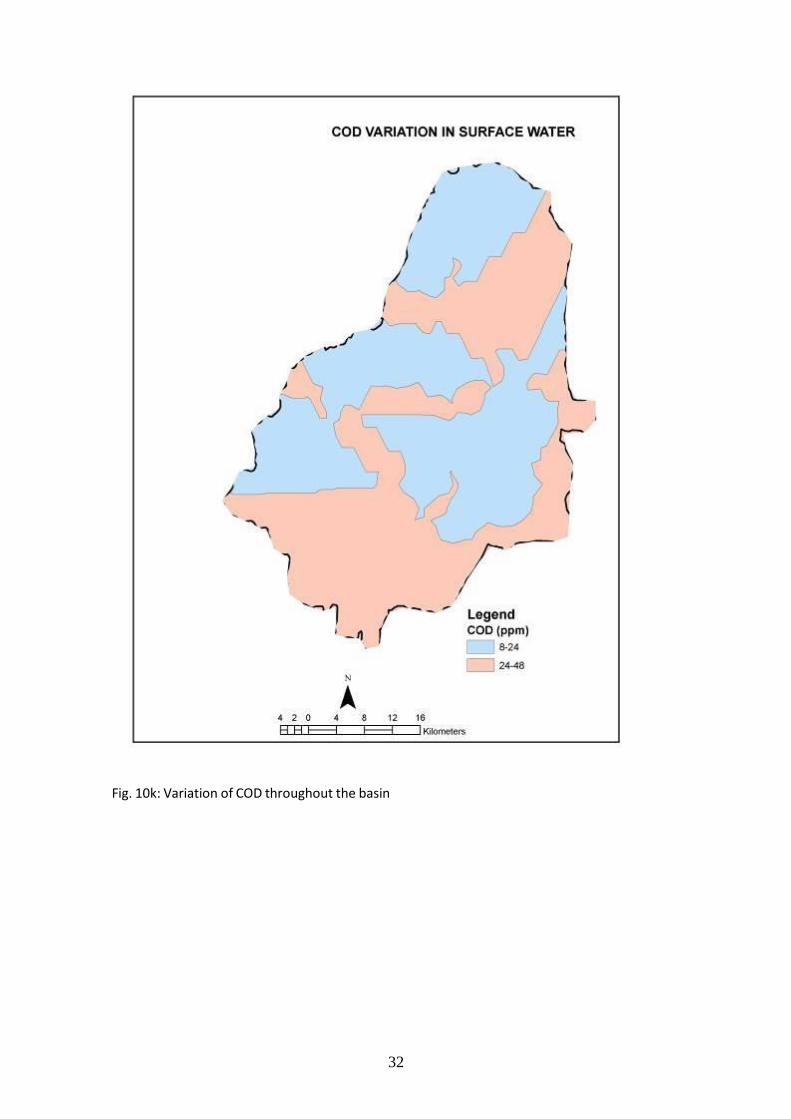
different surface water quality parameters are shown in Fig 10a to Fig 10k. The TDS
and EC were found highest in Jabli ka Naka reservoir (TDS - 1050 & EC - 3.14)
followed by Manas reservoir (TDS – 629 & EC – 1.802). The BOD5 and COD were
found highest in Tindol ka Naka (BOD5 4.6 and COD 42) whereas it was found
lowest in Ranthon ka Naka (BOD5 1.7 and COD 10). The different water quality
parameters of the reservoirs located in the basin is given in Table 7.
22
Fig. 10a: Variation in TDS throughout the basin
23
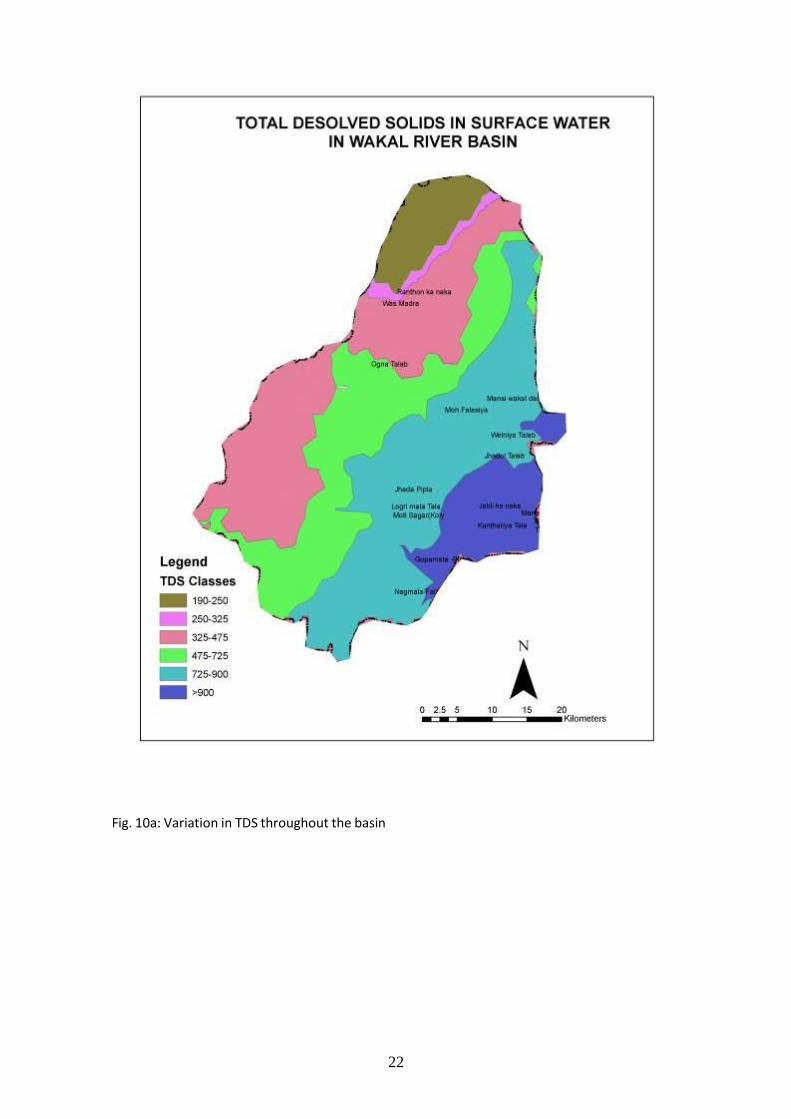
Fig. 10b: Variation in pH throughout the basin
24
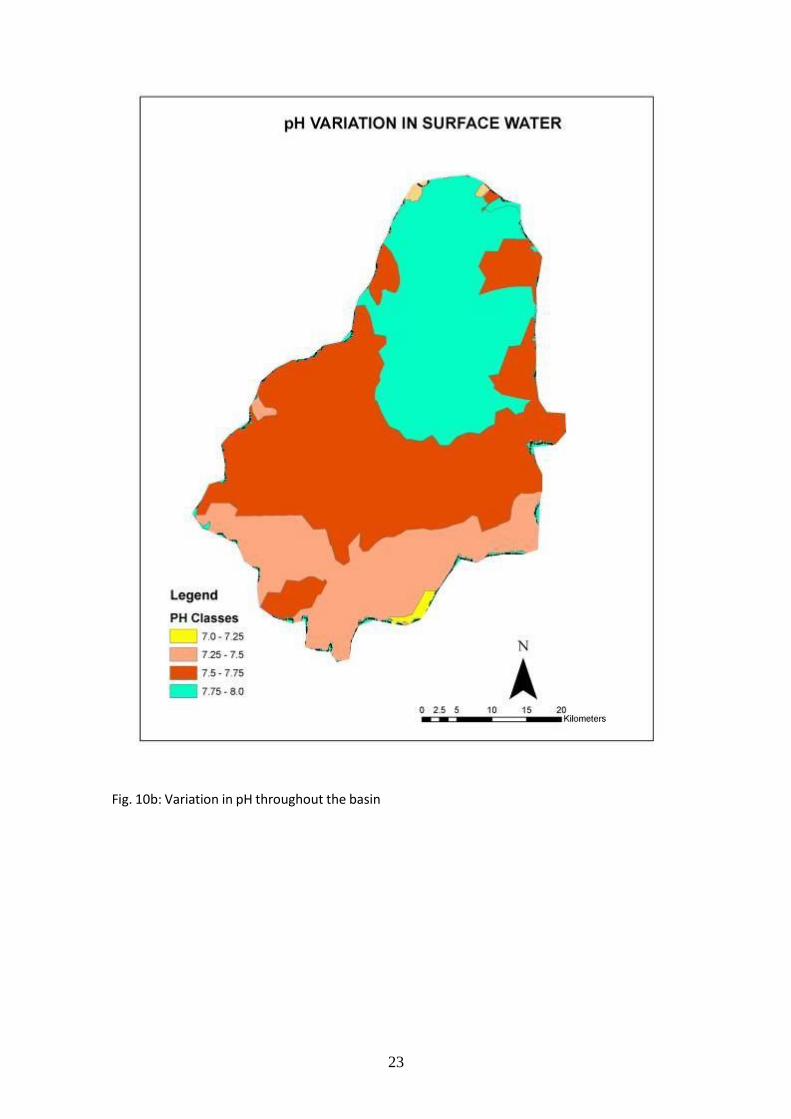
Fig. 10c: Variation in Chloride throughout the basin
25
Fig. 10d: Variation in Carbonate throughout the basin
26
Fig. 10e: Variation in Bicarbonate throughout the basin
27
Fig. 10f: Variation in Calcium throughout the basin
28
Fig: 10g: Variation in Magnesium throughout the basin
29
Fig. 10h: Variation in Sodium throughout the basin
30
Fig. 10i: Variation in Potassium throughout the basin
31
Fig. 10j: Variation of BOS5 throughout the basin
32
Fig. 10k: Variation of COD throughout the basin
33
Table 8 Water quality parameters of different water storage tanks
S. No.
Name of
Tank
TDS
(ppm)
Ph
EC
(dS/m)
Cl-
(meq/L)
CO3- -
(meq/L)
HCO3- -
(meq/L)
Ca++
(meq/L)
Mg+
(meq/L)
Na+
(meq/L)
K+
(meq/L)
BOD
COD
1 Jhadol 580 7.4 1.45 9 2 2 3.0 2.0 9.1 2.0 2.1 17
2 Kanthariya 511 7.8 1.496 9 0 4 3.8 1.8 7.6 1.4 1.7 9.0
3 Nagmala 304 7.1 0.835 5 0 5 1.4 0.2 4.8 1.6 3.3 29
4 Jhadapipla 362 7.6 1.003 4 2 4 2 2 4.6 1.2 1.8 13
5 Moti Sagar 306.5 7.5 0.848 5 2 1 2.4 1 4.2 0.7 3.5 36
6 Ogna 191 7.5 0.551 2 2 2 1.8 1.2 1.8 0.5 1.8 13
7 Manas 629 7 1.802 12 0 5 2.6 2.8 10 2.2 3.5 35
8 Nal NA NA NA NA NA NA NA NA NA NA NA NA
9 Welniya 597.5 7.6 1.719 10 2 2 3.2 2.2 9.3 2.1 1.6 8
10 Jabli ka naka 1050 7.1 3.14 20 0 4 3.6 2.8 20.2 4 1.5 8
11 Gopamata 459 6.9 1.241 7 2 2 3.6 1.6 5.8 1 3.2 27
12 Logrimata 492.5 7 1.361 6 2 3 2.4 1.4 7.9 1.2 1.7 11
13
Tindol ka
naka
252.5
7
0.69
3
0
5
2.6
0.8
2.2
1
4.6
42
14
Mohammad
Falasiya
328.5
7.8
0.901
4
0
5
1.8
1.8
4
1.2
3.3
34
15
Ranthon ka
naka
193.5
7.6
0.538
3
2
3
2.2
1.2
1.5
0.2
1.7
10
16 Was Madara 223 7.2 0.529 3 2 3 1.8 2 1 0.2 3.4 31
17 Mansi Wakal 223 7.3 0.612 3 0 5 1.8 1.4 2.2 0.3 2.8 24
7 STATUS OF SOIL EROSION
Due to high intensity of rainfall over a period of four monsoon months,
variation in slope gradient and scarce vegetative cover, the problem of soil erosion by
water is acute in Wakal basin. Existing field bunds on arable lands provide small
protection against soil loss but it is not very effective to check the erosion because
farmer does not construct it on contours due to small and scattered land holdings. The
non arable lands having undulating topography are mostly eroded and degraded
34
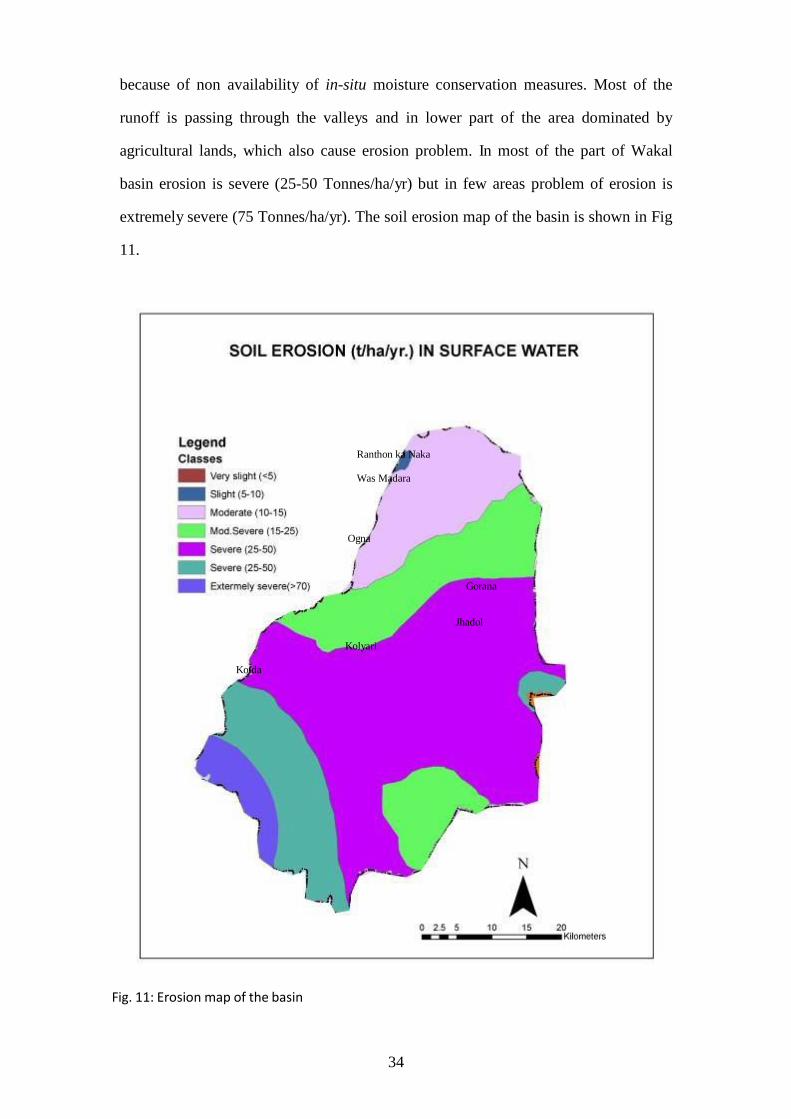
because of non availability of in-situ moisture conservation measures. Most of the
runoff is passing through the valleys and in lower part of the area dominated by
agricultural lands, which also cause erosion problem. In most of the part of Wakal
basin erosion is severe (25-50 Tonnes/ha/yr) but in few areas problem of erosion is
extremely severe (75 Tonnes/ha/yr). The soil erosion map of the basin is shown in Fig
11.
Ranthon ka Naka
Was Madara
Ogna
Gorana
Jhadol
Kolyari
Kotda
Fig. 11: Erosion map of the basin
35
8 CONCLUSIONS • In Wakal river basin there are five raingauge stations which are located in
Jhadol, Gorana, Ogna, Gogunda and Kotda.
• The daily rainfall data of last 15 years (1992-2006) were analyzed and it was
found that the maximum weekly rainfall probability at 75per cent probability
level is 105 mm.
• There is significant variation in the annual rainfall of Gogunda and Kotda
while these variations are non significant for rest of three raingauge stations.
• Surface drainage of the area is generally good due to slight undulations in the
topography. About 1,07,241 ha of the land falls under the slope group of 30 to
50%.
• The main tributaries of Wakal are Manshi and Pamri rivers. The total length of
the basin is 71.22 km, whereas the maximum width is 41.01 km. The total
catchment area of the basin is 1914.32 km2.
• The whole area of the basin is divided in four land use classes viz. agriculture,
open scrub, degraded forest and fairly dense forest.
• Most of the area of the basin falls under rocky soil group, in which soil depth
and slope are the limiting factors. Average soil depth varies between 30 to 50
per cent.
• The percentage runoff varies from minimum 4.37 to maximum of 37.89 for
the year 1999 and 2005 respectively. The maximum runoff yield of 714.73
million m3
was found during the year 2006.
• In the Wakal River Basin 17 major rainwater harvesting structures were
constructed. Mansi-Wakal Dam is the biggest dam constructed in the basin
which is having the gross storage capacity of 863 MCFt.
• In Wakal river basin Anicuts, Sunkan pond/ Nadi and low cost dry stone
masonry ponds are commonly used rainwater harvesting structures. The height
of these structures is varies from 1m to 5m.
• The twelve standard parameters of water quality were analyzed to find out the
suitability of surface water collected in the reservoirs. The TDS and EC were
found highest in Jabli ka Naka reservoir (TDS - 1050 & EC - 3.14) followed
by Manas reservoir (TDS – 629 & EC – 1.802). The BOD5 and COD was
found highest in Tindol ka Naka (BOD5 4.6 and COD 42) whereas it was
found lowest in Ranthon ka Naka (BOD5 1.7 and COD 10).
36
• In most of the part of Wakal basin, erosion is severe (25-50 Tonnes/ha/yr) but
in few areas problem of erosion is extremely severe (75 Tonnes/ha/yr).
• The erosion problem is extremely severe in the areas near Kotda and
Kalakhetar where Wakal River joins to Sabarmati River.
• There is urgent need to check the erosion by providing treatment measures of
the area using watershed approach.
• In Wakal River Basin surface rainwater harvesting seems to be the only
alternative by which water scarcity problem can be mitigated and agricultural
production can be increased.
9 RECOMMENDATIONS • There is a need to find out causes of pollution of water storage tank situated at
Jabli ka Naka because at this site TDS and EC are much high as compared to
permissible limits.
• It is required to follow a suitable irrigation schedule for withdrawal of water
through canals from the storage reservoirs for better scheduling and
management of surface water and its availability throughout the year.
• The erosion rate of the Wakal basin is very high therefore, to check the
siltation and also controlling erosion, there is an urgent need to put different
kinds of vegetative as well as engineering measures.

Global Water for Sustainability Program
Florida International University
Biscayne Bay Campus
3000 NE 151St. ACI-267
North Miami, FL 33181 USA
Phone: (+1-305) 919-4112
Fax: (+1-305) 919-4117
www.globalwaters.net