Embed Size (px)
Citation preview
Organizational Behavior and Human Decision ProcessesVol. 77, No. 2, February, pp. 85–129, 1999Article ID obhd.1998.2813, available online at http://www.idealibrary.com on
Work and Family Stress and Well-Being:An Examination of Person–Environment
Fit in the Work and Family Domains
Jeffrey R. Edwards
Kenan-Flagler Business School, University of North Carolina
and
Nancy P. Rothbard
Northwestern University
Research indicates that work and family are significant sourcesof stress. However, this research has underemphasized the cogni-tive appraisal process by which work and family generate stress.This study used person–environment fit theory to examine howthe comparison of work and family experiences to the person’svalues relates to stress and well-being. Using data from 1758employees, we assessed fit regarding autonomy, relationships,security, and segmentation for both work and family, and exam-ined the relationship of fit with work and family satisfaction,anxiety, depression, irritation, and somatic symptoms. In general,well-being improved as experiences increased toward values andimproved to a lesser extent as experiences exceeded values. Well-being was also higher when experiences and values were bothhigh than when both were low. These relationships were gener-ally strongest for within-domain fit and well-being (i.e., work fitand work satisfaction, family fit and family satisfaction), andseveral relationships were moderated by work and family cen-trality. q 1999 Academic Press
An earlier version of this paper was presented at the symposium Frontiers of PE Fit Theory:Spanning Work, Family, and Culture at the 11th Annual Conference of the Society for Industrialand Organizational Psychology, San Diego, California, April 1996. The authors thank Susan J.Ashford, Thomas S. Bateman, Richard S. Blackburn, Daniel M. Cable, and Jane E. Dutton fortheir helpful comments during the development of this paper. The authors gratefully acknowledgethe support of the University of Michigan Business School in conducting this research.
Address correspondence and reprint requests to Jeffrey R. Edwards, Kenan-Flagler BusinessSchool, University of North Carolina, Chapel Hill, NC 27599-3490. E-mail: [email protected].
850749-5978/99 $30.00
Copyright q 1999 by Academic PressAll rights of reproduction in any form reserved.

86 EDWARDS AND ROTHBARD
Stress is a growing concern in contemporary society. Research shows thatstress has important human costs in terms of mental and physical illness(Adler & Matthews, 1994; Coyne & Downey, 1991; Ganster & Schaubroeck,1991; Kinicki, McKee, & Wade, 1996). Stress also has significant financialconsequences. The New York Business Group on Health estimates that stresscosts employers $75–80 billion annually in absenteeism, turnover, lost produc-tivity, and health and disability claims (Mann, 1996). The cost of stress tosociety at large is also substantial. It has been estimated that stress contributesto 90% of medical disorders (Gibson, 1993) and is therefore a major factor inescalating health care costs, which in the United States reached nearly $950billion in 1994, or 13.7% of the gross domestic product (U.S. Department ofCommerce, 1996).
Work and family are particularly potent sources of stress, given that mostadults devote the bulk of their time, energy, and attention to these two lifedomains (Burke & Greenglass, 1987; Zedeck, 1992). Unfortunately, recent socio-economic trends indicate that work and family are becoming increasinglystressful. For example, cost-cutting and downsizing have heightened workdemands and reduced job security (Bayer, 1996; Fisher, 1992; Shaw & Barrett-Power, 1997). Concurrently, the rise of dual-earner couples has intensifiedthe struggle to manage family responsibilities (Brett & Yogev, 1988; Gupta &Jenkins, 1985; Higgins & Duxbury, 1992; Lundberg, 1996), and family relationshave weakened due to the breakdown of traditional family structures (Demo &Acock, 1996; Pardeck, Brown, Christian, & Schnurbusch, 1991).
Researchers have developed models to explain how work and family influencestress and well-being (e.g., Eckenrode & Gore, 1990; Frone, Russell, & Cooper,1992; Frone, Yardley, & Markel, 1997; Greenhaus & Parasuraman, 1986; Hig-gins, Duxbury, & Irving, 1992; Kopelman, Greenhaus, & Connolly, 1983; Mar-tin & Schermerhorn, 1983; Parasuraman, Purohit, Godshalk, & Beutell, 1996).Although these models differ in various respects, each predicts that perceivedwork and family experiences directly influence well-being. Notably absent fromthese models is cognitive appraisal, which refers to the subjective evaluationof perceptions relative to internal standards, such as desires, values, or goals(Lazarus & Folkman, 1984). With cognitive appraisal, researchers can addresswhat is perhaps the central question in the study of psychological stress: Whydo different people experience the same situation as stressful or benign? Somemodels of work and family stress use individual differences as moderators ofthe effects of work and family experiences on well-being (e.g., Eckenrode &Gore, 1990; Frone et al., 1992; Greenhaus & Parasuraman, 1986; Higgins etal., 1992; Martin & Schermerhorn, 1983; Parasuraman et al., 1996). However,using individual differences as moderators does not capture the subjectivecomparison of perceived work and family experiences to internal standards,a process that defines cognitive appraisal (Edwards, 1992; Lazarus &Folkman, 1984).
Cognitive appraisal is central to theories of psychological stress (e.g., Ed-wards, 1992; French, Caplan, & Harrison, 1982; Lazarus & Folkman, 1984;McGrath, 1976). Of these theories, perhaps the most versatile is person–
WORK AND FAMILY STRESS 87
environment (P-E) fit theory (Edwards, Caplan, & Harrison, 1998; French etal., 1982). P-E fit theory defines stress as a perceived mismatch between theenvironment and the person’s values, desires, or goals (Harrison, 1978). Bydefining stress in this manner, P-E fit theory directly incorporates cognitiveappraisal into the conceptualization of stress. P-E fit theory predicts that aperceived match between the person and environment is beneficial to mentaland physical well-being, whereas a perceived mismatch signifies stress, pro-duces mental and physical strain (i.e., damage to well-being), and stimulatesefforts to resolve P-E misfit (French et al., 1982).
Although P-E fit theory holds great promise for understanding psychologicalstress, current P-E fit research has two shortcomings. First, despite the general-ity of P-E fit theory, most P-E fit research has focused on work stress (Caplan &Harrison, 1993; Edwards et al., 1998). As a result, researchers have not realizedthe potential of P-E fit theory for understanding stress from nonwork sources,such as family. Second, studies of P-E fit have not developed strong predictionsregarding the form of the relationship between P-E fit and well-being (Edwardset al., 1998). Instead, most studies have relied on the general premise that fitis beneficial and misfit is harmful. This premise is overly simplistic, as well-being may vary depending on whether perceptions exceed or fall short of values(French et al., 1982; Locke, 1976) and on whether fit represents a match be-tween low versus high levels of person and environment constructs (Edwards &Harrison, 1993; Imparato, 1972). Although P-E fit theory recognizes differentpossible relationships between P-E fit and well-being, it does not provide strongconceptual criteria for predicting when a particular relationship will occur.
This study builds on P-E fit theory to investigate stress and well-beingassociated with work and family. The central research questions addressedby this study are twofold: (a) what mechanisms determine the nature of therelationship between P-E fit and well-being, and (b) what factors influence therelative effects of work P-E fit and family P-E fit on well-being? By investigatingthese questions, this study contributes to work-family research and P-E fitresearch. This study contributes to work–family research by using P-E fittheory to capture the cognitive appraisal process by which work and familyexperiences generate stress and influence well-being. By capturing this process,we attempt to explain why work and family experiences are stressful for somepeople but not for others. This study contributes to P-E fit research in twoways. First, whereas previous P-E fit research has focused on work, we examineP-E fit associated with both work and family. Second, we develop a priorihypotheses regarding the relationship between P-E fit and well-being thattake into account the direction of misfit and the absolute levels of person andenvironment constructs. Finally, this study contributes to both work–familyresearch and P-E fit research by investigating factors that influence the relativeeffects of work P-E fit and family P-E fit on well-being.
OVERVIEW OF PERSON–ENVIRONMENT FIT THEORY
P-E fit theory incorporates two basic distinctions regarding the person andenvironment. The first is between the objective and subjective person and

88 EDWARDS AND ROTHBARD
environment. The objective person refers to attributes of the person as theyactually exist, whereas the subjective person is the person’s perception of hisor her own attributes (i.e., the person’s self-concept). The objective environmentsignifies physical and social situations and events as they exist independentof the person’s perceptions, whereas the subjective environment refers to situa-tions and events as perceived by the person. According to P-E fit theory, theobjective person and environment affect their subjective counterparts, althoughthese effects are imperfect due to perceptual biases, limits on human informa-tion processing, cognitive construction processes, and situational barriers thatimpede access to objective information (Edwards et al., 1998; Harrison, 1978).
The second distinction is between two versions of P-E fit (French et al., 1982).One version entails the fit between the values of the person and the suppliesin the environment available to fulfill values (S-V fit; Dawis, 1992; Edwards,1992; French et al., 1982; Locke, 1976). Values refer to the desires of the personand thus signify a general construct that subsumes interests, preferences,and goals (Edwards, 1992; Schuler, 1980). Supplies refer to aspects of theenvironment that may fulfill the person’s values (French et al., 1982). Suppliesinclude extrinsic rewards, such as pay and recognition, and intrinsic rewardsderived from activities or experiences in the environment. The other versionof P-E fit involves the fit between the demands of the environment and theperson’s abilities (D-A fit; French et al., 1982; McGrath, 1976; Shirom, 1982).Demands are qualitative and quantitative requirements faced by the personand include objective demands (e.g., commute time, length of workweek) andsocially constructed norms and role expectations. Abilities comprise skills,energy, time, and resources the person may muster to meet demands.
The present study focuses on subjective S-V fit, for two reasons. First, thisstudy is concerned with work and family stress. As noted previously, P-E fittheory defines stress as misfit between perceptions and values, and this defini-tion of stress corresponds to subjective S-V misfit. Therefore, by focusing onsubjective S-V fit, we directly incorporate the concept of stress into our study.Accordingly, our hypotheses, measures, and analyses refer to subjective ratherthan objective supplies and values, under the assumption that these subjectiveconstructs are imperfectly related to their objective counterparts (Edwardset al., 1998). Our focus on subjective S-V fit is consistent with research onpsychological stress, which deals with stress as experiened by the person (Ed-wards, 1992; Lazarus & Folkman, 1984; Schuler, 1980). Second, a central goalof this study is to understand how work and family stress relate to well-being. According to P-E fit theory, S-V fit directly affects well-being, giventhat obtaining what one values creates pleasure (Diener, 1984; Locke, 1976),promotes self-esteem (Hyland, 1987), and stimulates physiological processesthat enhance health (Edwards & Cooper, 1988; Karasek, Russell, & Theorell,1982). Although some theorists argue that D-A fit also directly affects well-being (Cox, 1987; Shirom, 1982), Harrison (1978) contends that D-A fit influ-ences well-being only when meeting demands provides the person what he orshe values, as when meeting a production quota yields financial rewards or

WORK AND FAMILY STRESS 89
enhances the person’s sense of competence (White, 1959). Thus, by examiningS-V fit rather than D-A fit, we focus on a more proximal cause of well-being.
RELATIONSHIP BETWEEN SUPPLIES–VALUES FIT AND WELL-BEING
Most studies of the relationship between S-V fit and well-being rely on twosimplifying assumptions: (a) well-being is maximized at perfect S-V fit (i.e.,where supplies match values), and (b) S-V fit leads to the same level of well-being regardless of the absolute levels of supplies and values (Assouline &Meir, 1987; Edwards, 1991). In most studies, these assumptions are embeddedin analytical methods that cannot detect whether the assumptions are violated.Studies using alternative methods (e.g., Edwards, 1994, 1996; Edwards &Harrison, 1993; Elsass & Veiga, 1997; Hesketh & Gardner, 1993; Livingstone,Nelson, & Barr, 1997) have found that these assumptions rarely hold. Thesefindings are not surprising, as P-E theory indicates that the relationship be-tween S-V fit and well-being may follow a variety of functional forms (Frenchet al., 1982; Harrison, 1978; Kulka, 1979; Naylor, Pritchard, & Ilgen, 1980;Rice, McFarlin, Hunt, & Near, 1985), few of which conform to the simplifyingassumptions underlying most studies of S-V fit.
To capture the potential complexity of the relationship between S-V fit andwell-being, we conceive this relationship as a three-dimensional surface inwhich supplies and values jointly influence well-being (Edwards, 1996; Ed-wards & Cooper, 1990; Edwards & Harrison, 1993). We develop hypothesesregarding these surfaces by addressing three basic questions. First, does well-being improve, worsen, or remain constant as supplies increase toward values?Second, does well-being improve, worsen, or remain constant as supplies exceedvalues? Third, does S-V fit when supplies and values are both low yield thesame level of well-being as when supplies and values are both high? Thesequestions correspond to fundamental properties of a surface relating suppliesand values to well-being, and additional questions may be addressed as dictatedby relevant theory (Edwards, 1996; Edwards & Harrison, 1993; Edwards &Parry, 1993; Kulka, 1979; Naylor et al., 1980; Rice et al., 1985). Below weexamine potential answers to these questions and then apply this reasoningto generate hypotheses for this study.
Well-Being as Supplies Increase toward Values
P-E fit theory predicts that, as supplies increase toward values, well-beingimproves (French et al., 1982; Harrison, 1978). This prediction reflects thepremise that insufficient supplies signify unfulfilled needs, desires, or goals,and this lack of fulfillment creates tension and negative affect, thereby reducingwell-being (Dawis & Lofquist, 1984; Diener, 1984; Lazarus & Folkman, 1984;Locke, 1969; Murray, 1938). It follows that, as supplies increase toward values,fulfillment is achieved, and well-being should improve. This prediction appliesto S-V fit on all value dimensions (Harrison, 1978). Dimensions that refer toconditions or events that are undesirable (e.g., physical danger, social isolation)
90 EDWARDS AND ROTHBARD
can usually be reframed as value dimensions (e.g., physical safety, social com-panionship), and increases in supplies toward values on these reframed dimen-sions should improve well-being.
Well-Being as Supplies Exceed Values
Although P-E fit theory posits that well-being invariably improves as suppliesincrease toward values, it states that well-being may improve, worsen, orremain constant as supplies exceed values (French et al., 1982; Harrison, 1978).These alternative predictions depend on the effects of excess supplies on: (a)S-V fit on the same dimension over time, and (b) S-V fit on other dimensions(Harrison, 1978). Building on this reasoning, Edwards (1996) derived fourprocesses to describe the effects of excess supplies on well-being. Two of theseprocesses, depletion and interference, indicate that excess supplies worsen well-being. Depletion occurs when excess supplies reduce the likelihood that valueson the same dimension will be met in the future, as when drawing excesssupport from a confidant makes that person less available at a later time.Interference occurs when excess supplies inhibit S-V fit on other dimensions,as when excess challenge makes it difficult to achieve desired levels of taskperformance. Both depletion and interference yield a symmetric relationshipbetween S-V misfit and well-being, such that well-being worsens as suppliesexceed or fall short of values (Locke, 1969; Rice et al., 1985).
Two other processes, conservation and carryover, indicate that excess suppliesenhance well-being. Conservation occurs when excess supplies are retained tofulfill values on the same dimension at a later time, as when excess income issaved to meet future financial needs. Carryover occurs when excess suppliesfor one value are used to fulfill other values, as when excess control enablesthe person to initiate changes that bring supplies in line with values on a rangeof dimensions. Conservation and carryover produce monotonic relationshipsbetween S-V misfit and well-being, such that well-being improves as suppliesincrease toward values and continues to improve as supplies exceed values(Rice, Phillips, & McFarlin, 1990; Sweeney, McFarlin, & Inderrieden, 1990).
When excess supplies do not influence S-V fit on other dimensions or futureS-V fit on the same dimension, well-being will remain constant as suppliesexceed values, approximating the level of well-being associated with perfectS-V fit. As a result, the relationship between S-V fit and well-being is asymp-totic, increasing as supplies approach values and remaining constant as sup-plies exceed values (French et al., 1982; Harrison, 1978; Rice et al., 1985).
Well-Being for Low versus High Supplies and Values
Studies examining variation in well-being associated with the absolute levelsof supplies and values have found that when the degree of S-V fit is heldconstant, well-being is often higher when supplies and values are both highthan when both are low (Edwards, 1994, 1996; Edwards & Harrison, 1993;Imparato, 1972; Livingstone et al., 1997). We offer two explanations for this

WORK AND FAMILY STRESS 91
finding, each of which provides a conceptual basis for the hypotheses welater develop.
First, high supplies on one dimension may generate supplies that fulfillvalues on other dimensions, thereby enhancing well-being. For example, perfectS-V fit exists for a person who has and wants a simple, routine job and for aperson who has and wants a complex job. However, complex jobs often bringhigh pay, status, and other rewards, and people often want more of theserewards than they currently have (Evans, 1969; Wall & Payne, 1973; Wanous &Lawler, 1972). Therefore, high levels of these rewards signify increased suppliestoward values, which should improve well-being (Harrison, 1978). This expla-nation is analogous to carryover, which also describes how supplies on onedimension facilitate S-V fit on other dimensions. However, the present explana-tion refers to the effects of high supplies when supplies and values are equal,whereas carryover involves the effects of supplies that exceed values.
Second, attaining supplies that fulfill high values may yield a sense of accom-plishment, in that high values connote ambitious aspirations or goals. Thissense of accomplishment itself constitutes a supply for values regarding mas-tery, competence, and self-worth (Harrison, 1978; Morse, 1975; White, 1959).Because these values usually exceed their associated supplies (Caplan, 1983;deCharms, 1968; Maslow, 1954), heightened feelings of mastery, competence,and self-worth represent increases in supplies toward values on these dimen-sions, which should improve well-being. This explanation invokes the notionof metafit, meaning that the attainment of S-V fit on one dimension may itselfconstitute a supply for S-V fit on other dimensions.
Application to Supplies–Values Fit on Specific Dimensions
The foregoing discussion yields three general conclusions regarding the rela-tionship between S-V fit and well-being. First, well-being should improve assupplies increase toward values. Second, well-being may improve, worsen, orremain constant as supplies exceed values, depending on the effects of excesssupplies on S-V fit on the same dimension over time and on S-V fit on otherdimensions. Third, well-being is likely to improve as supplies and values bothincrease. We now draw from these general conclusions to derive specific hypoth-eses regarding the relationship between well-being and S-V fit on four valuedimensions. We chose these dimensions because they represent important hu-man values that are relevant to both work and family. Our choice of thesedimensions does not deny the potential relevance of other values, but insteadallows us to focus on a manageable set of dimensions that are relevant to ourcontext of inquiry.
We should note two points concerning our hypotheses of the relationshipbetween S-V fit and well-being. First, we capitalize on the generality of P-Efit theory by developing hypotheses that apply to both work and family. Wesubsequently test these hypotheses separately for work and family and comparerelationships between S-V fit and well-being for these two life domains. Second,for these hypotheses, we refer to well-being in general terms. Later, we discuss
92 EDWARDS AND ROTHBARD
how the relationship between S-V fit and well-being may vary according towhether well-being is domain-specific (e.g., work satisfaction, family satisfac-tion) or entails the overall functioning of the person (e.g., anxiety, depression,physical health).
Autonomy. The first dimension is autonomy, defined here as control overthe nature and timing of one’s activities (Hackman & Oldham, 1980). Autonomyis a fundamental human motive, as it signifies the ability to influence theconduct of one’s life (Bolton, 1980; Ryff & Keyes, 1995; Schwartz, 1994). Becauseautonomy is a fundamental human motive, it is relevant to both work andfamily (Ganster, 1989; Hackman & Oldham, 1980; Voydanoff, 1988; Zedeck,1992). Autonomy is particularly relevant to the study of stress and well-being,as stress research has identified lack of control as a significant source of stress(Abramson, Seligman, & Teasdale, 1978; Ganster, 1989; Karasek & Theorell,1990) and availability of control as an important coping resource (Folkman,1984; Silver & Wortman, 1980; Sutton & Kahn, 1987).
For autonomy, increases in supplies toward values should improve well-being, given that too little autonomy denotes insufficient control over one’s life(Abramson et al., 1978; Burger, 1984; Ganster, 1989). Excess autonomy mayimprove or worsen well-being, depending on the effects of conservation, deple-tion, carryover, and interference. Excess autonomy probably cannot be con-served, because autonomy is not a resource that can be saved. For similarreasons, having excess autonomy in the present is unlikely to deplete autonomyavailable for the future. Excess autonomy will likely have substantial carryovereffects, because autonomy signifies control that may be used to acquire suppliesthat fulfill values on multiple dimensions (Caplan, 1987; Folkman, 1984;Ganster, 1989; Harrison, 1978). On the other hand, excess autonomy maycreate interference if it deprives the person of guidance from others (Burger &Cooper, 1979), although these detrimental effects are likely only if excess auton-omy is substantial. On balance, we expect that excess autonomy will improvewell-being, provided supplies for autonomy do not greatly exceed values forautonomy. This assertion is consistent with results reported by Elsass andVeiga (1997), who found that anxiety decreased as actual job autonomy ex-ceeded desired job autonomy. The foregoing discussion leads to the followinghypothesis:
HYPOTHESIS 1A: For autonomy, well-being will increase as supplies increase toward valuesand will continue to increase as supplies exceed values, decreasing only when excess suppliesare substantial.
Well-being should be higher when autonomy supplies and values are bothhigh than when both are low, for three reasons. First, high supplies for auton-omy may accompany high supplies for responsibility and authority, and peoplewho value autonomy may also value these supplies. Therefore, high suppliesand values for autonomy may occur when supplies for authority and responsibil-ity fulfill their corresponding values, which would contribute to well-being.Second, wanting and attaining high levels of autonomy may itself constitutea supply for values regarding accomplishment and adjustment. These two
WORK AND FAMILY STRESS 93
explanations derive from our general discussion of the potential improvementsin well-being associated with high supplies and values. A third explanation,specific to autonomy, is that people may value autonomy because it allowsthem to freely allocate time and resources to meet pressing demands. Thus,high values and supplies for autonomy may serve as proxies for high demandsand control, respectively. Research has shown that high demands coupled withhigh control enable the person to cope successfully with challenging situations,leading to satisfaction and growth (Karasek & Theorell, 1990). In sum:
HYPOTHESIS 1B: For autonomy, well-being will be higher when supplies and values are bothhigh than when both are low.
Relationships. The second dimension is relationships, which refer to per-sonal connections with other people (Baumeister & Leary, 1995). Humans havean inherent motive to establish and maintain relationships with others(Alderfer, 1972; Baumeister & Leary, 1995; Ryff & Keyes, 1995), and this motiveapplies to relationships at work (Smith, Kendall, & Hulin, 1969) and withfamily members (Demo & Acock, 1996; Piotrkowski, Rapoport, & Rapoport,1987). Relationships also play a dominant role in stress research, which hasexamined how relationships may enhance well-being directly and by providingsocial support that facilitates coping with stress (Cohen & Wills, 1985; House,Landis, & Umberson, 1988).
For relationships, increases in supplies toward values signify the attainmentof desired connections with others, which should improve well-being (House etal., 1988). Excess supplies for relationships are probably subject to conservationrather than depletion, because connections that are stronger than desired inthe present may be maintained as social resources for the future (Bosse, Aldwin,Levenson, & Spiro, 1993; Francis, 1990; Kahn & Antonucci, 1980). Excessrelationships may produce interference by intruding on privacy (Harrison,1978) or by inhibiting work on tasks that require concentration and solitude.However, these problems will probably be more than offset by the benefits ofcarryover, because excess relationship supplies provide a base of social supportfrom which the person may draw to resolve S-V misfit on various dimensions(Cohen & Wills, 1985; Holahan & Moos, 1987; House et al., 1988). This assertionis consistent with studies showing a positive relationship between social sup-port and coping efficacy (Holahan & Moos, 1987). In combination, these effectssuggest the following hypothesis:
HYPOTHESIS 2A: For relationships, well-being will increase as supplies increase toward valuesand will continue to increase as supplies exceed values.
High relationship supplies and values should be associated with greaterwell-being than low supplies and values, for two reasons. First, as noted above,high supplies for relationships indicate the availability of social support, whichmay facilitate coping with a range of stressors, thereby improving well-being.Second, wanting and attaining strong connections with others suggests that

94 EDWARDS AND ROTHBARD
the person has achieved ambitious goals regarding friendship and social inte-gration. Achieving these goals may itself constitute a supply for values regard-ing competence in social situations (Schneider, Ackerman, & Kanfer, 1996).Hence:
HYPOTHESIS 2B: For relationships, well-being will be higher when supplies and values areboth high than when both are low.
Security. The third dimension is security, meaning the belief that member-ship in a role is stable and likely to continue (Schwartz, 1994). Like autonomyand relationships, security is a basic human motive (Bolton, 1980; Schwartz,1994), and studies show that security of work and family roles is integralto well-being and functioning in both domains (Barling & Macewen, 1992;Kuhnert & Palmer, 1991; Larson, Wilson, & Beley, 1994; Piotrkowski et al.,1987; Roskies & Louis-Geurin, 1990).
Well-being should improve as supplies for security increase toward values,because too little security implies an intolerable level of uncertainty, and resolv-ing this uncertainty should reduce anxiety and improve health (Kuhnert &Palmer, 1991; S. M. Miller, 1981; Roskies & Louis-Geurin, 1990). Excess secu-rity is probably not subject to conservation or depletion, because security mayfluctuate due to economic and social forces that are independent of the levelof security a person had in the past (Shaw & Barrett-Power, 1997). Thesefluctuations probably have greater effects on work security than on familysecurity, because work security hinges on transactional agreements that aremore mutable than blood relationships and legal ties among family members.Excess security should not interfere with S-V fit on other dimensions, becausesecurity can be voluntarily drawn upon only as needed. However, excess secu-rity may create carryover by permitting the person to confidently express ideasand take risks. Overall, this reasoning suggests that excess security shouldincrease well-being. However, we believe this increase will be smaller thanthat associated with resolving insufficient security, based on the assumptionthat the threat of too little security is more extreme than the potential benefitsof too much security. Consequently:
HYPOTHESIS 3A: For security, well-being will increase as supplies increase toward values andwill continue to increase as supplies exceed values, although to a smaller degree.
High supplies and values for security should be associated with greater well-being than low supplies and values, for two reasons. First, high supplies forsecurity may result from effective role performance, assuming the stability ofone’s role is partly contingent upon meeting the demands of that role. Effectiverole performance may bring additional contingent rewards that help fulfillvalues on a variety of dimensions, thereby enhancing well-being. Second, ifsecurity increases with role performance, then wanting and attaining a highdegree of security implies that the person has met high standards of roleperformance. Meeting these high standards may itself constitute a supply forachievement and competence (White, 1959). Hence:
HYPOTHESIS 3B: For security, well-being will be higher when supplies and values are bothhigh than when both are low.

WORK AND FAMILY STRESS 95
Segmentation. The fourth dimension is segmentation, or the degree to whichwork and family are separated or insulated from one another (Lambert, 1990;Zedeck, 1992). Segmentation is not an inherent barrier between work andfamily (Blood & Wolfe, 1960) but instead results from active efforts of theperson to manage the boundary between work and family (Eckenrode & Gore,1990; Lambert, 1990). Segmentation is central to research on the work–familyinterface (Burke & Greenglass, 1987; Lambert, 1990; Zedeck, 1992) and hasbeen identified as an important human value (Pryor, 1983, 1987). Segmentationis relevant to research on stress and well-being, as it enables the person tosuppress the transfer of stressful experiences between work and family (Ecken-rode & Gore, 1990; Lambert, 1990).
For segmentation, an increase in supplies toward values helps the personmaintain a desired boundary between work and family (Burke & Greenglass,1987; Greenhaus & Beutell, 1985; Lambert, 1990), which should improve well-being. Excess segmentation can be conserved if it prompts others to adjust thedemands they place on the person. For example, an employee without childrenmay unilaterally refuse to take work calls at home, even when such calls wouldnot be disruptive. This pattern may reduce the likelihood that work will intrudeon family time if the employee ultimately has children. Conversely, excesssegmentation can be depleted if it rests on the good will of others. For instance,an employee with no pressing deadlines at work may nonetheless refuse to letfamily concerns intrude on work time. This behavior may exhaust the patienceand grace of family members, who may subsequently demand greater attentionfrom the employee irrespective of his or her workload. Excess segmentationmay produce carryover by allowing prolonged, uninterrupted focus on the vari-ous role demands within a domain. However, these benefits may be offset byinterference, in that excess segmentation may prevent the person from knowingwhether problems have emerged in the other domain (S. M. Miller, 1981). Forexample, during international travel an employee may be out of contact withfamily members and worry about their safety and well-being. Excess segmenta-tion may also prevent the integration of work and family into a coherent viewof life as a whole (Beutell & Greenhaus, 1983; Sekaran, 1983). In combination,these arguments yield the following hypothesis:
HYPOTHESIS 4A: For segmentation, well-being will increase steeply as supplies increase towardvalues and will gradually decrease as supplies exceed values.
High supplies and values for segmentation will lead to the same level ofwell-being as low supplies and values, due to two countervailing effects.First, when segmentation supplies and values are both high, the personhas achieved an ambitious goal regarding the separation between work andfamily. On the other hand, when segmentation supplies and values are bothlow, the person has achieved an ambitious goal regarding the integrationof work and family. These effects should offset one another, producing novariation in well-being as supplies and values for segmentation jointlyincrease or decrease. Consequently:
96 EDWARDS AND ROTHBARD
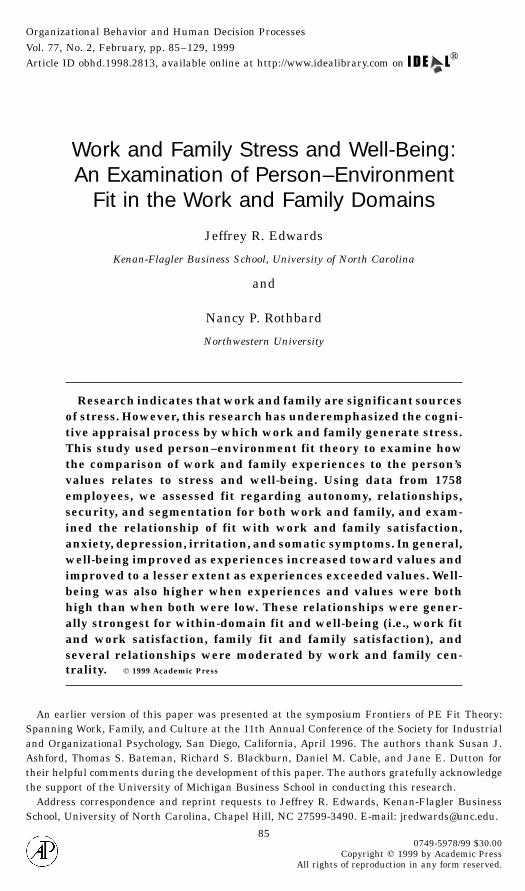
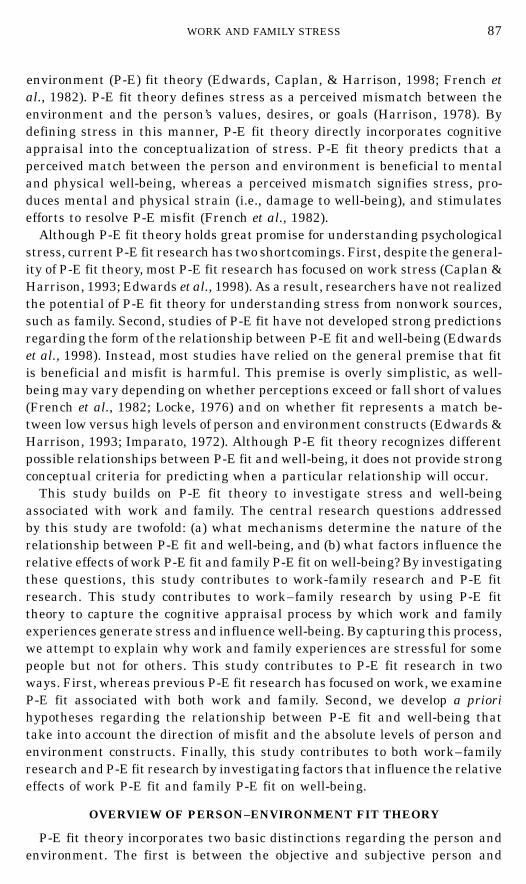
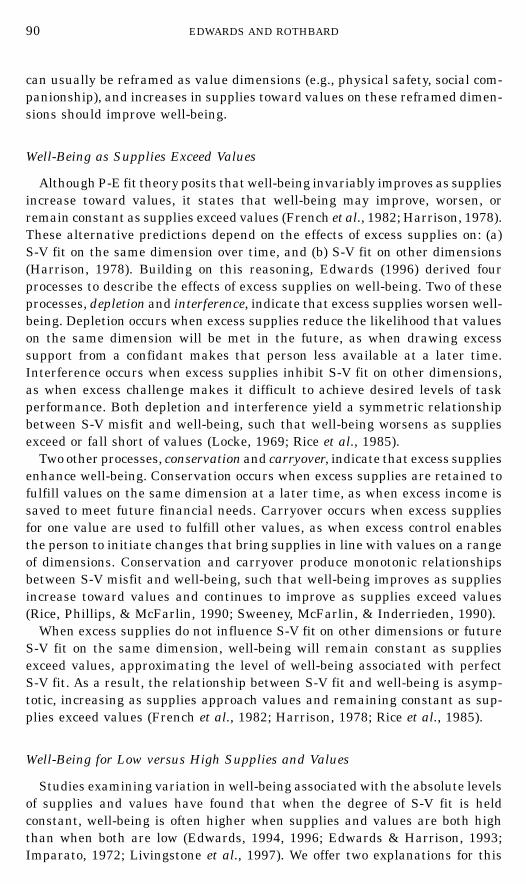
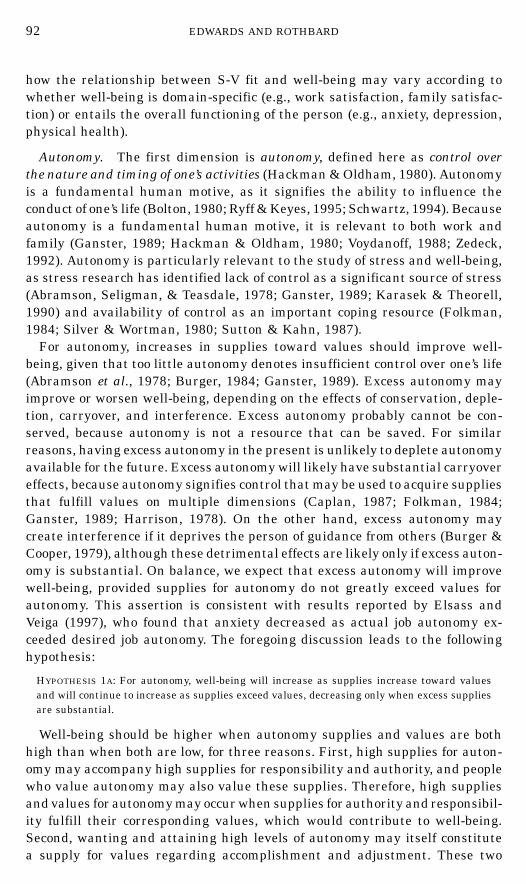
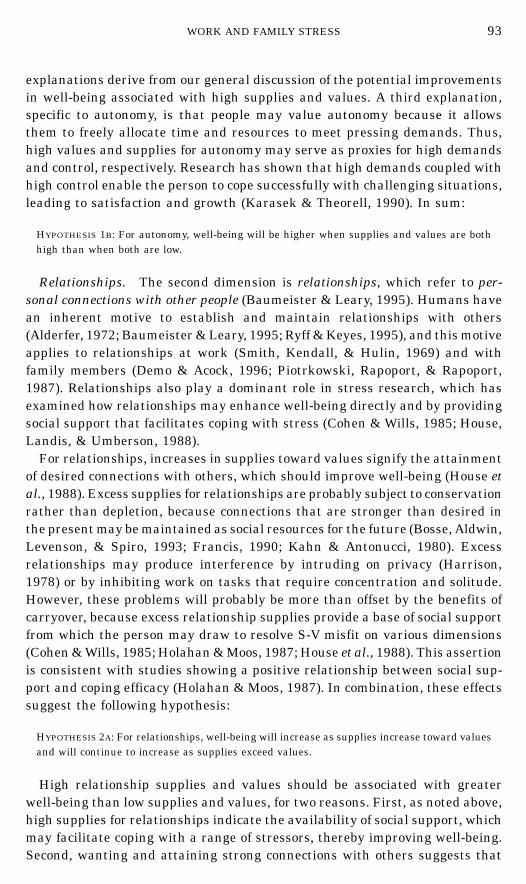
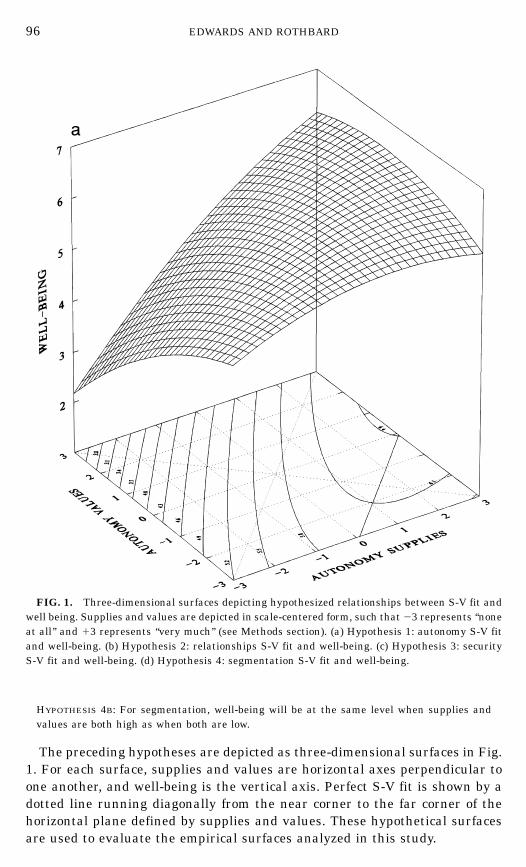
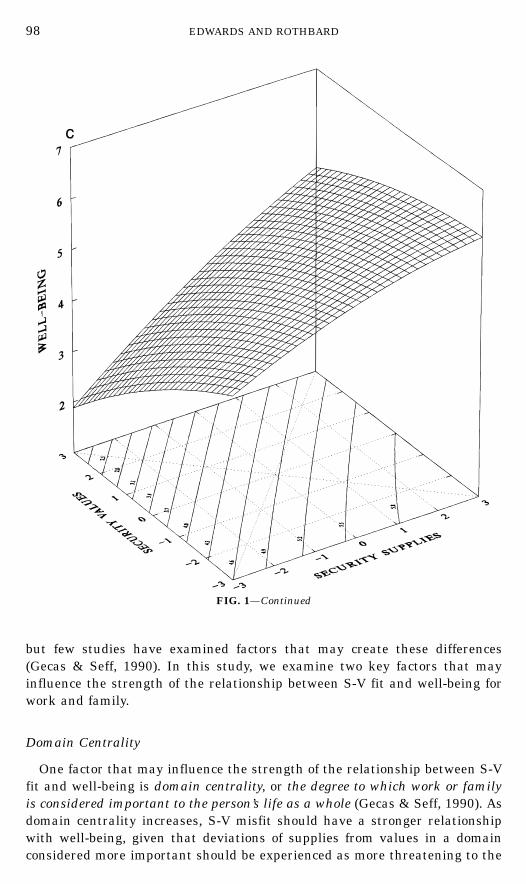
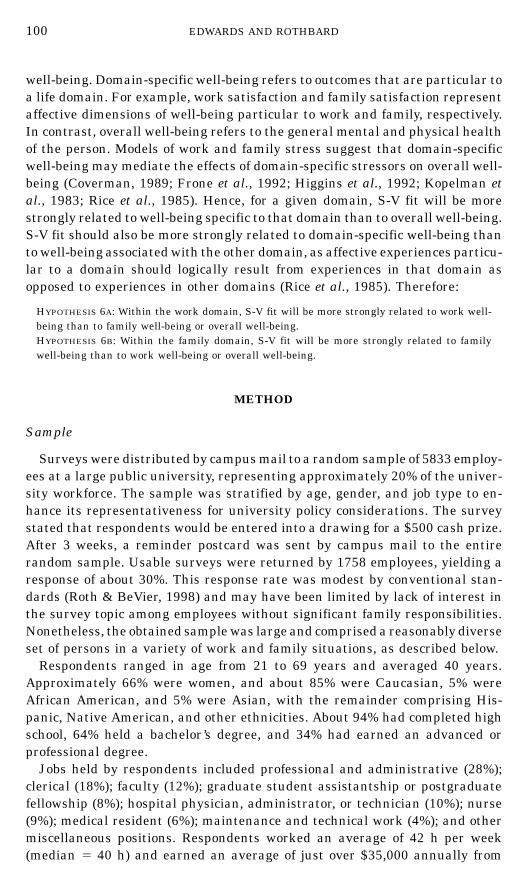
FIG. 1. Three-dimensional surfaces depicting hypothesized relationships between S-V fit andwell being. Supplies and values are depicted in scale-centered form, such that 23 represents ‘‘noneat all’’ and 13 represents ‘‘very much’’ (see Methods section). (a) Hypothesis 1: autonomy S-V fitand well-being. (b) Hypothesis 2: relationships S-V fit and well-being. (c) Hypothesis 3: securityS-V fit and well-being. (d) Hypothesis 4: segmentation S-V fit and well-being.
HYPOTHESIS 4B: For segmentation, well-being will be at the same level when supplies andvalues are both high as when both are low.
The preceding hypotheses are depicted as three-dimensional surfaces in Fig.1. For each surface, supplies and values are horizontal axes perpendicular toone another, and well-being is the vertical axis. Perfect S-V fit is shown by adotted line running diagonally from the near corner to the far corner of thehorizontal plane defined by supplies and values. These hypothetical surfacesare used to evaluate the empirical surfaces analyzed in this study.

WORK AND FAMILY STRESS 97
FIG. 1—Continued
RELATIVE EFFECTS OF WORK AND FAMILY SUPPLIES–VALUES FITON DOMAIN-SPECIFIC AND OVERALL WELL-BEING
Thus far, we have discussed relationships between S-V fit and well-beingthat apply to both work and family. This parallel structure underscores thepremise that, as a process theory, P-E fit theory applies to stress in all lifedomains, including work and family. This structure also allows us to examinewhether work S-V fit or family S-V fit exhibits a stronger relationship withwell-being, holding constant the substantive content of the S-V dimension(Kabanoff, 1980; Zedeck, 1992). Previous studies have reported differences inthe relationships of work and family stressors with well-being (e.g., Berger-maier, Borg, & Champoux, 1984; Klitzman, House, Israel, & Mero, 1990; Kopel-man et al., 1983; Parasuraman, Greenhaus, & Granrose, 1992; Rousseau, 1978),
98 EDWARDS AND ROTHBARD
FIG. 1—Continued
but few studies have examined factors that may create these differences(Gecas & Seff, 1990). In this study, we examine two key factors that mayinfluence the strength of the relationship between S-V fit and well-being forwork and family.
Domain Centrality
One factor that may influence the strength of the relationship between S-Vfit and well-being is domain centrality, or the degree to which work or familyis considered important to the person’s life as a whole (Gecas & Seff, 1990). Asdomain centrality increases, S-V misfit should have a stronger relationshipwith well-being, given that deviations of supplies from values in a domainconsidered more important should be experienced as more threatening to the

WORK AND FAMILY STRESS 99
FIG. 1—Continued
person’s overall self-esteem (Gecas & Seff, 1990; Locke, 1976; Mobley & Locke,1970; Rice et al., 1985). Thus, we view domain centrality as a moderator thatintensifies the relationship between S-V fit and well-being, increasing theslopes of the surfaces shown in Fig. 1. Therefore:
HYPOTHESIS 5A: As work centrality increases, the relationship between work S-V fit and well-being will become stronger.HYPOTHESIS 5B: As family centrality increases, the relationship between family S-V fit andwell-being will become stronger.
Domain-Specific Well-Being versus Overall Well-Being
A second factor that may influence the strength of the relationship of S-Vfit with well-being entails the distinction between domain-specific and overall
100 EDWARDS AND ROTHBARD
well-being. Domain-specific well-being refers to outcomes that are particular toa life domain. For example, work satisfaction and family satisfaction representaffective dimensions of well-being particular to work and family, respectively.In contrast, overall well-being refers to the general mental and physical healthof the person. Models of work and family stress suggest that domain-specificwell-being may mediate the effects of domain-specific stressors on overall well-being (Coverman, 1989; Frone et al., 1992; Higgins et al., 1992; Kopelman etal., 1983; Rice et al., 1985). Hence, for a given domain, S-V fit will be morestrongly related to well-being specific to that domain than to overall well-being.S-V fit should also be more strongly related to domain-specific well-being thanto well-being associated with the other domain, as affective experiences particu-lar to a domain should logically result from experiences in that domain asopposed to experiences in other domains (Rice et al., 1985). Therefore:
HYPOTHESIS 6A: Within the work domain, S-V fit will be more strongly related to work well-being than to family well-being or overall well-being.HYPOTHESIS 6B: Within the family domain, S-V fit will be more strongly related to familywell-being than to work well-being or overall well-being.
METHOD
Sample
Surveys were distributed by campus mail to a random sample of 5833 employ-ees at a large public university, representing approximately 20% of the univer-sity workforce. The sample was stratified by age, gender, and job type to en-hance its representativeness for university policy considerations. The surveystated that respondents would be entered into a drawing for a $500 cash prize.After 3 weeks, a reminder postcard was sent by campus mail to the entirerandom sample. Usable surveys were returned by 1758 employees, yielding aresponse of about 30%. This response rate was modest by conventional stan-dards (Roth & BeVier, 1998) and may have been limited by lack of interest inthe survey topic among employees without significant family responsibilities.Nonetheless, the obtained sample was large and comprised a reasonably diverseset of persons in a variety of work and family situations, as described below.
Respondents ranged in age from 21 to 69 years and averaged 40 years.Approximately 66% were women, and about 85% were Caucasian, 5% wereAfrican American, and 5% were Asian, with the remainder comprising His-panic, Native American, and other ethnicities. About 94% had completed highschool, 64% held a bachelor’s degree, and 34% had earned an advanced orprofessional degree.
Jobs held by respondents included professional and administrative (28%);clerical (18%); faculty (12%); graduate student assistantship or postgraduatefellowship (8%); hospital physician, administrator, or technician (10%); nurse(9%); medical resident (6%); maintenance and technical work (4%); and othermiscellaneous positions. Respondents worked an average of 42 h per week(median 5 40 h) and earned an average of just over $35,000 annually from

WORK AND FAMILY STRESS 101
their primary employer (median annual salary 5 $25,000). Total householdincome for respondents averaged slightly over $64,000 (median annual house-hold income 5 $55,000).
Marital status of respondents was 65% married, 7% living with a domesticpartner, 9% separated or divorced, 1% widowed, and 17% single. About 60%of respondents had at least one child, and for these respondents, the mediannumber of children was 2. In addition, nearly 30% of respondents had at leastone dependent parent, in-law, or other relative. Overall, 75% of respondentshad at least one child or dependent relative, and of the remaining respondents,over half were married or living with a domestic partner.
The representativeness of the sample was evaluated relative to the universityworkforce and the working population in the United States. Compared to theuniversity workforce, the sample did not differ in average age but had a higherproportion of women (66% versus 58%), relatively more clerical and administra-tive employees, and relatively fewer faculty, graduate student assistants, andmaintenance workers. Compared to the U.S. working population (U.S. Bureauof the Census, 1996), the sample was about 3 years younger; contained agreater proportion of women, Caucasians, and Asians; and had higher levelsof education and income. With regard to job type, the sample had relativelymore professional, administrative, technical, and clerical jobs and fewer manu-facturing, transportation, and manual labor jobs. In terms of family status,the sample contained relatively more married and fewer single persons, al-though the median number of children in the sample (i.e., 2) was equal to thenational median. These differences are not surprising, given the focus of thestudy on work–family issues and the organization and geographic region inwhich the study was conducted.
Measures
Respondents completed measures of supplies and values for autonomy, rela-tionships, security, and segmentation for work and family. Each measure con-tained 4 items, yielding 64 supply and value items in all (i.e., 4 items each for4 supplies and 4 values for work and family). Items were drawn from theindependence, relationships, security, and detachment scales of the Work As-pect Preference Scale (Pryor, 1983). These scales have shown good psychometricproperties in previous research (Bagozzi & Edwards, 1998; Macnab & Fitzsim-mons, 1987; Pryor, 1987). Items from these scales were modified to solicitratings of supplies (i.e., actual amount) and values (i.e., acceptable amount)for work and family. Values were rated in terms of acceptable rather than idealamount to avoid ceiling effects (Locke, 1969). All items were rated on a 7-pointscale ranging from “none at all” to “very much,” and these ratings were averagedto create supplies and values scores ranging from 1 to 7. Prior to quadraticregression analysis (see below), supplies and values measures were scale cen-tered by subtracting the scale midpoint (i.e., 4) to reduce multicollinearity andfacilitate interpretation (Edwards, 1994).
102 EDWARDS AND ROTHBARD
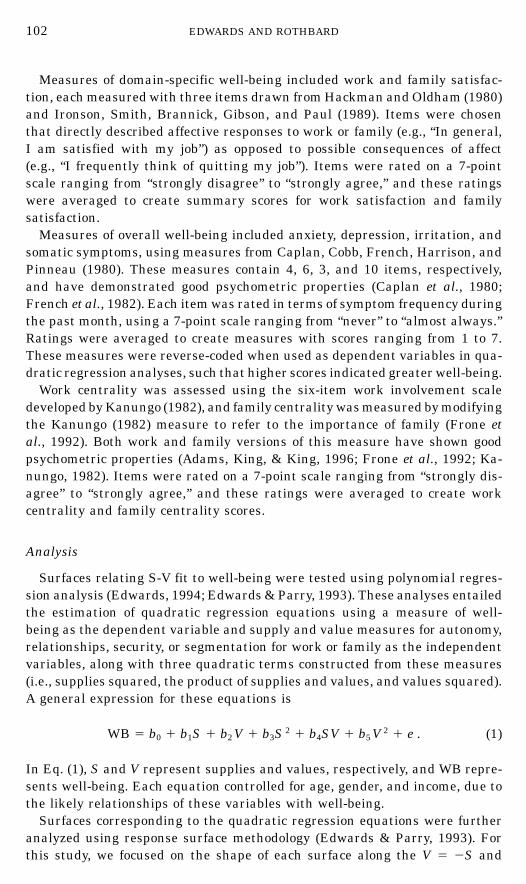
Measures of domain-specific well-being included work and family satisfac-tion, each measured with three items drawn from Hackman and Oldham (1980)and Ironson, Smith, Brannick, Gibson, and Paul (1989). Items were chosenthat directly described affective responses to work or family (e.g., “In general,I am satisfied with my job”) as opposed to possible consequences of affect(e.g., “I frequently think of quitting my job”). Items were rated on a 7-pointscale ranging from “strongly disagree” to “strongly agree,” and these ratingswere averaged to create summary scores for work satisfaction and familysatisfaction.
Measures of overall well-being included anxiety, depression, irritation, andsomatic symptoms, using measures from Caplan, Cobb, French, Harrison, andPinneau (1980). These measures contain 4, 6, 3, and 10 items, respectively,and have demonstrated good psychometric properties (Caplan et al., 1980;French et al., 1982). Each item was rated in terms of symptom frequency duringthe past month, using a 7-point scale ranging from “never” to “almost always.”Ratings were averaged to create measures with scores ranging from 1 to 7.These measures were reverse-coded when used as dependent variables in qua-dratic regression analyses, such that higher scores indicated greater well-being.
Work centrality was assessed using the six-item work involvement scaledeveloped by Kanungo (1982), and family centrality was measured by modifyingthe Kanungo (1982) measure to refer to the importance of family (Frone etal., 1992). Both work and family versions of this measure have shown goodpsychometric properties (Adams, King, & King, 1996; Frone et al., 1992; Ka-nungo, 1982). Items were rated on a 7-point scale ranging from “strongly dis-agree” to “strongly agree,” and these ratings were averaged to create workcentrality and family centrality scores.
Analysis
Surfaces relating S-V fit to well-being were tested using polynomial regres-sion analysis (Edwards, 1994; Edwards & Parry, 1993). These analyses entailedthe estimation of quadratic regression equations using a measure of well-being as the dependent variable and supply and value measures for autonomy,relationships, security, or segmentation for work or family as the independentvariables, along with three quadratic terms constructed from these measures(i.e., supplies squared, the product of supplies and values, and values squared).A general expression for these equations is
WB 5 b0 1 b1S 1 b2V 1 b3S 2 1 b4SV 1 b5V 2 1 e . (1)
In Eq. (1), S and V represent supplies and values, respectively, and WB repre-sents well-being. Each equation controlled for age, gender, and income, due tothe likely relationships of these variables with well-being.
Surfaces corresponding to the quadratic regression equations were furtheranalyzed using response surface methodology (Edwards & Parry, 1993). Forthis study, we focused on the shape of each surface along the V 5 2S and
WORK AND FAMILY STRESS 103
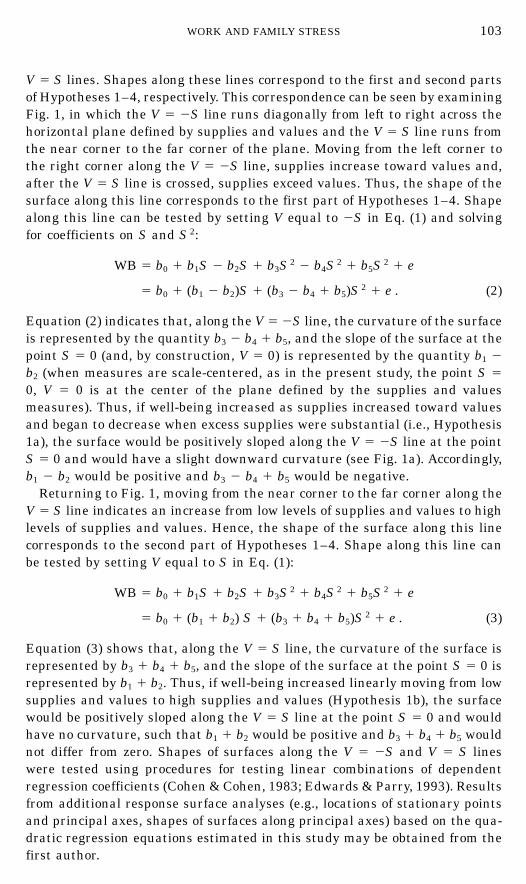
V 5 S lines. Shapes along these lines correspond to the first and second partsof Hypotheses 1–4, respectively. This correspondence can be seen by examiningFig. 1, in which the V 5 2S line runs diagonally from left to right across thehorizontal plane defined by supplies and values and the V 5 S line runs fromthe near corner to the far corner of the plane. Moving from the left corner tothe right corner along the V 5 2S line, supplies increase toward values and,after the V 5 S line is crossed, supplies exceed values. Thus, the shape of thesurface along this line corresponds to the first part of Hypotheses 1–4. Shapealong this line can be tested by setting V equal to 2S in Eq. (1) and solvingfor coefficients on S and S 2:
WB 5 b0 1 b1S 2 b2S 1 b3S 2 2 b4S 2 1 b5S 2 1 e
5 b0 1 (b1 2 b2)S 1 (b3 2 b4 1 b5)S 2 1 e . (2)
Equation (2) indicates that, along the V 5 2S line, the curvature of the surfaceis represented by the quantity b3 2 b4 1 b5, and the slope of the surface at thepoint S 5 0 (and, by construction, V 5 0) is represented by the quantity b1 2
b2 (when measures are scale-centered, as in the present study, the point S 5
0, V 5 0 is at the center of the plane defined by the supplies and valuesmeasures). Thus, if well-being increased as supplies increased toward valuesand began to decrease when excess supplies were substantial (i.e., Hypothesis1a), the surface would be positively sloped along the V 5 2S line at the pointS 5 0 and would have a slight downward curvature (see Fig. 1a). Accordingly,b1 2 b2 would be positive and b3 2 b4 1 b5 would be negative.
Returning to Fig. 1, moving from the near corner to the far corner along theV 5 S line indicates an increase from low levels of supplies and values to highlevels of supplies and values. Hence, the shape of the surface along this linecorresponds to the second part of Hypotheses 1–4. Shape along this line canbe tested by setting V equal to S in Eq. (1):
WB 5 b0 1 b1S 1 b2S 1 b3S 2 1 b4S 2 1 b5S 2 1 e
5 b0 1 (b1 1 b2) S 1 (b3 1 b4 1 b5)S 2 1 e . (3)
Equation (3) shows that, along the V 5 S line, the curvature of the surface isrepresented by b3 1 b4 1 b5, and the slope of the surface at the point S 5 0 isrepresented by b1 1 b2. Thus, if well-being increased linearly moving from lowsupplies and values to high supplies and values (Hypothesis 1b), the surfacewould be positively sloped along the V 5 S line at the point S 5 0 and wouldhave no curvature, such that b1 1 b2 would be positive and b3 1 b4 1 b5 wouldnot differ from zero. Shapes of surfaces along the V 5 2S and V 5 S lineswere tested using procedures for testing linear combinations of dependentregression coefficients (Cohen & Cohen, 1983; Edwards & Parry, 1993). Resultsfrom additional response surface analyses (e.g., locations of stationary pointsand principal axes, shapes of surfaces along principal axes) based on the qua-dratic regression equations estimated in this study may be obtained from thefirst author.

104 EDWARDS AND ROTHBARD
Testing moderator effects of work and family centrality. Hierarchical regres-sion analysis (Cohen & Cohen, 1983) was used to test the moderating effectsof work centrality and family centrality on the relationship between S-V fitand well-being. For each quadratic equation, the five terms were multipliedby work centrality or family centrality (depending on the domain under analy-sis), and the increment in R 2 yielded by these terms was tested, controllingfor centrality, the original five quadratic terms, and age, gender, and income.If the increment in R 2 was statistically significant, coefficients from the equa-tion were used to determine whether centrality intensified the effects of S-Vmisfit on well-being, as predicted by Hypothesis 5.
Comparing the relationship between S-V fit and well-being within and acrossdomains. Multivariate multiple regression analyses (Dwyer, 1983) were usedto examine the relationship between S-V fit and all six measures of well-beingas a set. We adapted procedures for testing dependent correlations (Steiger,1980; Tabachnick & Fidell, 1989) to compare the variance explained by thefive quadratic terms, controlling for age, gender, and income. Analyses focusedon whether the increment in variance explained in within-domain satisfactionwas greater than the increment explained in satisfaction with the other domainand in measures of overall well-being, pertaining to Hypothesis 6.
Treatment of missing data. Although listwise deletion of observations withmissing data is common in organizational research, this procedure is inferiorto methods that impute values for missing observations (Little & Rubin, 1987;Roth, 1994). However, imputed values become less dependable as the proportionof missing data increases. To reduce problems with listwise deletion and, atthe same time, limit the number of imputed values, we identified respondentswith a single missing item on any measure and substituted the mean of theremaining items for that respondent for the missing value. This procedureincreased sample size by about 3% relative to the sample size that would havebeen produced by listwise deletion.
Screening data for outliers and influential observations. Influential obser-vations are those that have a demonstrably greater impact on parameter esti-mates than most other observations (Belsley, Kuh, & Welsch, 1980). Influentialobservations can unduly affect results from quadratic regression equationsand analyses of response surfaces. Therefore, each equation was screened foroutliers and influential observations using leverage (i.e., the diagonal valuesof the hat matrix), studentized residuals, and Cook’s D statistic (Belsley et al.,1980; Fox, 1991) as criteria. Observations that exceeded the minimum cutoffon all three criteria (Bollen & Jackman, 1990) and were clearly discrepanton plots that combined these criteria were dropped from the equation. Thisprocedure was conservative, affecting no more than 17 observations per equa-tion, or less than 1% of the sample used in each analysis.
Controlling Type I error. Each hypothesis regarding the relationship be-tween S-V fit and well-being (i.e., Hypotheses 1–4) was tested for both workand family and for both domain-specific and overall well-being, yielding 10

WORK AND FAMILY STRESS 105
regression analyses in all. To control the risk of Type I error associated withthese analyses, we used the sequential Bonferroni procedure (Holm, 1979;Seaman, Levin, & Serlin, 1991). This procedure requires the researcher todefine the family of tests for which Type I error is controlled. For our purposes,a family comprised the tests of the R 2 values from the 10 regression equationsfor each hypothesis (Hochberg & Tamhane, 1987; R. G. Miller, 1981). For eachfamily of tests, the obtained probability levels were listed in ascending order.The first (i.e., smallest) probability was multiplied by the total number of tests(i.e., 10), the second probability was multiplied by the number of remainingtests (i.e., 9), and so forth until all probabilities were corrected. For each R 2
value that reached significance, coefficients from the equation were tested usingthe nominal alpha level (i.e., .05). This procedure struck a balance between TypeI and Type II error by considering only those equations that reached significanceat the required familywise alpha while testing the coefficients from thoseequations in the usual manner. Probabilities were also corrected for tests ofthe R 2 from regression equations containing centrality, with families definedin the same manner.
RESULTS
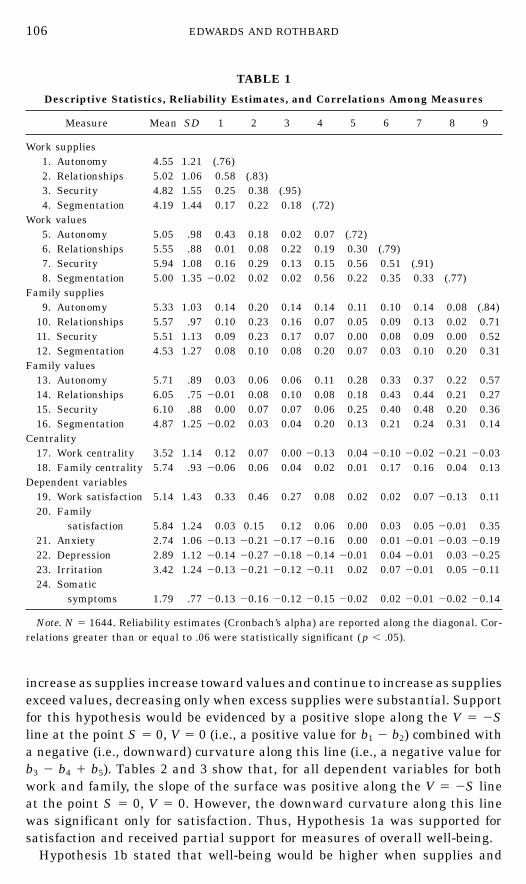
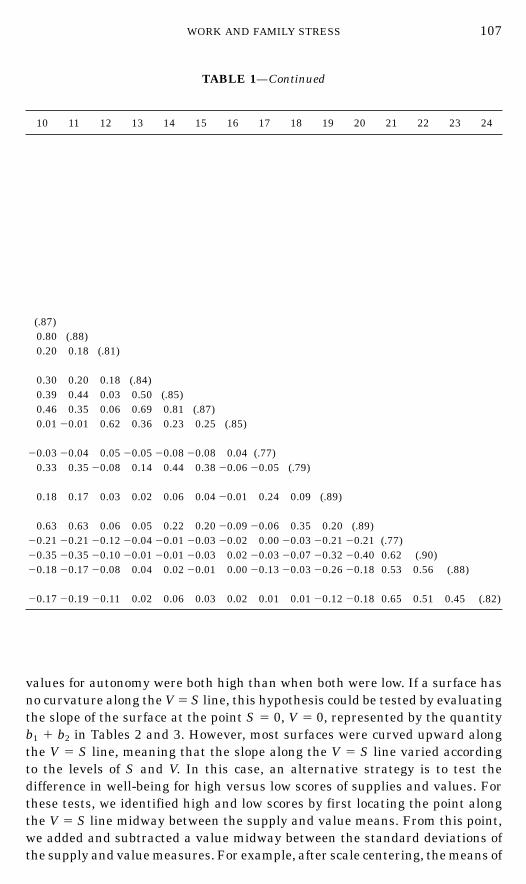
Descriptive statistics, reliability estimates, and correlations for all measuresare reported in Table 1. Means for all values measures were higher thantheir corresponding supplies measures, suggesting that respondents generallywanted more of these dimensions than they currently had. However, for eachdimension, bivariate distributions of supplies and values scores showed gooddispersion on either side of the line of perfect S-V fit, thereby permittingmeaningful tests of fit hypotheses. The mean for family centrality was notablyhigher than the mean for work centrality, indicating that respondents generallyfelt that family was more important than work. Well-being among respondentswas moderately high, as evidenced by fairly high means for work and familysatisfaction and low means for anxiety, depression, irritation, and somaticsymptoms. Reliability estimates ranged from .72 to .95, with a median of .84.Thus, all estimates exceeded the .70 criterion suggested by Nunnally (1978) andwere considered acceptable. Correlations among supplies and values measureswithin the work and family domains were positive and generally moderate inmagnitude. However, for family, relationships and security measures werehighly correlated, suggesting that family security was conceived primarily interms of the quality of relationships with family members. Consistent withprior research (Caplan et al., 1980), anxiety, depression, irritation, and somaticsymptoms were positively correlated with one another and negatively corre-lated with both satisfaction measures.
Relationship between S-V Fit and Well-Being
Analyses of surfaces pertaining to Hypotheses 1–4 are reported in Tables 2and 3. Recall that Hypothesis 1a predicted that, for autonomy, well-being would
106 EDWARDS AND ROTHBARD
TABLE 1
Descriptive Statistics, Reliability Estimates, and Correlations Among Measures
Measure Mean SD 1 2 3 4 5 6 7 8 9
Work supplies1. Autonomy 4.55 1.21 (.76)2. Relationships 5.02 1.06 0.58 (.83)3. Security 4.82 1.55 0.25 0.38 (.95)4. Segmentation 4.19 1.44 0.17 0.22 0.18 (.72)
Work values5. Autonomy 5.05 .98 0.43 0.18 0.02 0.07 (.72)6. Relationships 5.55 .88 0.01 0.08 0.22 0.19 0.30 (.79)7. Security 5.94 1.08 0.16 0.29 0.13 0.15 0.56 0.51 (.91)8. Segmentation 5.00 1.35 20.02 0.02 0.02 0.56 0.22 0.35 0.33 (.77)
Family supplies9. Autonomy 5.33 1.03 0.14 0.20 0.14 0.14 0.11 0.10 0.14 0.08 (.84)
10. Relationships 5.57 .97 0.10 0.23 0.16 0.07 0.05 0.09 0.13 0.02 0.7111. Security 5.51 1.13 0.09 0.23 0.17 0.07 0.00 0.08 0.09 0.00 0.5212. Segmentation 4.53 1.27 0.08 0.10 0.08 0.20 0.07 0.03 0.10 0.20 0.31
Family values13. Autonomy 5.71 .89 0.03 0.06 0.06 0.11 0.28 0.33 0.37 0.22 0.5714. Relationships 6.05 .75 20.01 0.08 0.10 0.08 0.18 0.43 0.44 0.21 0.2715. Security 6.10 .88 0.00 0.07 0.07 0.06 0.25 0.40 0.48 0.20 0.3616. Segmentation 4.87 1.25 20.02 0.03 0.04 0.20 0.13 0.21 0.24 0.31 0.14
Centrality17. Work centrality 3.52 1.14 0.12 0.07 0.00 20.13 0.04 20.10 20.02 20.21 20.0318. Family centrality 5.74 .93 20.06 0.06 0.04 0.02 0.01 0.17 0.16 0.04 0.13
Dependent variables19. Work satisfaction 5.14 1.43 0.33 0.46 0.27 0.08 0.02 0.02 0.07 20.13 0.1120. Family
satisfaction 5.84 1.24 0.03 0.15 0.12 0.06 0.00 0.03 0.05 20.01 0.3521. Anxiety 2.74 1.06 20.13 20.21 20.17 20.16 0.00 0.01 20.01 20.03 20.1922. Depression 2.89 1.12 20.14 20.27 20.18 20.14 20.01 0.04 20.01 0.03 20.2523. Irritation 3.42 1.24 20.13 20.21 20.12 20.11 0.02 0.07 20.01 0.05 20.1124. Somatic
symptoms 1.79 .77 20.13 20.16 20.12 20.15 20.02 0.02 20.01 20.02 20.14
Note. N 5 1644. Reliability estimates (Cronbach’s alpha) are reported along the diagonal. Cor-relations greater than or equal to .06 were statistically significant ( p , .05).
increase as supplies increase toward values and continue to increase as suppliesexceed values, decreasing only when excess supplies were substantial. Supportfor this hypothesis would be evidenced by a positive slope along the V 5 2Sline at the point S 5 0, V 5 0 (i.e., a positive value for b1 2 b2) combined witha negative (i.e., downward) curvature along this line (i.e., a negative value forb3 2 b4 1 b5). Tables 2 and 3 show that, for all dependent variables for bothwork and family, the slope of the surface was positive along the V 5 2S lineat the point S 5 0, V 5 0. However, the downward curvature along this linewas significant only for satisfaction. Thus, Hypothesis 1a was supported forsatisfaction and received partial support for measures of overall well-being.
Hypothesis 1b stated that well-being would be higher when supplies and
WORK AND FAMILY STRESS 107
TABLE 1—Continued
10 11 12 13 14 15 16 17 18 19 20 21 22 23 24
(.87)0.80 (.88)0.20 0.18 (.81)
0.30 0.20 0.18 (.84)0.39 0.44 0.03 0.50 (.85)0.46 0.35 0.06 0.69 0.81 (.87)0.01 20.01 0.62 0.36 0.23 0.25 (.85)
20.03 20.04 0.05 20.05 20.08 20.08 0.04 (.77)0.33 0.35 20.08 0.14 0.44 0.38 20.06 20.05 (.79)
0.18 0.17 0.03 0.02 0.06 0.04 20.01 0.24 0.09 (.89)
0.63 0.63 0.06 0.05 0.22 0.20 20.09 20.06 0.35 0.20 (.89)20.21 20.21 20.12 20.04 20.01 20.03 20.02 0.00 20.03 20.21 20.21 (.77)20.35 20.35 20.10 20.01 20.01 20.03 0.02 20.03 20.07 20.32 20.40 0.62 (.90)20.18 20.17 20.08 0.04 0.02 20.01 0.00 20.13 20.03 20.26 20.18 0.53 0.56 (.88)
20.17 20.19 20.11 0.02 0.06 0.03 0.02 0.01 0.01 20.12 20.18 0.65 0.51 0.45 (.82)
values for autonomy were both high than when both were low. If a surface hasno curvature along the V 5 S line, this hypothesis could be tested by evaluatingthe slope of the surface at the point S 5 0, V 5 0, represented by the quantityb1 1 b2 in Tables 2 and 3. However, most surfaces were curved upward alongthe V 5 S line, meaning that the slope along the V 5 S line varied accordingto the levels of S and V. In this case, an alternative strategy is to test thedifference in well-being for high versus low scores of supplies and values. Forthese tests, we identified high and low scores by first locating the point alongthe V 5 S line midway between the supply and value means. From this point,we added and subtracted a value midway between the standard deviations ofthe supply and value measures. For example, after scale centering, the means of
108E
DW
AR
DS
AN
DR
OT
HB
AR
D
TABLE 2
Results from Quadratic Regressions of Well-Being on Supplies and Values for Work
Results from quadratic regression controlling for age,gender, and income Shape along V 5 S line Shape along V 5 2S line
S V S 2 SV V 2 R 2 b1 1 b2 b3 1 b4 1 b5 b1 2 b2 b3 2 b4 1 b5
AutonomySatisfactionb .356*** 2.267*** 2.039* .108*** .001 .123*** .089a .070* .623*** 2.146*Anxiety .094* 2.128* .004 .034 .006 .023*** 2.034 .044* .222** 2.024Depressionb .069 2.136* .005 .075** .004 .031*** 2.067a .084** .205** 2.066Irritationb .098* 2.215** 2.034 .090** .024 .033*** 2.117 .080** .313*** 2.100Somatic symptoms .074** 2.106** 2.005 .012 .026 .017*** 2.032 .033* .180** .009
RelationshipsSatisfaction .587*** 2.113 2.028 .070* 2.026 .220*** .474a,*** .016 .700*** 2.124*Anxiety .216*** 2.113 2.019 .032 .015 .053*** .103a .028 .329** 2.036Depression .250*** 2.124 2.023 .066* 2.006 .084*** .126a .037 .374*** 2.095Irritationb .235*** 2.163 2.071** .109** .006 .070*** .072a .044 .398** 2.174**Somatic symptoms .102** 2.037 2.008 .020 2.002 .028*** .065a .010 .139* 2.030
SecuritySatisfaction .235*** 2.142* .003 .006 .033 .067*** .093a .042 .377*** .030Anxiety .085* 2.085 .005 .018 .006 .035*** .000a .029 .170 2.007Depression .102** 2.092 2.011 .022 .003 .037*** .010 .014 .194* 2.030Irritation .054 2.131* 2.014 .040* .002 .030*** 2.077 .028 .185* 2.052Somatic symptoms .043 2.032 .007 .005 2.002 .015*** .011 .010 .075 .000
SegmentationSatisfaction .169*** 2.199*** .000 .037 2.033 .045*** 2.030 .004 .368*** 2.070Anxiety .129*** 2.050 2.009 .038 2.020 .041*** .079a,** .009 .179** 2.067Depression .107** 2.065 2.009 .049* 2.024 .035*** .042a .016 .172** 2.082*Irritationb .083* 2.068 2.032* .069** 2.029 .033*** .015 .008 .151*** 2.130*Somatic symptoms .056* .004 .002 .025 2.022* .024*** .060a,** .005 .052 2.045
Note. N ranged from 1627 to 1665. For columns labeled S, V, S 2, SV, and V 2, table entries are unstandardized regression coefficients for equations with allpredictors entered simultaneously (S 5 supplies, V 5 values). The column labeled R 2 indicates the variance explained by the five quadratic terms, controlling forage, gender, and income. Columns labeled b1 1 b2 and b3 1 b4 1 b5 represent the slope of each surface along the V 5 S line, and columns labeled b1 2 b2 andb3 2 b4 1 b5 represent the slope of each surface along the V 5 S line (b1, b2, b3, b4, and b5 are the coefficients on S, V, S 2, SV, and V 2, respectively).
a Along the V 5 S line, well-being was significantly higher for high supply and value scores than for low supply and value scores ( p , .05). The procedure usedto identify high and low scores is described in the text.
b For this equation, the three quadratic terms (S 2, SV, V 2) were significant as a set ( p , .05).* p , .05. ** p , .01. *** p , .001.

WO
RK
AN
DFA
MILY
ST
RE
SS
109TABLE 3
Results from Quadratic Regressions of Well-Being on Supplies and Values for Family
Results from quadratic regression controlling for age,gender, and income Shape along V 5 S line Shape along V 5 2S line
S V S 2 SV V 2 R 2 b1 1 b2 b3 1 b4 1 b5 b1 2 b2 b3 2 b4 1 b5
AutonomySatisfactiona,b .610*** 2.553*** 2.145*** .143*** .051 .176*** .057c .049 1.163*** 2.237**Anxietya .273*** 2.307*** .025 2.029 .072* .052*** 2.034c .068* .580*** .126Depressiona .349*** 2.379*** 2.054* .093* .012 .098*** 2.030c .051 .728*** 2.135Irritationa .099 2.423*** 2.027 .119** .034 .044*** 2.324** .126*** .522*** 2.112Somatic symptoms .115* 2.188** .014 .009 .019 .034*** 2.073c .042* .303** .024
RelationshipsSatisfactiona .844*** .010 2.104*** .122** 2.088* .407*** .854c,** 2.070* .834*** 2.314***Anxiety .098 2.140 .016 .072 2.016 .056*** 2.042c .072* .238 2.072Depressiona .385*** 2.199 2.044* .095* 2.042 .142*** .186c .009 .584*** 2.181*Irritation .202* 2.079 .012 .043 2.036 .050*** .123c .019 .281 2.067Somatic symptoms .075 2.137 .008 .040 2.012 .039*** 2.062c .036 .212 2.044
SecuritySatisfactiona,b .879*** 2.327*** 2.076*** 2.006 .079** .398*** .552c,*** 2.003 1.206*** .009Anxiety .209** 2.200* 2.005 .026 .019 .057*** .009c .040 .409** 2.012Depression .441*** 2.325*** 2.031 .018 .034 .143*** .116c .021 .766*** 2.015Irritation .157* 2.043 .012 .035 2.044 .044*** .114c .003 .200** 2.067Somatic symptomsa .109* 2.196*** .019 .012 .013 .058*** 2.087c .044** .305*** .020
SegmentationSatisfactiona .140*** 2.175*** 2.068** .114*** 2.036 .037*** 2.035 .010 .315*** 2.218***Anxietya .076* 2.075* .024 .036 .007 .027*** .001c .067*** .151* 2.005Depressiona .114*** 2.118** 2.012 .092*** 2.025 .040*** 2.004c .055*** .232*** 2.129**Irritationa .022 2.018 .034 .081** 2.054** .028*** .004c .061*** .040 2.101*Somatic symptomsa .060** 2.060* .019 .017 2.000 .023*** .000c .036** .120** .002
Note. N ranged from 1627 to 1665. For columns labeled S, V, S 2, SV, and V 2, table entries are unstandardized regression coefficients for equations with allpredictors entered simultaneously (S 5 supplies, V 5 values). The column labeled R 2 indicates the variance explained by the five quadratic terms, controlling forage, gender, and income. Columns labeled b1 1 b2 and b3 1 b4 1 b5 represent the slope of each surface along the V 5 S line, and columns labeled b1 2 b2 andb3 2 b4 1 b5 represent the slope of each surface along the V 5 S line (b1, b2, b3, b4, and b5 are the coefficients on S, V, S 2, SV, and V 2, respectively).
a Along the V 5 S line, well-being was significantly higher for high supply and value scores than for low supply and value scores ( p , .05). The procedure usedto identify high and low scores is described in the text.
a For this equation, the three quadratic terms (S 2, SV, V 2) were significant as a set ( p , .05).c For this equation, the four cubic terms (S 3, S 2V, SV2, V 3) were significant as a set ( p , .05).* p , .05. ** p , .01. *** p , .001.
110 EDWARDS AND ROTHBARD
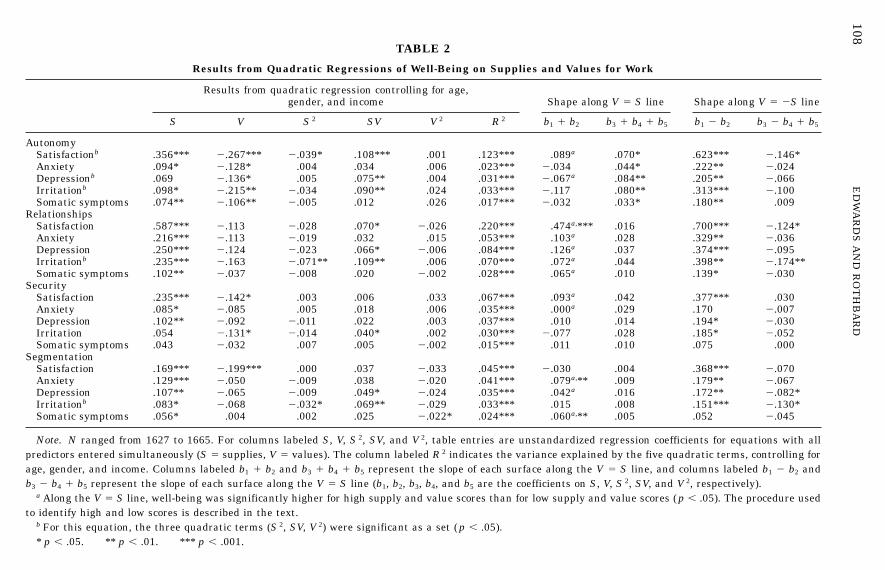
FIG. 2. Estimated surfaces relating autonomy S-V fit to satisfaction for work and family. (a)Work autonomy S-V fit and work satisfaction. (b) Family autonomy S-V fit and family satisfaction.
the work autonomy supply and value measures were 0.55 and 1.05, respectively(these means are four units smaller than the corresponding figures reportedin Table 1). The point midway between these means is thus 0.80. The pointmidway between the work autonomy supply and value standard deviations(1.21 and .98, respectively, as reported in Table 1) was 1.095. Thus, for workautonomy supply and values, we used 1.895 and 20.295 to represent high andlow scores along the V 5 S line. If well-being was higher at the high scorealong the V 5 S line than at the low score, then Hypothesis 1b would besupported. Results supported this hypothesis for two measures of well-beingin the work domain and four measures in the family domain. Thus, Hypothesis1b received moderate support.
WORK AND FAMILY STRESS 111
FIG. 2—Continued
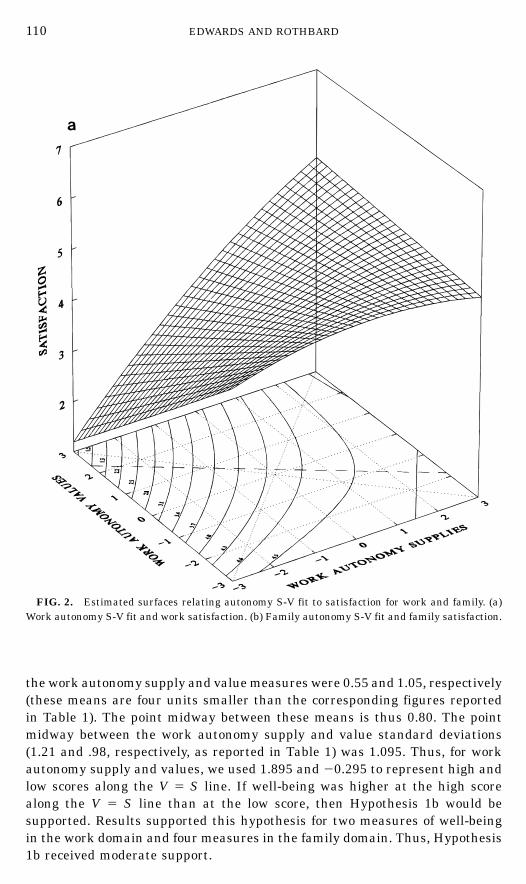
To illustrate the preceding results, Fig. 2 depicts estimated surfaces relatingautonomy S-V fit to satisfaction. As can be seen, these surfaces correspondclosely to the predicted surface shown in Fig. 1. Specifically, satisfaction in-creased as supplies increased toward values and leveled off as supplies exceededvalues, decreasing slightly when supplies exceeded values by about two units.In addition, along the V 5 S line, satisfaction was higher at high supply andvalue scores (1.895 and 2.480 for work and family, respectively) than for lowsupply and value scores (20.295 and 0.560 for work and family, respectively).
Hypothesis 2a stated that well-being would increase as relationship suppliesincreased toward values and continue to increase as supplies exceeded values.This hypothesis corresponds to a positive slope along the V 5 2S line at thepoint S 5 0, V 5 0. A positive slope was found for all well-being measures inthe work domain and for two of five measures in the family domain (see Tables

112 EDWARDS AND ROTHBARD
2 and 3), providing fairly strong support for Hypothesis 2a. Of these well-beingmeasures, four also exhibited a downward curvature along the V 5 2S line,indicating that the increase in well-being diminished when excess supplieswere substantial.
For relationships, several surfaces exhibited curvature along the V 5 S line.Therefore, Hypothesis 2b was tested by comparing well-being for high and lowsupply and value scores, using the procedure applied to Hypothesis 1b. In everycase, well-being was higher when supply and value scores were both high thanwhen both were low, thereby supporting Hypothesis 2b.
Hypothesis 3a posited that, for security, well-being would increase as suppliesincreased toward values and continue to increase as supplies exceeded values,although perhaps to a lesser extent. Tables 2 and 3 show that surfaces werepositively sloped along the V 5 2S line for all measures of well-being in thefamily domain and three of five measures in the work domain. However, noneof the surfaces showed significant downward curvature along the V 5 2S line,meaning that the increase in well-being did not diminish as supplies exceededvalues. This lack of curvature may be partly due to the small proportion ofrespondents who reported excess security (i.e., for both work and family, theproportion of respondents who reported supply scores that exceeded valuescores by at least one unit was less than 7%). Overall, these results providegeneral support for Hypothesis 3a.
To test Hypothesis 3b, we again compared well-being for high and low supplyand value scores. For family, all measures of well-being were higher whensupplies and values were both high than when both were low, whereas forwork, this difference was significant for only two of five measures of well-being. Thus, Hypothesis 3b received fairly strong support, particularly in thefamily domain.
Hypothesis 4a contended that, for segmentation, well-being would increasesteeply as supplies increased toward values and gradually decrease as suppliesexceeded values. This hypothesis corresponds to a positive slope along theV 5 2S line at the point S 5 0, V 5 0, combined with a downward curvaturealong this line. For both work and family, surfaces for four out of five well-being measures were positively sloped along the V 5 2S line at the point S 5
0, V 5 0. Of these eight surfaces, five exhibited significant downward curvature,indicating that well-being began to decrease when supplies moderately ex-ceeded values. These results provide fairly strong support for Hypothesis 4a.
Hypothesis 4b predicted that well-being would be essentially the same whensegmentation supplies and values were both high as when both were low.Contrary to this prediction, 7 of 10 measures of well-being were higher whensupply and value scores were high rather than low. For family, four surfaceswere also curved upward along the V 5 S line, indicating that, within thebounds of the data, well-being did not increase until supplies and values wereboth high (i.e., approximately one standard deviation above the means of sup-plies and values). These results provide weak support for Hypothesis 4b.

WORK AND FAMILY STRESS 113
Moderating Effects of Work and Family Centrality
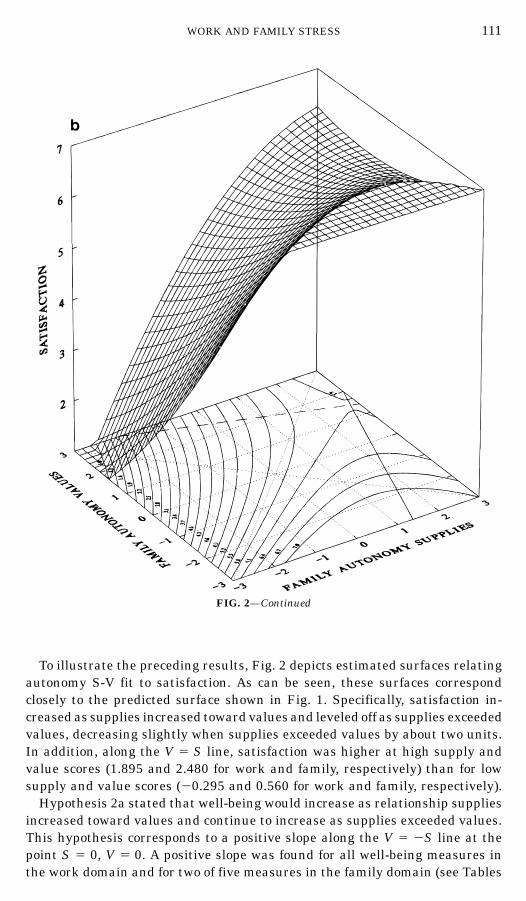
Hypotheses 5a and 5b stated that, for both work and family, centrality wouldstrengthen the relationship between S-V fit and well-being. Hierarchical regres-sion analyses revealed a moderating effect for centrality for five equationsin the work domain and three equations in the family domain, collectivelycomprising two equations for relationships, two for security, and four for seg-mentation. For relationships and security, the moderating effects of centralitywere as predicted, such that the slope of the surface relating S-V fit to well-being was steeper at higher levels of centrality. These effects are illustratedin Fig. 3, which depicts surfaces for family relationships S-V fit and family
FIG. 3. Estimated surfaces relating family relationships S-V fit to family satisfaction at threelevels of family centrality. (a) Family centrality low. (b) Family centrality moderate. (c) Familycentrality high.
114 EDWARDS AND ROTHBARD
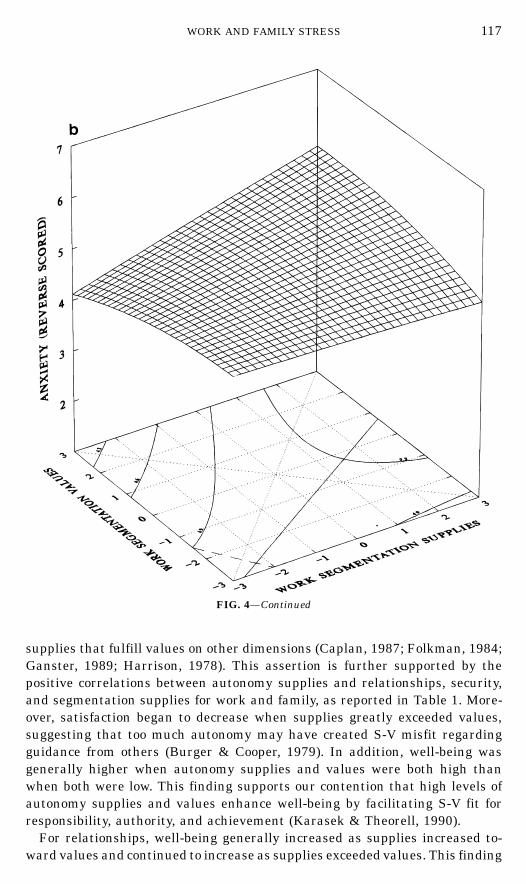
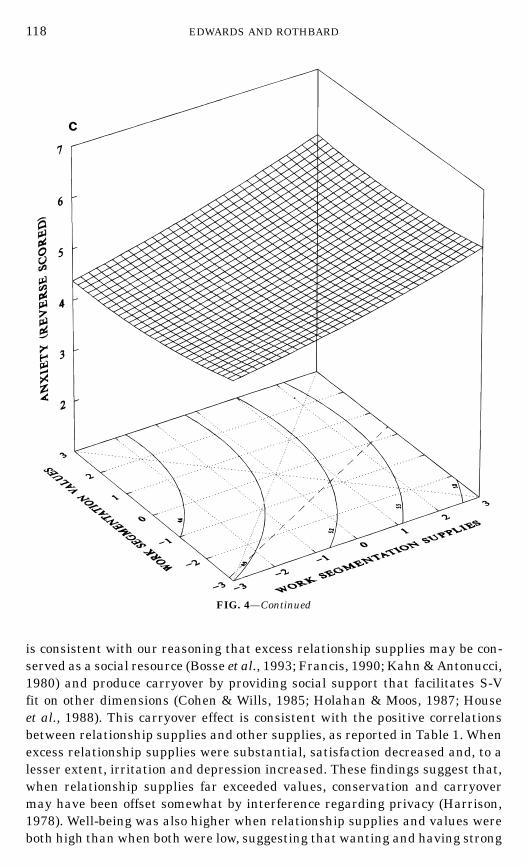
satisfaction at three levels of family centrality. In contrast, the moderatingeffects for segmentation were contrary to predictions, yielding surfaces thatwere more steeply sloped when centrality was lower. These effects are illus-trated in Fig. 4, which portrays the relationship between work segmentationS-V fit and anxiety at three levels of work centrality. These surfaces show that,when work is peripheral to one’s life, either too little or too much separationof work from family is linked to lower well-being.
Domain-Specific Well-Being versus Overall Well-Being
Hypotheses 6a and 6b predicted that, for both work and family, S-V fit wouldbe more strongly related to domain-specific well-being than to satisfactionwith the other domain or to overall well-being. Table 4 reports results from
FIG. 3—Continued

WORK AND FAMILY STRESS 115
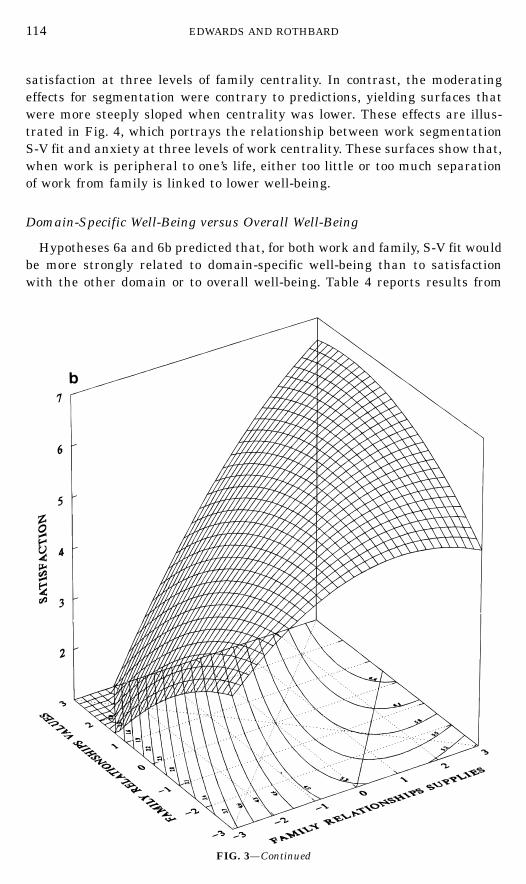
multivariate multiple regression analyses using all six measures of well-beingas a set, showing the increment in variance explained by the five quadraticterms for each dimension of S-V fit for the work and family domains. Theseresults indicated that, for all dimensions except segmentation, the incrementin variance explained for within-domain satisfaction was significantly higherthan for the remaining five measures of well-being. Thus, Hypotheses 6a and6b received support for three of the four value dimensions. Further analysesindicated that, after controlling for within-domain satisfaction, the incrementin variance explained in overall well-being by the five quadratic terms remainedsignificant for each S-V fit dimension ( p , .05). These results, combined withthe significant relationships between S-V fit and within-domain satisfaction(Tables 2 and 3) and between within-domain satisfaction and each measure ofoverall well-being (Table 1), suggest that within-domain satisfaction partially
FIG. 3—Continued

116 EDWARDS AND ROTHBARD
FIG. 4. Estimated surfaces relating work segmentation S-V fit to anxiety at three levels ofwork centrality. (a) Work centrality low. (b) Work centrality moderate. (c) Work centrality high.
mediates the relationship of work and family S-V fit with overall well-being(Baron & Kenny, 1986). Table 4 also shows that S-V fit for family relationshipsand security generally explained the most variance in overall well-being, par-ticularly depression.
DISCUSSION
The results of this study are generally consistent with the hypothesizedrelationships between S-V fit and well-being. Specifically, for autonomy, well-being increased as supplies increased toward values and continued to increaseas supplies exceeded values. This finding is consistent with our assertion thatexcess autonomy produces a carryover effect by enabling the person to acquire
WORK AND FAMILY STRESS 117
FIG. 4—Continued
supplies that fulfill values on other dimensions (Caplan, 1987; Folkman, 1984;Ganster, 1989; Harrison, 1978). This assertion is further supported by thepositive correlations between autonomy supplies and relationships, security,and segmentation supplies for work and family, as reported in Table 1. More-over, satisfaction began to decrease when supplies greatly exceeded values,suggesting that too much autonomy may have created S-V misfit regardingguidance from others (Burger & Cooper, 1979). In addition, well-being wasgenerally higher when autonomy supplies and values were both high thanwhen both were low. This finding supports our contention that high levels ofautonomy supplies and values enhance well-being by facilitating S-V fit forresponsibility, authority, and achievement (Karasek & Theorell, 1990).
For relationships, well-being generally increased as supplies increased to-ward values and continued to increase as supplies exceeded values. This finding
118 EDWARDS AND ROTHBARD
FIG. 4—Continued
is consistent with our reasoning that excess relationship supplies may be con-served as a social resource (Bosse et al., 1993; Francis, 1990; Kahn & Antonucci,1980) and produce carryover by providing social support that facilitates S-Vfit on other dimensions (Cohen & Wills, 1985; Holahan & Moos, 1987; Houseet al., 1988). This carryover effect is consistent with the positive correlationsbetween relationship supplies and other supplies, as reported in Table 1. Whenexcess relationship supplies were substantial, satisfaction decreased and, to alesser extent, irritation and depression increased. These findings suggest that,when relationship supplies far exceeded values, conservation and carryovermay have been offset somewhat by interference regarding privacy (Harrison,1978). Well-being was also higher when relationship supplies and values wereboth high than when both were low, suggesting that wanting and having strong

WORK AND FAMILY STRESS 119
TABLE 4
Comparison of Variance Explained by S-V Fit for Well-Being Measures
Well-being measures
Within- Cross-Value domain domain Somatic
dimension satisfaction satisfaction Anxiety Depression Irritation symptoms
Work domainAutonomy .121 .003a .027a .034a .036a .019a
Relationships .209 .025a .050a .075a .059a .026a
Security .078 .023a .036a .039a .028a .014a
Segmentation .044 .007 .037 .036 .030 .028Family domain
Autonomy .161 .016a .051a .092a .033a .035a
Relationships .393 .035a .055a .132a .044a .035a
Security .385 .025a .055a .134a .041a .054a
Segmentation .034 .005 .028 .036 .026 .021
Note. N ranged from 1571 to 1591. Table entries represent the increment in variance explainedin each well-being measure by the five quadratic terms (i.e., S, V, S 2, SV, V 2) for each valuedimension, controlling for age, gender, and income. All table entries greater than .006 differsignificantly from zero ( p , .05).
a This R 2 was significantly smaller than the R 2 for within-domain satisfaction ( p , .05).
relationships signifies social competence that may itself fulfill social motives(Schneider et al., 1996).
Well-being increased as security supplies increased toward values and contin-ued to increase at essentially the same rate as supplies exceeded values. Appar-ently, the benefit of increasing security to desired levels was comparable to thecarryover of excess security to S-V fit on dimensions such as idea expression andrisk-taking. However, as noted previously, relatively few respondents reportedhaving more security than desired, making it difficult to detect a change inslope as security supplies exceeded values. Well-being was also higher whensecurity supplies and values were both high than when both were low, sug-gesting that high levels of these variables may signify the achievement ofhigh standards of role performance, which itself serves as a supply for valuesregarding competence (White, 1959).
Finally, for segmentation, well-being increased as supplies approached valuesand tended to decrease as supplies exceeded values. The decrease in well-beingfor excess segmentation was manifested primarily by affective indices such assatisfaction, depression, and irritation. Perhaps these indices are particularlysensitive to feelings of isolation and alienation that may arise when life domainsare more separated than desired (Barnett & Gotlib, 1988). Contrary to predic-tions, well-being was higher when segmentation supplies and values were bothhigh than when both were low. This finding suggests that wanting and attaininga high degree of separation between work and family may signify effective

120 EDWARDS AND ROTHBARD
management of the boundary between these domains. Effective boundary man-agement may facilitate role performance in both domains, which in turn shouldenhance well-being.
Limited support was found for the moderating effect of domain centralityon the relationship between S-V fit and well-being. For S-V fit on relationshipsand security, the expected moderating effect was found in four analyses, indicat-ing that the surface relating S-V fit to well-being became more steeply slopedas centrality increased. However, for S-V fit on segmentation, the oppositeeffect was found in four analyses in the work domain, such that the relationshipbetween work S-V fit and well-being became stronger as work centrality de-creased. In retrospect, this finding is conceptually plausible. Specifically, peoplewho view work as unimportant may be intolerant of intrusions of work intoother life areas, such as family. For these people, insufficient work segmentationwould harm well-being. In contrast, for people who view work as highly im-portant, the intrusion of work into family may be tolerated and therefore wouldhave little effect on well-being. Although this reasoning explains the decreasein well-being associated with insufficient work segmentation when work cen-trality is low, it does not account for the decrease in well-being for excesswork segmentation. Because these findings were unexpected, they requirereplication before further speculation is warranted.
For most dimensions, S-V fit was more strongly related to domain-specificwell-being than to overall well-being or to well-being associated with the otherdomain, a pattern that has been found in previous studies (Kopelman et al.,1983; Parasuraman et al., 1992). The only exception to this pattern was S-Vfit for segmentation, which exhibited relationships of similar magnitude withwithin-domain, between-domain, and overall well-being. One explanation forthese findings is that, by referring to the relationship between work and family,segmentation transcends these domains. Therefore, achieving S-V fit for seg-mentation would enhance satisfaction with both work and family as well asoverall well-being.
Our analyses also showed that overall well-being was more strongly relatedto family S-V fit than to work S-V fit (see Table 4), a finding that corroboratesprior research (e.g., Bergermaier et al., 1984; Klitzman et al., 1990; Kopelmanet al., 1983; Rousseau, 1978). Our attempts to explain this difference usingdomain centrality as a moderator were only partly successful, as few significantmoderating effects were found. However, these analyses focused on variationin centrality within either the work or family domain. Comparing centralitybetween domains (see Table 1) shows that, for this sample, family centralitywas considerably higher than work centrality. Thus, the stronger relationshipsfor family S-V fit may be explained in part by the generally higher degree ofimportance associated with family.
Finally, our analyses suggest that, for all S-V fit dimensions, work and familyS-V fit is related to overall well-being not only indirectly through domain-specific well-being, but also directly. These direct relationships challenge theassumption that work and family stressors influence overall well-being only

WORK AND FAMILY STRESS 121
through domain-specific well-being (Coverman, 1989; Frone et al., 1992; Hig-gins et al., 1992; Kopelman et al., 1983; Rice et al., 1985). However, our analysesfocused on a single aspect of domain-specific well-being (i.e., work and familysatisfaction), and the direct associations we found may be mediated by otherdomain-specific aspects of well-being not included in this study. For example,domain-specific tension (Kahn, Wolfe, Quinn, Snoek, & Rosenthal, 1964) maymediate the relationship between work and family S-V fit and overall anxiety.On the other hand, some dimensions of overall well-being (e.g., physical health)have no within-domain analog and therefore may be influenced directly by workand family S-V fit. These alternative causal pathways merit further research.
Limitations
Several limitations of this study should be noted. First, the design of thestudy was cross-sectional, making it impossible to verify that S-V fit influencedwell-being. Although unlikely, it is possible that respondents with higher well-being construed or created greater S-V fit. Second, all data were self-report,which may have inflated interitem correlations due to common method variance(Podsakoff & Organ, 1986). However, common method variance is unlikely tocreate nonlinear and interactive relationships such as those found in our analy-sis (Evans, 1985). Third, by relying on self-report data, our findings pertain onlyto the fit between subjective supplies and values. This limitation is warranted byour focus on psychological stress, which arises from the person’s perception ofthe situation and self (Edwards, 1992; French et al., 1982; Harrison, 1978;Lazarus & Folkman, 1984; Schuler, 1980). Nonetheless, P-E fit research wouldbenefit from studies of the relationship between subjective and objective personand environment constructs. Fourth, correlations between family relationshipsand security measures were high, suggesting that tests of S-V fit for thesedimensions were somewhat redundant. Nonetheless, we retained both dimen-sions to ensure parallelism with analyses in the work domain, where correla-tions between relationships and security were not excessive. Fifth, although thefour value dimensions were correlated, we analyzed S-V fit for each dimensionseparately. These correlations create interpretative difficulties if the researcheris interested in the relationship of S-V fit with well-being holding constantS-V fit on other dimensions. However, the processes underlying our hypotheses,particularly carryover and interference, depend upon relationships betweenS-V fit on the focal dimension and S-V fit on other dimensions. Had we statisti-cally controlled these relationships, we would have masked the very processesthat underlie our hypotheses.
Two final limitations pertain to the sample used in this study. First, oursample differed from the university workforce and the U.S. working populationon several sociodemographic dimensions. It is unclear whether or how thesedifferences influenced relationships among variables used to test our hypothe-ses. Second, we obtained a 30% response rate, which raises concerns regardingself-selection bias. Available evidence suggests that response rate may havelittle effect on relationships among variables such as those examined in this

122 EDWARDS AND ROTHBARD
study (Goudy, 1978; Schalm and Kelloway, 1998). Nonetheless, these limita-tions restrict the generalization of our findings beyond our sample, and furtherresearch is needed using other samples and methods that provide higher re-sponse rates.
SUMMARY AND CONCLUSION
This study examined the relationship of S-V fit in the work and familydomains with well-being. For most dimensions of S-V fit, well-being increasedas supplies increased toward values and either continued to increase or leveledoff as supplies exceeded values. In addition, well-being was generally higherwhen supplies and values were both high than when both were low. Limitedsupport was found for domain centrality as a moderator of the relationshipbetween S-V fit and well-being, although most of the obtained moderatingeffects were conceptually plausible. Finally, S-V fit was more strongly relatedto within-domain well-being than to cross-domain or overall well-being. None-theless, overall well-being was more strongly related to family S-V fit than towork S-V fit, perhaps due to the greater importance ascribed to family inour sample.
These findings provide tentative answers to the two general questions thatmotivated this study. First, our results suggest that depletion, interference,conservation, and carryover represent theoretically meaningful mechanismsthat influence the relationship between S-V fit and well-being. By using thesemechanisms to derive hypotheses, researchers can go beyond simple assertionsthat S-V fit is beneficial to well-being. Future research should investigate howthese mechanisms correspond to different categories of value dimensions. Forexample, dimensions that facilitate coping, such as autonomy and relationshipsin the present study, may be generally prone to carryover, enhancing S-V fiton a range of dimensions. In contrast, dimensions that represent countervailingdesires (e.g., social contact versus privacy) may exhibit interference, as anincrease in supplies for one dimension implies a decrease in supplies for theother dimension. This research may uncover general attributes of value dimen-sions that can be used to predict how depletion, interference, conservation,and carryover apply to S-V fit on specific value dimensions in a particular study.
Second, this study indicates that the relative effects of work S-V fit andfamily S-V fit on well-being are influenced in part by domain centrality andby the degree to which well-being is specific to work or family. However, themoderating effects of domain centrality were limited, and future studies shouldconsider other factors that may explain the relative effects of work S-V fit andfamily S-V fit on well-being. One possible factor is the amount of attentiondevoted to work versus family. For example, holding constant the degree ofwork and family S-V misfit, a person who ruminates on family S-V misfit islikely to experience greater stress from family than from work (Edwards, 1992).The relative effects of work and family S-V misfit on well-being may also beinfluenced by the degree to which misfit in either domain can be resolved. Forinstance, persons in jobs with little autonomy but who have great control over
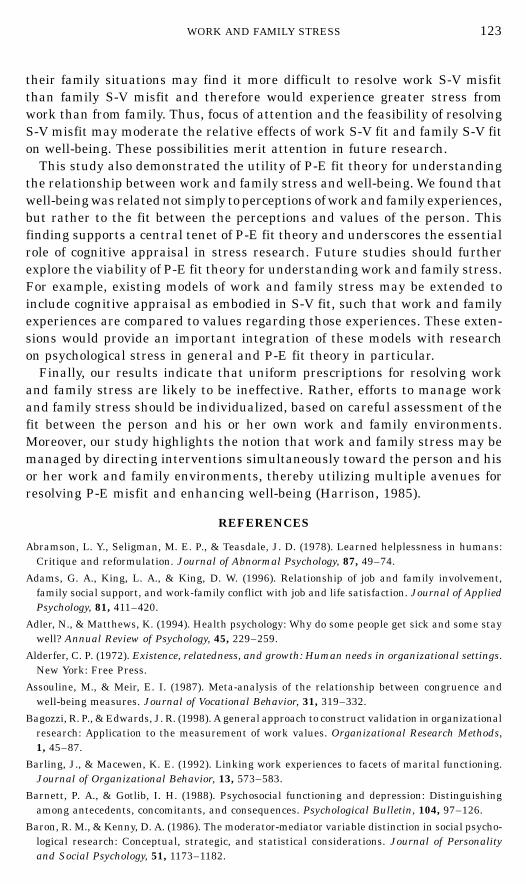
WORK AND FAMILY STRESS 123
their family situations may find it more difficult to resolve work S-V misfitthan family S-V misfit and therefore would experience greater stress fromwork than from family. Thus, focus of attention and the feasibility of resolvingS-V misfit may moderate the relative effects of work S-V fit and family S-V fiton well-being. These possibilities merit attention in future research.
This study also demonstrated the utility of P-E fit theory for understandingthe relationship between work and family stress and well-being. We found thatwell-being was related not simply to perceptions of work and family experiences,but rather to the fit between the perceptions and values of the person. Thisfinding supports a central tenet of P-E fit theory and underscores the essentialrole of cognitive appraisal in stress research. Future studies should furtherexplore the viability of P-E fit theory for understanding work and family stress.For example, existing models of work and family stress may be extended toinclude cognitive appraisal as embodied in S-V fit, such that work and familyexperiences are compared to values regarding those experiences. These exten-sions would provide an important integration of these models with researchon psychological stress in general and P-E fit theory in particular.
Finally, our results indicate that uniform prescriptions for resolving workand family stress are likely to be ineffective. Rather, efforts to manage workand family stress should be individualized, based on careful assessment of thefit between the person and his or her own work and family environments.Moreover, our study highlights the notion that work and family stress may bemanaged by directing interventions simultaneously toward the person and hisor her work and family environments, thereby utilizing multiple avenues forresolving P-E misfit and enhancing well-being (Harrison, 1985).
REFERENCES
Abramson, L. Y., Seligman, M. E. P., & Teasdale, J. D. (1978). Learned helplessness in humans:Critique and reformulation. Journal of Abnormal Psychology, 87, 49–74.
Adams, G. A., King, L. A., & King, D. W. (1996). Relationship of job and family involvement,family social support, and work-family conflict with job and life satisfaction. Journal of AppliedPsychology, 81, 411–420.
Adler, N., & Matthews, K. (1994). Health psychology: Why do some people get sick and some staywell? Annual Review of Psychology, 45, 229–259.
Alderfer, C. P. (1972). Existence, relatedness, and growth: Human needs in organizational settings.New York: Free Press.
Assouline, M., & Meir, E. I. (1987). Meta-analysis of the relationship between congruence andwell-being measures. Journal of Vocational Behavior, 31, 319–332.
Bagozzi, R. P., & Edwards, J. R. (1998). A general approach to construct validation in organizationalresearch: Application to the measurement of work values. Organizational Research Methods,1, 45–87.
Barling, J., & Macewen, K. E. (1992). Linking work experiences to facets of marital functioning.Journal of Organizational Behavior, 13, 573–583.
Barnett, P. A., & Gotlib, I. H. (1988). Psychosocial functioning and depression: Distinguishingamong antecedents, concomitants, and consequences. Psychological Bulletin, 104, 97–126.
Baron, R. M., & Kenny, D. A. (1986). The moderator-mediator variable distinction in social psycho-logical research: Conceptual, strategic, and statistical considerations. Journal of Personalityand Social Psychology, 51, 1173–1182.
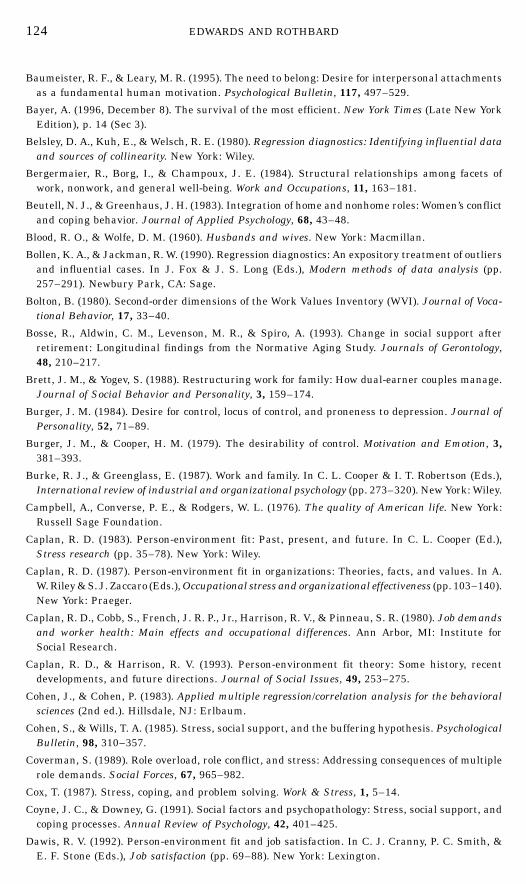
124 EDWARDS AND ROTHBARD
Baumeister, R. F., & Leary, M. R. (1995). The need to belong: Desire for interpersonal attachmentsas a fundamental human motivation. Psychological Bulletin, 117, 497–529.
Bayer, A. (1996, December 8). The survival of the most efficient. New York Times (Late New YorkEdition), p. 14 (Sec 3).
Belsley, D. A., Kuh, E., & Welsch, R. E. (1980). Regression diagnostics: Identifying influential dataand sources of collinearity. New York: Wiley.
Bergermaier, R., Borg, I., & Champoux, J. E. (1984). Structural relationships among facets ofwork, nonwork, and general well-being. Work and Occupations, 11, 163–181.
Beutell, N. J., & Greenhaus, J. H. (1983). Integration of home and nonhome roles: Women’s conflictand coping behavior. Journal of Applied Psychology, 68, 43–48.
Blood, R. O., & Wolfe, D. M. (1960). Husbands and wives. New York: Macmillan.
Bollen, K. A., & Jackman, R. W. (1990). Regression diagnostics: An expository treatment of outliersand influential cases. In J. Fox & J. S. Long (Eds.), Modern methods of data analysis (pp.257–291). Newbury Park, CA: Sage.
Bolton, B. (1980). Second-order dimensions of the Work Values Inventory (WVI). Journal of Voca-tional Behavior, 17, 33–40.
Bosse, R., Aldwin, C. M., Levenson, M. R., & Spiro, A. (1993). Change in social support afterretirement: Longitudinal findings from the Normative Aging Study. Journals of Gerontology,48, 210–217.
Brett, J. M., & Yogev, S. (1988). Restructuring work for family: How dual-earner couples manage.Journal of Social Behavior and Personality, 3, 159–174.
Burger, J. M. (1984). Desire for control, locus of control, and proneness to depression. Journal ofPersonality, 52, 71–89.
Burger, J. M., & Cooper, H. M. (1979). The desirability of control. Motivation and Emotion, 3,381–393.
Burke, R. J., & Greenglass, E. (1987). Work and family. In C. L. Cooper & I. T. Robertson (Eds.),International review of industrial and organizational psychology (pp. 273–320). New York: Wiley.
Campbell, A., Converse, P. E., & Rodgers, W. L. (1976). The quality of American life. New York:Russell Sage Foundation.
Caplan, R. D. (1983). Person-environment fit: Past, present, and future. In C. L. Cooper (Ed.),Stress research (pp. 35–78). New York: Wiley.
Caplan, R. D. (1987). Person-environment fit in organizations: Theories, facts, and values. In A.W. Riley & S. J. Zaccaro (Eds.), Occupational stress and organizational effectiveness (pp. 103–140).New York: Praeger.
Caplan, R. D., Cobb, S., French, J. R. P., Jr., Harrison, R. V., & Pinneau, S. R. (1980). Job demandsand worker health: Main effects and occupational differences. Ann Arbor, MI: Institute forSocial Research.
Caplan, R. D., & Harrison, R. V. (1993). Person-environment fit theory: Some history, recentdevelopments, and future directions. Journal of Social Issues, 49, 253–275.
Cohen, J., & Cohen, P. (1983). Applied multiple regression/correlation analysis for the behavioralsciences (2nd ed.). Hillsdale, NJ: Erlbaum.
Cohen, S., & Wills, T. A. (1985). Stress, social support, and the buffering hypothesis. PsychologicalBulletin, 98, 310–357.
Coverman, S. (1989). Role overload, role conflict, and stress: Addressing consequences of multiplerole demands. Social Forces, 67, 965–982.
Cox, T. (1987). Stress, coping, and problem solving. Work & Stress, 1, 5–14.
Coyne, J. C., & Downey, G. (1991). Social factors and psychopathology: Stress, social support, andcoping processes. Annual Review of Psychology, 42, 401–425.
Dawis, R. V. (1992). Person-environment fit and job satisfaction. In C. J. Cranny, P. C. Smith, &E. F. Stone (Eds.), Job satisfaction (pp. 69–88). New York: Lexington.

WORK AND FAMILY STRESS 125
Dawis, R. V., & Lofquist, L. H. (1984). A psychological theory of work adjustment. Minneapolis:University of Minnesota Press.
deCharms, R. (1968). Personal causation: The internal affective determinants of behavior. NewYork: Academic Press.
Demo, D. H., & Acock, A. C. (1996). Singlehood, marriage, and remarriage: The effects of familystructure and family relationships on mothers’ well-being. Journal of Family Issues, 17, 388–407.
Diener, E. (1984). Subjective well-being. Psychological Bulletin, 95, 542–575.
Dwyer, J. H. (1983). Statistical models for the social and behavioral sciences. New York: OxfordUniversity Press.
Eckenrode, J., & Gore, S. (Eds.). (1990). Stress between work and family. New York: Plenum Press.
Edwards, J. R. (1991). Person-job fit: A conceptual integration, literature review, and methodologi-cal critique. In C. L. Cooper & I. T. Robertson (Eds.), International review of industrial andorganizational psychology (Vol. 6, pp. 283–357). New York: Wiley.
Edwards, J. R. (1992). A cybernetic theory of stress, coping, and well-being in organizations.Academy of Management Review, 17, 238–274.
Edwards, J. R. (1994). The study of congruence in organizational behavior research: Critique anda proposed alternative. Organizational Behavior and Human Decision Processes, 58, 51–100(erratum, 58, 323–325).
Edwards, J. R. (1996). An examination of competing versions of the person-environment fit approachto stress. Academy of Management Journal, 39, 292–339.
Edwards, J. R., Caplan, R. D., & Harrison, R. V. (1998). Person-environment fit theory: Conceptualfoundations, empirical evidence, and directions for future research. In C. L. Cooper (Ed.), Theoriesof organizational stress (pp. 28–67). Oxford: Oxford University Press.
Edwards, J. R., & Cooper, C. L. (1988). The impacts of positive psychological states on physicalhealth: A review and theoretical framework. Social Science & Medicine, 27, 1447–1459.
Edwards, J. R., & Cooper, C. L. (1990). The person-environment fit approach to stress: Recurringproblems and some suggested solutions. Journal of Organizational Behavior, 10, 293–307.
Edwards, J. R., & Harrison, R. V. (1993). Job demands and worker health: Three-dimensionalreexamination of the relationship between person-environment fit and strain. Journal of AppliedPsychology, 78, 628–648.
Edwards, J. R., & Parry, M. E. (1993). On the use of polynomial regression equations as analternative to difference scores in organizational research. Academy of Management Journal,36, 1577–1613.
Elsass, P. M., & Veiga, J. F. (1997). Job control and job strain: A test of three models. Journal ofOccupational Health Psychology, 2, 195–211.
Evans, M. G. (1969). Conceptual and operational problems in the measurement of various aspectsof job satisfaction. Journal of Applied Psychology, 53, 93–101.
Evans, M. G. (1985). A Monte Carlo study of the effects of correlated method variance in moderatedmultiple regression analysis. Organizational Behavior and Human Decision Processes, 36,305–323.
Fisher, A. B. (1992, November 30). Welcome to the age of overwork. Fortune, 126, 64–67.
Folkman, S. (1984). Personal control and stress and coping processes: A theoretical analysis.Journal of Personality and Social Psychology, 46, 839–852.
Fox, J. (1991). Regression diagnostics: An introduction. Newbury Park, CA: Sage.
Francis, D. (1990). The significance of work friends in late life. Journal of Aging Studies, 4, 405–424.
French, J. R. P., Jr., Caplan, R. D., & Harrison, R. V. (1982). The mechanisms of job stress andstrain. New York: Wiley.
Frone, M. R., Russell, M., & Cooper, M. L. (1992). Antecedents and outcomes of work-family conflict:Testing a model of the work-family interface. Journal of Applied Psychology, 77, 65–78.

126 EDWARDS AND ROTHBARD
Frone, M. R., Russell, M., & Cooper, M. L. (1994). Relationship between job and family satisfaction:Causal or noncausal covariation? Journal of Management, 20, 565–579.
Frone, M. R., Yardley, J. K., & Markel, K. S. (1997). Developing and testing an integrative modelof the work-family interface. Journal of Vocational Behavior, 50, 145–167.
Ganster, D. C. (1989). Worker control and well-being: A review of research in the workplace. InS. L. Sauter, J. J. Hurrell, Jr., & C. L. Cooper (Eds.), Job control and worker health (pp. 3–24).New York: Wiley.
Ganster, D. C., & Schaubroeck, J. (1991). Work stress and employee health. Journal of Management,17, 235–271.
Gecas, V., & Seff, M. A. (1990). Social class and self-esteem: Psychological centrality, compensation,and the relative effects of work and home. Social Psychology Quarterly, 53, 165–173.
Gibson, V. M. (1993, January 15). Stress in the workplace: A hidden cost factor. HR Focus, 70.
Goudy, W. J. (1978). Interim response to a mail questionnaire: Impacts on variable relationships.Sociological Quarterly, 19, 253–265.
Greenhaus, J. H., & Beutell, N. J. (1985). Sources of conflict between work and family roles.Academy of Management Review, 10, 76–88.
Greenhaus, J. H., & Parasuraman, S. (1986). A work-nonwork interactive perspective of stressand its consequences. Journal of Organizational Behavior Management, 8, 37–60.
Hackman, J. R., & Oldham, G. R. (1980). Work redesign. Reading, MA: Addison-Wesley.
Harrison, R. V. (1978). Person-environment fit and job stress. In C. L. Cooper & R. Payne (Eds.),Stress at work (pp. 175–205). New York: Wiley.
Harrison, R. V. (1985). The person-environment fit model and the study of job stress. In T. A.Beehr & R. S. Bhagat (Eds.), Human stress and cognition in organizations (pp. 23–55). NewYork: Wiley.
Hesketh, B., & Gardner, D. (1993). Person-environment fit models: A reconceptualization andempirical test. Journal of Vocational Behavior, 42, 315–332.
Higgins, C. A., & Duxbury, L. E. (1992). Work-family conflict: A comparison of dual-career andtraditional-career men. Journal of Organizational Behavior, 13, 389–411.
Higgins, C. A., Duxbury, L. E., & Irving, R. H. (1992). Work-family conflict in the dual-careerfamily. Organizational Behavior and Human Decision Processes, 51, 51–75.
Hochberg, Y., & Tamhane, A. C. (1987). Multiple comparison procedures. New York: Wiley.
Holahan, C. J., & Moos, R. H. (1987). Personal and contextual determinants of coping strategies.Journal of Personality and Social Psychology, 52, 946–955.
Holm, S. (1979). A simple sequentially rejective multiple test procedure. Scandinavian Journalof Statistics, 6, 65–70.
House, J. S., Landis, K. R., & Umberson, D. (1988). Social relationships and health. Science,241, 540–545.
Hyland, M. E. (1987). Control theory interpretation of psychological mechanisms of depression:Comparison and integration of several theories. Psychological Bulletin, 102, 109–121.
Imparato, N. (1972). Relationship between Porter’s Need Satisfaction Questionnaire and the JobDescriptive Index. Journal of Applied Psychology, 56, 397–405.
Ironson, G. H., Smith, P. C., Brannick, M. T., Gibson, W. M., & Paul, K. B. (1989). Constructionof a job in general scale: A comparison of global, composite, and specific measures. Journal ofApplied Psychology, 74, 193–200.
Kabanoff, B. (1980). Work and nonwork: A review of models, methods, and findings. PsychologicalBulletin, 88, 60–77.
Kahn, R. L., & Antonucci, T. C. (1980). Convoys over the life course: Attachment, roles, and socialsupport. In P. B. Baltes & O. Brim (Eds.), Life-span development and behavior (Vol. 3, pp.253–286). New York: Academic Press.

WORK AND FAMILY STRESS 127
Kahn, R. L., Wolfe, D. M., Quinn, R. P., Snoek, J. D., & Rosenthal, R. A. (1964). Organizationalstress: Studies in role conflict and ambiguity. New York: Wiley.
Kanungo, R. N. (1982). Measurement of job and work involvement. Journal of Applied Psychology,67, 341–349.
Karasek, R. A., Jr., Russell, R. S., & Theorell, T. (1982). Physiology of stress and regeneration injob related cardiovascular illness. Journal of Human Stress, 8, 29–42.
Karasek, R. A., & Theorell, T. (1990). Healthy work: Stress, productivity, and the reconstructionof working life. New York: Basic Books.
Kinicki, A. J., McKee, F. M., & Wade, K. J. (1996). Annual review, 1991–1995: Occupational health.Journal of Vocational Behavior, 49, 190–220.
Klitzman, S., House, J. S., Israel, B. A., & Mero, R. P. (1990). Work stress, nonwork stress, andhealth. Journal of Behavioral Medicine, 13, 221–243.
Kopelman, R. E., Greenhaus, J. J., & Connolly, T. F. (1983). A model of work, family, and interroleconflict: A construct validation study. Organizational Behavior and Human Performance, 32,198–215.
Kuhnert, K. W., & Palmer, D. R. (1991). Job security, health, and the intrinsic and extrinsiccharacteristics of work. Group & Organization Studies, 16, 178–192.
Kulka, R. A. (1979). Interaction as person-environment fit. In L. R. Kahle (Ed.), New directionsfor methodology of behavioral science (pp. 55–71). San Francisco: Jossey-Bass.
Lambert, S. J. (1990). Processes linking work and family: A critical review and research agenda.Human Relations, 43, 239–257.
Larson, J. H., Wilson, S. M., & Beley, R. (1994). The impact of job insecurity on marital and familyrelationships. Family Relations, 43, 138–143.
Lazarus, R. S., & Folkman, S. (1984). Stress, coping, and adaptation. New York: Springer.
Lewin, K. (1951). Field theory in social science. New York: Harper.
Little, R. J. A., & Rubin, D. B. (1987). Statistical analysis with missing data. New York: Wiley.
Livingstone, L. P., Nelson, D. L., & Barr, S. H. (1997). Person-environment fit and creativity:An examination of supply-value and demand-ability versions of fit. Journal of Management,23, 119–146.
Locke, E. A. (1969). What is job satisfaction? Organizational Behavior and Human Performance,4, 309–336.
Locke, E. A. (1976). The nature and causes of job satisfaction. In M. Dunnette (Ed.), Handbookof industrial and organizational psychology (pp. 1297–1350). Chicago: Rand McNally.
Lundberg, U. (1996). Influence of paid and unpaid work on psychophysiological stress responsesof men and women. Journal of Occupational Health Psychology, 1, 117–130.
Macnab, D., & Fitzsimmons, G. W. (1987). A multitrait-multimethod study of work-related needs,values, and preferences. Journal of Vocational Behavior, 30, 1–15.
Mann, S. E. (1996, November 25). Employee stress: An important cost in mergers. BusinessInsurance, 30, 24.
Martin, T. N., & Schermerhorn, J. R., Jr. (1983). Work and nonwork influences on health: Aresearch agenda using inability to leave as a critical variable. Academy of Management Review,8, 650–659.
Maslow, A. H. (1954). Motivation and personality. New York: Harper.
McGrath, J. E. (1976). Stress and behavior in organizations. In M. Dunnette (Ed.), Handbook ofindustrial and organizational psychology (pp. 1351–1395). Chicago: Rand McNally.
Miller, R. G., Jr. (1981). Simultaneous statistical inference (2nd ed.). New York: Springer-Verlag.
Miller, S. M. (1981). Predictability and human stress: Toward a clarification of evidence and theory.In L. Berkowitz (Ed.), Advances in experimental social psychology (pp. 203–256). New York:Academic Press.
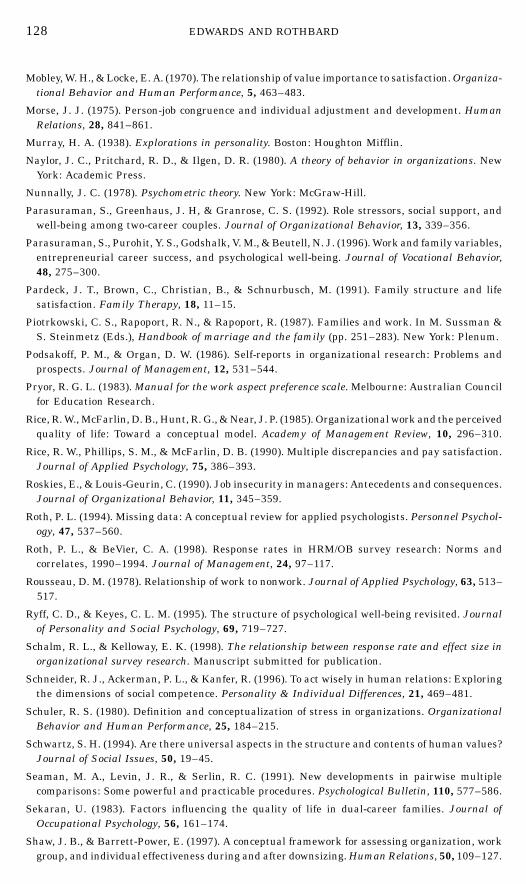
128 EDWARDS AND ROTHBARD
Mobley, W. H., & Locke, E. A. (1970). The relationship of value importance to satisfaction. Organiza-tional Behavior and Human Performance, 5, 463–483.
Morse, J. J. (1975). Person-job congruence and individual adjustment and development. HumanRelations, 28, 841–861.
Murray, H. A. (1938). Explorations in personality. Boston: Houghton Mifflin.
Naylor, J. C., Pritchard, R. D., & Ilgen, D. R. (1980). A theory of behavior in organizations. NewYork: Academic Press.
Nunnally, J. C. (1978). Psychometric theory. New York: McGraw-Hill.
Parasuraman, S., Greenhaus, J. H, & Granrose, C. S. (1992). Role stressors, social support, andwell-being among two-career couples. Journal of Organizational Behavior, 13, 339–356.
Parasuraman, S., Purohit, Y. S., Godshalk, V. M., & Beutell, N. J. (1996). Work and family variables,entrepreneurial career success, and psychological well-being. Journal of Vocational Behavior,48, 275–300.
Pardeck, J. T., Brown, C., Christian, B., & Schnurbusch, M. (1991). Family structure and lifesatisfaction. Family Therapy, 18, 11–15.
Piotrkowski, C. S., Rapoport, R. N., & Rapoport, R. (1987). Families and work. In M. Sussman &S. Steinmetz (Eds.), Handbook of marriage and the family (pp. 251–283). New York: Plenum.
Podsakoff, P. M., & Organ, D. W. (1986). Self-reports in organizational research: Problems andprospects. Journal of Management, 12, 531–544.
Pryor, R. G. L. (1983). Manual for the work aspect preference scale. Melbourne: Australian Councilfor Education Research.
Rice, R. W., McFarlin, D. B., Hunt, R. G., & Near, J. P. (1985). Organizational work and the perceivedquality of life: Toward a conceptual model. Academy of Management Review, 10, 296–310.
Rice, R. W., Phillips, S. M., & McFarlin, D. B. (1990). Multiple discrepancies and pay satisfaction.Journal of Applied Psychology, 75, 386–393.
Roskies, E., & Louis-Geurin, C. (1990). Job insecurity in managers: Antecedents and consequences.Journal of Organizational Behavior, 11, 345–359.
Roth, P. L. (1994). Missing data: A conceptual review for applied psychologists. Personnel Psychol-ogy, 47, 537–560.
Roth, P. L., & BeVier, C. A. (1998). Response rates in HRM/OB survey research: Norms andcorrelates, 1990–1994. Journal of Management, 24, 97–117.
Rousseau, D. M. (1978). Relationship of work to nonwork. Journal of Applied Psychology, 63, 513–517.
Ryff, C. D., & Keyes, C. L. M. (1995). The structure of psychological well-being revisited. Journalof Personality and Social Psychology, 69, 719–727.
Schalm, R. L., & Kelloway, E. K. (1998). The relationship between response rate and effect size inorganizational survey research. Manuscript submitted for publication.
Schneider, R. J., Ackerman, P. L., & Kanfer, R. (1996). To act wisely in human relations: Exploringthe dimensions of social competence. Personality & Individual Differences, 21, 469–481.
Schuler, R. S. (1980). Definition and conceptualization of stress in organizations. OrganizationalBehavior and Human Performance, 25, 184–215.
Schwartz, S. H. (1994). Are there universal aspects in the structure and contents of human values?Journal of Social Issues, 50, 19–45.
Seaman, M. A., Levin, J. R., & Serlin, R. C. (1991). New developments in pairwise multiplecomparisons: Some powerful and practicable procedures. Psychological Bulletin, 110, 577–586.
Sekaran, U. (1983). Factors influencing the quality of life in dual-career families. Journal ofOccupational Psychology, 56, 161–174.
Shaw, J. B., & Barrett-Power, E. (1997). A conceptual framework for assessing organization, workgroup, and individual effectiveness during and after downsizing. Human Relations, 50, 109–127.

WORK AND FAMILY STRESS 129
Shirom, A. (1982). What is organizational stress? A facet analytic conceptualization. Journal ofOccupational Behavior, 3, 21–37.
Silver, R. L., & Wortman, C. B. (1980). Coping with undesirable life events. In J. Garber and M.E. P. Seligman (Eds.), Human helplessness: Theory and applications (pp. 279–340). New York:Academic Press.
Smith, P. C., Kendall, L., & Hulin, C. L. (1969). The measurement of satisfaction in work andretirement. Chicago: Rand McNally.
Steiger, J. H. (1980). Tests for comparing elements of a correlation matrix. Psychological Bulletin,87, 245–251.
Sutton, R. I., & Kahn, R. L. (1987). Prediction, understanding, and control as antidotes to organiza-tional stress. In F. M. Andrews (Ed.), Research on the quality of life (pp. 337–361). Ann Arbor,MI: University of Michigan Institute for Social Research.
Sweeney, P. D., McFarlin, D. B., & Inderrieden, E. J. (1990). Using relative deprivation theory toexplain satisfaction with income and pay level: A multistudy examination. Academy of Manage-ment Journal, 33, 423–436.
Tabachnick, B. G., & Fidell, L. S. (1989). Using multivariate statistics (2nd ed.). New York:Harper & Row.
U.S. Bureau of the Census. (1996). Money income in the United States: 1995 (Current PopulationReports, P60-193). Washington, DC: U.S. Government Printing Office.
U.S. Department of Commerce. (1996). Statistical abstract of the United States (116th ed.). Washing-ton, DC: Economics and Statistics Administration, Bureau of the Census.
Voydanoff, P. (1988). Work and family: A review and expanded conceptualization. Journal of SocialBehavior & Personality, 3, 1–22.
Wall, T. D., & Payne, R. (1973). Are deficiency scores deficient? Journal of Applied Psychology,58, 322–326.
Wanous, J. P., & Lawler, E. E., III. (1972). Measurement and meaning of job satisfaction. Journalof Applied Psychology, 56, 95–105.
White, R. W. (1959). Motivation reconsidered: The concept of competence. Psychological Review,66, 297–333.
Zedeck, S. (Ed.). (1992). Work, families, and organizations. San Francisco: Jossey-Bass.
Received: March 16, 1998