Embed Size (px)
Citation preview
JD Edwards EnterpriseOne
One View Reporting – Functional Content
Overview
October 2012
Copyright © 2012, Oracle and/or its affiliates. All rights reserved. Oracle Proprietary and Confidential.
2
Copyright © 2012, Oracle and/or its affiliates. All rights reserved. Oracle Proprietary and Confidential. 3
Agenda
• ERP Reporting Business Issues
• Benefits of One View Reporting
• One View Reporting Across The Enterprise
• Functional Overview by Module
• Project Costing
• Sales Order Management
• Service Management
• Capital Asset Management
• Real Estate Management
• Financials
• Manufacturing Management
• Inventory Management
• Procurement and Subcontract Management
• Payroll
• Human Resources
• Transportation Management
Copyright © 2012, Oracle and/or its affiliates. All rights reserved. Oracle Proprietary and Confidential.
ERP Reporting Business
Issues
• Lack of effective operational reporting: • Requires access to real time information
• Focused on line of business management and staff
• IT resources
• High $$ resources are backlogged and should be redirected to
other priorities – not to report writing.
• Without effective operational reporting throughout the
enterprise it is difficult to:
• Reduce end of period close cycle times
• Identify data inaccuracies
• Improve operational processes such as collections
• Expand use of the software
4
Return to
Agenda/Index
Copyright © 2012, Oracle and/or its affiliates. All rights reserved. Oracle Proprietary and Confidential.
Benefits of One View Reporting
• Real time, interactive access improves day-to-
day operations.
• Increases accuracy
• Speeds period end close cycles
• Process improvement
• Decrease cost of reporting
• Free up high $$ IT resources
• Quick time to benefit & ROI with pre-built
content
5
Return to
Agenda/Index
Copyright © 2012, Oracle and/or its affiliates. All rights reserved. Oracle Proprietary and Confidential.
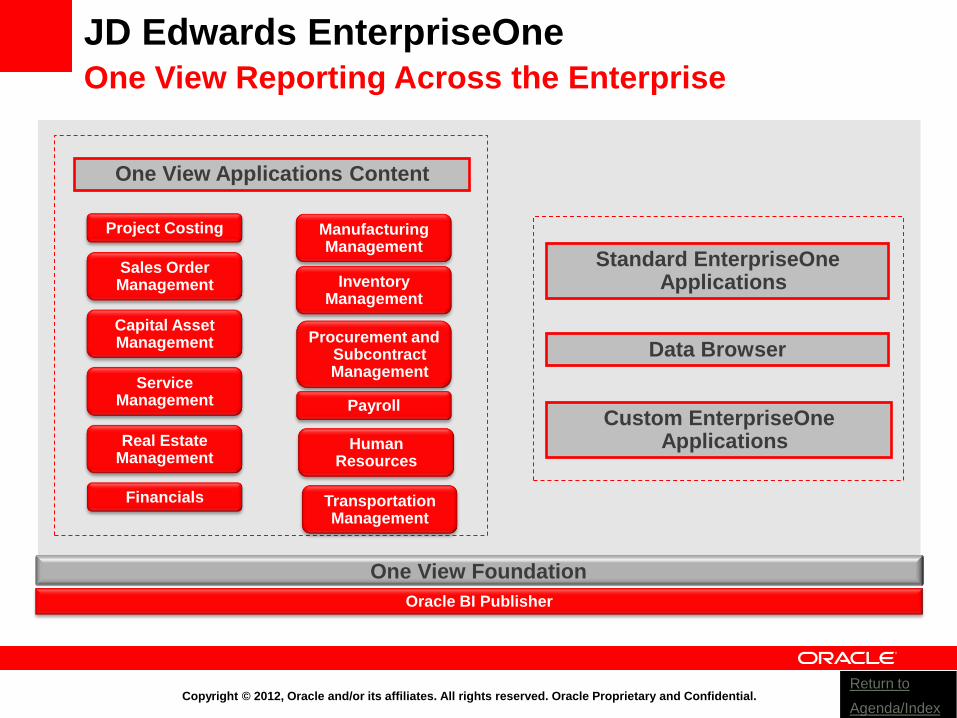
JD Edwards EnterpriseOne
One View Reporting Across the Enterprise
Oracle BI Publisher
Manufacturing Management
Financials
Sales Order Management
Procurement and Subcontract Management
Inventory Management
Real Estate Management
Capital Asset Management
Project Costing
Payroll
Human Resources
One View Foundation
One View Applications Content
Standard EnterpriseOne Applications
Custom EnterpriseOne Applications
Data Browser
Service Management
Transportation Management
Return to
Agenda/Index

Copyright © 2012, Oracle and/or its affiliates. All rights reserved. Oracle Proprietary and Confidential. 7
<Insert Picture Here>
One View Reporting
Project Costing
Return to
Agenda/Index
Copyright © 2012, Oracle and/or its affiliates. All rights reserved. Oracle Proprietary and Confidential. 8
Benefits – One View Project Costing Empower End Users
• Know your project status; budget vs. actuals vs. open commitments
• Consolidated spend analysis with MTD vs. YTD vs. ITD
• Consolidated and detail WIP reporting
• Labor unit metrics for productivity analysis across portfolio
• Earned value metrics for standardized project management analysis
Improve Insight into Project Status
• Use interactive reports with lists, charts, and graphs to drill down to the level of detail
required to make informed business decisions
• View project financial information
• Analyze your project financial information and accurately assess project status
Enhance Real-Time Decision Making
• Enable end users to design, create, run, and share reports
• Provide users real time access to operational data
• Codes vs. descriptions, group by customer, sum by category code, table vs.
chart….View your data the way you want to view it!
• Free up IT resources for projects
Decrease Cost of Reporting
Return to
Agenda/Index
Copyright © 2012, Oracle and/or its affiliates. All rights reserved. Oracle Proprietary and Confidential.
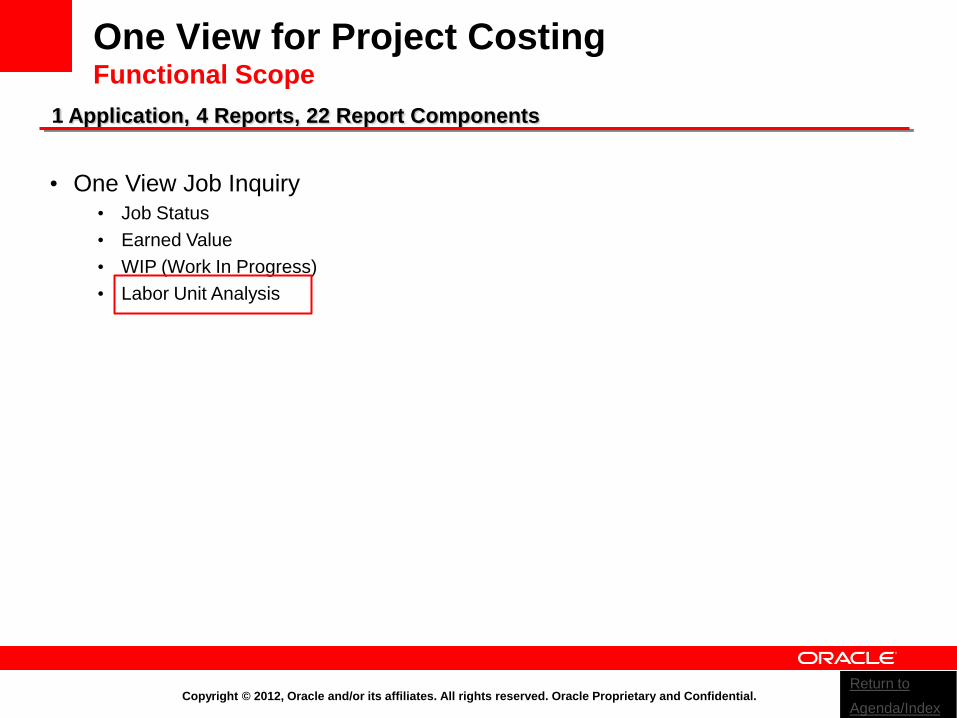
One View for Project Costing Functional Scope
• One View Job Inquiry • Job Status
• Earned Value
• WIP (Work In Progress)
• Labor Unit Analysis
1 Application, 4 Reports, 22 Report Components
Return to
Agenda/Index
Copyright © 2012, Oracle and/or its affiliates. All rights reserved. Oracle Proprietary and Confidential. 10
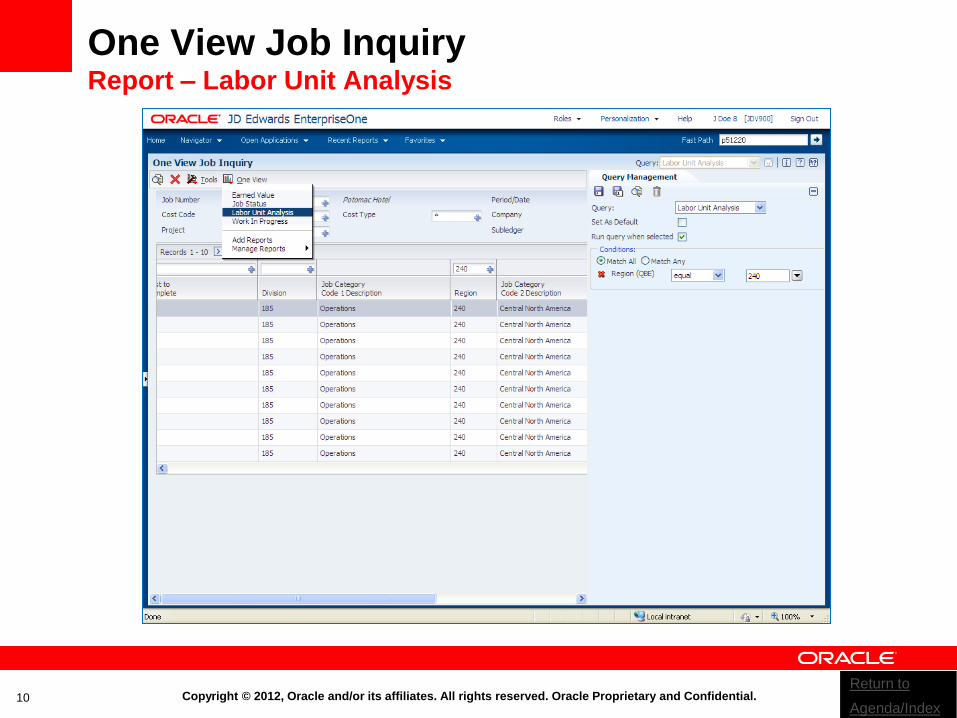
One View Job Inquiry Report – Labor Unit Analysis
Return to
Agenda/Index
Copyright © 2012, Oracle and/or its affiliates. All rights reserved. Oracle Proprietary and Confidential. 11
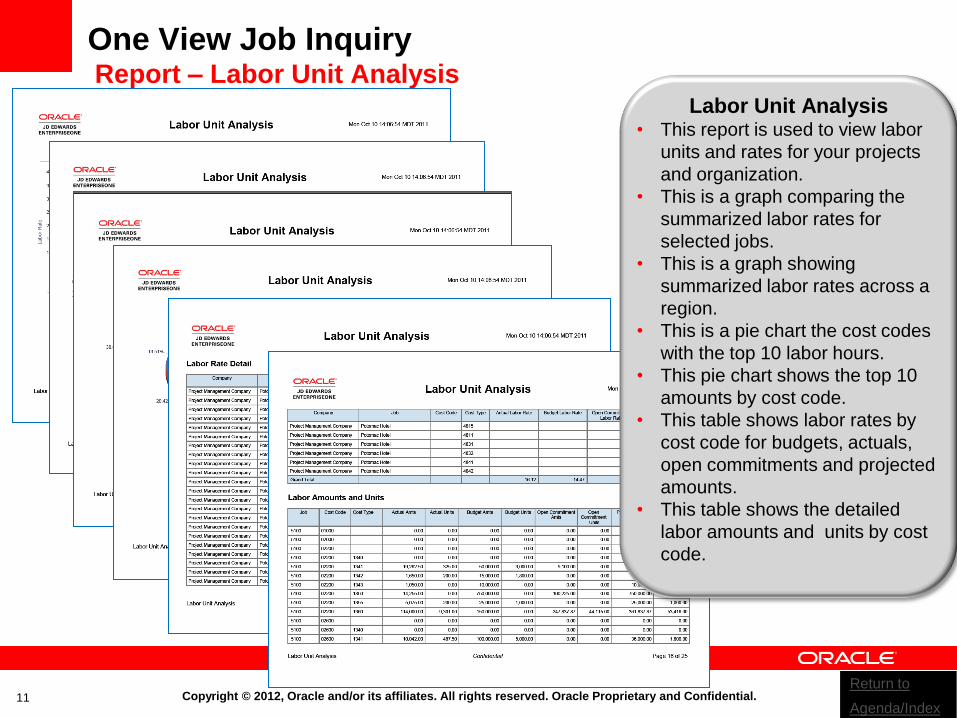
One View Job Inquiry Report – Labor Unit Analysis
Labor Unit Analysis • This report is used to view labor
units and rates for your projects
and organization.
• This is a graph comparing the
summarized labor rates for
selected jobs.
• This is a graph showing
summarized labor rates across a
region.
• This is a pie chart the cost codes
with the top 10 labor hours.
• This pie chart shows the top 10
amounts by cost code.
• This table shows labor rates by
cost code for budgets, actuals,
open commitments and projected
amounts.
• This table shows the detailed
labor amounts and units by cost
code.
Return to
Agenda/Index

Copyright © 2012, Oracle and/or its affiliates. All rights reserved. Oracle Proprietary and Confidential. 12
<Insert Picture Here>
One View Reporting
Sales Order Management
Return to
Agenda/Index

Copyright © 2012, Oracle and/or its affiliates. All rights reserved. Oracle Proprietary and Confidential. 13
Benefits – One View Sales Empower End Users
• Know who your top customers are; by region, territory, product, and so on
• View real-time customer activity
• Analyze customer buying trends and plan accordingly
Improve Customer Relationships
• Use interactive reports with lists, charts, and graphs to drill down to the level of detail
required to make informed business decisions
• Analyze your sales trends and plan accordingly
• Know what your top items are; by region, territory, customer, and so on
• Review your current and historical sales information
Enhance Real-Time Decision Making
• Enable end users to design, create, run, and share reports
• Provide users real-time access to operational data
• Codes vs. descriptions, group by customer, sum by category code, table vs.
chart….View your data the way you want to view it!
• Free up IT resources for projects
Decrease Cost of Reporting
Return to
Agenda/Index
Copyright © 2012, Oracle and/or its affiliates. All rights reserved. Oracle Proprietary and Confidential.
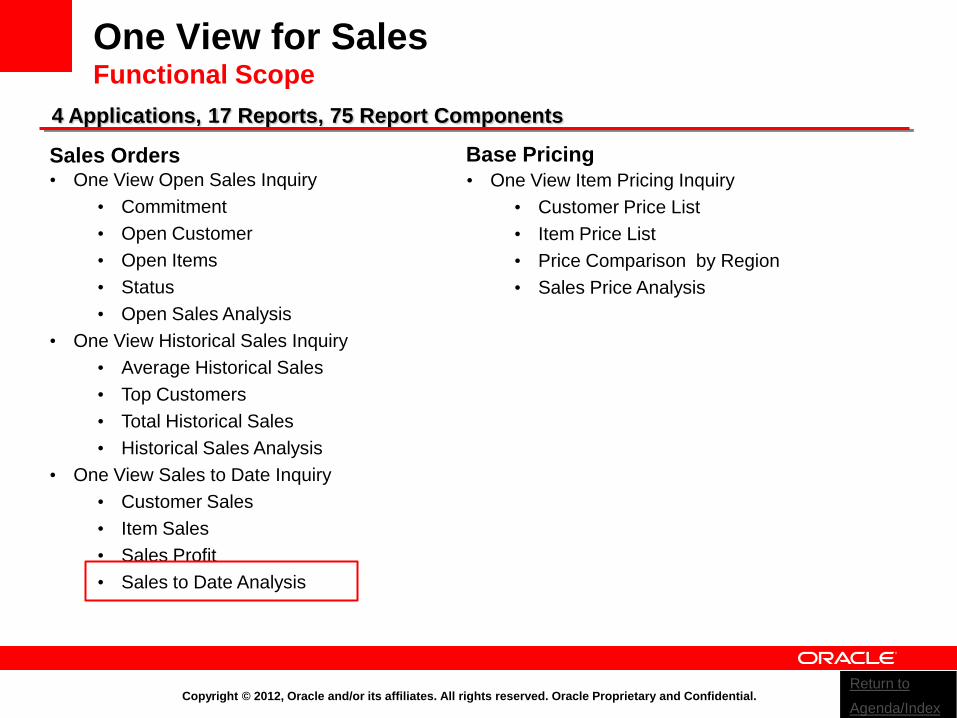
One View for Sales Functional Scope
Sales Orders Base Pricing • One View Open Sales Inquiry
• Commitment
• Open Customer
• Open Items
• Status
• Open Sales Analysis
• One View Historical Sales Inquiry
• Average Historical Sales
• Top Customers
• Total Historical Sales
• Historical Sales Analysis
• One View Sales to Date Inquiry
• Customer Sales
• Item Sales
• Sales Profit
• Sales to Date Analysis
4 Applications, 17 Reports, 75 Report Components
• One View Item Pricing Inquiry
• Customer Price List
• Item Price List
• Price Comparison by Region
• Sales Price Analysis
Return to
Agenda/Index
Copyright © 2012, Oracle and/or its affiliates. All rights reserved. Oracle Proprietary and Confidential. 15
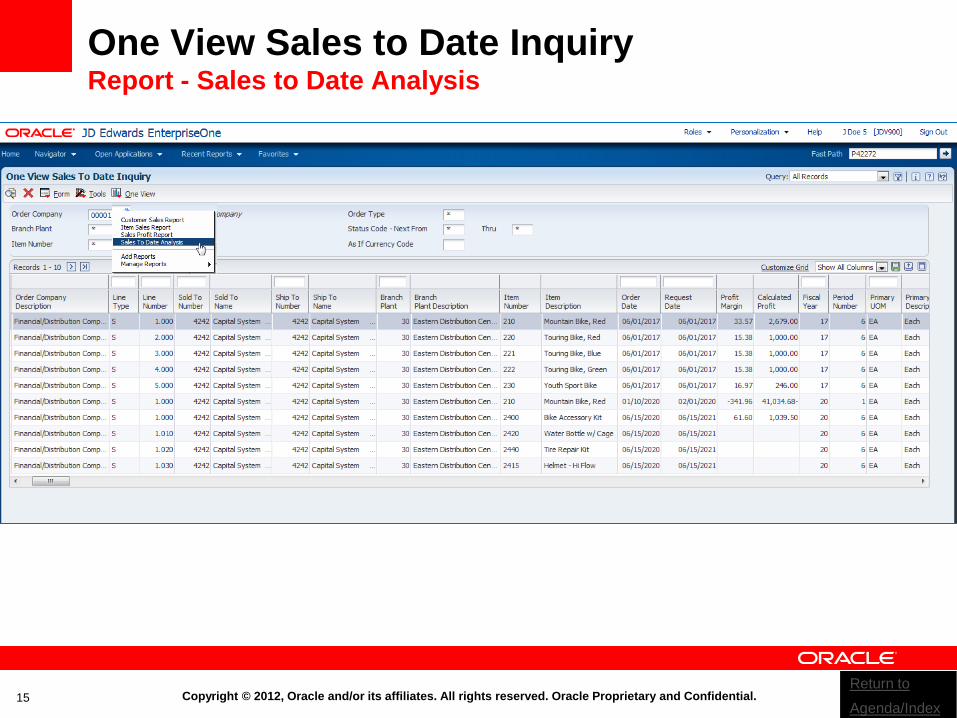
One View Sales to Date Inquiry Report - Sales to Date Analysis
Return to
Agenda/Index
Copyright © 2012, Oracle and/or its affiliates. All rights reserved. Oracle Proprietary and Confidential. 16
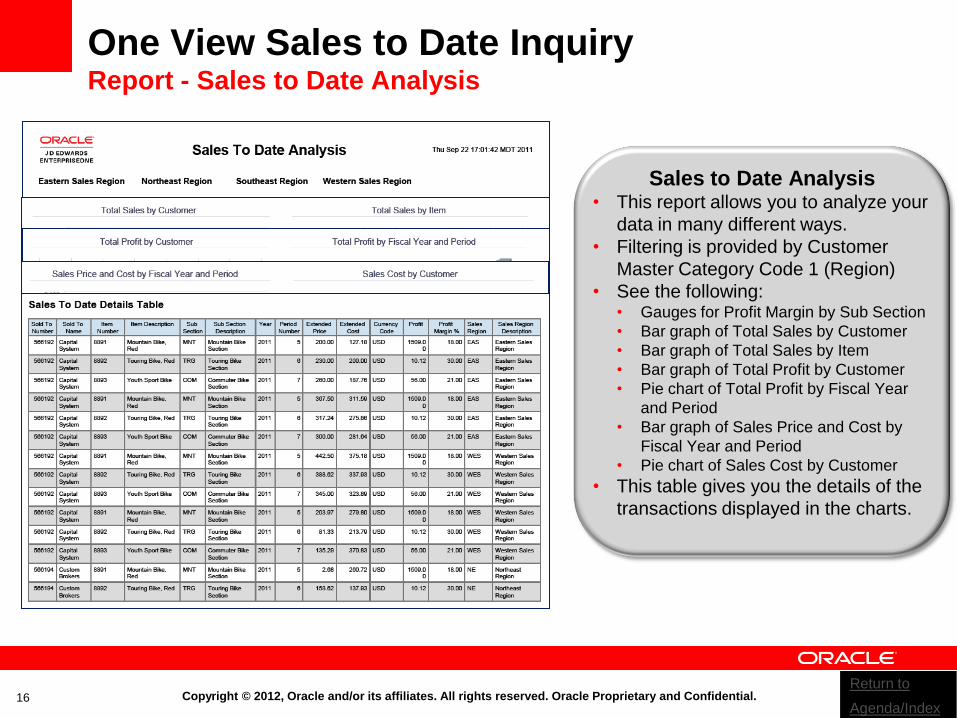
One View Sales to Date Inquiry Report - Sales to Date Analysis
Sales to Date Analysis • This report allows you to analyze your
data in many different ways.
• Filtering is provided by Customer
Master Category Code 1 (Region)
• See the following: • Gauges for Profit Margin by Sub Section
• Bar graph of Total Sales by Customer
• Bar graph of Total Sales by Item
• Bar graph of Total Profit by Customer
• Pie chart of Total Profit by Fiscal Year
and Period
• Bar graph of Sales Price and Cost by
Fiscal Year and Period
• Pie chart of Sales Cost by Customer
• This table gives you the details of the
transactions displayed in the charts.
Return to
Agenda/Index

Copyright © 2012, Oracle and/or its affiliates. All rights reserved. Oracle Proprietary and Confidential. 17
<Insert Picture Here>
One View Reporting
Capital Asset Management
Return to
Agenda/Index
Copyright © 2012, Oracle and/or its affiliates. All rights reserved. Oracle Proprietary and Confidential. 18
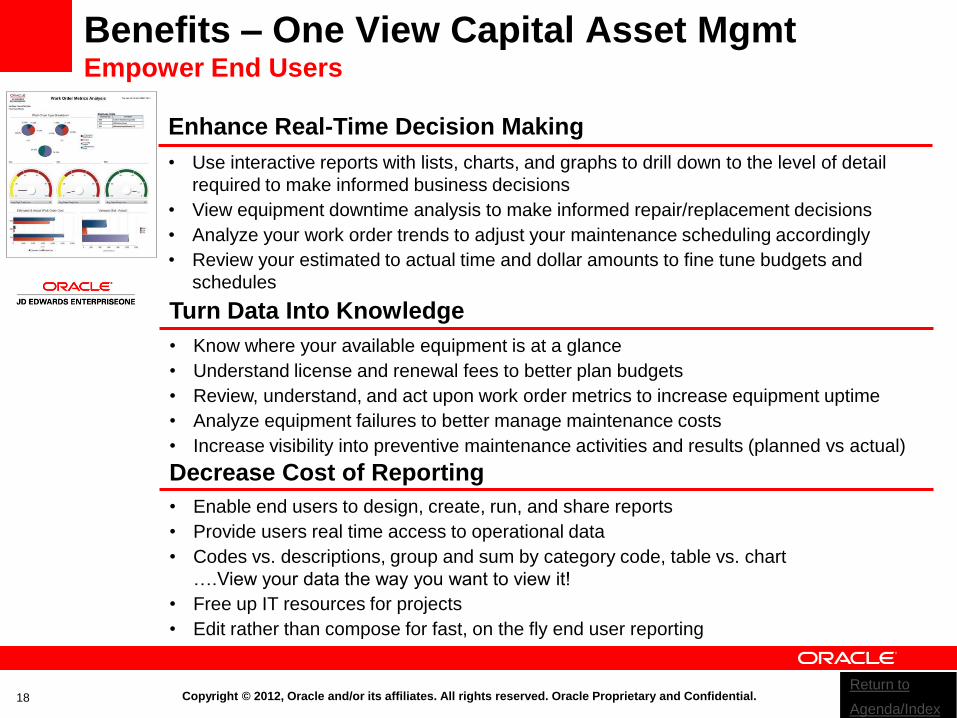
Benefits – One View Capital Asset Mgmt Empower End Users
• Know where your available equipment is at a glance
• Understand license and renewal fees to better plan budgets
• Review, understand, and act upon work order metrics to increase equipment uptime
• Analyze equipment failures to better manage maintenance costs
• Increase visibility into preventive maintenance activities and results (planned vs actual)
Turn Data Into Knowledge
• Use interactive reports with lists, charts, and graphs to drill down to the level of detail
required to make informed business decisions
• View equipment downtime analysis to make informed repair/replacement decisions
• Analyze your work order trends to adjust your maintenance scheduling accordingly
• Review your estimated to actual time and dollar amounts to fine tune budgets and
schedules
Enhance Real-Time Decision Making
• Enable end users to design, create, run, and share reports
• Provide users real time access to operational data
• Codes vs. descriptions, group and sum by category code, table vs. chart
….View your data the way you want to view it!
• Free up IT resources for projects
• Edit rather than compose for fast, on the fly end user reporting
Decrease Cost of Reporting
Return to
Agenda/Index
Copyright © 2012, Oracle and/or its affiliates. All rights reserved. Oracle Proprietary and Confidential.
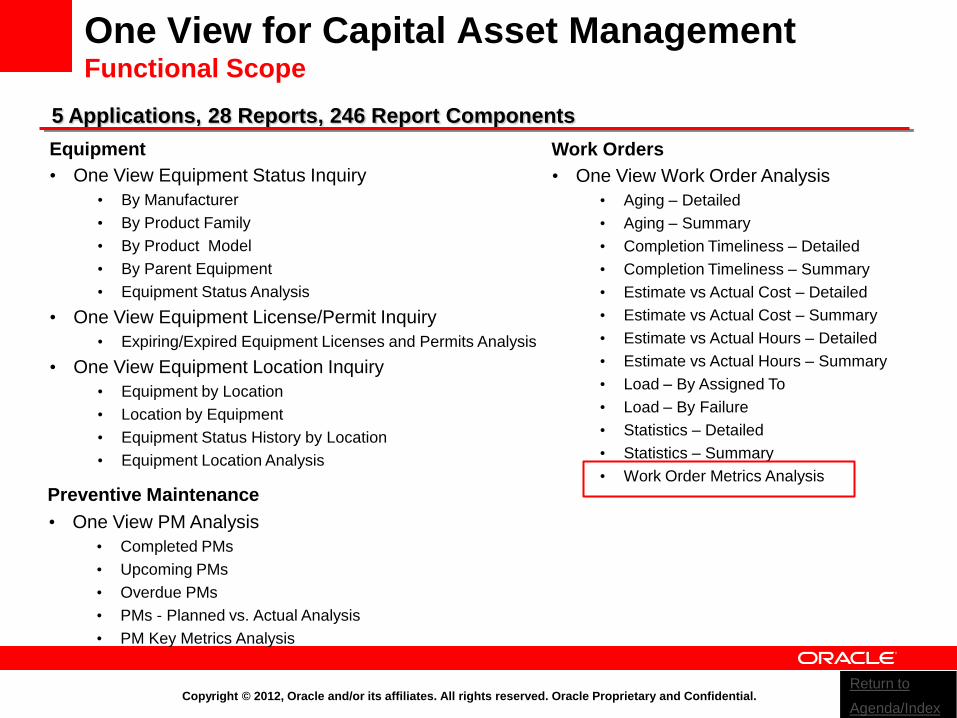
One View for Capital Asset Management Functional Scope
Equipment Work Orders
• One View Equipment Status Inquiry
• By Manufacturer
• By Product Family
• By Product Model
• By Parent Equipment
• Equipment Status Analysis
• One View Equipment License/Permit Inquiry
• Expiring/Expired Equipment Licenses and Permits Analysis
• One View Equipment Location Inquiry
• Equipment by Location
• Location by Equipment
• Equipment Status History by Location
• Equipment Location Analysis
5 Applications, 28 Reports, 246 Report Components
• One View Work Order Analysis
• Aging – Detailed
• Aging – Summary
• Completion Timeliness – Detailed
• Completion Timeliness – Summary
• Estimate vs Actual Cost – Detailed
• Estimate vs Actual Cost – Summary
• Estimate vs Actual Hours – Detailed
• Estimate vs Actual Hours – Summary
• Load – By Assigned To
• Load – By Failure
• Statistics – Detailed
• Statistics – Summary
• Work Order Metrics Analysis
• One View PM Analysis
• Completed PMs
• Upcoming PMs
• Overdue PMs
• PMs - Planned vs. Actual Analysis
• PM Key Metrics Analysis
Preventive Maintenance
Return to
Agenda/Index
Copyright © 2012, Oracle and/or its affiliates. All rights reserved. Oracle Proprietary and Confidential. 20
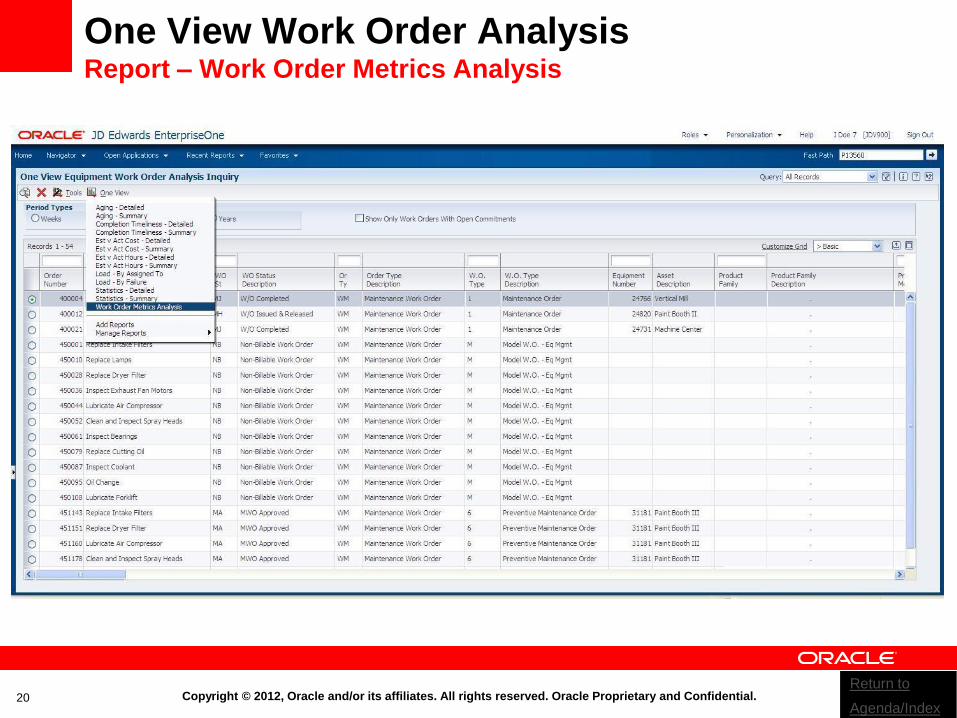
One View Work Order Analysis Report – Work Order Metrics Analysis
Return to
Agenda/Index

Copyright © 2012, Oracle and/or its affiliates. All rights reserved. Oracle Proprietary and Confidential. 21
Work Order Metrics Analysis • This report presents key metrics
for your work orders.
• Filtering is provided by Business
Unit, Supervisor and Lead Craft.
• See the following: • Gauges show the avg. age in days
for work orders by Business Unit.
• Pie graphs show the distribution of
Work Order Types by Business
Unit.
• These line graphs show the work
order load by Business Unit across
13 periods for incoming, planned
and completed work orders.
• Gauges show the avg. # of days
that work orders were completed
early or late by Business Unit.
• Bar graphs show the avg. estimated
and actual costs (left) and their
variance (right) by Business Unit.
• There are charts for Business
Unit, Supervisor and Lead Craft
that allow you to see the detail for
the specific work orders.
One View Work Order Analysis Report – Work Order Metrics Analysis
Return to
Agenda/Index
Copyright © 2012, Oracle and/or its affiliates. All rights reserved. Oracle Proprietary and Confidential. 22
<Insert Picture Here>
One View Reporting
Service Management
Return to
Agenda/Index
Copyright © 2012, Oracle and/or its affiliates. All rights reserved. Oracle Proprietary and Confidential. 23
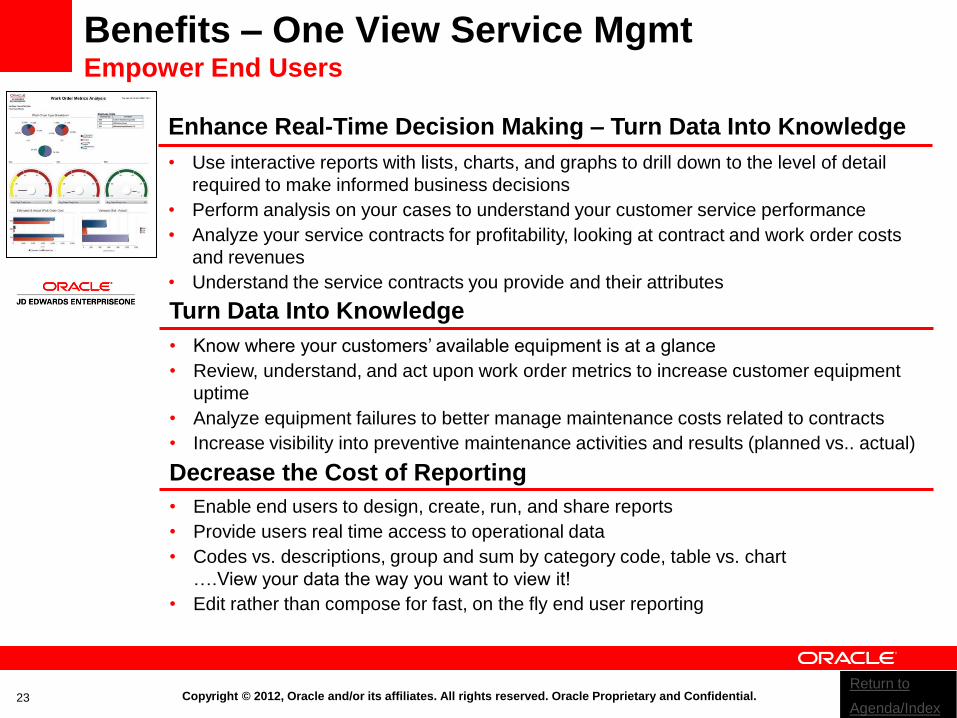
Benefits – One View Service Mgmt Empower End Users
• Know where your customers’ available equipment is at a glance
• Review, understand, and act upon work order metrics to increase customer equipment
uptime
• Analyze equipment failures to better manage maintenance costs related to contracts
• Increase visibility into preventive maintenance activities and results (planned vs.. actual)
Turn Data Into Knowledge
• Use interactive reports with lists, charts, and graphs to drill down to the level of detail
required to make informed business decisions
• Perform analysis on your cases to understand your customer service performance
• Analyze your service contracts for profitability, looking at contract and work order costs
and revenues
• Understand the service contracts you provide and their attributes
Enhance Real-Time Decision Making – Turn Data Into Knowledge
• Enable end users to design, create, run, and share reports
• Provide users real time access to operational data
• Codes vs. descriptions, group and sum by category code, table vs. chart
….View your data the way you want to view it!
• Edit rather than compose for fast, on the fly end user reporting
Decrease the Cost of Reporting
Return to
Agenda/Index

Copyright © 2012, Oracle and/or its affiliates. All rights reserved. Oracle Proprietary and Confidential.
One View for Service Management Functional Scope
Equipment*
Work Orders*
• One View Equipment Status Inquiry • By Manufacturer
• By Product Family
• By Product Model
• By Parent Equipment
• Equipment Status Analysis
• One View Equipment License/Permit Inquiry • Expiring/Expired Equipment Licenses and Permits Analysis
• One View Equipment Location Inquiry • Equipment by Location
• Location by Equipment
• Equipment Status History by Location
• Equipment Location Analysis
8 Applications*, 38 Reports, 361 Report Components
• One View Work Order Analysis • Aging – Detailed
• Aging – Summary
• Completion Timeliness – Detailed
• Completion Timeliness – Summary
• Estimate vs Actual Cost – Detailed
• Estimate vs Actual Cost – Summary
• Estimate vs Actual Hours – Detailed
• Estimate vs Actual Hours – Summary
• Load – By Assigned To
• Load – By Failure
• Statistics – Detailed
• Statistics – Summary
• Work Order Metrics Analysis
• One View PM Analysis • Completed PMs
• Upcoming PMs
• Overdue PMs
• PMs - Planned vs. Actual Analysis
• PM Key Metrics Analysis
Preventive Maintenance*
Cases
Contracts • One View Service Contract Inquiry
• Contracts by Customer
• Contracts by Equipment
• Contracts by Inventory
• Expired – Expiring Contracts
• One View Service Contract Profitability Inquiry • Service Contract Profitability
• One View Case Management Inquiry • Case Aging
• Case Commitment Results
• Case Load
• Case Statistics
• Overdue Open Cases
*The 5 applications of One View for Capital Asset Management are included in One View for Service Management. Service Management also includes the following 3 applications:
Return to
Agenda/Index
Copyright © 2012, Oracle and/or its affiliates. All rights reserved. Oracle Proprietary and Confidential. 25
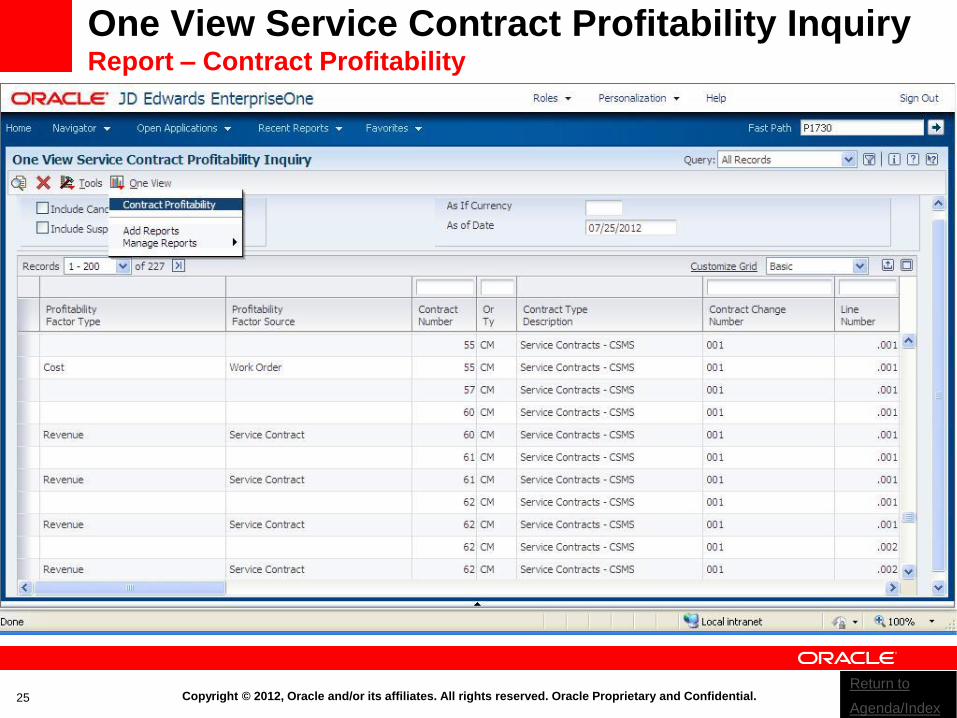
One View Service Contract Profitability Inquiry
Report – Contract Profitability
Return to
Agenda/Index
Copyright © 2012, Oracle and/or its affiliates. All rights reserved. Oracle Proprietary and Confidential. 26
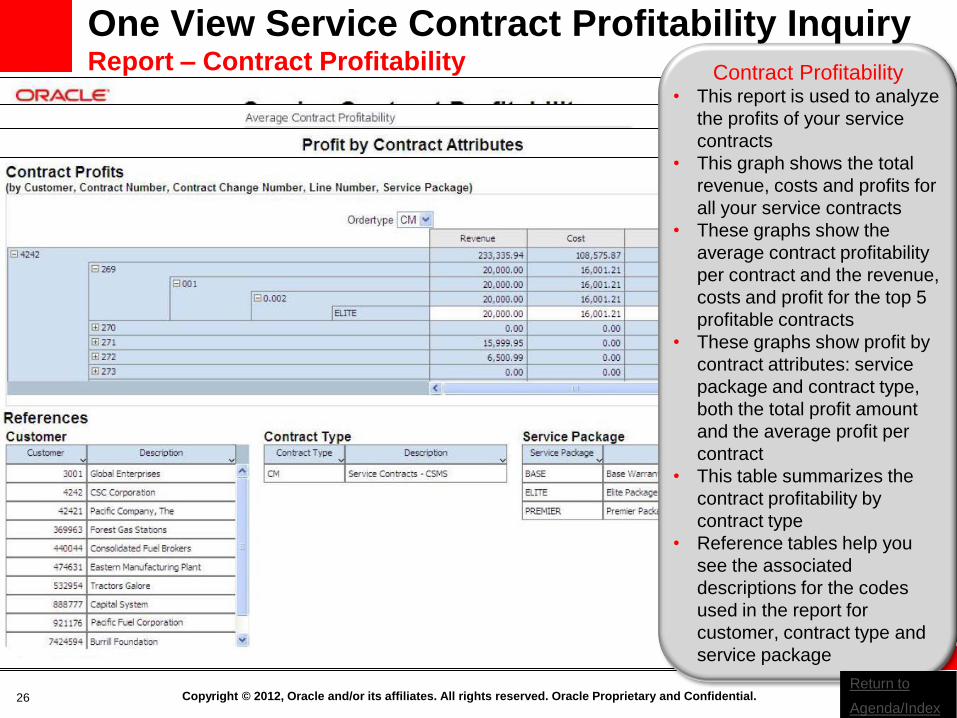
Contract Profitability • This report is used to analyze
the profits of your service
contracts
• This graph shows the total
revenue, costs and profits for
all your service contracts
• These graphs show the
average contract profitability
per contract and the revenue,
costs and profit for the top 5
profitable contracts
• These graphs show profit by
contract attributes: service
package and contract type,
both the total profit amount
and the average profit per
contract
• This table summarizes the
contract profitability by
contract type
• Reference tables help you
see the associated
descriptions for the codes
used in the report for
customer, contract type and
service package
One View Service Contract Profitability Inquiry
Report – Contract Profitability
Return to
Agenda/Index

Copyright © 2012, Oracle and/or its affiliates. All rights reserved. Oracle Proprietary and Confidential. 27
<Insert Picture Here>
One View Reporting
Real Estate Management
Return to
Agenda/Index
Copyright © 2012, Oracle and/or its affiliates. All rights reserved. Oracle Proprietary and Confidential. 28
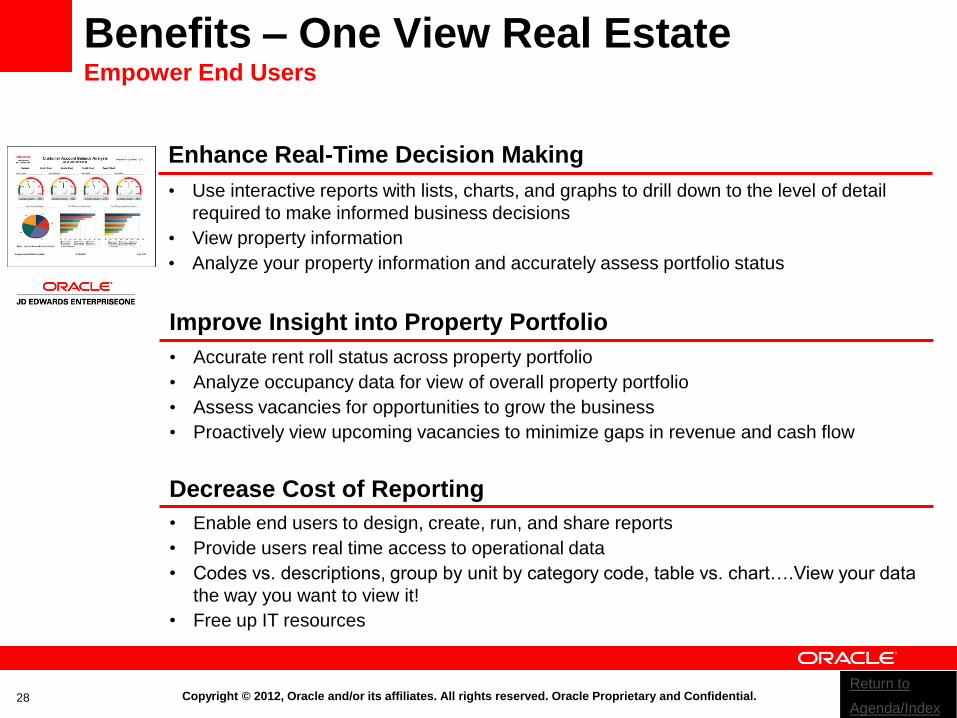
Benefits – One View Real Estate Empower End Users
• Accurate rent roll status across property portfolio
• Analyze occupancy data for view of overall property portfolio
• Assess vacancies for opportunities to grow the business
• Proactively view upcoming vacancies to minimize gaps in revenue and cash flow
Improve Insight into Property Portfolio
• Use interactive reports with lists, charts, and graphs to drill down to the level of detail
required to make informed business decisions
• View property information
• Analyze your property information and accurately assess portfolio status
Enhance Real-Time Decision Making
• Enable end users to design, create, run, and share reports
• Provide users real time access to operational data
• Codes vs. descriptions, group by unit by category code, table vs. chart….View your data
the way you want to view it!
• Free up IT resources
Decrease Cost of Reporting
Return to
Agenda/Index
Copyright © 2012, Oracle and/or its affiliates. All rights reserved. Oracle Proprietary and Confidential.
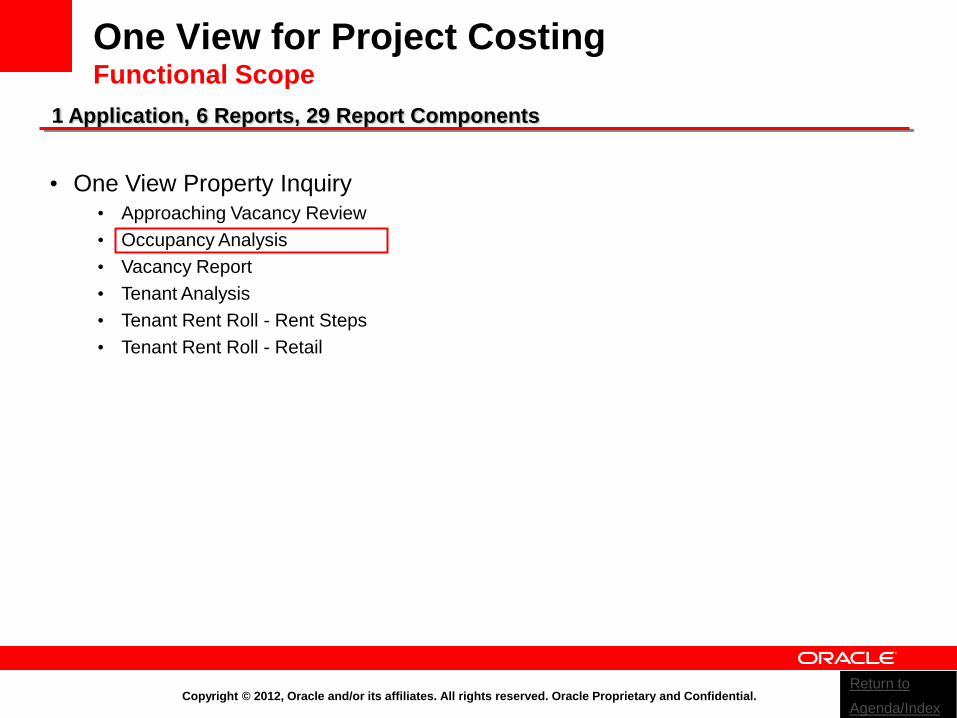
One View for Project Costing Functional Scope
• One View Property Inquiry • Approaching Vacancy Review
• Occupancy Analysis
• Vacancy Report
• Tenant Analysis
• Tenant Rent Roll - Rent Steps
• Tenant Rent Roll - Retail
1 Application, 6 Reports, 29 Report Components
Return to
Agenda/Index
Copyright © 2012, Oracle and/or its affiliates. All rights reserved. Oracle Proprietary and Confidential. 30
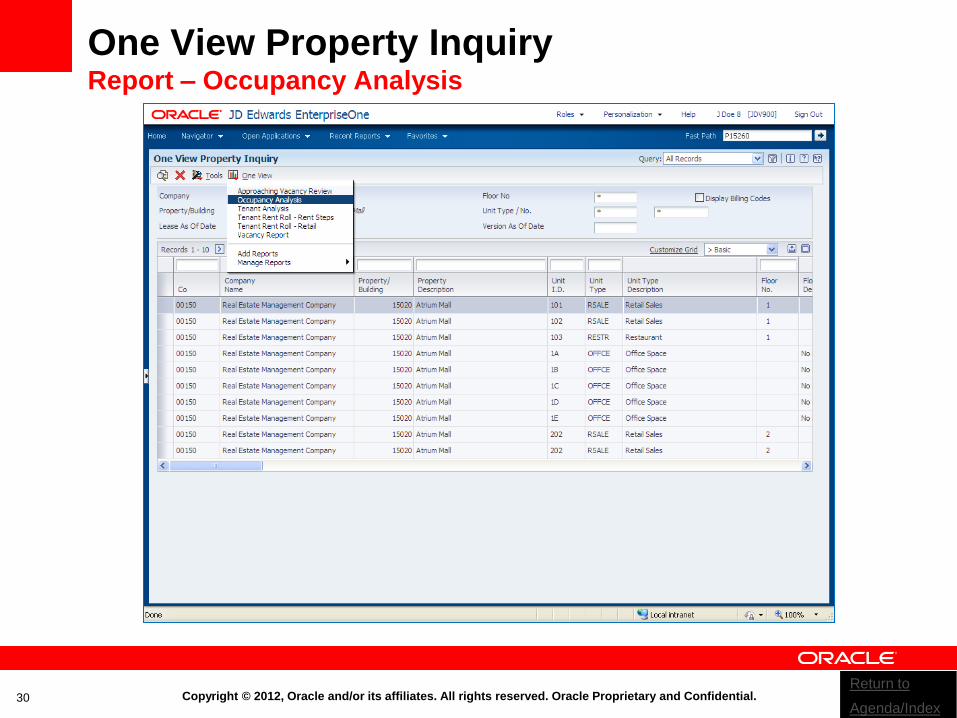
One View Property Inquiry Report – Occupancy Analysis
Return to
Agenda/Index
Copyright © 2012, Oracle and/or its affiliates. All rights reserved. Oracle Proprietary and Confidential. 31
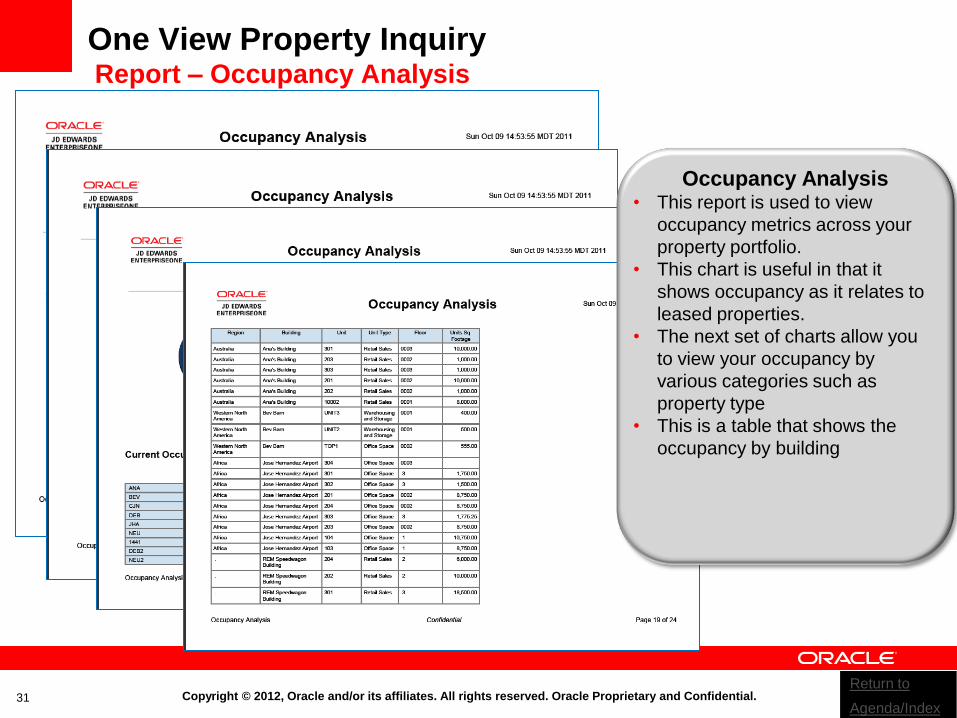
One View Property Inquiry Report – Occupancy Analysis
Occupancy Analysis • This report is used to view
occupancy metrics across your
property portfolio.
• This chart is useful in that it
shows occupancy as it relates to
leased properties.
• The next set of charts allow you
to view your occupancy by
various categories such as
property type
• This is a table that shows the
occupancy by building
Return to
Agenda/Index

Copyright © 2012, Oracle and/or its affiliates. All rights reserved. Oracle Proprietary and Confidential. 32
<Insert Picture Here>
One View Reporting
Financials
Return to
Agenda/Index
Copyright © 2012, Oracle and/or its affiliates. All rights reserved. Oracle Proprietary and Confidential. 33
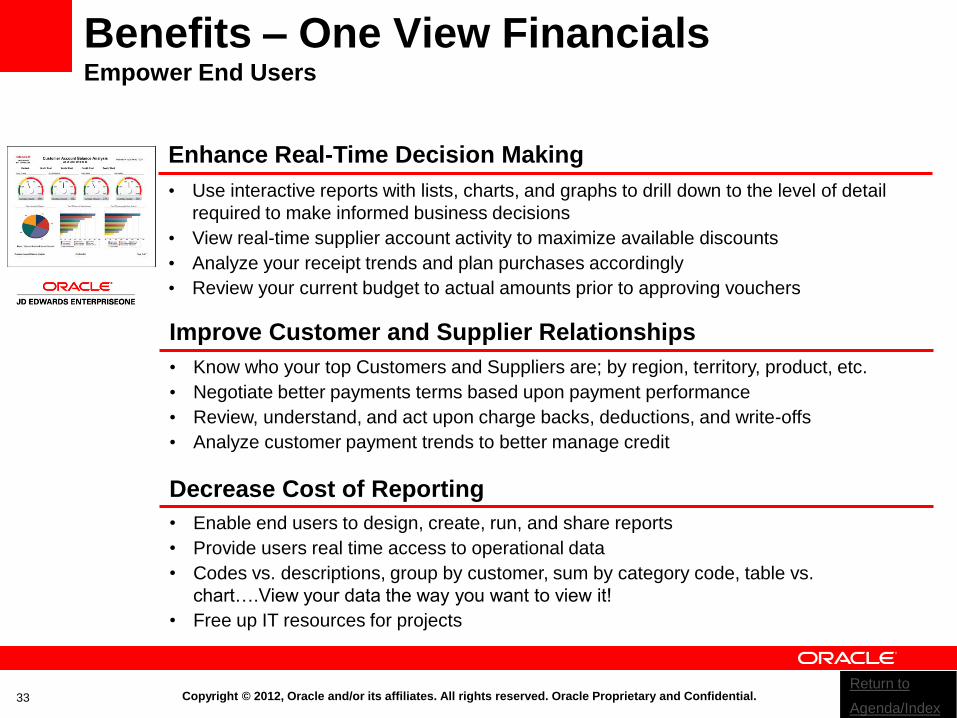
Benefits – One View Financials Empower End Users
• Know who your top Customers and Suppliers are; by region, territory, product, etc.
• Negotiate better payments terms based upon payment performance
• Review, understand, and act upon charge backs, deductions, and write-offs
• Analyze customer payment trends to better manage credit
Improve Customer and Supplier Relationships
• Use interactive reports with lists, charts, and graphs to drill down to the level of detail
required to make informed business decisions
• View real-time supplier account activity to maximize available discounts
• Analyze your receipt trends and plan purchases accordingly
• Review your current budget to actual amounts prior to approving vouchers
Enhance Real-Time Decision Making
• Enable end users to design, create, run, and share reports
• Provide users real time access to operational data
• Codes vs. descriptions, group by customer, sum by category code, table vs.
chart….View your data the way you want to view it!
• Free up IT resources for projects
Decrease Cost of Reporting
Return to
Agenda/Index
Copyright © 2012, Oracle and/or its affiliates. All rights reserved. Oracle Proprietary and Confidential.
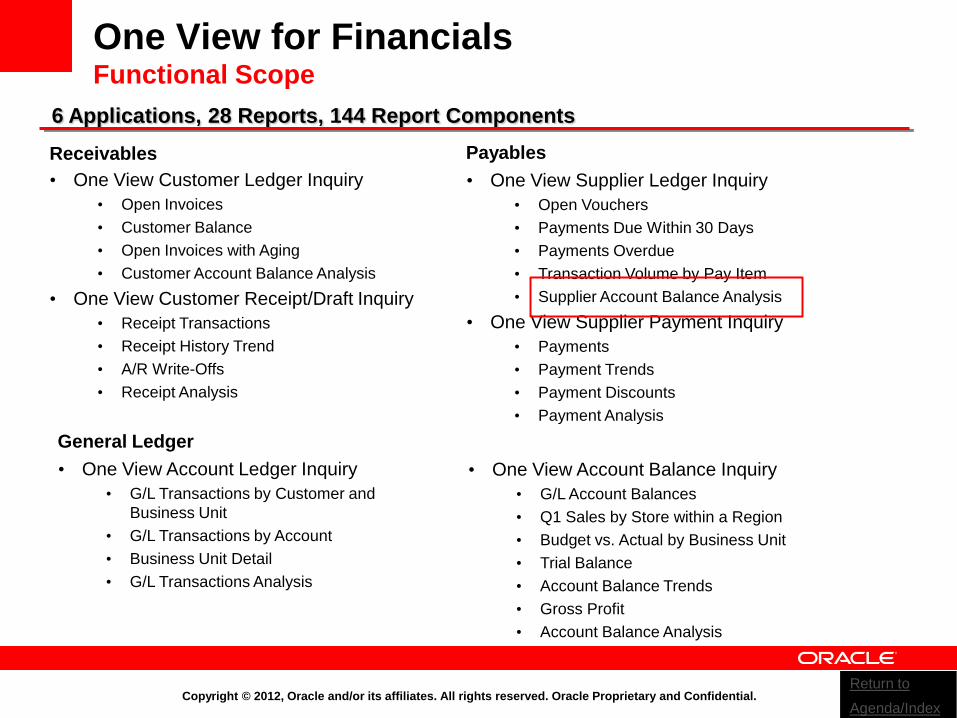
One View for Financials Functional Scope
Receivables Payables
• One View Customer Ledger Inquiry
• Open Invoices
• Customer Balance
• Open Invoices with Aging
• Customer Account Balance Analysis
• One View Customer Receipt/Draft Inquiry
• Receipt Transactions
• Receipt History Trend
• A/R Write-Offs
• Receipt Analysis
6 Applications, 28 Reports, 144 Report Components
• One View Supplier Ledger Inquiry
• Open Vouchers
• Payments Due Within 30 Days
• Payments Overdue
• Transaction Volume by Pay Item
• Supplier Account Balance Analysis
• One View Supplier Payment Inquiry
• Payments
• Payment Trends
• Payment Discounts
• Payment Analysis
General Ledger
• One View Account Ledger Inquiry
• G/L Transactions by Customer and
Business Unit
• G/L Transactions by Account
• Business Unit Detail
• G/L Transactions Analysis
• One View Account Balance Inquiry
• G/L Account Balances
• Q1 Sales by Store within a Region
• Budget vs. Actual by Business Unit
• Trial Balance
• Account Balance Trends
• Gross Profit
• Account Balance Analysis
Return to
Agenda/Index

Copyright © 2012, Oracle and/or its affiliates. All rights reserved. Oracle Proprietary and Confidential. 35
One View Supplier Ledger Inquiry Report – Supplier Account Balance Analysis
Return to
Agenda/Index
Copyright © 2012, Oracle and/or its affiliates. All rights reserved. Oracle Proprietary and Confidential. 36
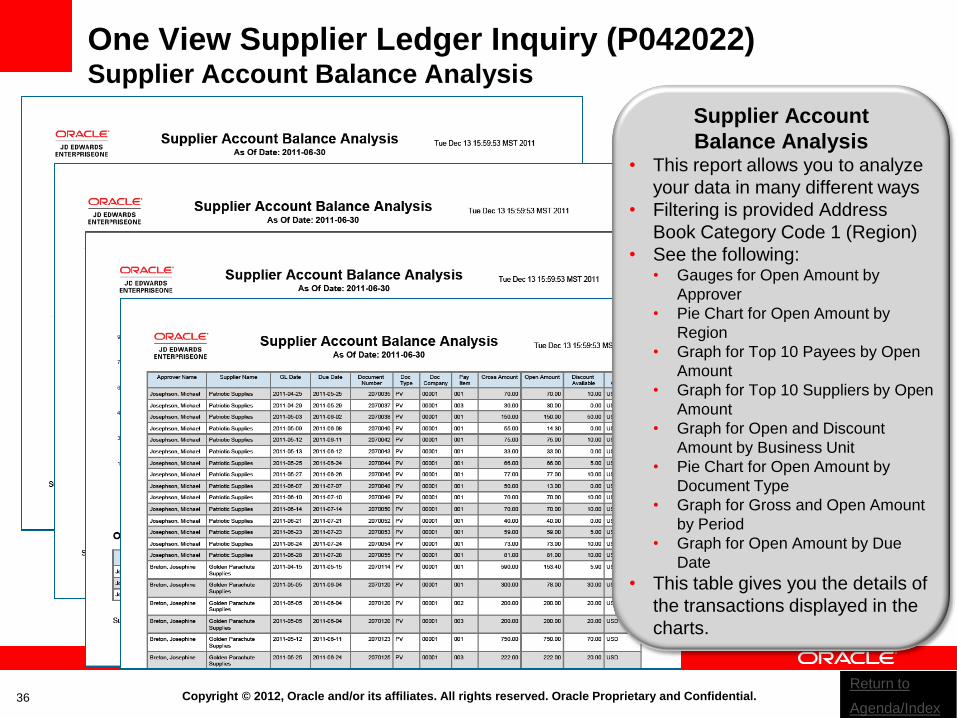
One View Supplier Ledger Inquiry (P042022) Supplier Account Balance Analysis
Supplier Account
Balance Analysis • This report allows you to analyze
your data in many different ways
• Filtering is provided Address
Book Category Code 1 (Region)
• See the following: • Gauges for Open Amount by
Approver
• Pie Chart for Open Amount by
Region
• Graph for Top 10 Payees by Open
Amount
• Graph for Top 10 Suppliers by Open
Amount
• Graph for Open and Discount
Amount by Business Unit
• Pie Chart for Open Amount by
Document Type
• Graph for Gross and Open Amount
by Period
• Graph for Open Amount by Due
Date
• This table gives you the details of
the transactions displayed in the
charts.
Return to
Agenda/Index
Copyright © 2012, Oracle and/or its affiliates. All rights reserved. Oracle Proprietary and Confidential. 37
<Insert Picture Here>
One View Reporting
Manufacturing Management
Return to
Agenda/Index
Copyright © 2012, Oracle and/or its affiliates. All rights reserved. Oracle Proprietary and Confidential. 38
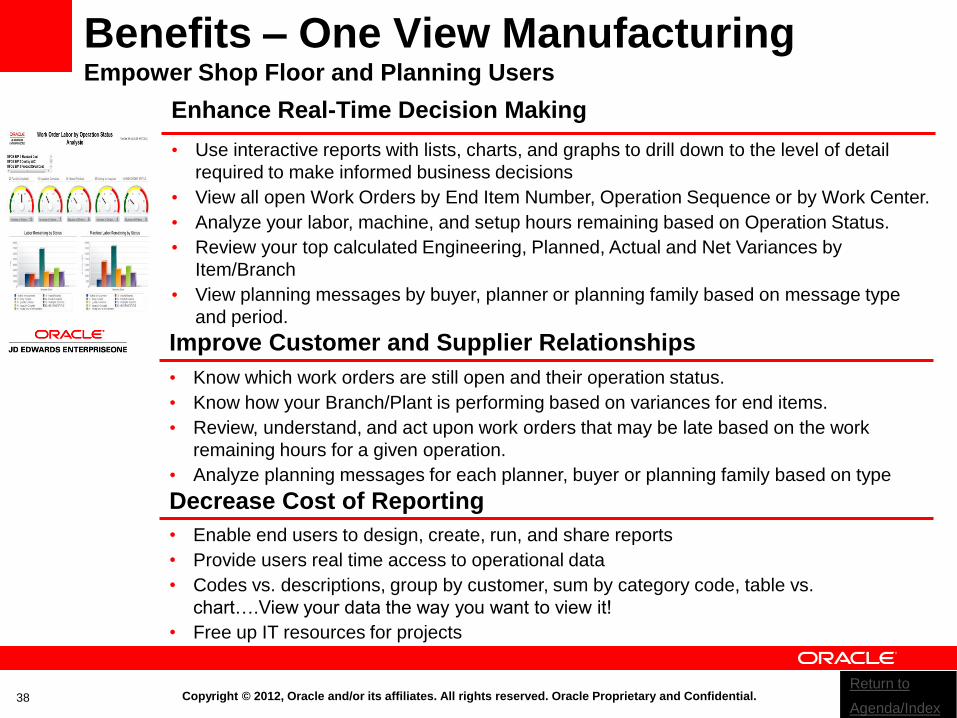
Benefits – One View Manufacturing Empower Shop Floor and Planning Users
• Know which work orders are still open and their operation status.
• Know how your Branch/Plant is performing based on variances for end items.
• Review, understand, and act upon work orders that may be late based on the work
remaining hours for a given operation.
• Analyze planning messages for each planner, buyer or planning family based on type
Improve Customer and Supplier Relationships
• Use interactive reports with lists, charts, and graphs to drill down to the level of detail
required to make informed business decisions
• View all open Work Orders by End Item Number, Operation Sequence or by Work Center.
• Analyze your labor, machine, and setup hours remaining based on Operation Status.
• Review your top calculated Engineering, Planned, Actual and Net Variances by
Item/Branch
• View planning messages by buyer, planner or planning family based on message type
and period.
Enhance Real-Time Decision Making
• Enable end users to design, create, run, and share reports
• Provide users real time access to operational data
• Codes vs. descriptions, group by customer, sum by category code, table vs.
chart….View your data the way you want to view it!
• Free up IT resources for projects
Decrease Cost of Reporting
Return to
Agenda/Index
Copyright © 2012, Oracle and/or its affiliates. All rights reserved. Oracle Proprietary and Confidential.
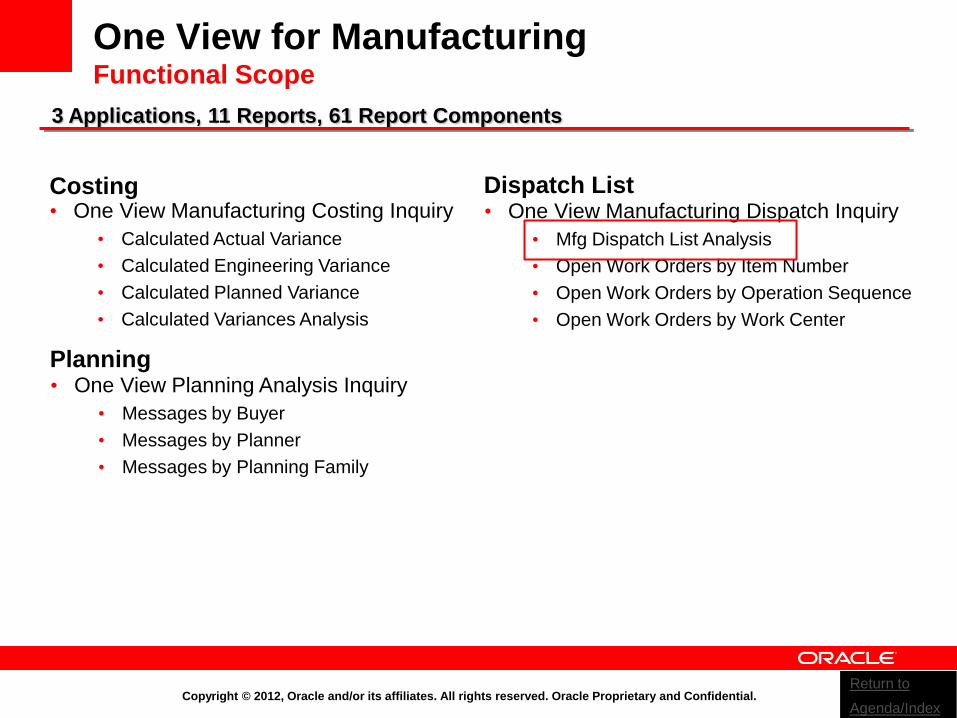
One View for Manufacturing Functional Scope
Costing Dispatch List • One View Manufacturing Costing Inquiry
• Calculated Actual Variance
• Calculated Engineering Variance
• Calculated Planned Variance
• Calculated Variances Analysis
3 Applications, 11 Reports, 61 Report Components
• One View Manufacturing Dispatch Inquiry
• Mfg Dispatch List Analysis
• Open Work Orders by Item Number
• Open Work Orders by Operation Sequence
• Open Work Orders by Work Center
Planning • One View Planning Analysis Inquiry
• Messages by Buyer
• Messages by Planner
• Messages by Planning Family
Return to
Agenda/Index
Copyright © 2012, Oracle and/or its affiliates. All rights reserved. Oracle Proprietary and Confidential. 40
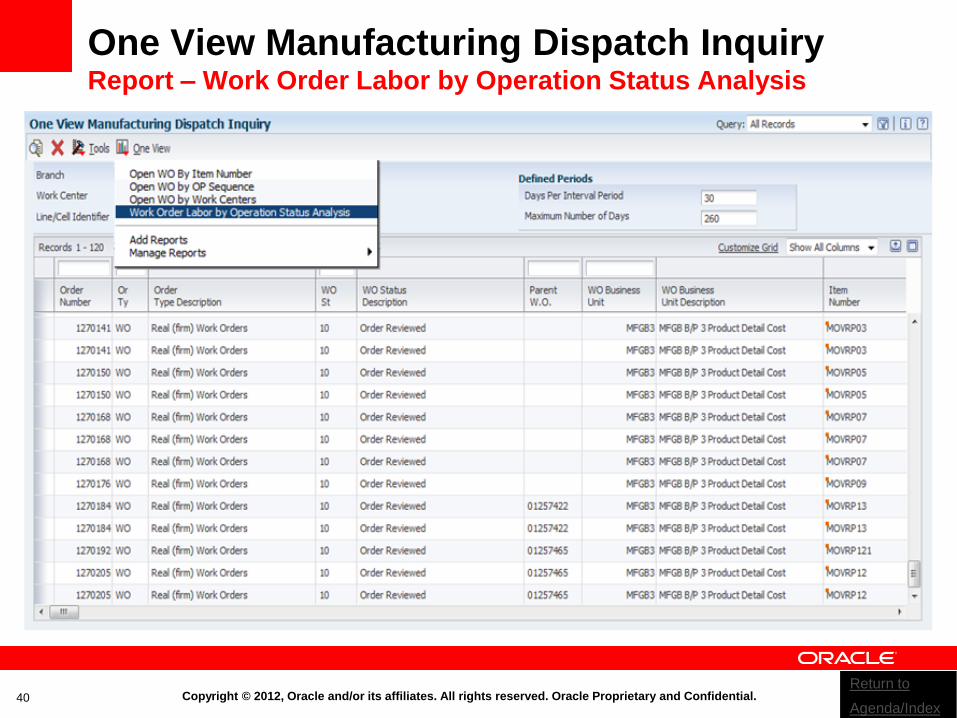
One View Manufacturing Dispatch Inquiry Report – Work Order Labor by Operation Status Analysis
Return to
Agenda/Index
Copyright © 2012, Oracle and/or its affiliates. All rights reserved. Oracle Proprietary and Confidential. 41
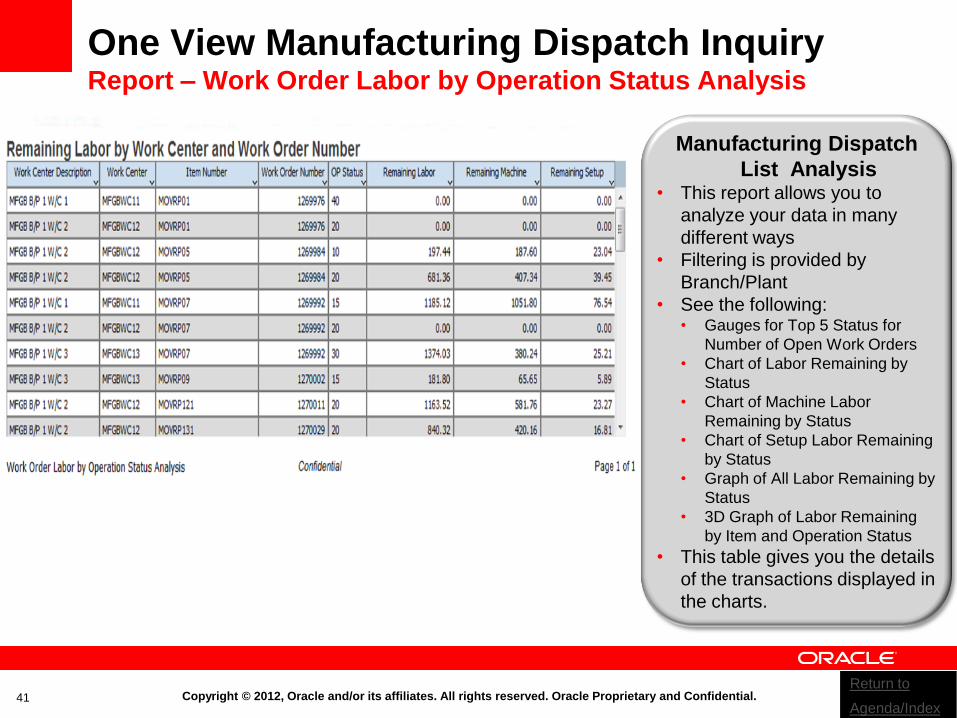
One View Manufacturing Dispatch Inquiry Report – Work Order Labor by Operation Status Analysis
Manufacturing Dispatch
List Analysis • This report allows you to
analyze your data in many
different ways
• Filtering is provided by
Branch/Plant
• See the following: • Gauges for Top 5 Status for
Number of Open Work Orders
• Chart of Labor Remaining by
Status
• Chart of Machine Labor
Remaining by Status
• Chart of Setup Labor Remaining
by Status
• Graph of All Labor Remaining by
Status
• 3D Graph of Labor Remaining
by Item and Operation Status
• This table gives you the details
of the transactions displayed in
the charts.
Return to
Agenda/Index

Copyright © 2012, Oracle and/or its affiliates. All rights reserved. Oracle Proprietary and Confidential. 42
<Insert Picture Here>
One View Reporting
Inventory Management
Return to
Agenda/Index

Copyright © 2012, Oracle and/or its affiliates. All rights reserved. Oracle Proprietary and Confidential. 43
Benefits – One View Inventory Empower End Users
• Gain historical insight of inventory items and trending analysis over a pre-defined period
of time
• Broad visibility of the average cost of items across branch/plants, over a fiscal period, by
location and lot
• Perform analysis and comparisons of the average cost of items across companies
Improve Supply Chain Inventory Levels
• Use interactive reports with lists, charts, and graphs to drill down to the level of detail
required to make informed business decisions
• View real-time inventory activity to maximize your inventory quantity levels
• Analyze your inventory costs throughout your supply chain
Enhance Real-Time Decision Making
• Enable end users to design, create, run, and share reports
• Codes vs. descriptions, group by customer, sum by category code, table vs.
chart….View your data the way you want to view it!
• Free up IT resources for projects
Decrease Cost of Reporting
Return to
Agenda/Index
Copyright © 2012, Oracle and/or its affiliates. All rights reserved. Oracle Proprietary and Confidential.
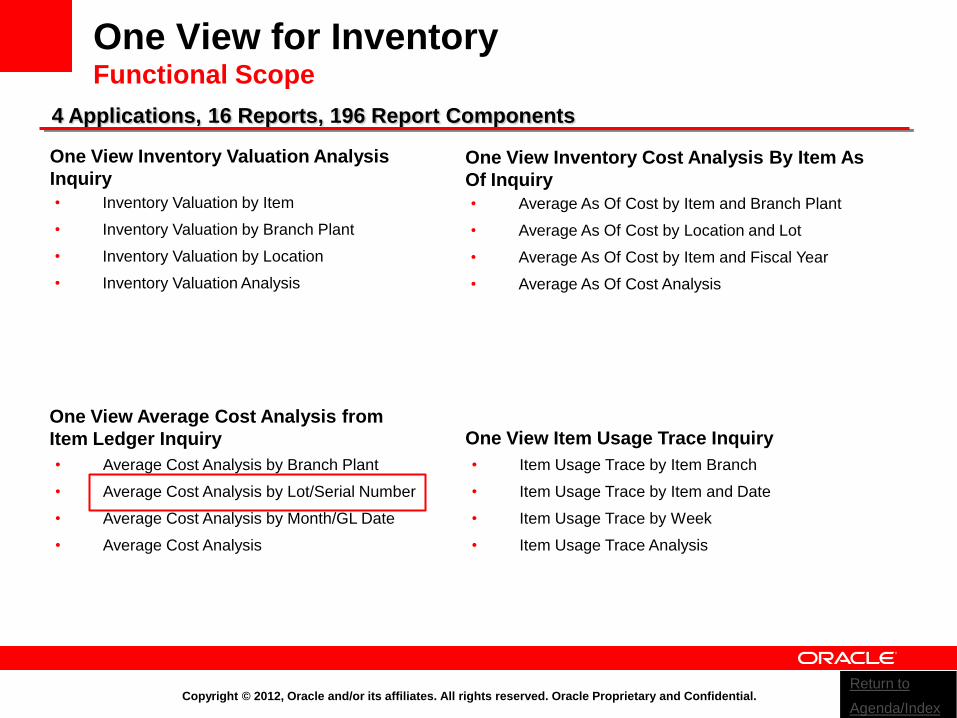
One View for Inventory Functional Scope
One View Average Cost Analysis from
Item Ledger Inquiry
• Average Cost Analysis by Branch Plant
• Average Cost Analysis by Lot/Serial Number
• Average Cost Analysis by Month/GL Date
• Average Cost Analysis
4 Applications, 16 Reports, 196 Report Components
One View Inventory Valuation Analysis
Inquiry
• Inventory Valuation by Item
• Inventory Valuation by Branch Plant
• Inventory Valuation by Location
• Inventory Valuation Analysis
• Item Usage Trace by Item Branch
• Item Usage Trace by Item and Date
• Item Usage Trace by Week
• Item Usage Trace Analysis
One View Item Usage Trace Inquiry
• Average As Of Cost by Item and Branch Plant
• Average As Of Cost by Location and Lot
• Average As Of Cost by Item and Fiscal Year
• Average As Of Cost Analysis
One View Inventory Cost Analysis By Item As
Of Inquiry
Return to
Agenda/Index
Copyright © 2012, Oracle and/or its affiliates. All rights reserved. Oracle Proprietary and Confidential. 45
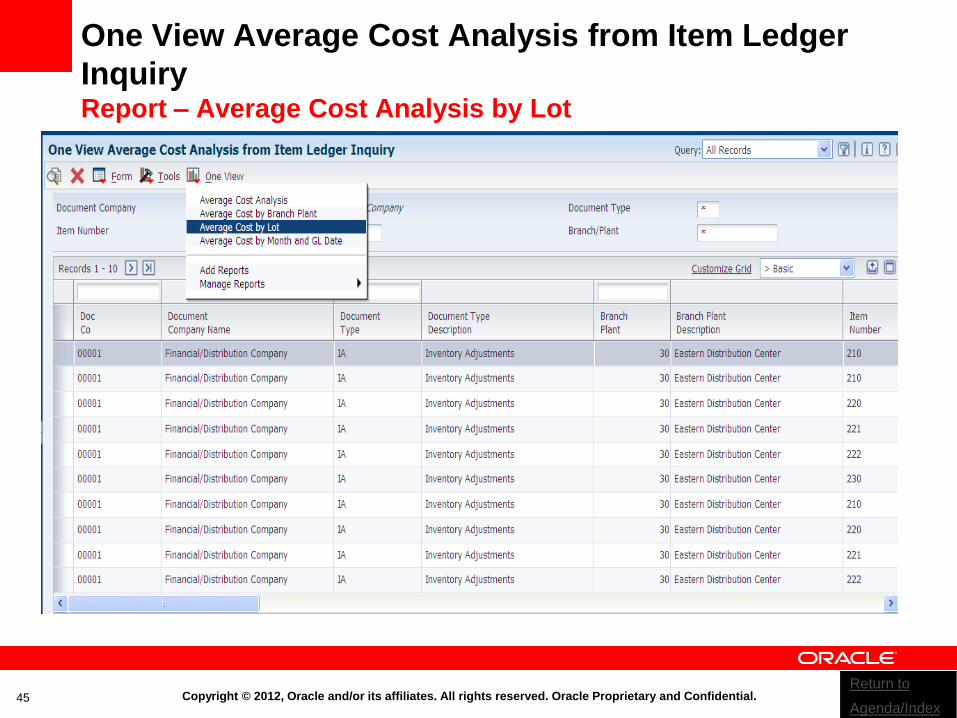
One View Average Cost Analysis from Item Ledger
Inquiry Report – Average Cost Analysis by Lot
Return to
Agenda/Index

Copyright © 2012, Oracle and/or its affiliates. All rights reserved. Oracle Proprietary and Confidential. 46
One View Inventory Valuation Analysis Inquiry Report – Average Cost Analysis by Lot
Average Cost Analysis of
Items by Lot
• This is a chart that illustrates the
Average Cost of the Item by
Lot/Serial Number
• This bar chart provides a view of
the Average Cost of Item by
Branch Plant
• This summary table provides the
Average Cost of items by Month,
Branch Plant and Lot Serial
Number
• This details table shows the
details of the transactions
associated to the Average Cost of
Item by Branch and Lot Serial
Number
Return to
Agenda/Index
Copyright © 2012, Oracle and/or its affiliates. All rights reserved. Oracle Proprietary and Confidential. 47
<Insert Picture Here>
One View Reporting
Procurement and
Subcontract Management
Return to
Agenda/Index
Copyright © 2012, Oracle and/or its affiliates. All rights reserved. Oracle Proprietary and Confidential. 48
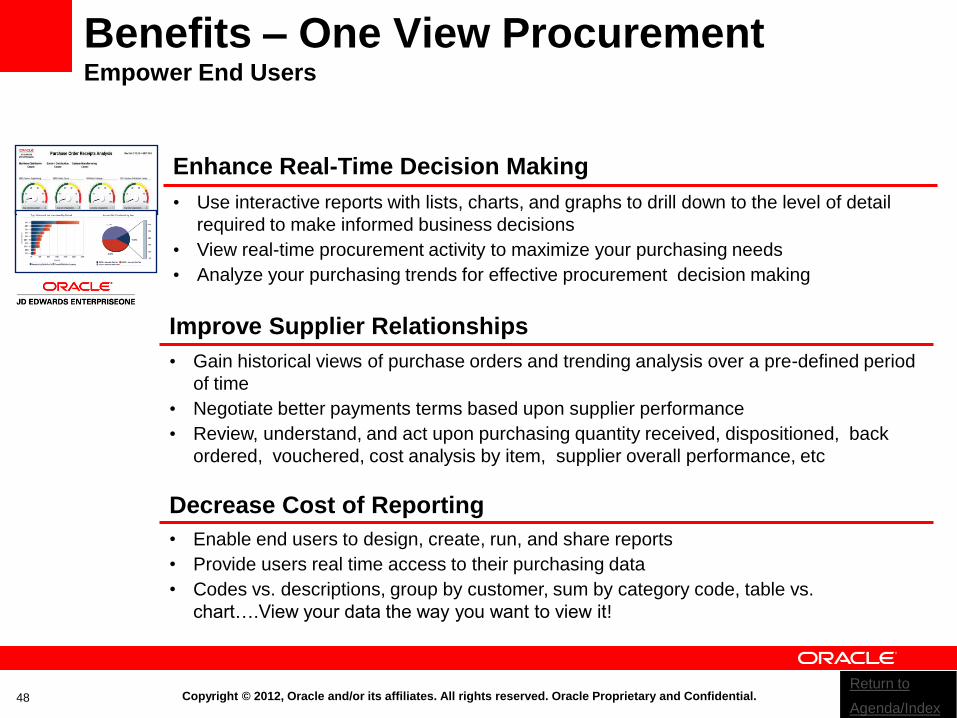
Benefits – One View Procurement Empower End Users
• Gain historical views of purchase orders and trending analysis over a pre-defined period
of time
• Negotiate better payments terms based upon supplier performance
• Review, understand, and act upon purchasing quantity received, dispositioned, back
ordered, vouchered, cost analysis by item, supplier overall performance, etc
Improve Supplier Relationships
• Use interactive reports with lists, charts, and graphs to drill down to the level of detail
required to make informed business decisions
• View real-time procurement activity to maximize your purchasing needs
• Analyze your purchasing trends for effective procurement decision making
Enhance Real-Time Decision Making
• Enable end users to design, create, run, and share reports
• Provide users real time access to their purchasing data
• Codes vs. descriptions, group by customer, sum by category code, table vs.
chart….View your data the way you want to view it!
Decrease Cost of Reporting
Return to
Agenda/Index
Copyright © 2012, Oracle and/or its affiliates. All rights reserved. Oracle Proprietary and Confidential.
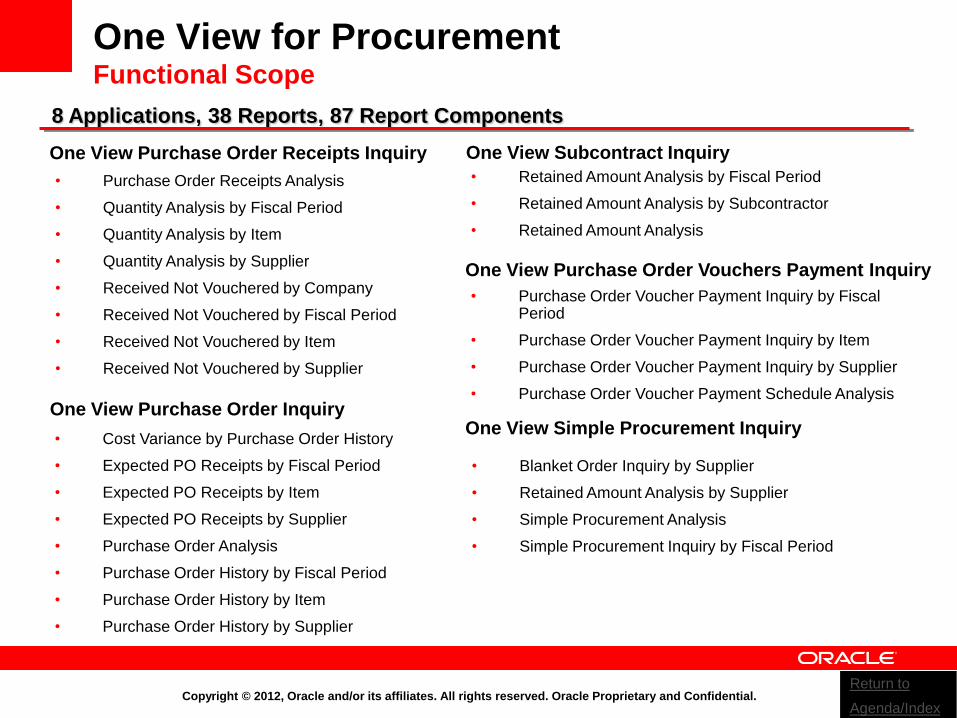
One View for Procurement Functional Scope
One View Purchase Order Receipts Inquiry One View Subcontract Inquiry
• Purchase Order Receipts Analysis
• Quantity Analysis by Fiscal Period
• Quantity Analysis by Item
• Quantity Analysis by Supplier
• Received Not Vouchered by Company
• Received Not Vouchered by Fiscal Period
• Received Not Vouchered by Item
• Received Not Vouchered by Supplier
8 Applications, 38 Reports, 87 Report Components
• Retained Amount Analysis by Fiscal Period
• Retained Amount Analysis by Subcontractor
• Retained Amount Analysis
One View Purchase Order Inquiry
• Cost Variance by Purchase Order History
• Expected PO Receipts by Fiscal Period
• Expected PO Receipts by Item
• Expected PO Receipts by Supplier
• Purchase Order Analysis
• Purchase Order History by Fiscal Period
• Purchase Order History by Item
• Purchase Order History by Supplier
• Blanket Order Inquiry by Supplier
• Retained Amount Analysis by Supplier
• Simple Procurement Analysis
• Simple Procurement Inquiry by Fiscal Period
One View Simple Procurement Inquiry
• Purchase Order Voucher Payment Inquiry by Fiscal Period
• Purchase Order Voucher Payment Inquiry by Item
• Purchase Order Voucher Payment Inquiry by Supplier
• Purchase Order Voucher Payment Schedule Analysis
One View Purchase Order Vouchers Payment Inquiry
Return to
Agenda/Index
Copyright © 2012, Oracle and/or its affiliates. All rights reserved. Oracle Proprietary and Confidential.
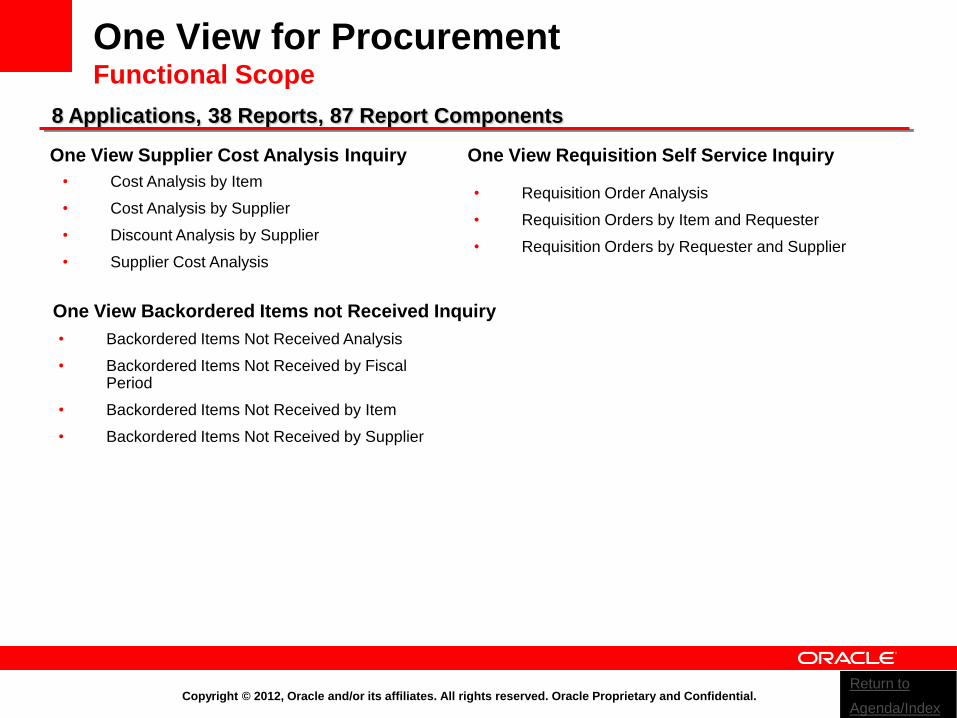
One View for Procurement Functional Scope
One View Backordered Items not Received Inquiry
• Backordered Items Not Received Analysis
• Backordered Items Not Received by Fiscal Period
• Backordered Items Not Received by Item
• Backordered Items Not Received by Supplier
8 Applications, 38 Reports, 87 Report Components
One View Supplier Cost Analysis Inquiry
• Cost Analysis by Item
• Cost Analysis by Supplier
• Discount Analysis by Supplier
• Supplier Cost Analysis
• Requisition Order Analysis
• Requisition Orders by Item and Requester
• Requisition Orders by Requester and Supplier
One View Requisition Self Service Inquiry
Return to
Agenda/Index
Copyright © 2012, Oracle and/or its affiliates. All rights reserved. Oracle Proprietary and Confidential. 51
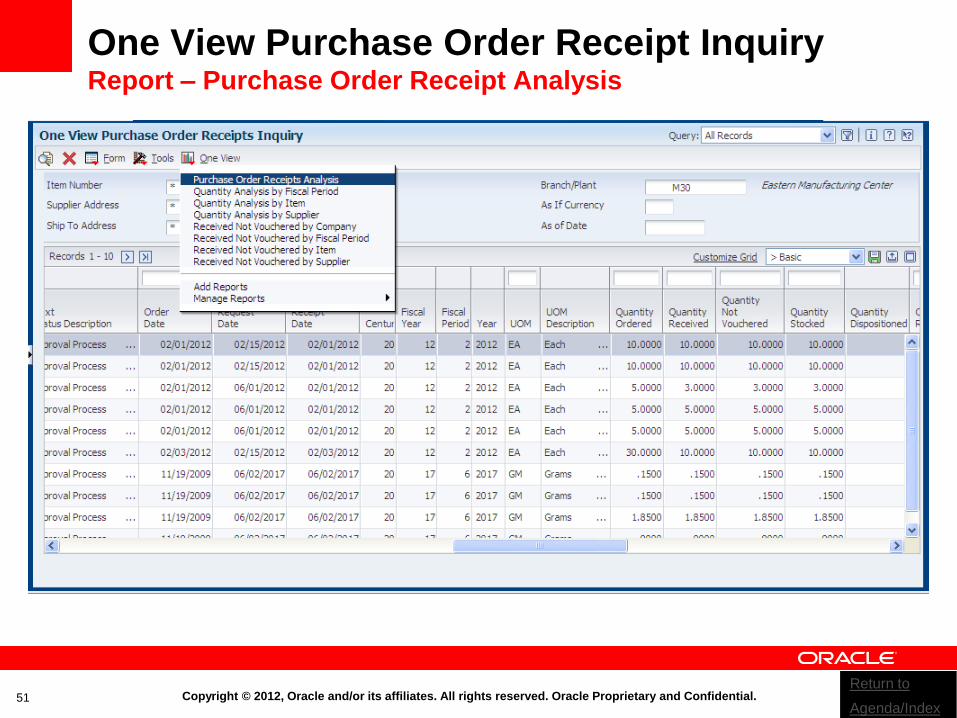
One View Purchase Order Receipt Inquiry Report – Purchase Order Receipt Analysis
Return to
Agenda/Index
Copyright © 2012, Oracle and/or its affiliates. All rights reserved. Oracle Proprietary and Confidential. 52
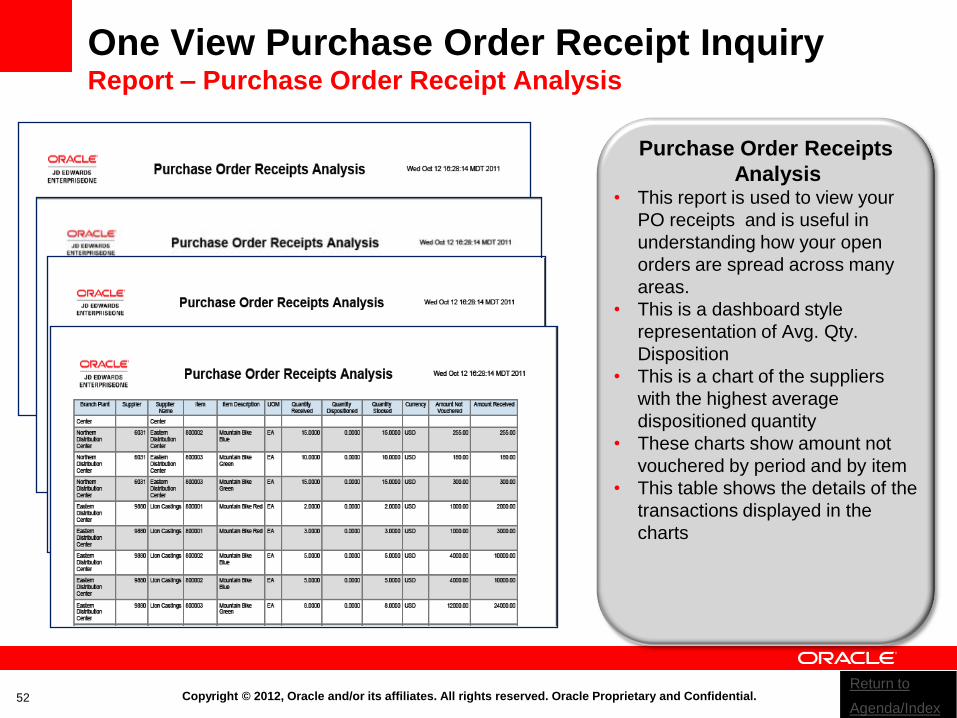
One View Purchase Order Receipt Inquiry Report – Purchase Order Receipt Analysis
Purchase Order Receipts
Analysis • This report is used to view your
PO receipts and is useful in
understanding how your open
orders are spread across many
areas.
• This is a dashboard style
representation of Avg. Qty.
Disposition
• This is a chart of the suppliers
with the highest average
dispositioned quantity
• These charts show amount not
vouchered by period and by item
• This table shows the details of the
transactions displayed in the
charts
Return to
Agenda/Index
Copyright © 2012, Oracle and/or its affiliates. All rights reserved. Oracle Proprietary and Confidential. 53
<Insert Picture Here>
One View Reporting
Payroll
Return to
Agenda/Index
Copyright © 2012, Oracle and/or its affiliates. All rights reserved. Oracle Proprietary and Confidential. 54
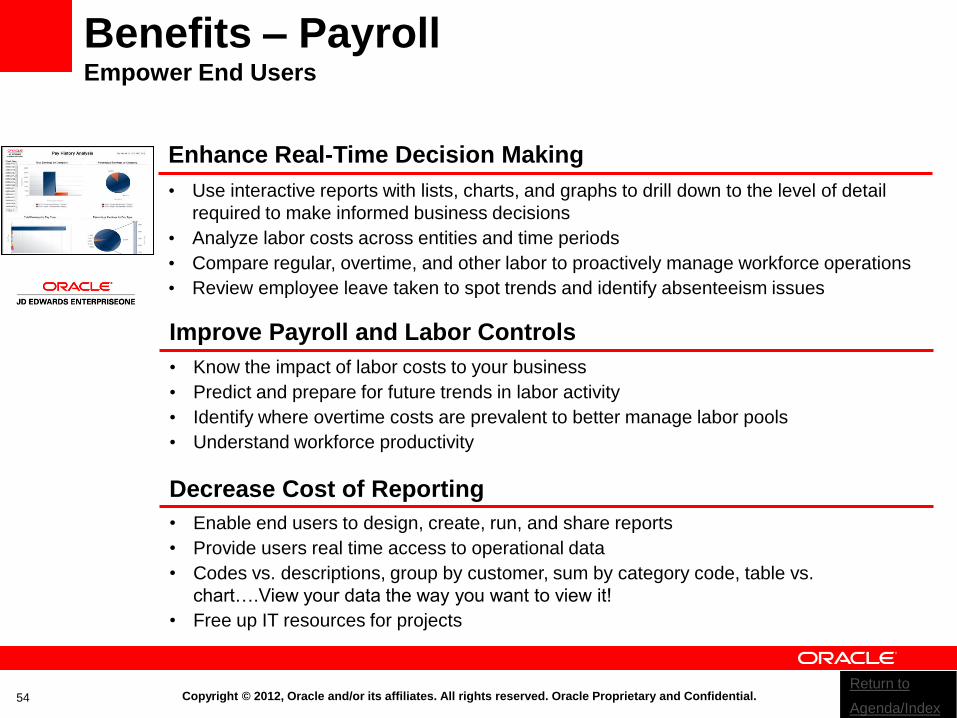
Benefits – Payroll Empower End Users
• Know the impact of labor costs to your business
• Predict and prepare for future trends in labor activity
• Identify where overtime costs are prevalent to better manage labor pools
• Understand workforce productivity
Improve Payroll and Labor Controls
• Use interactive reports with lists, charts, and graphs to drill down to the level of detail
required to make informed business decisions
• Analyze labor costs across entities and time periods
• Compare regular, overtime, and other labor to proactively manage workforce operations
• Review employee leave taken to spot trends and identify absenteeism issues
Enhance Real-Time Decision Making
• Enable end users to design, create, run, and share reports
• Provide users real time access to operational data
• Codes vs. descriptions, group by customer, sum by category code, table vs.
chart….View your data the way you want to view it!
• Free up IT resources for projects
Decrease Cost of Reporting
Return to
Agenda/Index
Copyright © 2012, Oracle and/or its affiliates. All rights reserved. Oracle Proprietary and Confidential.
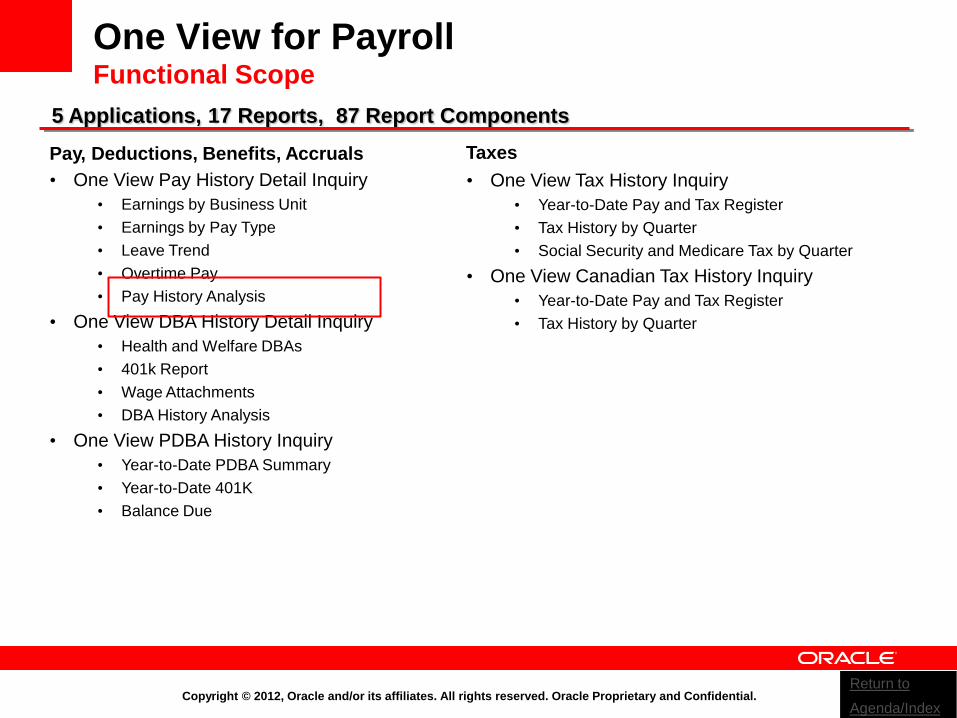
One View for Payroll Functional Scope
Pay, Deductions, Benefits, Accruals Taxes
• One View Pay History Detail Inquiry
• Earnings by Business Unit
• Earnings by Pay Type
• Leave Trend
• Overtime Pay
• Pay History Analysis
• One View DBA History Detail Inquiry
• Health and Welfare DBAs
• 401k Report
• Wage Attachments
• DBA History Analysis
• One View PDBA History Inquiry
• Year-to-Date PDBA Summary
• Year-to-Date 401K
• Balance Due
5 Applications, 17 Reports, 87 Report Components
• One View Tax History Inquiry
• Year-to-Date Pay and Tax Register
• Tax History by Quarter
• Social Security and Medicare Tax by Quarter
• One View Canadian Tax History Inquiry
• Year-to-Date Pay and Tax Register
• Tax History by Quarter
Return to
Agenda/Index
Copyright © 2012, Oracle and/or its affiliates. All rights reserved. Oracle Proprietary and Confidential. 56
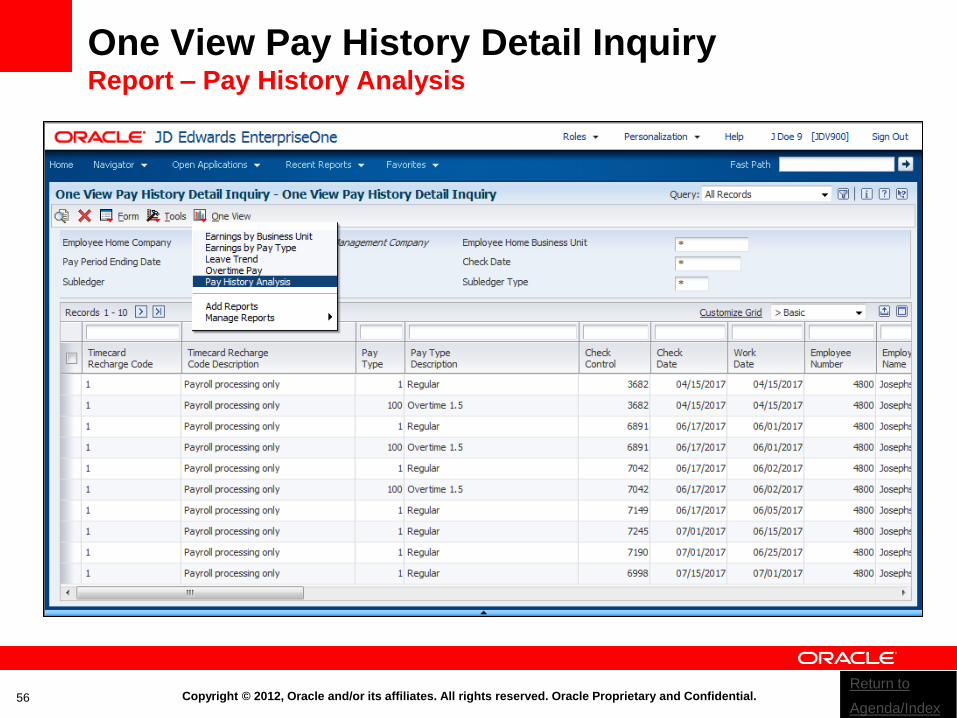
One View Pay History Detail Inquiry Report – Pay History Analysis
Return to
Agenda/Index
Copyright © 2012, Oracle and/or its affiliates. All rights reserved. Oracle Proprietary and Confidential. 57
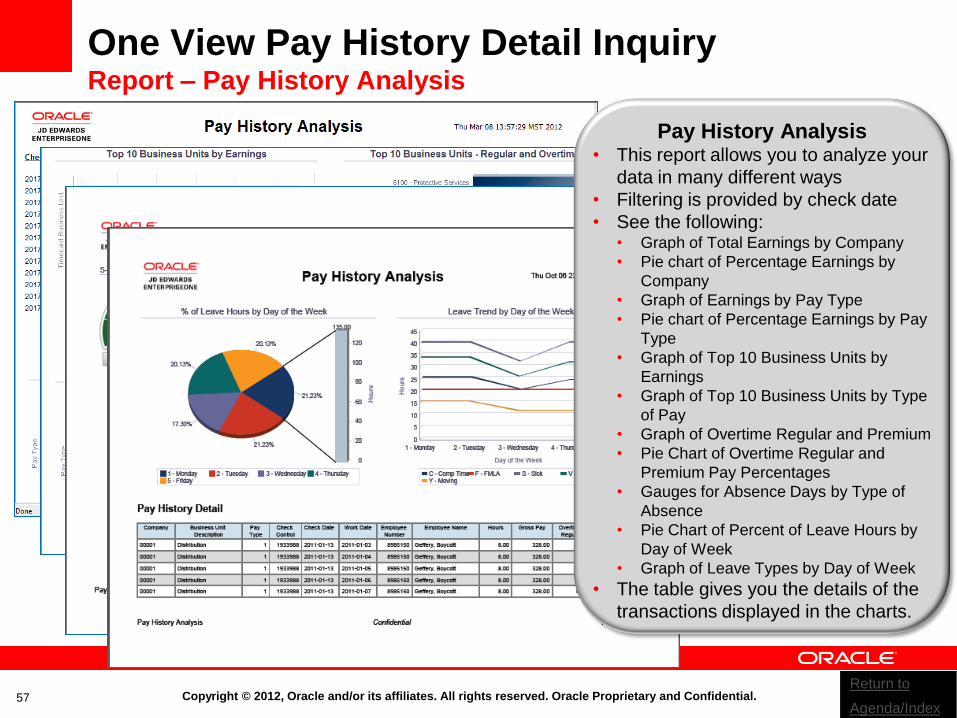
One View Pay History Detail Inquiry Report – Pay History Analysis
Pay History Analysis • This report allows you to analyze your
data in many different ways
• Filtering is provided by check date
• See the following: • Graph of Total Earnings by Company
• Pie chart of Percentage Earnings by
Company
• Graph of Earnings by Pay Type
• Pie chart of Percentage Earnings by Pay
Type
• Graph of Top 10 Business Units by
Earnings
• Graph of Top 10 Business Units by Type
of Pay
• Graph of Overtime Regular and Premium
• Pie Chart of Overtime Regular and
Premium Pay Percentages
• Gauges for Absence Days by Type of
Absence
• Pie Chart of Percent of Leave Hours by
Day of Week
• Graph of Leave Types by Day of Week
• The table gives you the details of the
transactions displayed in the charts.
Return to
Agenda/Index

Copyright © 2012, Oracle and/or its affiliates. All rights reserved. Oracle Proprietary and Confidential. 58
<Insert Picture Here>
One View Reporting
Human Resources
Return to
Agenda/Index
Copyright © 2012, Oracle and/or its affiliates. All rights reserved. Oracle Proprietary and Confidential. 59
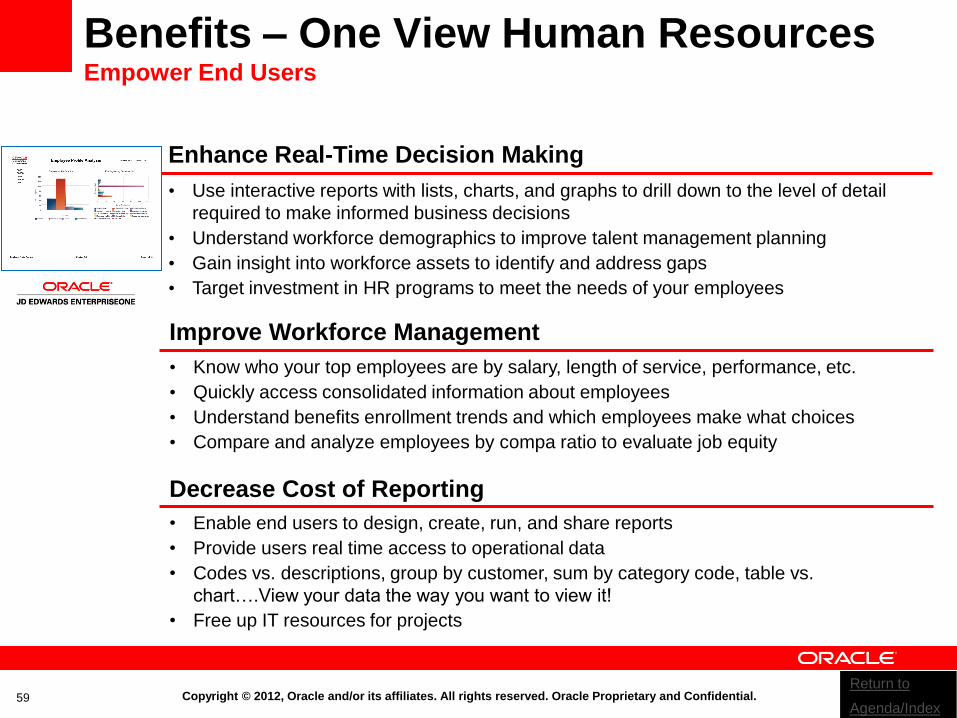
Benefits – One View Human Resources Empower End Users
• Know who your top employees are by salary, length of service, performance, etc.
• Quickly access consolidated information about employees
• Understand benefits enrollment trends and which employees make what choices
• Compare and analyze employees by compa ratio to evaluate job equity
Improve Workforce Management
• Use interactive reports with lists, charts, and graphs to drill down to the level of detail
required to make informed business decisions
• Understand workforce demographics to improve talent management planning
• Gain insight into workforce assets to identify and address gaps
• Target investment in HR programs to meet the needs of your employees
Enhance Real-Time Decision Making
• Enable end users to design, create, run, and share reports
• Provide users real time access to operational data
• Codes vs. descriptions, group by customer, sum by category code, table vs.
chart….View your data the way you want to view it!
• Free up IT resources for projects
Decrease Cost of Reporting
Return to
Agenda/Index
Copyright © 2012, Oracle and/or its affiliates. All rights reserved. Oracle Proprietary and Confidential.
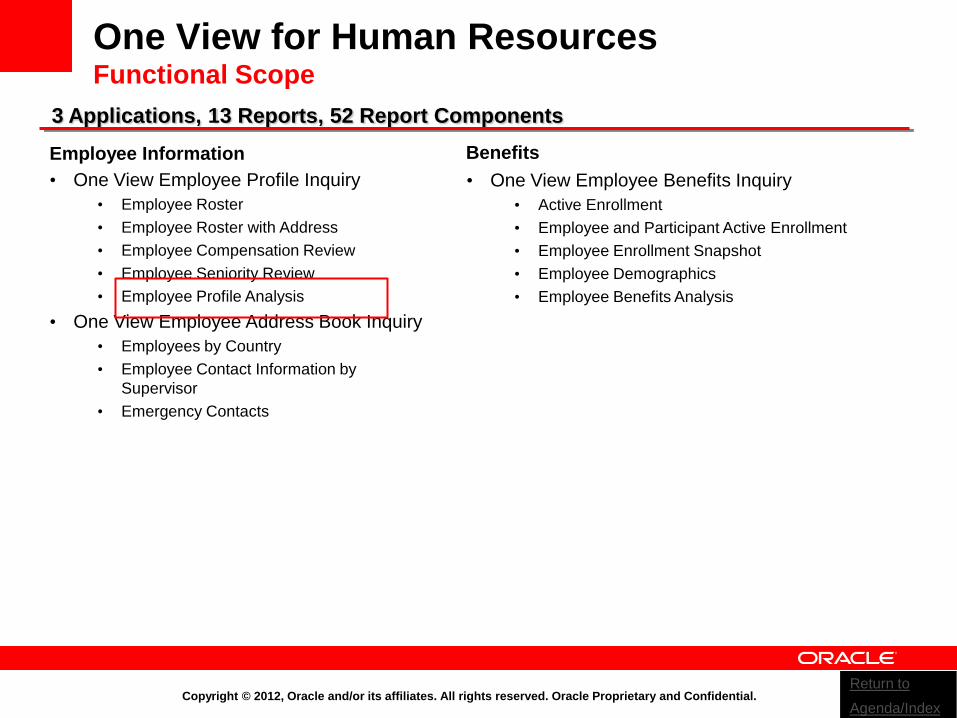
One View for Human Resources Functional Scope
Employee Information Benefits
• One View Employee Profile Inquiry
• Employee Roster
• Employee Roster with Address
• Employee Compensation Review
• Employee Seniority Review
• Employee Profile Analysis
• One View Employee Address Book Inquiry
• Employees by Country
• Employee Contact Information by
Supervisor
• Emergency Contacts
3 Applications, 13 Reports, 52 Report Components
• One View Employee Benefits Inquiry
• Active Enrollment
• Employee and Participant Active Enrollment
• Employee Enrollment Snapshot
• Employee Demographics
• Employee Benefits Analysis
Return to
Agenda/Index
Copyright © 2012, Oracle and/or its affiliates. All rights reserved. Oracle Proprietary and Confidential. 61
One View Employee Profile Inquiry Report – Employee Profile Analysis
Return to
Agenda/Index
Copyright © 2012, Oracle and/or its affiliates. All rights reserved. Oracle Proprietary and Confidential. 62
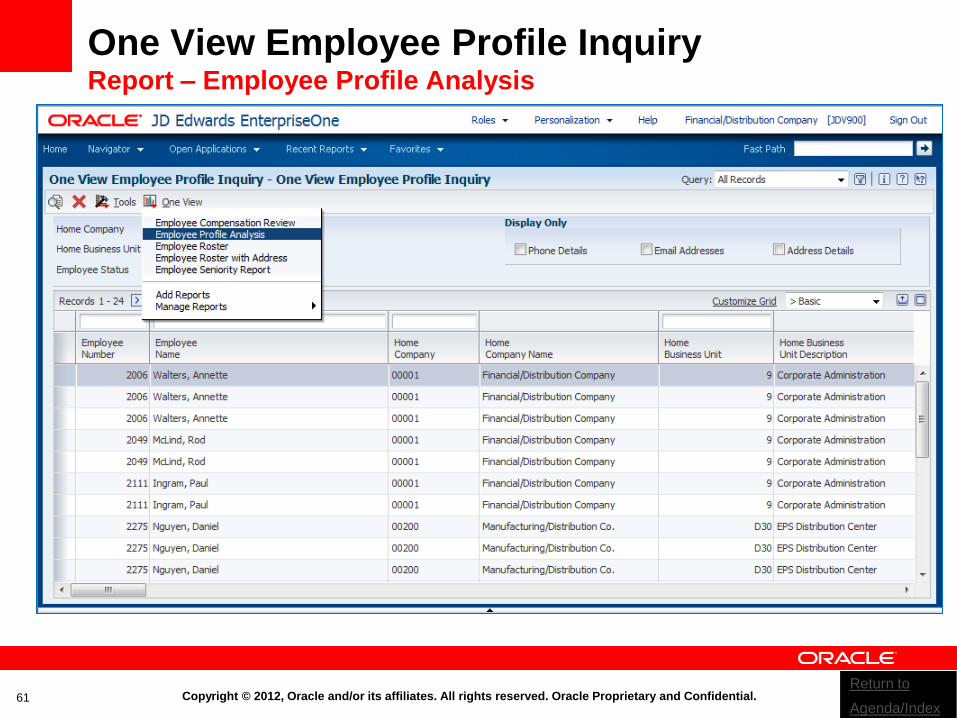
One View Employee Profile Inquiry Report – Employee Profile Analysis
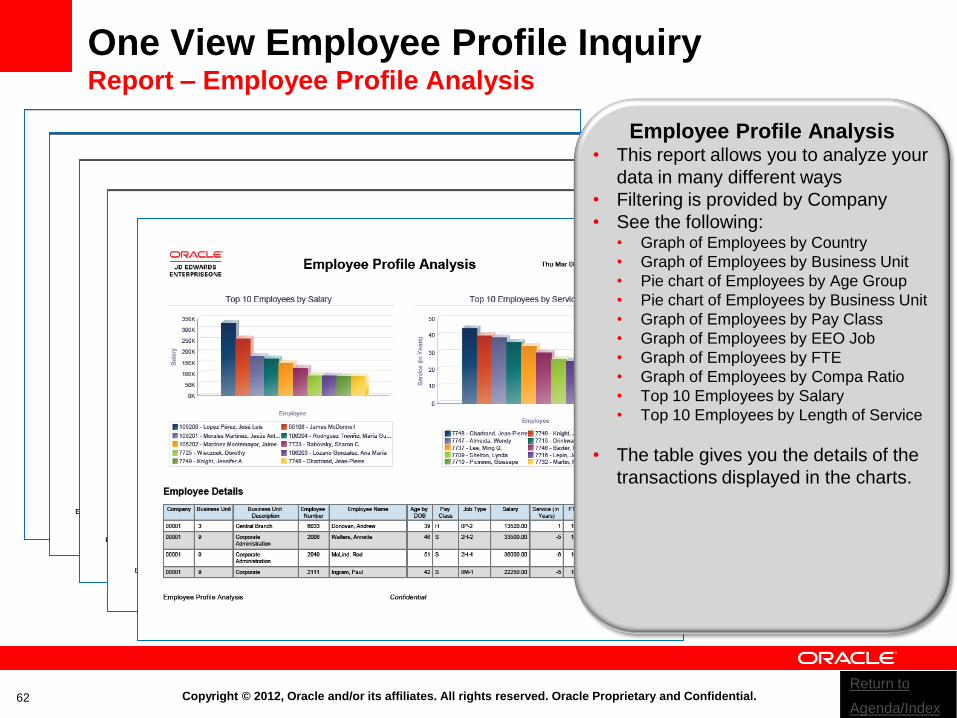
Employee Profile Analysis • This report allows you to analyze your
data in many different ways
• Filtering is provided by Company
• See the following: • Graph of Employees by Country
• Graph of Employees by Business Unit
• Pie chart of Employees by Age Group
• Pie chart of Employees by Business Unit
• Graph of Employees by Pay Class
• Graph of Employees by EEO Job
• Graph of Employees by FTE
• Graph of Employees by Compa Ratio
• Top 10 Employees by Salary
• Top 10 Employees by Length of Service
• The table gives you the details of the
transactions displayed in the charts.
Return to
Agenda/Index

Copyright © 2012, Oracle and/or its affiliates. All rights reserved. Oracle Proprietary and Confidential. 63
<Insert Picture Here>
One View Reporting
Transportation Management
Return to
Agenda/Index

Copyright © 2012, Oracle and/or its affiliates. All rights reserved. Oracle Proprietary and Confidential. 64
Benefits – One View Transportation Empower End Users
• Gain historical insight of your transportation shipments and loads over a pre-defined
period of time.
• Broad visibility of your carriers, freight spend and operating ratios by planning depots.
• Perform analysis and comparisons of your on-time shipments.
Improve Supply Chain Transportation Levels
• Use interactive reports with lists, charts, and graphs to drill down to the level of detail
required to make informed business decisions.
• View real-time Transportation activity to support your shipment needs.
• Analyze your Transportation costs throughout your supply chain.
Enhance Real-Time Decision Making
• Enable end users to design, create, run, and share reports.
• Free up IT resources for projects.
• Edit rather than compose for fast, on the fly end user reporting.
Decrease Cost of Reporting
Return to
Agenda/Index
Copyright © 2012, Oracle and/or its affiliates. All rights reserved. Oracle Proprietary and Confidential.
One View for Transportation Functional Scope
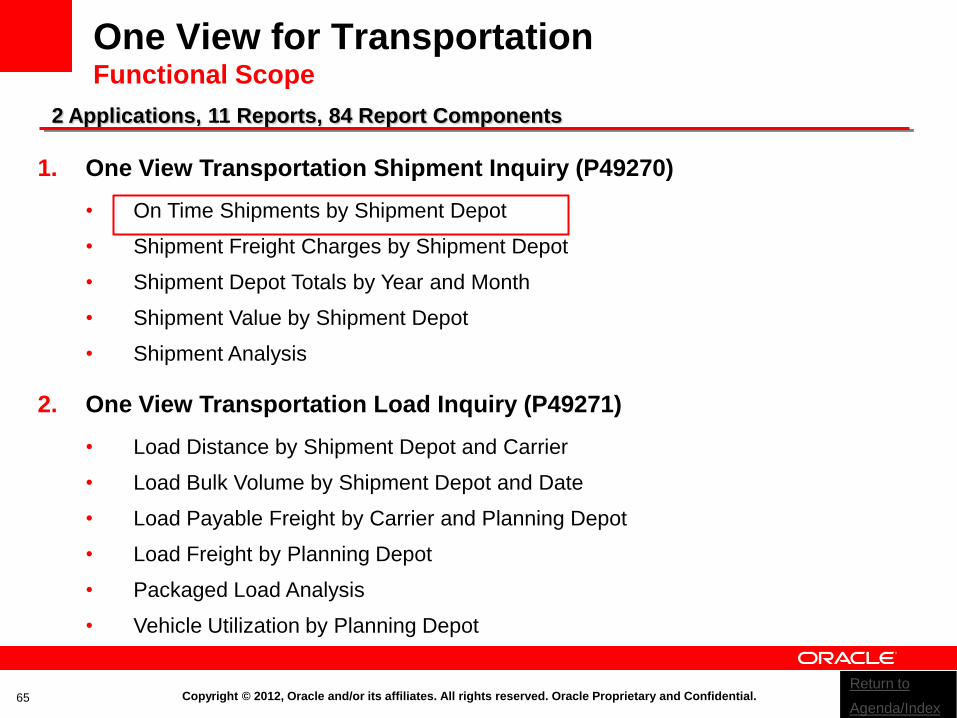
2 Applications, 11 Reports, 84 Report Components
1. One View Transportation Shipment Inquiry (P49270)
• On Time Shipments by Shipment Depot
• Shipment Freight Charges by Shipment Depot
• Shipment Depot Totals by Year and Month
• Shipment Value by Shipment Depot
• Shipment Analysis
2. One View Transportation Load Inquiry (P49271)
• Load Distance by Shipment Depot and Carrier
• Load Bulk Volume by Shipment Depot and Date
• Load Payable Freight by Carrier and Planning Depot
• Load Freight by Planning Depot
• Packaged Load Analysis
• Vehicle Utilization by Planning Depot
65 Return to
Agenda/Index
Copyright © 2012, Oracle and/or its affiliates. All rights reserved. Oracle Proprietary and Confidential. 66
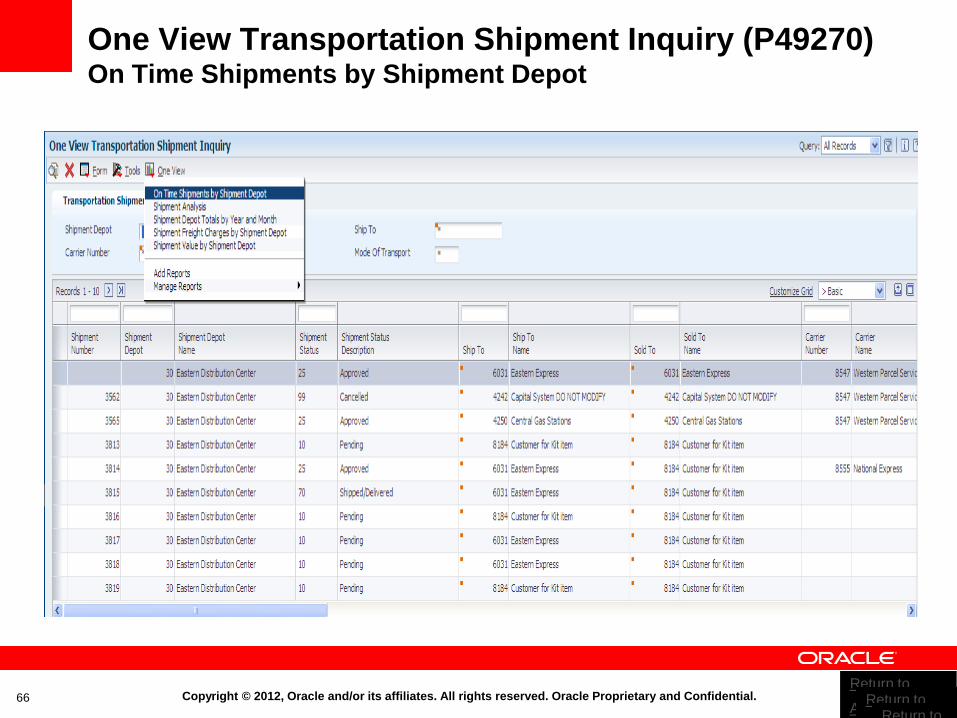
One View Transportation Shipment Inquiry (P49270) On Time Shipments by Shipment Depot
Return to
Agenda/Index Return to
Agenda/Index Return to
Return to
Copyright © 2012, Oracle and/or its affiliates. All rights reserved. Oracle Proprietary and Confidential. 67
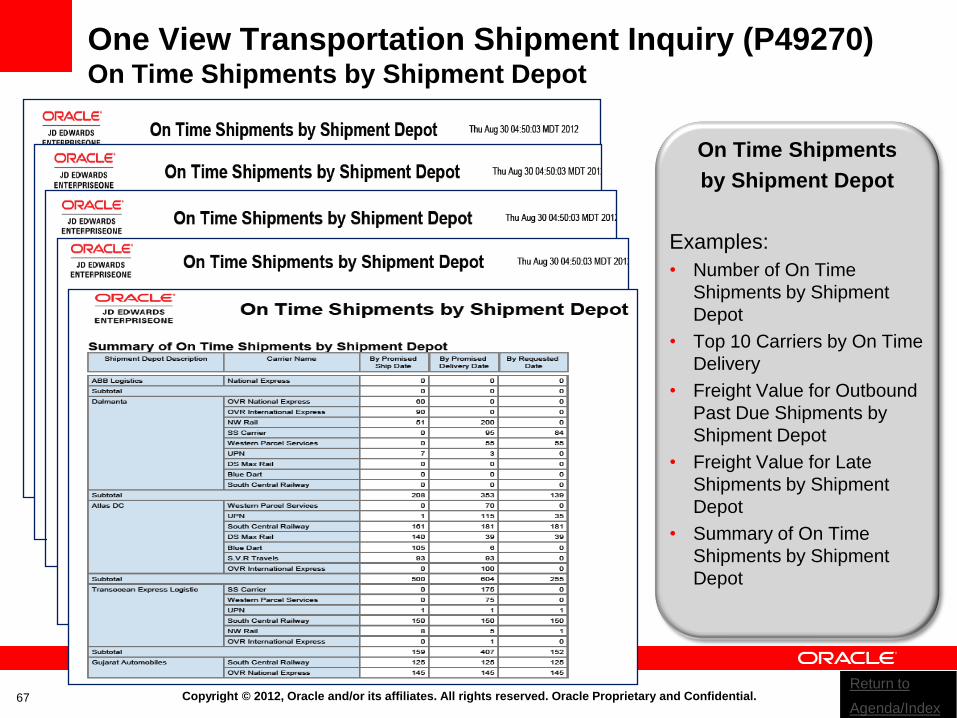
One View Transportation Shipment Inquiry (P49270) On Time Shipments by Shipment Depot
On Time Shipments
by Shipment Depot
Examples:
• Number of On Time
Shipments by Shipment
Depot
• Top 10 Carriers by On Time
Delivery
• Freight Value for Outbound
Past Due Shipments by
Shipment Depot
• Freight Value for Late
Shipments by Shipment
Depot
• Summary of On Time
Shipments by Shipment
Depot
Return to
Agenda/Index

Copyright © 2012, Oracle and/or its affiliates. All rights reserved. Oracle Proprietary and Confidential. Return to
Agenda/Index
Copyright © 2012, Oracle and/or its affiliates. All rights reserved. Oracle Proprietary and Confidential. 69 Return to
Agenda/Index


![JD Edwards EnterpriseOne Tools BI Publisher for JD Edwards ... · PDF file[1]JD Edwards EnterpriseOne Tools BI Publisher for JD Edwards EnterpriseOne Guide Release 9.2 E53612-03 April](https://img.pdfslide.us/doc/110x75/5abe1b877f8b9a5d718c9747/jd-edwards-enterpriseone-tools-bi-publisher-for-jd-edwards-1jd-edwards-enterpriseone.jpg)