Embed Size (px)
Citation preview
Forest Products Biotechnology at UBC
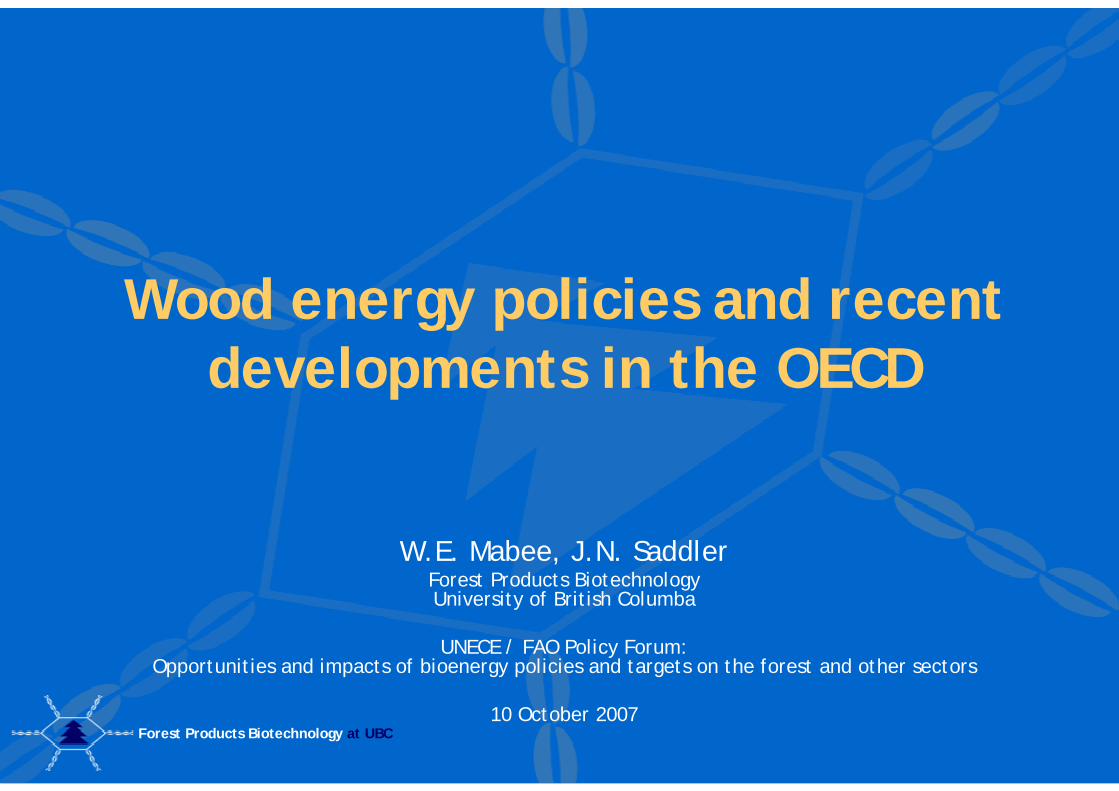
W.E. Mabee, J.N. SaddlerForest Products Biotechnology University of British Columba
UNECE / FAO Policy Forum: Opportunities and impacts of bioenergy policies and targets on the forest and other sectors
10 October 2007
Wood energy policies and recent developments in the OECD

Forest Products Biotechnology at UBC
IntroductionOver 50% of forestry biomass harvested today is used for energy (FAO 2007)
Recent reports prepared by the OECD, UNECE, IEA, FAO and others has informed the discussion tremendously
New policies are changing the role of wood-to-bioenergy
Research is still required, including development of better data describing biomass recovery from forestsand trade opportunities for biomass and biofuels
Introduction to bioenergyBioenergy policiesBioenergy and forestsInfluence of bioenergyNorth American issuesTake-home messages

Forest Products Biotechnology at UBC
What is bioenergy?Energy derived from all biomass, including forests
Derived as heatTransformed into electricityDelivered to industrial, transportation sector via biofuels
Wood energy is one component of total bioenergy
May be produced and used on-site (either residential or industrial)
May be produced for third-party sales
A type of renewable energy(when produced sustainably)
Introduction to bioenergyBioenergy policiesBioenergy and forestsInfluence of bioenergyNorth American issuesTake-home messages
Forest Products Biotechnology at UBC
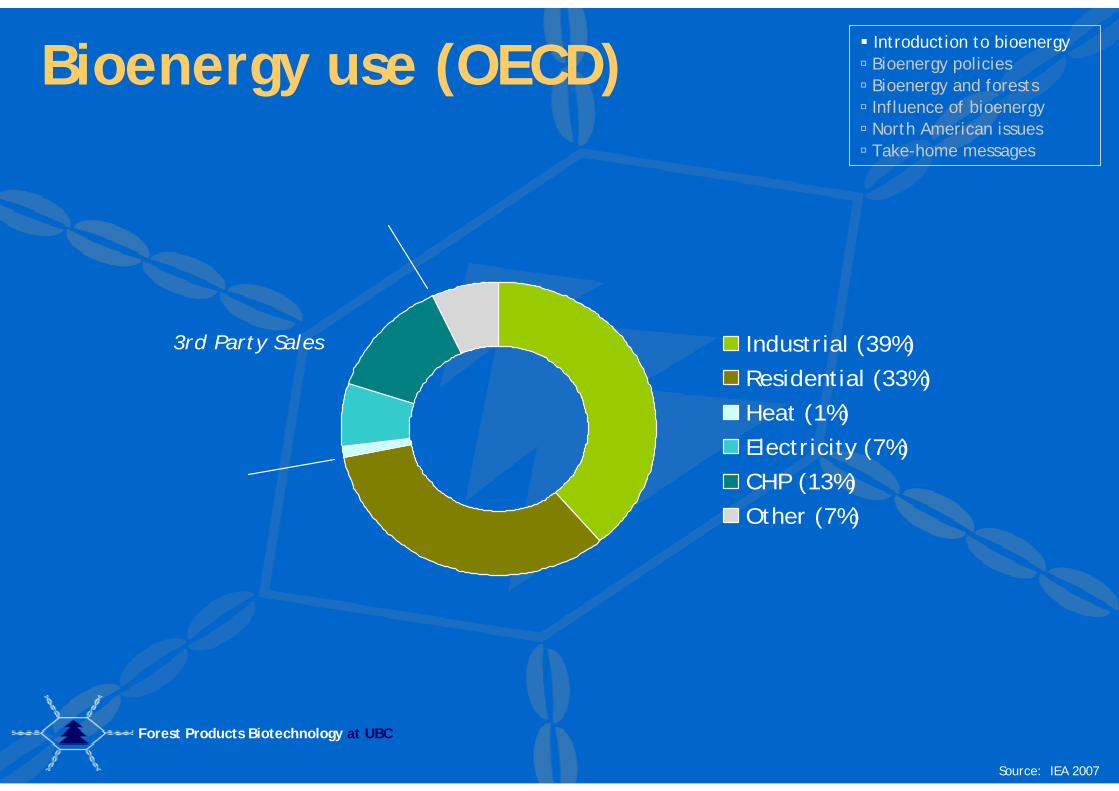
Bioenergy use (OECD)
Industrial (39%)
Residential (33%)
Heat (1%)
Electricity (7%)
CHP (13%)
Other (7%)
3rd Party Sales
Introduction to bioenergyBioenergy policiesBioenergy and forestsInfluence of bioenergyNorth American issuesTake-home messages
Source: IEA 2007
Forest Products Biotechnology at UBC
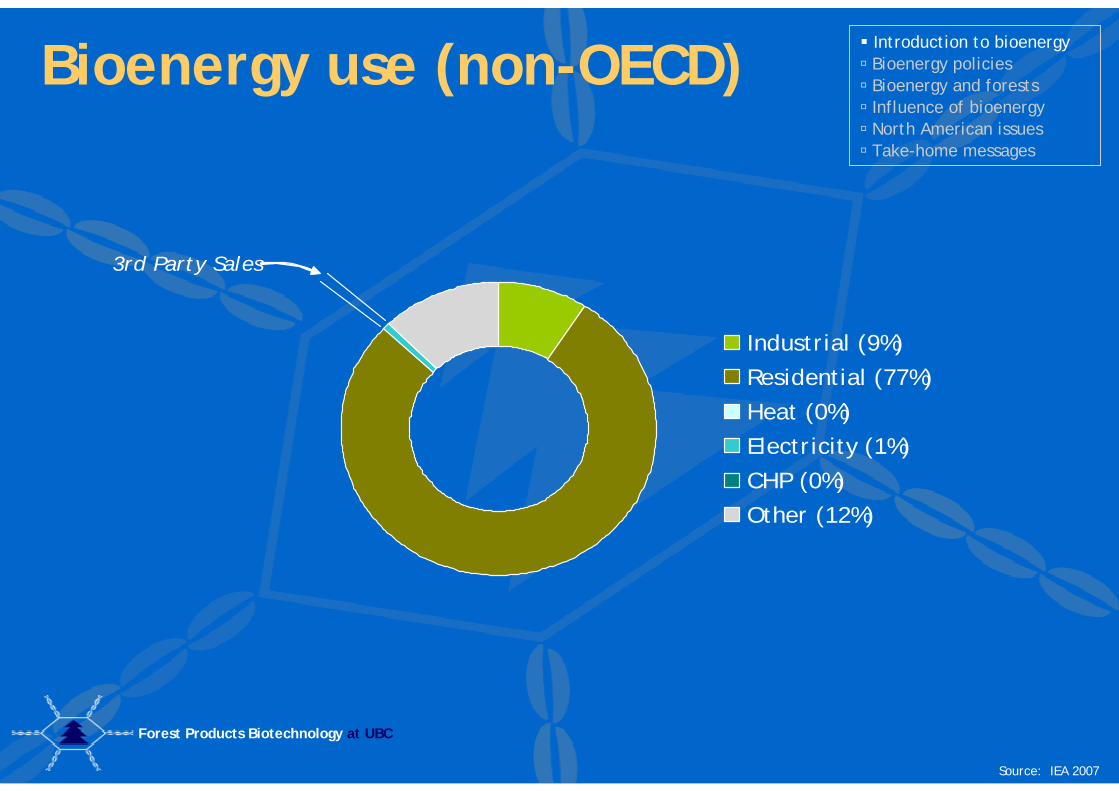
Bioenergy use (non-OECD)
Industrial (9%)
Residential (77%)
Heat (0%)
Electricity (1%)
CHP (0%)
Other (12%)
3rd Party Sales
Introduction to bioenergyBioenergy policiesBioenergy and forestsInfluence of bioenergyNorth American issuesTake-home messages
Source: IEA 2007
Forest Products Biotechnology at UBC
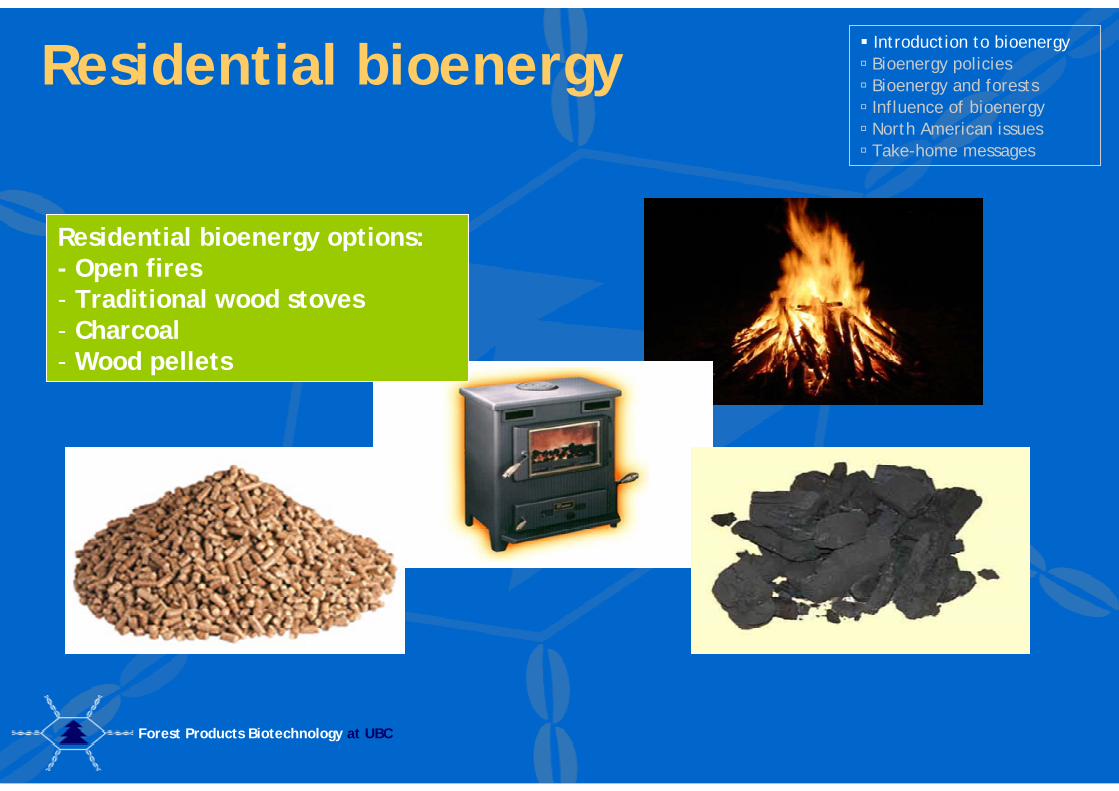
Residential bioenergy
Residential bioenergy options:- Open fires- Traditional wood stoves- Charcoal- Wood pellets
Introduction to bioenergyBioenergy policiesBioenergy and forestsInfluence of bioenergyNorth American issuesTake-home messages

Forest Products Biotechnology at UBC
Industrial bioenergy
Industrial bioenergy options:- Combined heat & power- Power boilers- Gasification- CHP + Heat recovery systems
Introduction to bioenergyBioenergy policiesBioenergy and forestsInfluence of bioenergyNorth American issuesTake-home messages

Forest Products Biotechnology at UBC
What are biofuels?Bioenergy feedstocks, usually in solid or liquid forms (i.e. wood pellets, bioethanol, biodiesel, etc.)
Biofuels may be classified by biomass source:Agrofuels (i.e. sugar, starch, vegetable oils)Woodfuels (fuelwood, charcoal)
Solid biofuels include wood pellets, charcoal, etc.Liquid biofuels may be classified by feedstock:
Food-based liquid biofuels (derived from foodstuffs)Cellulosic liquid biofuels (derived from the cellulosic component of agrofuels and woodfuels)
Introduction to bioenergyBioenergy policiesBioenergy and forestsInfluence of bioenergyNorth American issuesTake-home messages
Forest Products Biotechnology at UBC
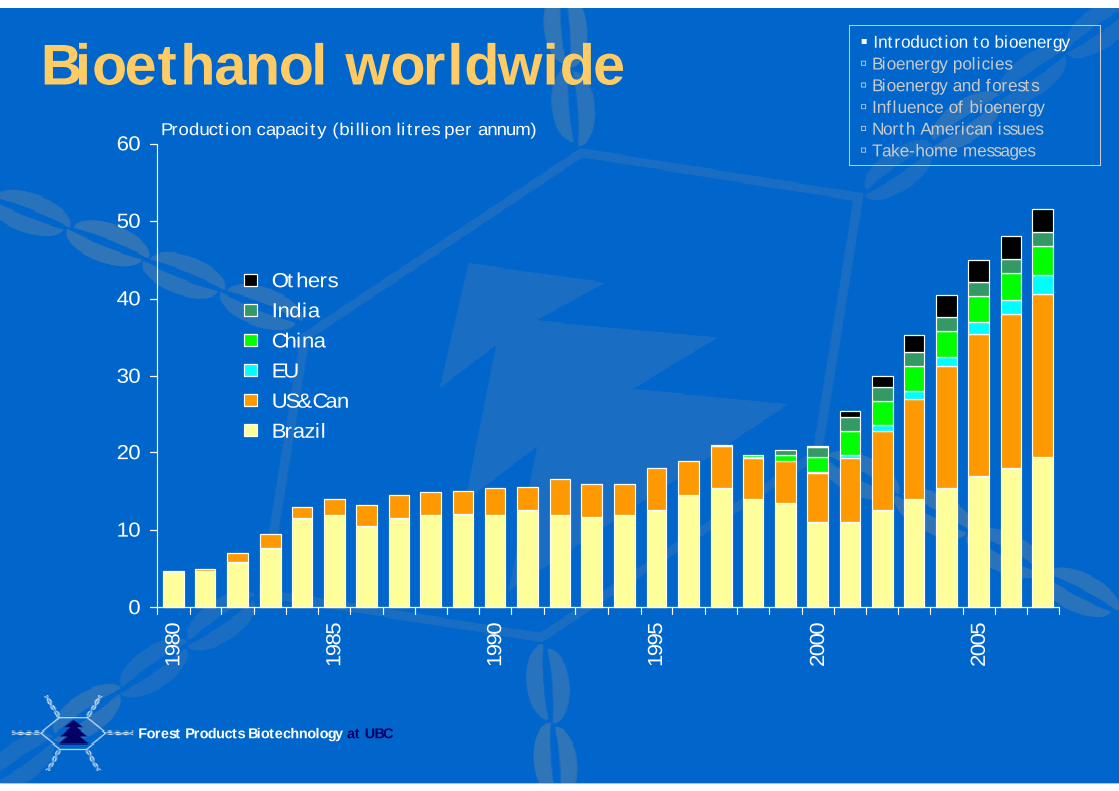
Bioethanol worldwide
0
10
20
30
40
50
6019
80
1985
1990
1995
2000
2005
Others India China EU US&Can Brazil
Production capacity (billion litres per annum)
Introduction to bioenergyBioenergy policiesBioenergy and forestsInfluence of bioenergyNorth American issuesTake-home messages

Forest Products Biotechnology at UBC
Biofuel producers (OECD)(bioethanol, biodiesel in 2006)
0
1
2
3
4
5
6USA
Can
ada
Ger
man
y
Spai
n
Swed
en
Ger
man
y
Fran
ce
Aust
ralia
Ital
y
USA
Bioethanol Biodiesel
18.4
Production capacity (billion litres per
Source: IEA 2007
Introduction to bioenergyBioenergy policiesBioenergy and forestsInfluence of bioenergyNorth American issuesTake-home messages
Forest Products Biotechnology at UBC
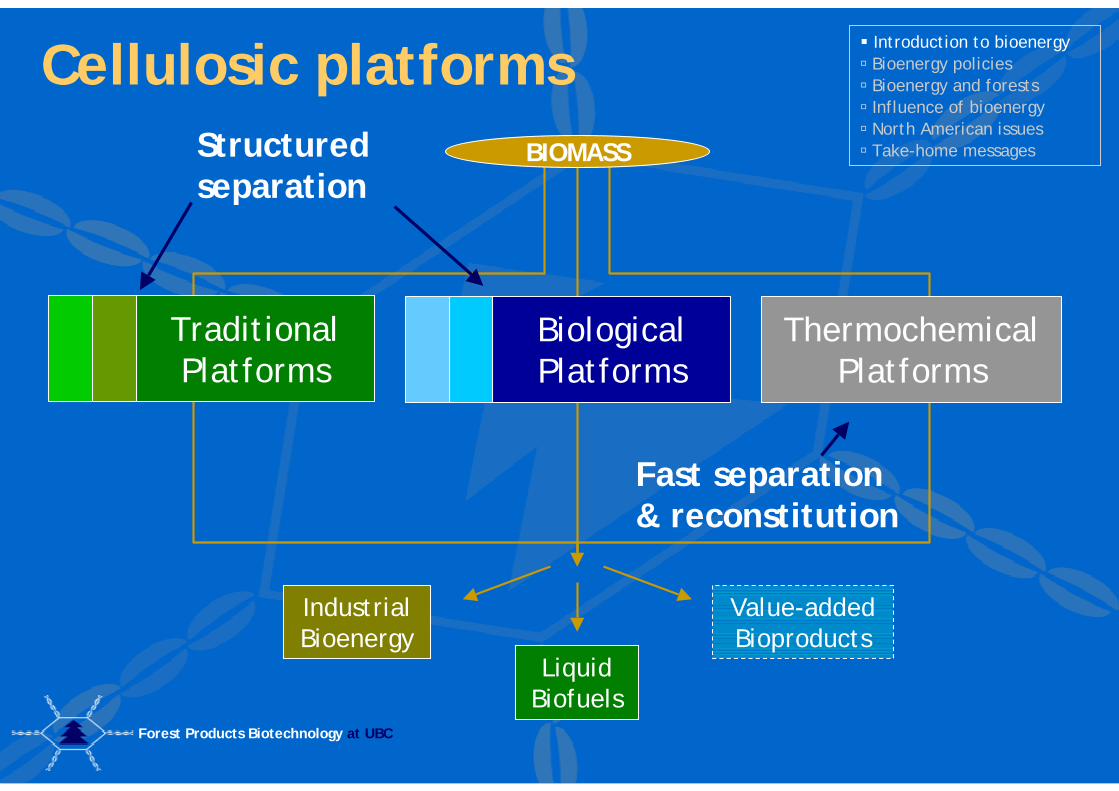
Cellulosic platformsBIOMASS
ThermochemicalPlatforms
BiologicalPlatforms
TraditionalPlatforms
Structured separation
Fast separation& reconstitution
Introduction to bioenergyBioenergy policiesBioenergy and forestsInfluence of bioenergyNorth American issuesTake-home messages
IndustrialBioenergy
LiquidBiofuels
Value-addedBioproducts
Forest Products Biotechnology at UBC
0%
10%
20%
30%
40%
50%
60%
70%
80%
90%
100%O
pen
fire
Woo
d st
ove
Cha
rcoa
l
Pell
et s
tove
CH
P
Pow
er b
oile
r
Gas
ifie
r
CH
P +
heat
rec
over
y
Etha
nol
(syn
gas)
Etha
nol
(str
aw)
Etha
nol
(woo
d)
Fisc
her-
Trop
schs
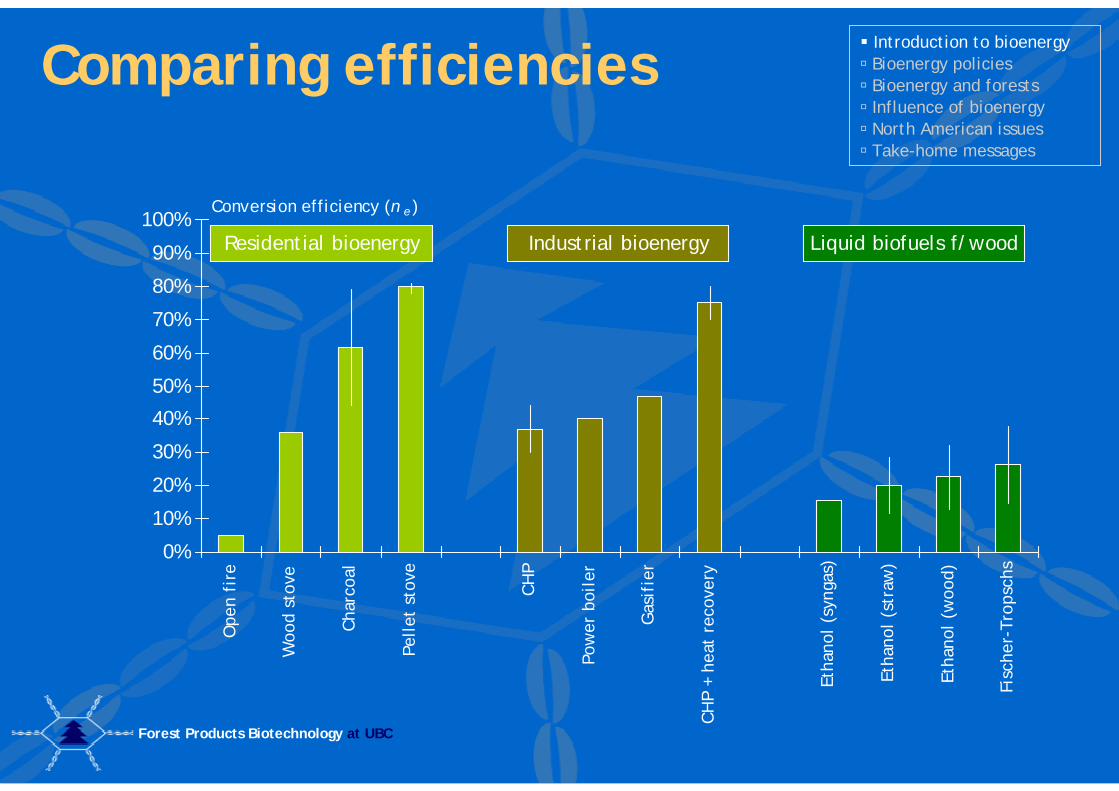
Conversion efficiency (n e )
Residential bioenergy Industrial bioenergy Liquid biofuels f/wood
Comparing efficienciesIntroduction to bioenergyBioenergy policiesBioenergy and forestsInfluence of bioenergyNorth American issuesTake-home messages

Forest Products Biotechnology at UBC
Bioenergy policy toolsTop-down, ‘rigid’ mechanisms
Feed-in tariffs(set a specific price that utilities must pay to domestic producers of ‘green’ electricity)
Fixed price mechanisms(premium or bonus paid above the normal rate directly to producers and/or distributors of ‘green’ energy)
Renewable energy obligation(mandate the amount of renewable energy in an energy portfolio)
Bottom-up mechanismsGreen certificates(renewable electricity is sold at conventional prices, but consumers must purchase green certificates to cover a % of total electricity consumption)
Tax incentives, loan guarantees, grants
Source: FAOStat 2007a, FAO 2006, FAO 1998
Introduction to bioenergyBioenergy policiesBioenergy and forestsInfluence of bioenergyNorth American issuesTake-home messages

Forest Products Biotechnology at UBC
Recent developmentsEuropean UnionFour primary policies cover the European Union:
Energy efficiency in buildings and end-use applications (2 Directives)Trade of GHG emissions throughout the EU (Directive 2003/87/EC)Production of electricity from renewable sources (Directive 2001/77/EC)Promotion of biofuels for transport (Directive 2003/30/EC)
A Biomass Action Plan has also been developed (2005)
A new Directive (2007) sets specific goals beyond 2012:20% target for renewable energy in 202010% target for biofuels in 2020Includes a sustainability scheme
Source: FAOStat 2007a, FAO 2006, FAO 1998
Introduction to bioenergyBioenergy policiesBioenergy and forestsInfluence of bioenergyNorth American issuesTake-home messages

Forest Products Biotechnology at UBC
Recent developmentsUnited States
21 States have renewable portfolio standardsFederal renewable fuel mandateFederal initiatives include a tax credit for biomass energy (but this does not yet apply to all forest bioenergy)Loan guarantees are also available under the Biomass energy and Alcohol Fuels Act of 1980
CanadaA Renewable Energy Working Group has been formed by the Canadian Council of Energy Ministers and tasked with providing a framework to maximize renewable energy potentialSome provinces (Ontario, Quebec, British Columbia) developing independent strategies that include bioenergyOntario has recently introduced a feed-in tariff that applies to biomassA Renewable Energy Deployment Initiative ended in March 2007; a new ecoEnergy/ecoAction programme is being implemented
Source: FAOStat 2007a, FAO 2006, FAO 1998
Introduction to bioenergyBioenergy policiesBioenergy and forestsInfluence of bioenergyNorth American issuesTake-home messages

Forest Products Biotechnology at UBC
Bioenergy policy issuesNot clearly differentiated from renewableenergy goals and policies in most cases
Interdisciplinary nature of bioenergy requires multiple agencies to collaborate in traditional government systems(i.e. natural resources, environment, energy, interior, transport, etc.)
Confusion exists over performance metrics(i.e. economics, GHG emissions, energy balance, contribution to TPES, etc.)
Need for coordination between stakeholders
Introduction to bioenergyBioenergy policiesBioenergy and forestsInfluence of bioenergyNorth American issuesTake-home messages
Forest Products Biotechnology at UBC
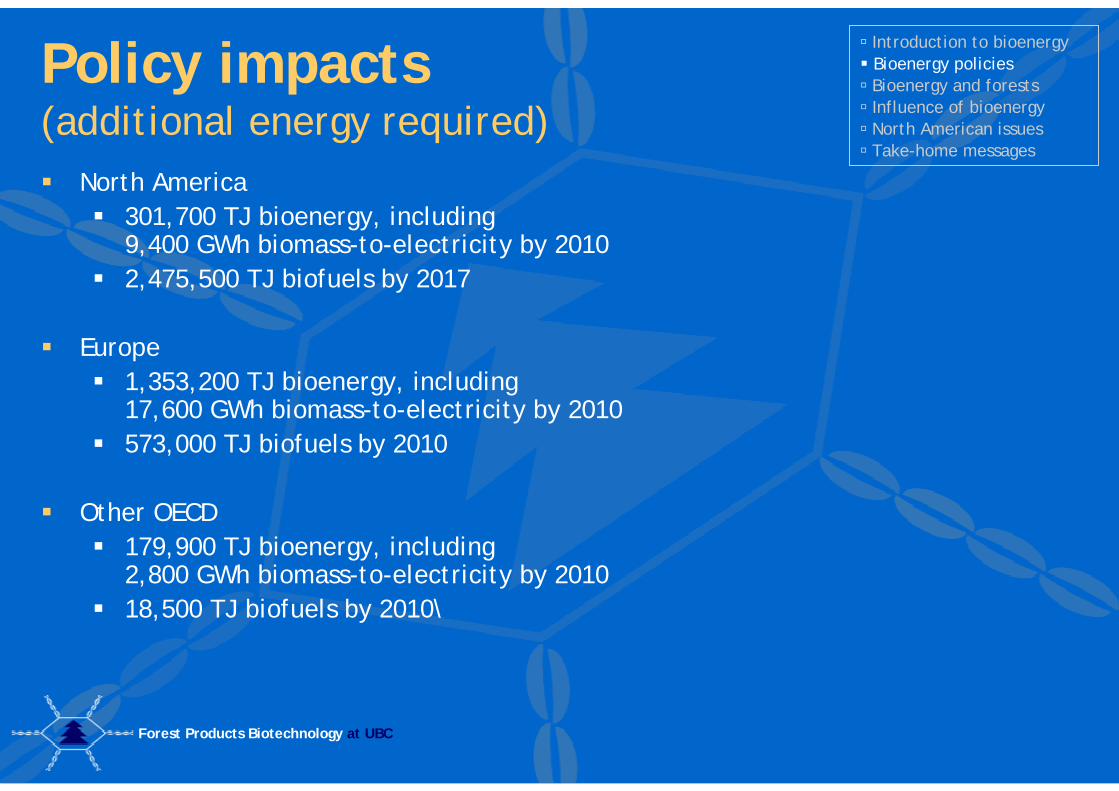
Policy impacts(additional energy required)
North America301,700 TJ bioenergy, including9,400 GWh biomass-to-electricity by 20102,475,500 TJ biofuels by 2017
Europe1,353,200 TJ bioenergy, including 17,600 GWh biomass-to-electricity by 2010573,000 TJ biofuels by 2010
Other OECD179,900 TJ bioenergy, including2,800 GWh biomass-to-electricity by 2010 18,500 TJ biofuels by 2010\
Introduction to bioenergyBioenergy policiesBioenergy and forestsInfluence of bioenergyNorth American issuesTake-home messages
Forest Products Biotechnology at UBC
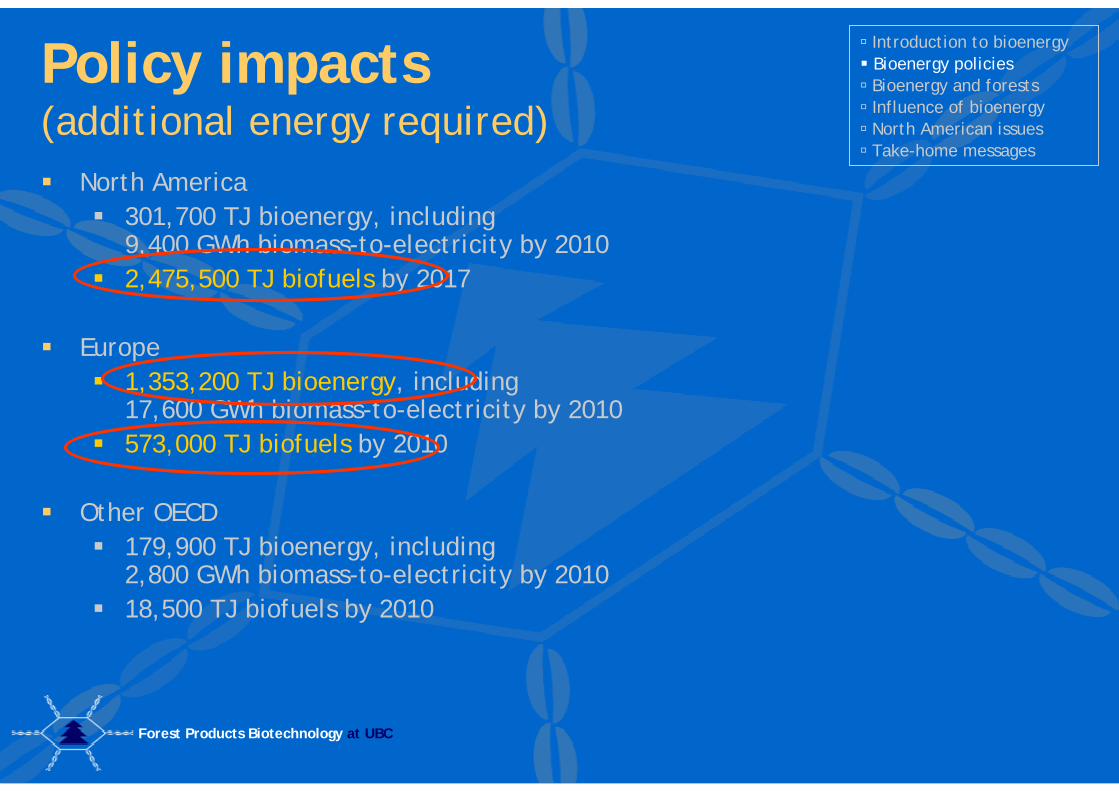
Policy impacts(additional energy required)
North America301,700 TJ bioenergy, including9,400 GWh biomass-to-electricity by 20102,475,500 TJ biofuels by 2017
Europe1,353,200 TJ bioenergy, including 17,600 GWh biomass-to-electricity by 2010573,000 TJ biofuels by 2010
Other OECD179,900 TJ bioenergy, including2,800 GWh biomass-to-electricity by 2010 18,500 TJ biofuels by 2010
Introduction to bioenergyBioenergy policiesBioenergy and forestsInfluence of bioenergyNorth American issuesTake-home messages

Forest Products Biotechnology at UBC
0
50
100
150
200
250
USA
Can
ada
Fran
ce
Swed
en
Finl
and
Ger
man
y
Aus
tria
Cze
ch R
ep.
Nor
way
Swit
zerl
and
Net
herl
ands UK
Recovered (post-consumer)
Indirect (black liquor, pellets)
Direct (from forests)
Wood-to-energy (M m3/year)
Source: Steierer et al. 2007
Introduction to bioenergyBioenergy policies Bioenergy and forestsInfluence of bioenergyNorth American issuesTake-home messages
The Joint Wood Energy Enquiry (UNECE, FAO, IEA, EC) providesdetailed data on the volumes andflows of wood energy in 12 European and 2 North American countries
Wood-to-energy (OECD)(Joint Wood Energy Enquiry)

Forest Products Biotechnology at UBC
0
50
100
150
200
250
USA
Can
ada
Fran
ce
Swed
en
Finl
and
Ger
man
y
Aus
tria
Cze
ch R
ep.
Nor
way
Swit
zerl
and
Net
herl
ands UK
Recovered (post-consumer)
Indirect (black liquor, pellets)
Direct (from forests)
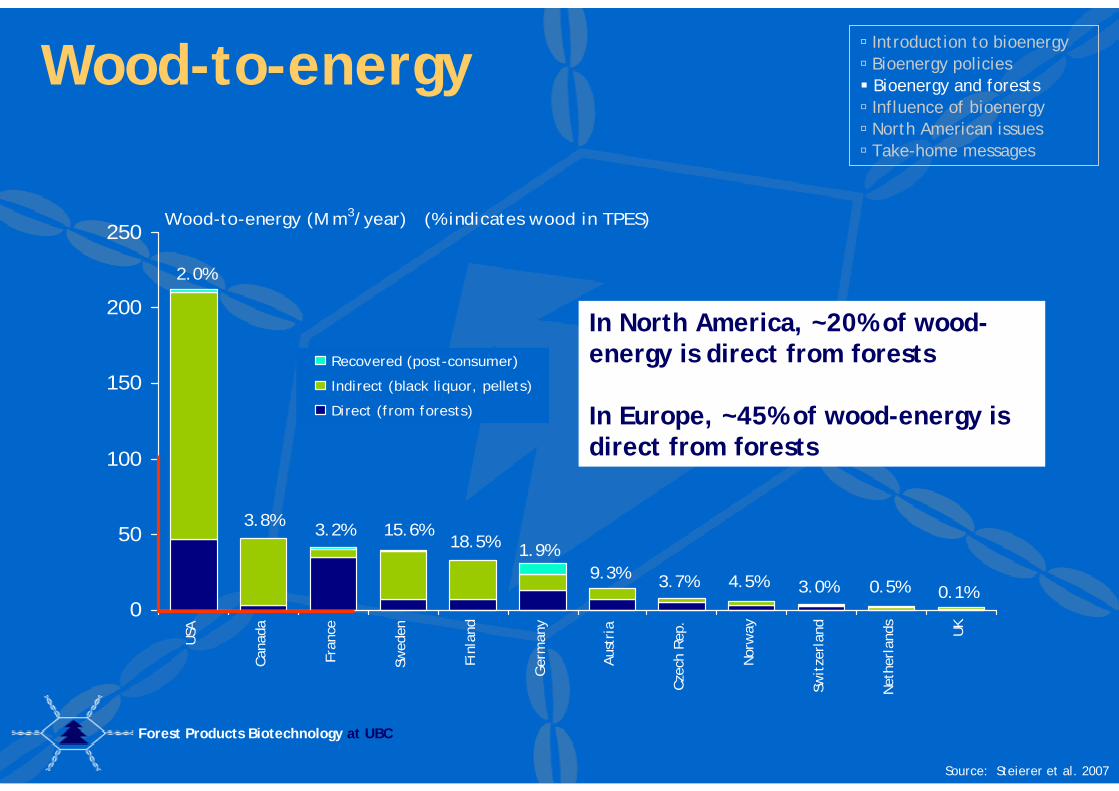
Wood-to-energy (M m3/year) (% indicates wood in TPES)
2.0%
3.8% 3.2% 15.6%18.5% 1.9%
9.3% 3.7% 4.5% 3.0% 0.5% 0.1%
Source: Steierer et al. 2007
Introduction to bioenergyBioenergy policies Bioenergy and forestsInfluence of bioenergyNorth American issuesTake-home messages
Wood-to-energy in TPES(Total Primary Energy Supply)
Forest Products Biotechnology at UBC
Wood-to-energy
0
50
100
150
200
250
USA
Can
ada
Fran
ce
Swed
en
Finl
and
Ger
man
y
Aus
tria
Cze
ch R
ep.
Nor
way
Swit
zerl
and
Net
herl
ands UK
Recovered (post-consumer)
Indirect (black liquor, pellets)
Direct (from forests)
Wood-to-energy (M m3/year) (% indicates wood in TPES)
2.0%
3.8% 3.2% 15.6%18.5% 1.9%
9.3% 3.7% 4.5% 3.0% 0.5% 0.1%
Source: Steierer et al. 2007
Introduction to bioenergyBioenergy policies Bioenergy and forestsInfluence of bioenergyNorth American issuesTake-home messages
In North America, ~20% of wood-energy is direct from forests
In Europe, ~45% of wood-energy is direct from forests

Forest Products Biotechnology at UBC
Forest biomass (OECD)
0
50
100
150
200
250
300
350
400
Canada Australia USA Spain France Germany Japan Finland Sweden Austria Other
OECD
Forest 'surplus' (Growth - Removals) (M m3/year)
Source: Mabee Saddler 2007
Introduction to bioenergyBioenergy policies Bioenergy and forestsInfluence of bioenergyNorth American issuesTake-home messages
Total ‘surplus’ forest biomass: Approximately 893 M m3 per year (?)
However, we don’t know:- how much is economically available- how much is really sustainable

Forest Products Biotechnology at UBC
Policy impacts(additional energy required)
North America301,700 TJ bioenergy, including9,400 GWh biomass-to-electricity by 20102,475,500 TJ biofuels by 2017
Europe1,353,200 TJ bioenergy, including 17,600 GWh biomass-to-electricity by 2010573,000 TJ biofuels by 2010
Other OECD179,900 TJ bioenergy, including2,800 GWh biomass-to-electricity by 2010 18,500 TJ biofuels by 2010
Introduction to bioenergyBioenergy policies Bioenergy and forestsInfluence of bioenergyNorth American issuesTake-home messages

Forest Products Biotechnology at UBC
Policy impacts - A(additional wood-to-energy)
0
20
40
60
80
100
120
140
160
A. Current
trends (to
2010)
Other
Finland
Sweden
France
Canada
USA
Additional woodfuels (M m3/year)
85 M m3/year
Source: Mabee Saddler 2007
Introduction to bioenergyBioenergy policies Bioenergy and forestsInfluence of bioenergyNorth American issuesTake-home messages
If current proportions of wood energy as a component of renewable energy persist, and current conversion technologies are not improved, approximately 85 million m3 of additional forest biomass will be required to meet OECD policy goals by 2010
This is approximately 10% of the total forest ‘surplus’ across the OECD membership

Forest Products Biotechnology at UBC
Policy impacts - B(additional wood-to-energy)
0
20
40
60
80
100
120
140
160
A. Current
trends (to
2010)
B. High
efficiency, no
biofuels (to
2010)
Other
Finland
Sweden
France
Canada
USA
Additional woodfuels (M m3/year)
85 M m3/year
73 M m3/year
Source: Mabee Saddler 2007
Introduction to bioenergyBioenergy policies Bioenergy and forestsInfluence of bioenergyNorth American issuesTake-home messages
If new facilities employ state-of-the-art conversion technologies and all additional renewable energy requirements are met by wood energy, about 73 million m3 of additional forest biomass would be required by 2010 – less than the current trends case.
This is approximately 8% of the total forest ‘surplus’ across the OECD membership

Forest Products Biotechnology at UBC
Policy impacts - C(additional wood-to-energy)
0
20
40
60
80
100
120
140
160
A. Current
trends (to
2010)
B. High
efficiency, no
biofuels (to
2010)
C. High
efficiency,
10% biofuels
(to 2017)
Other
Finland
Sweden
France
Canada
USA
Additional woodfuels (M m3/year)
85 M m3/year
73 M m3/year
148 M m3/year
Source: Mabee Saddler 2007
Introduction to bioenergyBioenergy policies Bioenergy and forestsInfluence of bioenergyNorth American issuesTake-home messages
If the previous scenario is extended, and it is assumed that 10% of liquid biofuel requirements will also be met with wood biomass, it is estimated that about 148 M m3 of forest biomass will be required by 2017.
This is about 17% of the estimated forest ‘surplus’ across the OECD.

Forest Products Biotechnology at UBC
Policy impacts (additional wood-to-energy)
0
20
40
60
80
100
120
140
160
A. Current
trends (to
2010)
B. High
efficiency, no
biofuels (to
2010)
C. High
efficiency,
10% biofuels
(to 2017)
Other
Finland
Sweden
France
Canada
USA
Additional woodfuels (M m3/year)
85 M m3/year
73 M m3/year
148 M m3/year
Source: Mabee Saddler 2007
Introduction to bioenergyBioenergy policies Bioenergy and forestsInfluence of bioenergyNorth American issuesTake-home messages
The largest forest biomass requirements are likely to be found in the US and France, followed by Canada, Finland and Sweden.

Forest Products Biotechnology at UBC
Influence of bioenergyExpected increases in demand for forest biomass for bioenergy are relativelymoderate across the OECD
However, the demand for forest biomass could increase substantially with even a moderate increase in cellulosic biofuels
The impacts of food-based vs. wood-based biofuels needs to be explored further
Three big issues: energy balance, carbon balance, and food-vs.-fuel issues
Introduction to bioenergyBioenergy policiesBioenergy and forestsInfluence of bioenergyNorth American issuesTake-home messages

Forest Products Biotechnology at UBC
Energy balance(energy investment vs. output)
0
5
10
15
20
25
30
35
40
Marland &
Turhollow
1991
Lorenz &
Morris
1995
Graboski
2002
Shapouri
et al. 2002
Kim & Dale
2005
Pimentel &
Patzek
2005
Tyson et
al. 1993
Lynd &
Wang 2004
Sheehan et
al. 2004
Pimentel &
Patzek
2005
Ethanol Distribution
Industrial Processing
Feedstock Transport
Agriculture/Forestry
Net energy investment (MJ/litre)
Energy in 1 L of ethanol = 23.6 MJ
Corn-to-ethanol Cellulose-to-ethanol
Source: NRDC 2006. Ethanol: Energy well spent.
Introduction to bioenergyBioenergy policiesBioenergy and forestsInfluence of bioenergyNorth American issuesTake-home messages
Forest Products Biotechnology at UBC
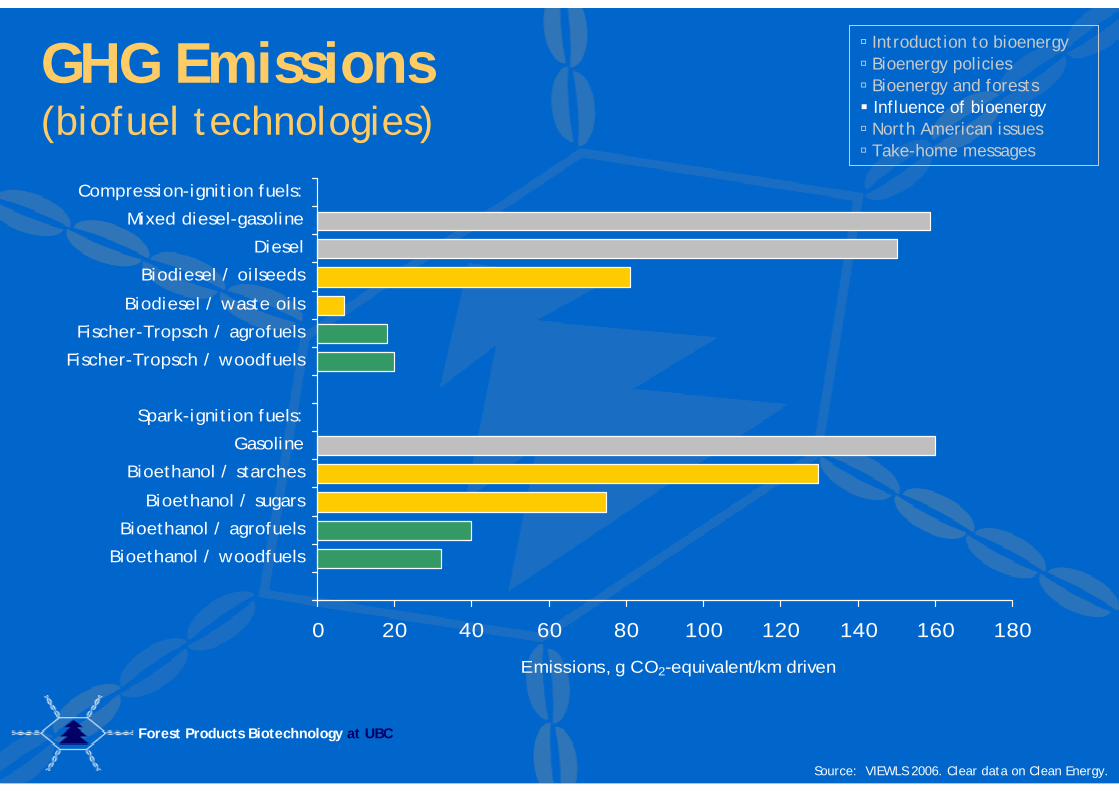
GHG Emissions(biofuel technologies)
0 20 40 60 80 100 120 140 160 180
Bioethanol / woodfuels
Bioethanol / agrofuels
Bioethanol / sugars
Bioethanol / starches
Gasoline
Spark-ignition fuels:
Fischer-Tropsch / woodfuels
Fischer-Tropsch / agrofuels
Biodiesel / waste oils
Biodiesel / oilseeds
Diesel
Mixed diesel-gasoline
Compression-ignition fuels:
Emissions, g CO2-equivalent/km driven
Source: VIEWLS 2006. Clear data on Clean Energy.
Introduction to bioenergyBioenergy policiesBioenergy and forestsInfluence of bioenergyNorth American issuesTake-home messages
Forest Products Biotechnology at UBC
Food vs. fuel(Mexican tortilla crisis)
Between August 2006 and January 2007, prices for tortillas in Mexico rose 3-4x, reaching about $1.81/kg (US)
Cause was reputedly high maize prices and a shortage of Mexican supply, due to increased exports to the USA
However, most biofuels rely on ‘yellow’ corn, while tortillas are made from ‘white’ corn
However, the dispute in the media continues
Source: Rosegrant et al., 2006
Introduction to bioenergyBioenergy policiesBioenergy and forestsInfluence of bioenergyNorth American issuesTake-home messages

Forest Products Biotechnology at UBC
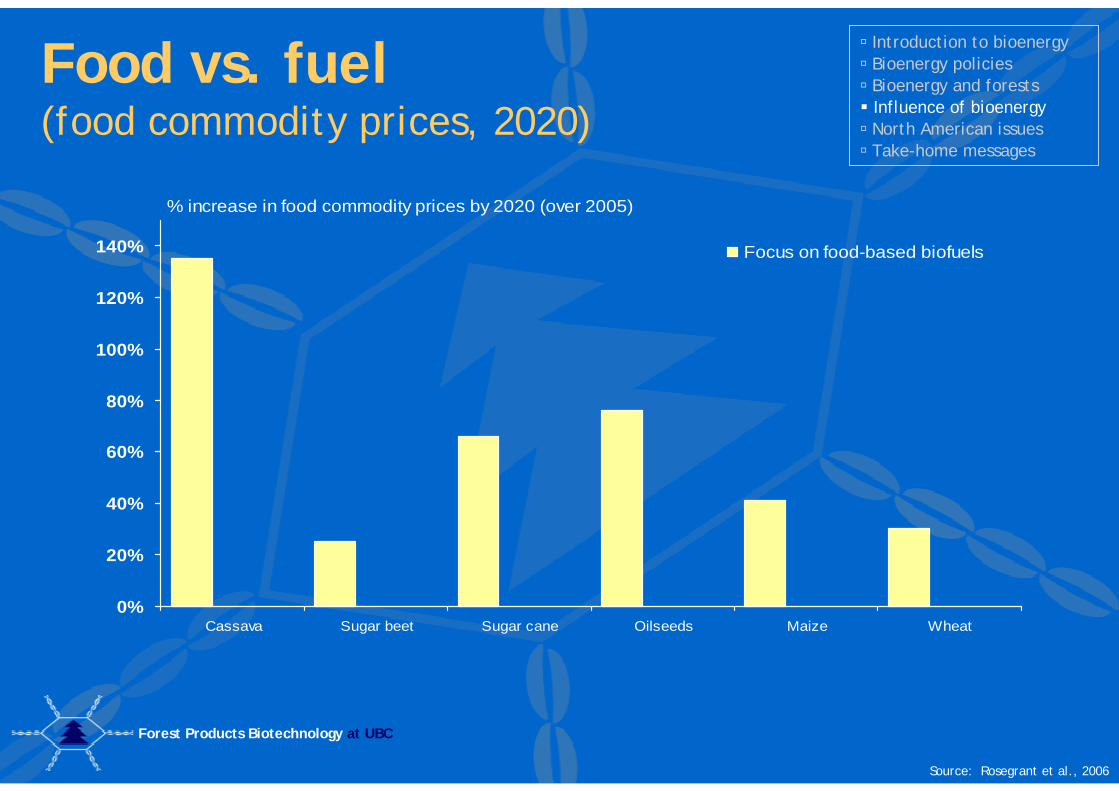
Schmidhuber (FAO, 2006) found that the extra demand for biofuel feedstocks has resulted in increased global agricultural commodity prices
An increase in food prices would impact food security in some nations, particularly where food is scarce
A price increase for food commodities would likely increase incomes in rural areas and potentially reduce poverty
Historically, real prices for food and agriculture have been declining, and a departure from this trend to meet biofuel demand may not be permanent
Food vs. fuel(food commodity prices, 2020)
Introduction to bioenergyBioenergy policiesBioenergy and forestsInfluence of bioenergyNorth American issuesTake-home messages

Forest Products Biotechnology at UBC
Food vs. fuel(food commodity prices, 2020)
0%
20%
40%
60%
80%
100%
120%
140%
Cassava Sugar beet Sugar cane Oilseeds Maize Wheat
Focus on food-based biofuels
% increase in food commodity prices by 2020 (over 2005)
Source: Rosegrant et al., 2006
Introduction to bioenergyBioenergy policiesBioenergy and forestsInfluence of bioenergyNorth American issuesTake-home messages
Study by the International Food Policy Research Instituteusing the IMPACT model (Rosegrant et al. 2006) found that,
under an aggressive scenario of biofuel growth, biofuel use would rise by 2-10x
Forest Products Biotechnology at UBC
Food vs. fuel(food commodity prices, 2020)
0%
20%
40%
60%
80%
100%
120%
140%
Cassava Sugar beet Sugar cane Oilseeds Maize Wheat
Focus on food-based biofuels
% increase in food commodity prices by 2020 (over 2005)
Source: Rosegrant et al., 2006
Introduction to bioenergyBioenergy policiesBioenergy and forestsInfluence of bioenergyNorth American issuesTake-home messages

Forest Products Biotechnology at UBC
Food vs. fuel(food commodity prices, 2020)
0%
20%
40%
60%
80%
100%
120%
140%
Cassava Sugar beet Sugar cane Oilseeds Maize Wheat
Focus on food-based biofuels
Shift to wood-based biofuels
Shift to wood-based biofuels +improved agriculture
% increase in food commodity prices by 2020 (over 2005)
Source: Rosegrant et al., 2006
Introduction to bioenergyBioenergy policiesBioenergy and forestsInfluence of bioenergyNorth American issuesTake-home messages
Wood-based biofuels can help minimize expected increases in food commodity prices

Forest Products Biotechnology at UBC
North America goalsUnited States
Triple bioenergy and bioproducts use by 2010Identify 1 billion tonnes of cellulosic feedstock for energy and fuel production by 2030
368 million tonnes forest biomass933 million tonnes agricultural biomass
133 billion litres of renewable fuels by 201730% bioethanol in gasoline by 2030
CanadaNo national bioenergy targetProvincial-level bioenergy goals being developed5% bioethanol in gasoline by 2010 2% biodiesel in diesel fuel by 2012
Source: FAOStat 2007a, FAO 2006, FAO 1998
Introduction to bioenergyBioenergy policiesBioenergy and forestsInfluence of bioenergyNorth American issuesTake-home messages

Forest Products Biotechnology at UBC
Introduction to bioenergyBioenergy policiesBioenergy and forestsInfluence of bioenergyNorth American issuesTake-home messages
Forest Products Biotechnology at UBC

Forest Products Biotechnology at UBC
Cellulosic ethanol
Iogen ($80 M)(Enzyme)
Bluefire ($40 M)(Acid)
Poet ($80 M)(Enzyme)
Abengoa ($76 M)(Enzyme / Thermochem)
Range ($76 M)(Thermochem)
Alico ($33 M)(Thermochem)
Demonstration plants (USDOE funding):
Introduction to bioenergyBioenergy policiesBioenergy and forestsInfluence of bioenergyNorth American issuesTake-home messages
Forest Products Biotechnology at UBC

Forest Products Biotechnology at UBC

Forest Products Biotechnology at UBC
Forest Products Biotechnology at UBC

Forest Products Biotechnology at UBC
0
2
4
6
8
10
12
14
16
1994
1995
1996
1997
1998
1999
2000
2001
2002
2003
2004
2005
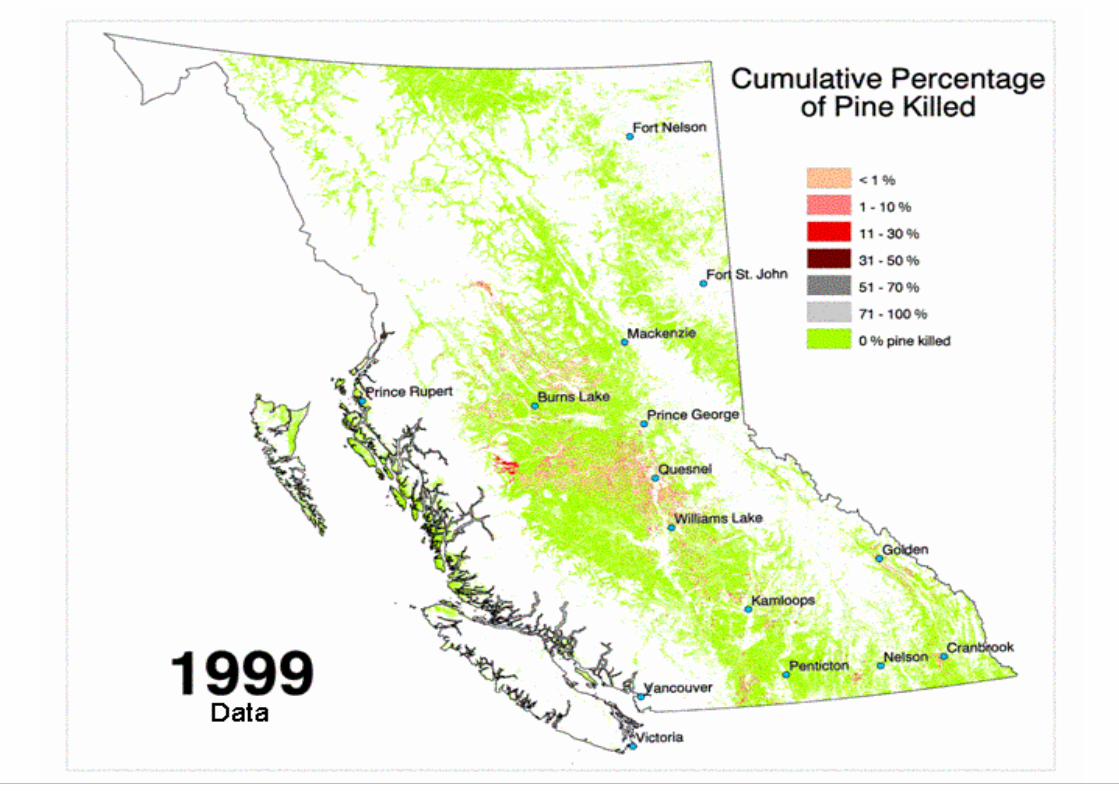
2005: 7 million hared attack
2005: 15 million ha 'spread over' (green, red, grey)
million ha
Cumulative impacts - areaD
enm
ark
5 m
illio
n ha
Port
ugal
10 m
illio
n ha
Sources: 1) Council of Forest Industries 2005.

Forest Products Biotechnology at UBC
Introduction to bioenergyBioenergy policiesBioenergy and forestsInfluence of bioenergyNorth American issuesTake-home messages
Take-home messagesResearch is still required, including development of better data describing biomass recovery from forestsand trade opportunities for biomass and biofuels
Policy does not yet define the role of forests; clear bioenergy policy goals would help define the size of the opportunity for forests
Policy impacts include an increased role for biofuels as well as bioenergy in the form of heat and power; this may result in great increases to forest biomass demand
When pursuing a biofuel future, wood-based biofuels can:Improve energy balance over food-based biofuelsReduce GHG emissions over petroleum fuels and food-based biofuels Reduce the impacts that biofuels will have on food pricesHelp deal with local impacts of climate change

Forest Products Biotechnology at UBC
AcknowledgementsFood and Agriculture Org.(Wulf Killman & colleagues)
International Energy Agency(Bioenergy Tasks, Task 39)
Natural Resources Canada,NSERC, Government of BC
Forest Products Biotechnology,University of British Columbia