Embed Size (px)
Citation preview
Hydrogen Production via Reforming ofHydrogen Production via Reforming ofBioBio--derived Liquidsderived Liquids
Yong Wang and David KingYong Wang and David King
U.S. Department of Energy Bio-Derived Liquids to Hydrogen Distributed Reforming Working Group
Kick-Off Meeting October 24, 2006, Baltimore, Maryland
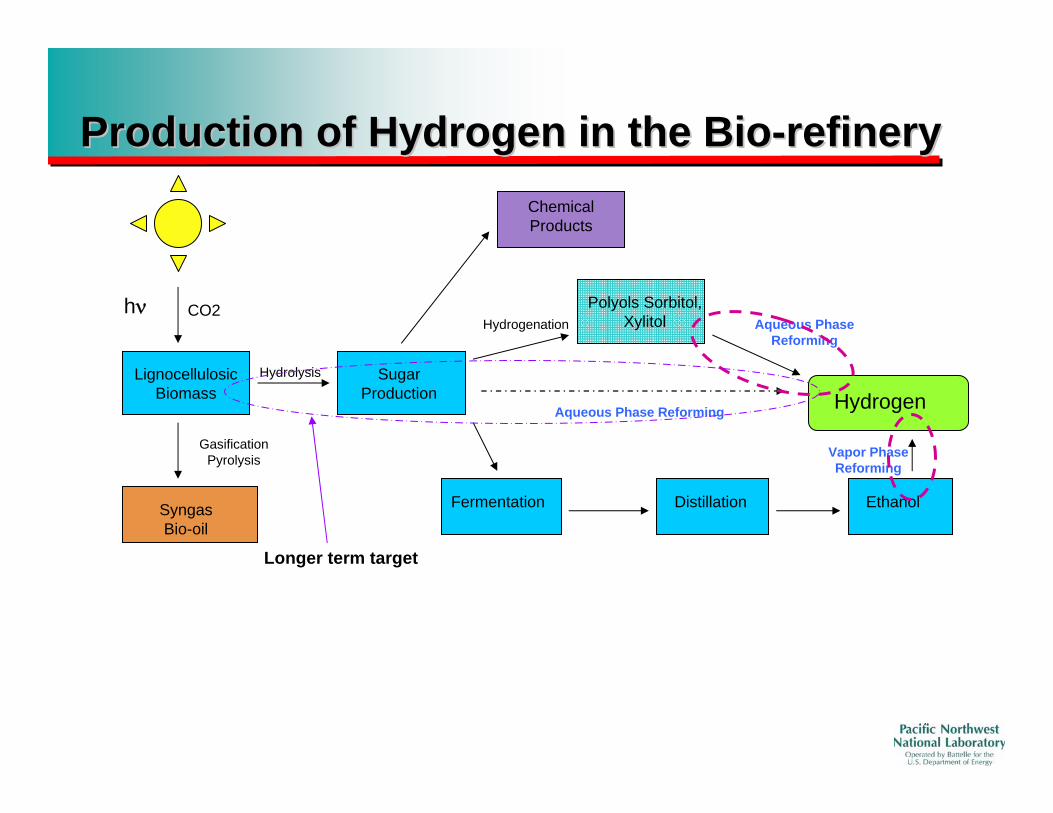
Production of Hydrogen in the BioProduction of Hydrogen in the Bio--refineryrefinery
hν CO2
Lignocellulosic Biomass
Sugar Production
Fermentation Distillation Ethanol
Hydrolysis
Hydrogenation
HydrogenAqueous Phase Reforming
Aqueous Phase Reforming
Vapor Phase Reforming
Gasification Pyrolysis
Syngas Bio-oil
Chemical Products
Polyols Sorbitol, Xylitol
Longer term target
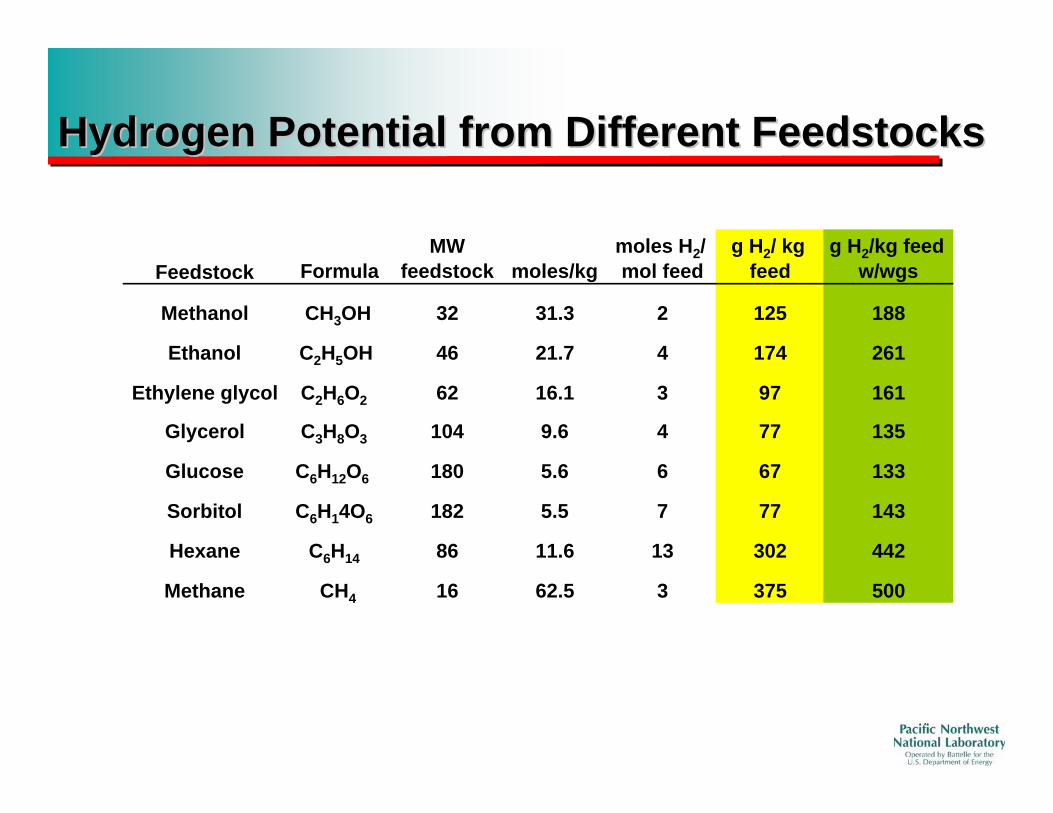
Hydrogen Potential from Different FeedstocksHydrogen Potential from Different Feedstocks
MW moles H2/ g H2/ kg g H2/kg feed Feedstock Formula feedstock moles/kg mol feed feed w/wgs
Methanol CH3OH 32 31.3 2 125 188
Ethanol C2H5OH 46 21.7 4 174 261
Ethylene glycol C2H6O2 62 16.1 3 97 161
Glycerol C3H8O3 104 9.6 4 77 135
Glucose C6H12O6 180 5.6 6 67 133
Sorbitol C6H14O6 182 5.5 7 77 143
Hexane C6H14 86 11.6 13 302 442
Methane CH4 16 62.5 3 375 500
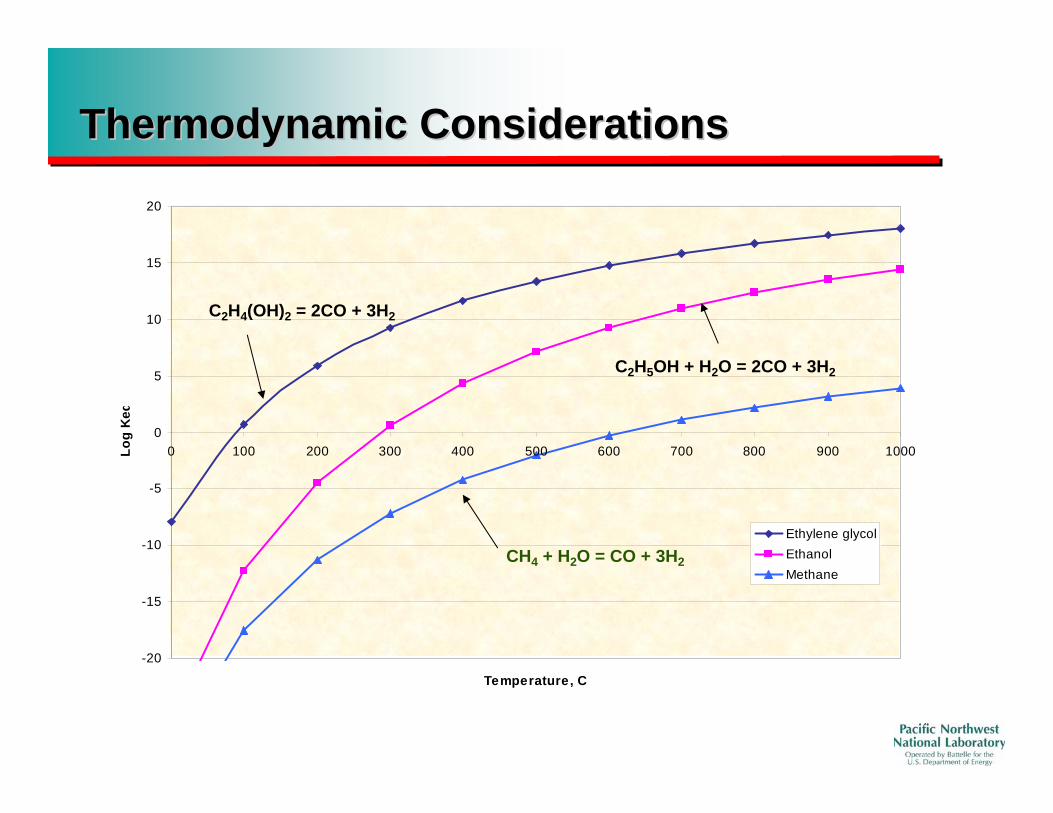
Thermodynamic ConsiderationsThermodynamic ConsiderationsLo
g K
eq
20
15
10
5
0
-5
-10
-15
-20
0 100 200 300 400 500 600 700 800 900 1000
Ethylene glycol Ethanol Methane
C2H4(OH)2 = 2CO + 3H2
C2H5OH + H2O = 2CO + 3H2
CH4 + H2O = CO + 3H2
Te mpe rature , C
Aqueous Phase Reforming
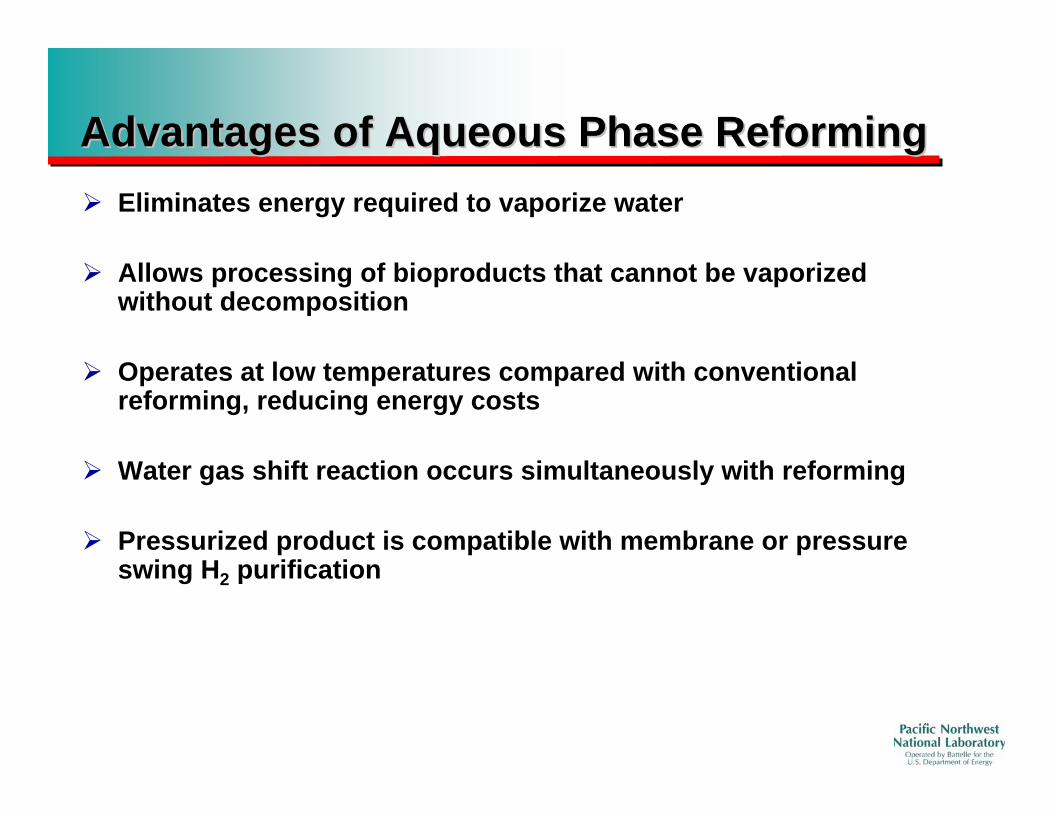
Advantages of Aqueous Phase ReformingAdvantages of Aqueous Phase Reforming¾ Eliminates energy required to vaporize water
¾ Allows processing of bioproducts that cannot be vaporizedwithout decomposition
¾ Operates at low temperatures compared with conventionalreforming, reducing energy costs
¾ Water gas shift reaction occurs simultaneously with reforming
¾ Pressurized product is compatible with membrane or pressureswing H2 purification
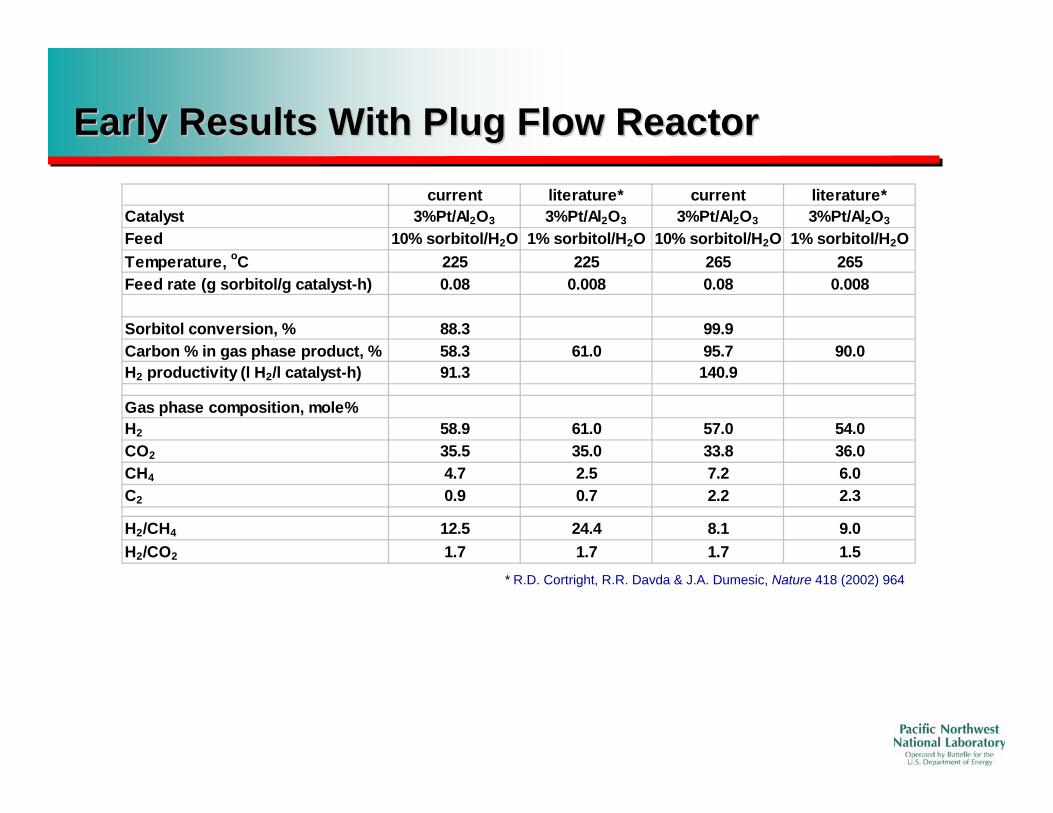
Early Results With Plug Flow ReactorEarly Results With Plug Flow Reactorcurrent literature* current literature*
Catalyst 3%Pt/Al2O3 3%Pt/Al2O3 3%Pt/Al2O3 3%Pt/Al2O3
Feed 10% sorbitol/H2O 1% sorbitol/H2O 10% sorbitol/H2O 1% sorbitol/H2O Temperature, oC 225 225 265 265 Feed rate (g sorbitol/g catalyst-h) 0.08 0.008 0.08 0.008
Sorbitol conversion, % 88.3 99.9 Carbon % in gas phase product, % 58.3 61.0 95.7 90.0 H2 productivity (l H2/l catalyst-h) 91.3 140.9
Gas phase composition, mole% H2 58.9 61.0 57.0 54.0 CO2 35.5 35.0 33.8 36.0 CH4 4.7 2.5 7.2 6.0 C2 0.9 0.7 2.2 2.3
H2/CH4 12.5 24.4 8.1 9.0 H2/CO2 1.7 1.7 1.7 1.5
* R.D. Cortright, R.R. Davda & J.A. Dumesic, Nature 418 (2002) 964
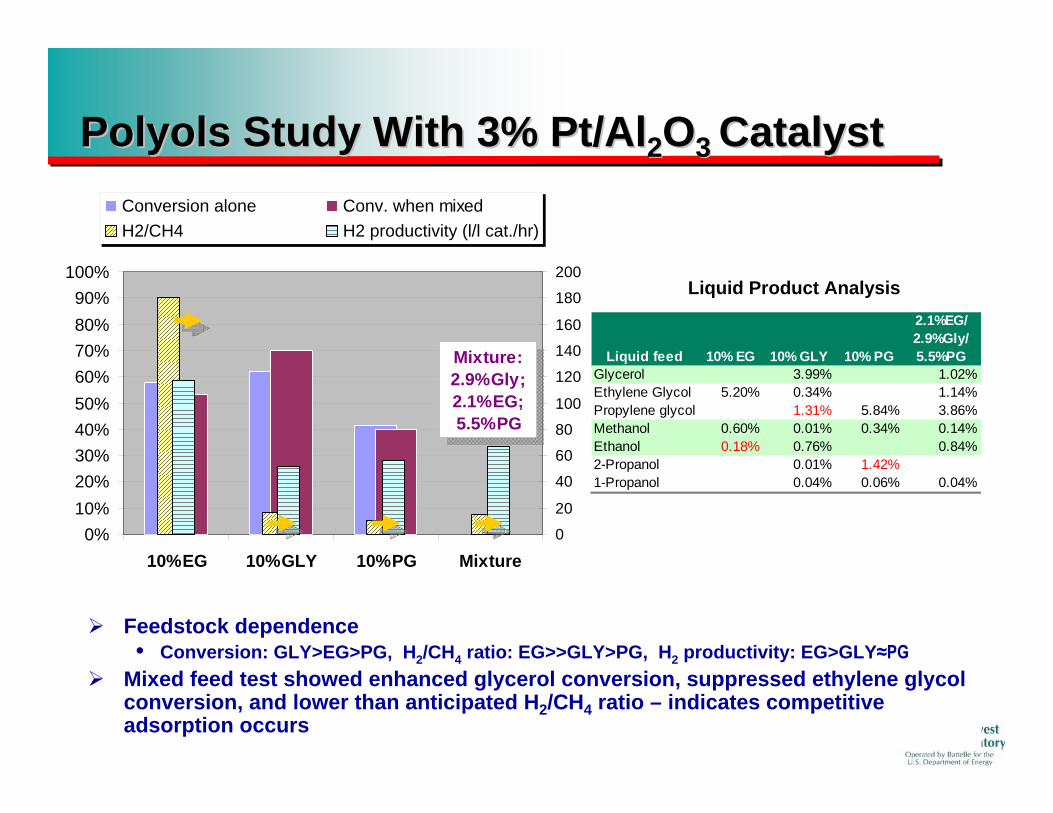
Polyols Study With 3% Pt/AlPolyols Study With 3% Pt/Al22OO3 3 CatalystCatalyst
0%10%20%30%40%50%60%70%80%90%
100%
10%EG 10%GLY 10%PG Mixture0
20
40
60
80
100
120
140
160
180
200
Conversion alone Conv. when mixedH2/CH4 H2 productivity (l/l cat./hr)
Mixture: 2.9%Gly; 2.1%EG; 5.5%PG
¾ Feedstock dependence• Conversion: GLY>EG>PG, H2/CH4 ratio: EG>>GLY>PG, H2 productivity: EG>GLY≈PG
¾ Mixed feed test showed enhanced glycerol conversion, suppressed ethylene glycol conversion, and lower than anticipated H2/CH4 ratio – indicates competitive adsorption occurs
Liquid feed 10% EG 10% GLY 10% PG
2.1%EG/ 2.9%Gly/ 5.5%PG
Glycerol 3.99% 1.02%Ethylene Glycol 5.20% 0.34% 1.14%Propylene glycol 1.31% 5.84% 3.86%Methanol 0.60% 0.01% 0.34% 0.14%Ethanol 0.18% 0.76% 0.84%2-Propanol 0.01% 1.42%1-Propanol 0.04% 0.06% 0.04%
Liquid Product Analysis
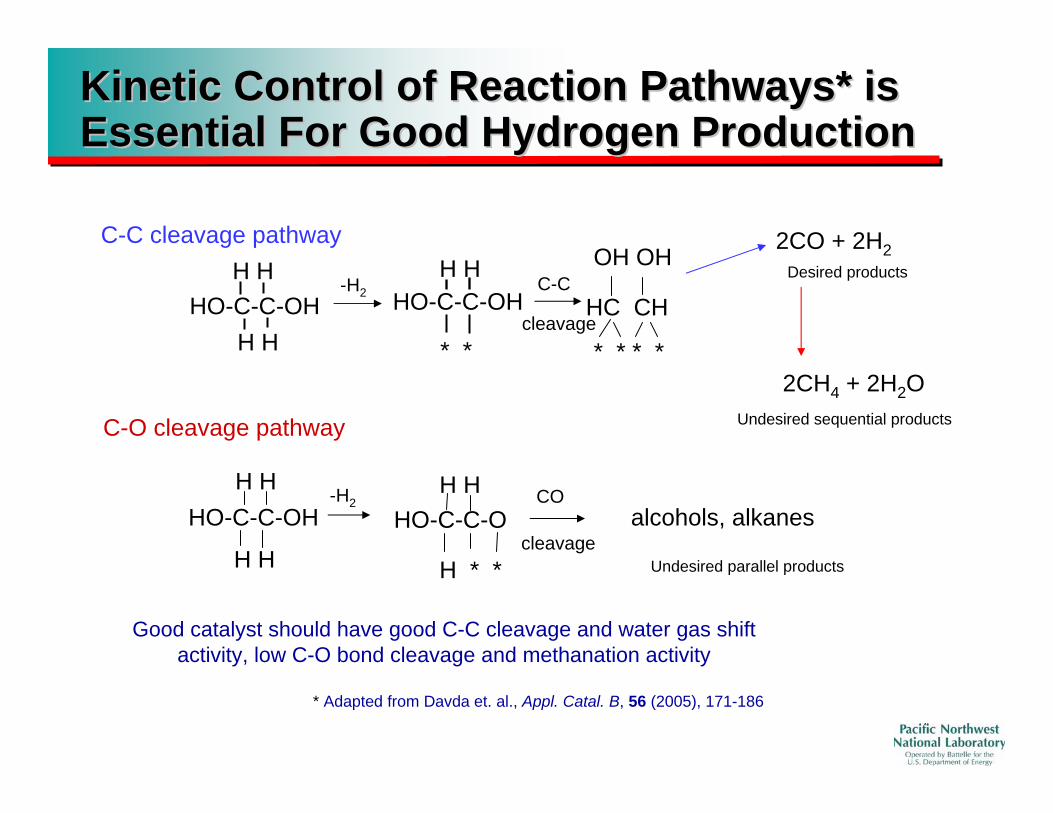
Kinetic Control of Reaction Pathways* isKinetic Control of Reaction Pathways* isEssential For Good Hydrogen ProductionEssential For Good Hydrogen Production
C-C cleavage pathway 2CO + 2H2 H H H H OH OH
Desired productsC-C-H2 HO-C-C-OHHO-C-C-OH HC CH
cleavageH H * * * * * *
2CH4 + 2H2O
C-O cleavage pathway Undesired sequential products
H H HO-C-C-O
H H CO-H2HO-C-C-OH alcohols, alkanes
cleavageH H H * * Undesired parallel products
Good catalyst should have good C-C cleavage and water gas shift activity, low C-O bond cleavage and methanation activity
* Adapted from Davda et. al., Appl. Catal. B, 56 (2005), 171-186
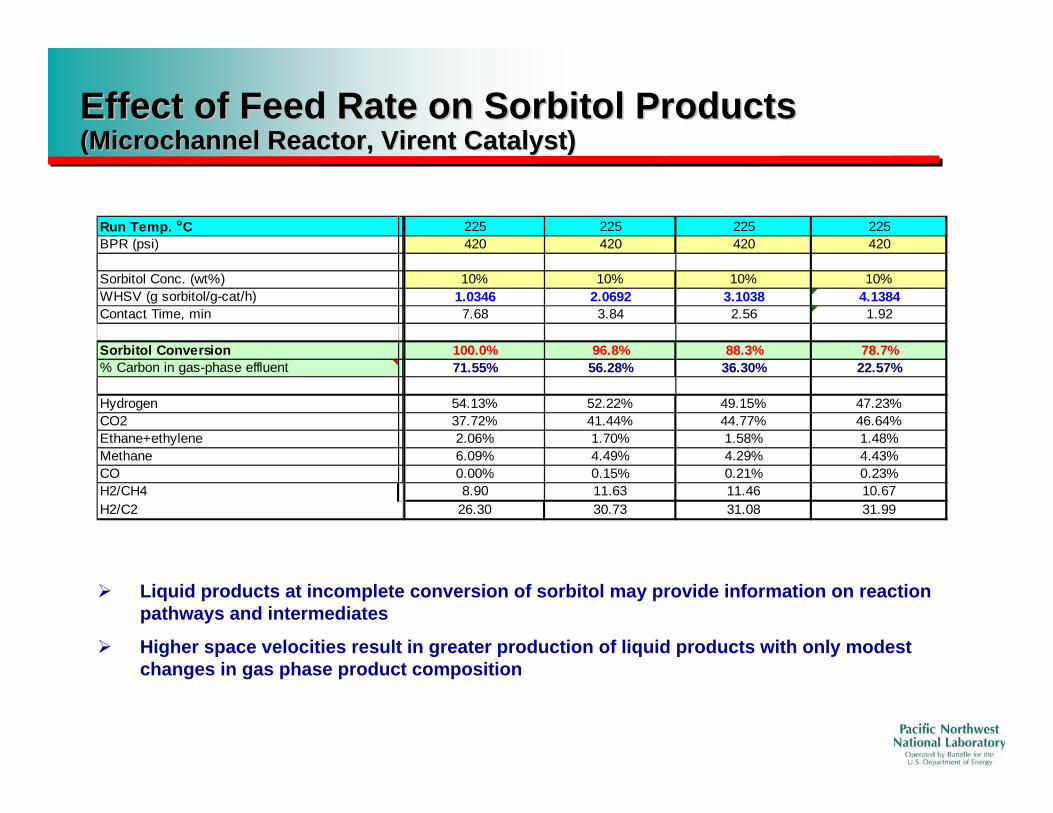
Effect of Feed Rate on Sorbitol ProductsEffect of Feed Rate on Sorbitol Products(Microchannel Reactor, Virent Catalyst)(Microchannel Reactor, Virent Catalyst)
Run Temp. oC 225 225 225 225 BPR (psi) 420 420 420 420
Sorbitol Conc. (wt%) 10% 10% 10% 10% WHSV (g sorbitol/g-cat/h) 1.0346 2.0692 3.1038 4.1384 Contact Time, min 7.68 3.84 2.56 1.92
Sorbitol Conversion 100.0% 96.8% 88.3% 78.7% % Carbon in gas-phase effluent 71.55% 56.28% 36.30% 22.57%
Hydrogen 54.13% 52.22% 49.15% 47.23% CO2 37.72% 41.44% 44.77% 46.64% Ethane+ethylene 2.06% 1.70% 1.58% 1.48% Methane 6.09% 4.49% 4.29% 4.43% CO 0.00% 0.15% 0.21% 0.23% H2/CH4 8.90 11.63 11.46 10.67 H2/C2 26.30 30.73 31.08 31.99
¾ Liquid products at incomplete conversion of sorbitol may provide information on reaction pathways and intermediates
¾ Higher space velocities result in greater production of liquid products with only modest changes in gas phase product composition
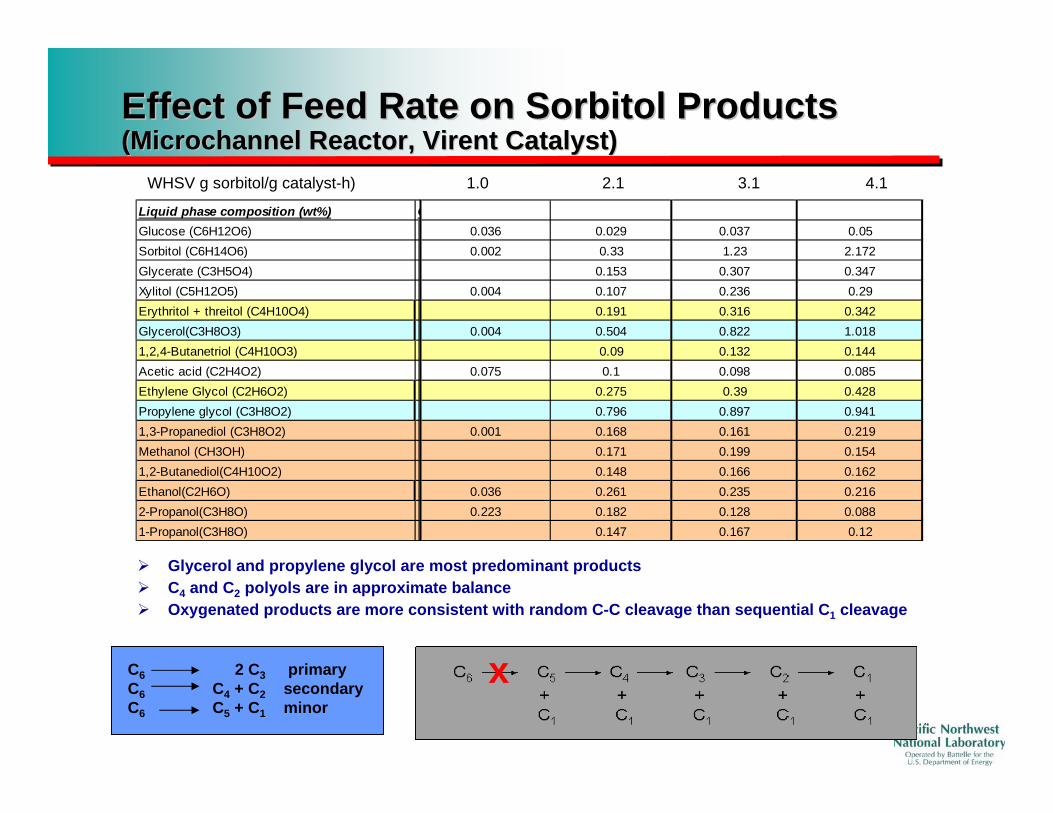
Effect of Feed Rate on Sorbitol ProductsEffect of Feed Rate on Sorbitol Products(Microchannel Reactor, Virent Catalyst)(Microchannel Reactor, Virent Catalyst)
WHSV g sorbitol/g catalyst-h) 1.0 2.1 3.1 4.1
Liquid phase composition (wt%) C Glucose (C6H12O6) 0.036 0.029 0.037 0.05 Sorbitol (C6H14O6) 0.002 0.33 1.23 2.172 Glycerate (C3H5O4) 0.153 0.307 0.347 Xylitol (C5H12O5) 0.004 0.107 0.236 0.29 Erythritol + threitol (C4H10O4) 0.191 0.316 0.342 Glycerol(C3H8O3) 0.004 0.504 0.822 1.018 1,2,4-Butanetriol (C4H10O3) 0.09 0.132 0.144 Acetic acid (C2H4O2) 0.075 0.1 0.098 0.085 Ethylene Glycol (C2H6O2) 0.275 0.39 0.428 Propylene glycol (C3H8O2) 0.796 0.897 0.941 1,3-Propanediol (C3H8O2) 0.001 0.168 0.161 0.219 Methanol (CH3OH) 0.171 0.199 0.154 1,2-Butanediol(C4H10O2) 0.148 0.166 0.162 Ethanol(C2H6O) 0.036 0.261 0.235 0.216 2-Propanol(C3H8O) 0.223 0.182 0.128 0.088 1-Propanol(C3H8O) 0.147 0.167 0.12
¾ Glycerol and propylene glycol are most predominant products ¾ C4 and C2 polyols are in approximate balance ¾ Oxygenated products are more consistent with random C-C cleavage than sequential C1 cleavage
C6 2 C3 primary C6 C4 + C2 secondary C6 C5 + C1 minor
x
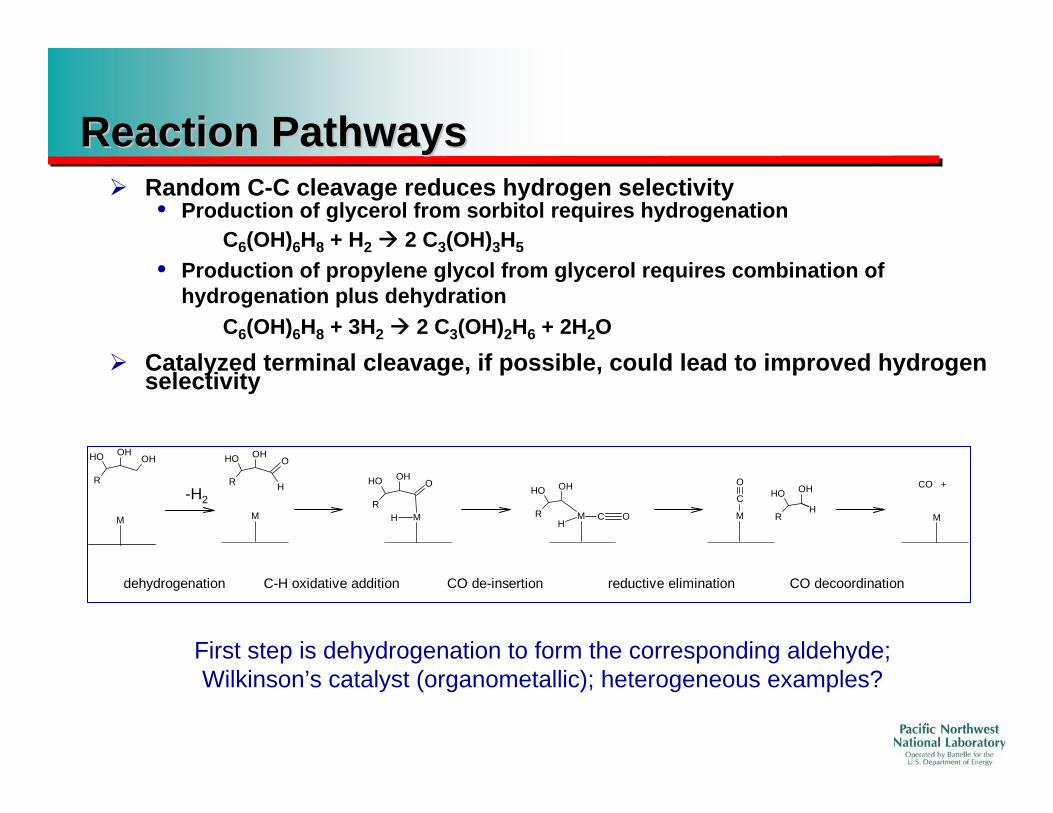
Reaction PathwaysReaction Pathways¾ Random C-C cleavage reduces hydrogen selectivity
• Production of glycerol from sorbitol requires hydrogenation C6(OH)6H8 + H2 Æ 2 C3(OH)3H5
• Production of propylene glycol from glycerol requires combination ofhydrogenation plus dehydration
C6(OH)6H8 + 3H2 Æ 2 C3(OH)2H6 + 2H2O ¾ Catalyzed terminal cleavage, if possible, could lead to improved hydrogen
selectivity
OHOHOH
R
M
OOHOH
R H
M M
OOHOH
R H
OHOH
R C OM H
OHOH
R H
dehydrogenation C-H oxidative addition CO de-insertion
M
C
O
M
CO +
reductive elimination CO decoordination
-H2
First step is dehydrogenation to form the corresponding aldehyde; Wilkinson’s catalyst (organometallic); heterogeneous examples?
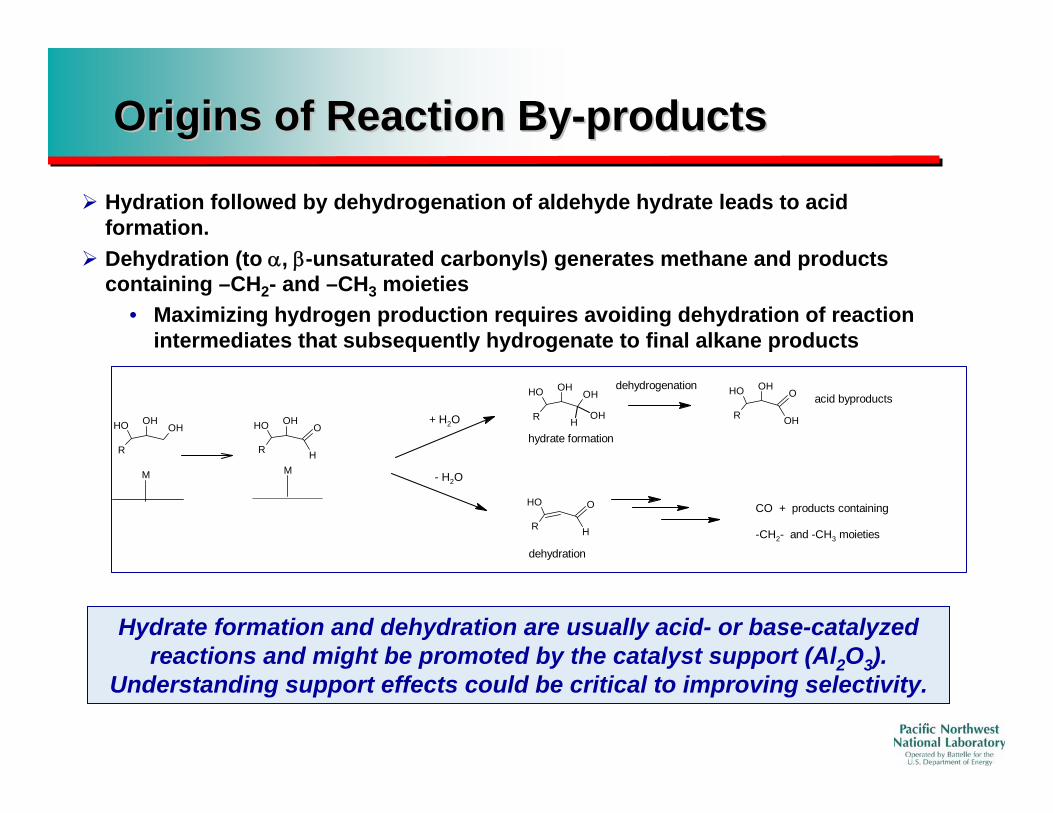
Origins of Reaction ByOrigins of Reaction By--productsproducts
¾ Hydration followed by dehydrogenation of aldehyde hydrate leads to acid formation.
¾ Dehydration (to α, β-unsaturated carbonyls) generates methane and products containing –CH2- and –CH3 moieties
• Maximizing hydrogen production requires avoiding dehydration of reaction intermediates that subsequently hydrogenate to final alkane products
dehydrogenation OH OHOH OH OOH acid byproducts OH R OHOH OH
OH OH OH + H2O R H hydrate formation
O
RR H
M M - H2O
OH O CO + products containing R H -CH2- and -CH3 moieties
dehydration
Hydrate formation and dehydration are usually acid- or base-catalyzed reactions and might be promoted by the catalyst support (Al2O3).
Understanding support effects could be critical to improving selectivity.
Conclusions and Path ForwardConclusions and Path Forward –– Aqueous Phase ReformingAqueous Phase Reforming
Conclusions ¾ Identifying reaction intermediates can be important for catalyst
design to increase hydrogen selectivity and productivity ¾ Catalyst modification may help hydrogen selectivity through
controlling certain classes of reactions
Path Forward ¾ Focus on the sorbitol and xylitol feedstocks and improve
hydrogen productivity by better understanding and controlling • Formation of intermediates • Reaction pathways of these intermediates
¾ Innovate the reaction engineering to improve the space time yield of hydrogen.
Hydrogen Production from SteamHydrogen Production from Steam--reforming ofreforming ofEthanolEthanol
¾ “Bioethanol”• Higher energy density than lithium ion batteries • Clean and renewable - potentially CO2 neutral • Cost competitive
– selling price decreased from $5.66/gge in 2001 to $2.26/gge in 2005 • Low temperature activation possible
¾ Steam reforming of ethanol • As-fermented aqueous solution has a water/alcohol ratio: ~6:1
to 9:1+ • Reforming fermentation-derived feedstocks reduces the cost
associated with the purification
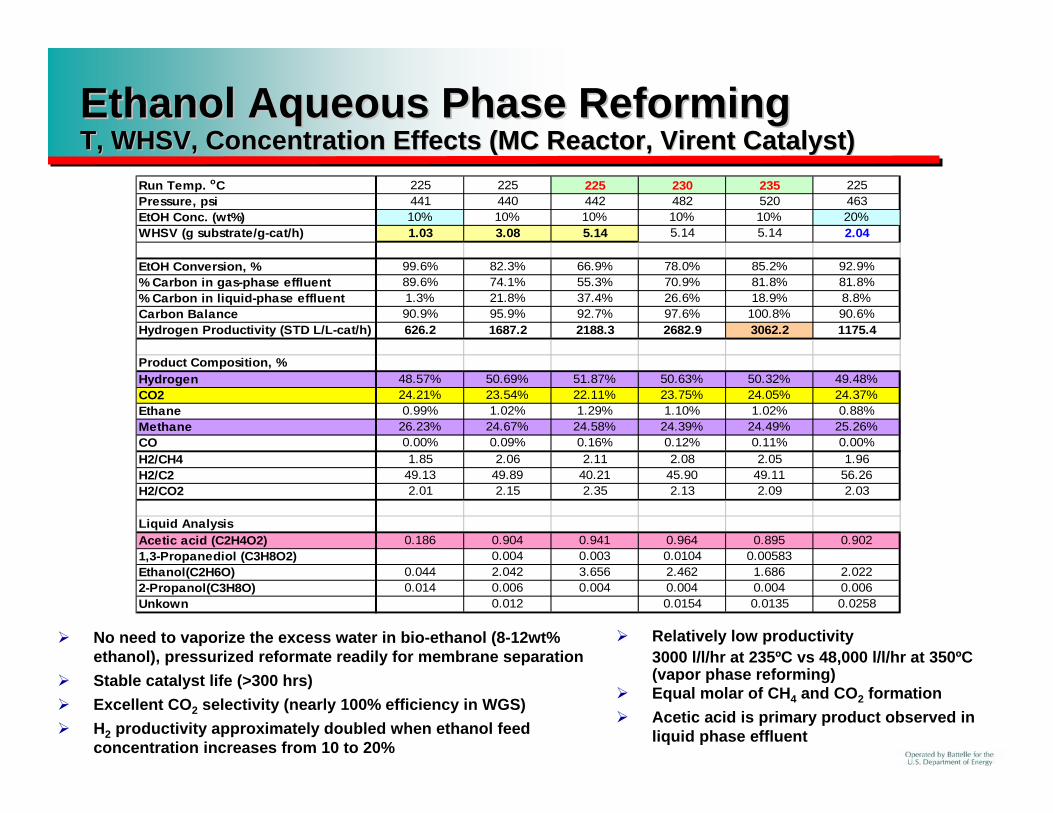
Ethanol Aqueous Phase ReformingEthanol Aqueous Phase ReformingT, WHSV, Concentration Effects (MC Reactor, Virent Catalyst)T, WHSV, Concentration Effects (MC Reactor, Virent Catalyst)
Run Temp. oC 225 225 225 230 235 225 Pressure, psi 441 440 442 482 520 463 EtOH Conc. (wt%) 10% 10% 10% 10% 10% 20% WHSV (g substrate/g-cat/h) 1.03 3.08 5.14 5.14 5.14 2.04
EtOH Conversion, % 99.6% 82.3% 66.9% 78.0% 85.2% 92.9% % Carbon in gas-phase effluent 89.6% 74.1% 55.3% 70.9% 81.8% 81.8% % Carbon in liquid-phase effluent 1.3% 21.8% 37.4% 26.6% 18.9% 8.8% Carbon Balance 90.9% 95.9% 92.7% 97.6% 100.8% 90.6% Hydrogen Productivity (STD L/L-cat/h) 626.2 1687.2 2188.3 2682.9 3062.2 1175.4
Product Composition, % Hydrogen 48.57% 50.69% 51.87% 50.63% 50.32% 49.48% CO2 24.21% 23.54% 22.11% 23.75% 24.05% 24.37% Ethane 0.99% 1.02% 1.29% 1.10% 1.02% 0.88% Methane 26.23% 24.67% 24.58% 24.39% 24.49% 25.26% CO 0.00% 0.09% 0.16% 0.12% 0.11% 0.00% H2/CH4 1.85 2.06 2.11 2.08 2.05 1.96 H2/C2 49.13 49.89 40.21 45.90 49.11 56.26 H2/CO2 2.01 2.15 2.35 2.13 2.09 2.03
Liquid Analysis Acetic acid (C2H4O2) 0.186 0.904 0.941 0.964 0.895 0.902 1,3-Propanediol (C3H8O2) 0.004 0.003 0.0104 0.00583 Ethanol(C2H6O) 0.044 2.042 3.656 2.462 1.686 2.022 2-Propanol(C3H8O) 0.014 0.006 0.004 0.004 0.004 0.006 Unkown 0.012 0.0154 0.0135 0.0258
¾ No need to vaporize the excess water in bio-ethanol (8-12wt% ethanol), pressurized reformate readily for membrane separation
¾ Stable catalyst life (>300 hrs) ¾ Excellent CO2 selectivity (nearly 100% efficiency in WGS) ¾ H2 productivity approximately doubled when ethanol feed
concentration increases from 10 to 20%
¾ Relatively low productivity 3000 l/l/hr at 235ºC vs 48,000 l/l/hr at 350ºC (vapor phase reforming)
¾ Equal molar of CH4 and CO2 formation ¾ Acetic acid is primary product observed in
liquid phase effluent
Vapor Phase Reforming of Ethanol
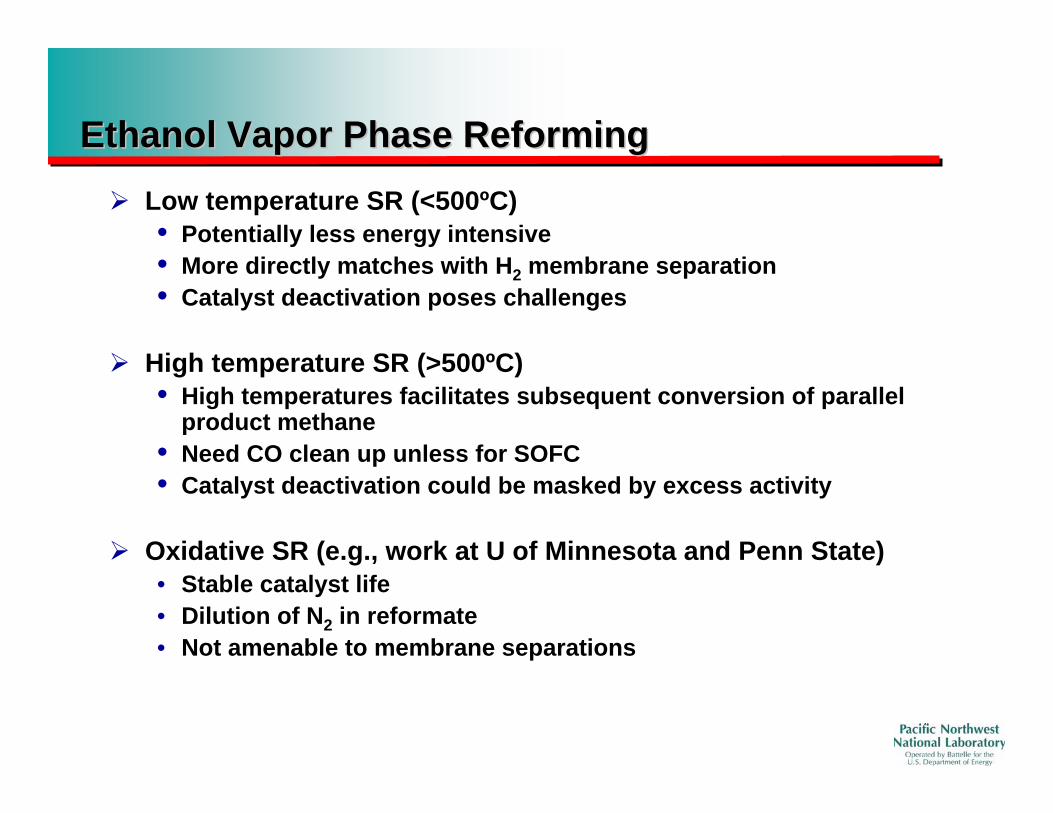
Ethanol Vapor Phase ReformingEthanol Vapor Phase Reforming¾ Low temperature SR (<500ºC)
• Potentially less energy intensive • More directly matches with H2 membrane separation • Catalyst deactivation poses challenges
¾ High temperature SR (>500ºC) • High temperatures facilitates subsequent conversion of parallel
product methane • Need CO clean up unless for SOFC • Catalyst deactivation could be masked by excess activity
¾ Oxidative SR (e.g., work at U of Minnesota and Penn State) • Stable catalyst life • Dilution of N2 in reformate • Not amenable to membrane separations
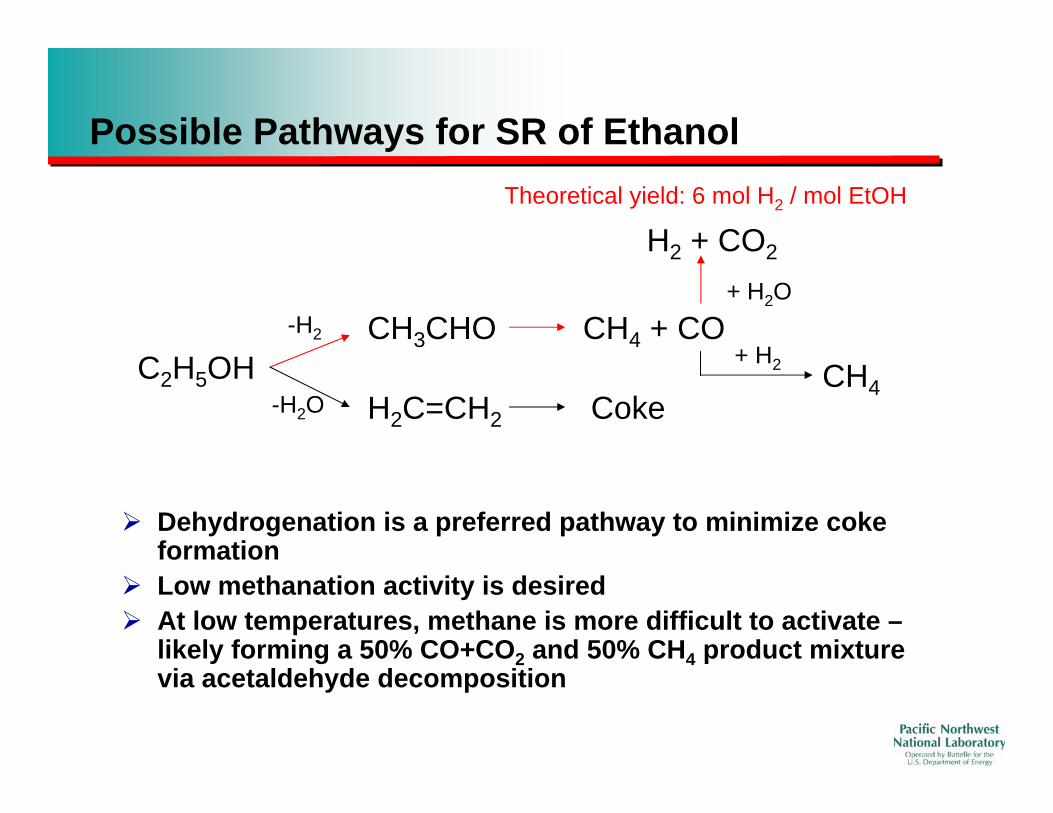
Possible Pathways for SR of Ethanol Theoretical yield: 6 mol H2 / mol EtOH
+ H2O
H2 + CO2
-H2 CH3CHO CH4 + CO + H2C2H5OH CH4
-H2O H2C=CH2 Coke
¾ Dehydrogenation is a preferred pathway to minimize coke formation
¾ Low methanation activity is desired ¾ At low temperatures, methane is more difficult to activate –
likely forming a 50% CO+CO2 and 50% CH4 product mixture via acetaldehyde decomposition
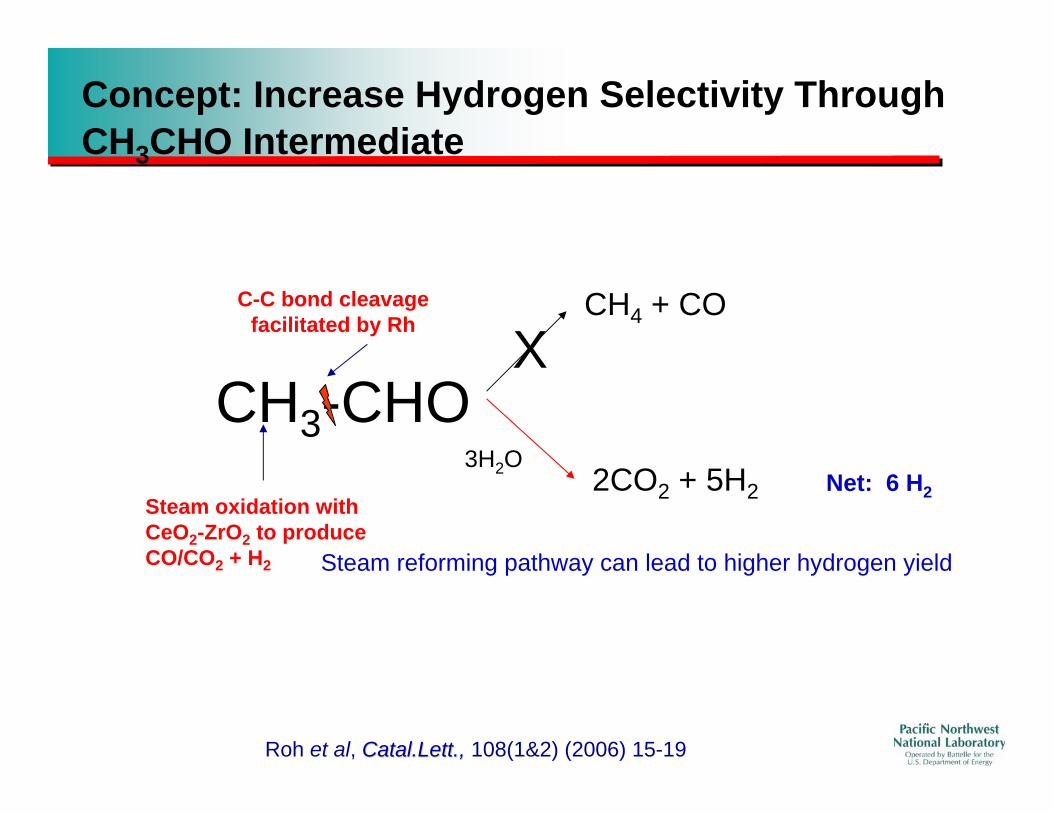
Concept: Increase Hydrogen Selectivity Through CH3CHO Intermediate
C-C bond cleavage
X
3H2O
CH4 + CO facilitated by Rh
CH3-CHO 2CO2 + 5H2 Net: 6 H2
Steam oxidation with CeO2-ZrO2 to produce CO/CO2 + H2 Steam reforming pathway can lead to higher hydrogen yield
Roh et al, Catal.LettCatal.Lett.,., 108(1&2) (2006) 15-19
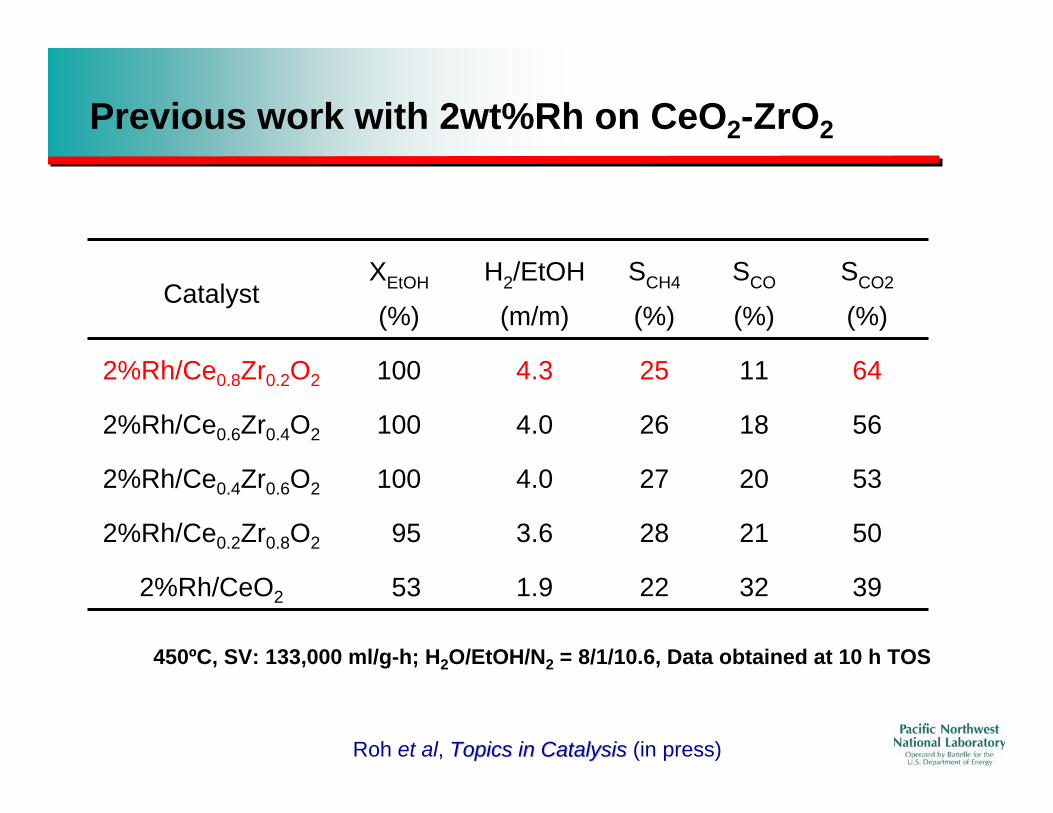
Previous work with 2wt%Rh on CeO2-ZrO2
Catalyst XEtOH
(%)
H2/EtOH
(m/m)
SCH4
(%)
SCO
(%)
SCO2
(%)
2%Rh/Ce0.8Zr0.2O2 100 4.3 25 11 64
2%Rh/Ce0.6Zr0.4O2 100 4.0 26 18 56
2%Rh/Ce0.4Zr0.6O2 100 4.0 27 20 53
2%Rh/Ce0.2Zr0.8O2 95 3.6 28 21 50
2%Rh/CeO2 53 1.9 22 32 39
450ºC, SV: 133,000 ml/g-h; H2O/EtOH/N2 = 8/1/10.6, Data obtained at 10 h TOS
Roh et al, Topics in CatalysisTopics in Catalysis (in press)
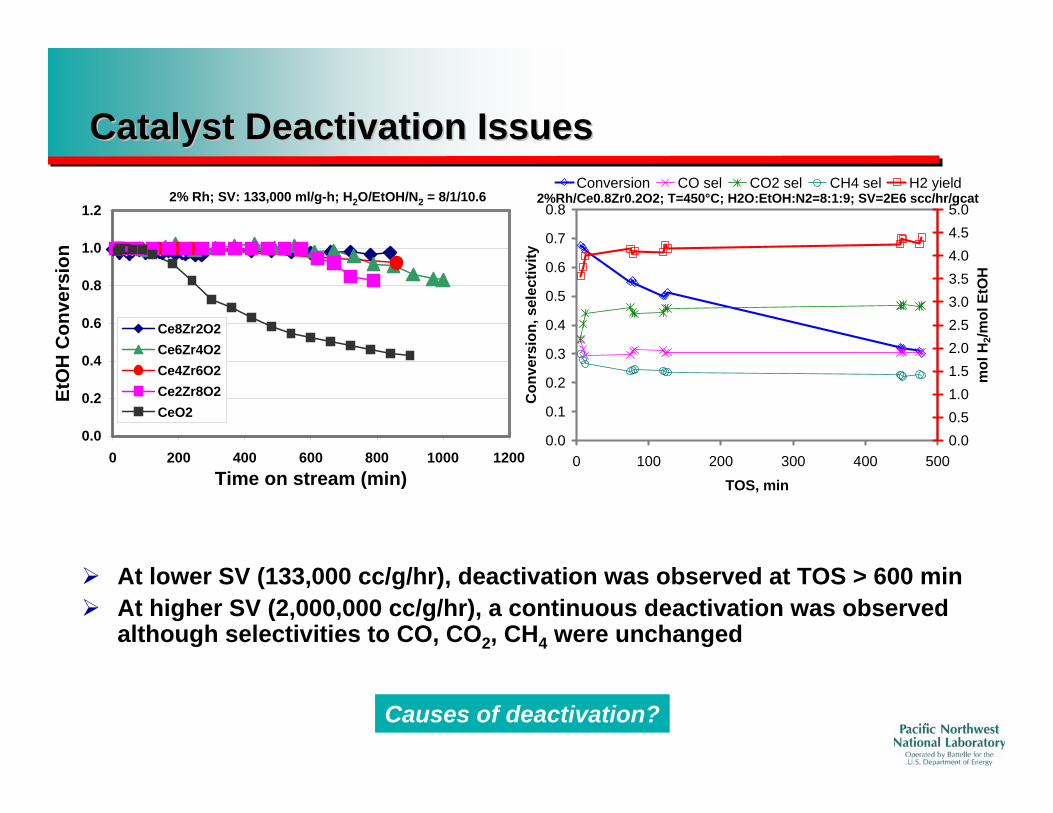
Catalyst Deactivation IssuesCatalyst Deactivation IssuesConversion CO sel CO2 sel CH4 sel H2 yield
2% Rh; SV: 133,000 ml/g-h; H2O/EtOH/N2 = 8/1/10.6 2%Rh/Ce0.8Zr0.2O2; T=450°C; H2O:EtOH:N2=8:1:9; SV=2E6 scc/hr/gcat
0.0
0.1
0.2
0.3
0.4
0.5
0.6
0.7
0.8
Con
vers
ion,
sel
ectiv
ity
0.0 0.5 1.0 1.5 2.0 2.5 3.0 3.5 4.0 4.5 5.0
mol
H2 /m
ol E
tOH
0.0
0.2
0.4
0.6
0.8
1.0
1.2
EtO
H C
onve
rsio
n
Ce8Zr2O2 Ce6Zr4O2 Ce4Zr6O2 Ce2Zr8O2 CeO2
0 200 400 600 800 1000 1200 0 100 200 300 400 500 Time on stream (min) TOS, min
¾ At lower SV (133,000 cc/g/hr), deactivation was observed at TOS > 600 min ¾ At higher SV (2,000,000 cc/g/hr), a continuous deactivation was observed
although selectivities to CO, CO2, CH4 were unchanged
Causes of deactivation?

Other Products Can Be Monitored DuringOther Products Can Be Monitored DuringReaction and DeactivationReaction and Deactivation
T=350°C; H2O:EtOH:N2:H2=8:1:9:0.0; SV=483K scc/hr/gcat Se
lect
ivity
, % m
ol
Acetaldehyde Acetone Acetic acid Ethylene
0%
20%
40% Ethane Propane Butane
0.3%
0.2%
0.1%
0.0% 0 100 200 300 400
TOS (min) ¾ Major byproducts/intermediates are the oxygenates acetaldehyde, acetone, and
acetic acid, and they increase as catalyst deactivates
¾ Hydrocarbon byproducts decrease as catalyst deactivates
Examination of Catalyst DeactivationExamination of Catalyst Deactivation
¾ Two major causes considered � Metal sintering or loss of surface area � Fouling by carbonaceous residues
¾ Investigation methods included � HRTEM – look for carbonaceous material, textural damage � FTIR – examine surface species � Dispersion and surface area – count available Rh sites � TPO and in-situ regeneration of spent catalyst – evidence
for, and amount of, carbonaceous deposits
735
735
735
760
760
760
815
815
815
865
865
865
7007508008509009501000
Wavenumber (cm-1)
DRIFTunderETOH SR
Aromatic C-H bending out of plane
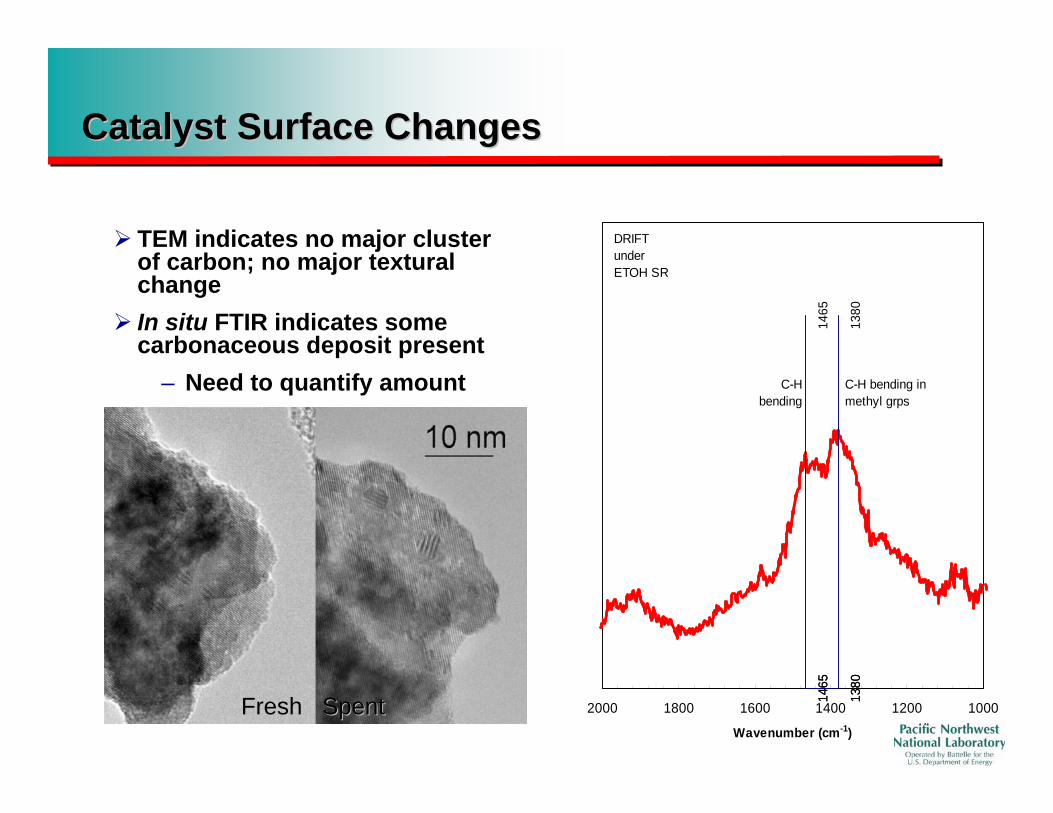
Catalyst Surface ChangesCatalyst Surface Changes
¾ TEM indicates no major clusterof carbon; no major texturalchange ¾ In situ FTIR indicates some
carbonaceous deposit present – Need to quantify amount
1380
13
8013
80
1465
14
6514
65
100012001400160018002000
Wavenumber (cm-1)
DRIFT under ETOH SR
C-H bending in methyl grps
C-H bending
Fresh SpentFresh Spent
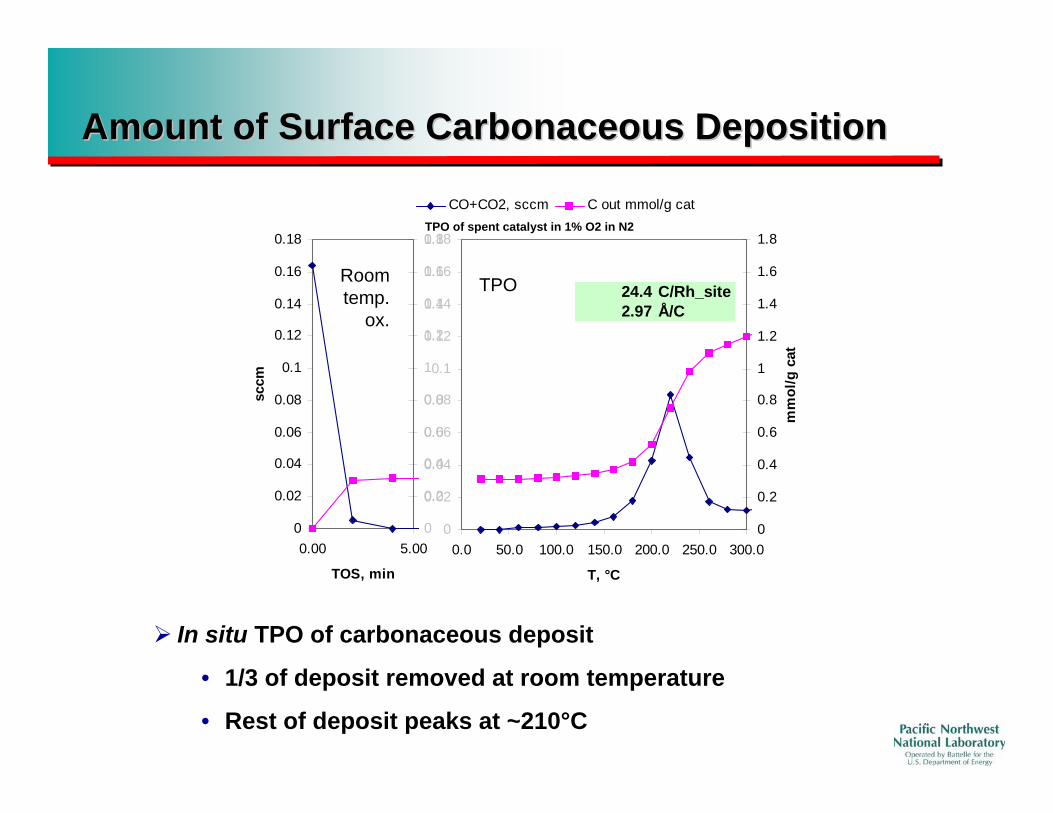
Amount of Surface Carbonaceous DepositionAmount of Surface Carbonaceous Deposition
CO+CO2, sccm C out mmol/g cat TPO of spent catalyst in 1% O2 in N2
0.18
Room temp.
ox.
1.80.18
24.4 C/Rh_site 2.97 Å/C
TPO 0.16 0.161.6
0.14 1.40.14
0.12 1.20.12 1.2
0.1 10.1 1
0.08 0.0.808 0.8
0.06 0.0.606 0.6
0.04 0.0.404 0.4
0.02 0.0.202 0.2
0 0 0 0 0.00 5.00 0.0 50.0 100.0 150.0 200.0 250.0 300.0
TOS, min T, °C
mm
ol/g
cat
sccm
¾ In situ TPO of carbonaceous deposit
• 1/3 of deposit removed at room temperature
• Rest of deposit peaks at ~210°C
1.4
1.6
1.8
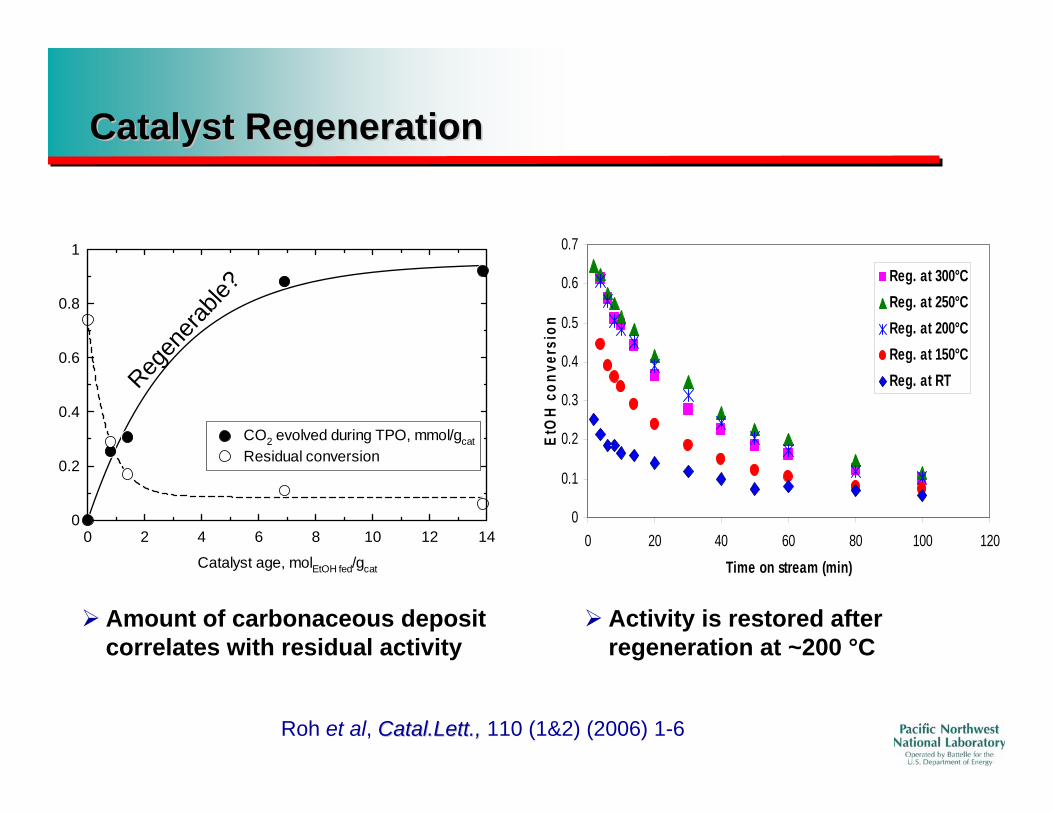
Catalyst RegenerationCatalyst Regeneration
0.71
0.8
0.6
0.4
0.2
00 2 4 6 8 10 12 14 0 20 40 60 80 100 120
Catalyst age, molEtOH fed/gcat Time on stream (min)
CO2 evolved during TPO, mmol/gcat Residual conversion
Regen
erable
?
0
0.1
0.2
0.3
0.4
0.5
0.6
E tO
H c
onv e
r s i o
n
Reg. at 300°C Reg. at 250°C Reg. at 200°C Reg. at 150°C Reg. at RT
¾ Amount of carbonaceous deposit ¾ Activity is restored after correlates with residual activity regeneration at ~200 °C
Roh et al, Catal.LettCatal.Lett.,., 110 (1&2) (2006) 1-6
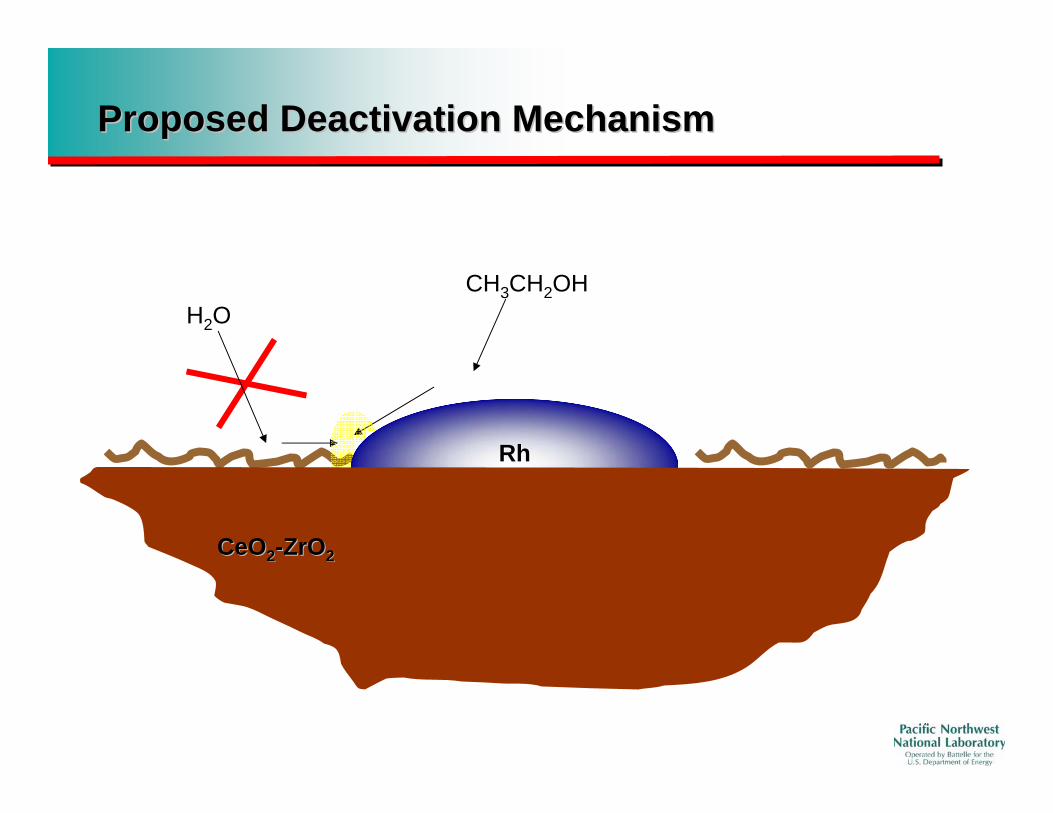
Proposed Deactivation MechanismProposed Deactivation Mechanism
CH3CH2OHH2O
RhRh
CeOCeO22--ZrOZrO22
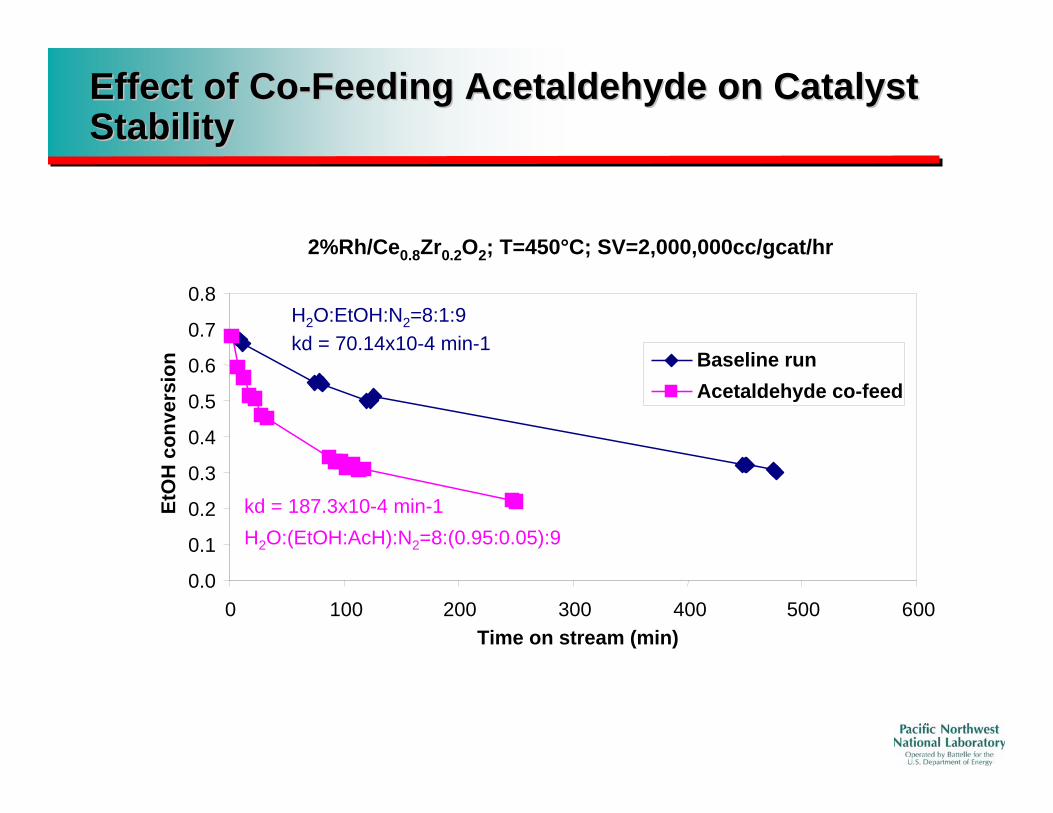
Effect of CoEffect of Co--Feeding Acetaldehyde on CatalystFeeding Acetaldehyde on CatalystStabilityStability
2%Rh/Ce0.8Zr0.2O2; T=450°C; SV=2,000,000cc/gcat/hr
0.8
0.7
0.6
0.5
0.4
0.3
0.2
0.1
0.0
0 100 200 300 400 500
EtO
H c
onve
rsio
n Baseline run Acetaldehyde co-feed
H2O:(EtOH:AcH):N2=8:(0.95:0.05):9
kd = 70.14x10⁻⁴ min-1
kd = 187.3x10⁻⁴ min-1
H2O:EtOH:N2=8:1:9
Time on stream (min) 600
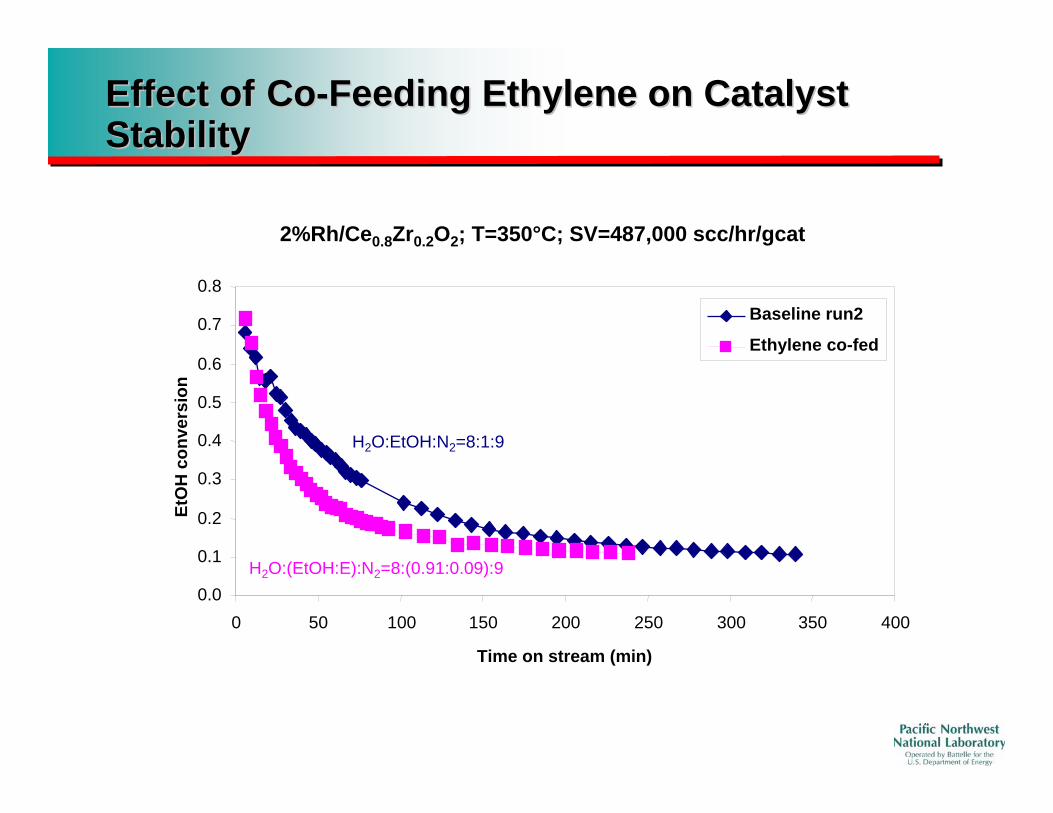
Effect ofEffect of CoCo--Feeding Ethylene on CatalystFeeding Ethylene on Catalyst StabilityStability
2%Rh/Ce0.8Zr0.2O2; T=350°C; SV=487,000 scc/hr/gcat
0.8
0.7
0.6
0.5
0.4
0.3
0.2
0.1
0.0
EtO
H c
onve
rsio
n
Baseline run2
Ethylene co-fed
H2O:EtOH:N2=8:1:9
H2O:(EtOH:E):N2=8:(0.91:0.09):9
0 50 100 150 200 250 300 350 400
Time on stream (min)
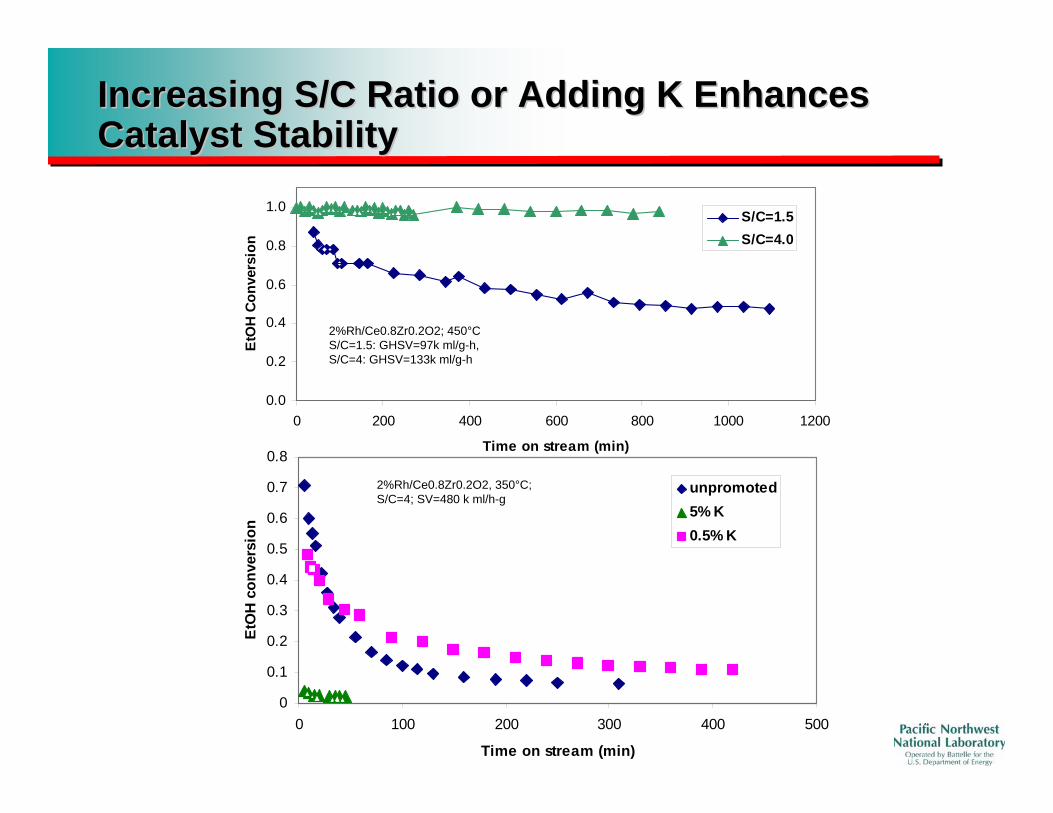
Increasing S/C Ratio or Adding K EnhancesIncreasing S/C Ratio or Adding K EnhancesCatalyst StabilityCatalyst Stability
2%Rh/Ce0.8Zr0.2O2; 450°C S/C=1.5: GHSV=97k ml/g-h, S/C=4: GHSV=133k ml/g-h
EtO
H c
onve
rsio
n
0.0
0.2
0.4
0.6
0.8
1.0
EtO
H Co
nver
sion
S/C=1.5 S/C=4.0
0 200 400 600 800 1000 1200
Time on stream (min)0.8
0.7
0.6
0.5
0.4
0.3
0.2
0.1
0
0 100 200 300 400 500
Time on stream (min)
unpromoted 5% K 0.5% K
2%Rh/Ce0.8Zr0.2O2, 350°C; S/C=4; SV=480 k ml/h-g
ConclusionsConclusions –– Vapor Phase Ethanol ReformingVapor Phase Ethanol Reforming
¾ Rh/Ce0.8Zr0.2O2 is active for ethanol SR at T<450oC ¾ Rapid catalyst deactivation is observed
• “soft” carbonaceous deposits • Activity can be readily recovered by treatment with O2 at 200oC
¾ Ethylene and acetaldehyde both accelerate deactivation • Acetaldehyde may be greater problem at low reforming temperatures
¾ Excess steam reduces deactivation • May displace intermediates on surface and facilitate reforming
¾ K-doping improves steady state activity • Likely due to facilitating H2O adsorption on surface
¾ Challenge: how to avoid deactivation when both postulated intermediates accelerate deactivation?
Path ForwardPath Forward
¾ Identify compositions and reaction conditions for stable vapor phase reforming • Increase reaction temperature to minimize deposition of “soft
carbonaceous deposits” • Identify the potential deactivation issue in the preheating zone
¾ Innovate reaction engineering, e.g., integrate with membrane separation
¾ Obtain guidance from process economics • e.g., trade off between low temperature and high temperature
reforming