Embed Size (px)
Citation preview
Winning the J2EE Performance Game
Winning the J2EE Performance Game
Presented to:
JAVA User Group-Minnesota
Michelle Pregler BallEmerging Markets Account Executive
Shahrukh NiaziSr.System Consultant
Java Solutions
Winning the J2EE Performance Game
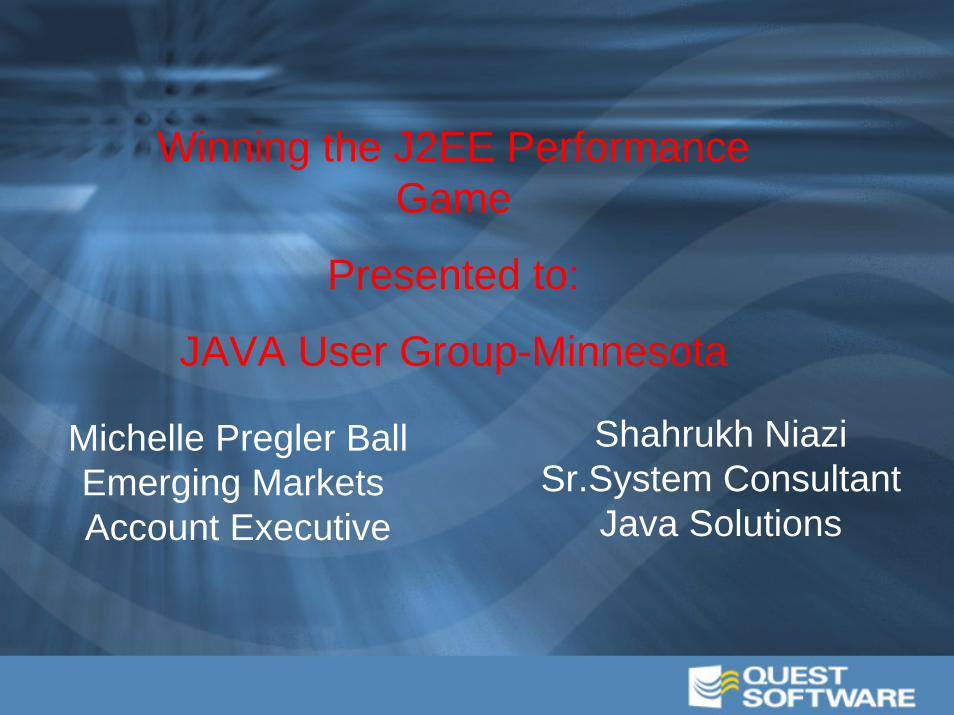
AgendaQuest BackgroundCore Principles of PerformanceUnderstanding Production Environment issuesQuest APM ApproachQuest APM Solutions overviewDemo
Winning the J2EE Performance Game
Company - Quest SoftwareCompany Size: $945 Million -- Market Capitalization
Past 3 year Revenues:2003 $304M – 19% growth from 20022002 $258M - 4.8% growth from 20012001 $245M - 48% growth from 2000
Number of APM Customers: 18,000+
Number of Support Team Members: 220
Year Founded: 1985
Corporate Headquarters: Irvine, CA
Number of Employees: Over 2,400
Winning the J2EE Performance Game
Core Principles
Understand your goals of Performance – Improve response time– Improve throughput– Ensure scalability
Understand your application– How does user activity affect each tier? – Are there any hotspots? If so, why?
• i.e Is the application database-intensive? Understand there is no Silver Bullet– Be objective– Removing one bottleneck will often uncover another
Winning the J2EE Performance Game
Core Principles
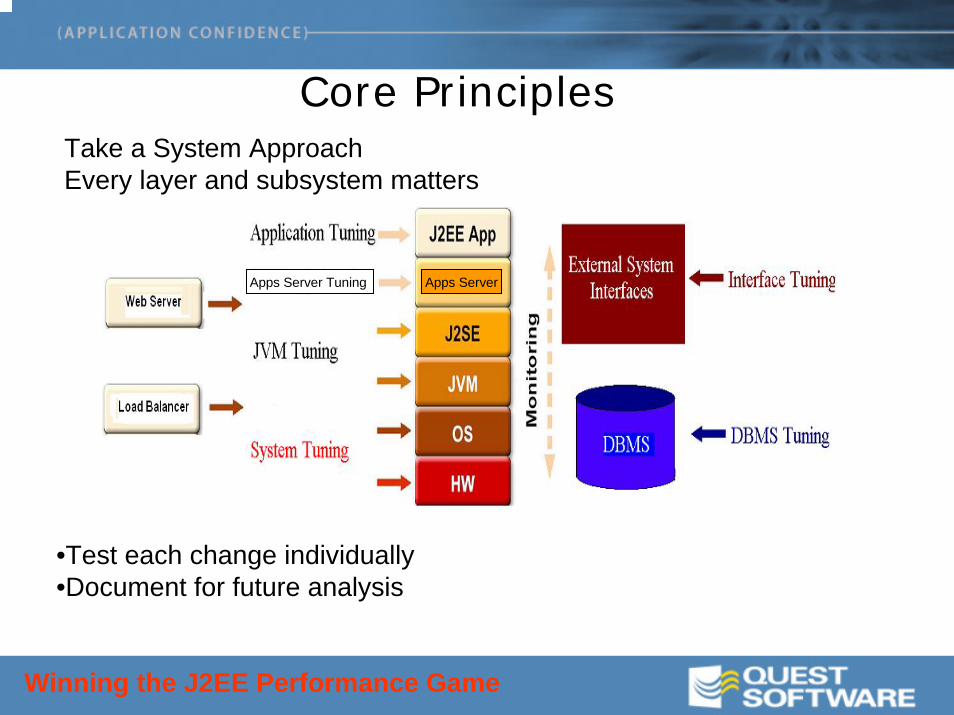
Apps ServerApps Server Tuning
Take a System ApproachEvery layer and subsystem matters
•Test each change individually•Document for future analysis
Winning the J2EE Performance Game
Core PrinciplesUse more powerful machines– “Vertical” scaling– Best for CPU-intensive apps
Use clustering– “Horizontal” scaling– Best in Web and application tiers– Increases reliability
Use network appliances– Specialized hardware devices can increase
performance– Data storage devices, content caching engines &
routers, load balancing hardware, SSL terminators
Winning the J2EE Performance Game
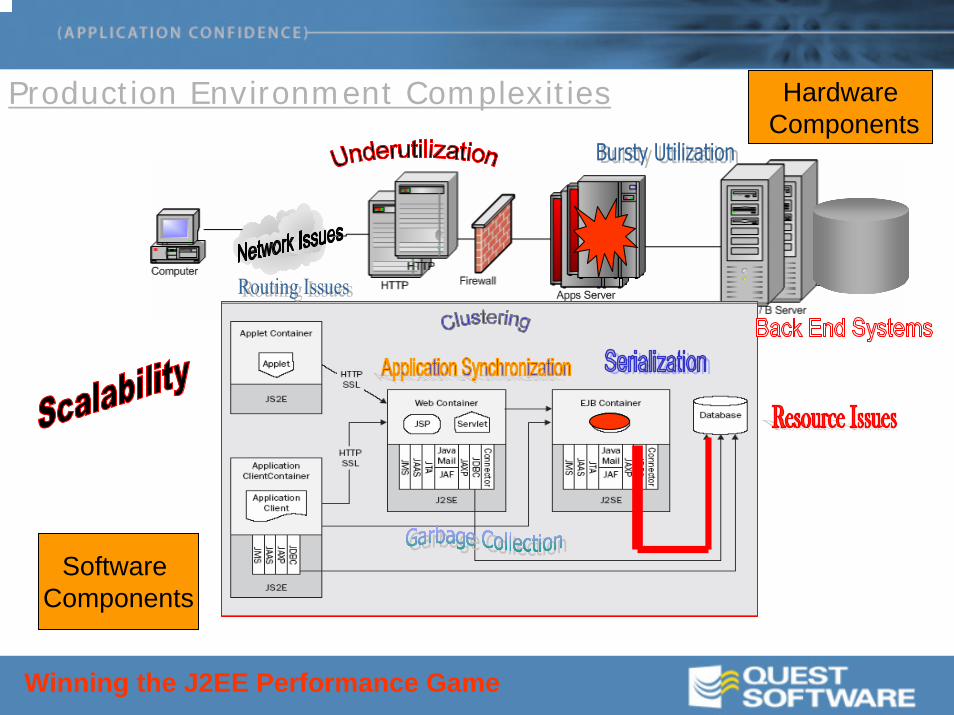
Production Environment Complexities
Software Components
HardwareComponents
Winning the J2EE Performance Game
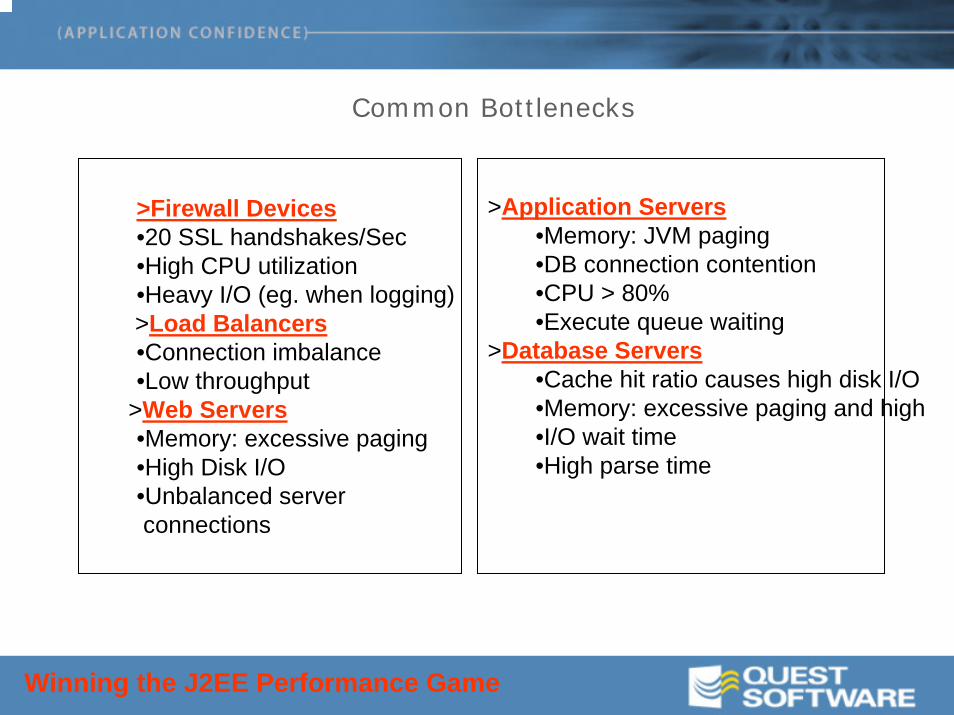
Common Bottlenecks
>Firewall Devices•20 SSL handshakes/Sec•High CPU utilization•Heavy I/O (eg. when logging)>Load Balancers•Connection imbalance•Low throughput
>Web Servers•Memory: excessive paging•High Disk I/O•Unbalanced server connections
>Application Servers•Memory: JVM paging•DB connection contention•CPU > 80%•Execute queue waiting
>Database Servers•Cache hit ratio causes high disk I/O•Memory: excessive paging and high•I/O wait time•High parse time
Winning the J2EE Performance Game
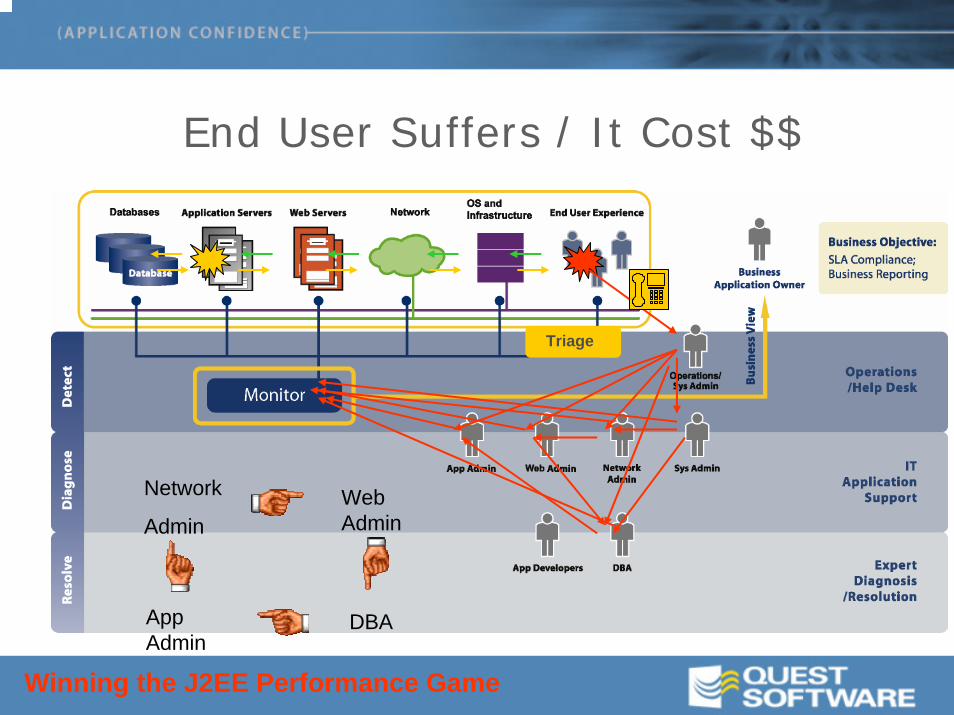
End User Suffers / It Cost $$
Triage
Web Admin
DBAApp Admin
Network
Admin
Winning the J2EE Performance Game
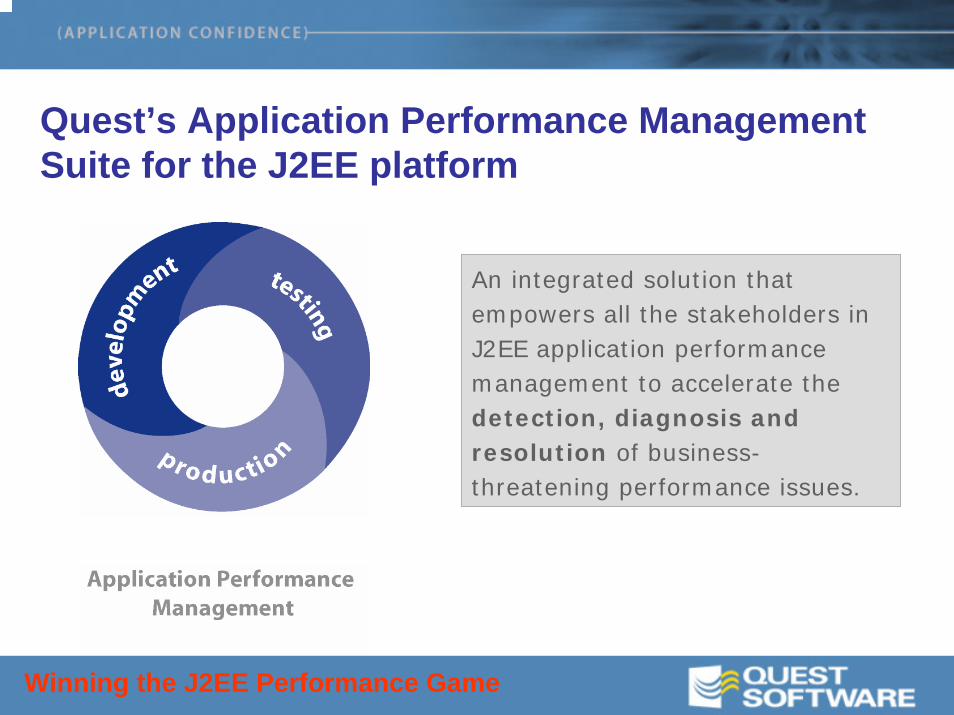
APM Suite for J2EE IntroQuest’s Application Performance Management Suite for the J2EE platform
An integrated solution that empowers all the stakeholders in J2EE application performance management to accelerate the detection, diagnosis and resolution of business-threatening performance issues.
Winning the J2EE Performance Game
Key features of Quest’s APM Solution
Service Level managementImprove staff efficiency by isolating performance problems basedon service models and end user response time
Application Server DiagnosticsWith very low overhead, quickly identify and resolve performanceproblems caused by resource bottlenecks and server configurations
Deep Transactional DiagnosticsPerform deep transaction-based diagnostics using Quest's Tag and Follow™ technology to identify renegade method or SQL causing performance problems
Application code profilingEnable developers to quickly resolve the offending line of Java code necessary to improve end user response time
Winning the J2EE Performance Game
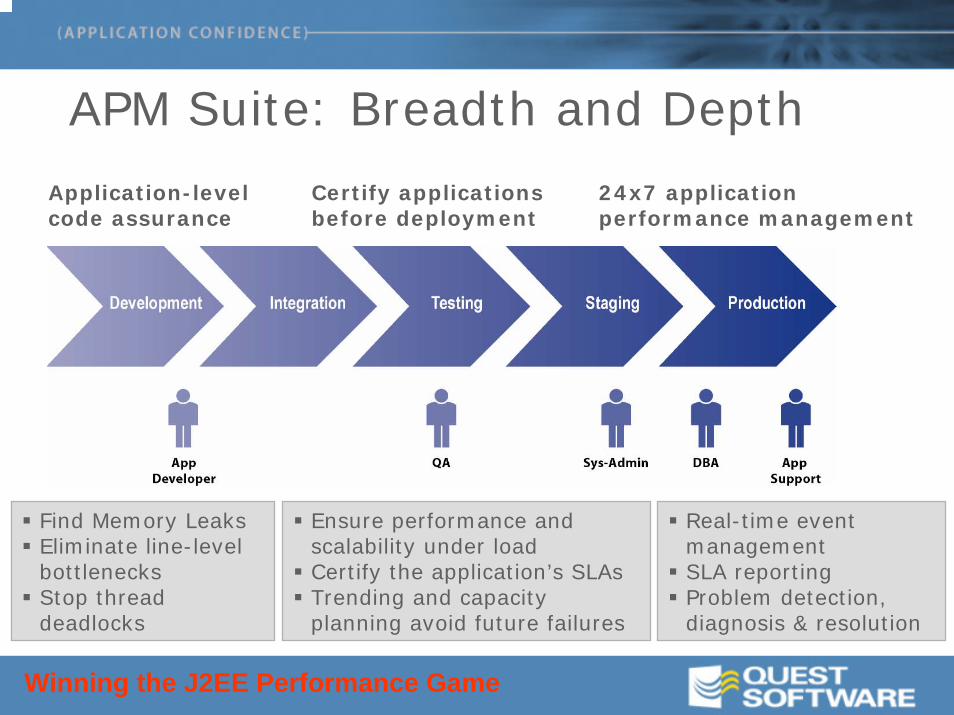
APM Suite: Breadth and Depth
Certify applications before deployment
24x7 application performance management
Application-level code assurance
Ensure performance and scalability under loadCertify the application’s SLAsTrending and capacity planning avoid future failures
Find Memory LeaksEliminate line-level bottlenecksStop thread deadlocks
Real-time event managementSLA reportingProblem detection, diagnosis & resolution
Winning the J2EE Performance Game
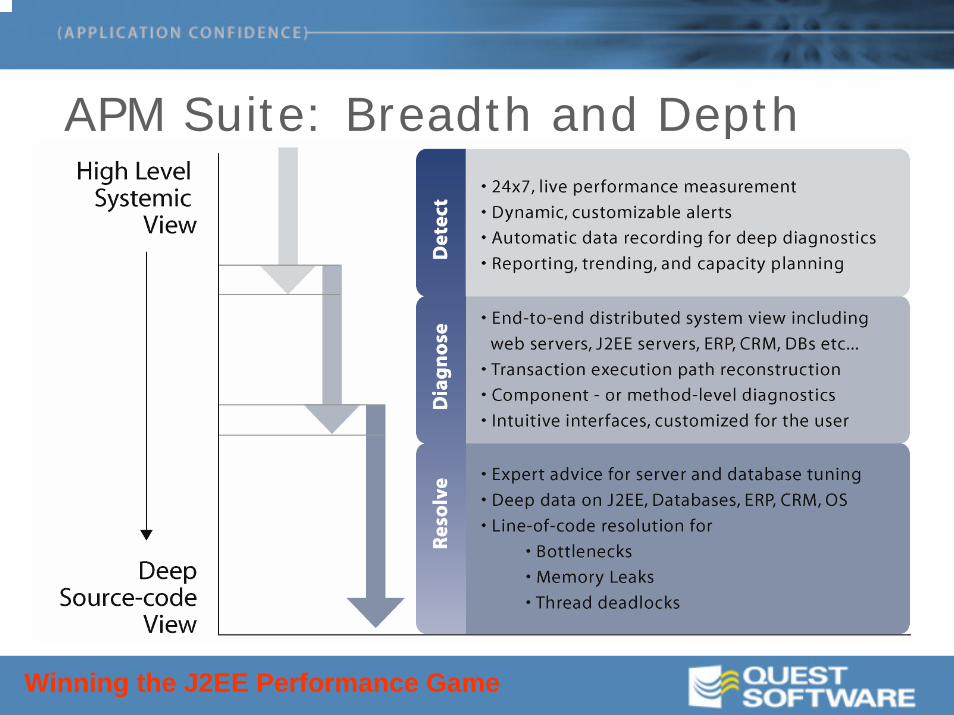
APM Suite: Breadth and Depth
Winning the J2EE Performance Game
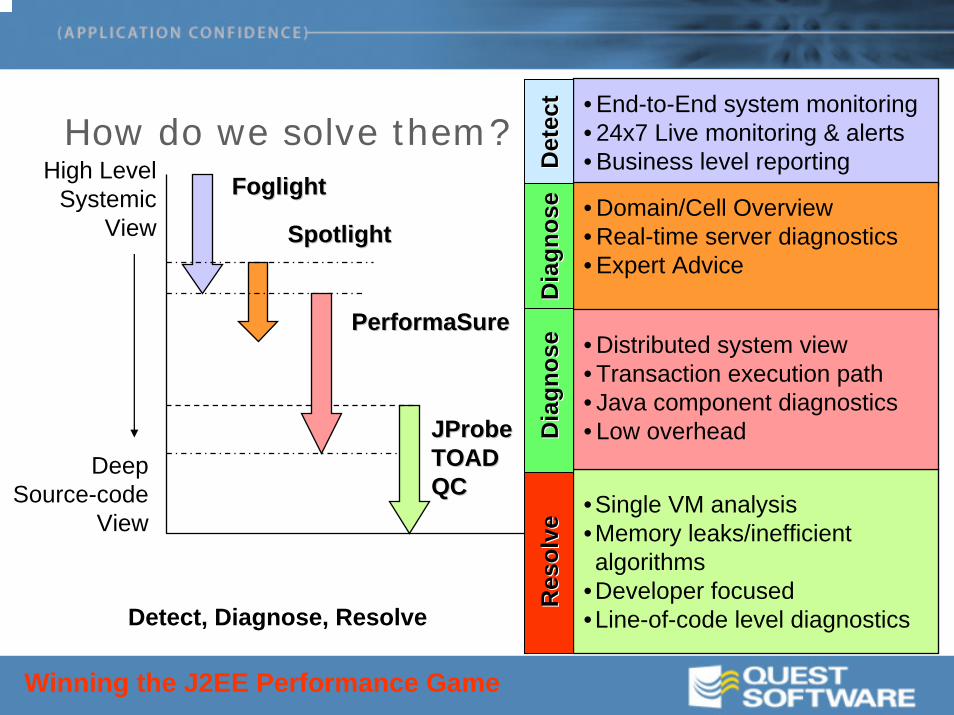
How do we solve them?
Deep Source-code
View
High LevelSystemic
View
•Single VM analysis•Memory leaks/inefficient algorithms
•Developer focused•Line-of-code level diagnostics
• End-to-End system monitoring• 24x7 Live monitoring & alerts• Business level reporting
FoglightFoglight
PerformaSurePerformaSure
JProbeJProbeTOADTOADQCQC
SpotlightSpotlight• Domain/Cell Overview• Real-time server diagnostics• Expert Advice
Detect, Diagnose, Resolve
• Distributed system view• Transaction execution path• Java component diagnostics• Low overhead
Det
ect
Det
ect
Res
olve
Res
olve
Dia
gnos
eD
iagn
ose
Dia
gnos
eD
iagn
ose
Winning the J2EE Performance Game
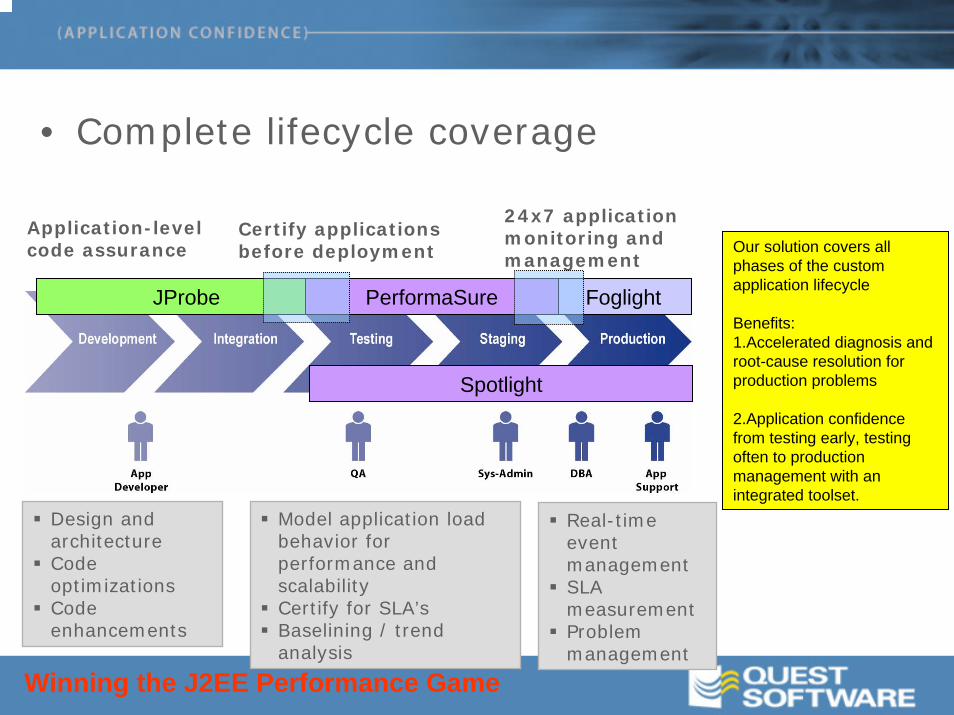
• Complete lifecycle coverage
Model application load behavior for performance and scalabilityCertify for SLA’sBaselining / trend analysis
Design and architectureCode optimizationsCode enhancements
Real-time event managementSLA measurementProblem management
Our solution covers all phases of the custom application lifecycle
Benefits:1.Accelerated diagnosis and root-cause resolution for production problems
2.Application confidence from testing early, testing often to production management with an integrated toolset.
Application-level code assurance
Certify applications before deployment
24x7 application monitoring and management
JProbe FoglightPerformaSure
Spotlight
Winning the J2EE Performance Game
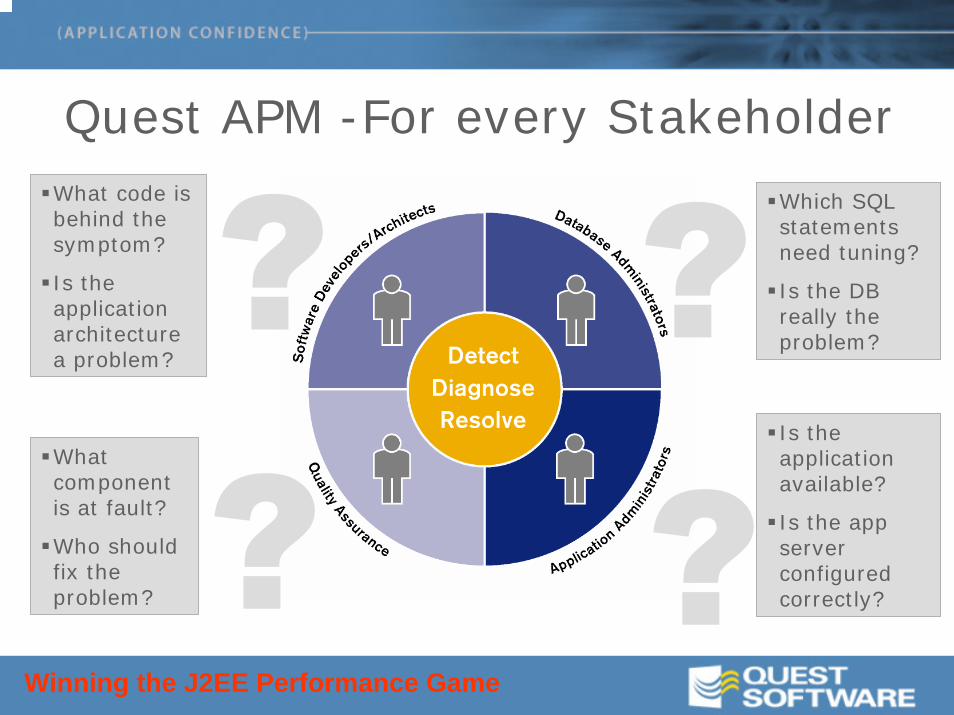
Quest APM -For every StakeholderWhat code is behind the symptom?
Is the application architecture a problem?
What component is at fault?
Who should fix the problem?
Which SQL statements need tuning?
Is the DB really the problem?
Is the application available?
Is the app server configured correctly?
Winning the J2EE Performance Game
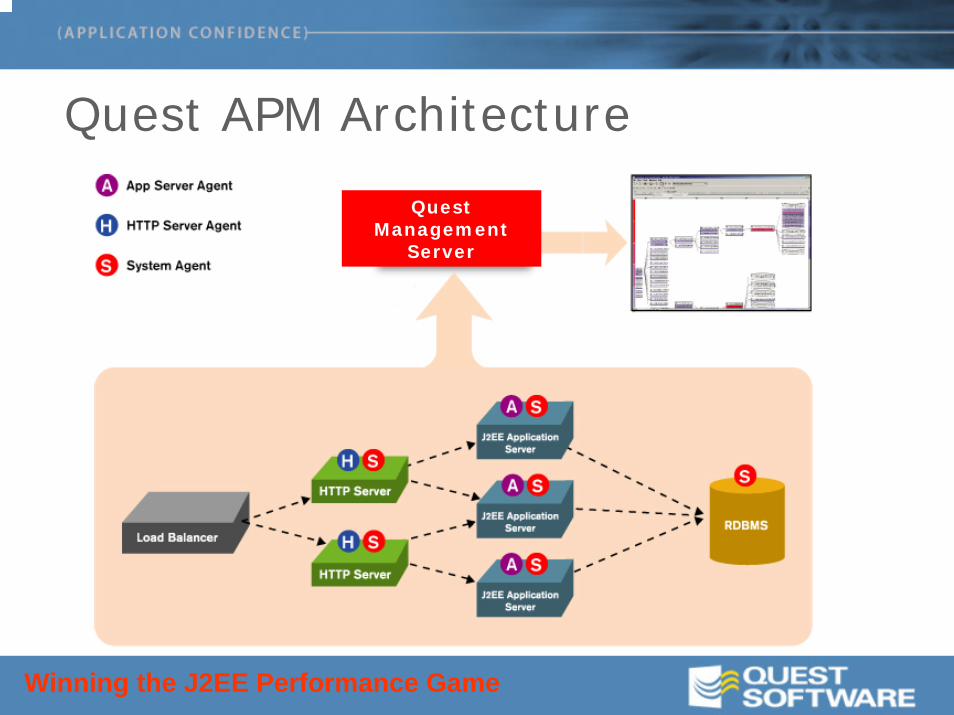
Quest APM Architecture
Quest Management
Server
Winning the J2EE Performance Game
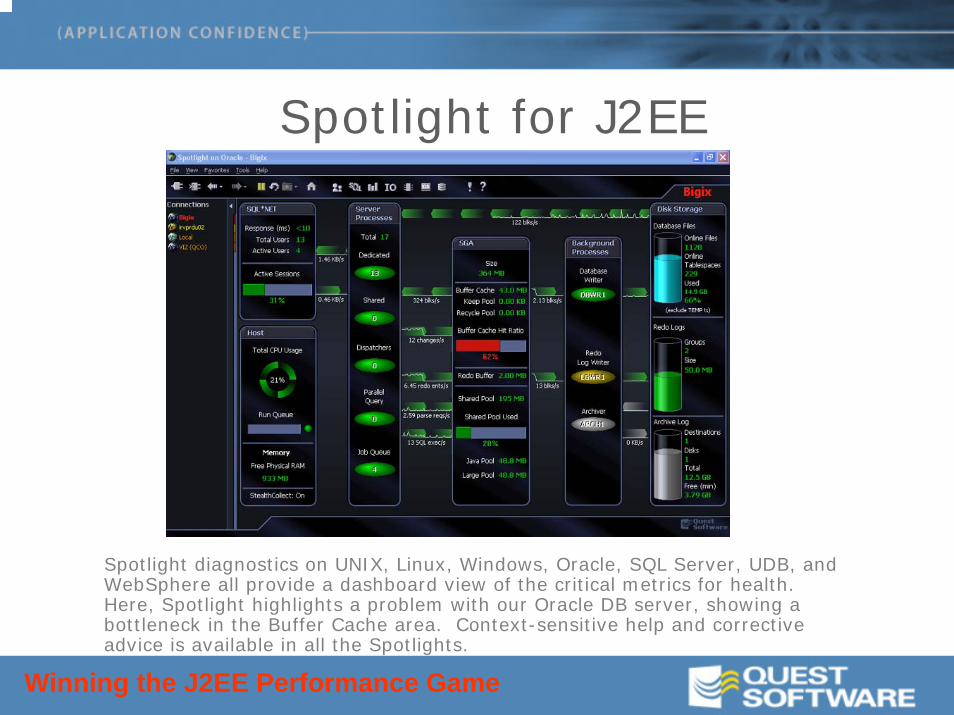
Spotlight for J2EE
Spotlight diagnostics on UNIX, Linux, Windows, Oracle, SQL Server, UDB, and WebSphere all provide a dashboard view of the critical metrics for health. Here, Spotlight highlights a problem with our Oracle DB server, showing a bottleneck in the Buffer Cache area. Context-sensitive help and corrective advice is available in all the Spotlights.
Winning the J2EE Performance Game
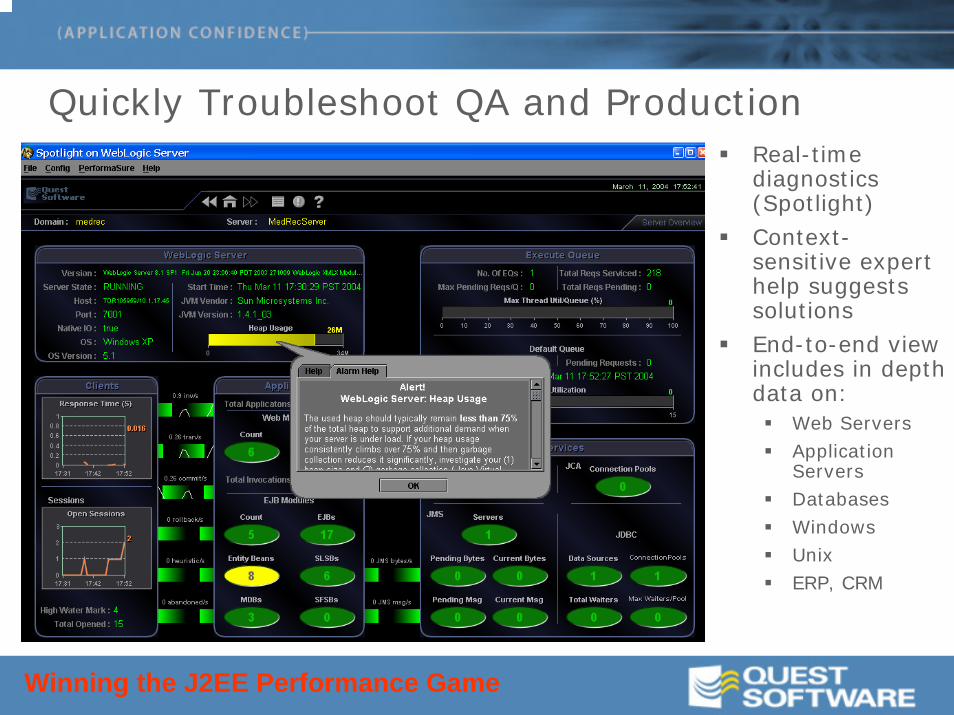
Quickly Troubleshoot QA and ProductionReal-time diagnostics (Spotlight)Context-sensitive expert help suggests solutionsEnd-to-end view includes in depth data on:
Web ServersApplication ServersDatabasesWindowsUnixERP, CRM
Winning the J2EE Performance Game
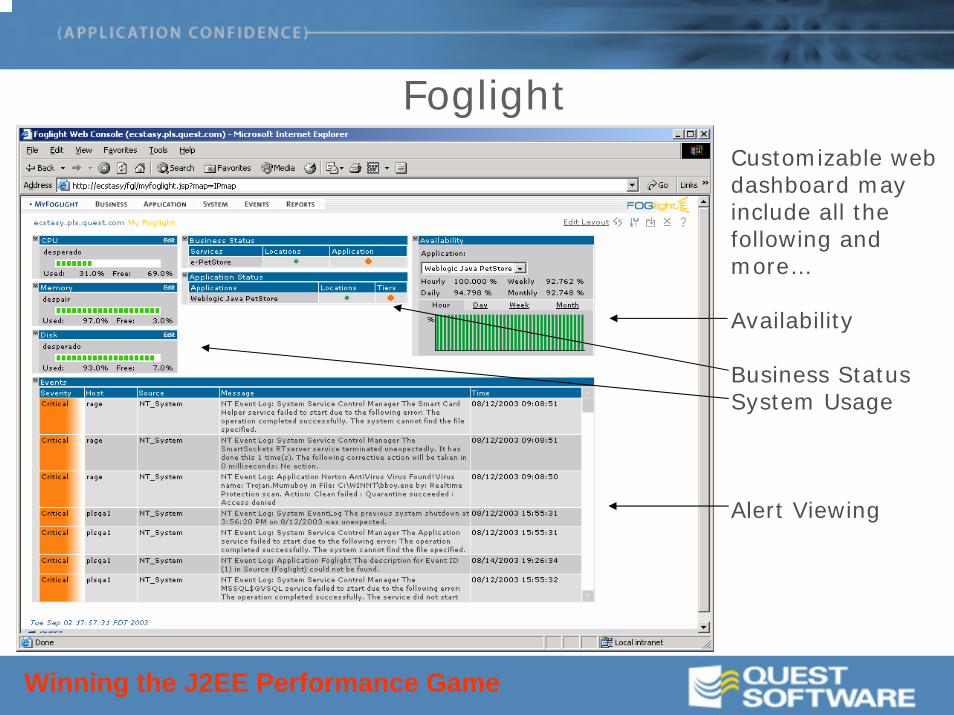
FoglightCustomizable web dashboard may include all the following and more…
Availability
Business StatusSystem Usage
Alert Viewing
Winning the J2EE Performance Game
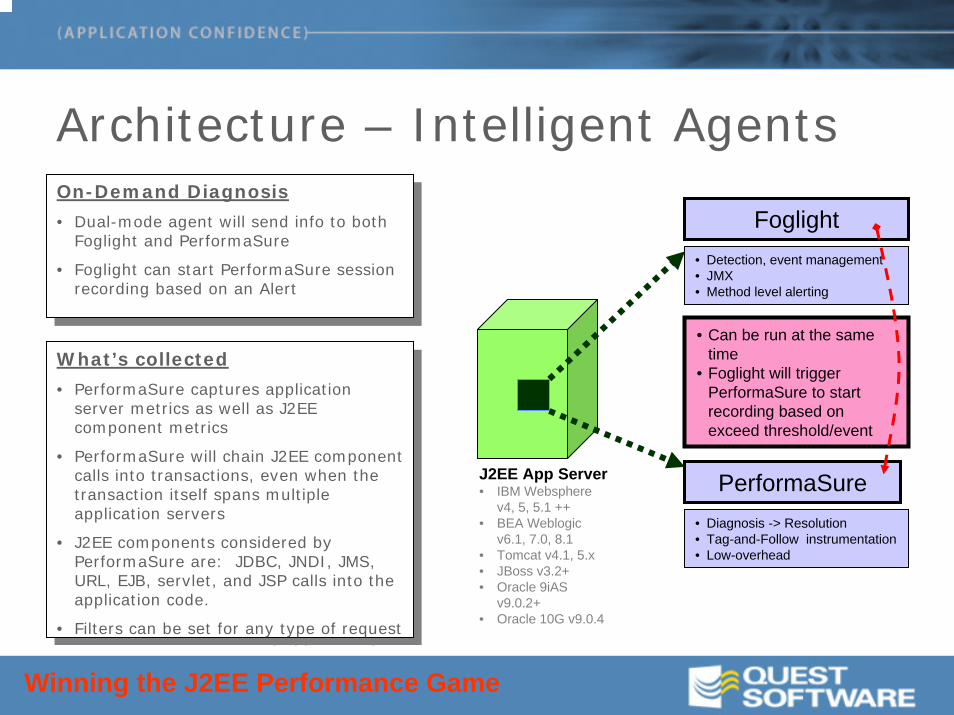
On-Demand Diagnosis
• Dual-mode agent will send info to both Foglight and PerformaSure
• Foglight can start PerformaSure session recording based on an Alert
On-Demand Diagnosis
• Dual-mode agent will send info to both Foglight and PerformaSure
• Foglight can start PerformaSure session recording based on an Alert
PerformaSure
Foglight• Detection, event management• JMX• Method level alerting
• Diagnosis -> Resolution• Tag-and-Follow instrumentation• Low-overhead
J2EE App Server• IBM Websphere
v4, 5, 5.1 ++• BEA Weblogic
v6.1, 7.0, 8.1• Tomcat v4.1, 5.x• JBoss v3.2+• Oracle 9iAS
v9.0.2+ • Oracle 10G v9.0.4
• Can be run at the same time
• Foglight will trigger PerformaSure to start recording based on exceed threshold/event
What’s collected
• PerformaSure captures application server metrics as well as J2EE component metrics
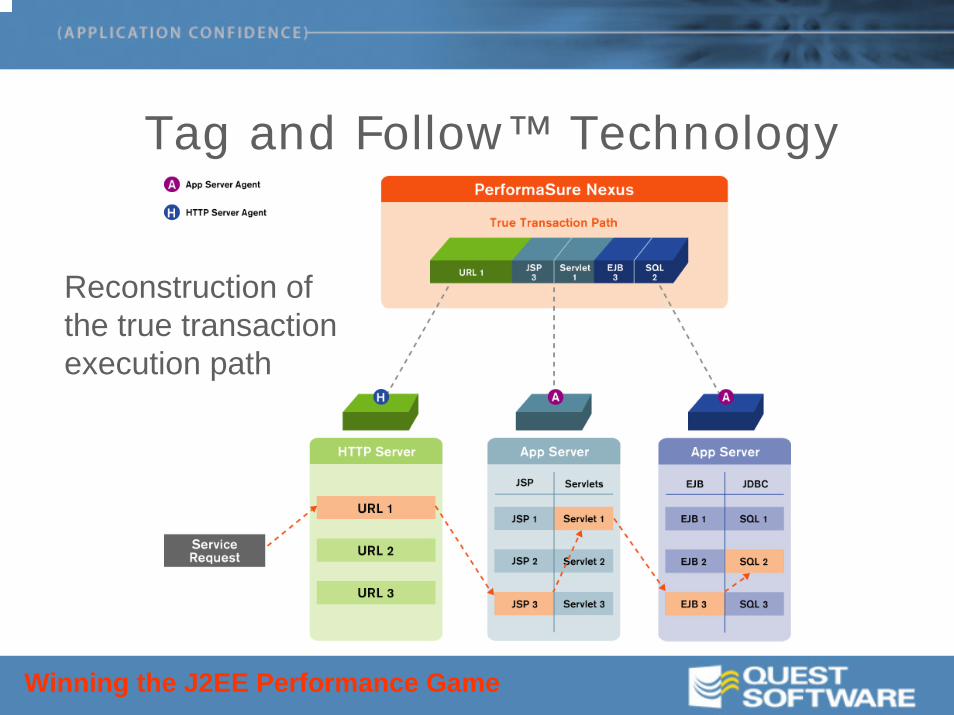
• PerformaSure will chain J2EE component calls into transactions, even when the transaction itself spans multiple application servers
• J2EE components considered by PerformaSure are: JDBC, JNDI, JMS, URL, EJB, servlet, and JSP calls into the application code.
• Filters can be set for any type of request
What’s collected
• PerformaSure captures application server metrics as well as J2EE component metrics
• PerformaSure will chain J2EE component calls into transactions, even when the transaction itself spans multiple application servers
• J2EE components considered by PerformaSure are: JDBC, JNDI, JMS, URL, EJB, servlet, and JSP calls into the application code.
• Filters can be set for any type of request
Architecture – Intelligent Agents
Winning the J2EE Performance Game
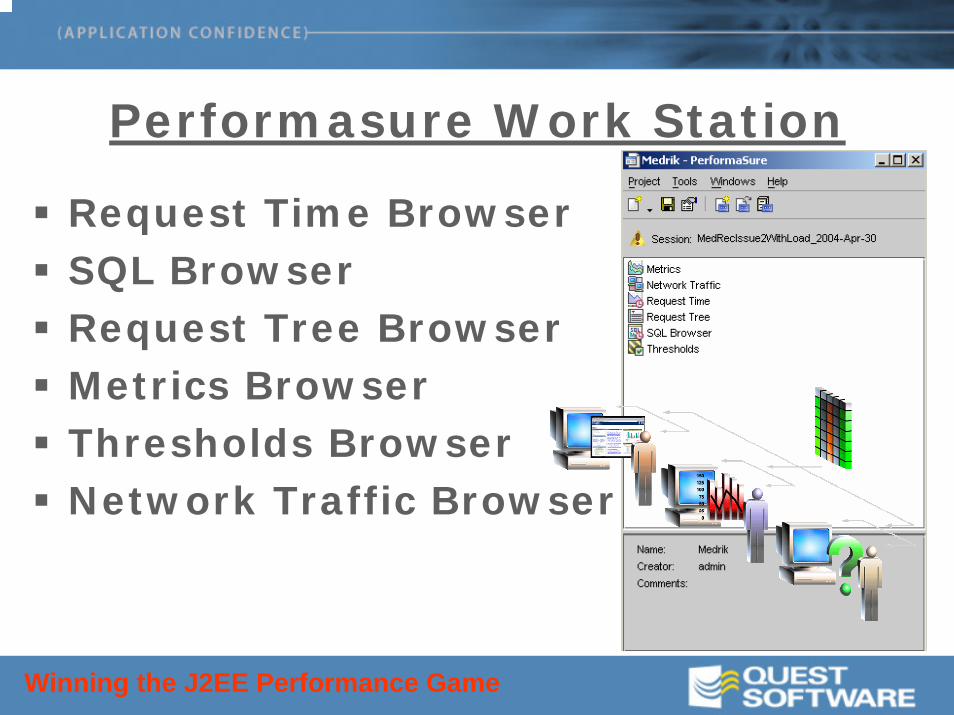
Performasure Work Station
Request Time BrowserSQL BrowserRequest Tree BrowserMetrics BrowserThresholds BrowserNetwork Traffic Browser
Winning the J2EE Performance Game
Tag and Follow™ Technology
Reconstruction of the true transaction execution path
Winning the J2EE Performance Game
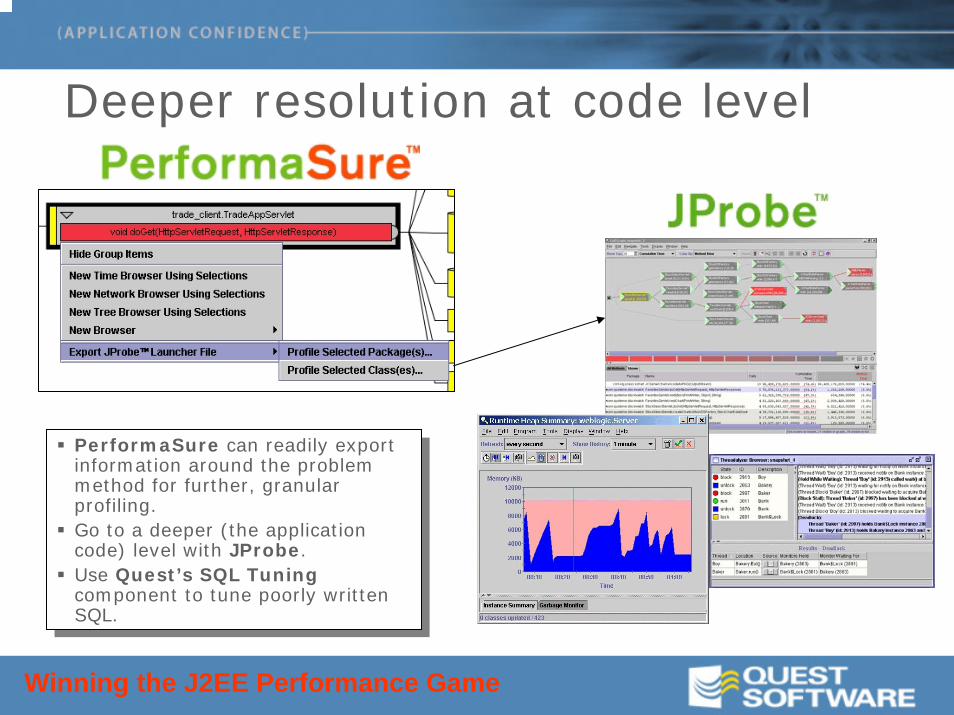
Deeper resolution at code level
PerformaSure can readily export information around the problem method for further, granular profiling.Go to a deeper (the application code) level with JProbe.Use Quest’s SQL Tuningcomponent to tune poorly written SQL.
PerformaSure can readily export information around the problem method for further, granular profiling.Go to a deeper (the application code) level with JProbe.Use Quest’s SQL Tuningcomponent to tune poorly written SQL.
Winning the J2EE Performance Game
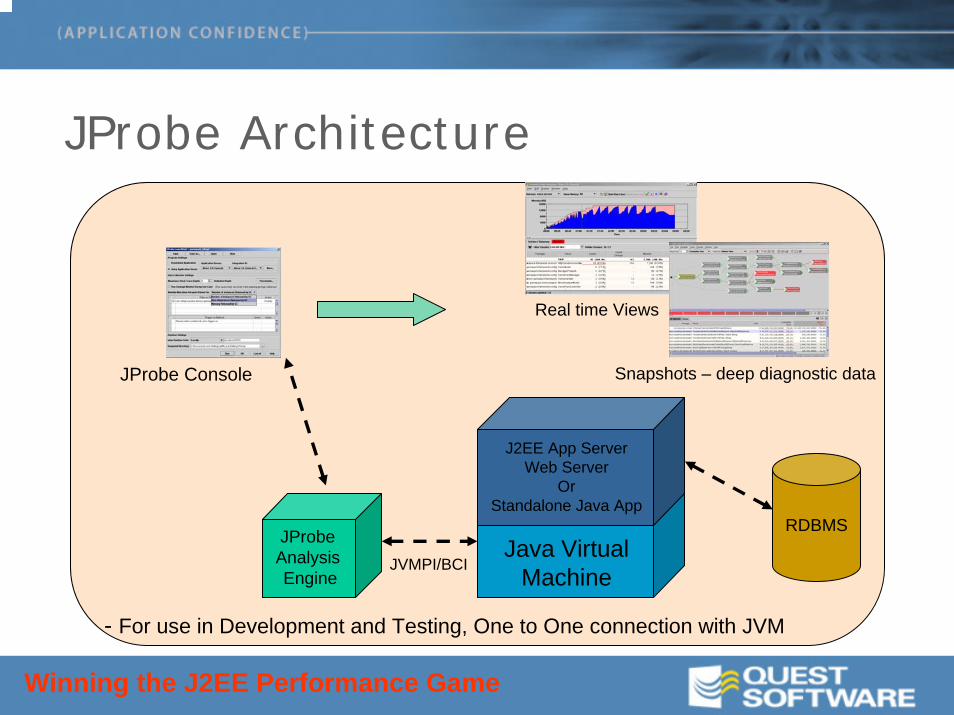
JProbe Architecture
RDBMSJProbe Analysis Engine
Java VirtualMachine
J2EE App ServerWeb Server
OrStandalone Java App
JProbe Console
Real time Views
Snapshots – deep diagnostic data
- For use in Development and Testing, One to One connection with JVM
JVMPI/BCI
Winning the J2EE Performance Game
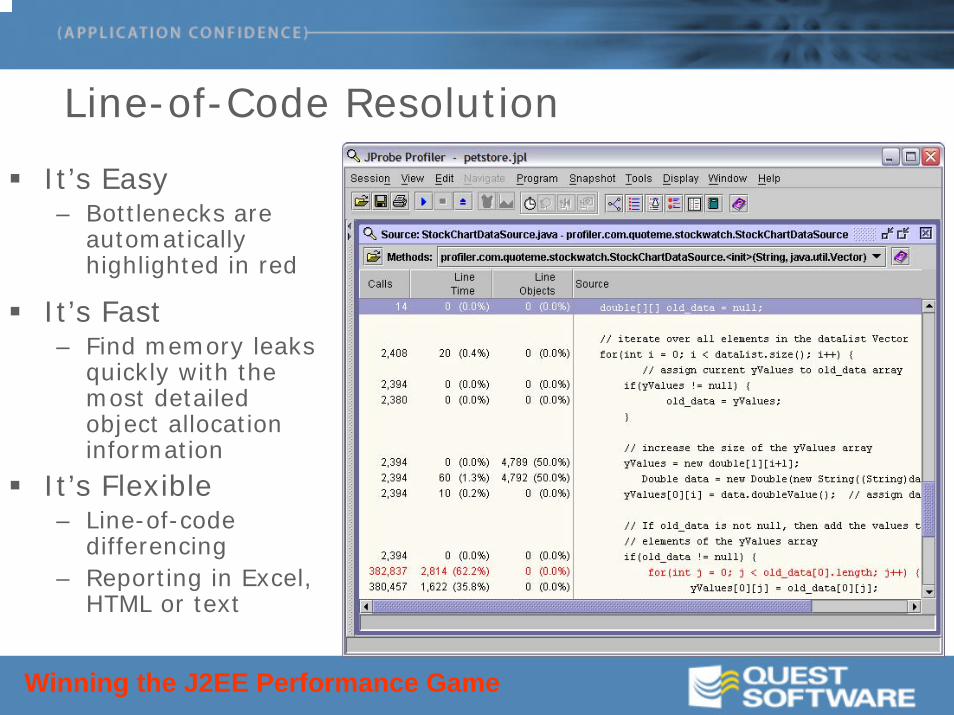
Line-of-Code Resolution
It’s Easy– Bottlenecks are
automatically highlighted in red
It’s Fast– Find memory leaks
quickly with the most detailed object allocation information
It’s Flexible– Line-of-code
differencing– Reporting in Excel,
HTML or text
Winning the J2EE Performance Game
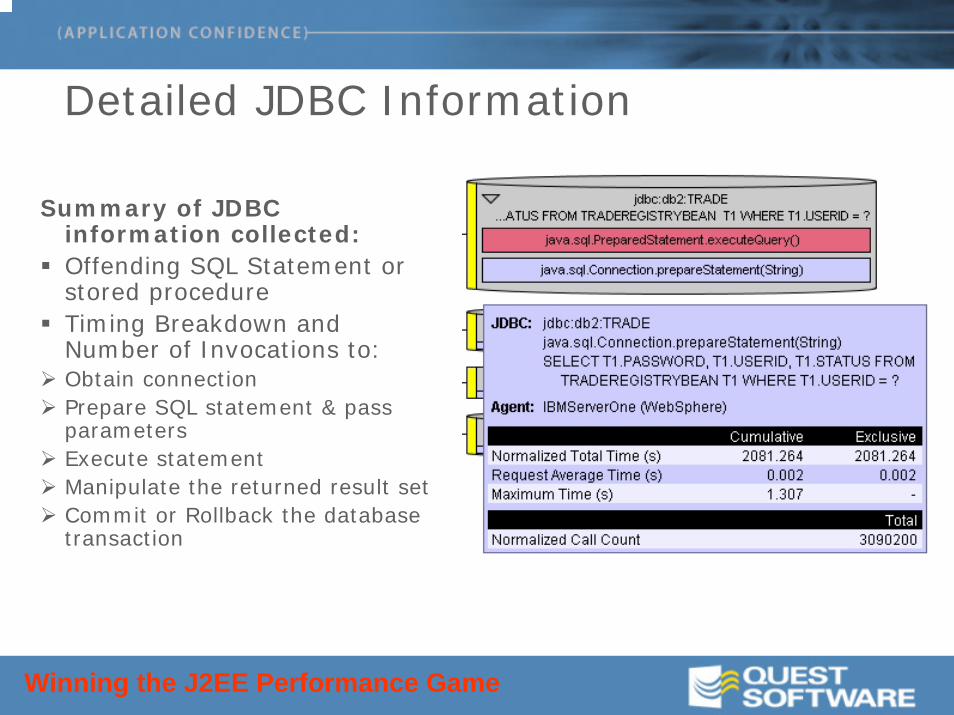
Detailed JDBC Information
Summary of JDBC information collected:Offending SQL Statement or stored procedureTiming Breakdown and Number of Invocations to:Obtain connectionPrepare SQL statement & pass parametersExecute statementManipulate the returned result setCommit or Rollback the database transaction
Winning the J2EE Performance Game
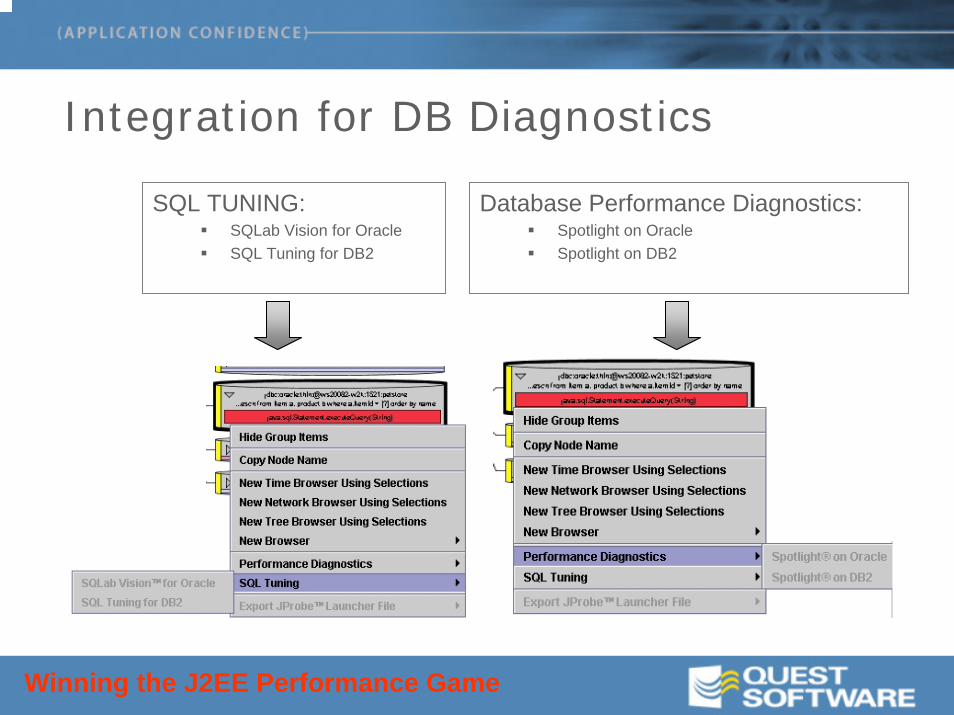
Integration for DB Diagnostics
Database Performance Diagnostics:Spotlight on OracleSpotlight on DB2
SQL TUNING:SQLab Vision for OracleSQL Tuning for DB2
Enough information to investigate through QCO!
Winning the J2EE Performance Game
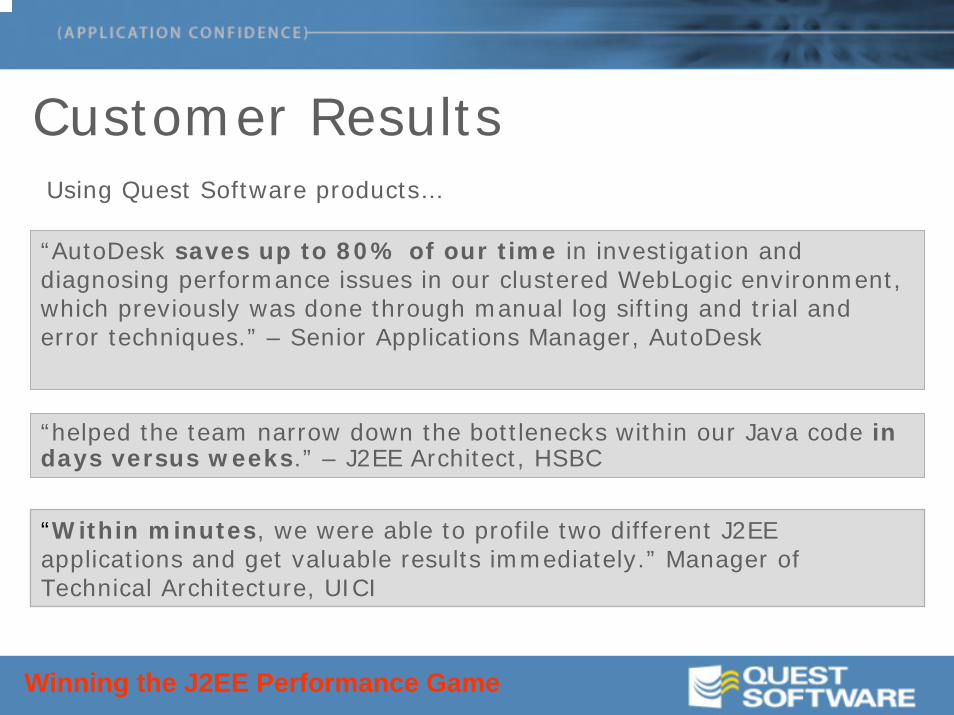
Customer ResultsUsing Quest Software products…
“AutoDesk saves up to 80% of our time in investigation and diagnosing performance issues in our clustered WebLogic environment, which previously was done through manual log sifting and trial and error techniques.” – Senior Applications Manager, AutoDesk
“helped the team narrow down the bottlenecks within our Java code in days versus weeks.” – J2EE Architect, HSBC
“Within minutes, we were able to profile two different J2EE applications and get valuable results immediately.” Manager of Technical Architecture, UICI
Winning the J2EE Performance Game
DEMO