Embed Size (px)
Citation preview
Wine Manufacturing Industry Vitals
KordaMentha Research Unit Publication 707
April 2007
Industry Vitals April 2007
Wine Industry
Sector: Wine Manufacturing in Australia
Overview
• The profitability of wineries (large listed to small boutique) has trended down over the last four years predominantly due to:
− over-supply of cool and warm climate fruit;
− increased competition and heavy discounting both domestically and internationally; and
− consolidation of the Australian retail sector;
− a strengthening AUD.
• As always there are exceptions to the rule as demonstrated by the growth in Yellow Tail underpinned by significant US sales growth, albeit at single digit growth in recent years.
• New market development, brand repositioning and the accelerated depletion of surplus inventory (due to drought, hail and frost as discussed below) may indicate the bottom of the industry cycle has been reached.
• In an increasingly crowded retail market, market access is a critical issue. Supermarket dominance will require brand owners to adopt and evolve sophisticated marketing techniques in order to survive.
• Medium size producers (revenue $5 million to $20 million) are most at risk of being “lost in the middle”. They have suffered from the tendency for large retailers to deal with large suppliers and are unable to clear their volumes through cellar-door sales. It is likely that ongoing distribution consolidation will drive future mergers between medium sized operators.
• Whilst barriers to entry are high and increasing, the outlook for existing players is highly dependant upon the industry’s ability to manage the supply-demand equation through non-price mechanisms.
• Due to extreme seasonal weather conditions the current vintage is expected to be approximately 30% lower than the 2006 vintage, with the 2008 vintage forecast to be approximately 20% lower than 2006. Consequently the estimated 530 million litres of unallocated inventory on hand is forecast to be materially reduced, if not exhausted, by FY09.
Industry Vitals
Page 3
2005
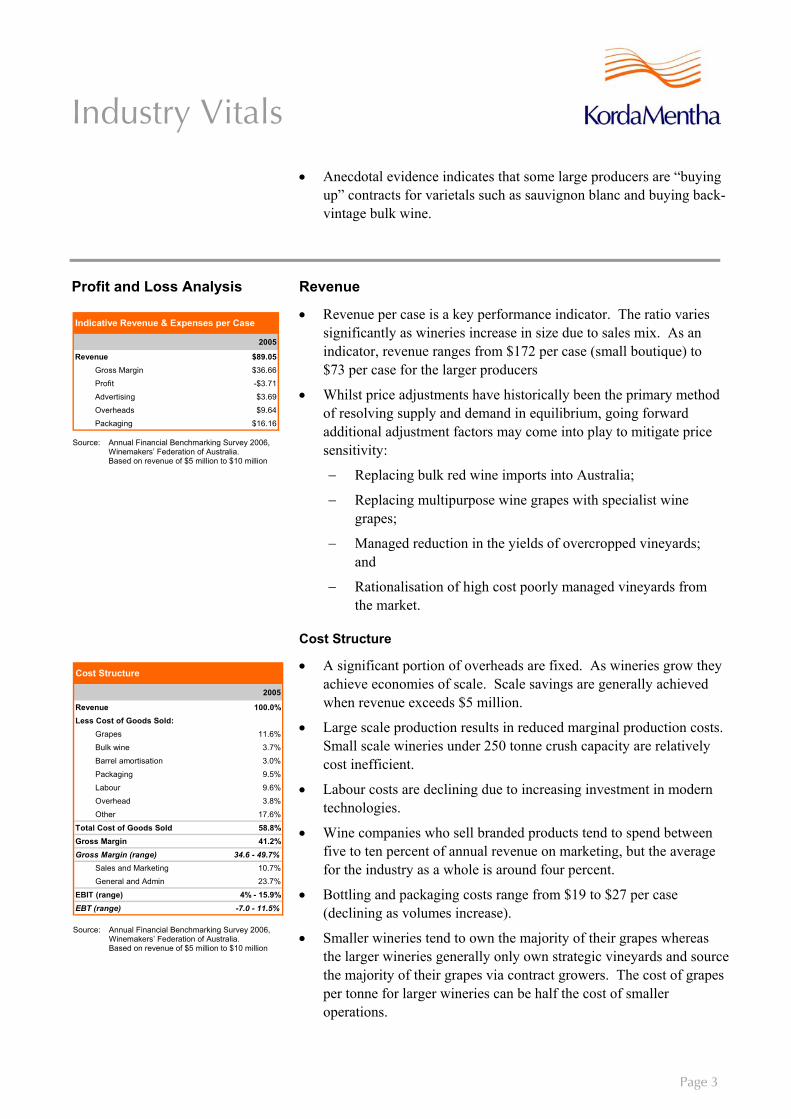
Revenue 100.0%Less Cost of Goods Sold:
Grapes 11.6%
Bulk wine 3.7%
Barrel amortisation 3.0%
Packaging 9.5%
Labour 9.6%
Overhead 3.8%
Other 17.6%
Total Cost of Goods Sold 58.8%Gross Margin 41.2%Gross Margin (range) 34.6 - 49.7%
Sales and Marketing 10.7%
General and Admin 23.7%
EBIT (range) 4% - 15.9%EBT (range) -7.0 - 11.5%
Cost Structure
• Anecdotal evidence indicates that some large producers are “buying up” contracts for varietals such as sauvignon blanc and buying back-vintage bulk wine.
Profit and Loss Analysis Revenue
• Revenue per case is a key performance indicator. The ratio varies significantly as wineries increase in size due to sales mix. As an indicator, revenue ranges from $172 per case (small boutique) to $73 per case for the larger producers
• Whilst price adjustments have historically been the primary method of resolving supply and demand in equilibrium, going forward additional adjustment factors may come into play to mitigate price sensitivity:
− Replacing bulk red wine imports into Australia;
− Replacing multipurpose wine grapes with specialist wine grapes;
− Managed reduction in the yields of overcropped vineyards; and
− Rationalisation of high cost poorly managed vineyards from the market.
Cost Structure
• A significant portion of overheads are fixed. As wineries grow they achieve economies of scale. Scale savings are generally achieved when revenue exceeds $5 million.
• Large scale production results in reduced marginal production costs. Small scale wineries under 250 tonne crush capacity are relatively cost inefficient.
• Labour costs are declining due to increasing investment in modern technologies.
• Wine companies who sell branded products tend to spend between five to ten percent of annual revenue on marketing, but the average for the industry as a whole is around four percent.
• Bottling and packaging costs range from $19 to $27 per case (declining as volumes increase).
• Smaller wineries tend to own the majority of their grapes whereas the larger wineries generally only own strategic vineyards and source the majority of their grapes via contract growers. The cost of grapes per tonne for larger wineries can be half the cost of smaller operations.
Source: Annual Financial Benchmarking Survey 2006, Winemakers’ Federation of Australia.
Based on revenue of $5 million to $10 million
2005
Revenue $89.05Gross Margin $36.66
Profit -$3.71
Advertising $3.69
Overheads $9.64
Packaging $16.16
Indicative Revenue & Expenses per Case
Source: Annual Financial Benchmarking Survey 2006, Winemakers’ Federation of Australia.
Based on revenue of $5 million to $10 million
Industry Vitals
Page 4
• Contracted fruit prices have tended to be “out of the money” but due to recent environmental conditions are moving toward weighted district average price.
• The Australian model of large scale low cost irrigated farming techniques continues to attract interest from Asia and the US.
Medium Sized Producers – “lost in the middle”
• Enterprise size plays an increasingly important part in the ability to compete. Recent profit figures (EBIT) for large multinational wine producers are around 14% - 18% of revenue, while medium sized producers are returning around 4% - 7%.
• The size of an enterprise partly determines access to markets and distribution channels.
• Medium sized wineries have suffered from consolidation of the Australian liquor retailing industry, exposure to “out of the money” grower contract, and the tendency for larger retailers to increasingly deal with large suppliers at the expense of smaller suppliers.
• Smaller wineries sell a significant proportion of output through cellar-door sales, mail orders and website/online. This direct to retail strategy avoids the burden of distributor costs.
• In light of diminished profit margins a number of medium sized wineries have sought to outsource production to specialised high volume contact producers to achieve economies of scale and realise assets to retire senior debt.
• Wholesale distribution channels are an important channel to market, particularly for medium to large enterprises.
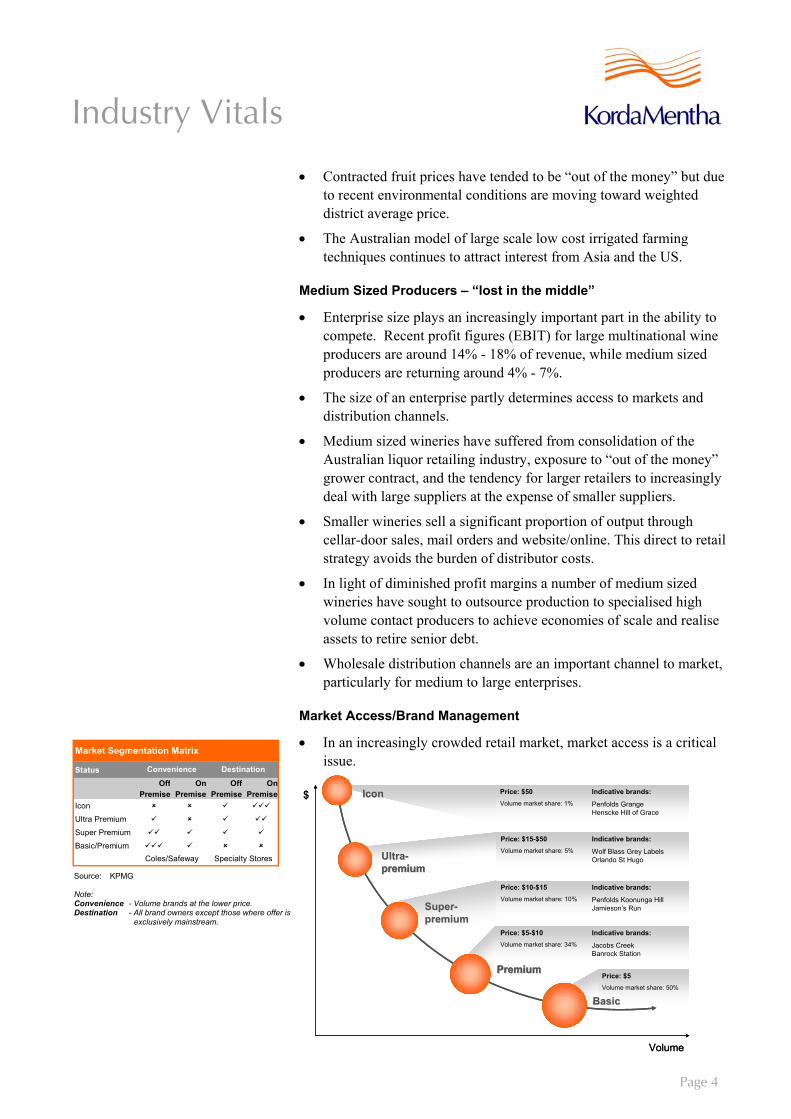
Market Access/Brand Management
• In an increasingly crowded retail market, market access is a critical issue.
Price: $50Volume market share: 1%
Indicative brands:
Penfolds GrangeHenscke Hill of Grace
Price: $5Volume market share: 50%
Price: $15-$50Volume market share: 5%
Indicative brands:
Wolf Blass Grey LabelsOrlando St Hugo
Price: $10-$15Volume market share: 10%
Indicative brands:
Penfolds Koonunga HillJamieson’s Run
Price: $5-$10Volume market share: 34%
Indicative brands:
Jacobs CreekBanrock Station
IconIcon
UltraUltra--premiumpremium
SuperSuper--premiumpremium
PremiumPremium
BasicBasic
$
Volume
StatusOff
PremiseOn
PremiseOff
PremiseOn
PremiseIcon
Ultra Premium
Super Premium
Basic/PremiumColes/Safeway Specialty Stores
Market Segmentation Matrix
Convenience Destination
Source: KPMG Note: Convenience - Volume brands at the lower price. Destination - All brand owners except those where offer is
exclusively mainstream.
Industry Vitals
Page 5
• Supermarket dominance requires brand owners to adopt sophisticated marketing techniques in order to survive:
− Access to scan data (AC Nielsen);
− National account management capabilities; and
− Supply chain management and order fulfilment capability.
• Small and medium sized players between 0.1 million to 3 million cases, with no defined market niche, are most at risk.
Taxation
• Wine Equalisation Tax (“WET”) (29%) is a value-based tax levied on the value of the goods at the last wholesale sale. Results in a 2% to 3% increase in the price of a bottle of wine.
• Legislation recently passed contained a number of changes to WET:
− A new Commonwealth producer rebate which replaces the cellar door rebate scheme;
− A repayment of export credits on wine that is subsequently returned to Australia for sale; and
− Inclusion of bottling and packaging costs in the tax base where wine is purchased in bulk for retail sale.
• Under federal rebate arrangements (effective from 1 October 2004) producers are entitled to a rebate of 29% of the wholesale value of domestic sales. The maximum rebate is $500,000 each year for wine producers’ sales of up to $1,700,000.
Cash Flow Issues Capex/Fixed Assets
• Vines - Generally three to five years to full production
• Oak barrels – A 225 litre French oak baroque costs approximately $1,400 and depreciates over three to four years.
• Other capex includes storage tanks and vineyard netting. There is a tendency towards asset finance arrangements to ease the cash flow burden of significant capex.
Seasonality/Cash Flow
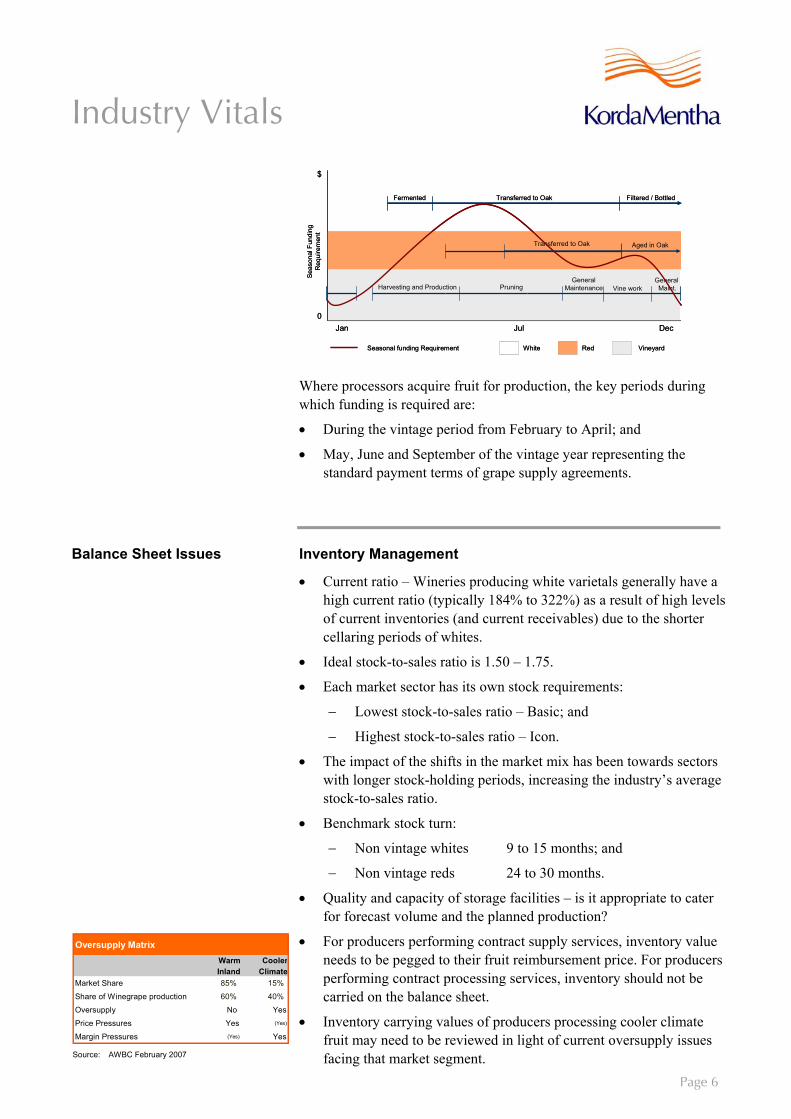
Where processors use owned fruit in production, most costs of production are incurred during vintage, between Feb and June as demonstrated in the table below.
Industry Vitals
Page 6
Oversupply MatrixWarm Inland
Cooler Climate
Market Share 85% 15%
Share of Winegrape production 60% 40%
Oversupply No Yes
Price Pressures Yes (Yes)
Margin Pressures (Yes) Yes
Thinning
Fermented
Tank Fermentation
Seas
onal
Fun
ding
R
equi
rem
ent
Harvesting and Production PruningGeneral
Maintenance
Jan Jul Dec
Transferred to Oak Aged in Oak
Filtered / BottledTransferred to Oak
Vine workGeneral
Maint.
$
0
Seasonal funding Requirement White Red Vineyard
Thinning
Fermented
Tank Fermentation
Seas
onal
Fun
ding
R
equi
rem
ent
Harvesting and Production PruningGeneral
Maintenance
Jan Jul Dec
Transferred to Oak Aged in Oak
Filtered / BottledTransferred to Oak
Vine workGeneral
Maint.
$
0
Seasonal funding Requirement White Red Vineyard
Where processors acquire fruit for production, the key periods during which funding is required are:
• During the vintage period from February to April; and
• May, June and September of the vintage year representing the standard payment terms of grape supply agreements.
Balance Sheet Issues Inventory Management
• Current ratio – Wineries producing white varietals generally have a high current ratio (typically 184% to 322%) as a result of high levels of current inventories (and current receivables) due to the shorter cellaring periods of whites.
• Ideal stock-to-sales ratio is 1.50 – 1.75.
• Each market sector has its own stock requirements:
− Lowest stock-to-sales ratio – Basic; and
− Highest stock-to-sales ratio – Icon.
• The impact of the shifts in the market mix has been towards sectors with longer stock-holding periods, increasing the industry’s average stock-to-sales ratio.
• Benchmark stock turn:
− Non vintage whites 9 to 15 months; and
− Non vintage reds 24 to 30 months.
• Quality and capacity of storage facilities – is it appropriate to cater for forecast volume and the planned production?
• For producers performing contract supply services, inventory value needs to be pegged to their fruit reimbursement price. For producers performing contract processing services, inventory should not be carried on the balance sheet.
• Inventory carrying values of producers processing cooler climate fruit may need to be reviewed in light of current oversupply issues facing that market segment. Source: AWBC February 2007
Industry Vitals
Page 7
• AASB - 141 Agriculture:
− AASB 141 requires the carrying value of vines to be measured at fair value less estimated point of sale costs except where fair value cannot be measured. In determining the FV certain assumptions have to be made about the yields and market prices of grapes in future vintages, the cost of running the vineyard and the quality of the grapes grown. Generally an independent valuation is required; and
− The amendments to the AASB’s have eliminated a large degree of the subjectivity associated with the previous standards in relation to inventory valuation.
Debt to Equity
• The smaller wineries generally have a higher debt to equity level as a result of limited access to equity. Fixed assets are generally debt funded.
Valuation – Land Under Vine
• The value of land under vine can vary significantly. Key considerations include soil conditions, yields, operational costs, age and varietals of plantings, rate of new plantings, water supply, disease and geographic location.
Brand Names/Trademarks
• Quality of label – Market perception/brand awareness is critical.
• Awards received – From where and for what?
• Are these items allowed to be recognised in the balance sheet? Generally only acquired intangibles may be recognised at cost. Internally generated Brand Names/Trademarks should not be capitalised and the expenditure charged against profits in the year in which the expenditure is incurred.
• These intangibles must be tested for impairment where indicators of impairment exist to ensure carrying value does not exceed the recoverable amount.
• Expenditure in developing, maintaining or enhancing these intangibles should be written off in the income statement in the year in which it is incurred.
Industry Vitals
Page 8
Environmental/Climatic Risk/Disease Management
• Production is affected by supply of grapes, which is impacted by weather, soil conditions and disease.
Environmental
• Water usage varies considerably, depending upon weather conditions, operational efficiency and age of the vines (high in initial years and lower thereafter).
• Consider availability of water (dams/water rights).
Climatic Risk
• Fire – Risk is enhanced due to drought conditions (King Valley and Grampians). The Yarra Valley 2007 vintage has experienced smoke taint in red varietals as a result of recent fires.
• Weather – Drought conditions in Australia/Frosts in New Zealand
• Frost/hail/wind/storm damage – Is insurance in place?
• Bird damage – Is netting required? Capex requirements?
Disease Management
• Is the company doing enough/too much/anything at all?
• Control – Spraying, farm management.
• Prevention – Phylloxera resistant root stock/sufficient infrastructure and management strategies in the event of an outbreak (Yarra Valley).
Exit Strategy Considerations
• Consider impact of third party leased equipment – particularly storage tanks and barrels.
• Potential ROT on bulk wine, bottles, barrels, etc.
• Lien claims for storage/distribution agents. Consider liens available for contract suppliers or contract processors.
• Impact on key contracts, grape purchasing, bulk wine sales, distribution, contract crushing, etc.
Other Regulation
• Subject to food standards legislation.
• Australian Wine and Brandy Corporation (AWBC) is a Commonwealth statutory corporation that regulates and promotes the Australian wine industry.
Industry Vitals
Page 9
• The Australian Wine Export Council (AWEC) issues export licences (required when exports exceed 100 litres to any destination) and export quality inspections.
• The Commonwealth Department of Agriculture, Fisheries and Forestry (AFFA) collects levies on wine exports which are forwarded to the AWBC for export promotion purposes:
− 0.20% on the first $10 million of FOB export sales;
− 0.10% on the next $40 million of FOB export sales; and
− 0.05% on remaining FOB export sales.
Barriers to Entry – High and Increasing
• Capital requirement – Generally significant even for small operations.
• Foreign competition – Overseas large scale operations increasingly a threat.
• Premium grapes – Access is a diminishing problem as production expands although the availability of quality and experienced wine makers has become limited.
• Brand establishment – High cost to establish and maintain in a competitive market but imperative given consumers typically choose a brand that they are familiar with.
• Distribution channels – “Any Australian winegrape producer without a secure purchase contract or any Australian wine producer who is not already in the market with a well established brand by now, will not succeed in the next 10 years.” (Bruce Kemp, Global Wine Advice, Sept 2000)
US/AUS Free Trade Agreement
• The FTA is expected to have little immediate impact on Australian wine companies as tariff adjustments are to be phased in over 15 years.
• The immediate challenges from the US are not quotas and tariffs but competition from “extreme value” Californian producers
Non-Forestry Managed Investments Schemes
• The federal government’s announcement that they will strip tax concessions for all non-forestry related managed investment schemes means investors will have to apply directly to the Federal Government from 1 July in order to be able to claim tax concessions. The ATO is currently preparing a Draft Taxation Ruling setting out the position.
• The tax incentives were originally offered to encourage investment in the plantation timber industry and rapidly spread into other industries, including the wine industry.
Industry Vitals
Page 10
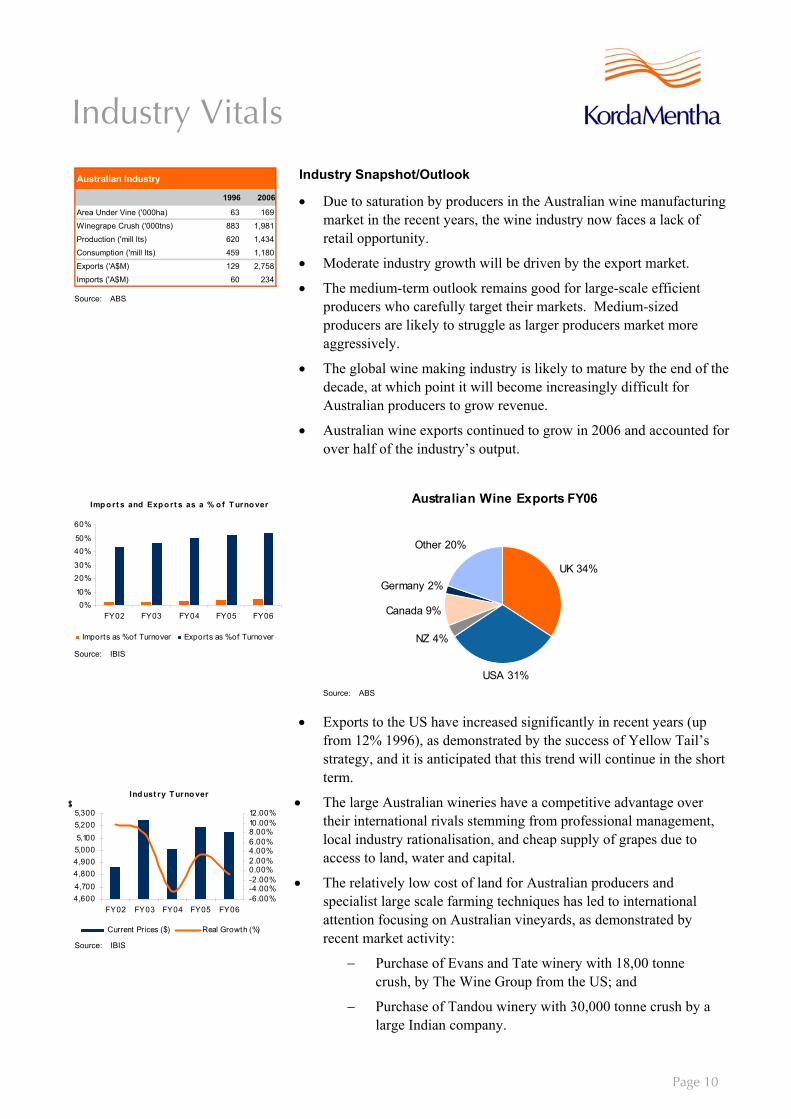
Australian Industry
1996 2006
Area Under Vine ('000ha) 63 169
Winegrape Crush ('000tns) 883 1,981
Production ('mill lts) 620 1,434
Consumption ('mill lts) 459 1,180
Exports ('A$M) 129 2,758
Imports ('A$M) 60 234
Industry Snapshot/Outlook
• Due to saturation by producers in the Australian wine manufacturing market in the recent years, the wine industry now faces a lack of retail opportunity.
• Moderate industry growth will be driven by the export market.
• The medium-term outlook remains good for large-scale efficient producers who carefully target their markets. Medium-sized producers are likely to struggle as larger producers market more aggressively.
• The global wine making industry is likely to mature by the end of the decade, at which point it will become increasingly difficult for Australian producers to grow revenue.
• Australian wine exports continued to grow in 2006 and accounted for over half of the industry’s output.
Australian Wine Exports FY06
UK 34%
USA 31%
NZ 4%
Canada 9%
Germany 2%
Other 20%
• Exports to the US have increased significantly in recent years (up
from 12% 1996), as demonstrated by the success of Yellow Tail’s strategy, and it is anticipated that this trend will continue in the short term.
• The large Australian wineries have a competitive advantage over their international rivals stemming from professional management, local industry rationalisation, and cheap supply of grapes due to access to land, water and capital.
• The relatively low cost of land for Australian producers and specialist large scale farming techniques has led to international attention focusing on Australian vineyards, as demonstrated by recent market activity:
− Purchase of Evans and Tate winery with 18,00 tonne crush, by The Wine Group from the US; and
− Purchase of Tandou winery with 30,000 tonne crush by a large Indian company.
Source: ABS
Source: ABS
Imp o rt s and Exp o rt s as a % o f T urno ver
0%10%
20%30%
40%50%
60%
FY02 FY03 FY04 FY05 FY06
Imports as % of Turnover Exports as % of Turnover
Ind ust ry T urno ver
4,6004,7004,8004,9005,0005,1005,2005,300
FY02 FY03 FY04 FY05 FY06-6.00%-4.00%-2.00%0.00%2.00%4.00%6.00%8.00%10.00%12.00%
Current Prices ($) Real Growth (%)
Source: IBIS
Source: IBIS
Industry Vitals
Page 11
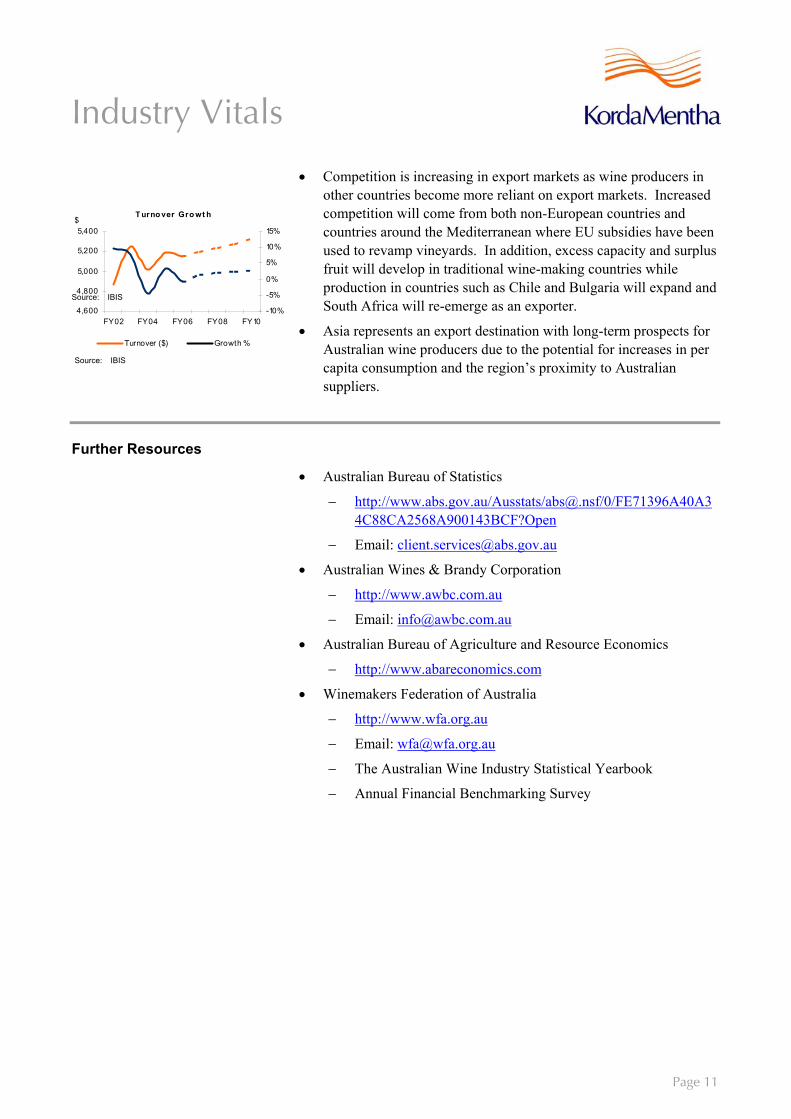
• Competition is increasing in export markets as wine producers in other countries become more reliant on export markets. Increased competition will come from both non-European countries and countries around the Mediterranean where EU subsidies have been used to revamp vineyards. In addition, excess capacity and surplus fruit will develop in traditional wine-making countries while production in countries such as Chile and Bulgaria will expand and South Africa will re-emerge as an exporter.
• Asia represents an export destination with long-term prospects for Australian wine producers due to the potential for increases in per capita consumption and the region’s proximity to Australian suppliers.
Further Resources
• Australian Bureau of Statistics
− http://www.abs.gov.au/Ausstats/[email protected]/0/FE71396A40A34C88CA2568A900143BCF?Open
− Email: [email protected]
• Australian Wines & Brandy Corporation
− http://www.awbc.com.au
− Email: [email protected]
• Australian Bureau of Agriculture and Resource Economics
− http://www.abareconomics.com
• Winemakers Federation of Australia
− http://www.wfa.org.au
− Email: [email protected]
− The Australian Wine Industry Statistical Yearbook
− Annual Financial Benchmarking Survey
T urno ver Gro wt h
4,600
4,800
5,000
5,200
5,400
FY02 FY04 FY06 FY08 FY10
$
-10%
-5%
0%
5%
10%
15%
Turnover ($) Growth %
Source: IBIS
Source: IBIS
About The KordaMentha Research Unit
Background
KordaMentha is an independent professional services firm specialising in corporate restructuring, corporate advisory and real estate services.
Our national practice spans all major cities in Australia and comprises in excess of 180 staff. Internationally, we have an affiliation with AlixPartners, a global restructuring firm covering North America, Europe and Asia.
Our partners, directors and staff have extensive experience across a broad range of industries and our firm has a culture based on creative solutions and implementation. The strength of KordaMentha’s experience makes us well placed to monitor, evaluate and comment on issues and developments in industry, and in corporate restructuring, workouts and insolvency generally.
Statement of Direction
The KordaMentha Research Unit aims to:
• develop intellectual property
• share our knowledge of specialist topics with insolvency stakeholders; and
• develop balanced solutions for issues in the industry.
Personnel
The KordaMentha Research Unit is headed by Andrew Malarkey ([email protected]). KordaMentha Partners and Directors contribute to the KordaMentha Research Unit.
Current Research
In addition to general publications, the KordaMentha Research Unit regularly publishes Industry Roundups and Industry Vitals.
Industry Roundups provide a concise summary of recent news and development, covering a number of industry sectors.
Industry Vitals provide a snapshot of key issues relating to selected industries.
All KordaMentha Research Unit publications can be accessed via our website – www.kordamentha.com