Embed Size (px)
Citation preview

FIRST-YEAR WILKINSON MICROWAVE ANISOTROPY PROBE (WMAP)1 OBSERVATIONS:PRELIMINARY MAPS AND BASIC RESULTS
C. L. Bennett,2M. Halpern,
3G. Hinshaw,
2N. Jarosik,
4A. Kogut,
2M. Limon,
2,5S. S. Meyer,
6L. Page,
4
D. N. Spergel,7G. S. Tucker,
2,5,8E.Wollack,
2E. L. Wright,
9C. Barnes,
4M. R. Greason,
10
R. S. Hill,10
E. Komatsu,7M. R. Nolta,
4N. Odegard,
10H. V. Peiris,
7
L. Verde,7and J. L. Weiland
10
Received 2003 February 11; accepted 2003May 29
ABSTRACT
We present full-sky microwave maps in five frequency bands (23–94 GHz) from theWilkinson MicrowaveAnisotropy Probe (WMAP) first-year sky survey. Calibration errors are less than 0.5%, and the low system-atic error level is well specified. The cosmic microwave background (CMB) is separated from the foregroundsusing multifrequency data. The sky maps are consistent with the 7� FWHM Cosmic Background Explorer(COBE) maps. We report more precise, but consistent, dipole and quadrupole values. The CMB anisotropyobeys Gaussian statistics with �58 < fNL < 134 (95% confidence level [CL]). The 2 � ‘ � 900 anisotropypower spectrum is cosmic-variance–limited for ‘ < 354, with a signal-to-noise ratio greater than 1 per modeto ‘ ¼ 658. The temperature-polarization cross-power spectrum reveals both acoustic features and a large-angle correlation from reionization. The optical depth of reionization is � ¼ 0:17� 0:04, which implies areionization epoch of tr ¼ 180þ220
�80 Myr (95% CL) after the big bang at a redshift of zr ¼ 20þ10�9 (95% CL) for a
range of ionization scenarios. This early reionization is incompatible with the presence of a significant warmdark matter density.
A best-fit cosmological model to the CMB and other measures of large-scale structure works remarkablywell with only a few parameters. The age of the best-fit universe is t0 ¼ 13:7� 0:2 Gyr. Decoupling wastdec ¼ 379þ8
�7 kyr after the big bang at a redshift of zdec ¼ 1089� 1. The thickness of the decoupling surfacewas Dzdec ¼ 195� 2. The matter density of the universe is �mh2 ¼ 0:135þ0:008
�0:009, the baryon density is�bh2 ¼ 0:0224� 0:0009, and the total mass-energy of the universe is �tot ¼ 1:02� 0:02. It appears that theremay be progressively less fluctuation power on smaller scales, fromWMAP to fine-scale CMBmeasurementsto galaxies and finally to the Ly� forest. This may be accounted for with a running spectral index of scalarfluctuations, fitted as ns ¼ 0:93� 0:03 at wavenumber k0 ¼ 0:05 Mpc�1 (‘eff � 700), with a slope ofdns=d ln k ¼ �0:031þ0:016
�0:018 in the best-fit model. (ForWMAP data alone, ns ¼ 0:99� 0:04.) This flat universemodel is composed of 4.4% baryons, 22% dark matter, and 73% dark energy. The dark energy equation ofstate is limited to w < �0:78 (95% CL). Inflation theory is supported with ns � 1,�tot � 1, Gaussian randomphases of the CMB anisotropy, and superhorizon fluctuations implied by the temperature-polarizationanticorrelations at decoupling. An admixture of isocurvature modes does not improve the fit. The tensor-to-scalar ratio is rðk0 ¼ 0:002 Mpc�1Þ < 0:90 (95% CL). The lack of CMB fluctuation power on the largestangular scales reported by COBE and confirmed by WMAP is intriguing. WMAP continues to operate, soresults will improve.
Subject headings: cosmic microwave background — cosmology: observations — dark matter —early universe — instrumentation: detectors — space vehicles: instruments
1. INTRODUCTION
The cosmic microwave background (CMB) radiation wasfirst detected by Penzias & Wilson (1965). After itsdiscovery, a small number of experimentalists worked foryears to better characterize the CMB as they searched for
temperature fluctuations. A leader of this effort, and of theWilkinson Microwave Anisotropy Probe (WMAP) effort,was our recently deceased colleague, Professor David T.Wilkinson of Princeton University. He was also a leadingmember of the Cosmic Background Explorer (COBE) mis-sion team, which accurately characterized the spectrum of
1 WMAP is the result of a partnership between Princeton University and the NASA Goddard Space Flight Center. Scientific guidance is provided by theWMAP Science Team.
2 NASAGoddard Space Flight Center, Code 685, Greenbelt,MD 20771; [email protected] Department of Physics and Astronomy, University of British Columbia, Vancouver, BCV6T 1Z1, Canada.4 Department of Physics, JadwinHall, Princeton, NJ 08544.5 National Research Council Fellow.6 Departments of Astrophysics and Physics, EFI, and CfCP, University of Chicago, Chicago, IL 60637.7 Department of Astrophysical Sciences, PrincetonUniversity, Princeton, NJ 08544.8 Department of Physics, BrownUniversity, Providence, RI 02912.9 Department of Astronomy, UCLA, P.O. Box 951562, Los Angeles, CA 90095-1562.10 Science Systems andApplications, Inc. (SSAI), 10210Greenbelt Road, Suite 600, Lanham,MD 20706.
The Astrophysical Journal Supplement Series, 148:1–27, 2003 September
# 2003. The American Astronomical Society. All rights reserved. Printed in U.S.A.
1
the CMB (Mather et al. 1990, 1999) and first discoveredanisotropy (Smoot et al. 1992; Bennett et al. 1992; Kogutet al. 1992; Wright et al. 1992). The MAP was recentlyrenamedWMAP in his honor.
The general recognition that the CMB is a primary toolfor determining the global properties, content, and historyof the universe has led to the tremendous interest andgrowth of the field. In addition to the characterization ofthe large-scale anisotropy results fromCOBE (Bennett et al.1996; Hinshaw et al. 1996a, 1996b; Kogut et al. 1996a,1996b, 1996c; Gorski et al. 1996; Wright et al. 1996a), a hostof experiments have measured the finer scale anisotropy(Benoit et al. 2003; Grainge et al. 2003; Pearson et al. 2003;Ruhl et al. 2003; Kuo et al. 2002; Dawson et al. 2001;Halverson et al. 2002; Hanany et al. 2000; Leitch et al. 2000;Wilson et al. 2000; Padin et al. 2001; Romeo et al. 2001;Harrison et al. 2000; Peterson et al. 2000; Baker et al. 1999;Coble et al. 1999; Dicker et al. 1999; Miller et al. 1999;de Oliveira-Costa et al. 1998; Cheng et al. 1997; Hancocket al. 1997; Netterfield et al. 1997; Piccirillo et al. 1997;Tucker et al. 1997; Gundersen et al. 1995; de Bernardis et al.1994; Ganga et al. 1993; Myers, Readhead, & Lawrence1993; Tucker et al. 1993). As a result of these tremendousefforts, the first acoustic peak of the anisotropy power spec-trum has been unambiguously detected (Knox & Page 2000;Mauskopf et al. 2000; Miller et al. 1999), and CMB observa-tions have placed important constraints on cosmologicalmodels. Recently, Kovac et al. (2002) reported the firstdetection of CMB polarization arising from the anisotropicscattering of CMB photons at decoupling, ushering in a newera of CMB polarization measurements.
The WMAP mission was designed to advance obser-vational cosmology by making full-sky CMB maps withaccuracy, precision, and reliability, as described by Bennettet al. (2003a). The instrument observes the temperature dif-ference between two directions (as did COBE) using twonearly identical sets of optics (Page et al. 2003a, 2003b).These optics focus radiation into horns (Barnes et al. 2002)that feed differential microwave radiometers (Jarosik et al.2003a). We produce full-sky maps in five frequency bandsfrom the radiometer data of temperature differencesmeasured over the full sky. A CMB map is the most com-pact representation of CMB anisotropy without loss ofinformation.
In this paper we present the maps, their properties, and asynopsis of the basic results of the first year of observations.In x 2 we give a brief overview of theWMAPmission. In x 3we summarize the data analysis, calibration, and systematicerrors of the experiment, which are discussed in muchgreater detail in the companion papers by Hinshaw et al.
(2003a), Page et al. (2003b), Jarosik et al. (2003b), andBarnes et al. (2003). In x 4 we present the maps and theirsampling properties, and we compare the WMAP andCOBE maps. In x 5 we summarize the foreground analysesof Bennett et al. (2003a). In x 6 we establish the Gaussiannature of the WMAP anisotropy, determined in the com-panion paper of Komatsu et al. (2003). In x 7 we present thedipole and quadrupole moments and summarize analyses ofthe angular power spectrum (Hinshaw et al. 2003b; Verdeet al. 2003). In x 8 we highlight the WMAP polarizationresults, including a detection of the reionization of the uni-verse (Kogut et al. 2003). In x 9 we summarize some of thecosmological implications of theWMAP results (Page et al.2003a; Spergel et al. 2003; Peiris et al. 2003). Finally, in x 10we discuss the availability of theWMAP data products.
2. OBSERVATIONS
The 840 kg WMAP observatory was launched aboard aDelta II 7425-10 rocket (Delta launch number 286) on 2001June 30 at 3:46:46.183 EDT from Cape Canaveral. WMAPexecuted three phasing loops in the Earth-Moon systembefore a lunar-gravity–assist swing-by, a month afterlaunch, catapulted WMAP to an orbit at about the secondLagrange point of the Sun-Earth system, L2. Station-keeping is performed approximately four times per year tomaintain the observatory in a Lissajous orbit about the L2point with the Earth-WMAP vector within �1�–10� of theSun-Earth vector. The phasing loop maneuvers and station-keeping are executed using the WMAP propulsion systemof blow-down hydrazine and eight thrusters.
The central design philosophy of theWMAPmission wasto minimize sources of systematic measurement errors(Bennett et al. 2003a). The COBE mission proved the effec-tiveness of a differential design in minimizing systematicerrors. Therefore, theWMAP instrument was designed witha back-to-back optical system with 1:4 m� 1:6 m primaryreflectors to provide for differential measurements of thesky. The primary and secondary reflectors direct radiationinto two focal planes, with 10 feed horns in each, asdescribed by Page et al. (2003a).
The beams have a gain pattern G, which is neither sym-metric nor Gaussian. We define the beam solid angle asR½Gð�Þ=Gmax� d�. The beam size can be expressed as the
square root of the beam solid angles, giving 0=22, 0=35, 0=51,0=66, and 0=88 for the W band through the K band, respec-tively. Alternately, the beams can be expressed in terms of aFWHM for each band, given in Table 1. Detailedanalyses of the WMAP beams are discussed by Page et al.(2003a, 2003b).
TABLE 1
Approximate Observational Properties by Band
Item KBand Ka Band QBand V Band WBand
Wavelength, � (mm)............................................. 13 9.1 7.3 4.9 3.2
Frequency, � (GHz) ............................................. 22.8 33.0 40.7 60.8 93.5
Ant./therm. conversion factor, DT/DTA .............. 1.014 1.029 1.044 1.100 1.251
Noise, �0 (mK), � ¼ �0N�1=2obs ............................... 1.424 1.449 2.211 3.112 6.498
Beamwidth h (deg FWHM)................................. 0.82 0.62 0.49 0.33 0.21
Number of differencing assemblies ....................... 1 1 2 2 4
Number of radiometers........................................ 2 2 4 4 8
Number of channels ............................................. 4 4 8 8 16
2 BENNETT ET AL. Vol. 148
The feed horns are attached to orthomode transducers(OMTs) that split the polarization of the incoming signal intoa differential correlation radiometer system with HighElectron Mobility Transistor (HEMT) amplifiers. There are10 ‘‘ differencing assemblies,’’ each consisting of two ‘‘ radio-meters ’’ with two ‘‘ channels ’’ each (Jarosik et al. 2003a;Bennett et al. 2003a). There are four W-band (�94 GHz),two V-band (�61 GHz), two Q-band (�41 GHz), one Ka-band (�33 GHz), and one K-band (�23 GHz) differencingassemblies. We usually refer to these bands by the genericdesignations K, Ka, Q, V, and W because there are multipleradiometers in each band, whose precise frequencies are notidentical. In addition, the effective frequency of a radiometerdepends on the spectrum of the emission it detects. Precisefrequencies for the radiometers for a CMB anisotropy spec-trum are given by Jarosik et al. (2003a). Polynomials aregiven to determine the effective frequency of the radiometersdepending on the emission frequency spectrum. See Table 1for a summary of radiometer properties.
Undesirable 1=f noise is minimized by the design of theWMAP radiometers (Jarosik et al. 2003a). All radiometershave 1=f knees below 50 mHz; 18 of 20 are below 10 mHz,and 10 of the 20 are below 1 mHz (Jarosik et al. 2003b).(The 1=f knee is defined as the frequency at which the noisepower spectral density is
ffiffiffi2
ptimes higher than its high-
frequency value.) Jarosik et al. (2003a) demonstrate that allradiometer outputs have Gaussian noise, which ‘‘ integratesdown ’’ with time as expected.
The radiometers are passively cooled to �90 K with nomechanical refrigerators. In addition, no actively cyclingheaters were permitted anywhere on theWMAP spacecraft.These design features helped to ensure a mechanically, ther-mally, and electronically quiet platform that minimizes thedriving forces of systematic measurement errors.
In addition to the differential design, the COBE missionalso demonstrated the importance of scanning large areas ofthe sky in a short period of time with a complex scan pat-tern. WMAP follows the COBE example with a three-axis(three reaction wheel) control system that maintains theobservatory in a nearly constant survey mode of operations.(The observatory is in constant survey mode, except for only�1 hr for each of approximately four station-keepingmaneuvers per year.) In survey mode, the optical boresightsweeps out a complex pattern on the sky (Bennett et al.2003a). Approximately 30% of the sky is observed eachhour. The observatory spins at 0.464 rpm (�7.57 mHz) andprecesses at 1 revolution hr�1 (�0.3 mHz).
Six months are required for L2 to orbit half-way aroundthe Sun, allowing for full-sky coverage. The observationspresented in this and companion papers include a full orbitabout the Sun, thus containing two sets of full-sky observa-
tions. By 2001 August 10, WMAP was sufficiently stable inits L2 orbit for CMB data taking to commence. One year ofobservations, completed on 2002 August 9, were analyzed.Data taken beyond this date will be the subject of futureanalyses.
3. DATA PROCESSING, CALIBRATION, ANDSYSTEMATIC ERRORS
Time-ordered telemetry data from the observatory aredownlinked via NASA’s Deep Space Network to theWMAP Science andMission Operations Center (SMOC) atthe Goddard Space Flight Center. The data are then trans-ferred to the WMAP Science Team for analysis. All of theinstrument data are downlinked to the ground without anyonboard flight data processing, thus allowing full insightinto potential systematic effects.
Only a fraction of a percent of data were lost in the flowfrom the observatory to the SMOC. About 1% of thereceived data were not used because of systematic error con-cerns (e.g., data taken during or near station-keepingmaneuvers). Of the �99% good data, the processing pipe-line flagged observations where bright planets were in thebeams so that these data would not be used in making maps.The statistics on lost, bad, and flagged data are given inTable 2.
An overview of the data flow is shown in Figure 1. Theheart of the data analysis efforts centers on studies ofsystematic measurement errors (Hinshaw et al. 2003b).Components of spurious signals at the spin period are themost difficult to distinguish from true sky signals. Theobservatory was designed to minimize all thermal and volt-age variations and all susceptibilities to these variations,especially at the spin period, as discussed in x 2 and byBennett et al. (2003a). In addition, high-precision tempera-ture monitors on the observatory provide the data neededto verify that systematic errors from thermal variations arenegligible. Jarosik et al. (2003b) report that in-flight spin-synchronous effects from the radiometers are less than 0.17lK rms in the time-ordered data (TOD), based on flightthermal variations multiplied by upper limits on componentsusceptibilities measured in ground testing. Analysis offlight data without use of characterizations derived fromground-based testing give less than 0.14 lK rms from allsources (not just the radiometers). This is a factor of morethan 50 times smaller than the requirement that was set inthe mission’s systematic error budget. Thus, no correctionsto the first-year WMAP data are required for spin-synchronous systematic errors.
The core of the processing pipeline calibrates the dataand converts the differential temperatures into maps. The
TABLE 2
Data Flagging Summary
Category K Band Ka Band QBand V Band WBand
Rejected or lost data:
Lost data (%)........................................ 0.27 0.27 0.27 0.27 0.27
Spacecraft thermal change (%) ............. 0.87 0.87 0.87 0.87 0.87
Gain or baseline step (%) ...................... 0.00 0.13 0.12 0.00 0.22
Total lost or bad data (%) ..................... 1.04 1.27 1.26 1.14 1.36
Data not used in maps:
Planet flag (%) ...................................... 0.11 0.11 0.11 0.11 0.11
No. 1, 2003 WMAP FIRST-YEAR RESULTS 3
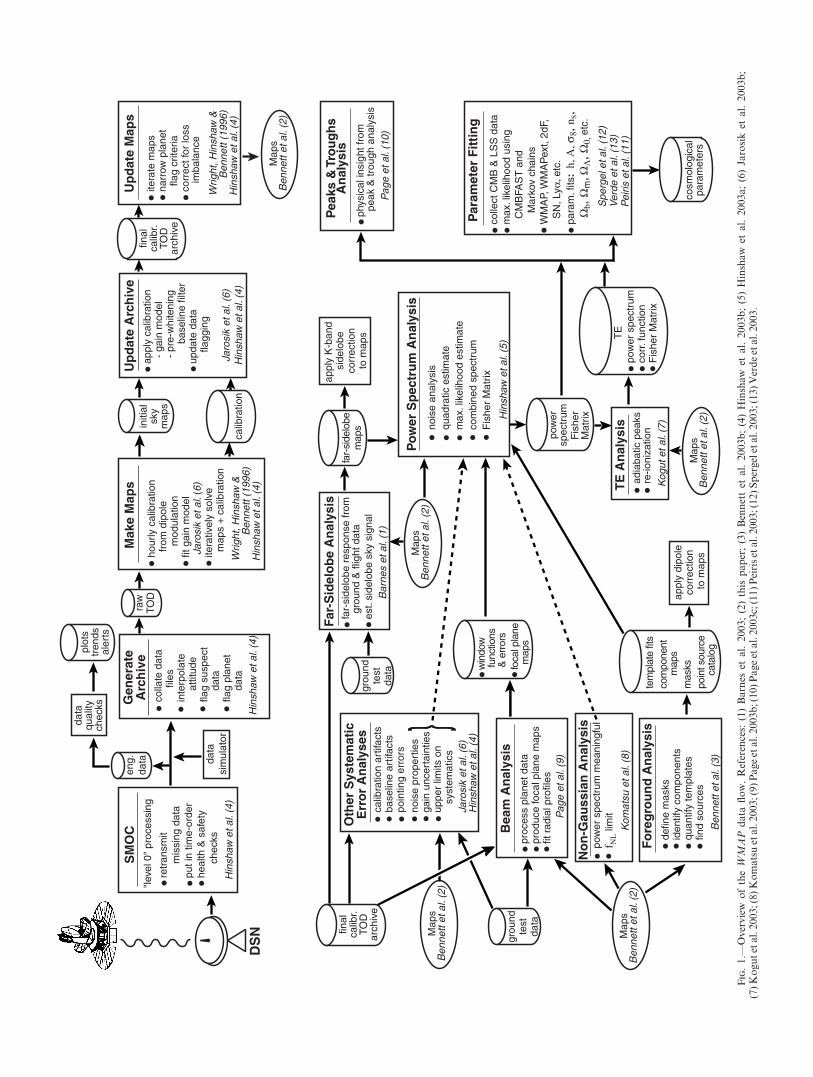
Fig.1.—
Overview
oftheWMAP
data
flow.References:
(1)Barnes
etal.2003;(2)this
paper;(3)Bennettet
al.2003b
;(4)Hinshaw
etal.2003b
;(5)Hinshaw
etal.2003a;(6)Jarosiket
al.2003b
;(7)Kogutetal.2003;(8)Komatsu
etal.2003;(9)Pageetal.2003b
;(10)Pageetal.2003c;(11)Peirisetal.2003;(12)Spergeletal.2003;(13)Verdeetal.2003.

data are calibrated based on the Earth-velocity modulationof the CMB dipole. A gain model of the radiometers wasderived and fitted by Jarosik et al. (2003b). The model isbased on the constancy of the dipole signal on the sky, themeasured physical temperature of the front-end radiometercomponents, and the time-averaged radio-frequency bias(total power) of the radiometer outputs. This relativelysimple model closely matches the gains derived from thehourly measurements of the amplitude of the dipole and isused in WMAP data processing. Calibration is achievedwithin 0.5% accuracy, dominated by the statisticaluncertainty in the absolute calibration.
Low levels of 1=f noise create stripes in the maps thataffect the angular power spectrum and other statisticsderived from the maps. A prewhitening filter is applied tothe TOD to minimize these artifacts. An estimate of themagnitude of the striping is given by Hinshaw et al. (2003b)for the maps and by Hinshaw et al. (2003a) for the powerspectrum.
The differential temperature data are formed into mapsbased on the technique introduced by Wright et al. (1996b).HEALPix11 is used to define map pixels on the sky in Galac-tic coordinates. Various levels of resolution are specified bya ‘‘ resolution level ’’ with an integer (r ¼ 0, 1, 2, . . .). WithNside ¼ 2r, the number of pixels in the map isNpix ¼ 12N2
side.The area per pixel is �pix ¼ 4�=Npix, and the separationbetween pixel centers is �pix ¼ �
1=2pix . For example, HEALPix
resolution level r ¼ 9 (used in WMAP map-making)corresponds to Nside ¼ 512, Npix ¼ 3,145,728, �pix ¼ 3:99�10�6 sr, and �pix ¼ 0=115 ¼ 6<87.
WMAP observes the sky convolved with the beam pat-tern. This is equivalent to the spatial transform of the skymultiplied by the instrument’s ‘‘ window function.’’ Thebeam patterns are measured in flight from observations ofJupiter (Page et al. 2003b). Uncertainties in our knowledgeof the beam pattern, although small, are a significant sourceof uncertainty for WMAP, since they imply imperfectknowledge of the window function. A small differencebetween the A-side and B-side optical losses was derivedbased on dipole observations and corrected in the process-ing. Far sidelobes of the beam patterns, determined byground measurements and in flight using the Moon, havebeen carefully examined (Barnes et al. 2003). A small farsidelobe correction is applied to only the K-band map. Wenow describe the maps.
4. THE MAPS
We combine the radiometer results within each band andpresent the five full-sky maps at effective CMB anisotropyfrequencies of 23, 33, 41, 61, and 94 GHz in Figures 2a–2e.The maps are shown in the Mollweide projection in units ofCMB thermodynamic temperature. The number of inde-pendent observations that contribute to each pixel formsthe sky pattern in Figure 3. Figure 4 provides an overallguide to some of the more prominent features of the mapsas well as point sources detected by WMAP, as describedherein.
Figure 5 shows the K-band and Ka-band maps, with theKa-band map smoothed to K-band resolution. Note boththe significant decrease in Galactic signal from the K band
to the Ka band and the high Galactic latitude similarities ofthe CMB between the maps. Likewise, Figure 6 shows theQ-band, V-band, and W-band maps with the latter twosmoothed to Q-band resolution. Higher Galactic contami-nation in the Q band is apparent. Both Figures 5 and 6 high-light the consistency of the high Galactic latitude CMBanisotropy pattern from band to band.
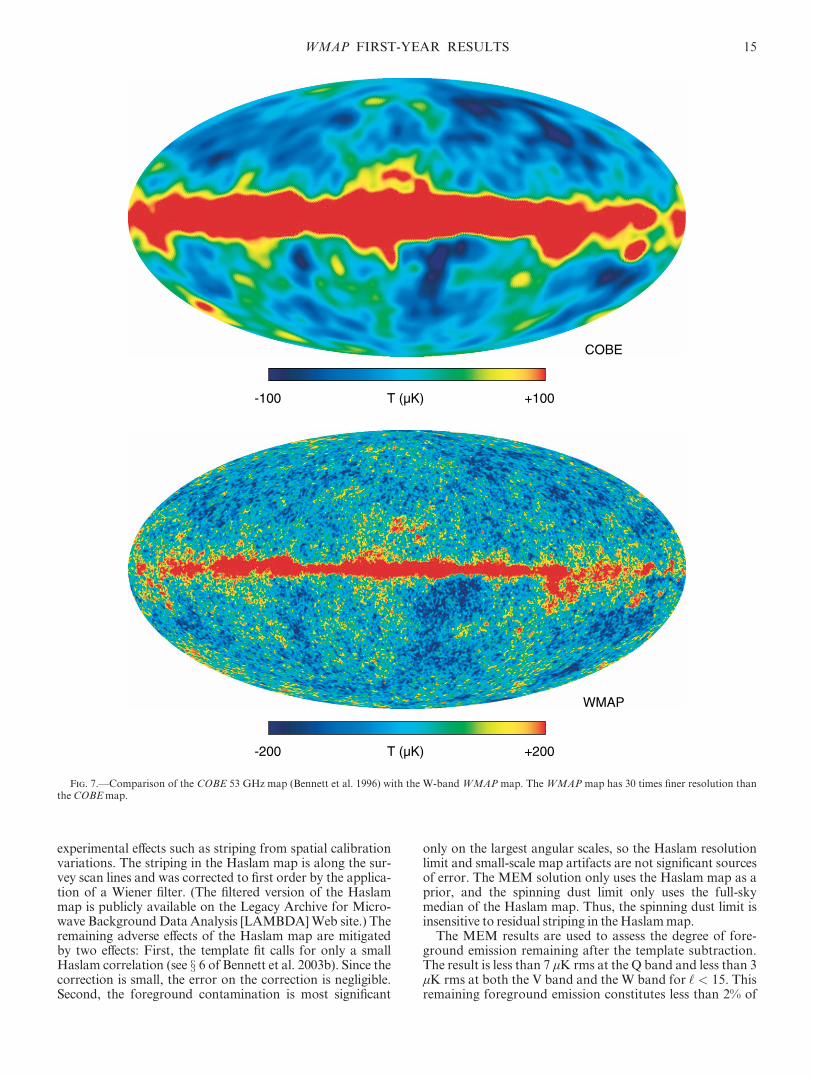
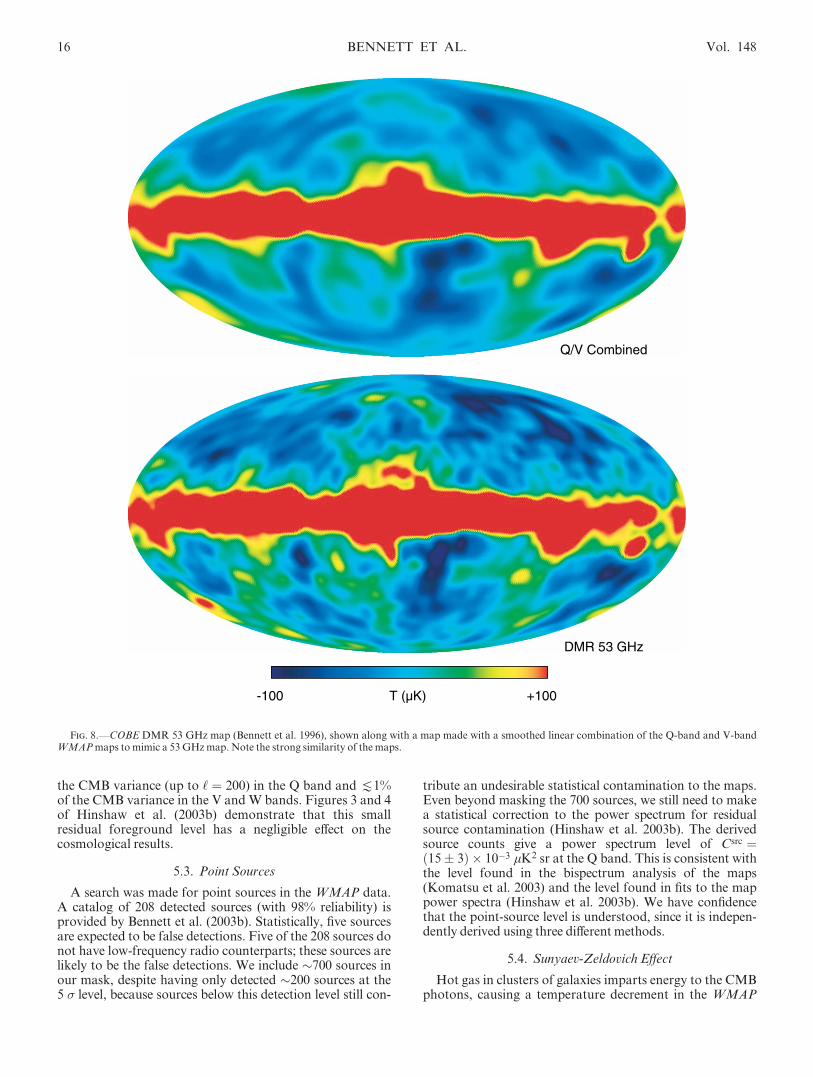
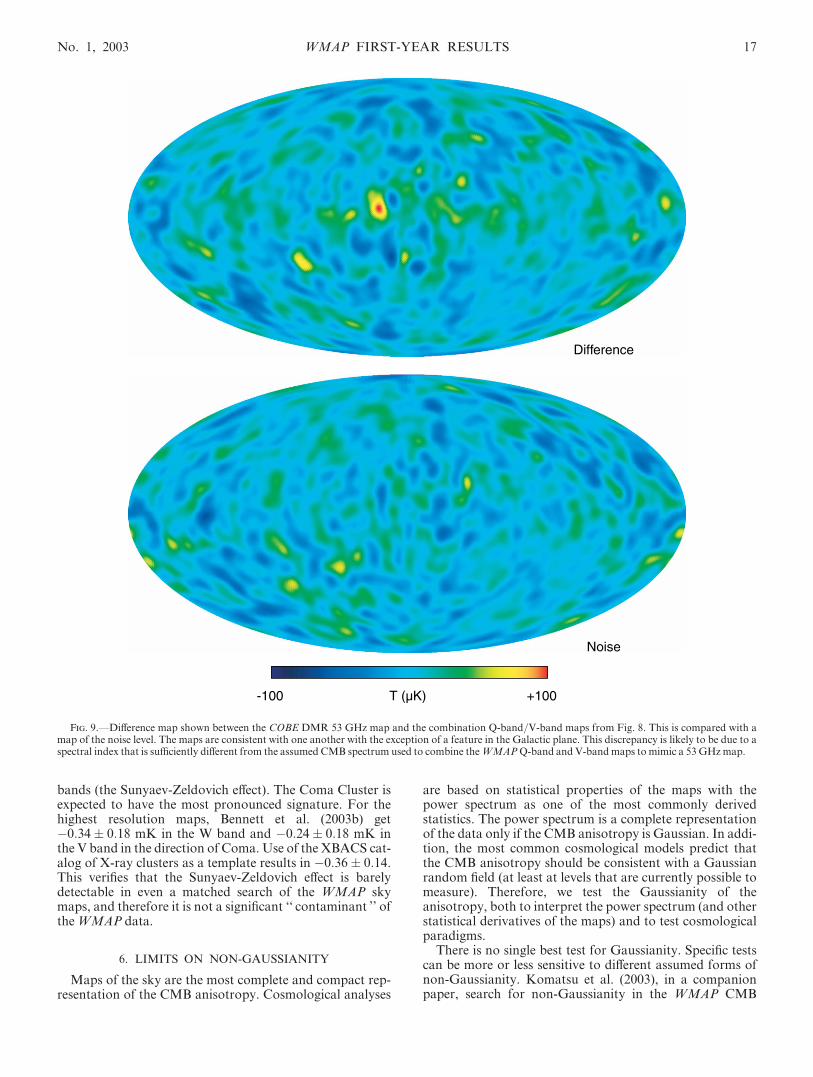
Comparisons of data between WMAP radiometers, andbetween WMAP and COBE, are important indicators ofsystematic error levels. Figure 7 illustrates the enormousimprovement in angular resolution from COBE toWMAP.Features in the maps appear to be generally consistent, butthe consistency is better addressed by a more direct compar-ison. To do this we take a combination of the WMAP Q-band and V-band maps and smooth it to mimic a COBEDifferential Microwave Radiometer (DMR) 53 GHz map(see Fig. 8). We then examine the difference between theCOBE map and WMAP pseudomap. Figure 9 shows thedifference map along with a simulated map of the noise.With the exception of a feature in the Galactic plane, theagreement is clearly at the noise level. The Galactic planefeature is likely to be a result of the spectral index uncer-tainty of combining the Q-band and V-band maps to makea 53 GHz equivalent map.
5. FOREGROUND ANALYSES
An understanding of diffuse Galactic emission and extra-galactic point sources is necessary for CMB analyses. TheWMAP mission carries radiometers at five frequencies forthe purpose of separating the CMB anisotropy from fore-ground emission based on their different spectra. Figure 10illustrates the spectral difference between the CMB and fore-grounds. The WMAP bands were selected to be near thefrequency at which the ratio of the CMB anisotropy to thecontaminating foreground is at a maximum.
5.1. Masks
For CMB analyses it is necessary to mask out regions ofbright foreground emission. Bennett et al. (2003b) present arecipe for foreground masks based on K-band temperaturelevels. Since foreground contamination is most severe in theK-band, it is used as the best tracer of contamination. Thecontamination morphology is similar enough across all fiveWMAP bands that masks based on the temperature levelsin other bands would be redundant and unnecessary. Stan-dard names are given for the mask levels. For example, theKp0 mask cuts 21.4% of sky pixels, while the Kp2 mask cuts13.1%. See Bennett et al. (2003b) for further detail. Anextragalactic point-source mask is also constructed basedon selections from source catalogs. An additional 2% of pix-els are masked because of these�700 sources.
5.2. Diffuse Galactic Emission
Beyond the use of masks, one technique for reducing thelevel of foreground contamination is to form a linear combi-nation of the multifrequencyWMAP data that retains unityresponse for only the emission component with a CMBspectrum. This technique was introduced for COBE byBennett et al. (1992). With fiveWMAP bands instead of thethree on COBE, and with a somewhat more elaborateapproach for WMAP, Bennett et al. (2003b) arrive at theinternal (WMAP data only) linear combination map seen in11 See http://www.eso.org/science/healpix.
WMAP FIRST-YEAR RESULTS 5
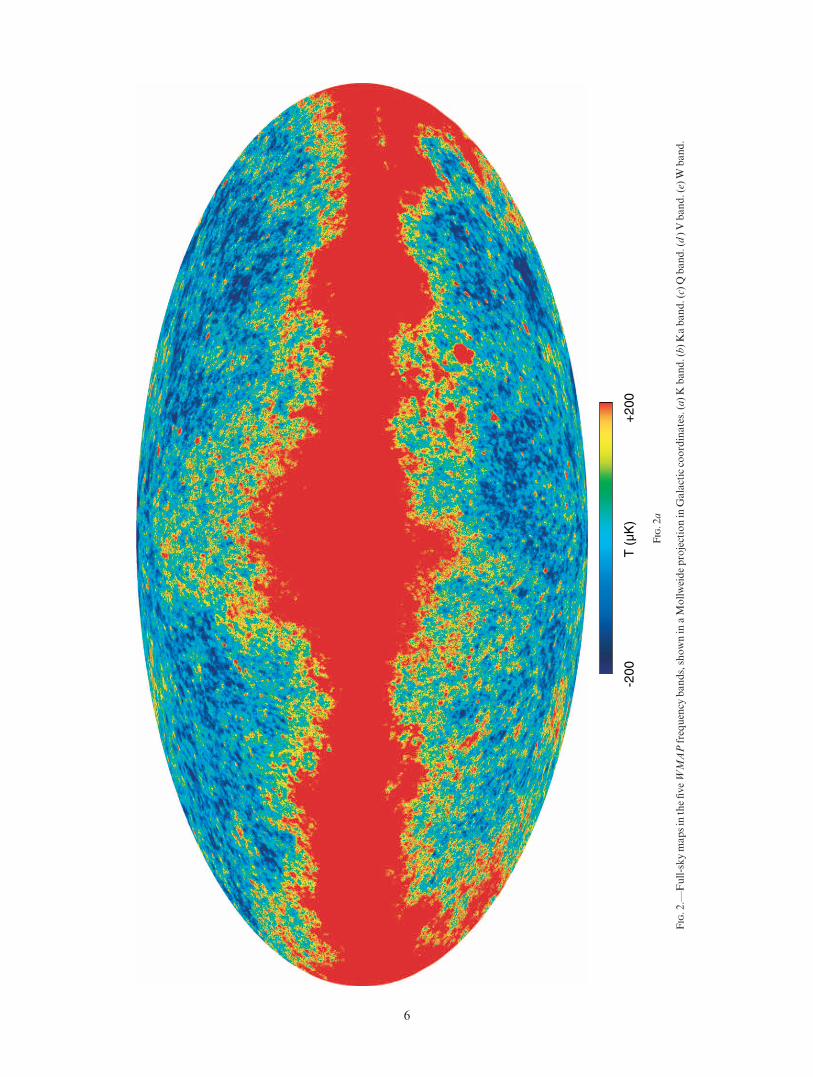
Fig.2a
Fig.2.—
Full-skymapsin
thefiveWMAPfrequency
bands,shownin
aMollweideprojectionin
Galacticcoordinates.(a)K
band.(b)Kaband.(c)Qband.(d)Vband.(e)W
band.
6
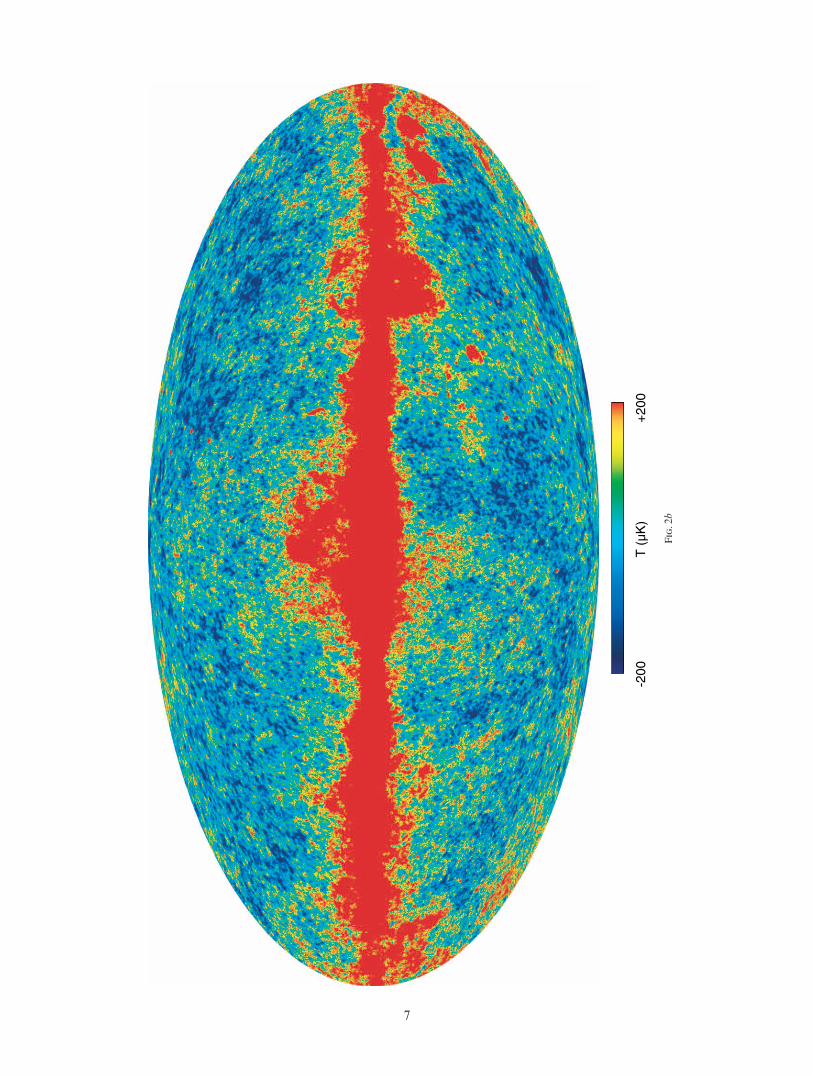
Fig.2b
7
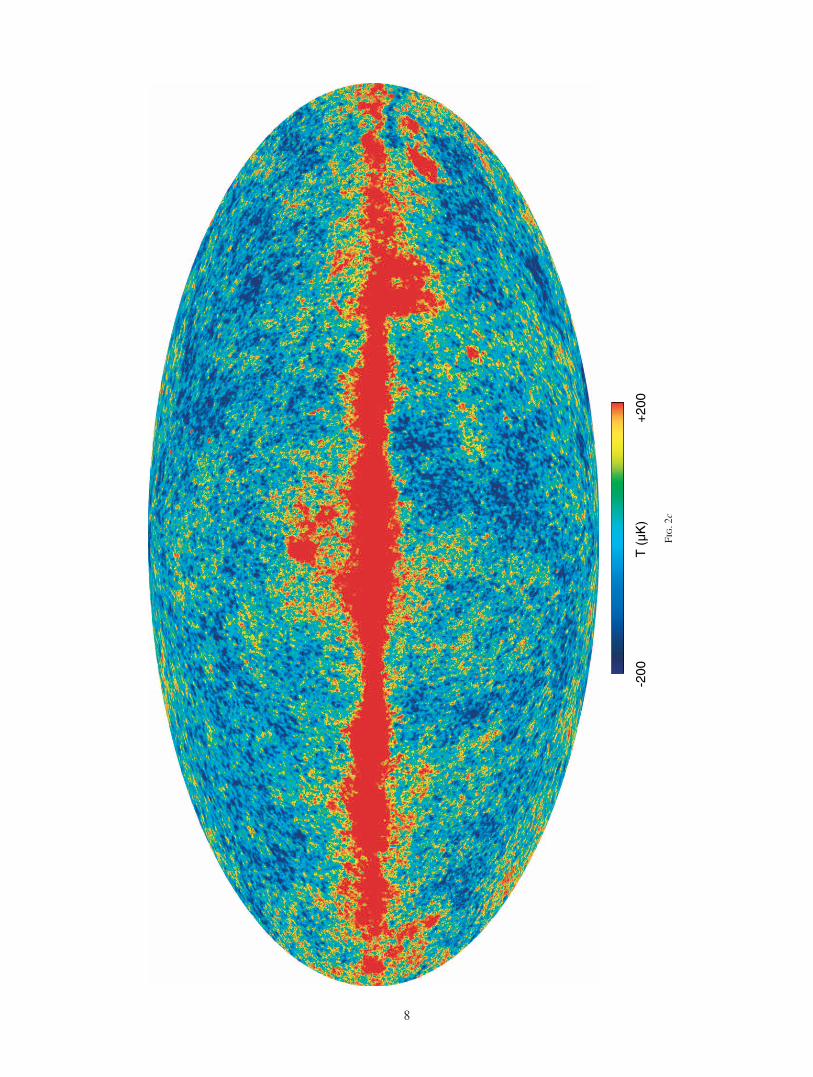
Fig.2c
8
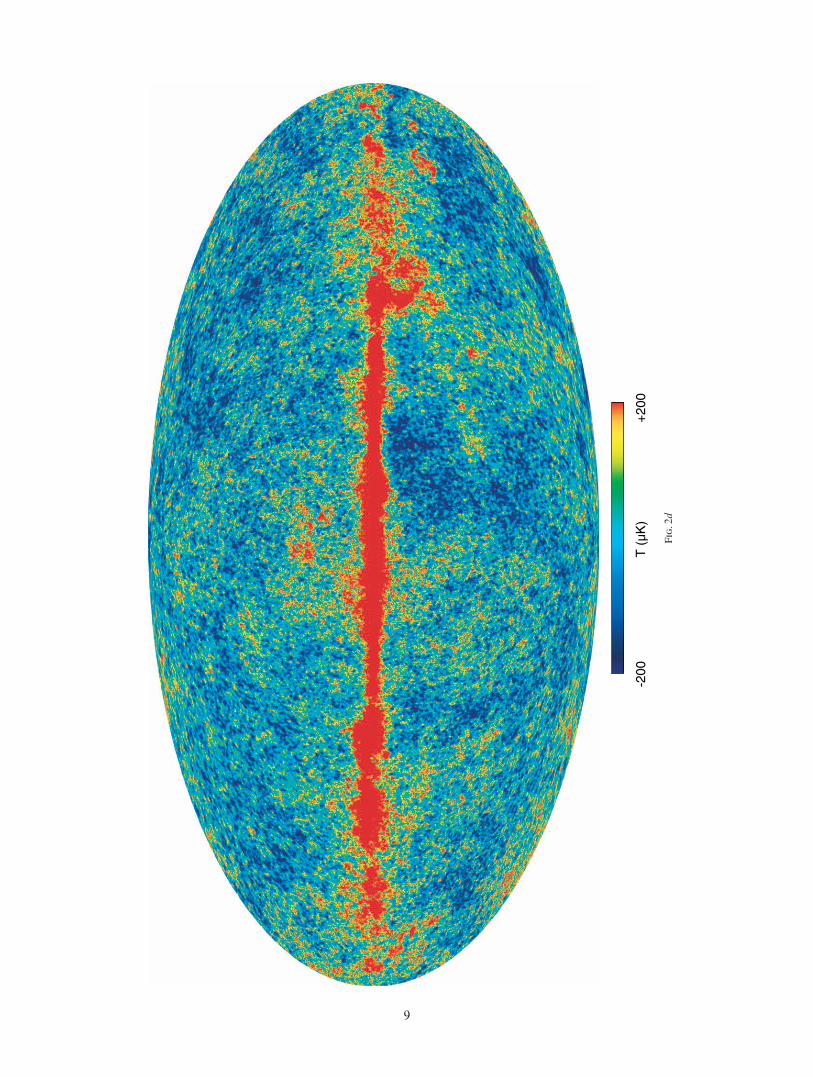
Fig.2d
9

Fig.2e

Figure 11 of this paper. The foregrounds are removed to aremarkable degree; however, the statistics of this internallinear combination map are complex and inappropriate formost CMB analyses.
Below, we use the notation convention that flux density isS � �� and antenna temperature is TA � ��, where thespectral indexes are related by � ¼ �� 2. In general, theCMB is expressed in terms of thermodynamic temperature,while Galactic and extragalactic foregrounds are expressedin antenna temperature. Thermodynamic temperature dif-ferences are given by DT ¼ DTA½ðex � 1Þ2=x2ex�, wherex ¼ h�=kT0, h is the Planck constant, � is frequency, k is theBoltzmann constant, and T0 ¼ 2:725 K is the CMB temper-ature (Mather et al. 1999). Values of DT=DTA for theWMAP bands are given by Jarosik et al. (2003b) and can befound in Table 1.
Bennett et al. (2003b) identify the amplitudes and spectralindexes of the individual emission components. A maximumentropy method (MEM) approach is adopted in which priorsare used for component amplitudes and spectral indexes,except for free-free emission, which has a fixed spectral index(� ¼ �2:15 in the WMAP bands). An iterative fit is per-formed, in which the pixel-by-pixel amplitudes are updated
in accordance with the MEM residuals until low (<1%)residuals are achieved. The process results in a map of eachemission component for each of the five WMAP bands. Thederived maps of thermal emission from dust give a uniformspectral index across the sky of �d � 2:2. The derived map offree-free emission is reasonable given the amplitude andmor-phology ofH�measurements. The other radio component fitshould include the combined emission of synchrotron andspinning dust. It shows the synchrotron spectrum steepeningwith increasing frequency, as would be expected for a spectralbreak due to synchrotron losses at �20 GHz. There is noindication of the less steep or flattening spectral index thatwould result from spinning dust emission. The spinning dustemission is limited to less than 5% of the total Ka-band fore-ground. Reports of dust-correlatedmicrowave emission fromCOBE data analyses are understood as an admixture of thefraction of synchrotron emission (with � � �3) that is tracedby a dust template and thermal dust emission (� � 2:2), giv-ing a combined spectral index of � � �2:2 between theWMAP Ka band and V band, approximating the COBE 31and 53GHz bands.
While the MEM is useful for understanding the natureof the foreground emission components, these results
Fig. 3.—Number of independent observations per pixel in Galactic coordinates. The number of observations is greatest at the ecliptic poles and in ringsaround the ecliptic poles with diameters corresponding to the separation angle of the two optical boresight directions (approximately 141�). The observationsare the most sparse in the ecliptic plane. Small area cuts are apparent where Mars, Saturn, Jupiter, Uranus, and Neptune data are masked so as not tocontaminate CMB analyses. Jupiter data are used for beammapping. The histogram of the sky sampling shows the departures from uniform sky coverage.
WMAP FIRST-YEAR RESULTS 11
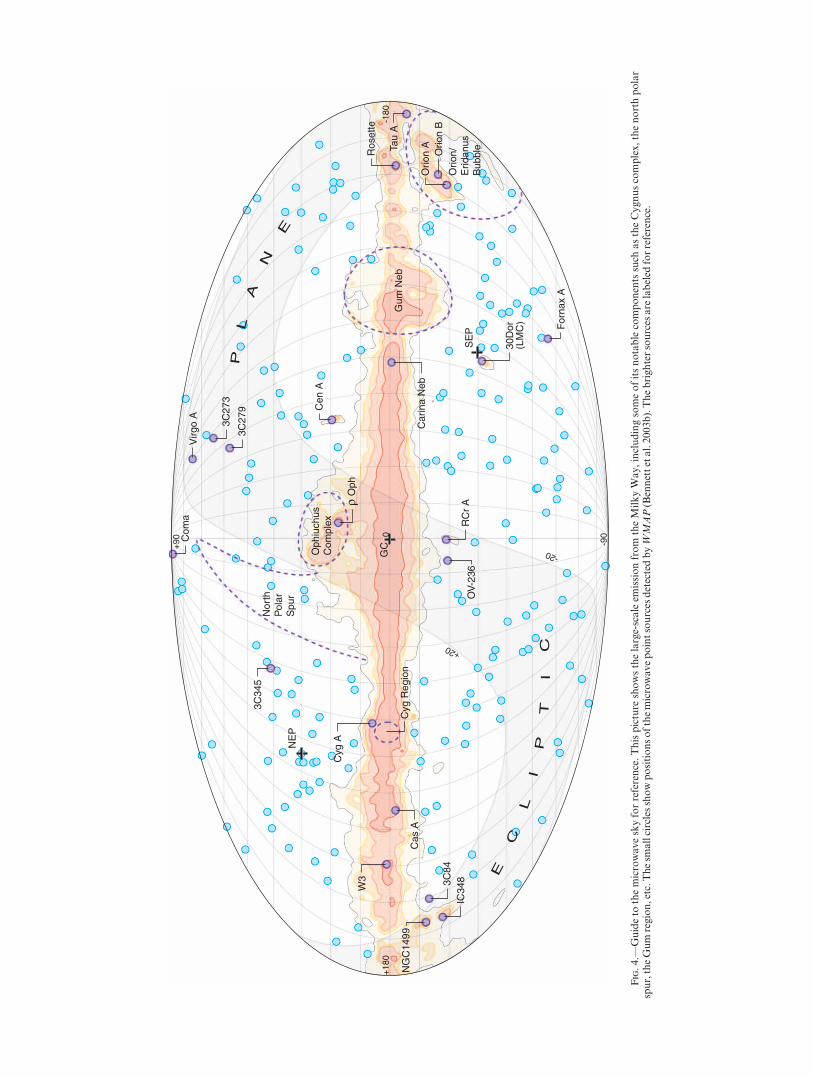
Fig.4.—
Guideto
themicrowaveskyforreference.Thispicture
showsthelarge-scaleem
issionfrom
theMilkyWay,includingsomeofitsnotablecomponentssuch
astheCygnuscomplex,thenorthpolar
spur,theGum
region,etc.T
hesm
allcircles
showpositionsofthemicrowavepointsources
detectedbyWMAP(Bennettetal.2003b
).Thebrigh
tersources
are
labeled
forreference.

cannot be directly used in CMB analyses because of thecomplex noise properties that result from the MEM pro-cess and its simultaneous use of multifrequency maps.This is because the multifrequency maps are smoothed,different weights are used in different regions of the sky,and these weights are smoothed, all of which complicatethe noise correlations. For the CMB analyses we use amask to exclude pixels in which the Galactic emission isstrong, combined with template fitting (using externaldata only) in which the foregrounds can be adequatelycorrected. This approach does not complicate the noiseproperties of the maps. The Kp2 cut is used for allanalyses except for limits on non-Gaussianity and thetemperature-polarization correlation function, in whichthe more severe Kp0 cut is used.
Bennett et al. (2003b) describe the template fitting in detail.Thermal dust emission has been mapped over the full sky inseveral infrared bands, most notably by theCOBE and IRASmissions. A full-sky template is provided by Schlegel,Finkbeiner, & Davis (1998) and is extrapolated in frequencyby Finkbeiner, Davis, & Schlegel (1999). Themostly synchro-tron emissionmap of Haslam et al. (1981) at 408MHz is usedas a radio template. The free-free ionized gas is traced by theH�map assembled by Finkbeiner (2003) from theWisconsinH-Alpha Mapper, the Virginia Tech Spectral-Line Survey,and the Southern H-Alpha Sky Survey Atlas (Dennison,Simonetti, & Topasna 1998; L. M. Haffner et al. 2003, inpreparation; Reynolds, Haffner, &Madsen 2002; Gaustad etal. 2001). TheHaslammap resolution is not as high as that ofthe WMAP maps, and the Haslam map has artifacts from
Fig. 5.—Comparison of the K-band map with the Ka-band map smoothed to K-band resolution, both in thermodynamic temperature, showing thedramatic reduction of Galactic contamination with increased frequency. The comparison also shows the similarity of the CMB fluctuation features at highGalactic latitude.
WMAP FIRST-YEAR RESULTS 13
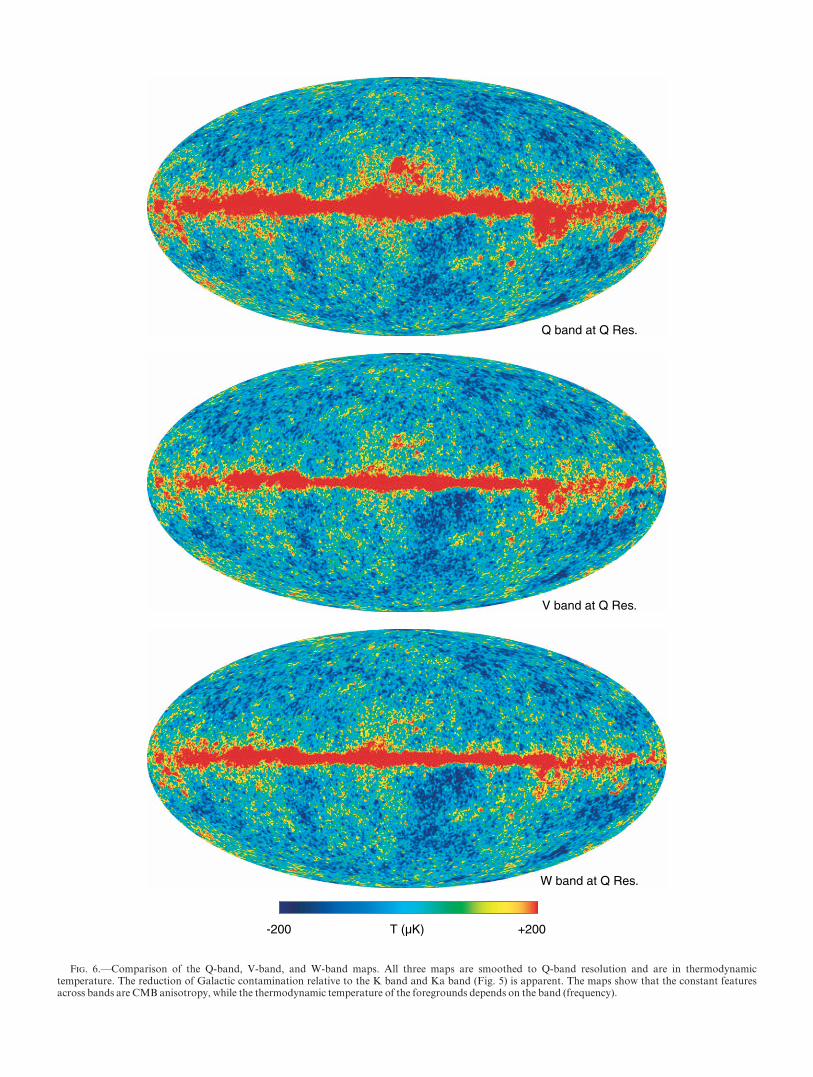
Fig. 6.—Comparison of the Q-band, V-band, and W-band maps. All three maps are smoothed to Q-band resolution and are in thermodynamictemperature. The reduction of Galactic contamination relative to the K band and Ka band (Fig. 5) is apparent. The maps show that the constant featuresacross bands are CMB anisotropy, while the thermodynamic temperature of the foregrounds depends on the band (frequency).
experimental effects such as striping from spatial calibrationvariations. The striping in the Haslam map is along the sur-vey scan lines and was corrected to first order by the applica-tion of a Wiener filter. (The filtered version of the Haslammap is publicly available on the Legacy Archive for Micro-wave Background Data Analysis [LAMBDA]Web site.) Theremaining adverse effects of the Haslam map are mitigatedby two effects: First, the template fit calls for only a smallHaslam correlation (see x 6 of Bennett et al. 2003b). Since thecorrection is small, the error on the correction is negligible.Second, the foreground contamination is most significant
only on the largest angular scales, so the Haslam resolutionlimit and small-scale map artifacts are not significant sourcesof error. The MEM solution only uses the Haslam map as aprior, and the spinning dust limit only uses the full-skymedian of the Haslam map. Thus, the spinning dust limit isinsensitive to residual striping in theHaslammap.
The MEM results are used to assess the degree of fore-ground emission remaining after the template subtraction.The result is less than 7 lK rms at the Q band and less than 3lK rms at both the V band and the W band for ‘ < 15. Thisremaining foreground emission constitutes less than 2% of
Fig. 7.—Comparison of the COBE 53 GHz map (Bennett et al. 1996) with the W-bandWMAP map. The WMAP map has 30 times finer resolution thantheCOBEmap.
WMAP FIRST-YEAR RESULTS 15
the CMB variance (up to ‘ ¼ 200) in the Q band and d1%of the CMB variance in the V andW bands. Figures 3 and 4of Hinshaw et al. (2003b) demonstrate that this smallresidual foreground level has a negligible effect on thecosmological results.
5.3. Point Sources
A search was made for point sources in the WMAP data.A catalog of 208 detected sources (with 98% reliability) isprovided by Bennett et al. (2003b). Statistically, five sourcesare expected to be false detections. Five of the 208 sources donot have low-frequency radio counterparts; these sources arelikely to be the false detections. We include �700 sources inour mask, despite having only detected �200 sources at the5 � level, because sources below this detection level still con-
tribute an undesirable statistical contamination to the maps.Even beyond masking the 700 sources, we still need to makea statistical correction to the power spectrum for residualsource contamination (Hinshaw et al. 2003b). The derivedsource counts give a power spectrum level of Csrc ¼ð15� 3Þ � 10�3 lK2 sr at the Q band. This is consistent withthe level found in the bispectrum analysis of the maps(Komatsu et al. 2003) and the level found in fits to the mappower spectra (Hinshaw et al. 2003b). We have confidencethat the point-source level is understood, since it is indepen-dently derived using three different methods.
5.4. Sunyaev-Zeldovich Effect
Hot gas in clusters of galaxies imparts energy to the CMBphotons, causing a temperature decrement in the WMAP
Fig. 8.—COBE DMR 53 GHz map (Bennett et al. 1996), shown along with a map made with a smoothed linear combination of the Q-band and V-bandWMAPmaps to mimic a 53GHzmap. Note the strong similarity of the maps.
16 BENNETT ET AL. Vol. 148
bands (the Sunyaev-Zeldovich effect). The Coma Cluster isexpected to have the most pronounced signature. For thehighest resolution maps, Bennett et al. (2003b) get�0:34� 0:18 mK in the W band and �0:24� 0:18 mK inthe V band in the direction of Coma. Use of the XBACS cat-alog of X-ray clusters as a template results in �0:36� 0:14.This verifies that the Sunyaev-Zeldovich effect is barelydetectable in even a matched search of the WMAP skymaps, and therefore it is not a significant ‘‘ contaminant ’’ oftheWMAP data.
6. LIMITS ON NON-GAUSSIANITY
Maps of the sky are the most complete and compact rep-resentation of the CMB anisotropy. Cosmological analyses
are based on statistical properties of the maps with thepower spectrum as one of the most commonly derivedstatistics. The power spectrum is a complete representationof the data only if the CMB anisotropy is Gaussian. In addi-tion, the most common cosmological models predict thatthe CMB anisotropy should be consistent with a Gaussianrandom field (at least at levels that are currently possible tomeasure). Therefore, we test the Gaussianity of theanisotropy, both to interpret the power spectrum (and otherstatistical derivatives of the maps) and to test cosmologicalparadigms.
There is no single best test for Gaussianity. Specific testscan be more or less sensitive to different assumed forms ofnon-Gaussianity. Komatsu et al. (2003), in a companionpaper, search for non-Gaussianity in the WMAP CMB
Fig. 9.—Difference map shown between the COBE DMR 53 GHz map and the combination Q-band/V-band maps from Fig. 8. This is compared with amap of the noise level. The maps are consistent with one another with the exception of a feature in the Galactic plane. This discrepancy is likely to be due to aspectral index that is sufficiently different from the assumed CMB spectrum used to combine theWMAPQ-band and V-bandmaps to mimic a 53GHzmap.
No. 1, 2003 WMAP FIRST-YEAR RESULTS 17

anisotropy maps using Minkowski functionals and abispectrum estimator.
Minkowski functionals (Minkowski 1903; Gott et al.1990) quantify topological aspects of the CMB maps.Anisotropy is examined via contours at different temper-ature levels, and the number and areas of regionsenclosed by these contours are computed. ThreeMinkowski functionals are the area represented by hotand cold spots, the contour length around these areas,and the difference between the number of these areas(the ‘‘ genus ’’).
It is widely believed that the CMB anisotropy arises fromGaussian linear fluctuations in the gravitational potential.Komatsu & Spergel (2001) suggest that non-Gaussiananisotropy be considered in terms of the curvature pertur-bation. The simplest expression for the overall primordialgravitational curvature perturbation, �ðxÞ, is a sum of a
linear �LðxÞ and weak nonlinear components: �ðxÞ ¼�LðxÞ þ fNL½�2
LðxÞ � h�LðxÞi2�, where �L is the linearGaussian portion of the curvature perturbation and fNL is anonlinear coupling constant. Then, fNL ¼ 0 corresponds tothe purely linear Gaussian case. Since the CMB bispectrummeasures the phase correlations of the anisotropy, it can beused to solve for fNL. The Minkowski functional results canalso be expressed in terms of fNL.
For the Minkowski functionals, Komatsu et al. (2003)find fNL < 139 (95% confidence level [CL]). From the bi-spectrum, Komatsu et al. (2003) find �58 < fNL < 134(95% CL). The two results are consistent. The CMB aniso-tropy is thus demonstrated to follow Gaussian statistics.This is a significant result for models of the early universe. Italso means that we can construct and interpret CMB statis-tics (e.g., the angular power spectrum) from the maps in astraightforward manner.
Fig. 10.—False-color images representing the spectral information from multiple WMAP bands. Q band is red, V band is green, and W band is blue.A CMB thermodynamic spectrum is gray. Top: Three-color combination image from the Q, V, and W-band maps. The dipole and high Galactic latitudeanisotropy are seen.Bottom: Similar false-color image but with the dipole subtracted.
18 BENNETT ET AL.
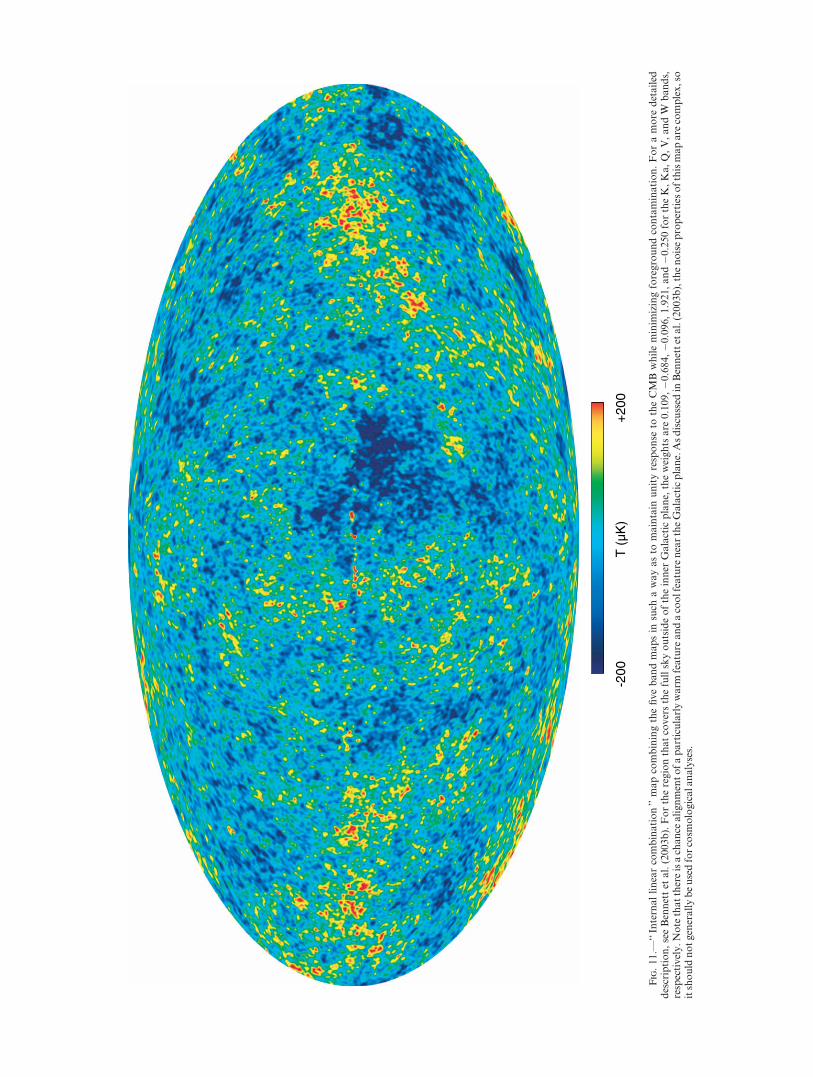
Fig.11.—
‘‘Internallinearcombination’’mapcombiningthefivebandmapsin
such
awayasto
maintain
unityresponse
totheCMBwhileminim
izingforegroundcontamination.Foramore
detailed
description,seeBennettet
al.(2003b).Fortheregionthatcoversthefullskyoutsideoftheinner
Galacticplane,theweightsare
0.109,
�0.684,
�0.096,
1.921,
and�0.250fortheK,Ka,Q,V,andW
bands,
respectively.N
otethatthereisachance
alignmentofaparticularlywarm
feature
andacoolfeature
neartheGalacticplane.Asdiscussed
inBennettetal.(2003b
),thenoiseproperties
ofthismapare
complex,so
itshould
notgenerallybeusedforcosm
ologicalanalyses.
7. MULTIPOLES
The temperature anisotropy TðnÞ is naturally expandedin a spherical harmonic basisY‘m as
TðnÞ ¼X‘;m
a‘mY‘mðnÞ : ð1Þ
The angular power spectrum C‘ is a cosmological ensembleaverage given by
C‘ ¼�a‘mj j2
�ð2Þ
and is observed for our actual sky as
Csky‘ ¼ 1
2‘þ 1
Xm
a‘mj j2 : ð3Þ
Assuming random phases, the temperature anisotropy foreach multipole moment, DT‘, can be associated with theangular spectrumC‘ as
DT‘ ¼
ffiffiffiffiffiffiffiffiffiffiffiffiffiffiffiffiffiffiffiffiffiffiffiffiffiCsky
‘ ‘ð‘þ 1Þ2�
sð4Þ
The correlation function is
Cð�Þ ¼ 1
4�
X‘
Xþ‘
m¼�‘
C‘P‘ cos �ð Þ ð5Þ
¼ 1
4�
X‘
2‘þ 1ð ÞC‘P‘ cos �ð Þ ; ð6Þ
where P‘ is the Legendre polynomial of the order of ‘.In practice, an instrument adds noise and spatially filters
the sky signal due to the beam pattern and any other experi-mental limitations on the sampling of all angular scales. Theexperimental transfer function b‘ for each multipolemoment depends on the specific beam pattern of the experi-ment.WMAP samples all angular scales limited only by thebeam pattern. The window function for the signal powerbetween channels i and j is
wij‘ ¼ bi‘b
j‘p
2‘ ; ð7Þ
where p2‘ is the pixel window function. The angular powerspectrum then becomes
C‘ ¼ Cij‘ b
i‘b
j‘p
2‘ þNi
‘ij ; ð8Þ
where Ni‘ is the power spectrum noise that results from the
instrument noise, which is assumed to be uncorrelatedbetween channels i and j.
Note that an autopower spectrum has twice the noisevariance of a cross-power spectrum with the correspondingnoise in each map. This follows from the property ofGaussian noise that
hðNi‘Þ
2ðNj‘Þ
2i ¼ 2hðNi‘Þ
2i2ij þ hðNi‘Þ
2ihðNj‘Þ
2i ;
with
hNi‘N
j‘i
2 ¼ hðNi‘Þ
2i2ij and hðNi‘Þ
4i ¼ 3hðNi‘Þ
2i2 :
The use of a sky mask for foreground suppression breaksthe orthogonality of the spherical harmonics on the sky andleads to mode coupling. Hinshaw et al. (2003b) discuss howWMAP handles this, and other complexities.
7.1. ‘ ¼ 1Dipole
COBE determined the dipole amplitude is 3:353� 0:024mK in the direction
ðl; bÞ ¼ ð264=26� 0=33; 48=22� 0=13Þ ;
where l is Galactic longitude and b is Galactic latitude(Bennett et al. 1996). This dipole was subtracted from theWMAP data during processing. Examination of theWMAP maps allows for the determination of a residualdipole, and thus an improvement over the COBE value.Note that this does not have any effect on WMAP calibra-tion, which is based on the Earth’s velocity modulationof the dipole and not on the dipole itself. The WMAP-determined dipole is 3:346� 0:017 mK in the directionðl; bÞ ¼ ð263=85� 0=1; 48=25� 0=04Þ. The uncertainty ofthe dipole amplitude is limited by the WMAP 0.5%calibration uncertainty, which will improve with time.
7.2. ‘ ¼ 2Quadrupole
The quadrupole is the ‘ ¼ 2 term of the spectrumDT2
‘ ¼ ‘ð‘þ 1ÞC‘=2�, i.e., DT2‘¼2 ¼ ð3=�ÞC‘¼2. Alternately,
the quadrupole amplitude can be expressed as Qrms ¼½ð5=4�ÞC‘¼2�1=2 ¼ 5=12ð Þ1=2DT‘¼2. The 4 year COBE quad-rupole is Qrms ¼ 10þ7
�4 lK, with the peak of the likelihood inthe range 6:9 lK < Qrms < 10 lK, as shown in Figure 1 ofHinshaw et al. (1996b).
The WMAP quadrupole, Qrms ¼ 8� 2 lK or DT22 ¼
154� 70 lK2, is consistent with COBE but with tighterlimits because of better measurements and understandingof foregrounds. We determine the quadrupole value bycomputing the power spectrum of the internal linear combi-nation map and individual channel maps, with and withoutforeground corrections, for a range of Galactic cuts. Thefinal ‘ ¼ 2 value corresponds to a full-sky estimate with anuncertainty that encompasses a range of foreground-masked or foreground-corrected solutions. The foregroundlevel is still the leading uncertainty. (The small kinematicquadrupole is neither removed from the maps noraccounted for in this analysis.) The quadrupole value is lowcompared to values predicted by �-dominated cold darkmatter (�CDM) models that fit the rest of the power spec-trum. �CDM models, in particular, tend to predict rela-tively high quadrupole values due to the enhanced,�-driven, integrated Sachs-Wolfe effect.
7.3. n-Poles
A central part of the task of computing multipole infor-mation from the maps is the evaluation and propagation oferrors and uncertainties. This largely involves arriving at anadequate representation of the Fisher matrix, which is theinverse covariance matrix of the data. The Fisher matrixmust take into account mode coupling from the sky cut,beam (window function) uncertainties, and noise properties.The fact that theWMAP data use a nearly azimuthally sym-metric cut and have a nearly diagonal pixel-pixel covariancegreatly simplifies the evaluation of the Fisher matrix.
Two approaches to computing the angular power spec-trum have been used by Hinshaw et al. (2003b): a quadraticestimation based on Hivon et al. (2002) and a maximumlikelihood estimate based on Oh, Spergel, & Hinshaw(1999). The quadratic estimator is used in the final WMAP
20 BENNETT ET AL. Vol. 148
spectrum analyses, while the maximum likelihood techniqueis used as a cross-check.
The K-band and Ka-band beam sizes are large enoughthat these bands are not used for CMB analysis, since theyhave the most foreground contamination and probe theregion in ‘-space that is cosmic-variance–limited by themeasurements at the other bands. These bands are invalu-able, however, as monitors of Galactic emission. The twoQ-band, two V-band, and four W-band differencing assem-blies are the source of the prime CMB data. The matrix ofauto- and cross-correlations between the eight Q, V, andW-band differencing assemblies has eight diagonal (auto-correlations) and 28 unique off-diagonal elements (cross-correlations). Since autocorrelations are difficult to assessbecause of the noise bias (see eq. [8]), we included only the28 unique cross-correlations in theWMAP power spectrumanalysis. In dropping the autocorrelations, each of whichhas twice the noise variance of a cross-correlation, we loseonly 1� 56=ð56þ 8Þ½ �1=2¼ 6% of the ideally achievable sig-nal-to-noise ratio. In Hinshaw et al. (2003b), we show thatthe power spectrum computed from the autocorrelationdata is consistent with the angular power spectrum from thecross-correlation data. We anticipate using the autocorrela-tion data in future analyses.
The cross-power spectrum from the 28 pairs is consideredin four ‘-ranges. For ‘ � 100 we use uniform pixel weightingof only V- andW-band data. This reduces the Galactic con-tamination where measurement errors are well below thecosmic variance. For 100 < ‘ � 200 we use uniform pixelweighting of the combined 28 pairs. For 200 < ‘ � 450 all28 cross-power pairs are used with a transitional pixelweighting. The transitional pixel weighting, defined and dis-cussed in detail in Appendix A of Hinshaw et al. (2003b),smoothly transitions the weighting from the uniform pixelweights in the signal-dominated ‘ < 200 multipole regimeto inverse noise variance weighting in the noise-dominated‘ > 450 multipole regime. For ‘ > 450 all 28 pairs are usedwith inverse noise weighting. Our Monte Carlo simulationsshow that this approach is a nearly optimal scheme.
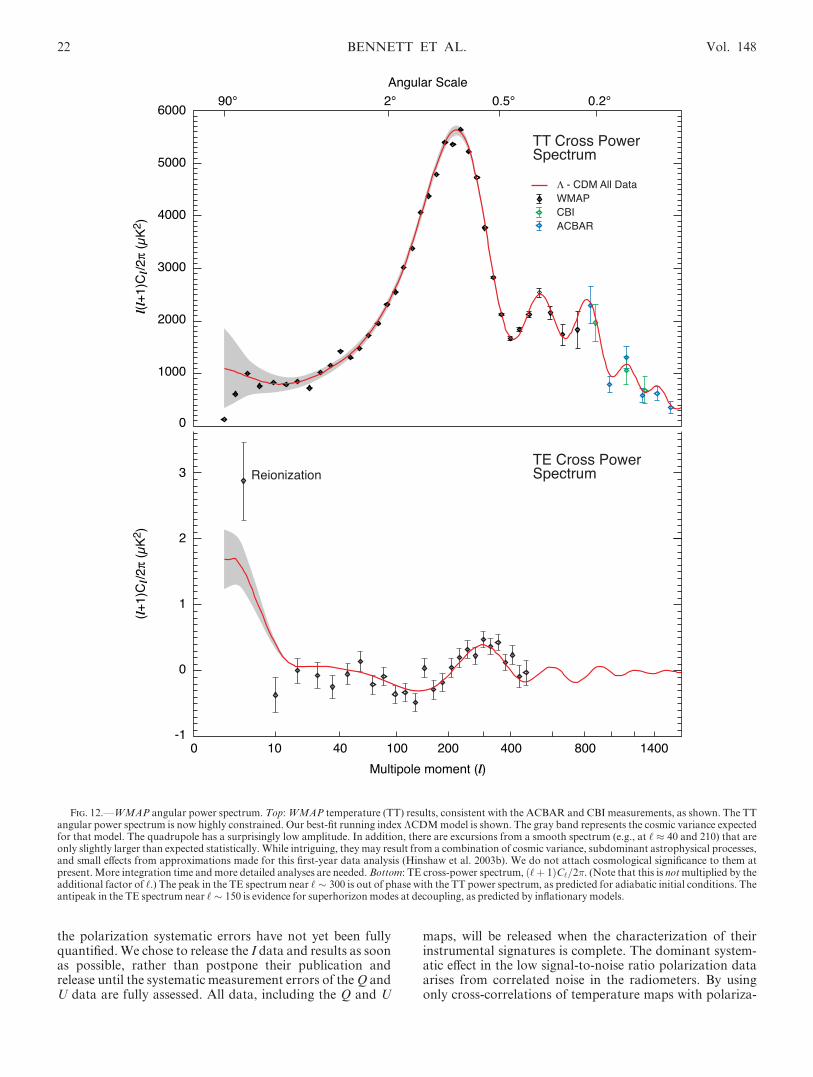
The angular power spectrum is shown for the WMAPdata in Figure 12. The WMAP power spectrum agreesclosely with COBE at the largest angular scales, and withthe Cosmic Background Imager (CBI) and the ArcminuteCosmology Bolometer Array Receiver (ACBAR) at thefiner angular scales. We highlight the CBI and ACBARresults because they are a useful complement to WMAP atthe smaller angular scales. The acoustic pattern is obvious.Page et al. (2003c) find that the first acoustic peak isDT‘ ¼ 74:7� 0:5 lK at ‘ ¼ 220:1� 0:8. The trough follow-ing this peak is 41:0� 0:5 lK at ‘ ¼ 411:7� 3:5, and thesecond peak is 48:8� 0:9 lK at ‘ ¼ 546� 10.
�CDM models predict enhanced large-angle power dueto the integrated Sachs-Wolfe effect. The WMAP andCOBE data, on the other hand, have the opposite trend.The conflict is also seen clearly in the correlation functionCð�Þ shown in Figure 13. The WMAP correlation functionis computed using the Kp0 cut on a combination of the Q-band, V-band, and W-band maps with the MEM Galacticmodel removed. The COBE correlation function is com-puted on the ‘‘ custom cut ’’ sky (Bennett et al. 1996). Thebest-fit �CDM model is shown with a gray band indicating1 � as determined byMonte Carlo simulations.
The lower two plots in Figure 13 display the correlationfunction of the difference between the COBE DMR and
WMAPmapswith a jbj ¼ 10� Galactic plane cut. A synthesisof the WMAP Q- and V-band maps was made to approxi-mate a 53 GHz map to compare with the COBE DMR 53GHz map. The COBE DMR 90 GHz map is compareddirectly, without corrections, to the WMAP W-band map.These plots emphasize the consistency of the WMAP andCOBE measurements. The slightly higher than expecteddeviations at 53GHz are likely to be due toGalactic contami-nation, arising from outside the cut regions and from theconstruction of the synthesizedWMAP 53GHzmap.
The model is an excellent fit to the WMAP full powerspectrum except, perhaps, at ‘d6. Since only a small frac-tion of the total number of measured multipoles areinvolved, the statistical contribution of the ‘d6 points tothe overall power spectrum fit is small and does not greatlydrive the overall best-fit model. The correlation functionemphasizes the low-‘ signal because these modes contributeto Cð�Þ at all angular separations. The discrepancy at�d30� reflects the average lack of power in the data relativeto the model at ‘ < 6. More significantly, the lack of powerat �e60� relative to the model reflects the special shape ofthe power spectrum from 2 < ‘ < 5 seen in both theWMAPand COBE maps. This result is generically true for �CDMmodels, independent of the exact parameters of the model.There is very little large-scale CMB anisotropy power in oursky. This fact, first seen by COBE, is confirmed by WMAP.The probability of so little Cð� > 60�Þ anisotropy power is�2� 10�3, given the best-fit �CDM model. The lack ofpower is seen in bothCð�Þ and the behavior of the low-order(‘ ¼ 2, 3, 4, and 5) multipoles.
8. CMB POLARIZATION AND THE DETECTIONOF REIONIZATION
Each differencing assembly measures the sky in twoorthogonal linear polarizations. As the observatory spins,precesses, and orbits the Sun, the instrument observes thesky over a range of polarization angles. The range of anglesobserved is neither complete nor uniform, but it is sufficientto provide valuable new CMB polarization results.
We express polarization in terms of the standard I,Q, andU Stokes parameters, in units of thermodynamic tem-perature. Polarization coordinates are not rotationallyinvariant, so a coordinate system is defined by Kogut et al.(2003) for expressing information. By appropriate summingand differencing of the TOD from the pairs of correspond-ing radiometers, we iteratively make maps in unpolarizedintensity I and in each polarized component, Q and U(Hinshaw et al. 2003b). The Q and U maps not only have amuch lower signal-to-noise ratio than the I maps, but theyare more susceptible to systematic errors, since the differ-encing between radiometer outputs occurs on the ground,not in the front end of the radiometers.
The U polarization maps are expected to be the mostaffected by systematic errors. This is due to the orientationof the observed polarization angles relative to the spin axisof the observatory, causing systematics not fixed on the skyto preferentially go into theUmap.
Taurus A, an extremely strong source in the WMAPbands, is polarized, and its polarization amplitude anddirection are known (Flett & Henderson 1979). Polarizationmeasurements from WMAP are consistent with previousobservations of Taurus A, providing a useful check on theoperation of the WMAP hardware and software. However,
No. 1, 2003 WMAP FIRST-YEAR RESULTS 21
the polarization systematic errors have not yet been fullyquantified.We chose to release the I data and results as soonas possible, rather than postpone their publication andrelease until the systematic measurement errors of theQ andU data are fully assessed. All data, including the Q and U
maps, will be released when the characterization of theirinstrumental signatures is complete. The dominant system-atic effect in the low signal-to-noise ratio polarization dataarises from correlated noise in the radiometers. By usingonly cross-correlations of temperature maps with polariza-
Fig. 12.—WMAP angular power spectrum. Top:WMAP temperature (TT) results, consistent with the ACBAR and CBI measurements, as shown. The TTangular power spectrum is now highly constrained. Our best-fit running index �CDMmodel is shown. The gray band represents the cosmic variance expectedfor that model. The quadrupole has a surprisingly low amplitude. In addition, there are excursions from a smooth spectrum (e.g., at ‘ � 40 and 210) that areonly slightly larger than expected statistically. While intriguing, they may result from a combination of cosmic variance, subdominant astrophysical processes,and small effects from approximations made for this first-year data analysis (Hinshaw et al. 2003b). We do not attach cosmological significance to them atpresent.More integration time andmore detailed analyses are needed.Bottom: TE cross-power spectrum, ð‘þ 1ÞC‘=2�. (Note that this is notmultiplied by theadditional factor of ‘.) The peak in the TE spectrum near ‘ � 300 is out of phase with the TT power spectrum, as predicted for adiabatic initial conditions. Theantipeak in the TE spectrum near ‘ � 150 is evidence for superhorizonmodes at decoupling, as predicted by inflationary models.
22 BENNETT ET AL. Vol. 148

tion maps, generated from independent radiometer combi-nations that have uncorrelated noise, we mitigate the lead-ing systematic error. For this reason, results of temperature-polarization correlations between the I and Q maps, i.e.,temperature-polarization (TE) correlations, are much lesssensitive to systematic effects than polarization signalsalone, so we are able to report those results.
Figure 12 shows the TE cross-power spectrum. Kogut etal. (2003) report a detection of TE correlations on both largeangular scales (from reionization) and small scales (fromthe adiabatic fluctuations). The TE power spectrum, shownin Figure 12, is discussed in detail by Kogut et al. (2003). Inthe TE angular power spectrum, the antipeak is �35� 9lK2 at ‘ ¼ 137� 9, and the peak is 105� 18 lK2 at‘ ¼ 329� 19 (Page et al. 2003c).
The detection of the reionization of the universe corre-sponds to an optical depth � ¼ 0:17� 0:04 (0:09 � � � 0:28at 95% CL). Although WMAP measures the integratedoptical depth, the epoch and redshift of reionization can bederived from the integral optical depth within the context ofa model of the reionization process. A single instantaneousstep function in the ionization fraction from zero to a steadyfixed value is physically unlikely. For more likely models,Kogut et al. (2003) conclude that the redshift of reionizationis zr ¼ 20þ10
�9 (95% CL), corresponding to an epoch of reio-nization of tr ¼ 180þ220
�80 Myr (95% CL) after the big bang.Cen (2003) presents a detailed model of a reionization pro-cess and predicts an integral value of the optical depth,� ¼ 0:10� 0:03. This is low compared to the newly mea-sured value but would be higher and consistent if theassumed cosmological parameters in the model wereadjusted to the values of the newWMAP best-fit parameters(see x 9.1).
The measured optical depth means that reionization sup-pressed the acoustic peak amplitudes by 1� e�2� � 30%.While accounted for in our model fits (x 9), this suppressionwas not accounted for in previous CMB parameter determi-nations. The anticorrelations observed in the TE powerspectrum directly imply superhorizon fluctuations, a newresult in support of inflation-like theories, as discussed inx 9.3.
9. COSMOLOGICAL INTERPRETATION
In this section we summarize the cosmological interpreta-tion of WMAP first-year results, which are discussed inmore detail by Spergel et al. (2003), Peiris et al. (2003), Pageet al. (2003c), and Kogut et al. (2003). The methodologyused in the model fits is described by Verde et al. (2003).
Spergel et al. (2003) show that a cosmological model witha flat universe, seeded with a scale-invariant spectrum ofadiabatic Gaussian fluctuations, and with reionization is anacceptable fit not only to theWMAP data but also to a hostof astronomical data. These data are smaller angular scaleCMB anisotropy data from ACBAR (Kuo et al. 2002) andCBI (Pearson et al. 2003), the Hubble Space Telescope(HST) Key Project value of H0 (Freedman et al. 2001), theaccelerating universe seen in Type Ia supernovae (Riesset al. 2001), the shape and amplitude of the large-scale struc-ture seen in clusters and superclusters of galaxies (Percivalet al. 2001; Verde et al. 2003), and the linear matter powerspectrum seen in the Ly� forest (Croft et al. 2002). Therehas been mounting evidence in the direction of this modelfor years (Peebles 1984; Bahcall et al. 1999). The opticaldepth since reionization is a new, but not surprising, compo-nent of the model. The WMAP data establish this model asthe standard model of cosmology by testing the key assump-tions of the model and by enabling a precise determinationof its parameters.
The WMAP data test several of the key tenets of thestandard model. The WMAP detection of temperature-
Fig. 13.—Top: CMB temperature correlation function of the WMAPand COBE data. The WMAP correlation function is computed using acombination of the Q-band, V-band, and W-band maps with the Kp0 cutsky and the MEM Galactic model subtracted. The COBE correlationfunction is computed using the ‘‘ custom cut ’’ sky. The running index�CDM model that is fitted to the power spectrum is shown with a MonteCarlo–determined gray band indicating 1 �. The model is, overall, anexcellent fit to the WMAP power spectrum. However, a correlation plotemphasizes the low-‘ power. The discrepancy between the model and dataillustrates that there is surprisingly little anisotropy power in the WMAPand COBE maps at large angles. Bottom: The lower two plots display thecorrelation function of the difference between the COBE DMR andWMAP maps with a jbj ¼ 10� Galactic plane cut. A synthesis of theWMAP Q- and V-band maps was made to approximate a 53 GHz–likemap to compare with the COBEDMR 53 GHz map. The COBEDMR 90GHzmap is compared directly, without corrections, to theWMAPW-bandmap. These plots emphasize the consistency of the WMAP and COBEmeasurements. The slightly higher than expected deviations at 53 GHz arelikely to be due to Galactic contamination, arising from outside the cutregions and from the construction of the synthesizedWMAP 53GHzmap.
No. 1, 2003 WMAP FIRST-YEAR RESULTS 23
polarization correlations (Kogut et al. 2003) and the cleardetection of acoustic peaks (Page et al. 2003c) imply that theprimordial fluctuations were primarily adiabatic: theprimordial ratio of darkmatter/photons and the primordialratio of baryons/photons do not vary spatially. Theanalysis of the WMAP temperature data demonstratesGaussianity (Komatsu et al. 2003). TheWMAP data, whencombined with any one of the following three external datasets, the HST Key Project measurement of H0 (Freedmanet al. 2001), the Two-Degree Field Galaxy Redshift Survey(2dFGRS) measurement of the matter density (Percivalet al. 2001; Verde et al. 2003), or the Type Ia supernovameasurements (Riess et al. 2001), imply that the radius ofcurvature of the universe, R ¼ cH�1
0 j1� �totj�1=2, must bevery large: �tot ¼ 1:02� 0:02 and 0:99 < �tot < 1:05 (95%CL). These measurements also require that the dark energybe the dominant constituent of �tot. The WMAP dataalone rule out the standard �m ¼ 1 CDM model by morethan 7 �.
9.1. Best-Fit CosmologicalModel
While an acceptable fit, the model described above is notour best-fit model. In the discussion below we concentrate
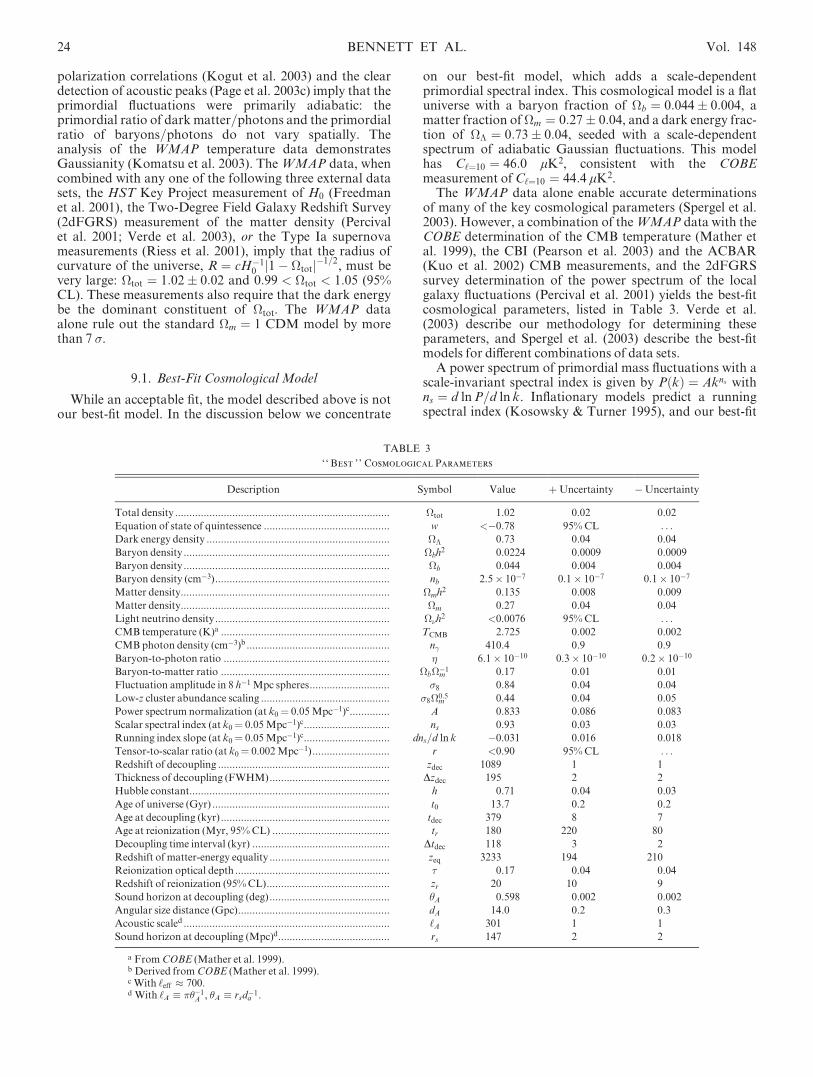
on our best-fit model, which adds a scale-dependentprimordial spectral index. This cosmological model is a flatuniverse with a baryon fraction of �b ¼ 0:044� 0:004, amatter fraction of�m ¼ 0:27� 0:04, and a dark energy frac-tion of �� ¼ 0:73� 0:04, seeded with a scale-dependentspectrum of adiabatic Gaussian fluctuations. This modelhas C‘¼10 ¼ 46:0 lK2, consistent with the COBEmeasurement ofC‘¼10 ¼ 44:4 lK2.
The WMAP data alone enable accurate determinationsof many of the key cosmological parameters (Spergel et al.2003). However, a combination of theWMAP data with theCOBE determination of the CMB temperature (Mather etal. 1999), the CBI (Pearson et al. 2003) and the ACBAR(Kuo et al. 2002) CMB measurements, and the 2dFGRSsurvey determination of the power spectrum of the localgalaxy fluctuations (Percival et al. 2001) yields the best-fitcosmological parameters, listed in Table 3. Verde et al.(2003) describe our methodology for determining theseparameters, and Spergel et al. (2003) describe the best-fitmodels for different combinations of data sets.
A power spectrum of primordial mass fluctuations with ascale-invariant spectral index is given by PðkÞ ¼ Akns withns ¼ d lnP=d ln k. Inflationary models predict a runningspectral index (Kosowsky & Turner 1995), and our best-fit
TABLE 3
‘‘ Best ’’ Cosmological Parameters
Description Symbol Value +Uncertainty �Uncertainty
Total density ........................................................................... �tot 1.02 0.02 0.02
Equation of state of quintessence ............................................ w <�0.78 95%CL . . .Dark energy density ................................................................ �� 0.73 0.04 0.04
Baryon density ........................................................................ �bh2 0.0224 0.0009 0.0009
Baryon density ........................................................................ �b 0.044 0.004 0.004
Baryon density (cm�3)............................................................. nb 2.5� 10�7 0.1� 10�7 0.1� 10�7
Matter density......................................................................... �mh2 0.135 0.008 0.009
Matter density......................................................................... �m 0.27 0.04 0.04
Light neutrino density............................................................. ��h2 <0.0076 95%CL . . .
CMB temperature (K)a ........................................................... TCMB 2.725 0.002 0.002
CMB photon density (cm�3)b .................................................. n 410.4 0.9 0.9
Baryon-to-photon ratio .......................................................... � 6.1� 10�10 0.3� 10�10 0.2� 10�10
Baryon-to-matter ratio ........................................................... �b��1m 0.17 0.01 0.01
Fluctuation amplitude in 8 h�1Mpc spheres............................ �8 0.84 0.04 0.04
Low-z cluster abundance scaling ............................................. �8�0:5m 0.44 0.04 0.05
Power spectrum normalization (at k0 = 0.05Mpc�1)c.............. A 0.833 0.086 0.083
Scalar spectral index (at k0 = 0.05Mpc�1)c.............................. ns 0.93 0.03 0.03
Running index slope (at k0 = 0.05Mpc�1)c.............................. dns=d ln k �0.031 0.016 0.018
Tensor-to-scalar ratio (at k0 = 0.002Mpc�1)........................... r <0.90 95%CL . . .
Redshift of decoupling ............................................................ zdec 1089 1 1
Thickness of decoupling (FWHM).......................................... Dzdec 195 2 2
Hubble constant...................................................................... h 0.71 0.04 0.03
Age of universe (Gyr) .............................................................. t0 13.7 0.2 0.2
Age at decoupling (kyr)........................................................... tdec 379 8 7
Age at reionization (Myr, 95%CL) ......................................... tr 180 220 80
Decoupling time interval (kyr) ................................................ Dtdec 118 3 2
Redshift of matter-energy equality .......................................... zeq 3233 194 210
Reionization optical depth ...................................................... � 0.17 0.04 0.04
Redshift of reionization (95%CL)........................................... zr 20 10 9
Sound horizon at decoupling (deg).......................................... hA 0.598 0.002 0.002
Angular size distance (Gpc)..................................................... dA 14.0 0.2 0.3
Acoustic scaled ........................................................................ ‘A 301 1 1
Sound horizon at decoupling (Mpc)d....................................... rs 147 2 2
a FromCOBE (Mather et al. 1999).b Derived fromCOBE (Mather et al. 1999).c With ‘eff � 700.d With ‘A ���1
A , �A rsd�1a .
24 BENNETT ET AL. Vol. 148

model uses a power spectrum of primordial mass fluctua-tions with a scale-dependent spectral index:
PðkÞ ¼ Pðk0Þk
k0
� �nsðk0Þþð1=2Þðdns=d ln kÞ lnðk=k0Þ: ð9Þ
As in the scale-independent case, we define
nsðkÞ d lnP
d ln k; ð10Þ
so
nsðkÞ ¼ nsðk0Þ þdnsd ln k
lnk
k0
� �ð11Þ
(with d2ns=d ln k2 ¼ 0). The definition for ns used hereincludes a factor of 1
2 difference from the Kosowsky &Turner (1995) definition. Peiris et al. (2003) explore theimplications of this running spectral index for inflation. Thebest-fit values of A, ns, and dns=d ln k are in Table 3 fork0 ¼ 0:05 Mpc�1. The quantity A is the normalizationparameter in CMBFAST, version 4.1, with optionUNNORM. The amplitude of curvature fluctuations at thehorizon crossing is DRðk0Þj j2¼ 2:95� 10�9A. We discussthe implications of the measured values of these parametersin x 9.3 and in Peiris et al. (2003).
The WMAP data constrain the properties of both thedark matter and the dark energy in the following ways:
1. The WMAP detection of reionization at z � 20 isincompatible with the presence of significant warm darkmatter density. Since the warm dark matter moves too fastto cluster in small objects, the first objects do not form inthis scenario until z � 8 (Barkana, Haiman, & Ostriker2001).2. The running spectral index implies a lower amplitude
for mass fluctuations on the dwarf galaxy scale. Darkmatter simulations of models (Ricotti 2002) find that thedark matter mass profiles depend on the spectral index onthe relevant mass scale. Thus, the shallower spectral indeximplied by our best-fit model may solve the CDM darkmatter halo profile problem (Moore et al. 1998; Spergel &Steinhardt 2000).3. While the WMAP data alone are compatible with a
wide range of possible properties for the dark energy, thecombination of the WMAP data with either the HST KeyProject measurement of H0, the 2dFGRS measurements ofthe galaxy power spectrum, or the Type Ia supernova meas-urements requires that the dark energy be 73% of the totaldensity of the universe and that the equation of state of thedark energy satisfyw < �0:78 (95%CL).
9.2. Best-Fit Parameters
WMAP’s measurements of the baryon density, Hubbleconstant, and age of the universe strengthen the cosmicconsistency that underlies the big bangmodel.
Atomic density (�bh2).—WMAP measures the atomicdensity at recombination to an accuracy of 4% through theshape of the angular power spectrum, and particularlythrough the ratio of the heights of the first to second peak(Page et al. 2003c; Spergel et al. 2003). Our best-fit value is�bh2 ¼ 0:0224� 0:0009. The baryon density is also probedvia abundance measurements of [D]/[H] (O’Meara et al.
2001; Pettini & Bowen 2001; D’Odorico, Dessauges-Zavadsky, & Molaro 2001). It is impressive that �bh2 is thesame at z ¼ 1089 as measured via the CMB as it is atz ¼ 109 from big bang nucleosynthesis. Thus, we find cos-mic consistency of the baryon density throughout cosmictime and measurement technique.Hubble constant (H0).—TheWMAPmeasurements of the
age and �mh2 yield a measurement of H0 ¼ 71þ4�3 km s�1
Mpc�1 that is remarkably consistent with the HST KeyProject value of H0 ¼ 72� 3� 7 km s�1 Mpc�1 (Freedmanet al. 2001), but with smaller uncertainty. Recent measure-ments of the Hubble constant from gravitational lens timingand the Sunyaev-Zeldovich effect yield independent esti-mates that are generally consistent but with larger uncer-tainties at present. Through a variety of measurementtechniques that sample different cosmic times and distances,we find cosmic consistency onH0.Age of the universe (t0).—The first acoustic peak in the
CMB power spectrum represents a known acoustic size(rs ¼ 147� 2 Mpc) at a known redshift (zdec ¼ 1089� 1).From these, WMAP measures the age of the universe(t0 ¼ 13:7� 0:2 Gyr) to an accuracy of�1% by determiningthe CMB light travel time over the distance determined bythe decoupling surface (dA ¼ 14:0þ0:2
�0:3 Gpc) and thegeometry of the universe (i.e., flat). The age of the universeis also estimated via stars in three ways:
1. The main-sequence turnoff in globular clustersyielding a cluster age of 12� 1 Gyr (Reid 1997).2. The temperature of the coldest white dwarfs in globu-
lar clusters yielding a cluster age of 12:7� 0:7 Gyr (Hansenet al. 2002).3. Nucleosynthesis age dating yielding an age of
15:6� 4:6 Gyr (Cowan et al. 1999).
These stellar ages are all consistent with the age of theuniverse found byWMAP.
Matter density (�mh2).—The matter density affects theheight and shape of the acoustic peaks. The baryon-to-matter ratio determines the amplitude of the acoustic wavesignal, and the matter-to-radiation ratio determines theepoch zeq when the energy density of matter equaled theenergy density of radiation. The amplitude of the earlyintegrated Sachs-Wolfe effect signal is sensitive to the mat-ter-radiation equality epoch. From these effects, WMAPmeasures the matter density �mh2 to an accuracy of �5%.Large-scale structure observations measure �mh throughthe shape of the power spectrum. When combined with esti-mates of h, this yields �mh2. Large-scale velocity field meas-urements yield �0:6
m b�1, where b is the bias in how the galaxypower spectrum traces the matter power spectrum[Pgal ¼ b2PðkÞ]. Galaxy bispectrum measurements yield b,allowing for estimates of �m. From the galaxy data, Verdeet al. (2002) find �m ¼ 0:27� 0:06, which is consistent withtheWMAP result of�m ¼ 0:27� 0:04.
Cluster lensing observations yield measurements of thetotal mass in the cluster. X-ray measurements give both thebaryonic mass and the total mass through the gravitationalpotential. Sunyaev-Zeldovich effect observations give a dif-ferent determination of the baryonic mass in clusters. Thecombined X-ray and Sunyaev-Zeldovich measurements givea value of �b��1
m ¼ 0:081þ0:009�0:011 h�1 (Grego et al. 2001),
which is reasonably consistent with 0:17� 0:01 fromWMAP.
No. 1, 2003 WMAP FIRST-YEAR RESULTS 25
9.3. Implications for Inflation
WMAP data test several of the key predictions of theinflationary scenario (see Peiris et al. 2003 for furtherdiscussion):
1. Inflation predicts that the universe is flat. As noted inx 9.1 and discussed in detail in Spergel et al. (2003), thecombination of WMAP data with either H0, Type Iasupernovae, or large-scale structure data constrainsj1� �totj < 0:03.2. Inflation predicts Gaussian random phase
fluctuations. Komatsu et al. (2003) show that the CMBfluctuations have no detectable skewness and place strongconstraints on primordial non-Gaussianity. Komatsu et al.(2003) also show that the Minkowski functionals of theWMAP data are consistent with the predictions of a modelwith Gaussian random phase fluctuations.3. Inflation predicts fluctuations on scales that appear to
be superhorizon scales in a Friedman-Robertson-Walkercosmology. The WMAP detection of an anticorrelationbetween polarization and temperature fluctuations on scalesof �1�–2� (Kogut et al. 2003) confirms this prediction andrules out subhorizon causal mechanisms for generatingCMB fluctuations (Peiris et al. 2003).4. Inflation predicts a nearly scale-invariant spectrum of
fluctuations, as seen byWMAP.
The WMAP data, in combination with complementarycosmological data, not only test the basic ideas of theinflationary scenario but also rule out broad classes of infla-tionary models, and therefore the data guide us toward aspecific workable inflationary scenario. The WMAP dataplace significant constraints on r, the tensor-to-scalar ratio,ns, the slope of the scalar fluctuations, and dns=d ln k, thescale dependence of these fluctuations. The addition of anadmixture of isocurvature modes does not improve theWMAPmodel fits.
The best-fit model to the combination of the WMAP,ACBAR, CBI, 2dFGRS, and Ly� forest data has a spectralindex that runs from n > 1 on the large scales probed byWMAP to n < 1 on the small scales probed by the 2dFGRSand the Ly� forest data. Only a handful of inflationarymodels predict this behavior. The Linde & Riotto (1997)hybrid inflationary model is one example. The data, how-ever, do not yet require n > 1 on large scales: our best-fitmodel has ns ¼ 1:03� 0:04 at k ¼ 0:002Mpc�1.
Our analysis of inflationary models (Peiris et al. 2003)marks the beginning of precision experimental tests ofspecific inflationary models. With the addition of ongoingWMAP observations and future improved analyses,WMAP will be able to more accurately constrain � andhence ns on large scales. When other CMB experimentsare calibrated directly to the WMAP sky maps, they willprovide improved measurements of the temperatureangular power spectrum for ‘ > 700. The upcomingrelease of the Sloan Digital Sky Survey (SDSS) powerspectrum will provide an improved measurement of thegalaxy power spectrum. The SDSS Ly� forest data areexpected to be a significant improvement over the dataused in our current analysis. Looking further toward thefuture, ESA’s Planck mission will provide improvedmeasurements of the CMB angular power spectrum onsmaller angular scales and should be able to improveconstraints on r.
10. DATA PRODUCTS
All of the WMAP data will be released. In addition, sev-eral ancillary and analyzed data sets are released. Theseinclude beam patterns, angular spectra, etc. Some softwaretools are also provided. An explanatory supplement pro-vides detailed information about theWMAP in-flight oper-ations and data products (Limon et al. 2003).12 All WMAPdata products are distributed through LAMBDA.13 This isa new NASA data center dedicated to the rapidly growingfield of microwave background data archiving and analysis.
11. SUMMARY AND CONCLUSIONS
1. WMAP has produced high-quality full-sky maps infive widely separated frequency bands. These maps can beused to test cosmological models and serve as the primarylegacy of the mission.
2. We have characterized and placed stringent limits onsystematic measurement errors. The calibration is based onthe modulation of the CMB dipole and is accurate to betterthan 0.5%.
3. We have demonstrated the ability to separate the CMBanisotropy from Galactic and extragalactic foregrounds.We provide masks for this purpose. In addition, we haveproduced CMB maps in which the Galactic signal isminimized.
4. We have a new determination of the dipole. It is3:346� 0:017 mK in the direction
ðl; bÞ ¼ ð263=85� 0=1; 48=25� 0=04Þ :
5. We have a new determination of the quadrupoleamplitude. It isQrms ¼ 8� 2 lK, or DT2
2 ¼ 154� 70 lK2.6. We have placed tight new limits on the non-
Gaussianity of the CMB anisotropy. The couplingcoefficient of a quadratic non-Gaussian term is limited to�58 < fNL < 134 (95% CL; Komatsu et al. 2003).
7. We have produced an angular power spectrum of theanisotropy with unprecedented accuracy and precision. Thepower spectrum is cosmic-variance–limited for ‘ < 354,with a signal-to-noise ratio greater than 1 per mode to‘ ¼ 658.
8. We have, for the first time, observed the angular powerspectrum of temperature-polarization correlations with suf-ficient accuracy and precision to place meaningful limits oncosmology.
9. We have detected the epoch of reionization with anoptical depth of � ¼ 0:17� 0:04. This implies a reionizationepoch of tr ¼ 180þ220
�80 Myr (95% CL) after the big bang at aredshift of zr ¼ 20þ10
�9 (95% CL) for a range of ionizationscenarios. This early reionization is incompatible with thepresence of a significant warm dark matter density.
10. We have fitted cosmological parameters to the data.We find results that are consistent with the big bang theoryand inflation.We find that the addition of a running spectralindex, while not required, improves the fit at the �2 � level.We provide values and uncertainties for a host of parame-ters based on this non–power-law inflationary model. Our‘‘ best ’’ values for cosmic parameters are given in Table 3.
13 See http://lambda.gsfc.nasa.gov.
12 Seehttp://lambda.gsfc.nasa.gov/data/map/doc/WMAP_supplement.pdf.
26 BENNETT ET AL. Vol. 148
11. WMAP continues to collect data and is currentlyapproved for 4 years of operations at L2. The additionaldata, and more elaborate analyses, will help to furtherconstrain models. The addition of other continuouslyimproving CMB and large-scale structure observations isessential for progress toward the ultimate goal of a completeunderstanding of the global properties of the universe.
The WMAP mission is made possible by the support ofthe Office of Space Sciences at NASA Headquarters and bythe hard and capable work of scores of scientists, engineers,
technicians, machinists, data analysts, budget analysts,managers, administrative staff, and reviewers. We are grate-ful to the National Radio Astronomy Observatory, whichdesigned and produced the HEMT amplifiers that madeWMAP possible. We are grateful to A. Riess for providingthe likelihood surfaces for the supernova data. D.Finkbeiner supplied us with his full-sky composite map ofH� emission in advance of publication. L. V. is supportedby NASA through a Chandra fellowship issued by theChandra X-Ray Observatory Center, operated by theSmithsonian Astrophysical Observatory. M. L. and G. T.are supported by the National Research Council.
REFERENCES
Bahcall, N. A., Ostriker, J. P., Perlmutter, S., & Steinhardt, P. J. 1999,Science, 284, 1481
Baker, J. C., et al. 1999,MNRAS, 308, 1173Barkana, R., Haiman, Z., &Ostriker, J. P. 2001, ApJ, 558, 482Barnes, C., et al. 2002, ApJS, 143, 567———. 2003, ApJS, 148, 51Bennett, C. L., et al. 1992, ApJ, 396, L7———. 1996, ApJ, 464, L1———. 2003a, ApJ, 583, 1———. 2003b, ApJS, 148, 97Benoit, A., et al. 2003, A&A, 399, L19Cen, R. 2003, ApJ, 591, 12Cheng, E. S., et al. 1997, ApJ, 488, L59Coble, K., et al. 1999, ApJ, 519, L5Cowan, J. J., Pfeiffer, B., Kratz, K.-L., Thielemann, F.-K., Sneden, C.,Burles, S., Tytler, D., & Beers, T. C. 1999, ApJ, 521, 194
Croft, R. A. C.,Weinberg, D. H., Bolte,M., Burles, S., Hernquist, L., Katz,N., Kirkman, D., & Tytler, D. 2002, ApJ, 581, 20
Dawson, K. S., Holzapfel, W. L., Carlstrom, J. E., Joy,M., LaRoque, S. J.,& Reese, E. D. 2001, ApJ, 553, L1
de Bernardis, P., et al. 1994, ApJ, 422, L33de Oliveira-Costa, A., Devlin, M. J., Herbig, T., Miller, A. D., Netterfield,C. B., Page, L., & Tegmark,M. 1998, ApJ, 509, L77
Dennison, B., Simonetti, J. H., & Topasna, G. A. 1998, Publ. Astron. Soc.Australia, 15, 147
Dicker, S. R., et al. 1999,MNRAS, 309, 750D’Odorico, S., Dessauges-Zavadsky, M., & Molaro, P. 2001, A&A, 368,L21
Finkbeiner, D. P. 2003, ApJS, 146, 407Finkbeiner, D. P., Davis, M., & Schlegel, D. J. 1999, ApJ, 524, 867Flett, A.M., &Henderson, C. 1979,MNRAS, 189, 867Freedman,W. L., et al. 2001, ApJ, 553, 47Ganga, K., Cheng, E., Meyer, S., & Page, L. 1993, ApJ, 410, L57Gaustad, J. E., McCullough, P. R., Rosing, W., & Buren, D. V. 2001,PASP, 113, 1326
Gorski, K. M., Banday, A. J., Bennett, C. L., Hinshaw, G., Kogut, A.,Smoot, G. F., &Wright, E. L. 1996, ApJ, 464, L11
Gott, J. R. I., Park, C., Juszkiewicz, R., Bies, W. E., Bennett, D. P.,Bouchet, F. R., & Stebbins, A. 1990, ApJ, 352, 1
Grainge, K., et al. 2003,MNRAS, 341, L23Grego, L., Carlstrom, J. E., Reese, E. D., Holder, G. P., Holzapfel, W. L.,Joy,M. K.,Mohr, J. J., & Patel, S. 2001, ApJ, 552, 2
Gundersen, J. O., et al. 1995, ApJ, 443, L57Halverson, N.W., et al. 2002, ApJ, 568, 38Hanany, S., et al. 2000, ApJ, 545, L5Hancock, S., Gutierrez, C. M., Davies, R. D., Lasenby, A. N., Rocha, G.,Rebolo, R.,Watson, R. A., & Tegmark,M. 1997,MNRAS, 289, 505
Hansen, B.M. S., et al. 2002, ApJ, 574, L155Harrison, D. L., et al. 2000,MNRAS, 316, L24Haslam, C. G. T., Klein, U., Salter, C. J., Stoffel, H., Wilson,W. E., Cleary,M. N., Cooke, D. J., & Thomasson, P. 1981, A&A, 100, 209
Hinshaw, G., Banday, A. J., Bennett, C. L., Gorski, K. M., Kogut, A.,Lineweaver, C. H., Smoot, G. F., &Wright, E. L. 1996a, ApJ, 464, L25
Hinshaw, G., Banday, A. J., Bennett, C. L., Gorski, K. M., Kogut, A.,Smoot, G. F., &Wright, E. L. 1996b, ApJ, 464, L17
Hinshaw, G. F., et al. 2003a, ApJS, 148, 135———. 2003b, ApJS, 148, 63Hivon, E., Gorski, K. M., Netterfield, C. B., Crill, B. P., Prunet, S., &Hansen, F. 2002, ApJ, 567, 2
Jarosik, N., et al. 2003a, ApJS, 145, 413———. 2003b, ApJS, 148, 29Knox, L., & Page, L. 2000, Phys. Rev. Lett., 85, 1366Kogut, A., Banday, A. J., Bennett, C. L., Gorski, K. M., Hinshaw, G.,Smoot, G. F., &Wright, E. L. 1996a, ApJ, 464, L5
Kogut, A., Banday, A. J., Bennett, C. L., Gorski, K. M., Hinshaw, G.,Smoot, G. F., &Wright, E. L. 1996b, ApJ, 464, L29
Kogut, A., et al. 1992, ApJ, 401, 1———. 1996c, ApJ, 470, 653———. 2003, ApJS, 148, 161Komatsu, E., & Spergel, D. N. 2001, Phys. Rev. D, 63, 63002Komatsu, E., et al. 2003, ApJS, 148, 119Kosowsky, A., & Turner,M. S. 1995, Phys. Rev. D, 52, 1739Kovac, J., et al. 2002, Nature, 420, 772Kuo, C. L., et al. 2002, ApJ, submitted (astro-ph/0212289)Leitch, E. M., Readhead, A. C. S., Pearson, T. J., Myers, S. T., Gulkis, S.,& Lawrence, C. R. 2000, ApJ, 532, 37
Limon, M., et al. 2003, Wilkinson Microwave Anisotropy Probe (WMAP):Explanatory Supplement (Greenbelt: GSFC)
Linde, A. D., &Riotto, A. 1997, Phys. Rev. D, 56, 1841Mather, J. C., Fixsen, D. J., Shafer, R. A., Mosier, C., & Wilkinson, D. T.1999, ApJ, 512, 511
Mather, J. C., et al. 1990, ApJ, 354, L37Mauskopf, P. D., et al. 2000, ApJ, 536, L59Miller, A. D., et al. 1999, ApJ, 524, L1Minkowski, H. 1903,Math. Ann., 57, 447Moore, B., Governato, F., Quinn, T., Stadel, J., & Lake, G. 1998, ApJ, 499,L5
Myers, S. T., Readhead, A. C. S., & Lawrence, C. R. 1993, ApJ, 405, 8Netterfield, C. B., Devlin, M. J., Jarosik, N., Page, L., & Wollack, E. J.1997, ApJ, 474, 47
Oh, S. P., Spergel, D. N., &Hinshaw, G. 1999, ApJ, 510, 551O’Meara, J. M., Tytler, D., Kirkman, D., Suzuki, N., Prochaska, J. X.,Lubin, D., &Wolfe, A.M. 2001, ApJ, 552, 718
Padin, S., et al. 2001, ApJ, 549, L1Page, L., et al. 2003a, ApJ, 585, 566———. 2003b, ApJS, 148, 39———. 2003c, ApJS, 148, 233Pearson, T. J., et al. 2003, ApJ, 591, 556Peebles, P. J. E. 1984, ApJ, 284, 439Peiris, H., et al. 2003, ApJS, 148, 213Penzias, A. A., &Wilson, R.W. 1965, ApJ, 142, 419Percival,W. J., et al. 2001,MNRAS, 327, 1297Peterson, J. B., et al. 2000, ApJ, 532, L83Pettini, M., & Bowen, D. V. 2001, ApJ, 560, 41Piccirillo, L., et al. 1997, ApJ, 475, L77Reid, I. N. 1997, AJ, 114, 161Reynolds, R. J., Haffner, L. M., & Madsen, G. J. 2002, in ASP Conf. Ser.282, Galaxies: The Third Dimension, ed. M. Rosado, L. Binette, &L. Arias (San Francisco: ASP), 31
Ricotti, M. 2002,MNRAS, submitted (astro-ph/0212146)Riess, A. G., et al. 2001, ApJ, 560, 49Romeo, G., Ali, S., Femenıa, B., Limon, M., Piccirillo, L., Rebolo, R., &Schaefer, R. 2001, ApJ, 548, L1
Ruhl, J. E., et al. 2003, ApJ, submitted (astro-ph/0212229)Schlegel, D. J., Finkbeiner, D. P., &Davis,M. 1998, ApJ, 500, 525Smoot, G. F., et al. 1992, ApJ, 396, L1Spergel, D. N., & Steinhardt, P. J. 2000, Phys. Rev. Lett., 84, 3760Spergel, D. N., et al. 2003, ApJS, 148, 175Tucker, G. S., Griffin, G. S., Nguyen, H. T., & Peterson, J. B. 1993, ApJ,419, L45
Tucker, G. S., Gush, H. P., Halpern, M., Shinkoda, I., & Towlson, W.1997, ApJ, 475, L73
Verde, L., et al. 2002,MNRAS, 335, 432———. 2003, ApJS, 148, 195Wilson, G.W., et al. 2000, ApJ, 532, 57Wright, E. L., Bennett, C. L., Gorski, K., Hinshaw, G., & Smoot, G. F.1996a, ApJ, 464, L21
Wright, E. L., Hinshaw, G., & Bennett, C. L. 1996b, ApJ, 458, L53Wright, E. L., et al. 1992, ApJ, 396, L13
No. 1, 2003 WMAP FIRST-YEAR RESULTS 27