Embed Size (px)
Citation preview

WIDER Working Paper 2018/66
The interaction of institutional quality and human capital in shaping the dynamics of capital structure in Vietnam
Enrico Santarelli1 and Hien Thu Tran2
June 2018

1Department of Economics, University of Bologna, Bologna, Italy, e-mail: [email protected]; 2 Telfer School of Management, University of Ottawa; Ottawa, Canada, e-mail: [email protected].
This study has been prepared within the UNU-WIDER project on ‘Structural transformation and inclusive growth in Viet Nam’.
Copyright © UNU-WIDER 2018
Information and requests: [email protected]
ISSN 1798-7237 ISBN 978-92-9256-508-4 https://doi.org/10.35188/UNU-WIDER/2018/508-4
Typescript prepared by Lesley Ellen.
The United Nations University World Institute for Development Economics Research provides economic analysis and policy advice with the aim of promoting sustainable and equitable development. The Institute began operations in 1985 in Helsinki, Finland, as the first research and training centre of the United Nations University. Today it is a unique blend of think tank, research institute, and UN agency—providing a range of services from policy advice to governments as well as freely available original research.
The Institute is funded through income from an endowment fund with additional contributions to its work programme from Finland, Sweden, and the United Kingdom as well as earmarked contributions for specific projects from a variety of donors.
Katajanokanlaituri 6 B, 00160 Helsinki, Finland
The views expressed in this paper are those of the author(s), and do not necessarily reflect the views of the Institute or the United Nations University, nor the programme/project donors.
Abstract: The aim of this paper is to find which of two theories of capital structure—trade-off theory or pecking order theory—best explains the capital structure decision of non-state firms during the post-transition process in Vietnam. We also investigate the effect of human capital, institutional quality, and their interaction on the capital structure decision. For empirical evidence, we use a unique database provided by the CIEM-DANIDA project covering around 2,000 micro, small, and medium-sized enterprises in Vietnam for each year from 2003 to 2014. We estimate our empirical models by employing the System Generalized Method of Moments estimator. Our findings suggest that the capital structure of Vietnamese firms is a balance between the trade-off theory and the pecking order theory. On one hand, accessing formal debts is extremely tough for young and non-state firms; they bootstrap themselves out of financial constraints by stretching and making the most of their internal resources and assets. On the other hand, those with access to formal sources take advantage of leverage tools from using formal loans to exploit the tax benefits against the costs of financial distress. Other noteworthy findings include: (i) profitability and debt tax shields are no longer significantly important when entrepreneurs adopt informal debt financing; (ii) high-quality institutions with transparent and fair credit rationing rules will enable firms to reduce their reliance on debt financing; and (iii) while human capital encourages entrepreneurs to obtain more loans, its interaction with institutional quality deters debt financing and favours other financial sources.
Keywords: capital structure, trade-off theory, pecking order theory, formal/informal debt, institutional quality, non-state firms, VietnamJEL classification: C23, D22, E41, G32, M21

1
1 Introduction
Firms are financed through various means: internal capital, debt, equity, or any hybrid forms. The combination of different sources of finance is often referred to as the ‘capital structure puzzle’ initially proposed by Myers (1984). The choice of capital structure is one of the most important strategic decisions that managers face in today’s increasingly volatile and hypercompetitive market. But what do we know about the capital structure of small businesses in a transition economic setting? The answer is ‘not much’ as almost all the existing empirical literature on capital structure has so far mostly focused on established firms, especially market-listed companies in advanced countries. Ignoring the peculiarities of small enterprises, which represent the majority of the firm population and account for a remarkable part of gross domestic product (GDP) and employment in most countries, especially in transition and developing countries, extant studies tend therefore to underestimate an important aspect of the capital structure puzzle. In Viet Nam, for example, there are only around 1,000 firms that issue publicly traded securities, yet according to the General Statistics Office (GSO 2016) they contribute up to 65 per cent of GDP and hold 23 per cent of the whole national capital investment. However, there are around 56,000 small firms with total assets of less than 10 billion Viet Nam Dong (VND), accounting for 93.8 per cent of the whole firm population, and contributing to nearly 30 per cent of GDP. The latter create more than half a million new jobs and employ more than 51 per cent of the labour force.
So far, the three most influential theories of capital structure—trade-off theory, pecking order theory, and market-timing theory—offer several predictions regarding firm-specific factors affecting firm capital structure. Under trade-off theory, the firm seeks to balance the tax benefits from using debt against the costs of financial distress that rise at an increasing rate with the use of leverage. Hence, this theory predicts an ‘optimal’ ratio of debt to equity, where the tax benefits of deductible interest are just offset by the costs of financial distress (Miller 1977). The theory predicts that larger firms, in general, and firms with more tangible assets and characterized by higher profitability could enjoy greater tax benefits of debt and hence should have higher leverage. The pecking order theory (Myers 1984; Myers and Majluf 1984) relies upon the concept of asymmetric information between managers and investors that guides managers in their preference for raising funds. According to this theory, firms stick to a ‘pecking order’ in their search for funding, first using internally generated funds (primarily retained earnings) with the lowest degrees of asymmetric information, then tapping private debt (primarily in the form of loans from financial institutions), and seeking equity from outside sources as a last resort. Based on this, the theory predicts that more profitable firms can rely on internal funds and hence have lower leverage. As a consequence, there is no ‘optimal’ ratio of debt to equity. Finally, the market-timing theory of capital structure is the most recent addition to the theories of capital structure, emerging from a study by Baker and Wurgler (2002) that considers how the efforts of management to ‘time’ the issuance of equity relate to the firm’s capital structure. Of these three major competing theories explaining capital structure decisions, only the first two are relevant for small firms that do not issue publicly traded securities. There has been no consensus about which theory best explains small firms’ capital structure decisions (Serrasqueiro and Caetano 2015).
Further, while developed countries tend to have an advanced institutional environment and a developed capital market such that capital-constrained firms can easily access different sources of finance to optimize their capital structure (Rajan and Zingales 1995; Wald 1999), very little is known about how firms in transition countries determine their capital structure and how this decision is influenced by the local institutional quality, which is normally characterized by distinctive characteristics such as inefficient markets, active government involvement, weak financial market, and high uncertainty (Booth et al. 2001; Chang et al. 2014). These transition

2
settings challenge the efficacy of existing business models and theories, and thus provide a useful context to explore how firms facing radical external institutional and market changes of the transition develop a relevant capital structure to bring about required organizational changes. As a transition country, Viet Nam presents an interesting and highly relevant context to explore the wider applicability of the capital structure literature. With the implementation of the doimoi policy over the past 30 years driving the centrally planned economy towards more market-driven arrangements, Viet Nam has experienced substantial changes in virtually every aspect of its society and economy (Tran and Santarelli 2017).
Our paper contributes to the literature as follows. First, we explore what determines the evolution of capital structure over time. In this connection, we address the question of ‘which capital structure theory—trade-off or pecking order—best explains the capital structure decisions of non-state firms during the post-transition process in Viet Nam?’. We classify the determinants into three categories—individual-level, firm-level, and regional-level categories—in order to provide a comprehensive insight into firms’ capital structure black boxes. Second, since the financial market is relatively underdeveloped in Viet Nam, and non-state firms are constrained by a complex credit-rationing process, the use of formal external financing directly from the market is very limited, and hence we predict that informal sources of debt will be more important than formal ones. Thus, we study how informality in the financing market is associated with firms’ leverage decisions. Finally, we identify that an optimal capital structure or a beneficial leverage level in small firms will depend significantly on their entrepreneurs’ human capital and the local institutional environment. In particular, the extent to which firms can access formal loans or may need to exploit informal loans instead is contingent on the combination of their owners’ education, experience and transparent and fair credit rationing rules in a high-quality institution. We look into the dynamic relationship between environmental institutional quality and firms’ changing leveraging decisions, taking into account the interaction effect of entrepreneurs’ human capital and local institutions.
For empirical evidence, we use a unique database provided by the CIEM-DANIDA (Central Institute for Economic Management and Danish International Development Agency) project covering around 2,000 micro, small and medium-sized enterprises in Viet Nam for each year from 2003 to 2014. We estimate our empirical models by employing the System Generalized Method of Moments estimator (GMM-Sys) (Blundell and Bond 1998). The structure of the paper is as follows. We review the related literature on capital structure theories, determinants of capital structure, and how capital structure influences firm survival, and develop our hypothesis in Section 2. Section 3 discusses our data, their descriptive statistics, and pair-wise correlation. Section 4 presents variable construction and estimation models. Section 5 discusses the main results and provides interpretation. Finally, Section 6 concludes.
2 Literature discussion
2.1 Trade-off theory versus pecking order theory
In theory, firm capital structure is optimal in efficient markets (Rubinstein 2003). However, in practice, the financial market is never efficient. Subsequent theoretical work has taken into account the imperfections of financial markets and has shown that firms establish their capital structure depending on firm-specific attributes and macroeconomic factors that determine the various costs and benefits associated with debt and equity financing (Frank and Goyal 2009). Our empirical analysis is motivated by two strands of the capital structure literature which are directly relevant to non-state small and medium-sized enterprises (SMEs).

3
The trade-off strand states that optimal capital structure is determined by firms balancing tax savings from debt against deadweight bankruptcy costs. Classic arguments for this trade-off theory are based on bankruptcy costs in a situation of excessive debt, tax deductibility of interest expenses, and agency costs of equity derived from excess free cash flows (Jensen and Meckling 1976). It is therefore suggested that there is an optimal level of debt where the marginal benefit equals the marginal cost of an additional unit of debt (Bradley et al. 1984). The pecking order theory argues that a pecking order in financing exists if there is information asymmetry in companies between the insiders, either shareholders or managers, and outsiders, mainly investors. There is thus a preference hierarchy of financing sources: firms prefer to use retained earnings as their first financing source, followed by debt and, lastly, by equity. Equity is less attractive to firms given that it entails larger information asymmetry costs (Baskin 1989), or managerial optimism (Heaton 2002), making its issuance more expensive relative to other funding sources.
Empirically, these two theories have often been placed in opposition when seeking to identify which offers the best explanation regarding capital structure decisions. In the empirical studies, some of the findings are consistent with the trade-off theory while others are consistent with the pecking order theory.1 A large number of these empirical studies have focused on the debt determinants of large and listed companies, whereas capital structure decisions of SMEs have only recently gained interest (Sogorb-Mira 2005; Serrasqueiro and Caetano 2015). The serious lack of capital and existence of information asymmetry prevent SMEs from accessing external financing sources and thus being able to peg with a hierarchical order of selection. However, to balance debt tax shield benefits and deadweight bankruptcy costs associated with debt financing, they need a high level of financial literacy around debt and tax systems, which appears to be far beyond their ability. While various empirical studies support a particular theory in explaining SMEs’ capital structure decisions (for instance, the pecking order theory in Ou and Haynes 2006; Ramalho and Silva 2009), Serrasqueiro and Caetano (2015) conclude that the pecking order theory and trade-off theory are not mutually exclusive, i.e. when SMEs adopt a financing behaviour, following one theory does not imply a distance from the other theory. In what follows, we will review the (contradictory) predictions of the two theories regarding the key determinants of capital structure such as profitability, growth opportunities, asset tangibility, income volatility, firm size, and tax shield benefits.
According to trade-off theory, profitability is positively associated with leverage for three reasons (Bonfim and Antão 2012). First, as profitability increases, bankruptcy costs decrease, pushing firms to higher levels of leverage. Second, facing higher expected tax rates than less or non-profitable firms, more profitable firms should borrow to shield income from taxation. This asymmetric taxation of profits and losses drives profitable firms to higher levels of debt as they benefit more from the resulting tax benefits of debt (DeAngelo and Masulis 1980). Third, in the agency theoretical framework, profitable firms tend to have severe free cash-flow problems, that is, more excess earnings over profitable investments, thus also requiring higher leverage to restrain management discretion. However, the pecking order theory suggests a negative relationship between profitability and leverage level since profitable firms have internal funds (retained earnings) to support investments and are less likely to seek debt financing.
The two theories also disagree with respect to the relationship between leverage and growth opportunities. While trade-off theory predicts a negative relationship between leverage and firm growth, the pecking order theory predicts a positive relationship. Supporting the agency theoretical framework, trade-off proponents suggest that firms with high-growth opportunities tend to have
1 For a review, see Köksal and Orman (2014).
4
few free cash-flow problems but high financial distress costs of debt due to significant conflicts of interest between shareholders and debt holders. Thus, high-growth firms should use less debt. However, pecking-order theorists claim that high growth is likely to put a strain on retained earnings since internal funds are unlikely to be sufficient to support emerging investment opportunities, and it therefore pushes capital-constrained firms into debt financing. This supports a positive relationship between debt and growth opportunities once internal retained earnings have been fully exhausted.
Asset tangibility is normally a proxy for the availability of collateral, and thus firms with considerable tangible assets tend to have low expected distress costs and few debt-related agency problems. Trade-off theory asserts that firm leverage increases with tangibility of assets (Rajan and Zingales 1995; Frank and Goyal 2009). This is because tangible assets are easier to collateralize and they suffer a smaller loss in value when firms go into distress. In addition, since firms tend to match the maturity of assets with that of liabilities, tangibility should be positively correlated with long-term leverage. However, according to pecking order theory, firms with high tangibility can have low leverage because they tend to have low information asymmetry, making the issuance of equity less costly (Harris and Raviv 1991).
According to trade-off theory, the value of interest tax shields incentivizes firms to hold high levels of debt when facing high tax rates. The effect of taxes on debt ratios, however, has been difficult to clearly identify in the data, and the available evidence is rather mixed and weak (see, for example, Antoniou et al. 2008; Frank and Goyal 2009). This may be because non-state firms face severe constraints in accessing external financing, there is uncertainty about what would constitute a good proxy for tax effects, and transaction costs make it difficult to identify tax effects even when they are an element of a firm’s problems. Thus, in practice, researchers normally analyse non-debt tax shields, such as depreciation deductions, depletion allowances, and investment tax credits, which can be a substitute for the interest expenses and consequently can reduce the need to carry debt (DeAngelo and Masulis 1980). These shields can be considered as substitutes for the corporate tax benefits of debt financing. Therefore, while tax shields make it attractive to secure additional financing using debt, trade-off theory predicts a negative relationship between leverage and non-debt tax shields. More often than not, empirical studies produce results that are supportive of this trade-off theory prediction (Köksal and Orman 2014). Nevertheless, the pecking order theory, with the underpinning principle that a company follows a certain ‘pecking order’ in its capital structure choices (internal funds first, then debt, and equity) does not, however, provide an explicit explanation for the relationship between non-debt tax shields and leverage.
Large firms tend to be diversified and have stable cash flow, so their probability of bankruptcy is smaller than that of SMEs. Trade-off theory asserts that large firms have higher leverage compared with small firms. However, since large firms also tend to have less asymmetric information and lower adverse selection, pecking order theory suggests that large firms can more easily issue equity compared to small firms, and thus prefer equity to debt, resulting in lower leverage.
Although the two theories are in contradiction as far as the prediction of the impact of profitability, growth opportunities, and firm size on leverage are concerned, they agree on the impact of volatility (or firm risk) on leverage ratios. Risky firms tend to have volatile cash flows and high costs of financial distress. Under trade-off theory, the impact of volatility on debt financing is negative as debt increases bankruptcy costs. In addition, the probability of wasting interest tax shields increases when earnings are less than tax shields (Frank and Goyal 2009). Bankruptcy risks and tax shields both work to reduce leverage. Under pecking order theory, business risk exacerbates the adverse selection between firms and creditors. Thus, firms with more volatile cash flows are less likely to be indebted to lower the possibility that they will have to issue new risky securities or forego future profitable investments when cash flows are low.

5
2.2 Institutional effects in transition countries
Institutions are recognized as being fundamental to economic growth and development because they provide the basic rules of human interaction for people in their use of scarce resources. More recent international studies pay particular attention to how institutional differences across countries shape capital structure decisions (Öztekin 2015). Institutional characteristics affect not only the costs and benefits of operating at various leverage ratios, but also the speed at which a firm converges to its long-term capital structure. If a province’s institutional characteristics make debt and equity financing more costly, firms in that province will exhibit slower adjustment speeds.
With the collapse of the Soviet bloc in the late 1980s, firms in post-socialist countries had to readjust their working principles to be competitive in the open market. This also created a wave of new-born enterprises. These countries underwent severe economic reforms during the 1990s to produce significant changes to their institutional settings as well as their macroeconomic indicators. All these major changes were expected to have an impact on the capital structure of firms from transition countries (De Haas and Peeters 2006; Decoure 2007). Cross-country studies have shown that firms in these countries tend to use short-term debt rather than long-term debt (Demirguc-Kunt and Maksimovic 1999).
Since at least the mid-1990s, there have been a growing number of studies that explore the determinants of capital structure in individual transition countries,2 including Viet Nam.3 The ideologies of the centrally planned mechanism prioritize state ownership in controlling the capital market. By introducing a monobank system—a system consisting of the central bank and various specialized state-owned banks (an investment bank, a foreign trade bank, an agricultural bank, etc.), which are regulated directly by instructions from the central bank—the central planning board can control all funds and cash flows. A large proportion of these funds is for state investment in state-owned enterprises and public services. However, the newly developed market institutions have not been supported by an effective system of legalization and legal practices in which private transactions are enforced, fair competition, free entry and orderly ways of exit are maintained, and the rights of debtors and creditors are secured. As a result, this substantially limits firms’ financing choices, especially those of private firms. Evidence suggests that private firms in China are denied access to bank loans and often must resort to expensive trade credits (Brandt and Li 2003; Cull et al. 2009), while informal and short-term loans are preferred by new business founders in Viet Nam (Rand 2007). Many private entrepreneurs in Viet Nam with experience of doing business in informal markets in the past mainly use their savings rather than bank credits to finance their businesses (Tran and Santarelli 2014).
2.3 Hypothesis
Viet Nam is currently one of the fastest emerging markets undergoing transition to a market economy. Its rapidly expanding capital market is gradually opening up to global investors and international firms. This suggests that some of the trade-off theory’s predictions are more appropriate for the case of Viet Nam than those of the pecking order theory. First, there are so
2 See, for example, Wiwattanakantang (1999), Deesomsak et al. (2004) for Thailand; Pandey (2004) for Malaysia; Huang and Song (2006), Qian et al. (2009), Chang et al. (2014) for China; Correa et al. (2007) for Brazil; Qureshi (2009) for Pakistan; Espinosa et al. (2012) for Chile; and Sbeti and Moosa (2012) for Kuwait. 3 Almost all the studies of the capital structure in Viet Nam (for instance Nguyen 2010; Nguyen et al. 2012; Vo 2017) focus solely on listed firms and limit exploring whether determinants of capital structure of the country are comparable to those of advanced countries.

6
many profit opportunities in the country that entrepreneurs are always in need of loans to finance their start-ups and operations. The underdevelopment of the Vietnamese financial market, however, limits their access to formal loans and prioritizes loans from informal sources. Second, large size, profitability, and high growth are key indicators in the credit-rationing criteria of formal creditors. Thus, large, profitable, and high-growth firms will attempt to obtain more loans, especially from formal sources to finance their activities. Third, since SMEs find it difficult to obtain formal financing due to difficulties in proving their creditworthiness, small cash flows, inadequate credit history, high risk premiums, underdeveloped bank–borrower relationships and high transaction costs (Tran and Santarelli 2014), collateral is essential for them to obtain loans. Thus asset tangibility, a good proxy for collateral availability, stimulates firms to adopt more debt financing. Finally, income volatility indicates high firm risk and instable cash flows. As a consequence, firms with volatile income will be less likely to obtain loans since debt financing may exacerbate their bankruptcy risks. Thus, we propose the following hypothesis:
Hypothesis: The leverage decisions of firms in Viet Nam follow trade-off theory predictions, rather than those of pecking order theory.
Nevertheless, modern Viet Nam, during the transition to a market economy, still suffers many institutional constraints with complex administrative regulation, excessive bureaucracy, and frequent changes in ‘red tape’ increasing the risk and cost of doing business for private entrepreneurs (Glewwe and Dang 2011; de Jong et al. 2012). As a consequence, although the government has recognized entrepreneurial activities as an essential driver of economic growth, there is a lack of an established system of entrepreneurial finance. Since the early 1990s, shortage of capital was at the top of the list of constraints identified by Vietnamese entrepreneurs in almost every survey of private small firms in the country (Tran and Santarelli 2014). Until recently, state-owned commercial banks still relied on political connections to determine loan access as a credit source for private enterprises regardless of their profitability or growth (Malesky and Taussig 2009). In fact, recent research indicates that SMEs in transition economies may experience highly constrained pecking orders, given the significant institutional biases they face in accessing debt from the formal financial sector (Newman et al. 2012). Rand (2007) suggests that formal loans are relatively unimportant for new business founders compared to informal loans and personal savings due to collateral requirements from the formal financial system. Thus, we realize that SMEs in Viet Nam may passively follow a pecking-order strategy in financing their businesses.
On one hand, social capital from membership of business networks plays an important role in gaining support and accessing external resources, including financial capital (Santarelli and Tran 2013). However, our data show that only 7.5 per cent of firms were members of business associations in 2015. On the other hand, human capital helps entrepreneurs to acquire financial resources, as it is one of the factors that investors and banks rely on to evaluate credit applications. Tran and Santarelli (2014) suggest that human capital helps family firms to relax their capital constraints since they have a greater knowledge of financing alternatives. However, we observe from our data that around 80 per cent of respondents have low levels of educations (unskilled/technical training with no certificate/vocational education). This once again supports the passively adopted pecking-order strategy of relying mainly on internal funding, since even when SMEs try to apply for loans, they are unlikely to obtain them.
3 Data description
The dataset used in our empirical investigation is a 12-year panel of Vietnamese small and medium private manufacturing enterprises covering the period from 2003 to 2014. The dataset is extracted

7
from five waves of the Danish International Development Agency (DANIDA) surveys (carried out in 2005, 2007, 2009, 2011, 2013, and 2015), providing highly detailed information on various aspects of entrepreneurs and their firms. These SME surveys stemmed from the collaboration of the Central Institute for Economic Management (CIEM) in Hanoi, Viet Nam and the Ministry of Labour, Invalids and Social Affairs of Viet Nam, the Department of Economics of the University of Copenhagen, and the Royal Embassy of Denmark in Viet Nam. The surveys are designed with the objective of collecting and analysing data representative of the private sector as a whole in Viet Nam. This means that, as well as interviewing large or formally registered enterprises, a substantial number of non-registered businesses are also studied in order to gain a comprehensive understanding of SME dynamics in Viet Nam.
The sample we use for our analysis was extracted from the master dataset based on the following criteria: (i) firms’ sales, total assets and/or labour force are non-zero; (ii) state-owned firms and joint ventures are excluded; and (iii) unregistered (informal) businesses who do not pay tax are excluded. The final sample consists of 24,640 observations covering 4,458 firms, of which up to 73 per cent (3,273) obtained some type of loan. Among these indebted firms, nearly 52 per cent (1,698) applied for loans from formal sources, 72 per cent (2,360) applied for loans from informal sources, and 36 per cent (1,181) applied for loans from both sources. The average leverage ratio (debt to total asset) of our sampled firms is comparatively low and stable, varying between 9 per cent and 14 per cent from 2003 to 2008, and then reducing to less than 9 per cent from 2009 onwards when transitional measures brought positive changes to the macro institutional environment.
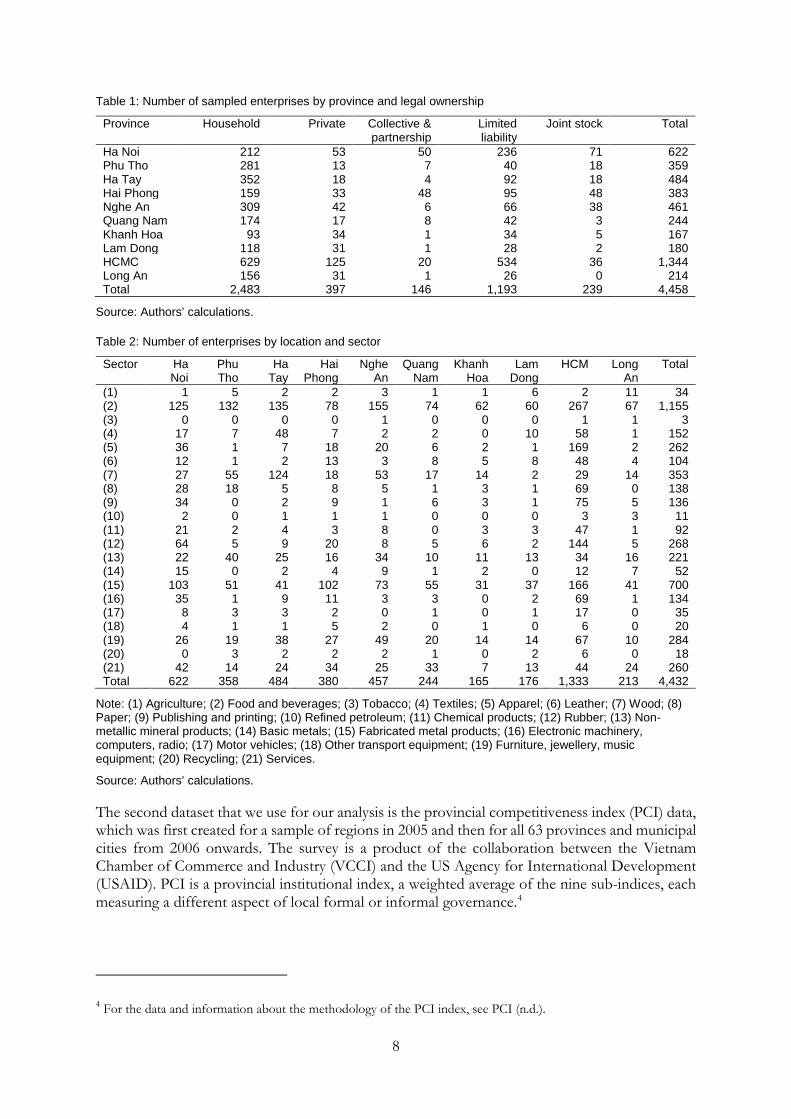
Table 1 documents the types of legal ownership and provinces in our sample. Only 55 per cent of the sampled firms are household enterprises compared to around 90 per cent in the firm population (CIEM et al. 2011). Many households operate informally (unregistered) and thus are excluded from the analysis.
Table 2 presents the location–sector split of our sample. Sector codes are based on the ISIC (International Standard Industrial Classification of All Economic Activities) codes. The three largest sectors in terms of number of enterprises are food and beverages, fabricated metal products, and manufacturing of wood products.
According to Table 3, some 67 per cent of small and medium firms are registered as limited liability companies, compared to 33 per cent of micro firms. Moreover, up to 90 per cent of all micro firms are household establishments. Only 26 per cent of the joint stock firms are found in the medium firm category, and almost 21 per cent with this legal structure are found in the micro category.
8
Table 1: Number of sampled enterprises by province and legal ownership
Province Household Private Collective & partnership
Limited liability
Joint stock Total
Ha Noi 212 53 50 236 71 622 Phu Tho 281 13 7 40 18 359 Ha Tay 352 18 4 92 18 484 Hai Phong 159 33 48 95 48 383 Nghe An 309 42 6 66 38 461 Quang Nam 174 17 8 42 3 244 Khanh Hoa 93 34 1 34 5 167 Lam Dong 118 31 1 28 2 180 HCMC 629 125 20 534 36 1,344 Long An 156 31 1 26 0 214 Total 2,483 397 146 1,193 239 4,458
Source: Authors’ calculations.
Table 2: Number of enterprises by location and sector
Sector Ha Noi
Phu Tho
Ha Tay
Hai Phong
Nghe An
Quang Nam
Khanh Hoa
Lam Dong
HCM Long An
Total
(1) 1 5 2 2 3 1 1 6 2 11 34 (2) 125 132 135 78 155 74 62 60 267 67 1,155 (3) 0 0 0 0 1 0 0 0 1 1 3 (4) 17 7 48 7 2 2 0 10 58 1 152 (5) 36 1 7 18 20 6 2 1 169 2 262 (6) 12 1 2 13 3 8 5 8 48 4 104 (7) 27 55 124 18 53 17 14 2 29 14 353 (8) 28 18 5 8 5 1 3 1 69 0 138 (9) 34 0 2 9 1 6 3 1 75 5 136 (10) 2 0 1 1 1 0 0 0 3 3 11 (11) 21 2 4 3 8 0 3 3 47 1 92 (12) 64 5 9 20 8 5 6 2 144 5 268 (13) 22 40 25 16 34 10 11 13 34 16 221 (14) 15 0 2 4 9 1 2 0 12 7 52 (15) 103 51 41 102 73 55 31 37 166 41 700 (16) 35 1 9 11 3 3 0 2 69 1 134 (17) 8 3 3 2 0 1 0 1 17 0 35 (18) 4 1 1 5 2 0 1 0 6 0 20 (19) 26 19 38 27 49 20 14 14 67 10 284 (20) 0 3 2 2 2 1 0 2 6 0 18 (21) 42 14 24 34 25 33 7 13 44 24 260 Total 622 358 484 380 457 244 165 176 1,333 213 4,432
Note: (1) Agriculture; (2) Food and beverages; (3) Tobacco; (4) Textiles; (5) Apparel; (6) Leather; (7) Wood; (8) Paper; (9) Publishing and printing; (10) Refined petroleum; (11) Chemical products; (12) Rubber; (13) Non-metallic mineral products; (14) Basic metals; (15) Fabricated metal products; (16) Electronic machinery, computers, radio; (17) Motor vehicles; (18) Other transport equipment; (19) Furniture, jewellery, music equipment; (20) Recycling; (21) Services.
Source: Authors’ calculations.
The second dataset that we use for our analysis is the provincial competitiveness index (PCI) data, which was first created for a sample of regions in 2005 and then for all 63 provinces and municipal cities from 2006 onwards. The survey is a product of the collaboration between the Vietnam Chamber of Commerce and Industry (VCCI) and the US Agency for International Development (USAID). PCI is a provincial institutional index, a weighted average of the nine sub-indices, each measuring a different aspect of local formal or informal governance.4
4 For the data and information about the methodology of the PCI index, see PCI (n.d.).

9
Table 3: Number of enterprises by legal ownership and size
Micro Small Medium Total Per cent Household enterprises 2,239 235 8 2,482 (56) Private/sole proprietorship 207 163 23 393 (8.87) Collective/cooperative 37 91 17 145 (3.27) Limited liability companies 385 597 196 1,178 (26.58) Joint stock companies 49 125 60 234 (5.28) Total 2,917
(65.82) 1,211
(27.32) 304
(6.86) 4,432 (100)
(100)
Source: Authors’ calculations.
4 Estimation methods
4.1 Variables
Dependent variable:
There are several different leverage measures used in capital structure studies. Following Köksal and Orman (2014), we consider three different measures of leverage: formal, informal, and total debt over total assets.5 It is important to distinguish between formal and informal leverage since formal debt and informal debt inherently carry different implications for the outcome of the business. As mentioned earlier, firms in transition countries tend to employ more informal forms of financing, reflecting the greater dependence of these firms on families and friends. While these informal sources enable firms to have less pressure from interest rates, they can, however, erode the necessary entrepreneurial efforts to maintain firm survival and growth.
Independent variables:
(i) Profitability is the ratio of before-tax profit to total assets (return on assets (ROA)). While trade-off theory expects a positive impact of profitability on leverage, pecking order theory suggests a negative impact.
(ii) Growth opportunities are reflected by the growth of sales as in Schoubben and Van Hulle (2004), Frank and Goyal (2009), and Köksal and Orman (2014). While trade-off theory predicts a negative impact of firm growth on leverage ratios, pecking order theory predicts a positive impact.
(iii) Following Rajan and Zingales (1995) and Demirguc-Kunt and Maksimovic (1999), we define asset tangibility as the ratio of tangible fixed assets to total assets. Trade-off theory predicts a positive relationship between leverage and tangibility, while pecking order theory generally predicts a negative relationship between leverage and tangibility.
(iv) Following Titman and Wessels (1988) and Rajan and Zingales (1995), firm size consists of labour size (natural logarithm of total number of employees) and economic size (natural logarithm of total assets). Trade-off theory asserts that large firms have higher leverage compared with small firms but, according to pecking order theory, large firms prefer equity to debt, and thus have lower leverage.
5 Formal loans come from weak relationships: banks, venture capital funds, social funds, etc., while informal loans are from strong networks such as families, relatives, friends, private creditors, etc. They are specified from the most important (in value terms) current formal and informal loan respectively.
10
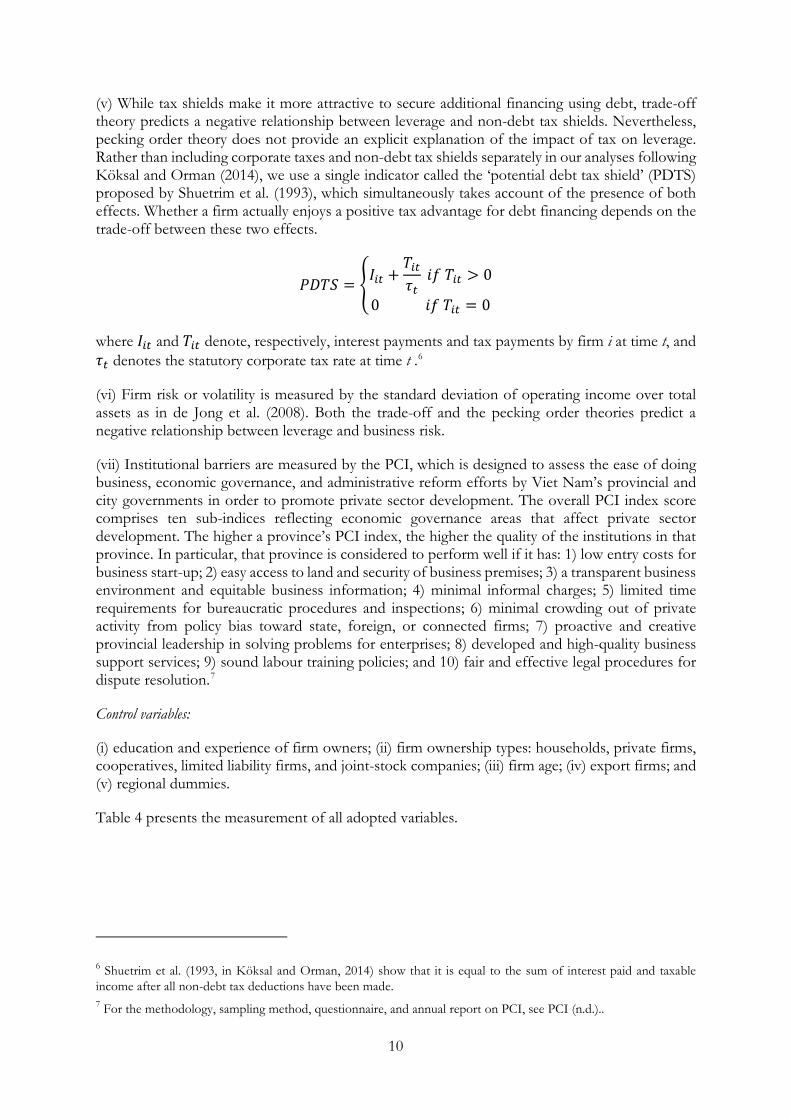
(v) While tax shields make it more attractive to secure additional financing using debt, trade-off theory predicts a negative relationship between leverage and non-debt tax shields. Nevertheless, pecking order theory does not provide an explicit explanation of the impact of tax on leverage. Rather than including corporate taxes and non-debt tax shields separately in our analyses following Köksal and Orman (2014), we use a single indicator called the ‘potential debt tax shield’ (PDTS) proposed by Shuetrim et al. (1993), which simultaneously takes account of the presence of both effects. Whether a firm actually enjoys a positive tax advantage for debt financing depends on the trade-off between these two effects.
𝑃𝑃𝑃𝑃𝑃𝑃𝑃𝑃 = �𝐼𝐼𝑖𝑖𝑖𝑖 +𝑃𝑃𝑖𝑖𝑖𝑖𝜏𝜏𝑖𝑖
𝑖𝑖𝑖𝑖 𝑃𝑃𝑖𝑖𝑖𝑖 > 0
0 𝑖𝑖𝑖𝑖 𝑃𝑃𝑖𝑖𝑖𝑖 = 0
where 𝐼𝐼𝑖𝑖𝑖𝑖 and 𝑃𝑃𝑖𝑖𝑖𝑖 denote, respectively, interest payments and tax payments by firm i at time t, and 𝜏𝜏𝑖𝑖 denotes the statutory corporate tax rate at time t .6
(vi) Firm risk or volatility is measured by the standard deviation of operating income over total assets as in de Jong et al. (2008). Both the trade-off and the pecking order theories predict a negative relationship between leverage and business risk.
(vii) Institutional barriers are measured by the PCI, which is designed to assess the ease of doing business, economic governance, and administrative reform efforts by Viet Nam’s provincial and city governments in order to promote private sector development. The overall PCI index score comprises ten sub-indices reflecting economic governance areas that affect private sector development. The higher a province’s PCI index, the higher the quality of the institutions in that province. In particular, that province is considered to perform well if it has: 1) low entry costs for business start-up; 2) easy access to land and security of business premises; 3) a transparent business environment and equitable business information; 4) minimal informal charges; 5) limited time requirements for bureaucratic procedures and inspections; 6) minimal crowding out of private activity from policy bias toward state, foreign, or connected firms; 7) proactive and creative provincial leadership in solving problems for enterprises; 8) developed and high-quality business support services; 9) sound labour training policies; and 10) fair and effective legal procedures for dispute resolution.7
Control variables:
(i) education and experience of firm owners; (ii) firm ownership types: households, private firms, cooperatives, limited liability firms, and joint-stock companies; (iii) firm age; (iv) export firms; and (v) regional dummies.
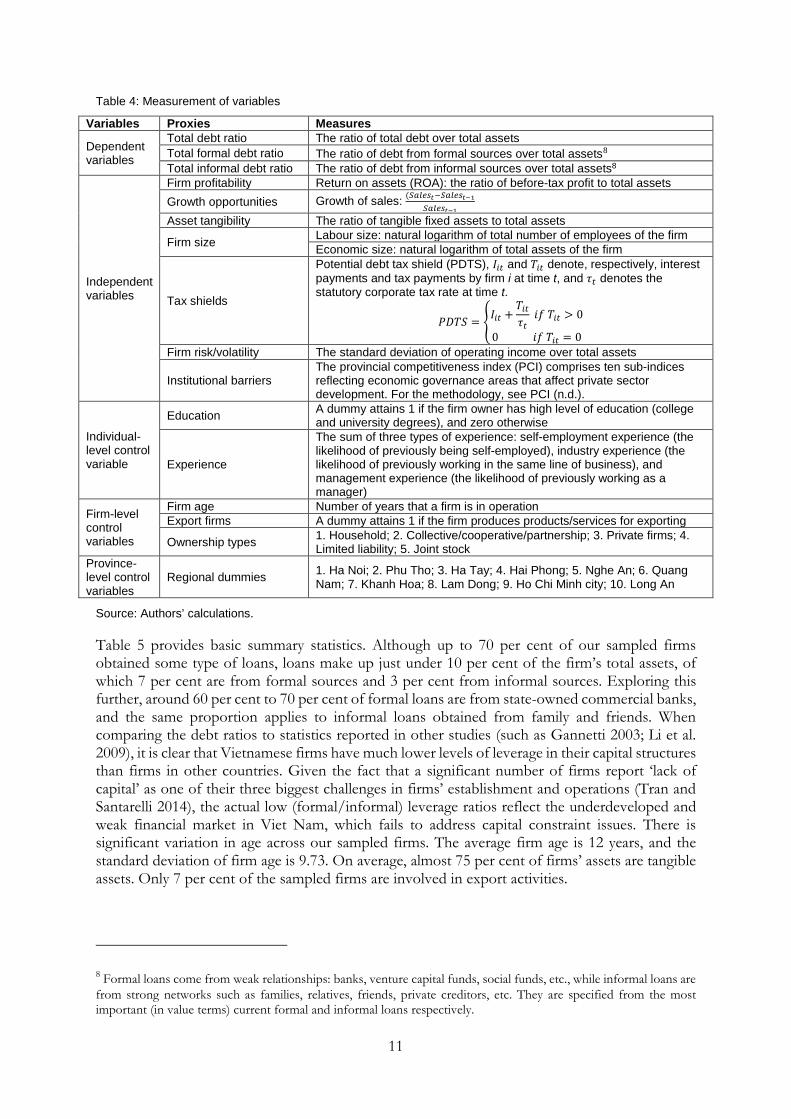
Table 4 presents the measurement of all adopted variables.
6 Shuetrim et al. (1993, in Köksal and Orman, 2014) show that it is equal to the sum of interest paid and taxable income after all non-debt tax deductions have been made. 7 For the methodology, sampling method, questionnaire, and annual report on PCI, see PCI (n.d.)..
11
Table 4: Measurement of variables
Variables Proxies Measures
Dependent variables
Total debt ratio The ratio of total debt over total assets Total formal debt ratio The ratio of debt from formal sources over total assets8 Total informal debt ratio The ratio of debt from informal sources over total assets8
Independent variables
Firm profitability Return on assets (ROA): the ratio of before-tax profit to total assets Growth opportunities Growth of sales: (𝑆𝑆𝑆𝑆𝑆𝑆𝑆𝑆𝑆𝑆𝑡𝑡−𝑆𝑆𝑆𝑆𝑆𝑆𝑆𝑆𝑆𝑆𝑡𝑡−1
𝑆𝑆𝑆𝑆𝑆𝑆𝑆𝑆𝑆𝑆𝑡𝑡−1
Asset tangibility The ratio of tangible fixed assets to total assets
Firm size Labour size: natural logarithm of total number of employees of the firm Economic size: natural logarithm of total assets of the firm
Tax shields
Potential debt tax shield (PDTS), 𝐼𝐼𝑖𝑖𝑖𝑖 and 𝑃𝑃𝑖𝑖𝑖𝑖 denote, respectively, interest payments and tax payments by firm i at time t, and 𝜏𝜏𝑖𝑖 denotes the statutory corporate tax rate at time t.
𝑃𝑃𝑃𝑃𝑃𝑃𝑃𝑃 = �𝐼𝐼𝑖𝑖𝑖𝑖 +𝑃𝑃𝑖𝑖𝑖𝑖𝜏𝜏𝑖𝑖
𝑖𝑖𝑖𝑖 𝑃𝑃𝑖𝑖𝑖𝑖 > 0
0 𝑖𝑖𝑖𝑖 𝑃𝑃𝑖𝑖𝑖𝑖 = 0
Firm risk/volatility The standard deviation of operating income over total assets
Institutional barriers The provincial competitiveness index (PCI) comprises ten sub-indices reflecting economic governance areas that affect private sector development. For the methodology, see PCI (n.d.).
Individual-level control variable
Education A dummy attains 1 if the firm owner has high level of education (college and university degrees), and zero otherwise
Experience
The sum of three types of experience: self-employment experience (the likelihood of previously being self-employed), industry experience (the likelihood of previously working in the same line of business), and management experience (the likelihood of previously working as a manager)
Firm-level control variables
Firm age Number of years that a firm is in operation Export firms A dummy attains 1 if the firm produces products/services for exporting
Ownership types 1. Household; 2. Collective/cooperative/partnership; 3. Private firms; 4. Limited liability; 5. Joint stock
Province-level control variables
Regional dummies 1. Ha Noi; 2. Phu Tho; 3. Ha Tay; 4. Hai Phong; 5. Nghe An; 6. Quang Nam; 7. Khanh Hoa; 8. Lam Dong; 9. Ho Chi Minh city; 10. Long An
Source: Authors’ calculations.
Table 5 provides basic summary statistics. Although up to 70 per cent of our sampled firms obtained some type of loans, loans make up just under 10 per cent of the firm’s total assets, of which 7 per cent are from formal sources and 3 per cent from informal sources. Exploring this further, around 60 per cent to 70 per cent of formal loans are from state-owned commercial banks, and the same proportion applies to informal loans obtained from family and friends. When comparing the debt ratios to statistics reported in other studies (such as Gannetti 2003; Li et al. 2009), it is clear that Vietnamese firms have much lower levels of leverage in their capital structures than firms in other countries. Given the fact that a significant number of firms report ‘lack of capital’ as one of their three biggest challenges in firms’ establishment and operations (Tran and Santarelli 2014), the actual low (formal/informal) leverage ratios reflect the underdeveloped and weak financial market in Viet Nam, which fails to address capital constraint issues. There is significant variation in age across our sampled firms. The average firm age is 12 years, and the standard deviation of firm age is 9.73. On average, almost 75 per cent of firms’ assets are tangible assets. Only 7 per cent of the sampled firms are involved in export activities.
8 Formal loans come from weak relationships: banks, venture capital funds, social funds, etc., while informal loans are from strong networks such as families, relatives, friends, private creditors, etc. They are specified from the most important (in value terms) current formal and informal loans respectively.
12
The correlation matrix in Table 5 indicates that there are high correlations of 0.71 and 0.52 between the overall leverage level and the formal/informal debt ratios respectively, reflecting the fact that formal and informal loans are equally important to Vietnamese firms in financing their investments. There is a trivial correlation of 0.04 between formal debt ratio and informal debt ratio, which indicates that firms mainly rely on one loan source at a particular point of time, rather than using both at the same time. Firm size is significantly and negatively correlated with firms’ ROA: smaller firms are more profitable. Profitability is positively associated with all measures of leverage, whereas asset tangibility is negatively associated with these measures. Export firms appear to be more leveraged than their counterparts. We also find a significantly positive correlation between the entrepreneur’s human capital variables and leverage ratios. Finally, PCI index is negatively associated with all measures of human capital and leverage ratios. This indicates that firms are less financially constrained in provinces with high-quality institutions. However, these provinces are also attractive repositories of highly educated and richly experienced entrepreneurs, suggesting some possible interactions between institutional quality and the entrepreneur’s human capital.

13
Table 5: Descriptive statistics and pair-wise correlation matrix
Var Mean Std Min Max (1) (2) (3) (4) (5) (6) (7) (8) (9) (10) (11) (12) (13) (14) (15) (16) (17) (1) 0.099 0.29 0 13.3 1.00 (2) 0.07 0.24 0 12.5 0.71* 1.00 (3) 0.03 0.15 0 9.8 0.52* 0.04* 1.00 (4) 11.82 9.73 0 76 -.06* -.05* -.05* 1.00 (5) 14.09 1.72 4.59 20.8 0.02* 0.03* -.04* -.04* 1.00 (6) 2.07 1.14 0 7.56 0.16* 0.15* 0.09* -.13* 0.64* 1.00 (7) 0.35 3.35 -1.3 406 0.03* 0.03* 0.02* -.02* -.08* -.00 1.00 (8) 18.2 1,496 -1 196,001 0.00 0.01 0.00 -.00 0.01 0.01 -0.00 1.00 (9) 0.22 0.91 0 60.1 0.04* 0.04* 0.03* -.03* -.09* 0.01 0.71* -0.00 1.00 (10) 0.75 0.30 0 1 -.07* -.12* -.14* 0.04* 0.07* -.01 -.02* 0.00 -.01 1.00 (11) 817,525 149*105 0 178*107 0.03* 0.03* 0.00 -0.00 0.09* 0.10* 0.00 -0.00 0.00 -.03* 1.00 (12) 0.074 0.26 0 1 0.09* 0.08* 0.05* -.04* 0.25* 0.38* 0.00 -0.00 0.01 -.04* 0.05* 1.00 (13) 0.27 0.44 0 1 0.11* 0.09* 0.08* -.14* 0.36* 0.43* -0.01 -0.00 0.01 -.05* 0.06* 0.20* 1.00 (14) 0.26 0.44 0 1 0.01 0.00 -.01 .01 -.02* -.06* 0.01 -0.01 -.00 0.03* -0.01 -.04* -.15* 1.00 (15) 0.062 0.24 0 1 0.04* 0.03* 0.03* -.06* 0.09* 0.16* -0.01 -0.00 -.00 0.03* -0.00 0.09* -.16* -0.01 1.00 (16) 0.114 0.32 0 1 0.05* 0.03* 0.03* -.09* -.14* -0.01 0.00 0.00 -.01 -0.01 -.06* -.01 -.02* -.05* 0.04* 1.00 (17) 57.9 4.09 47.7 67.1 -.04* -.03* -.04* -.06* 0.15* 0.05* -0.00 0.04* -.00 0.03* -.15* 0.02* 0.05* 0.05* -.01 0.01 1.00
Note: * significant at 1 per cent level. (1) debt ratio; (2) formal debt ratio; (3) informal debt ratio; (4) firm age; (5) economic size; (6) labour size; (7) return on assets (ROA); (8) growth of sales; (9) firm volatility; (10) firm tangibility; (11) potential debt tax shield (PDTS); (12) export firm; (13) education; (14) self-employment experience; (15) management experience; (16) industry experience (17) provincial competitiveness index (PCI).
Source: Authors’ calculations.

14
4.2 Methodology
We estimate a dynamic panel model that estimates the unobserved leverage ratio, t, from the past leverage ratio, t-1 and other explanatory variables.
𝐿𝐿𝐿𝐿𝐿𝐿𝑖𝑖,𝑖𝑖 = 𝛼𝛼𝐿𝐿𝐿𝐿𝐿𝐿𝑖𝑖,𝑖𝑖−1 + 𝛽𝛽𝑋𝑋𝑖𝑖,𝑖𝑖 + 𝛾𝛾𝑃𝑃𝑃𝑃𝐼𝐼𝑖𝑖,𝑖𝑖 + 𝛿𝛿𝑖𝑖,𝑖𝑖 (1)
where 𝐿𝐿𝐿𝐿𝐿𝐿𝑖𝑖,𝑖𝑖 is firm i’s debt ratio in year t, 𝐿𝐿𝐿𝐿𝐿𝐿𝑖𝑖,𝑖𝑖−1 is firm i’s debt ratio in year t-1, 𝛼𝛼 is the adjustment parameter, 𝛽𝛽 and 𝛾𝛾 are the coefficients to be estimated. 𝑋𝑋𝑖𝑖,𝑖𝑖 are observable firm and province characteristics, and 𝑃𝑃𝑃𝑃𝐼𝐼𝑖𝑖,𝑖𝑖 is institutional quality index of the province where firm i is located.
Equation (1) contains the endogenous lagged dependent variable and the short panel bias (Blundell and Bond 1998; Huang and Ritter 2009). We therefore use the system GMM technique to estimate equation (1), and we control for the potential endogeneity of the explanatory variables, including the lagged dependent variable, by using lags of the same variables as instruments. According to Wintoki et al. (2012), the system GMM procedure can both take advantage of the panel structure of our dataset and account for the frequently ignored methodological concerns that are common to corporate finance studies, such as dynamic endogeneity.
5 Estimation results
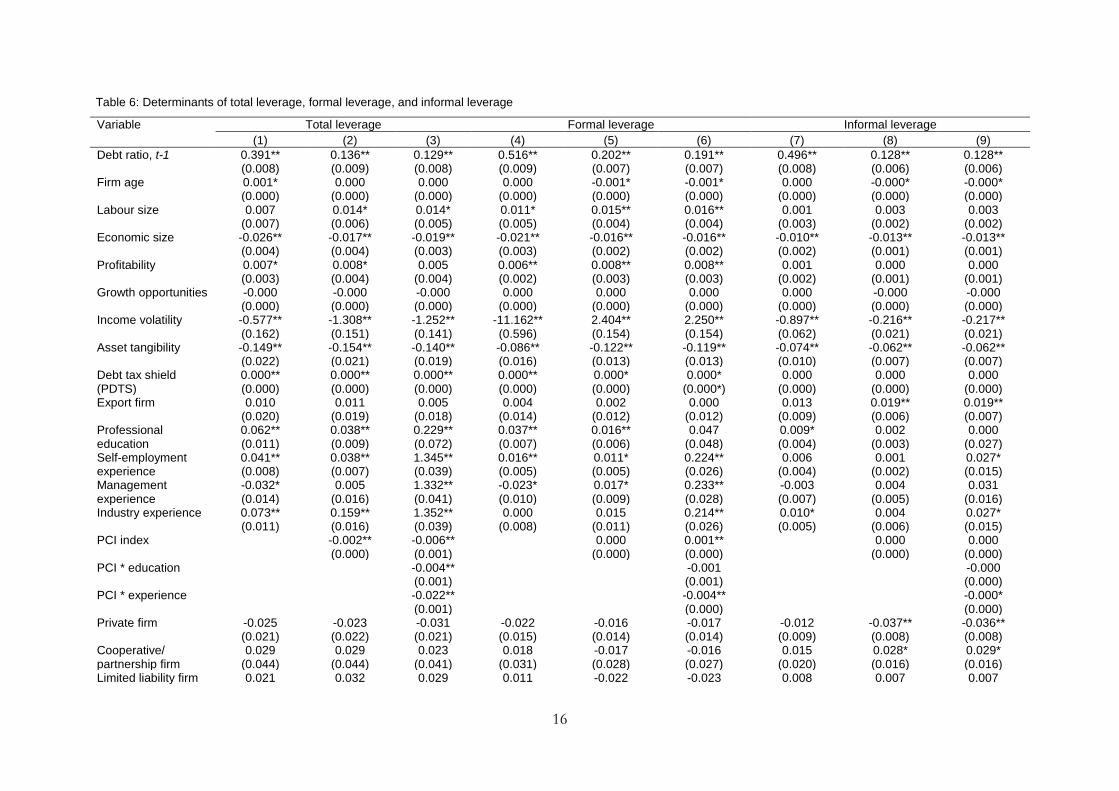
We estimate three equations in which the overall debt ratio, the formal debt ratio, and the informal debt ratio take turns to be the dependent variable. The results are presented in Table 6. For each equation, we provide three treatments: columns (1), (4), and (7) examine the relationship between capital structure determinants and the three leverage ratios; columns (2), (5), and (8) add provincial institutional quality index into the estimation; and columns (3), (6), and (9) look into the interaction between institutional quality and the entrepreneur’s human capital variables. We will now look at the effect of individual capital structure determinants to explore if our hypothesis is supported.
The results show that firm size is a reliable factor for all sources of leverage. This seems to be driven more by countries with weak institutional settings, in which the liability of newness and smallness represents a key challenge to start-up firms. While labour size has a significant and positive relationship with leverage ratios, which supports the trade-off theory’s assertion that large firms have higher leverage compared with small firms, economic size is negatively associated with debt financing. Firms with large asset pools are able to leverage their assets to various means to create stable cash in-flows without debt obligations.
Profitability has a significantly positive impact on overall and formal leverage. As profitability increases, the higher are the expected tax rates and the lower the bankruptcy risk, which pushes firms to obtain more (formal) loans to capitalize abundant growth opportunities in a transitional economic setting, as well as to shield their income from taxation. This again supports the trade-off theory. Furthermore, high profitability also improves firms’ credit ratings to obtain formal loans, so they rely less on informal loan sources when it comes to further investments. However, sales growth does not exert a significant impact on leverage, which fails to support either the trade-off theory or pecking order theory.
We also find that asset tangibility reflects the availability of collateral for acquiring loans. Nevertheless, we find a significant and negative relationship between firms’ asset tangibility and leverage ratios, which supports the pecking order theory. Given the underdevelopment of the

15
financial market and the importance of informal loans in Viet Nam, access to formal loans is challenging, and thus rather than obtaining credits, firms will try to bootstrap by all means such as by leasing or renting their land or factories, to create stable income from their large fixed assets. However, we do support both the trade-off theory and pecking order theory in finding a significant and negative relationship between firm risk (volatility) and leverage. The volatility of firms’ incomes indicates the instability of returns to entrepreneurs and a higher risk of bankruptcy, but also a large potential magnitude of profit. Thus, although a higher risk of returns is correlated with lower debt ratios, the magnitude of the correlation is weaker with informal debt ratios. Given its open policy for the last three decades, Viet Nam is characterized by a generation of young, ambitious, and dynamic entrepreneurs who are willing to take advantage of every opportunity that comes their way. Unable to obtain loans from formal sources due to volatile cash flows, they renegotiate terms with family and friends to obtain informal financial support.
Finally, potential debt tax shields are significantly and positively associated with leverage. These tax shields act as powerful substitutes for corporate tax benefits of debt financing, and thus firms with higher amounts of debt tax shields should choose to have lower levels of debt according to the trade-off theory. However, we fail to support this theory for the case of Viet Nam. We claim that these tax shield benefits, such as depreciation deductions, depletion allowances, and investment tax credits, make it more attractive to secure additional financing. Nevertheless, these tax shield benefits are strongly available when we consider the overall and formal leverage ratios of firms. They gradually lose their significance, and become insignificant and irrelevant for informal leverage sources. Obviously, loans acquired from informal sources, such as families and friends, are considered as internal/own capital, and thus are not applicable for any tax exemption or shield benefits.
Overall, our findings support the trade-off theory with respect to the effects of profitability, volatility, and firm size, while supporting the pecking order theory with respect to asset tangibility. Therefore, overall, we cannot strongly support our hypothesis, and contend that the leverage decisions of firms in Viet Nam follow the explanations of both the pecking order theory and the trade-off theory. They work in a complementary rather than mutually exclusive manner in explaining the capital structure decisions of firms in a transition economic setting.
16
Table 6: Determinants of total leverage, formal leverage, and informal leverage
Variable Total leverage Formal leverage Informal leverage (1) (2) (3) (4) (5) (6) (7) (8) (9)
Debt ratio, t-1 0.391** (0.008)
0.136** (0.009)
0.129** (0.008)
0.516** (0.009)
0.202** (0.007)
0.191** (0.007)
0.496** (0.008)
0.128** (0.006)
0.128** (0.006)
Firm age 0.001* (0.000)
0.000 (0.000)
0.000 (0.000)
0.000 (0.000)
-0.001* (0.000)
-0.001* (0.000)
0.000 (0.000)
-0.000* (0.000)
-0.000* (0.000)
Labour size 0.007 (0.007)
0.014* (0.006)
0.014* (0.005)
0.011* (0.005)
0.015** (0.004)
0.016** (0.004)
0.001 (0.003)
0.003 (0.002)
0.003 (0.002)
Economic size -0.026** (0.004)
-0.017** (0.004)
-0.019** (0.003)
-0.021** (0.003)
-0.016** (0.002)
-0.016** (0.002)
-0.010** (0.002)
-0.013** (0.001)
-0.013** (0.001)
Profitability 0.007* (0.003)
0.008* (0.004)
0.005 (0.004)
0.006** (0.002)
0.008** (0.003)
0.008** (0.003)
0.001 (0.002)
0.000 (0.001)
0.000 (0.001)
Growth opportunities -0.000 (0.000)
-0.000 (0.000)
-0.000 (0.000)
0.000 (0.000)
0.000 (0.000)
0.000 (0.000)
0.000 (0.000)
-0.000 (0.000)
-0.000 (0.000)
Income volatility -0.577** (0.162)
-1.308** (0.151)
-1.252** (0.141)
-11.162** (0.596)
2.404** (0.154)
2.250** (0.154)
-0.897** (0.062)
-0.216** (0.021)
-0.217** (0.021)
Asset tangibility -0.149** (0.022)
-0.154** (0.021)
-0.140** (0.019)
-0.086** (0.016)
-0.122** (0.013)
-0.119** (0.013)
-0.074** (0.010)
-0.062** (0.007)
-0.062** (0.007)
Debt tax shield (PDTS)
0.000** (0.000)
0.000** (0.000)
0.000** (0.000)
0.000** (0.000)
0.000* (0.000)
0.000* (0.000*)
0.000 (0.000)
0.000 (0.000)
0.000 (0.000)
Export firm 0.010 (0.020)
0.011 (0.019)
0.005 (0.018)
0.004 (0.014)
0.002 (0.012)
0.000 (0.012)
0.013 (0.009)
0.019** (0.006)
0.019** (0.007)
Professional education
0.062** (0.011)
0.038** (0.009)
0.229** (0.072)
0.037** (0.007)
0.016** (0.006)
0.047 (0.048)
0.009* (0.004)
0.002 (0.003)
0.000 (0.027)
Self-employment experience
0.041** (0.008)
0.038** (0.007)
1.345** (0.039)
0.016** (0.005)
0.011* (0.005)
0.224** (0.026)
0.006 (0.004)
0.001 (0.002)
0.027* (0.015)
Management experience
-0.032* (0.014)
0.005 (0.016)
1.332** (0.041)
-0.023* (0.010)
0.017* (0.009)
0.233** (0.028)
-0.003 (0.007)
0.004 (0.005)
0.031 (0.016)
Industry experience 0.073** (0.011)
0.159** (0.016)
1.352** (0.039)
0.000 (0.008)
0.015 (0.011)
0.214** (0.026)
0.010* (0.005)
0.004 (0.006)
0.027* (0.015)
PCI index -0.002** (0.000)
-0.006** (0.001)
0.000 (0.000)
0.001** (0.000)
0.000 (0.000)
0.000 (0.000)
PCI * education -0.004** (0.001)
-0.001 (0.001)
-0.000 (0.000)
PCI * experience -0.022** (0.001)
-0.004** (0.000)
-0.000* (0.000)
Private firm -0.025 (0.021)
-0.023 (0.022)
-0.031 (0.021)
-0.022 (0.015)
-0.016 (0.014)
-0.017 (0.014)
-0.012 (0.009)
-0.037** (0.008)
-0.036** (0.008)
Cooperative/ partnership firm
0.029 (0.044)
0.029 (0.044)
0.023 (0.041)
0.018 (0.031)
-0.017 (0.028)
-0.016 (0.027)
0.015 (0.020)
0.028* (0.016)
0.029* (0.016)
Limited liability firm 0.021 0.032 0.029 0.011 -0.022 -0.023 0.008 0.007 0.007

17
(0.025) (0.024) (0.023) (0.018) (0.015) (0.015) (0.011) (0.008) (0.008) Joint stock firm -0.039
(0.043) -0.064 (0.039)
-0.045 (0.036)
-0.006 (0.031)
-0.042* (0.024)
-0.041* (0.024)
-0.018 (0.019)
-0.032* (0.014)
-0.033* (0.014)
Provincial dummies 𝜒𝜒2(8)=230** 𝜒𝜒2(8)=513** 𝜒𝜒2(8)=513**
𝜒𝜒2(8)=228** 𝜒𝜒2(8)=698** 𝜒𝜒2(8)=699** 𝜒𝜒2(8)=584** 𝜒𝜒2(8)=1,337** 𝜒𝜒2(8)=1,332**
Intercept 1.129** (0.165)
0.027 (0.139)
0.672** (0.132)
18.404** (1.156)
9.183** (0.310)
8.909** (0.311)
-2.868** (0.233)
-0.886** (0.067)
-0.889** (0.068)
Wald 𝜒𝜒2 test 𝜒𝜒2(27)=3,244**
𝜒𝜒2(28)=1,751**
𝜒𝜒2(30)=3028**
𝜒𝜒2(27)=6,957**
𝜒𝜒2(28)=9,007**
𝜒𝜒2(29)=9,170**
𝜒𝜒2(26)=6,722**
𝜒𝜒2(27)=7,039**
𝜒𝜒2(25)=7,045**
Observations 18,358 16,309 16,309 16,098 14,049 14,049 16,098 14,049 14,049
Source: Authors’ calculations.

18
With regard to the effects of control variables, firm and individual characteristics that explain total debt decisions appear to play a similar role in formal and informal debt decisions, although the statistical significance may differ. Export firms in particular are slightly more indebted, but their loans are mainly from informal sources. As expected, the entrepreneur’s human capital is a crucial determinant of a firm’s capital structure. We find a consistent positive impact of professional education on the overall and the formal leverage ratios. Keeping other factors constant, entrepreneurs with high education levels (college and university degrees) are more likely to have 6.2 per cent higher financial leverage. Since education level is always one of the most important screening criteria for banks and venture capital funds to make investment decisions, it is plausible that highly educated entrepreneurs find it easier to obtain formal loans. Surprisingly, while self-employment and industry experience are important for obtaining loans, especially formal ones, management experience plays the exact opposite role. An entrepreneur who has owned/started up a firm previously or has worked in the same line of business gives a positive signal to formal creditors when they evaluate the risks and returns of investments into a firm. This valuable entrepreneurial experience is also found to exert a significantly positive effect on various measures of entrepreneurial performance in Viet Nam (Santarelli and Tran 2013). However, management experience is more meaningful to wage employment opportunities (Tran et al. 2017). As expected, we consistently find an insignificant effect of human capital variables on the informal debt ratio.
Importantly, disparities in regional institutional development matter for firms’ leverage decisions. Our variable of interest, provincial institutional quality, is negatively associated with the overall leverage ratio. Firms residing in provinces with high-quality institutions are found to have lower leverage levels than their counterparts in low-quality institutions. Advanced market institutions require banks to apply strict screening criteria to monitor loan financing, and, thus, firms with bad credit in well-developed provinces cannot obtain loans or cannot borrow as much as they want. However, a developed institutional environment also favours the emergence and development of alternative financing instruments such as equity and, as a result, local firms reduce their reliance on debt financing (Li et al. 2009). The significant and positive effect of PCI on the formal debt ratio indicates that better legal rules and better protection of creditors in high-quality institutions also encourage more formal debt financing (supporting Demirguc-Kunt and Maksimovic 1999). But it is worth noting that our measure of institutional development across regions (PCI) in Viet Nam is much broader than the creditor protection measure typically used in prior work.
While higher professional education is positively associated with leverage ratios, institutional quality has a negative impact on debt financing. Further, better developed provinces are attractive destinations for highly educated entrepreneurs and workers in general. These inconclusive pair-wise correlations suggest the need to study the interaction effects of human capital and institutional quality on capital structure decisions. We present the estimation results of these interactions in columns (3), (6), and (9) for the overall debt ratio, formal debt ratio, and informal debt ratio respectively. Interestingly, although human capital motivates and enables entrepreneurs to adopt debt financing, highly educated and experienced entrepreneurs residing in high-quality institutions do not find loans attractive as other sources of finance. Being exposed to various sources of finance in a well-developed province with an advanced financial market, they acquire fewer loans and move toward more sophisticated financial sources (such as venture capital). The single effect of education becomes insignificant when we add its interaction term with PCI in the estimation. This again affirms the crucial role of the institutional environment in obtaining loans in particular and capital structure decisions in general. No matter how well educated entrepreneurs are, they fail to access debt financing if they are located in a province with low-quality institutions. In summary, we show that human capital and institutional development interact in important ways to affect capital structure decisions: the role of human capital in firms’ capital structure decisions is strengthened in more developed provinces. As suggested by Carbonara et al. (2016), advanced

19
institutional quality not only facilitates the development of an efficient financial market that eases access to formal loans and other more attractive sources of finance, but it also promotes entrepreneurial start-up activities in different economic settings.
6 Discussion and conclusion
Employing a unique database on Vietnamese firms, this paper addresses the questions: ‘which capital structure theory—trade-off or pecking-order—best explains the capital structure decisions of non-state and non-listed firms during the post-transition process in Viet Nam?’ and ‘how do human capital and provincial institutional quality as well as their interaction influence these decisions?’. We classify the determinants into three categories: individual-level, firm-level, and regional-level categories and find that the leverage decisions of Vietnamese firms generally follow the explanation of both the trade-off theory with respect to the effects of profitability, volatility, and firm size, and pecking order theory with respect to the effect of asset tangibility. Although many studies favour either the trade-off theory or pecking order theory over the other to describe the capital structures of firms (Köksal and Orman 2014), we claim that this is not necessarily the case for young and dynamic entrepreneurs in a transition country. Both theories work in a complementary manner to explain the financing choices of private firms in Viet Nam. Since the financial market is underdeveloped and state-controlled in Viet Nam and non-state firms are constrained by a complex credit-rationing process, accessing formal sources of loans is extremely tough for young and non-state firms. However, Viet Nam is a land full of opportunity where entrepreneurs always have new opportunities to begin again after failed business attempts, with the support of their family and friends (Tran et al. 2017). Thus, given their liability of newness and smallness, bootstrapping skills and informal sources of finance are far more essential to their financial decisions. It is therefore not possible to explain this informality characteristic of firms’ capital structure in transition countries in general, and Viet Nam in particular, by relying on only one particular standard capital structure theory.
Given the widespread prevalence of informal loans, we study how informality in the financing market is associated with the leverage decisions of firms. We find a rather consistent pattern of estimation results in terms of effect direction across all sources of loans. Nevertheless, profitability and debt tax shields are no longer significantly important when entrepreneurs adopt informal debt financing. Finally, identifying an optimal capital structure or a beneficial leverage level depends significantly on the local institutional environment. We study the effect of provincial institutions on firms’ leverage levels and find that high-quality institutions with transparent and fair credit rationing rules, legal protection of creditors, and efficient government involvement enables firms to reduce their reliance on debt financing and to adopt other more appropriate sources of financing.
Inspection of individual characteristics reveals that the human capital of entrepreneurs is an important factor in determining their capital structure. Generally, educated and experienced entrepreneurs are more likely to take loans to finance their investments. However, when entrepreneurs reside in a high-quality institutional province, education and experience may respond adversely to leveraging decisions. They all use fewer loans and switch to other more attractive financial sources that become available and accessible when institutional quality is improved.
Our results are relevant for policy makers and managers of firms in transition economies. The evidence supports the well-studied consensus that obtaining external formal financing is extremely difficult for firms in these countries. As a result, they mostly rely on internally generated funds or

20
informal financing sources to support their investment activities and growth (Mateev et al. 2013). We claim that institutional quality plays a crucial role in easing access to formal debt financing, and thus extending financing choices for non-state firms.
Nevertheless, the situation has improved since the enactment of the new Law on State Bank and Law on Credit Institutions in December 1997. State-owned commercial banks were restructured toward stock holding institutions and the State Bank of Vietnam was reformed toward specializing in monetary policy and supervising the banking system. Credit institutions, regardless of ownership, are growing in terms of quantity and quality, which provides firms with easier access to various sources of financing in a more market-oriented manner (World Bank 2005).
References
Antoniou A., G. Yilmaz, and P. Krishna (2008). ‘The Determinants of Capital Structure: Capital Market-oriented versus Bank-oriented Institutions. Journal of Financial and Quantitative Analysis, 43(1): 59–92.
Baker M., and J. Wurgler (2002). ‘Market Timing and Capital Structure’. Journal of Finance, 57(1): 1–32.
Baskin J.B. (1989). ‘An Empirical Investigation of the Pecking Order Hypothesis’. Financial Management, 18(1): 26–35.
Blundell, R.W., and S.R. Bond (1998). ‘Initial Conditions and Moment Restrictions in Dynamic Panel Data Models’. Journal of Econometrics, 87(1): 115–43.
Bonfim D., and P. Antão (2012). ‘The Dynamics of Capital Structure Decisions’. Banco De Portugal Working Paper Series No. 6. Lisbon: Economics and Research Department, Banco de Portugal.
Booth L., V. Aivazian, A. Demirguc-Kunt, and V. Maksimovic (2001). ‘Capital Structures in Developing Countries’. The Journal of Finance, 56(1): 87–130.
Bradley M., A.J. Gregg, and E.H. Kim (1984). ‘On the Existence of an Optimal Capital Structure: Theory and Evidence’. Journal of Finance, 39(3): 857–78.
Brandt L., and H. Li (2003). ‘Bank Discrimination in Transition Economies: Ideology, Information, and Incentives?’. Journal of Comparative Economics, 31(3): 387–413.
Carbonara E., E. Santarelli, and H.T. Tran (2016). ‘De Jure Determinants of New Firm Formation: How the Pillars of Constitutions Influence Entrepreneurship’. Small Business Economics, 47(1): 139–62.
Chang C., X. Chen, and G. Liao (2014). ‘What are the Reliably Important Determinants of Capital Structure in China?’. Pacific Basin Finance Journal, 30(1): 87–113.
CIEM, DoE, ILSSA, and UNU-WIDER (2011). Characteristics of the Vietnamese Business Environment: Evidence from a SME Survey in 2011. Available at: https://www.wider.unu.edu/sites/default/files/Report-Characteristics%20of%20the%20Vietnamese%20Business%20Environment-Eng.pdf (accessed on 8 February 2017).
Correa C., L.C. Basso, and W.T. Nakamura (2007). ‘What Determines the Capital Structure of the Largest Brazilian Firms? An Empirical Analysis Using Panel Data’. Available at: http://dx.doi.org/10.2139/ssrn.989047 (accessed on 15 February 2017).
21
Cull R., L.C. Xu, and Z. Tian (2009). ‘Formal Finance and Trade Credit during China’s Transition’. Journal of Financial Intermediation, 18(2): 173–92.
DeAngelo H., and R.W. Masulis (1980). ‘Optimal Capital Structure under Corporate and Personal Taxation’. Journal of Financial Economics, 8(1): 3–29.
Decoure N. (2007) ‘The Determinants of Capital Structure in Transition Economies’. International Review of Economics and Finance, 16: 400–15.
Deesomsak R., K. Paudyal, and G. Pescetto (2004). ‘The Determinants of Capital Structure: Evidence from the Asia Pacific Region’. Journal of Multinational Financial Management, 14: 387–405.
De Haas R., and M. Peeters (2006). ‘The Dynamic Adjustment towards Target Capital Structures of Firms in Transition Economies’. Economics of Transition, 14(1): 133–69.
de Jong A., R. Kabir, and T.T. Nguyen (2008). ‘Capital Structure around the World: The Roles of Firm- and Country-specific Determinants’. Journal of Banking & Finance, 32 (9): 1954–69.
de Jong A., M. Verbeek, and P. Verwijmeren (2012). ‘Does Financial Flexibility Reduce Investment Distortions?’. Journal of Financial Research, 35(2): 243–59.
Demirguc-Kunt A., and V. Maksimovic. (1999). ‘Institutions, Financial Markets and Firm Debt Maturity’. Journal of Financial Economics, 54: 295–336.
Espinosa C.M., C.V. Maquieira, J.P. Vieito, and M.A. Gonzalez (2012). ‘Capital Structures in Developing Economies: The Latin American Case’. Investigacion Economica, 71(282): 35–54.
Frank M.Z., and V.K. Goyal (2009). ‘Capital Structure Decisions: Which Factors are Reliably Important?’. Financial Management, 38(1): 1–37.
Gannetti R.T. (2003). ‘Bowling Ninepins in Tocqueville's Township’. American Political Science Review, 97(1): 1–16.
Glewwe P., and H.A.H. Dang (2011). ‘Was Vietnam’s Economic Growth in the 1990s Pro-poor? An Analysis of Panel Data from Vietnam’. Economic Development and Cultural Change, 59(3): 583–608.
GSO (General Statistics Office of Vietnam) (2016). Statistic Yearbook 2016. Hanoi: Statistical Publisher:
Harris M., and A. Raviv (1991). ‘The Theory of Capital Structure’. Journal of Finance, 46(1): 297–355.
Heaton J.B. (2002). ‘Managerial Optimism and Corporate Finance’. Financial Management, 31(2): 33–45.
Huang R., and J.R. Ritter (2009). ‘Testing Theories of Capital Structure and Estimating the Speed of Adjustment. Journal of Financial and Quantitative Analysis, 44(2): 237–71.
Huang S.G.H., and F.M. Song (2006). ‘The Determinants of Capital Structure: Evidence from China’. China Economic Review, 17(1): 14–35.
Jensen M., and W.H. Meckling (1976). ‘Can the Corporation Survive?’. Center for Research in Government Policy and Business Working Paper PPS 76-4. Rochester, NY: University of Rochester.
Köksal B., and C. Orman (2014). ‘Determinants of Capital Structure: Evidence from a Major Developing Economy’. Small Business Economics, 44(2): 255–82.
Li K., H. Yue, and L. Zhao (2009). ‘Ownership, Institutions, and Capital Structure: Evidence from China’.Journal of Comparative Economics, 37(3): 471–90.

22
Malesky E.J., and M. Taussig (2009). ‘Where is Credit Due? Legal Institutions, Connections and the Efficiency of Bank Lending in Vietnam’. Journal of Law, Economics and Organization, 25(2): 535–78.
Mateev M., P. Poutziouris, and K. Ivanov (2013). ‘On the Determinant of SME Capital Structure in Central and Eastern Europe. A Dynamic Panel Analysis’. Research in International Business and Finance, 27(1): 28–51.
Miller M.H. (1977). ‘Debt and Taxes’. Journal of Finance, 32(4): 261–75.
Myers S.C. (1984). ‘The Capital Structure Puzzle’. Journal of Finance, 39(3): 575–92.
Myers S.C., and N.S. Majluf (1984). ‘Corporate Financing and Investment Decision when Firms have Information that Investors Do not Have’. Journal of Financial Economics, 13(2): 187–221.
Newman A., S. Gunessee, and B. Hilton (2012). ‘Applicability of Financial Theories of Capital Structure to the Chinese Cultural Context: A Study of Privately Owned SMEs’. International Small Business Journal, 30(1), 65–83.
Nguyen D.T., I. Diaz-Rainey, and A. Gregoriou (2012). ‘Financial Development and the Determinants of Capital Structure in Vietnam’. Available at: http://dx.doi.org/ 10.2139/ssrn.2014834 (accessed on 15 February 2017).
Nguyen X.T., (2010). ‘The Determinants of Capital Structure: An Empirical Study of Listed Firms on the Vietnamese Stock Exchange. Finance and Corporate Governance Conference 2011 Paper. Available at: http://ssrn.com/abstract=1725710 (accessed on 15 February 2017).
Ou C., and G.W. Haynes (2006). ‘Acquisition of Additional Equity Capital by Small Firms: Findings from the National Survey of Small Business Finance’. Small Business Economics, 27(2): 157–68.
Öztekin O. (2015). ‘Capital Structure Decisions around the World: Which Factors are Reliably Important?’. Journal of Financial and Quantitative Analysis, 50(3): 301–23.
Pandey I.M. (2004). ‘Capital Structure, Profitability and Market Structure: Evidence from Malaysia’. Asia Pacific Journal of Economics & Business, 8(2): 78–91.
PCI (n.d.). ‘The Provincial Competitiveness Index (PCI)’. Available at: http://eng.pcivietnam.org/index.php and http://eng.pcivietnam.org/about/pci-methodology/ (accessed on 8 February 2017).
Qian Y., T. Yao, and T.S. Wirjanto (2009). ‘Do Chinese Publicly Listed Companies Adjust their Capital Structure toward a Target Level?’. China Economic Review, 20(4): 662–76.
Qureshi M. (2009). ‘Does Pecking Order Theory Explain Leverage Behavior in Pakistan?’. Applied Financial Economics, 19(17): 1365–70.
Rajan R.G., and L. Zingales (1995). ‘What Do We Know about Capital Structure? Some Evidence from International Data. The Journal of Finance, 50(5): 1421–60.
Ramalho J., and J. Silva (2009). ‘A Two-part Fractional Regression Model for the Financial Leverage Decisions of Micro, Small, Medium and Large Firms. Quantitative Finance, 9(5): 621–36.
Rand J. (2007). ‘Credit Constraints and Determinants of the Cost of Capital in Vietnamese Manufacturing’. Small Business Economics, 29(1–2): 1–13.
Rubinstein M. (2003). ‘Great Moments in Financial Economics: II. Modigliani-Miller Theorem. Journal of Investment Management, 1(2): 7–13.

23
Santarelli E., and H.T. Tran (2013). ‘The Interplay of Human and Social Capital in Shaping Entrepreneurial Performance: The Case of Vietnam’. Small Business Economics, 40 (2): 435–58.
Sbeti W.M., and I. Moosa (2012). ‘Firm-specific Factors as Determinants of Capital Structure in the Absence of Taxes’. Journal of Applied Financial Economics, 22(3): 209–13.
Schoubben F., and C. Van Hulle (2004). ‘The Determinants of Leverage; Differences between Quoted and Non Quoted Firms’, Tijdschrift voor Economie en Management Vol. XLIX (4): 589-621.
Serrasqueiro Z., and A. Caetano (2015). ‘Trade-off Theory versus Pecking Order Theory: Capital Structure Decisions in a Peripheral Region of Portugal’. Journal of Business Economics and Management, 16(2): 445–66.
Shuetrim G., P. Lowe, and S. Morling (1993). ‘The Determinants of Corporate Leverage: A Panel Data Analysis’. Reserve Bank of Australia Working Paper 9313. Available at: https://www.rba.gov.au/publications/rdp/1993/pdf/rdp9313.pdf (accessed on 1 March 2017).
Sogorb-Mira F. (2005). ‘How SME Uniqueness Affects Capital Structure: Evidence from a 1994-1998 Spanish Data Panel’. Small Business Economics, 25(5): 447–57.
Titman S., and R. Wessels (1988). ‘The Determinants of Capital Structure Choice’. The Journal of Finance, 43 (1): 1–19.
Tran H.T., E. Carbonara, and E. Santarelli (2017). ‘Determinants of Novice, Portfolio and Serial Entrepreneurship: An Occupational Choice Approach’. GLO Discussion Paper 74. Available at: https://www.econstor.eu/bitstream/10419/158030/1/GLO_DP_0074.pdf (accessed on 8 February 2017).
Tran H.T., and E. Santarelli (2014). ‘Capital Constraints and the Performance of Entrepreneurial Firms in Vietnam’. Industrial and Corporate Change, 23(3): 827–64.
Tran H.T., and E. Santarelli (2017). ‘Spatial Heterogeneity, Industry Heterogeneity, and Entrepreneurship’. Annals of Regional Science, 59(1): 69–100.
Vo X.V. (2017). ‘Determinants of Capital Structure in Emerging Markets: Evidence from Vietnam’. Research in International Business and Finance, 40(C): 105–13.
Wald J. (1999). ‘How Firm Characteristics Affect Capital Structure: An International Comparison’. The Journal of Financial Research, 22(2): 161–87.
Wintoki, M.B., J.S. Linck, and J.M. Netter (2012). ‘Endogeneity and the Dynamics of Internal Corporate Governance’. Journal of Financial Economics, 105(3): 581–606.
Wiwatttanakantang Y. (1999). ‘An Empirical Study on the Determinants of Capital Structure of Thai Firms’. Pacific-Basin Finance Journal, 7(3-4): 371–403.
World Bank (2005). Vietnam: Managing Public Expenditure for Poverty Reduction and Growth. Washington, DC: World Bank.