Embed Size (px)
Citation preview
JSNA 2017 Chapter 4 Wider Determinants of Health
March 2017 page 43
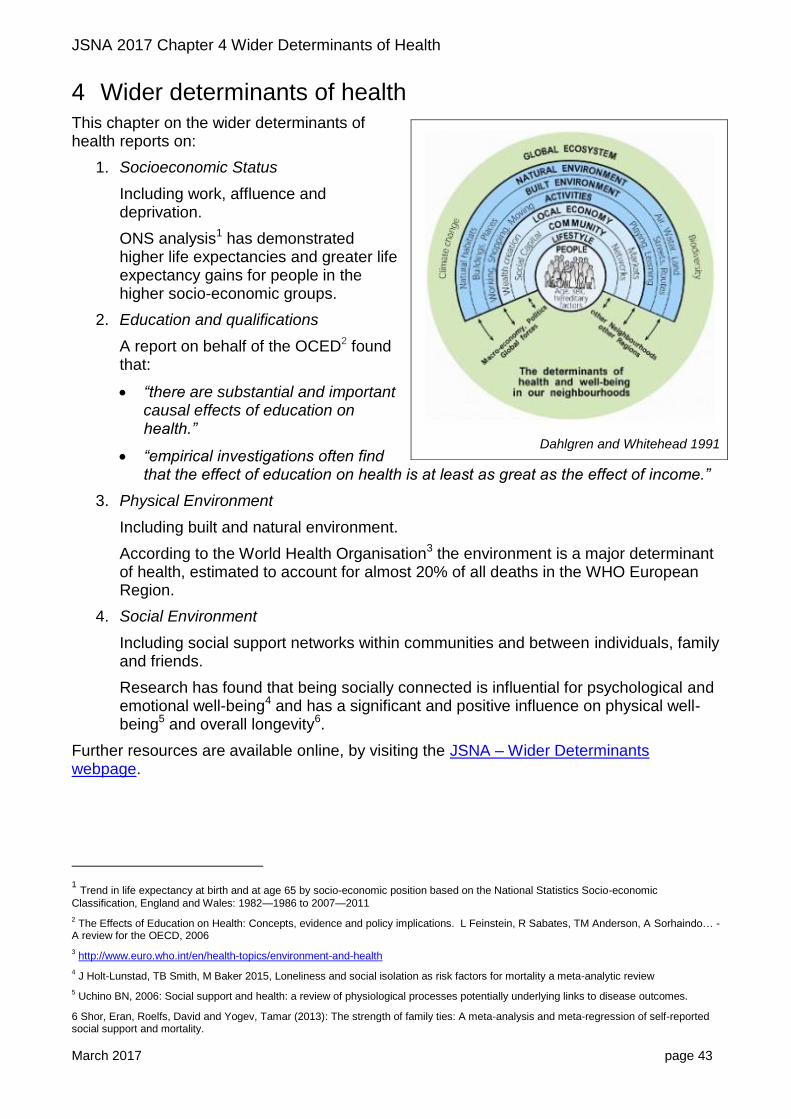
4 Wider determinants of health This chapter on the wider determinants of health reports on:
1. Socioeconomic Status
Including work, affluence and deprivation.
ONS analysis1 has demonstrated higher life expectancies and greater life expectancy gains for people in the higher socio-economic groups.
2. Education and qualifications
A report on behalf of the OCED2 found that:
“there are substantial and important causal effects of education on health.”
“empirical investigations often find that the effect of education on health is at least as great as the effect of income.”
3. Physical Environment
Including built and natural environment.
According to the World Health Organisation3 the environment is a major determinant of health, estimated to account for almost 20% of all deaths in the WHO European Region.
4. Social Environment
Including social support networks within communities and between individuals, family and friends.
Research has found that being socially connected is influential for psychological and emotional well-being4 and has a significant and positive influence on physical well-being5 and overall longevity6.
Further resources are available online, by visiting the JSNA – Wider Determinants webpage.
1 Trend in life expectancy at birth and at age 65 by socio-economic position based on the National Statistics Socio-economic
Classification, England and Wales: 1982—1986 to 2007—2011
2 The Effects of Education on Health: Concepts, evidence and policy implications. L Feinstein, R Sabates, TM Anderson, A Sorhaindo… -
A review for the OECD, 2006
3 http://www.euro.who.int/en/health-topics/environment-and-health
4 J Holt-Lunstad, TB Smith, M Baker 2015, Loneliness and social isolation as risk factors for mortality a meta-analytic review
5 Uchino BN, 2006: Social support and health: a review of physiological processes potentially underlying links to disease outcomes.
6 Shor, Eran, Roelfs, David and Yogev, Tamar (2013): The strength of family ties: A meta-analysis and meta-regression of self-reported social support and mortality.
Dahlgren and Whitehead 1991
JSNA 2017 Chapter 4 Wider Determinants of Health
March 2017 page 44
4.1 Wider determinants – key findings
This section highlights the key messages from the review of data on Wider Determinants (data sources and research references are provided with the detailed data in the remainder of this chapter).
Work, affluence and deprivation
National statistics show that, over a 30 year period, improvements in life expectancy have been greatest for those in higher socio-economic groups.
Oxfordshire has a higher than average proportion of people in Higher Managerial and Professional occupations.
The working age population in Oxfordshire (and nationally) is ageing.
Unemployment remains relatively low in Oxfordshire. The increase in claimants of employment-related benefits in the older age group in Oxfordshire was above average.
Earnings remain relatively high for Oxfordshire residents and (for the first time in the past 15 years of data), median earnings for residents was statistically above the South East average.
Despite relative affluence, income deprivation is an issue in urban and rural areas.
o 14,000 children in Oxfordshire were affected by income deprivation (IMD 2015), 81% living in urban areas and 19% in rural Oxfordshire.
o Snapshot HMRC data (Aug14) shows almost 1 in 5 children aged 0-15 in Oxford were living in low income families.
o 13,500 older people in Oxfordshire were affected by income deprivation (IMD
2015), 68% living in urban areas and 32% in rural Oxfordshire.
People claiming Employment Support Allowance made up the majority of working age benefits claimants in May 2016. The top health condition of ESA claimants was Mental and Behavioural disorders.
Housing and homelessness
House prices in Oxfordshire continue to increase at a higher rate than earnings.
Buying a family home now requires 2-3 times a median income (i.e. 2-3 earners per household) in each district in Oxfordshire.
The Centre for Cities report 2017 ranks Oxford as the least affordable UK city for housing.
In Oxford city, social rents in 2015 were 18% above the national average.
South Oxfordshire is ranked as one of the 5 local authorities in England and Wales with the greatest decline in affordability of social housing (2010 to 2015).
There has been an increase in people presenting as homeless and of people accepted as homeless and in priority need in Oxfordshire. Loss of private rented accommodation is becoming an increasing cause of homelessness.
There are a similar number of households in temporary accommodation in Oxfordshire to the previous year. The number of people rough-sleeping has increased.

JSNA 2017 Chapter 4 Wider Determinants of Health
March 2017 page 45
Education and qualifications
There has been an increase in 5 year olds achieving the expected Early Learning Goals in Oxfordshire. Girls continue to outperform boys.
Early Years attainment for 5 years olds with an Asian ethnic background in Oxfordshire was well below the South East average.
The proportion of pupils eligible for Free School Meals at the end of primary school and attaining at least the expected standard at Key Stage 2 in reading writing and mathematics in Oxfordshire was below the national average (26% compared with 36%).
The new secondary school attainment data (replacing GCSE results) shows Oxfordshire just above the national average and the lowest of its statistical neighbour group.
Provisional apprenticeship data shows a slight decline in number of apprenticeship starts in 2015-16. The number of young people not in education, employment or training has continued to fall.
Oxfordshire has an above-average proportion of people with high level qualifications and a low proportion of people with no qualifications.
There are 25 areas in the county (including 10 in Oxford) which are ranked in the top 10% most deprived nationally on the Education and Skills domain of the IMD 2015.
Physical and social environment
Oxford continues to have relatively high rates of cycling, influenced by the higher rate of cycling amongst students.
West Oxfordshire has seen a statistically significant increase in people using cycling for “utility” (non-leisure) purposes.
Nationally the proportion of trips to school made by walking has fallen over the last 40 years, especially for primary aged pupils. The falling trend is likely to reflect both increasing household car availability and increasing length of trips to school.
Young children (aged 7-10) have become less likely to be allowed to cross roads alone.
The number of people injured using cycles on roads in Oxfordshire has increased significantly since 2010. The increase has been above the national average.
Public Health England analysis found 423 fast food outlets in Oxfordshire of which 56% were in Cherwell and Oxford. The ward with the highest number of fast food outlets was Banbury Grimsbury & Castle (39 outlets).
Oxfordshire continues to have 13 Air Quality Management Areas where the annual mean objective for nitrogen dioxide is being exceeded including the whole of Oxford city.
It is likely that the weather patterns in Oxfordshire will change in coming decades with more heavy rainfall and more frequent heatwaves.
As the elderly are more vulnerable to extreme heat and cold, the UK Health Protection Agency predicts that future health burdens from climate change are likely to be amplified by an ageing population.
JSNA 2017 Chapter 4 Wider Determinants of Health
March 2017 page 46
Isolation and loneliness have been found to be a significant health risk and a cause of increased use of health services. Areas rated as “high risk” for isolation and loneliness in Oxfordshire are mainly in urban centres.
4.2 Work, affluence and deprivation
Employment and life expectancy
Analysis by the ONS found that, over a 30 year period, improvements in life expectancy have been greatest for those in higher socio-economic groups7. The ONS summary8 reports that:
Since the 1970s, men have been catching women up in terms of survival. The decline of the mining industry and the move away from physical labour and manufacturing industries towards the service sector is a likely cause, along with a reduction in the proportion of men smoking.
Over the past 30 years inequalities in life expectancy by socioeconomic position have widened for both men and women with improvements in life expectancy being greater for the most advantaged.
Studies of the influence of aspects of employment conditions on health, such as physical working conditions, autonomy, security of employment, psychosocial support, job strain and effort-reward imbalance have shown that they are more relevant for those who are economically active. Positive aspects of these conditions are also most concentrated among the Higher Managerial and Professional class, whereas negative aspects are most concentrated among the Routine class.
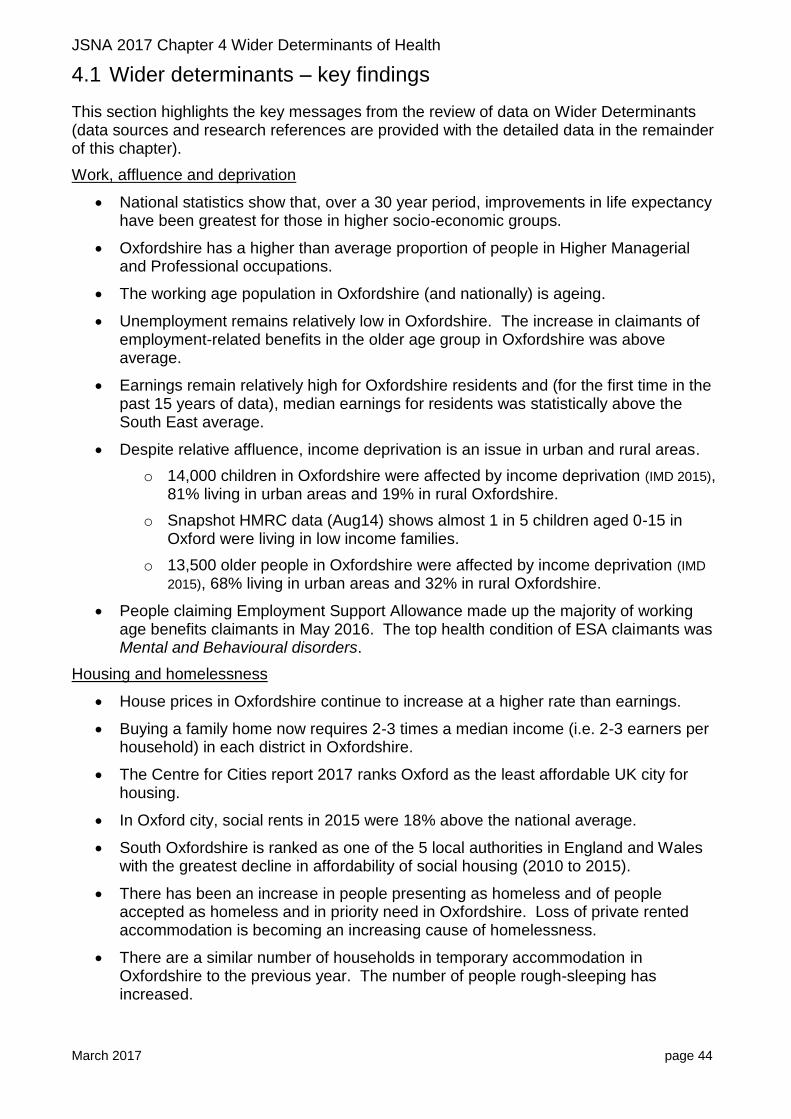
The gap in life expectancy at birth between the highest and lowest socio-economic group for males was 5.9 years and for females was 4.4 years (England and Wales, 2007-2011).
Figure 1 Male and Female life expectancy at birth 2007 to 2011, highest vs lowest socio-economic group (England and Wales)
Source: ONS Trend in life expectancy at birth and at age 65 by socio-economic position. Note scale starts at 70 years
7 Source: ONS Trend in life expectancy at birth and at age 65 by socio-economic position based on the
National Statistics Socio-economic Classification, England and Wales: 1982—1986 to 2007—2011 (Oct 2015) 8 http://visual.ons.gov.uk/most-affluent-man-now-outlives-the-average-woman-for-the-first-time/
year
JSNA 2017 Chapter 4 Wider Determinants of Health
March 2017 page 47
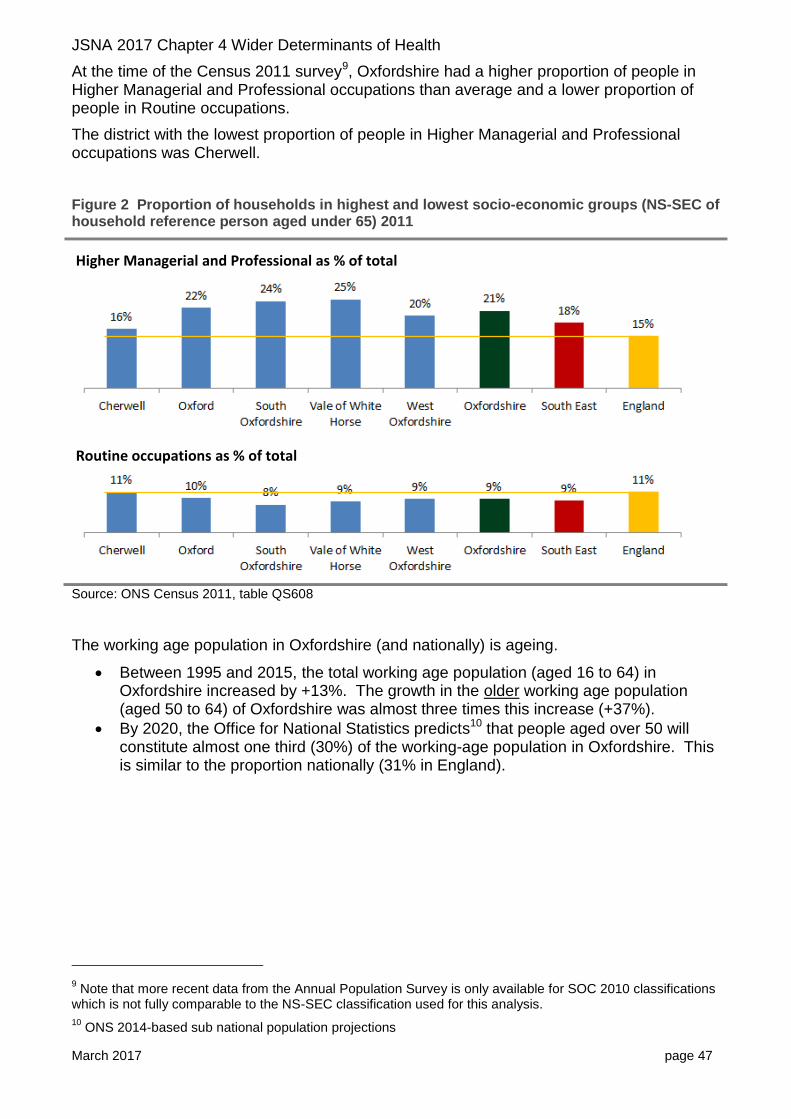
At the time of the Census 2011 survey9, Oxfordshire had a higher proportion of people in Higher Managerial and Professional occupations than average and a lower proportion of people in Routine occupations.
The district with the lowest proportion of people in Higher Managerial and Professional occupations was Cherwell.
Figure 2 Proportion of households in highest and lowest socio-economic groups (NS-SEC of household reference person aged under 65) 2011
Source: ONS Census 2011, table QS608
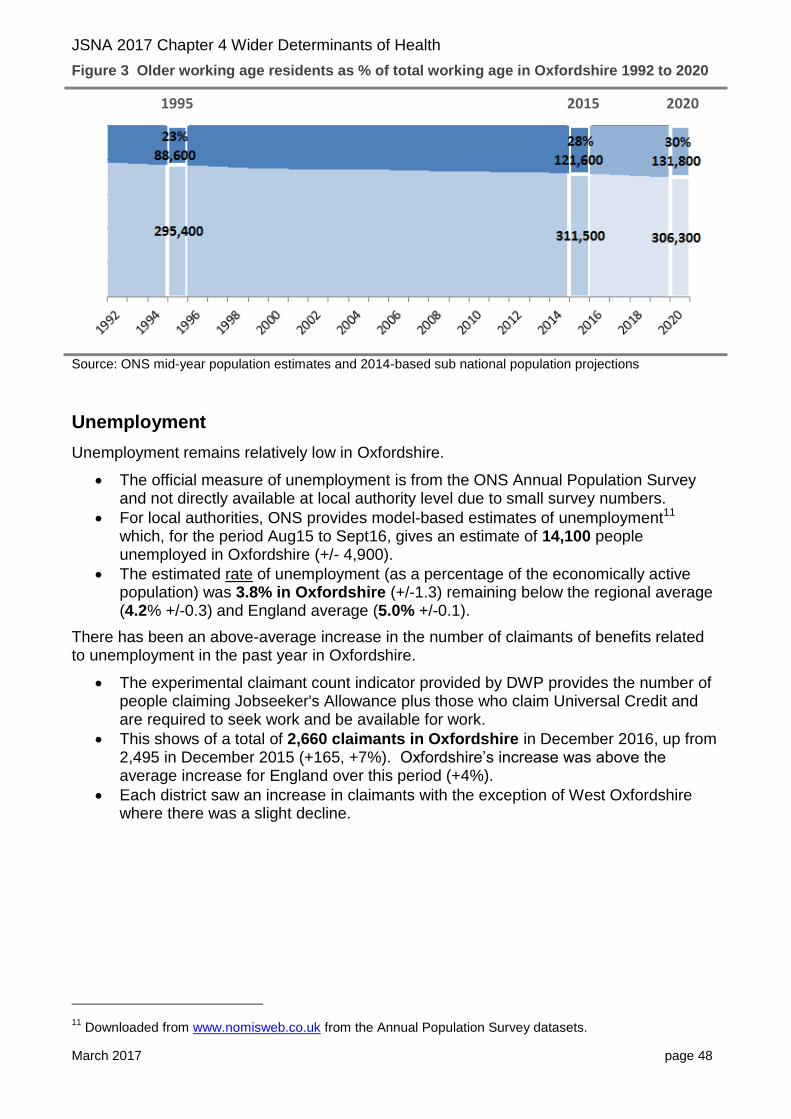
The working age population in Oxfordshire (and nationally) is ageing.
Between 1995 and 2015, the total working age population (aged 16 to 64) in Oxfordshire increased by +13%. The growth in the older working age population (aged 50 to 64) of Oxfordshire was almost three times this increase (+37%).
By 2020, the Office for National Statistics predicts10 that people aged over 50 will constitute almost one third (30%) of the working-age population in Oxfordshire. This is similar to the proportion nationally (31% in England).
9 Note that more recent data from the Annual Population Survey is only available for SOC 2010 classifications
which is not fully comparable to the NS-SEC classification used for this analysis.
10 ONS 2014-based sub national population projections
Routine occupations as % of total
Higher Managerial and Professional as % of total
JSNA 2017 Chapter 4 Wider Determinants of Health
March 2017 page 48
Figure 3 Older working age residents as % of total working age in Oxfordshire 1992 to 2020
Source: ONS mid-year population estimates and 2014-based sub national population projections
Unemployment
Unemployment remains relatively low in Oxfordshire.
The official measure of unemployment is from the ONS Annual Population Survey and not directly available at local authority level due to small survey numbers.
For local authorities, ONS provides model-based estimates of unemployment11 which, for the period Aug15 to Sept16, gives an estimate of 14,100 people unemployed in Oxfordshire (+/- 4,900).
The estimated rate of unemployment (as a percentage of the economically active population) was 3.8% in Oxfordshire (+/-1.3) remaining below the regional average (4.2% +/-0.3) and England average (5.0% +/-0.1).
There has been an above-average increase in the number of claimants of benefits related to unemployment in the past year in Oxfordshire.
The experimental claimant count indicator provided by DWP provides the number of people claiming Jobseeker's Allowance plus those who claim Universal Credit and are required to seek work and be available for work.
This shows of a total of 2,660 claimants in Oxfordshire in December 2016, up from 2,495 in December 2015 (+165, +7%). Oxfordshire’s increase was above the average increase for England over this period (+4%).
Each district saw an increase in claimants with the exception of West Oxfordshire where there was a slight decline.
11
Downloaded from www.nomisweb.co.uk from the Annual Population Survey datasets.
1995 2015 2020
Aged 50 to 64
Aged 16 to 49
JSNA 2017 Chapter 4 Wider Determinants of Health
March 2017 page 49
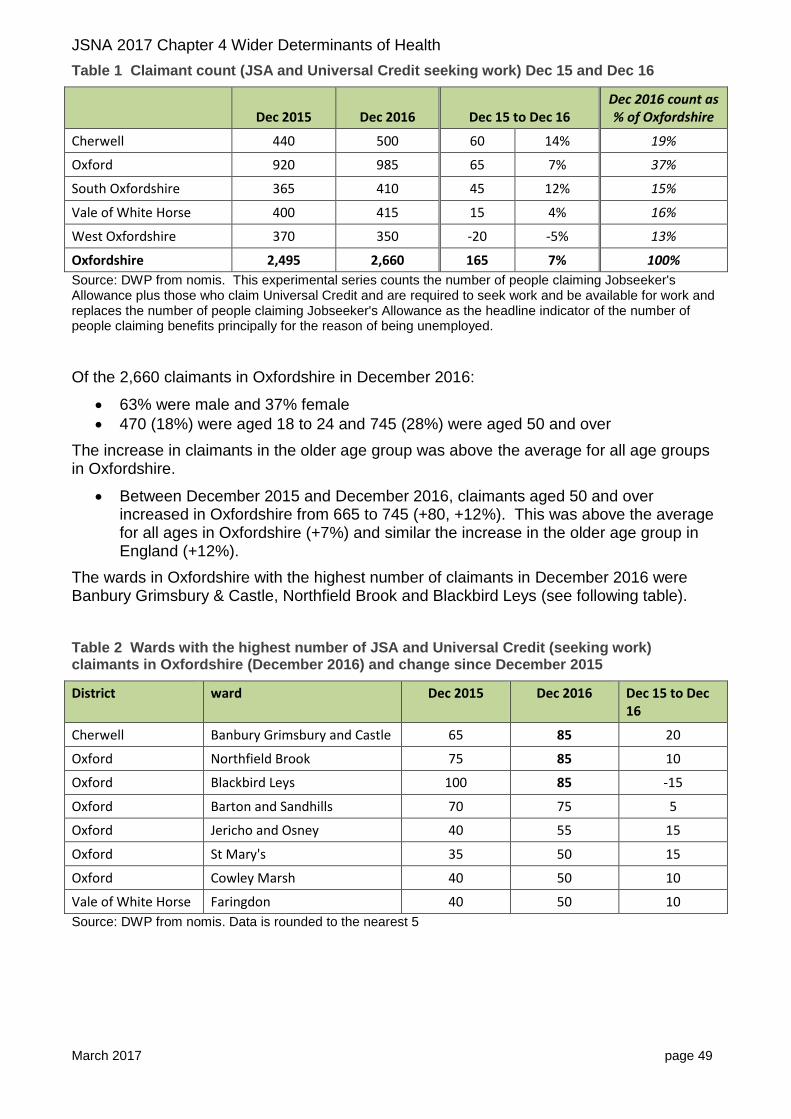
Table 1 Claimant count (JSA and Universal Credit seeking work) Dec 15 and Dec 16
Dec 2015 Dec 2016 Dec 15 to Dec 16 Dec 2016 count as % of Oxfordshire
Cherwell 440 500 60 14% 19%
Oxford 920 985 65 7% 37%
South Oxfordshire 365 410 45 12% 15%
Vale of White Horse 400 415 15 4% 16%
West Oxfordshire 370 350 -20 -5% 13%
Oxfordshire 2,495 2,660 165 7% 100%
Source: DWP from nomis. This experimental series counts the number of people claiming Jobseeker's Allowance plus those who claim Universal Credit and are required to seek work and be available for work and replaces the number of people claiming Jobseeker's Allowance as the headline indicator of the number of people claiming benefits principally for the reason of being unemployed.
Of the 2,660 claimants in Oxfordshire in December 2016:
63% were male and 37% female
470 (18%) were aged 18 to 24 and 745 (28%) were aged 50 and over
The increase in claimants in the older age group was above the average for all age groups in Oxfordshire.
Between December 2015 and December 2016, claimants aged 50 and over increased in Oxfordshire from 665 to 745 (+80, +12%). This was above the average for all ages in Oxfordshire (+7%) and similar the increase in the older age group in England (+12%).
The wards in Oxfordshire with the highest number of claimants in December 2016 were Banbury Grimsbury & Castle, Northfield Brook and Blackbird Leys (see following table).
Table 2 Wards with the highest number of JSA and Universal Credit (seeking work) claimants in Oxfordshire (December 2016) and change since December 2015
District ward Dec 2015 Dec 2016 Dec 15 to Dec 16
Cherwell Banbury Grimsbury and Castle 65 85 20
Oxford Northfield Brook 75 85 10
Oxford Blackbird Leys 100 85 -15
Oxford Barton and Sandhills 70 75 5
Oxford Jericho and Osney 40 55 15
Oxford St Mary's 35 50 15
Oxford Cowley Marsh 40 50 10
Vale of White Horse Faringdon 40 50 10
Source: DWP from nomis. Data is rounded to the nearest 5
JSNA 2017 Chapter 4 Wider Determinants of Health
March 2017 page 50
Earnings
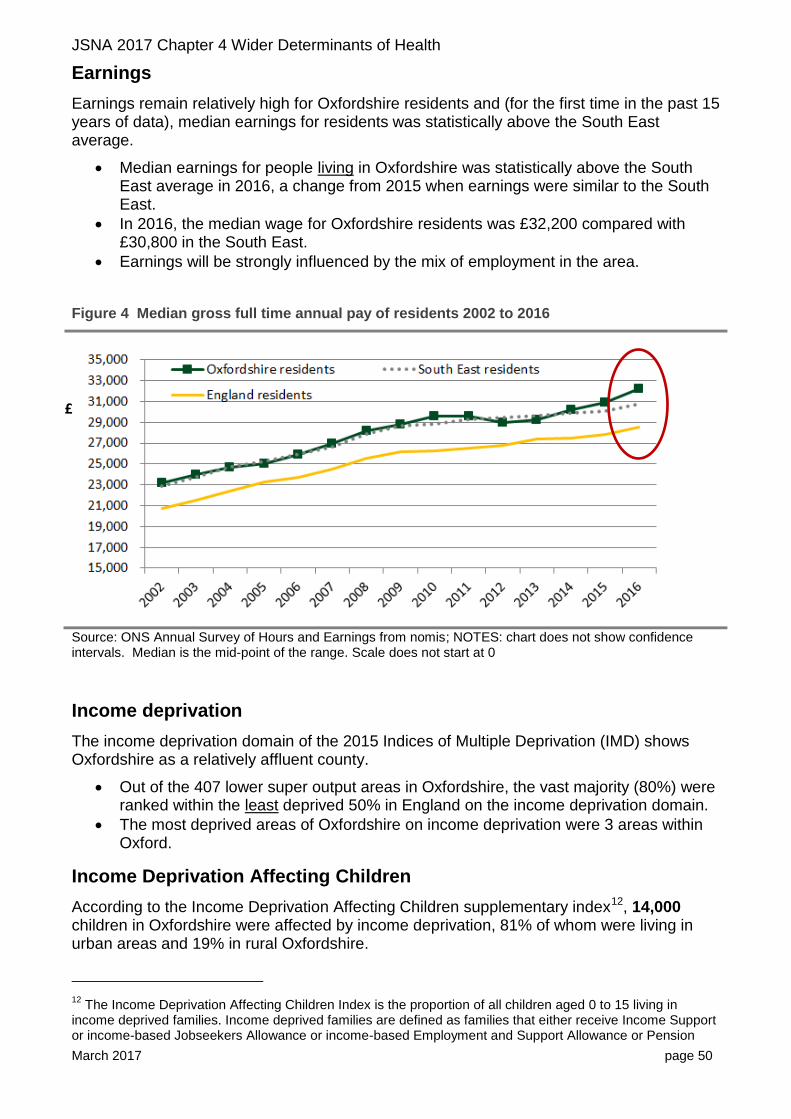
Earnings remain relatively high for Oxfordshire residents and (for the first time in the past 15 years of data), median earnings for residents was statistically above the South East average.
Median earnings for people living in Oxfordshire was statistically above the South East average in 2016, a change from 2015 when earnings were similar to the South East.
In 2016, the median wage for Oxfordshire residents was £32,200 compared with £30,800 in the South East.
Earnings will be strongly influenced by the mix of employment in the area.
Figure 4 Median gross full time annual pay of residents 2002 to 2016
Source: ONS Annual Survey of Hours and Earnings from nomis; NOTES: chart does not show confidence intervals. Median is the mid-point of the range. Scale does not start at 0
Income deprivation
The income deprivation domain of the 2015 Indices of Multiple Deprivation (IMD) shows Oxfordshire as a relatively affluent county.
Out of the 407 lower super output areas in Oxfordshire, the vast majority (80%) were ranked within the least deprived 50% in England on the income deprivation domain.
The most deprived areas of Oxfordshire on income deprivation were 3 areas within Oxford.
Income Deprivation Affecting Children
According to the Income Deprivation Affecting Children supplementary index12, 14,000 children in Oxfordshire were affected by income deprivation, 81% of whom were living in urban areas and 19% in rural Oxfordshire.
12
The Income Deprivation Affecting Children Index is the proportion of all children aged 0 to 15 living in income deprived families. Income deprived families are defined as families that either receive Income Support or income-based Jobseekers Allowance or income-based Employment and Support Allowance or Pension
£

JSNA 2017 Chapter 4 Wider Determinants of Health
March 2017 page 51
Oxford city had the highest rate, with 20% of the population aged 0-15 counted as income deprived.
Table 3 Income deprivation affecting children aged 0-15 (from IMD 2015) – rural vs urban by district
Rural Urban Total
count
% of population count
% of population count
% of population
Cherwell 475 5.9% 2,775 13.5% 3,250 11.4%
Oxford 15 4.6% 5,110 19.8% 5,125 19.7%
South Oxfordshire 715 5.7% 1,220 9.0% 1,935 7.4%
Vale of White Horse 680 7.1% 1,365 9.9% 2,045 8.8%
West Oxfordshire 735 6.8% 915 10.0% 1,650 8.3%
Oxfordshire 2,620 6.4% 11,385 13.7% 14,005 11.3%
% of Oxfordshire 19% 81% 100%
Source: CLG IMD 2015, underlying indicators, analysis by Oxfordshire County Council; indicators as of 2012
Child Poverty
According to HM Revenue and Customs data on children in low income, between 2013 and 2014, the proportion of children aged 0-15 in poverty in Oxfordshire increased slightly (from 11.1% to 11.6%), remaining below the national average (20.1%).
The Oxfordshire district with the highest rate of children in poverty was Oxford (19.2%) and the lowest was South Oxfordshire (8.3%).
Table 4 Children aged 0-15 in low income families 2013 and 2014 (snapshot as of 31 August)
31 Aug 2013 31 Aug 2014 Percentage point change
Cherwell 10.8% 11.4% 0.60pp
Oxford 19.5% 19.2% -0.30pp
South Oxfordshire 7.7% 8.3% 0.60pp
Vale of White Horse 8.9% 9.4% 0.50pp
West Oxfordshire 8.0% 9.0% 1.00pp
Oxfordshire 11.1% 11.6% 0.50pp
England 18.6% 20.1% 1.50pp
Source: HM Revenue and Customs (released Sept 2016)
Credit (Guarantee) or families not in receipt of these benefits but in receipt of Working Tax Credit or Child Tax Credit with an equivalised income (excluding housing benefit) below 60 per cent of the national median before housing costs.
JSNA 2017 Chapter 4 Wider Determinants of Health
March 2017 page 52
Children in "Poverty"
Children in “Poverty” is defined as the number of children living in families in receipt of Child Tax Credit whose reported income is less than 60 per cent of the median income or in receipt of Income Support or (Income-Based) Job Seeker Allowance, divided by the total number of children in the area (determined by Child Benefit data)
For more information and definitions please refer to the technical note available at:
https://www.gov.uk/government/statistics/personal-tax-credits-children-in-low-income-families-local-measure
Latest release:
https://www.gov.uk/government/statistics/personal-tax-credits-children-in-low-income-families-local-measure-2014-snapshot-as-at-31-august-2014-30-september-2016
Income Deprivation Affecting Older People
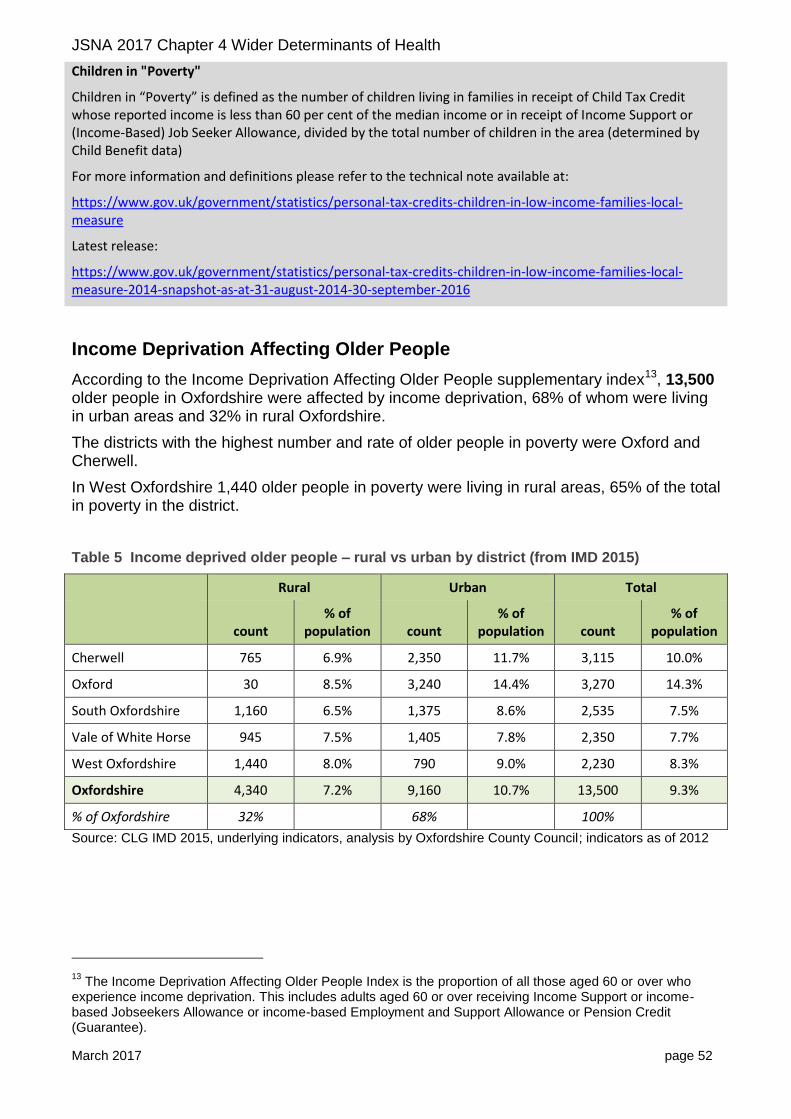
According to the Income Deprivation Affecting Older People supplementary index13, 13,500 older people in Oxfordshire were affected by income deprivation, 68% of whom were living in urban areas and 32% in rural Oxfordshire.
The districts with the highest number and rate of older people in poverty were Oxford and Cherwell.
In West Oxfordshire 1,440 older people in poverty were living in rural areas, 65% of the total in poverty in the district.
Table 5 Income deprived older people – rural vs urban by district (from IMD 2015)
Rural Urban Total
count
% of population count
% of population count
% of population
Cherwell 765 6.9% 2,350 11.7% 3,115 10.0%
Oxford 30 8.5% 3,240 14.4% 3,270 14.3%
South Oxfordshire 1,160 6.5% 1,375 8.6% 2,535 7.5%
Vale of White Horse 945 7.5% 1,405 7.8% 2,350 7.7%
West Oxfordshire 1,440 8.0% 790 9.0% 2,230 8.3%
Oxfordshire 4,340 7.2% 9,160 10.7% 13,500 9.3%
% of Oxfordshire 32% 68% 100%
Source: CLG IMD 2015, underlying indicators, analysis by Oxfordshire County Council; indicators as of 2012
13
The Income Deprivation Affecting Older People Index is the proportion of all those aged 60 or over who experience income deprivation. This includes adults aged 60 or over receiving Income Support or income-based Jobseekers Allowance or income-based Employment and Support Allowance or Pension Credit (Guarantee).

JSNA 2017 Chapter 4 Wider Determinants of Health
March 2017 page 53
Benefits claimants
As of May 2016 there was a total of 27,480 working age benefits claimants in Oxfordshire of which over half (14,670, 53%) were claiming Employment and Support Allowance and Incapacity benefits.
The number of people claiming ESA has remained at a similar level to the number of claimants in May 2011. The number of people claiming job seeker benefits, and others on income related benefits, have each dropped significantly.
Figure 5 Working age benefits claimants in Oxfordshire May 2016 (vs May 2011)
Source: DWP from nomis; claimants aged 16-64
Employment and Support Allowance (ESA) is an income-related benefit for people where illness or disability affects ability to work. Claimants must be:
- under State Pension age - not getting Statutory Sick Pay or Statutory Maternity Pay and haven’t gone back to work - not getting Jobseeker’s Allowance
Universal Credit is a new type of benefit designed to support people who are on a low income or out of work. It will replace six existing benefits and is being rolled out in stages across the UK. The new system is based on a single monthly payment, transferred directly into a bank account. At present Universal Credit only affects newly unemployed people in certain areas of the country.
JSNA 2017 Chapter 4 Wider Determinants of Health
March 2017 page 54
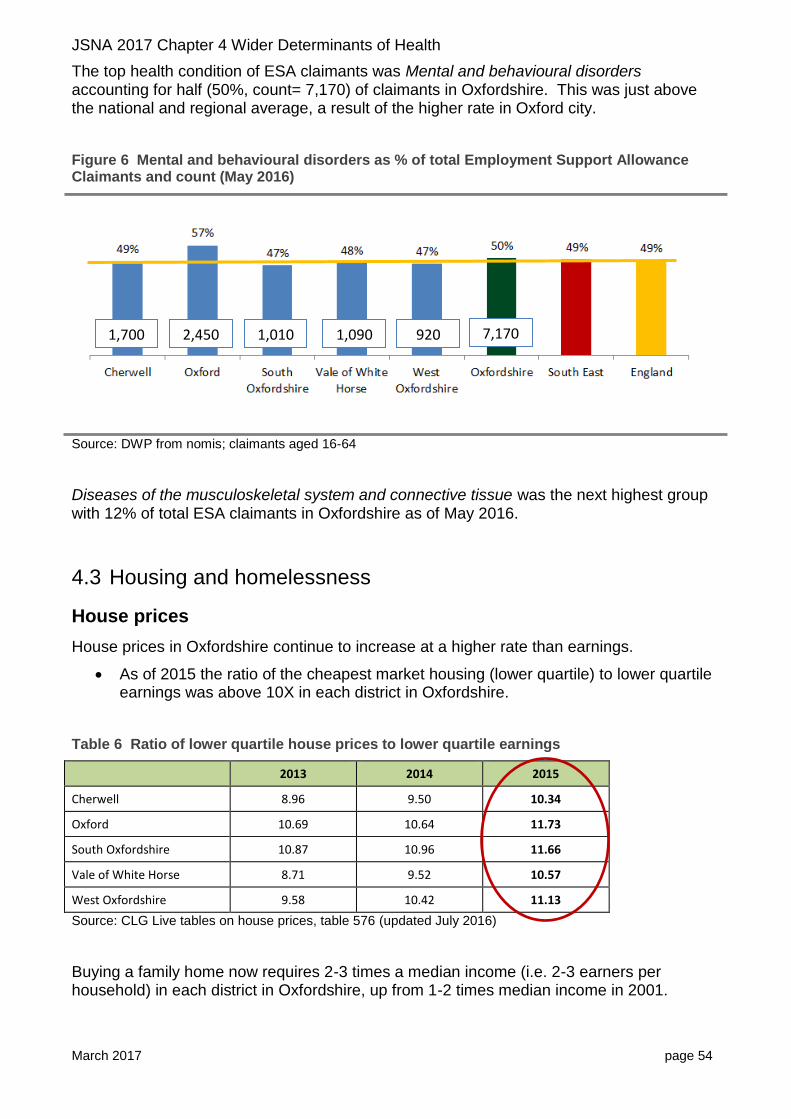
The top health condition of ESA claimants was Mental and behavioural disorders accounting for half (50%, count= 7,170) of claimants in Oxfordshire. This was just above the national and regional average, a result of the higher rate in Oxford city.
Figure 6 Mental and behavioural disorders as % of total Employment Support Allowance Claimants and count (May 2016)
Source: DWP from nomis; claimants aged 16-64
Diseases of the musculoskeletal system and connective tissue was the next highest group with 12% of total ESA claimants in Oxfordshire as of May 2016.
4.3 Housing and homelessness
House prices
House prices in Oxfordshire continue to increase at a higher rate than earnings.
As of 2015 the ratio of the cheapest market housing (lower quartile) to lower quartile earnings was above 10X in each district in Oxfordshire.
Table 6 Ratio of lower quartile house prices to lower quartile earnings
2013 2014 2015
Cherwell 8.96 9.50 10.34
Oxford 10.69 10.64 11.73
South Oxfordshire 10.87 10.96 11.66
Vale of White Horse 8.71 9.52 10.57
West Oxfordshire 9.58 10.42 11.13
Source: CLG Live tables on house prices, table 576 (updated July 2016)
Buying a family home now requires 2-3 times a median income (i.e. 2-3 earners per household) in each district in Oxfordshire, up from 1-2 times median income in 2001.
1,700 2,450 1,010 1,090 920 7,170
JSNA 2017 Chapter 4 Wider Determinants of Health
March 2017 page 55
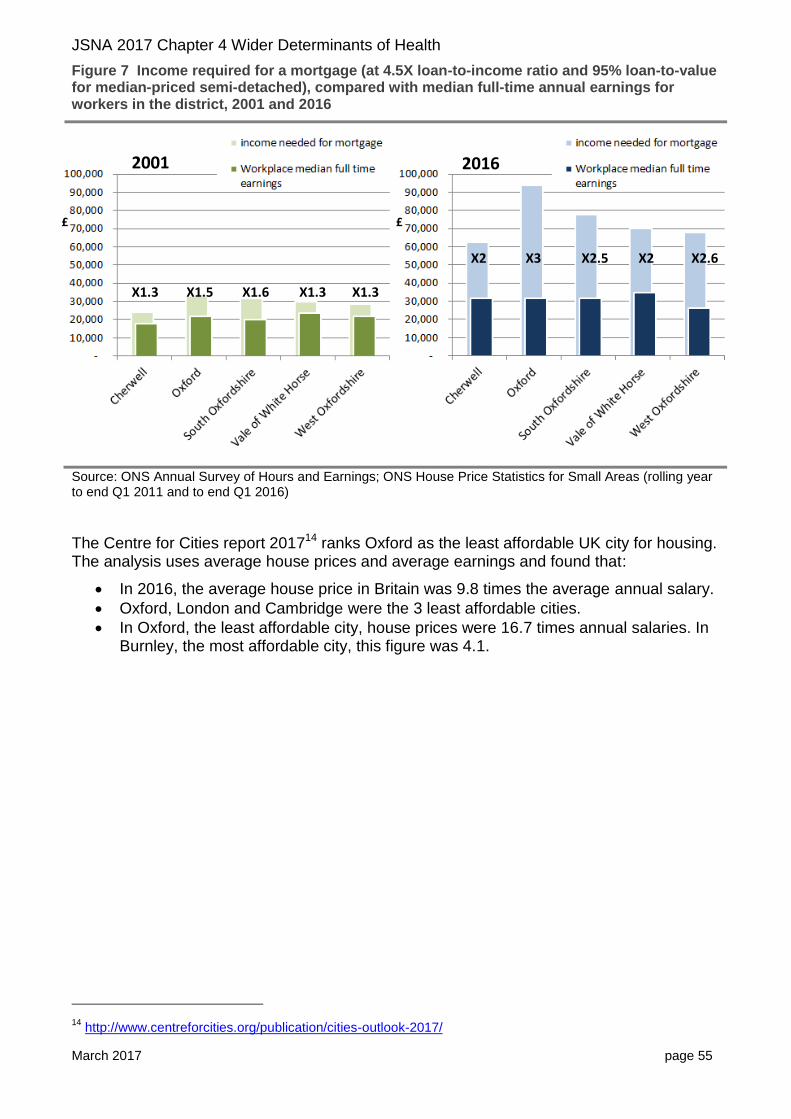
Figure 7 Income required for a mortgage (at 4.5X loan-to-income ratio and 95% loan-to-value for median-priced semi-detached), compared with median full-time annual earnings for workers in the district, 2001 and 2016
Source: ONS Annual Survey of Hours and Earnings; ONS House Price Statistics for Small Areas (rolling year to end Q1 2011 and to end Q1 2016)
The Centre for Cities report 201714 ranks Oxford as the least affordable UK city for housing. The analysis uses average house prices and average earnings and found that:
In 2016, the average house price in Britain was 9.8 times the average annual salary.
Oxford, London and Cambridge were the 3 least affordable cities.
In Oxford, the least affordable city, house prices were 16.7 times annual salaries. In Burnley, the most affordable city, this figure was 4.1.
14
http://www.centreforcities.org/publication/cities-outlook-2017/
2001 2016
X2 X3 X2.5 X2 X2.6
X1.3 X1.5 X1.6 X1.3 X1.3
£ £
JSNA 2017 Chapter 4 Wider Determinants of Health
March 2017 page 56
Social rented housing
The proportion of social housing stock varies by district from between 11% and 13% in Oxfordshire’s rural districts to 23% in Oxford. Since 2010 the proportion of social housing has declined in all districts in Oxfordshire other than Cherwell.
Table 7 Social housing stock as a percentage of total housing stock, 2010 to 2015
2010 2015 2010 to 2015 pp* change
Cherwell 12.8 12.9 0.1
Oxford 23.9 23.3 -0.6
South Oxfordshire 12.5 11.3 -1.2
Vale of White Horse 15.3 12.7 -2.6
West Oxfordshire 14.1 14.1 -0.1
Source: ONS Housing Summary Measures 2015, *pp= percentage point
Between 2014 and 2015 social sector rents in Oxfordshire increased by around 4% in each district in Oxfordshire (similar to the national increase) with the exception of West Oxfordshire which saw an increase of 5%.
In Oxford city social rents in 2015 were 18% above the national average.
Table 8 Average social rents £ per week (as at 31st March each year)
2014 2015 2014 to 2015 2015 social rents compared with
national average
Cherwell £101.36 £105.08 £3.72 3.7% 1.10
Oxford £109.10 £113.20 £4.10 3.8% 1.18
South Oxfordshire £107.03 £111.16 £4.13 3.9% 1.16
Vale of White Horse £104.32 £108.91 £4.59 4.4% 1.14
West Oxfordshire £103.72 £109.26 £5.54 5.3% 1.14
ENGLAND £92.30 £95.89 £3.59 3.9% 1.00
Source: DCLG Live tables on rents, lettings and tenancies, table 704, Figures are based on based on general needs stock available for social rent only and are only taken from the larger Private Registered Providers
JSNA 2017 Chapter 4 Wider Determinants of Health
March 2017 page 57
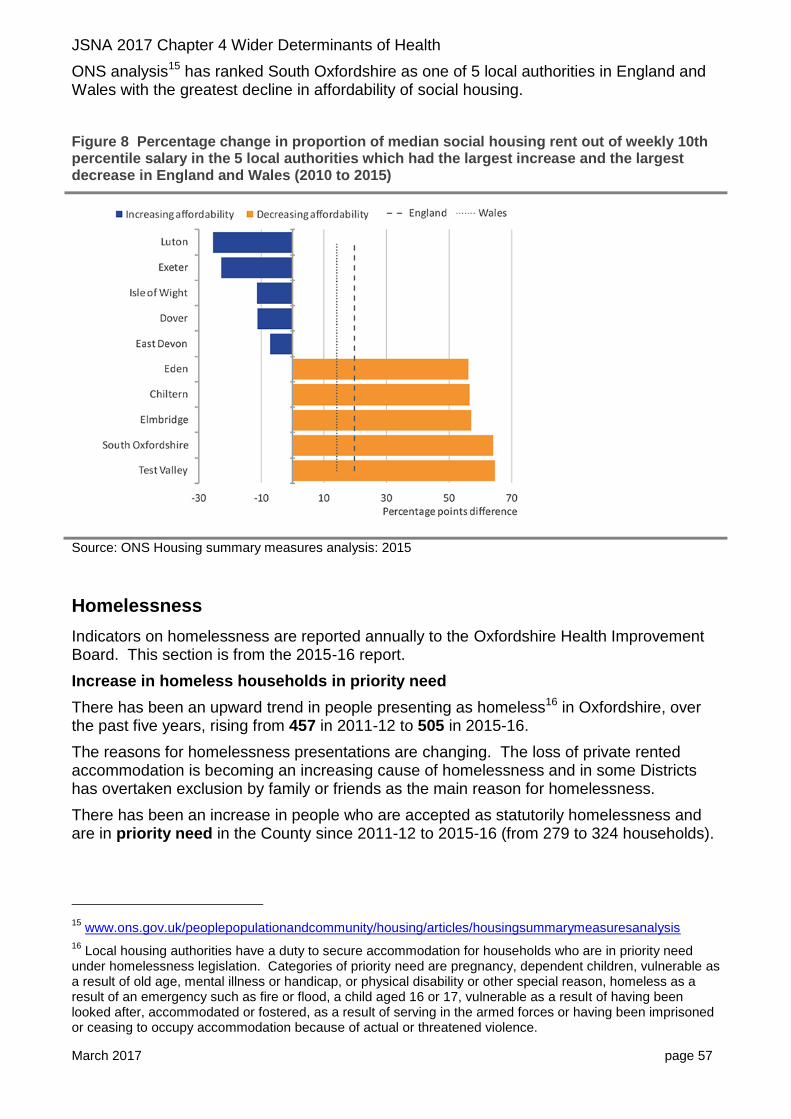
ONS analysis15 has ranked South Oxfordshire as one of 5 local authorities in England and Wales with the greatest decline in affordability of social housing.
Figure 8 Percentage change in proportion of median social housing rent out of weekly 10th percentile salary in the 5 local authorities which had the largest increase and the largest decrease in England and Wales (2010 to 2015)
Source: ONS Housing summary measures analysis: 2015
Homelessness
Indicators on homelessness are reported annually to the Oxfordshire Health Improvement Board. This section is from the 2015-16 report.
Increase in homeless households in priority need
There has been an upward trend in people presenting as homeless16 in Oxfordshire, over the past five years, rising from 457 in 2011-12 to 505 in 2015-16.
The reasons for homelessness presentations are changing. The loss of private rented accommodation is becoming an increasing cause of homelessness and in some Districts has overtaken exclusion by family or friends as the main reason for homelessness.
There has been an increase in people who are accepted as statutorily homelessness and are in priority need in the County since 2011-12 to 2015-16 (from 279 to 324 households).
15
www.ons.gov.uk/peoplepopulationandcommunity/housing/articles/housingsummarymeasuresanalysis
16 Local housing authorities have a duty to secure accommodation for households who are in priority need
under homelessness legislation. Categories of priority need are pregnancy, dependent children, vulnerable as a result of old age, mental illness or handicap, or physical disability or other special reason, homeless as a result of an emergency such as fire or flood, a child aged 16 or 17, vulnerable as a result of having been looked after, accommodated or fostered, as a result of serving in the armed forces or having been imprisoned or ceasing to occupy accommodation because of actual or threatened violence.
JSNA 2017 Chapter 4 Wider Determinants of Health
March 2017 page 58
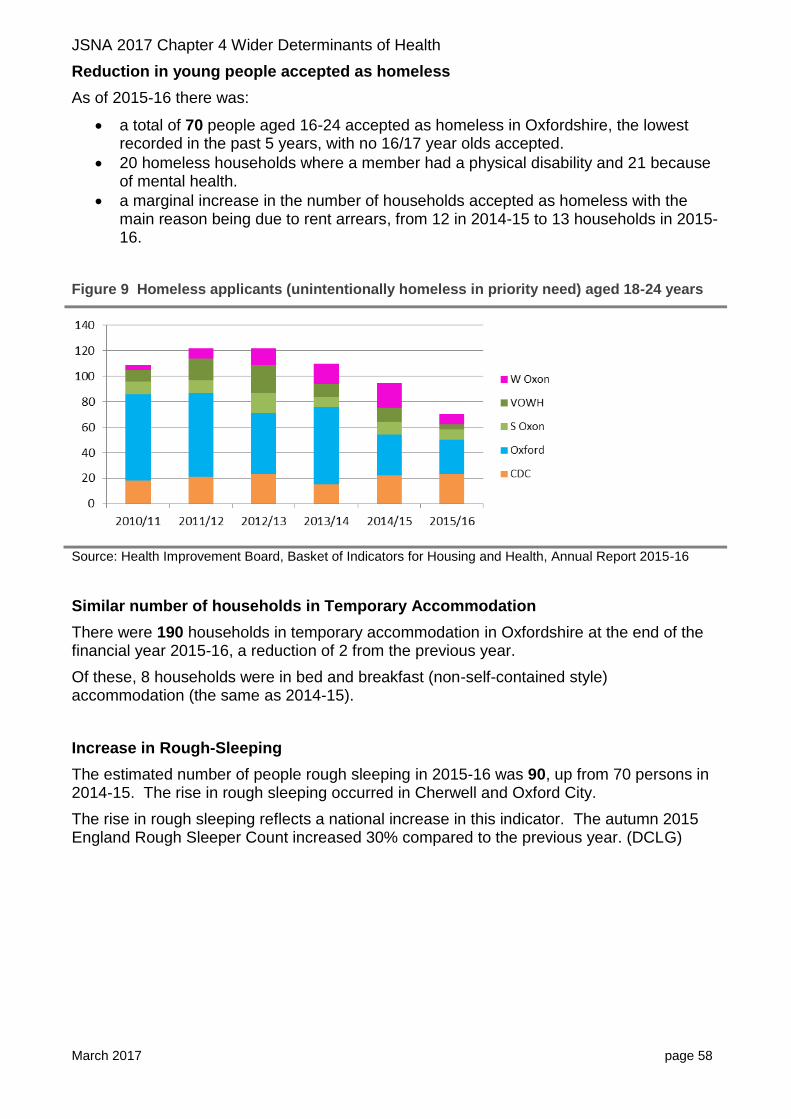
Reduction in young people accepted as homeless
As of 2015-16 there was:
a total of 70 people aged 16-24 accepted as homeless in Oxfordshire, the lowest recorded in the past 5 years, with no 16/17 year olds accepted.
20 homeless households where a member had a physical disability and 21 because of mental health.
a marginal increase in the number of households accepted as homeless with the main reason being due to rent arrears, from 12 in 2014-15 to 13 households in 2015-16.
Figure 9 Homeless applicants (unintentionally homeless in priority need) aged 18-24 years
Source: Health Improvement Board, Basket of Indicators for Housing and Health, Annual Report 2015-16
Similar number of households in Temporary Accommodation
There were 190 households in temporary accommodation in Oxfordshire at the end of the financial year 2015-16, a reduction of 2 from the previous year.
Of these, 8 households were in bed and breakfast (non-self-contained style) accommodation (the same as 2014-15).
Increase in Rough-Sleeping
The estimated number of people rough sleeping in 2015-16 was 90, up from 70 persons in 2014-15. The rise in rough sleeping occurred in Cherwell and Oxford City.
The rise in rough sleeping reflects a national increase in this indicator. The autumn 2015 England Rough Sleeper Count increased 30% compared to the previous year. (DCLG)

JSNA 2017 Chapter 4 Wider Determinants of Health
March 2017 page 59
Figure 10 Estimate of number of people sleeping rough
Source: Health Improvement Board, Basket of Indicators for Housing and Health, Annual Report 2015-16
Reduction in households affected by removal of Spare Room Subsidy and Benefit Cap
In 2015-16, the number of households in Oxfordshire who found that their housing benefit has been reduced because of the Social Sector size criteria17 was 2,154. This is a reduction from 2,304 households in 2014-15.
The number of households affected by the Benefit Cap18 across the County fell significantly from 257 households in 2014-15 to 125 households in 2015-16.
17
This affects households where the tenants are of working age and do not fall within one of the exception categories and they are assessed as having one or more bedrooms than they require according to the following formula of one bedroom for
each adult couple
any other person aged 16 or over
two children of the same sex under the age of 16
two children under the age of 10 regardless of their sex
any other child
a carer (who does not normally live with the tenant) if the tenant or their partner needs overnight care. Tenants who are under occupying by one bedroom, have their benefit reduced by 14% of eligible rent, and tenants who are under occupying by two or more bedrooms have their benefit reduced by 25% of eligible rent.
18 £350 per week maximum of benefits covered for single adults who don’t have children or whose children
don’t live with them and £500 per week maximum for couples (with or without children living with them) and £500 a week for single parents whose children live with them.
JSNA 2017 Chapter 4 Wider Determinants of Health
March 2017 page 60
Fuel poverty
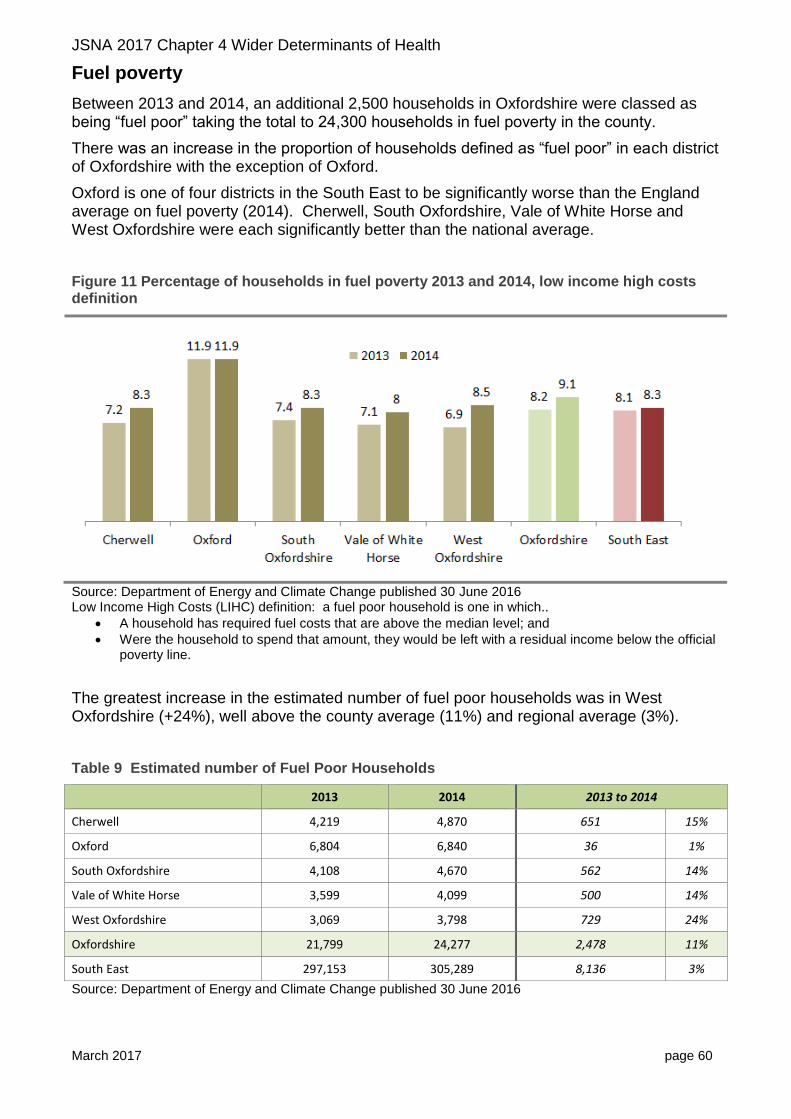
Between 2013 and 2014, an additional 2,500 households in Oxfordshire were classed as being “fuel poor” taking the total to 24,300 households in fuel poverty in the county.
There was an increase in the proportion of households defined as “fuel poor” in each district of Oxfordshire with the exception of Oxford.
Oxford is one of four districts in the South East to be significantly worse than the England average on fuel poverty (2014). Cherwell, South Oxfordshire, Vale of White Horse and West Oxfordshire were each significantly better than the national average.
Figure 11 Percentage of households in fuel poverty 2013 and 2014, low income high costs definition
Source: Department of Energy and Climate Change published 30 June 2016 Low Income High Costs (LIHC) definition: a fuel poor household is one in which..
A household has required fuel costs that are above the median level; and
Were the household to spend that amount, they would be left with a residual income below the official poverty line.
The greatest increase in the estimated number of fuel poor households was in West Oxfordshire (+24%), well above the county average (11%) and regional average (3%).
Table 9 Estimated number of Fuel Poor Households
2013 2014 2013 to 2014
Cherwell 4,219 4,870 651 15%
Oxford 6,804 6,840 36 1%
South Oxfordshire 4,108 4,670 562 14%
Vale of White Horse 3,599 4,099 500 14%
West Oxfordshire 3,069 3,798 729 24%
Oxfordshire 21,799 24,277 2,478 11%
South East 297,153 305,289 8,136 3%
Source: Department of Energy and Climate Change published 30 June 2016
JSNA 2017 Chapter 4 Wider Determinants of Health
March 2017 page 61
4.4 Education and qualifications
Early years
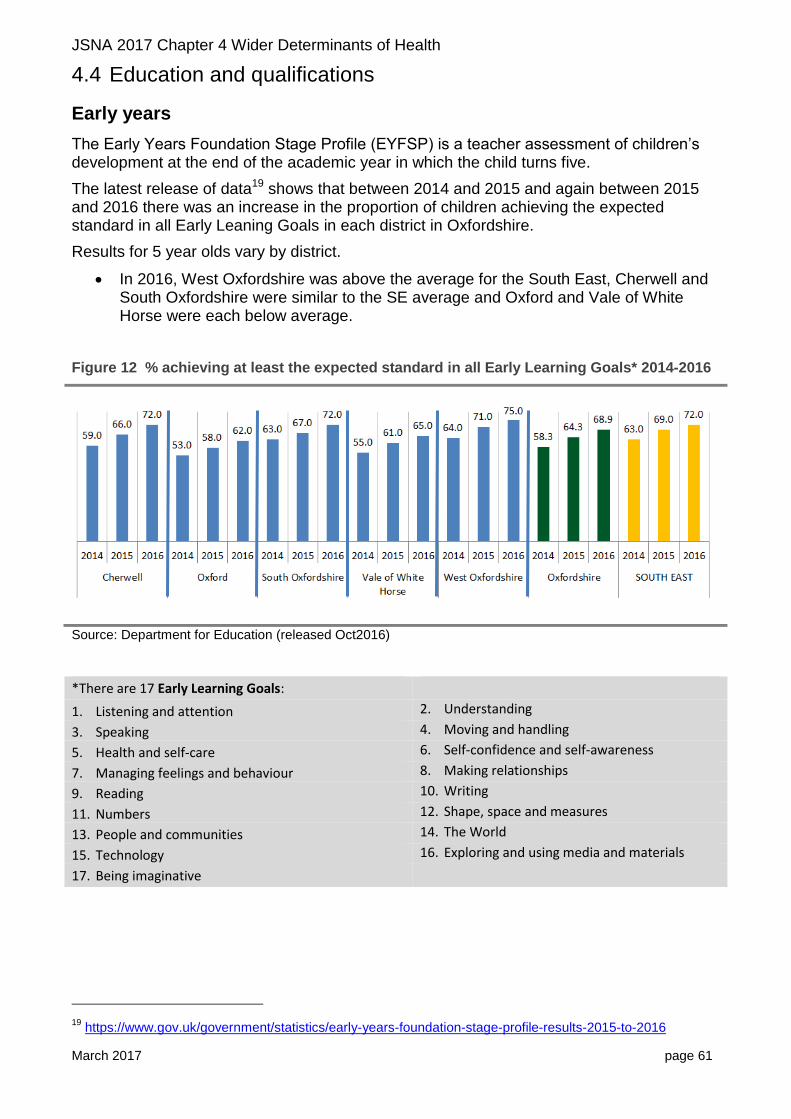
The Early Years Foundation Stage Profile (EYFSP) is a teacher assessment of children’s development at the end of the academic year in which the child turns five.
The latest release of data19 shows that between 2014 and 2015 and again between 2015 and 2016 there was an increase in the proportion of children achieving the expected standard in all Early Leaning Goals in each district in Oxfordshire.
Results for 5 year olds vary by district.
In 2016, West Oxfordshire was above the average for the South East, Cherwell and South Oxfordshire were similar to the SE average and Oxford and Vale of White Horse were each below average.
Figure 12 % achieving at least the expected standard in all Early Learning Goals* 2014-2016
Source: Department for Education (released Oct2016)
*There are 17 Early Learning Goals:
1. Listening and attention 2. Understanding
3. Speaking 4. Moving and handling
5. Health and self-care 6. Self-confidence and self-awareness
7. Managing feelings and behaviour 8. Making relationships
9. Reading 10. Writing
11. Numbers 12. Shape, space and measures
13. People and communities 14. The World
15. Technology 16. Exploring and using media and materials
17. Being imaginative
19
https://www.gov.uk/government/statistics/early-years-foundation-stage-profile-results-2015-to-2016
JSNA 2017 Chapter 4 Wider Determinants of Health
March 2017 page 62
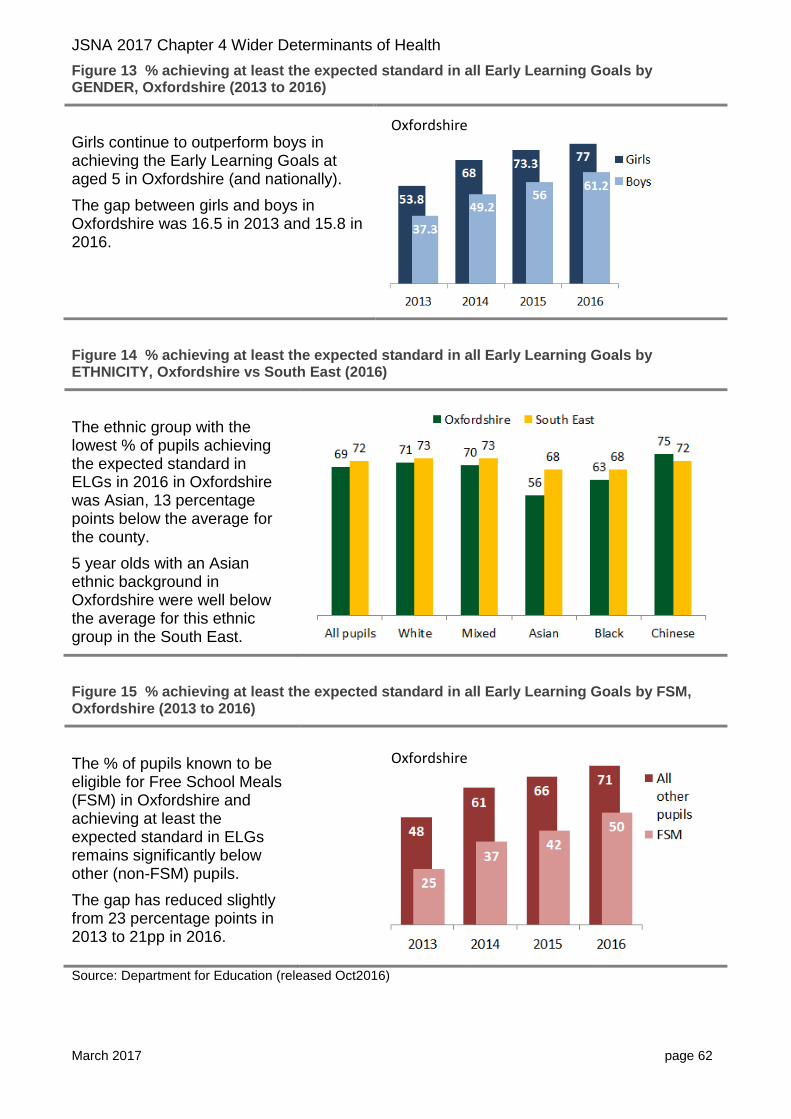
Figure 13 % achieving at least the expected standard in all Early Learning Goals by GENDER, Oxfordshire (2013 to 2016)
Girls continue to outperform boys in achieving the Early Learning Goals at aged 5 in Oxfordshire (and nationally).
The gap between girls and boys in Oxfordshire was 16.5 in 2013 and 15.8 in 2016.
Figure 14 % achieving at least the expected standard in all Early Learning Goals by ETHNICITY, Oxfordshire vs South East (2016)
The ethnic group with the lowest % of pupils achieving the expected standard in ELGs in 2016 in Oxfordshire was Asian, 13 percentage points below the average for the county.
5 year olds with an Asian ethnic background in Oxfordshire were well below the average for this ethnic group in the South East.
Figure 15 % achieving at least the expected standard in all Early Learning Goals by FSM, Oxfordshire (2013 to 2016)
The % of pupils known to be eligible for Free School Meals (FSM) in Oxfordshire and achieving at least the expected standard in ELGs remains significantly below other (non-FSM) pupils.
The gap has reduced slightly from 23 percentage points in 2013 to 21pp in 2016.
Source: Department for Education (released Oct2016)
Oxfordshire
Oxfordshire
JSNA 2017 Chapter 4 Wider Determinants of Health
March 2017 page 63
Pupil attainment at Key Stage 2 (Year 6)
The 2016 key stage 2 assessments for pupils at the end of primary school (aged 10-11) are the first which assess the new, more challenging national curriculum which was introduced in 2014. The new data, therefore, cannot be compared with previous years.
In 2016 the proportion of pupils in Oxfordshire attaining at least the expected standard at Key Stage 2 in reading writing and mathematics was 52% compared with 54% in England.
For pupils with a first language not English the proportion was 44% compared with 52% nationally.
The proportion of pupils eligible for Free School Meals at the end of primary school and attaining at least the expected standard at Key Stage 2 in reading writing and mathematics in Oxfordshire was below the national average (26% compared with 36%).
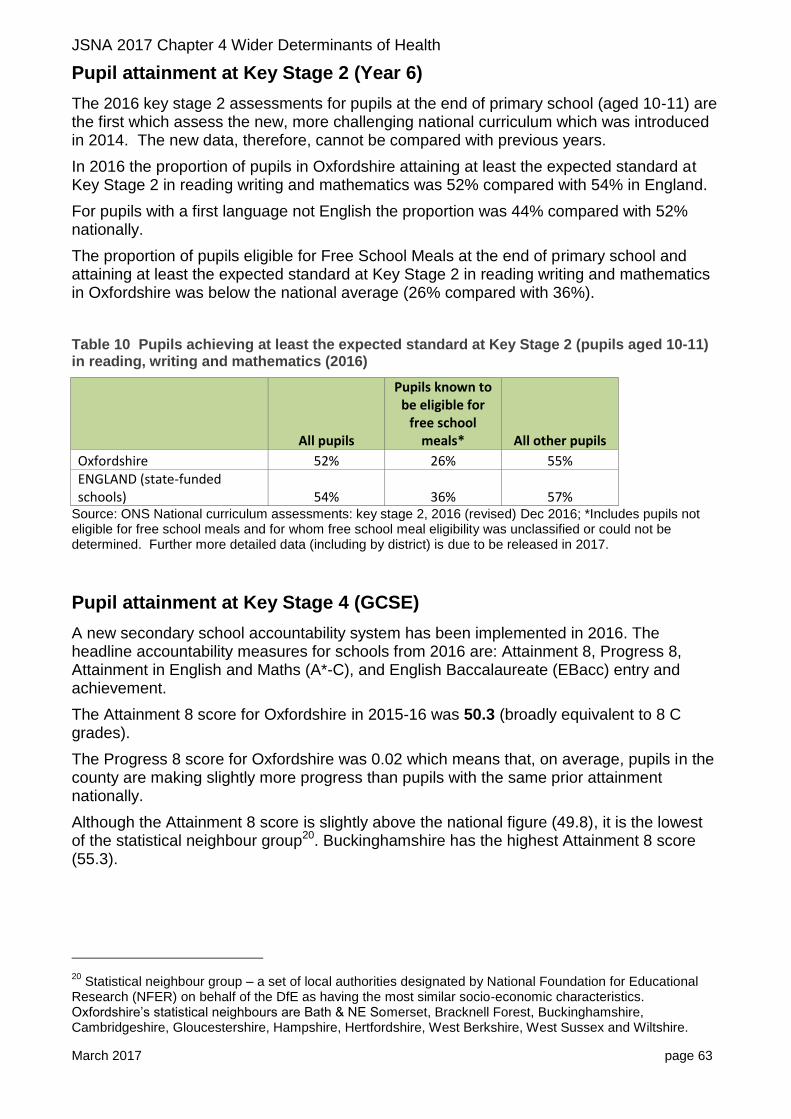
Table 10 Pupils achieving at least the expected standard at Key Stage 2 (pupils aged 10-11) in reading, writing and mathematics (2016)
All pupils
Pupils known to be eligible for
free school meals* All other pupils
Oxfordshire 52% 26% 55% ENGLAND (state-funded schools) 54% 36% 57%
Source: ONS National curriculum assessments: key stage 2, 2016 (revised) Dec 2016; *Includes pupils not eligible for free school meals and for whom free school meal eligibility was unclassified or could not be determined. Further more detailed data (including by district) is due to be released in 2017.
Pupil attainment at Key Stage 4 (GCSE)
A new secondary school accountability system has been implemented in 2016. The headline accountability measures for schools from 2016 are: Attainment 8, Progress 8, Attainment in English and Maths (A*-C), and English Baccalaureate (EBacc) entry and achievement.
The Attainment 8 score for Oxfordshire in 2015-16 was 50.3 (broadly equivalent to 8 C grades).
The Progress 8 score for Oxfordshire was 0.02 which means that, on average, pupils in the county are making slightly more progress than pupils with the same prior attainment nationally.
Although the Attainment 8 score is slightly above the national figure (49.8), it is the lowest of the statistical neighbour group20. Buckinghamshire has the highest Attainment 8 score (55.3).
20
Statistical neighbour group – a set of local authorities designated by National Foundation for Educational Research (NFER) on behalf of the DfE as having the most similar socio-economic characteristics. Oxfordshire’s statistical neighbours are Bath & NE Somerset, Bracknell Forest, Buckinghamshire, Cambridgeshire, Gloucestershire, Hampshire, Hertfordshire, West Berkshire, West Sussex and Wiltshire.
JSNA 2017 Chapter 4 Wider Determinants of Health
March 2017 page 64
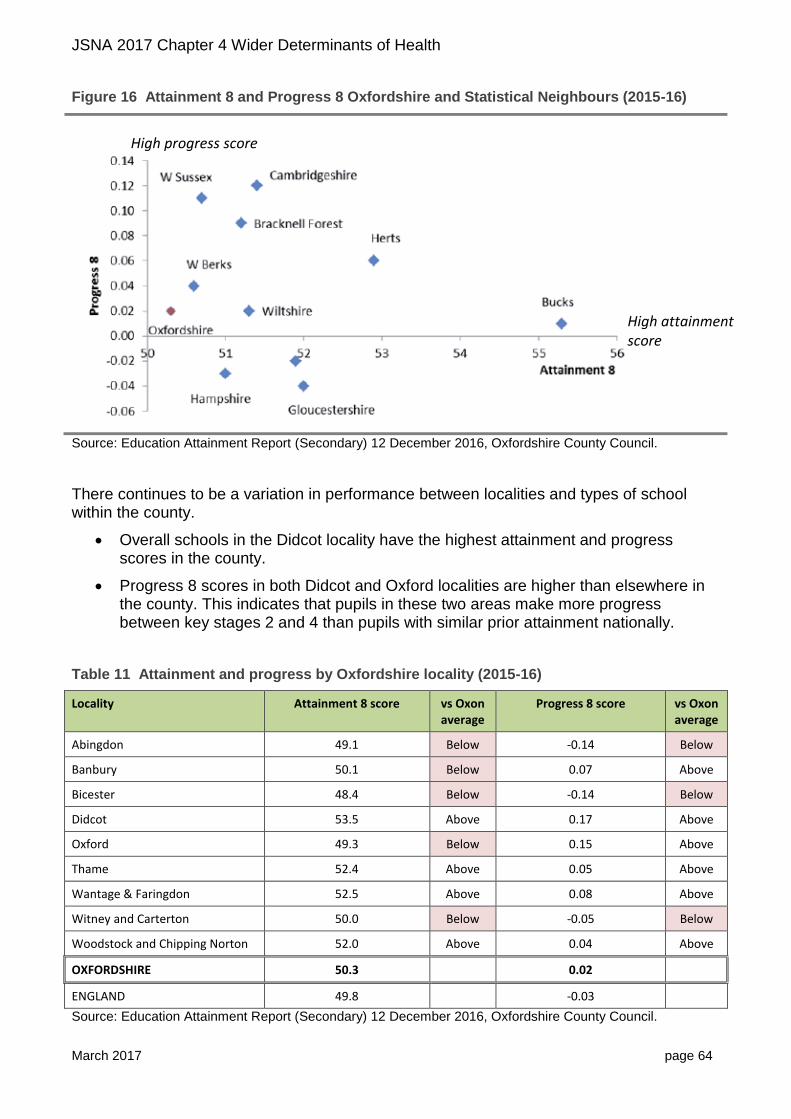
Figure 16 Attainment 8 and Progress 8 Oxfordshire and Statistical Neighbours (2015-16)
Source: Education Attainment Report (Secondary) 12 December 2016, Oxfordshire County Council.
There continues to be a variation in performance between localities and types of school within the county.
Overall schools in the Didcot locality have the highest attainment and progress scores in the county.
Progress 8 scores in both Didcot and Oxford localities are higher than elsewhere in the county. This indicates that pupils in these two areas make more progress between key stages 2 and 4 than pupils with similar prior attainment nationally.
Table 11 Attainment and progress by Oxfordshire locality (2015-16)
Locality Attainment 8 score vs Oxon average
Progress 8 score vs Oxon average
Abingdon 49.1 Below -0.14 Below
Banbury 50.1 Below 0.07 Above
Bicester 48.4 Below -0.14 Below
Didcot 53.5 Above 0.17 Above
Oxford 49.3 Below 0.15 Above
Thame 52.4 Above 0.05 Above
Wantage & Faringdon 52.5 Above 0.08 Above
Witney and Carterton 50.0 Below -0.05 Below
Woodstock and Chipping Norton 52.0 Above 0.04 Above
OXFORDSHIRE 50.3 0.02
ENGLAND 49.8 -0.03
Source: Education Attainment Report (Secondary) 12 December 2016, Oxfordshire County Council.
High attainment score
High progress score
JSNA 2017 Chapter 4 Wider Determinants of Health
March 2017 page 65
Comparative data for different groups of pupils (e.g. disadvantaged pupils) have not yet been published by the DfE. This data will be available from mid-January 2017.
16-19 bursary
In 2010 the Education Maintenance Allowance (EMA), for transport and other costs of accessing education (not university), was closed in England and replaced by a 16-19 bursary scheme.
This discretionary bursary is allocated to education institutions which then assess and award varying amounts to any eligible student.
Responding to a data enquiry from Oxfordshire County Council in November 2016, the Education Funding Agency said that it cannot provide the number of students accessing the 16-19 bursary.
Because of how the scheme is administered it cannot be assumed how many students have been supported by the bursary allocation. We therefore rely on institutions to report numbers accessing support on the ILR. This is not always done and the data is therefore is not reliable.
Apprenticeships
In 2014-15 there was a total of 4,360 apprenticeships started in Oxfordshire, the greatest number of which was in Cherwell district (1,040). Provisional data for 2015-16 appears to show a slight decline to 4,210 apprenticeship starts in Oxfordshire.
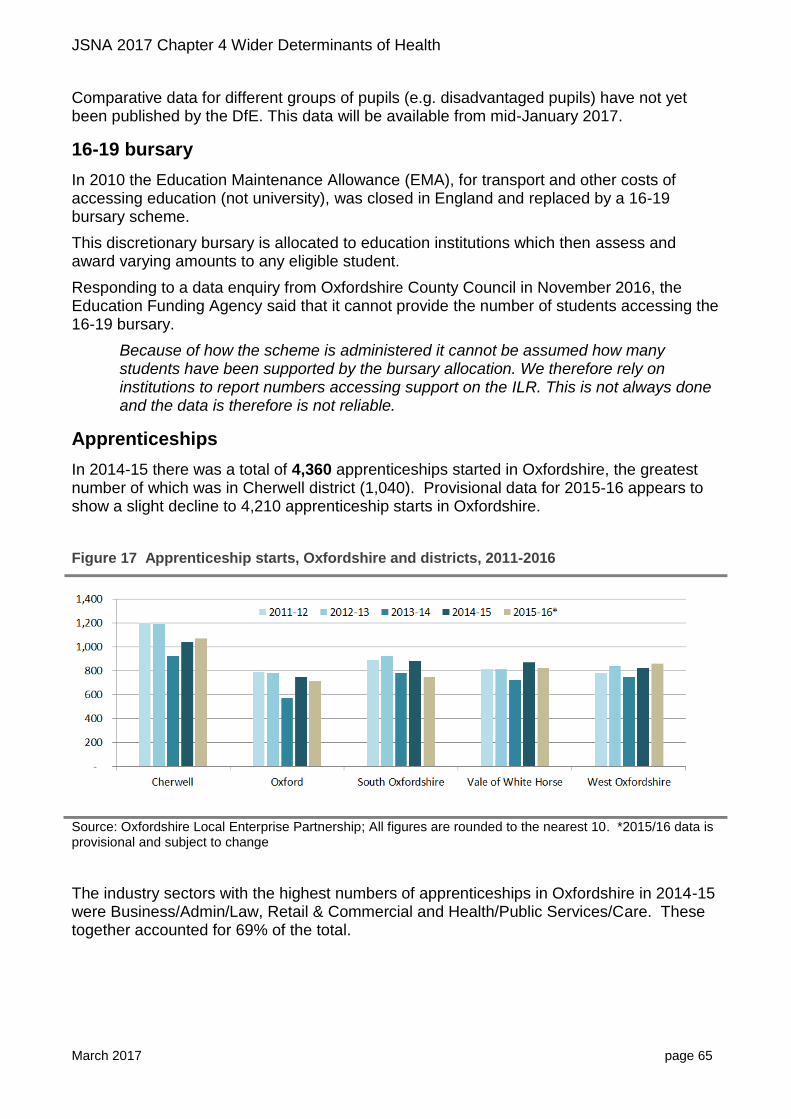
Figure 17 Apprenticeship starts, Oxfordshire and districts, 2011-2016
Source: Oxfordshire Local Enterprise Partnership; All figures are rounded to the nearest 10. *2015/16 data is provisional and subject to change
The industry sectors with the highest numbers of apprenticeships in Oxfordshire in 2014-15 were Business/Admin/Law, Retail & Commercial and Health/Public Services/Care. These together accounted for 69% of the total.
JSNA 2017 Chapter 4 Wider Determinants of Health
March 2017 page 66
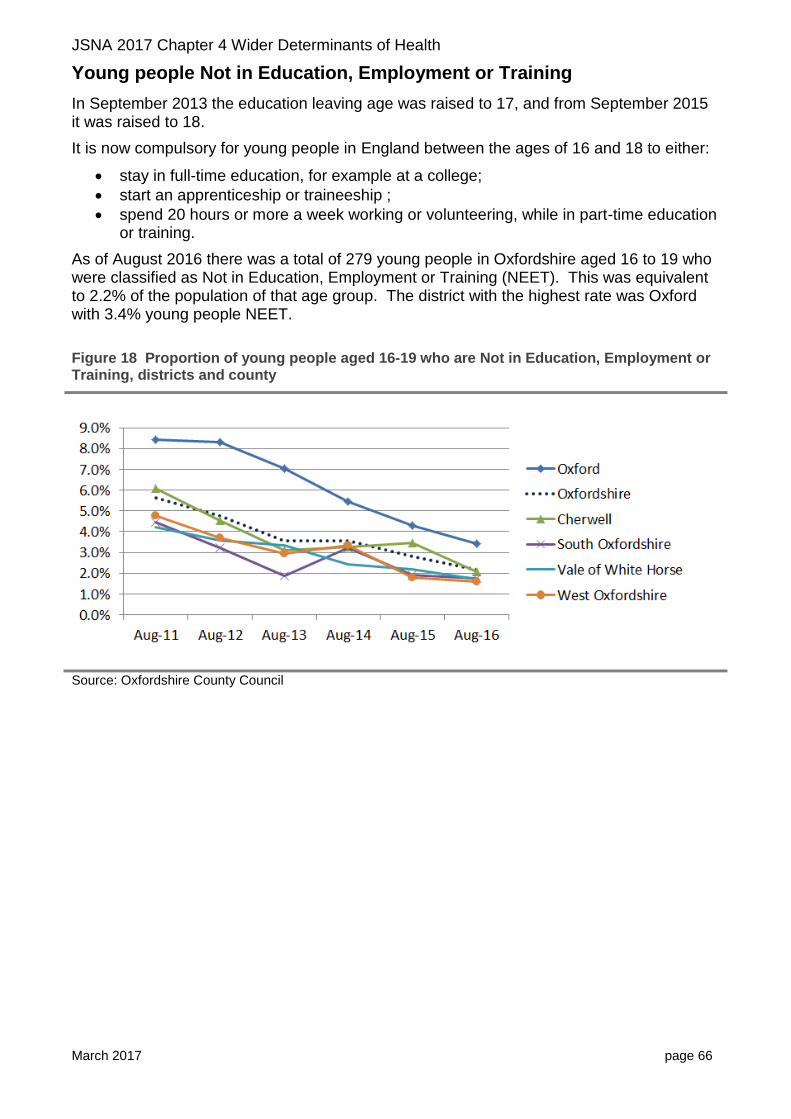
Young people Not in Education, Employment or Training
In September 2013 the education leaving age was raised to 17, and from September 2015 it was raised to 18.
It is now compulsory for young people in England between the ages of 16 and 18 to either:
stay in full-time education, for example at a college;
start an apprenticeship or traineeship ;
spend 20 hours or more a week working or volunteering, while in part-time education or training.
As of August 2016 there was a total of 279 young people in Oxfordshire aged 16 to 19 who were classified as Not in Education, Employment or Training (NEET). This was equivalent to 2.2% of the population of that age group. The district with the highest rate was Oxford with 3.4% young people NEET.
Figure 18 Proportion of young people aged 16-19 who are Not in Education, Employment or Training, districts and county
Source: Oxfordshire County Council
JSNA 2017 Chapter 4 Wider Determinants of Health
March 2017 page 67
Qualifications
As reported in the previous JSNA (2016)21, Oxfordshire had an above-average proportion of people with higher qualifications and a below-average proportion of people with no qualifications.
At the time of the 2011 Census survey, 35.7% of people over 16 in Oxfordshire had at least a bachelor's degree (census category level 4 and above). This was up from 27.7% in 2001. The proportion was higher than in the South East (29.9%) and England overall (27.4%).
16.7% of Oxfordshire’s population lacked any qualification (down from 18.6% per cent in 2001). This was below the proportions seen in the South East (19.1%) and England (22.5%).
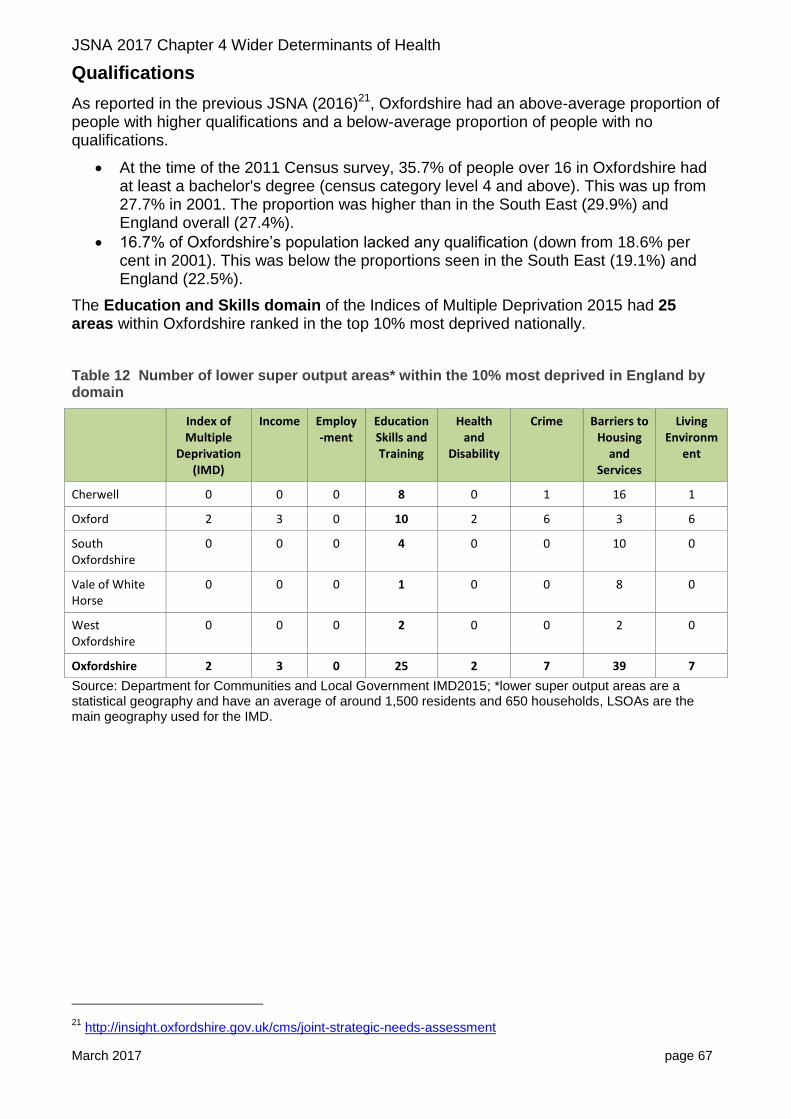
The Education and Skills domain of the Indices of Multiple Deprivation 2015 had 25 areas within Oxfordshire ranked in the top 10% most deprived nationally.
Table 12 Number of lower super output areas* within the 10% most deprived in England by domain
Index of Multiple
Deprivation (IMD)
Income Employ-ment
EducationSkills and Training
Health and
Disability
Crime Barriers to Housing
and Services
Living Environm
ent
Cherwell 0 0 0 8 0 1 16 1
Oxford 2 3 0 10 2 6 3 6
South Oxfordshire
0 0 0 4 0 0 10 0
Vale of White Horse
0 0 0 1 0 0 8 0
West Oxfordshire
0 0 0 2 0 0 2 0
Oxfordshire 2 3 0 25 2 7 39 7
Source: Department for Communities and Local Government IMD2015; *lower super output areas are a statistical geography and have an average of around 1,500 residents and 650 households, LSOAs are the main geography used for the IMD.
21
http://insight.oxfordshire.gov.uk/cms/joint-strategic-needs-assessment
JSNA 2017 Chapter 4 Wider Determinants of Health
March 2017 page 68
4.5 Physical and social environment
The environment is a major determinant of health. A well-designed physical environment can provide opportunities for:
people to be more active e.g. encouraging walking and cycling as modes of transport, open spaces/green spaces for play and recreation, sports and leisure.
healthier food choices e.g. restricting proximity of hot food takeaways to schools and encouraging healthy food provision in public spaces such as community centres, leisure centres and park kiosks.
social interaction e.g. encouraging social community infrastructure and opportunities for social interaction, reducing social isolation and loneliness.
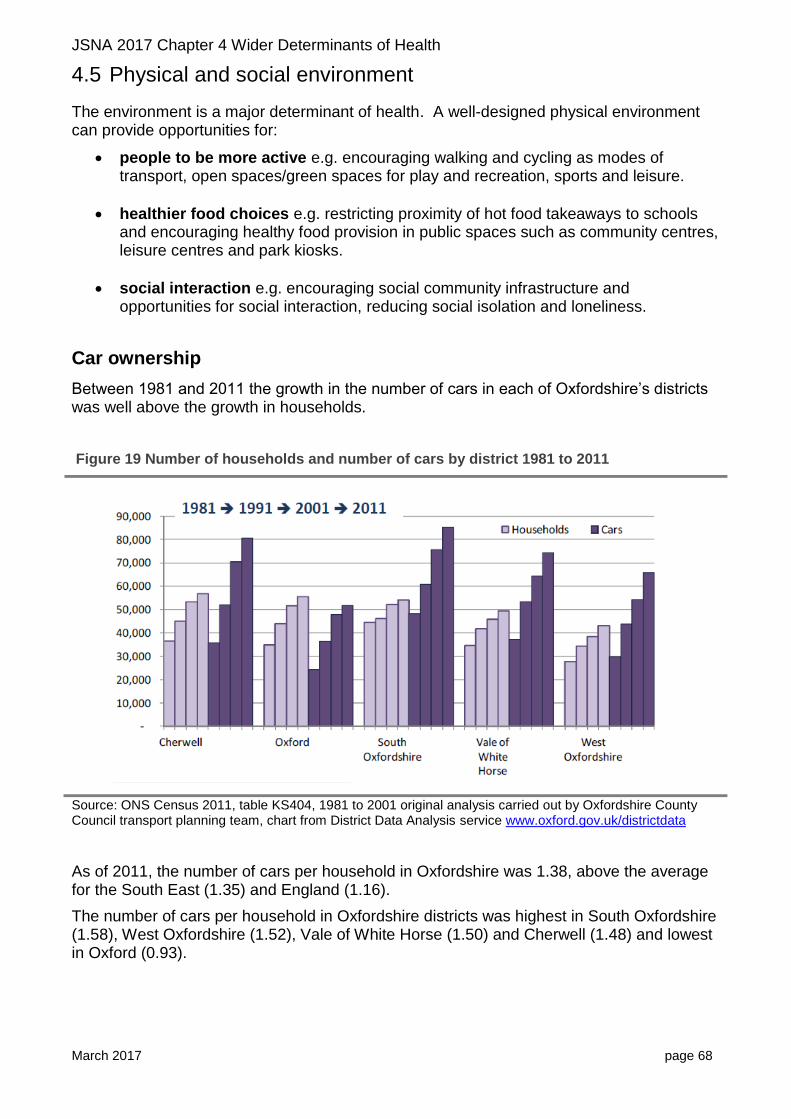
Car ownership
Between 1981 and 2011 the growth in the number of cars in each of Oxfordshire’s districts was well above the growth in households.
Figure 19 Number of households and number of cars by district 1981 to 2011
Source: ONS Census 2011, table KS404, 1981 to 2001 original analysis carried out by Oxfordshire County Council transport planning team, chart from District Data Analysis service www.oxford.gov.uk/districtdata
As of 2011, the number of cars per household in Oxfordshire was 1.38, above the average for the South East (1.35) and England (1.16).
The number of cars per household in Oxfordshire districts was highest in South Oxfordshire (1.58), West Oxfordshire (1.52), Vale of White Horse (1.50) and Cherwell (1.48) and lowest in Oxford (0.93).

JSNA 2017 Chapter 4 Wider Determinants of Health
March 2017 page 69
Active travel
Oxford continues to have relatively high rates of cycling, influenced by the higher rate of cycling amongst students.
In England the proportion of the adult population who cycled at least once per month has remained at around 15%. In Oxford the proportion was over double this national rate (43%).
Figure 20 Percentage of adults cycling at least once a month: top 10 local authorities, England, 2014-15
Source: Walking and cycling statistics Dept for Transport from Active People Survey (published July 2016)
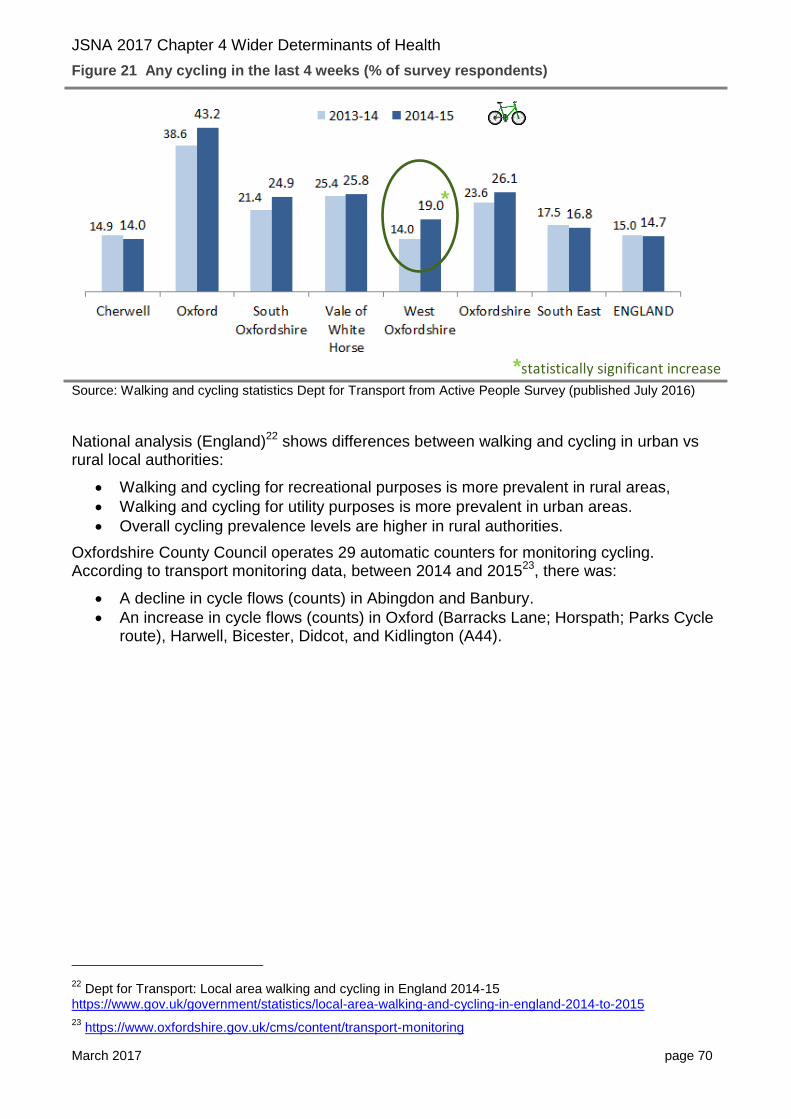
Comparing rates of walking and cycling between 2013-14 and 2014-15 shows little change in Oxfordshire’s districts.
The exception was West Oxfordshire where there was a statistically significant increase in cycling between 2013-14 and 2014-15. The increase in West Oxfordshire was in people using a cycle for “utility” reasons (anything other than recreational, i.e. including cycling to work) at least once per month.
22% of students report cycling at least once per month, more than any other socio-economic group (England 2014-15)
JSNA 2017 Chapter 4 Wider Determinants of Health
March 2017 page 70
Figure 21 Any cycling in the last 4 weeks (% of survey respondents)
Source: Walking and cycling statistics Dept for Transport from Active People Survey (published July 2016)
National analysis (England)22 shows differences between walking and cycling in urban vs rural local authorities:
Walking and cycling for recreational purposes is more prevalent in rural areas,
Walking and cycling for utility purposes is more prevalent in urban areas.
Overall cycling prevalence levels are higher in rural authorities.
Oxfordshire County Council operates 29 automatic counters for monitoring cycling. According to transport monitoring data, between 2014 and 201523, there was:
A decline in cycle flows (counts) in Abingdon and Banbury.
An increase in cycle flows (counts) in Oxford (Barracks Lane; Horspath; Parks Cycle route), Harwell, Bicester, Didcot, and Kidlington (A44).
22
Dept for Transport: Local area walking and cycling in England 2014-15 https://www.gov.uk/government/statistics/local-area-walking-and-cycling-in-england-2014-to-2015
23 https://www.oxfordshire.gov.uk/cms/content/transport-monitoring
*
*statistically significant increase

JSNA 2017 Chapter 4 Wider Determinants of Health
March 2017 page 71
Travel to school
Nationally the proportion of trips to school made by walking has fallen over the last 40 years24, especially for primary age pupils.
74% of primary age pupils in Great Britain walked to school in 1975-76 compared with 46% in 2013.
53% of secondary age pupils walked to school in 1975-76 compared with 37% in 2013.
The falling trend in walking trips is likely to reflect both increasing household car availability, and increasing length of trips to school.
Trips by primary school age children of less than 1 mile went from 67% of all trips in 1975-76 to 47% of all trips in 2014.
Trips by secondary school age children of less than 1 mile went from 35% in 1975-76 to 23% of all trips in 2014.
A high proportion of primary aged children were accompanied by an adult. Road safety continues to be the top reason although fear of assault has seen a recent increase.
Young children (aged 7-10) have become less likely to be allowed to cross roads alone than in 2002. When they are allowed to do so it is more likely to be for minor roads only.
Figure 22 Trends in the proportion of children allowed to cross roads alone, either always or sometimes: England, 2002 to 2013
Source: National Travel Survey 2014: Travel to school factsheet
24
National Travel Survey 2014: Travel to school factsheet

JSNA 2017 Chapter 4 Wider Determinants of Health
March 2017 page 72
People injured on cycles
The number of people injured using cycles on roads in Oxfordshire has increased significantly since 2010.
In 2015 there was a total of 344 people injured on a pedal cycle (including killed, seriously injured or ‘slight’ casualties) in Oxfordshire up from 237 in 2010 (+45%). Over the same time period the number of pedal cycle casualties in Great Britain increased by +10%.
Of the 344 injuries in 2015, 4 were fatal, 63 were serious and 277 were slight casualties.
Figure 23 Trend in casualties using a pedal cycle, Oxfordshire vs GB
Source: Oxfordshire County Council; GB data from Department for Transport statistics table RAS30004
Green spaces An October 2016 Parliamentary Office of Science and Technology briefing on Green space and Health25 found that:
Areas with more accessible green space are associated with better mental and physical health.
The risk of mortality caused by cardiovascular disease is lower in residential areas that have higher levels of ‘greenness’.
There is evidence that exposure to nature could be used as part of the treatment for some conditions.
25
http://researchbriefings.parliament.uk/ResearchBriefing/Summary/POST-PN-0538
Indexed to 2010
JSNA 2017 Chapter 4 Wider Determinants of Health
March 2017 page 73
Access to healthy food choices
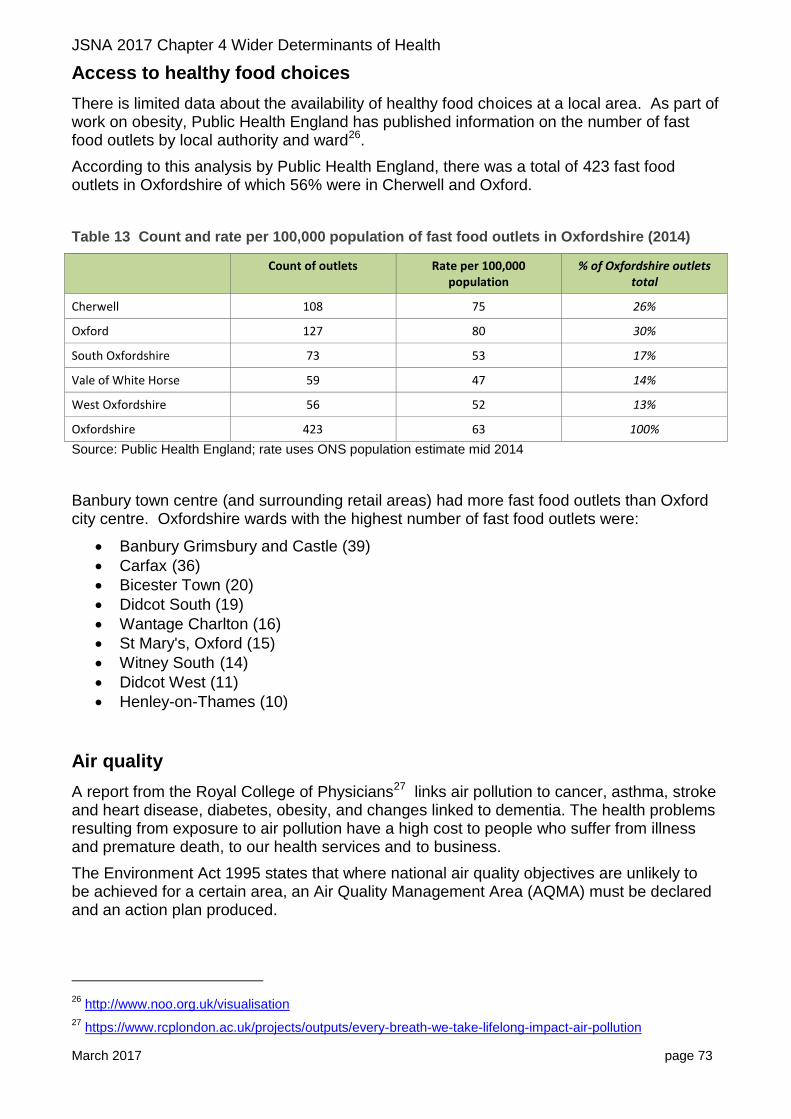
There is limited data about the availability of healthy food choices at a local area. As part of work on obesity, Public Health England has published information on the number of fast food outlets by local authority and ward26.
According to this analysis by Public Health England, there was a total of 423 fast food outlets in Oxfordshire of which 56% were in Cherwell and Oxford.
Table 13 Count and rate per 100,000 population of fast food outlets in Oxfordshire (2014)
Count of outlets Rate per 100,000 population
% of Oxfordshire outlets total
Cherwell 108 75 26%
Oxford 127 80 30%
South Oxfordshire 73 53 17%
Vale of White Horse 59 47 14%
West Oxfordshire 56 52 13%
Oxfordshire 423 63 100%
Source: Public Health England; rate uses ONS population estimate mid 2014
Banbury town centre (and surrounding retail areas) had more fast food outlets than Oxford city centre. Oxfordshire wards with the highest number of fast food outlets were:
Banbury Grimsbury and Castle (39)
Carfax (36)
Bicester Town (20)
Didcot South (19)
Wantage Charlton (16)
St Mary's, Oxford (15)
Witney South (14)
Didcot West (11)
Henley-on-Thames (10)
Air quality
A report from the Royal College of Physicians27 links air pollution to cancer, asthma, stroke and heart disease, diabetes, obesity, and changes linked to dementia. The health problems resulting from exposure to air pollution have a high cost to people who suffer from illness and premature death, to our health services and to business.
The Environment Act 1995 states that where national air quality objectives are unlikely to be achieved for a certain area, an Air Quality Management Area (AQMA) must be declared and an action plan produced.
26
http://www.noo.org.uk/visualisation
27 https://www.rcplondon.ac.uk/projects/outputs/every-breath-we-take-lifelong-impact-air-pollution

JSNA 2017 Chapter 4 Wider Determinants of Health
March 2017 page 74
Oxfordshire has 13 Air Quality Management Areas in Oxfordshire, where the annual mean objective for nitrogen dioxide is being exceeded28: four in Cherwell, one covering the whole of Oxford, three in South Oxfordshire, three in Vale of White Horse and two in West Oxfordshire. These are within the most populated areas of the county, where a direct link can be made between air pollution and emissions from road traffic.
Cherwell AQMA No.1 is an area around Hennef Way, Banbury.
AQMA No.2 is an area between Southam Road and Oxford Road, Banbury, including some of High Street.
AQMA No.3 is an area of Bicester Road, Kidlington.
AQMA No.4 is an area around Kings End, Queens Avenue, Field Street and St Johns, Bicester.
Nitrogen dioxide is monitored at 43 sites throughout the district.
http://www.cherwell.gov.uk/airqualitymanagement
Oxford In September 2010 Oxford City Council made an Air Quality Management Order declaring the whole of the city as an AQMA, to include the 7 localised hotspots where pollution levels of nitrogen dioxide have exceeded national objectives.
The latest available air pollution data for the year 2015, included in Oxford City Council’s Air Quality Annual Status Report (July 2016)
29 shows that ten year air pollution trends of NO2
measured at roadside monitoring sites have dropped by 35% in the city centre, however, the annual mean was still exceeded at 25 of the 70 monitoring locations in 2015. Transport is by far the most significant source of emissions of this pollutant in the city, with a contribution of 75% of the total emissions.
https://www.oxford.gov.uk/info/20216/air_quality_management
South Oxfordshire Henley: Air pollution levels have been monitored in Henley since 1998 and due to levels of NO2 exceeding the national air quality objectives, an AQMA was declared in 2002.
Wallingford: Air pollution here has also been monitored since 1998. An AQMA was declared in 2005 again as a result of NO2 levels exceeding the national objectives.
Watlington: Air pollution monitoring in Watlington commenced in 2003 with an AQMA designated in 2009 due to NO2 exceedences.
https://oxfordshire.air-quality.info/local-air-quality-management/south-oxfordshire
Vale of White Horse Abingdon: Air pollution levels have been monitored in Abingdon since 1995 and due to levels of NO2 exceeding the national air quality objectives, an AQMA was declared in 2006.
Botley: Air pollution here has also been monitored since 1995. An AQMA was declared in 2008 again as a result of NO2 levels exceeding the national objectives.
Marcham: Air pollution monitoring in Marcham commenced in 2009 with an AQMA designated in 2015 due to NO2 exceedences.
https://oxfordshire.air-quality.info/local-air-quality-management/vale-of-white-horse
West Oxfordshire West Oxfordshire has 2 Air Quality Management Areas (AQMAs) which exceed the objective for nitrogen dioxide: Chipping Norton and Witney.
Concentrations outside of the AQMAs are all below the objectives at relevant locations, (latest report 2014)
https://www.westoxon.gov.uk/residents/environment/environmental-health/air-quality/
28
Department for Environment, Food and Rural Affairs list of local authorities with AQMAs https://uk-air.defra.gov.uk/aqma/list
29 https://www.oxford.gov.uk/downloads/file/2936/air_quality_annual_status_report_2016
JSNA 2017 Chapter 4 Wider Determinants of Health
March 2017 page 75
Noise Pollution
As reported by the 2016 JSNA, in 2011 Public Health England estimated that 3.4% of Oxfordshire’s population was exposed to road, rail and air transport noise of 65 A-weighted decibels or more, during the daytime.
At the same time, an estimated 5.4% of Oxfordshire’s population was exposed to road, rail and air transport noise of 55 A-weighted decibels or more, during the night-time.
In 2013/14 the rate of complaints about noise in Oxfordshire was estimated at 5.3 per 1,000 people in the population. This was similar to rates in the previous two years. It was also similar to the estimate for the South East (5.4) but lower than that for England overall (7.4). Across the county there were thought to be proportionately more complaints in Oxford (9 per 1,000 people in the population) than in other districts.
Climate change
The UK Climate Change Risk Assessment 201730 by the Committee on Climate Change31, (July 2016) summarises the greatest direct climate change-related threats for the UK as:
large increases in flood risk
exposure to high temperatures and heatwaves,
shortages in water,
substantial risks to UK wildlife and natural ecosystems,
risks to domestic and international food production and trade, and
risks from new and emerging pests and diseases.
A 2012 report from the Health Protection Agency32 on the health effects of climate change reported that:
At present, the health burden due to low temperature exceeds that of high temperature. However, heat-related mortality, which is currently around 2,000 premature deaths per year, is projected to increase steeply in the UK throughout the 21st century.
Southern, central and eastern England appear to be most vulnerable to current and future effects of hot weather compared with other UK regions. Cold is still likely to contribute to the majority of temperature related health effects over the coming decades, although the health burden due to the cold is projected to decline by the 2080s compared with the present day levels.
The elderly are more vulnerable to extreme heat and cold than younger people, so future health burdens are likely to be amplified by an ageing population.
The Health Protection Agency report considered:
ozone-related mortality, air pollution;
aeroallergens associated with pollen grains and fungal spores;
30
https://www.theccc.org.uk/tackling-climate-change/preparing-for-climate-change/climate-change-risk-assessment-2017/
31 The Committee on Climate Change (CCC) is an independent statutory body established under the Climate
Change Act 2008 to advise the UK and devolved administration governments on setting and meeting carbon budgets, and preparing for climate change.
32 Health effects of climate change in the UK 2012 https://www.gov.uk/government/publications/climate-
change-health-effects-in-the-uk

JSNA 2017 Chapter 4 Wider Determinants of Health
March 2017 page 76
building overheating, indoor air pollution, flood damage and water and biological contamination of buildings;
levels of Ultraviolet (UV) radiation;
health implications of flooding, particularly impacts on mental health and impacts from disruption to critical supplies of utilities;
range, activity and vector potential of ticks and mosquitoes (expected to increase across the UK by the 2080s). The potential for introduction of exotic species and pathogens;
water and food-borne diseases;
health co-benefits of measures to reduce greenhouse gas emissions (e.g. increased physical activity as a result of reduced car use in urban centres).
A recent report by the UK Health Alliance33 sets out the challenges and opportunities from climate change. Opportunities include the co-benefits of emission reduction activities leading to healthier lifestyles (more walking/ cycling, insulating homes and others).
It is likely that the weather patterns in Oxfordshire will change in coming decades. According to “Oxfordshire in a changing climate” (Oxfordshire County Council, updated January 2016):
The widespread flooding in winter 2014 and winter 2012, show the county’s vulnerability to severe weather.
Climate models indicate that severe weather events could become more frequent in Oxfordshire in the future with:
o More heavy rainfall - more days with heavy rainfall of 25mm (1 inch) or more, particularly in winter.
o More frequent heatwaves - average temperatures likely to increase by between 2.5 and 8.0 ◦C by the 2080s. Heat waves likely at least once in every three years by 2050s.
Figure 24 Impact of heavy rainfall in Oxfordshire
33
A Breath of Fresh Air: Addressing Climate Change and Air Pollution Together for Health 2016 http://www.ukhealthalliance.org/new-report-breath-fresh-air-addressing-climate-change-air-pollution-together-health/

JSNA 2017 Chapter 4 Wider Determinants of Health
March 2017 page 77
Source: Oxfordshire County Council

JSNA 2017 Chapter 4 Wider Determinants of Health
March 2017 page 78
Isolation and loneliness
Isolation and loneliness have been found to be a significant health risk and a cause of increased use of health services.
Loneliness can be as harmful for our health as smoking 15 cigarettes a day34.
Lonely individuals more likely to visit their GP, have higher use of medication, higher incidence of falls and increased risk factors for long term health care35.
In 2015, Age UK carried out a study to predict risk of loneliness at a local area level by applying findings from the English Longitudinal Study of Ageing (wave 5) to local demographic and social statistics.
The factors which were more associated with a higher prevalence of loneliness were:
Health o The poorer the self-reported health, the more likely the respondent feels
lonely. o Having difficulty with one or more activities of daily living is positively
associated with the prevalence of loneliness
Household type: o Being single, divorced or separated and widowhood are associated with a
higher prevalence of loneliness compared to being married. o Household size is inversely related with prevalence of loneliness (the more
people in the household the less like the respondent feels lonely).
Factors found NOT to be statistically associated with loneliness were:
Age
Gender
Having a pet
The level of household income
Whether the respondent is in paid employment.
Rurality
Multiple deprivation
Hearing problems
Number of eye conditions (although it is marginally significant for respondents with 3 or more eye problems).
Areas rated as “High risk” for isolation and loneliness in Oxfordshire were mainly found in Oxford and the urban centres of Banbury, Bicester, Kidlington, Didcot, Henley, Thame, Wallingford, Abingdon, Faringdon, Wantage and Grove, Chipping Norton and Witney.
34
Social relationships and mortality risk: a meta-analytic review. Holt-Lunstad J, Smith TB, Layton JB. PLoS Med 2010;7(7)
35 Cohen, G.D. et al. 2006 ‘The impact of professionally conducted cultural programs on the physical health,
mental health, and social functioning of older adults’ The Gerontologist 46 (6) http://gerontologist.oxfordjournals.org/content/46/6/726