Embed Size (px)
Citation preview


•
•
•
Why?

•
•
•
•
•
•
What and how

•
•
•
•
•
Weighted respondent profile

6.1
19.9
19.843.2
11.1
% agree
Definitely disagree Mostly disagree NAND Mostly agree Definitely agree
I am satisfied with the academic experience so far this term
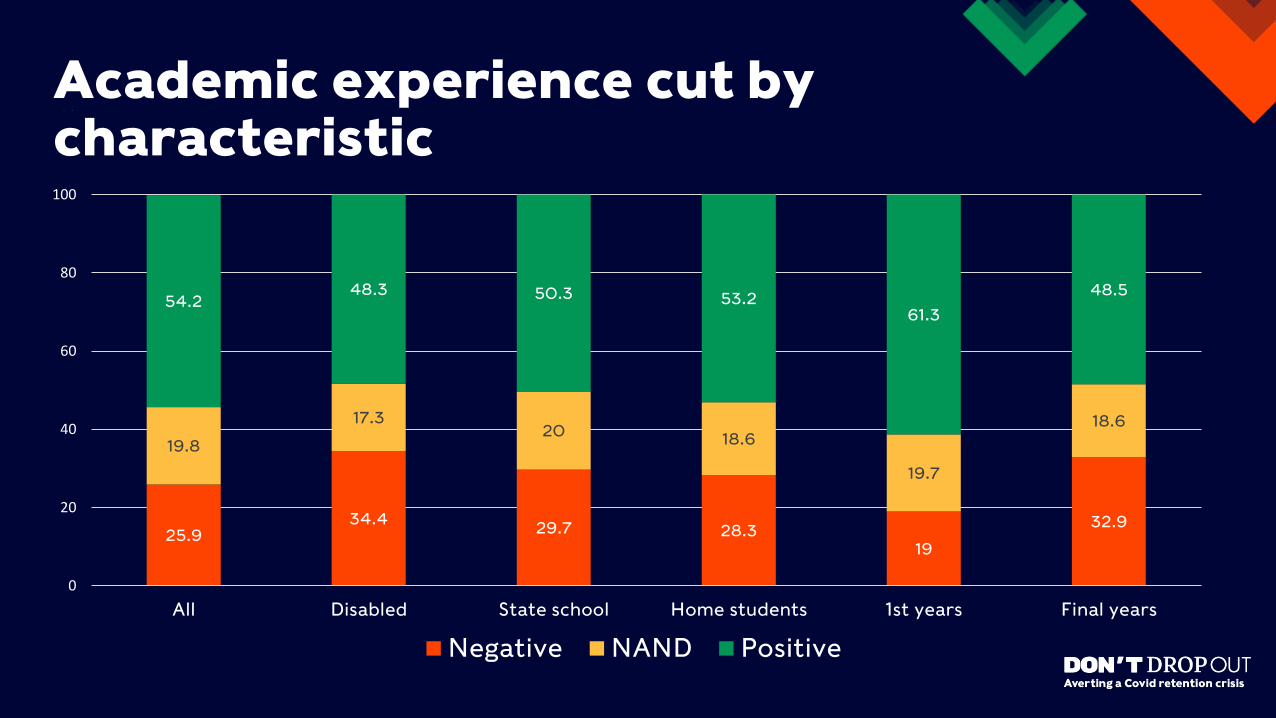
25.934.4
29.7 28.319
32.9
19.8
17.320
18.6
19.7
18.6
54.248.3 50.3 53.2
61.3
48.5
0
20
40
60
80
100
120
All Disabled State school Home students 1st years Final years
Negative NAND Positive
Academic experience cut by characteristic

Academic experience: qual

Academic experience: qual
•
•
•
•
•
What’s going on?

•
•
•
•
•
Key drivers of academic dissatisfaction
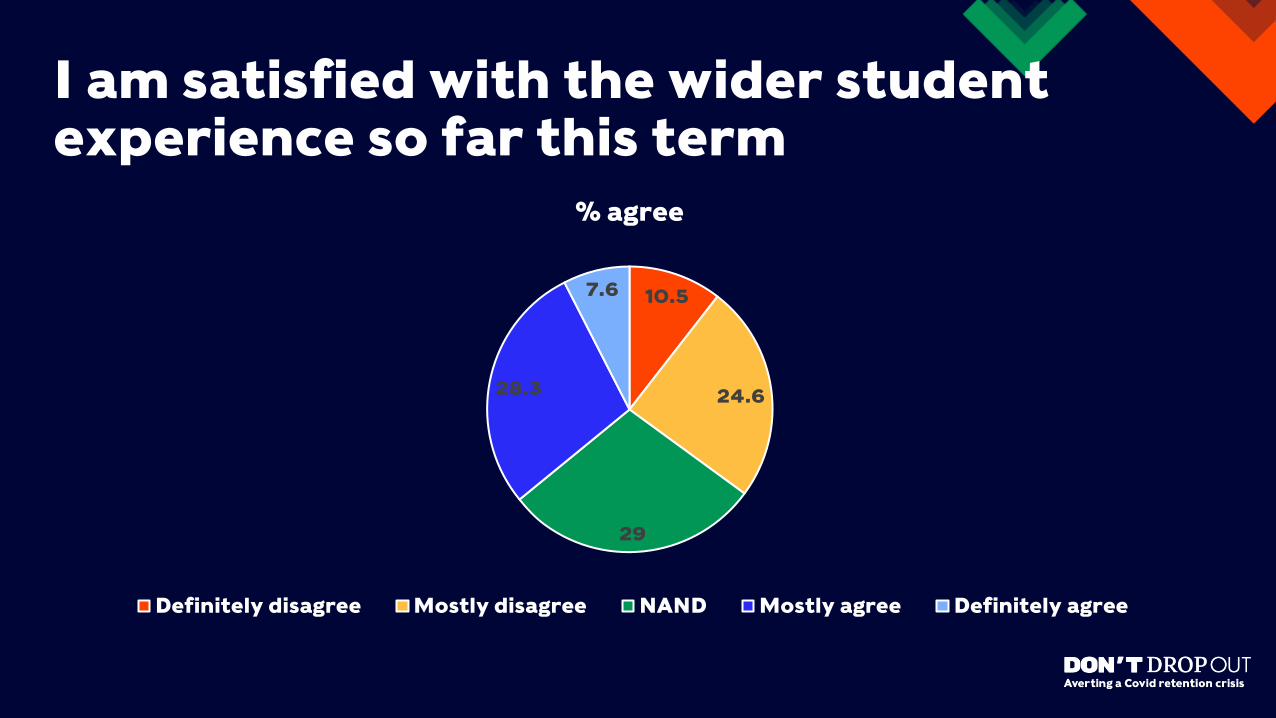
10.5
24.6
29
28.3
7.6
% agree
Definitely disagree Mostly disagree NAND Mostly agree Definitely agree
I am satisfied with the wider student experience so far this term
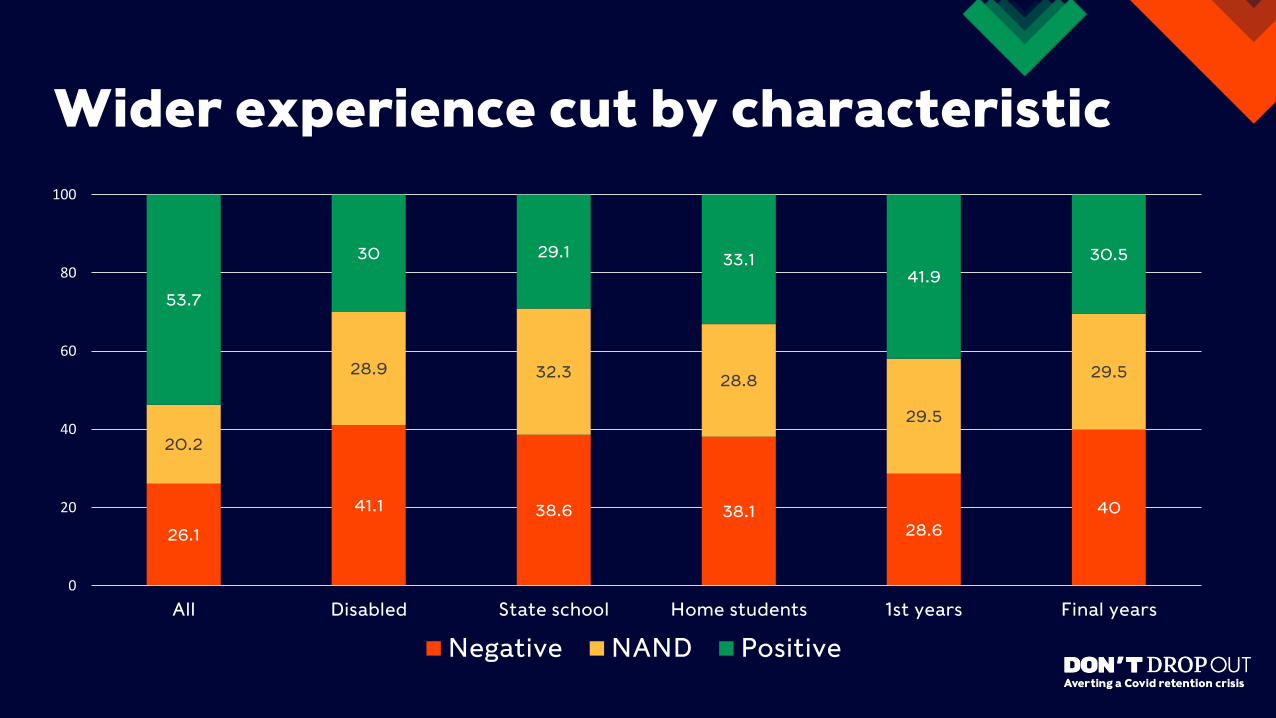
26.1
41.1 38.6 38.128.6
40
20.2
28.9 32.328.8
29.5
29.5
53.7
30 29.1 33.141.9
30.5
0
20
40
60
80
100
120
All Disabled State school Home students 1st years Final years
Negative NAND Positive
Wider experience cut by characteristic

12.4
26.4
42.6
18.6
% agree
Daily Weekly Less than weekly Never
How often, if ever, do you feel lonely? May 2019

18.3
32.132.2
17.4
% agree
Daily Weekly Less than weekly Never
How often, if ever, do you feel lonely? Oct 2020

50.459.7 57.7
44.237.3
48.3 45.2
49.640.3 42.3
55.862.7
51.7 54.8
0
20
40
60
80
100
120
All Uni owned Private halls Parents Own home HMO Remote
Daily or weekly Less often
Loneliness by living situation

14.4
25.2
60.3
% agree
Disagree or strongly disagree NAND Agree or strongly disagree
I feel part of community of staff and students May 2019

24.9
24.7
50.4
% agree
Disagree or strongly disagree NAND Agree or strongly agree
I feel part of community of staff and students Oct 2020

3.7
8.9
20.8
66.5
% agree
Every day Every week Less than weekly Never
How often do you consider dropping out of your course?
•
•
In the following slides…

12.720.5 18 15.4 13.5 17.4
87.379.5 82 84.6 86.5 82.6
0
20
40
60
80
100
120
All Disabled State school Home students 1st years LGBT
Daily or weekly Less often
Drop out risk by characteristic

13.2
29.1
13.75.18
86.8
70.9
86.394.8
0
20
40
60
80
100
120
All Negative academic NAND Positive academic
Drop out risk Not risk
Drop out risk by academic satisfaction

12.6
23.4
10.96.4
87.4
76.6
89.193.6
0
20
40
60
80
100
120
All Negative non academic NAND Positive non academic
Drop out risk Not drop out risk
Drop out risk by non academic satisfaction

12.6
26.1
13.66.5
87.4
73.9
86.493.5
0
20
40
60
80
100
120
All Community negative Community NAND Community positive
Drop out risk Drop out not at risk
Drop out risk by feeling part of a community

12.6
31.5
12.95.5 7
87.4
68.5
87.194.5 93
0
20
40
60
80
100
120
All Daily lonely Weekly lonely Less often lonely Never lonely
Daily or weekly Less often
Drop out risk by loneliness

•
•
•
•
Happiness (9 or 10 agree)

Drop out risk: qual

Wider experience: qual
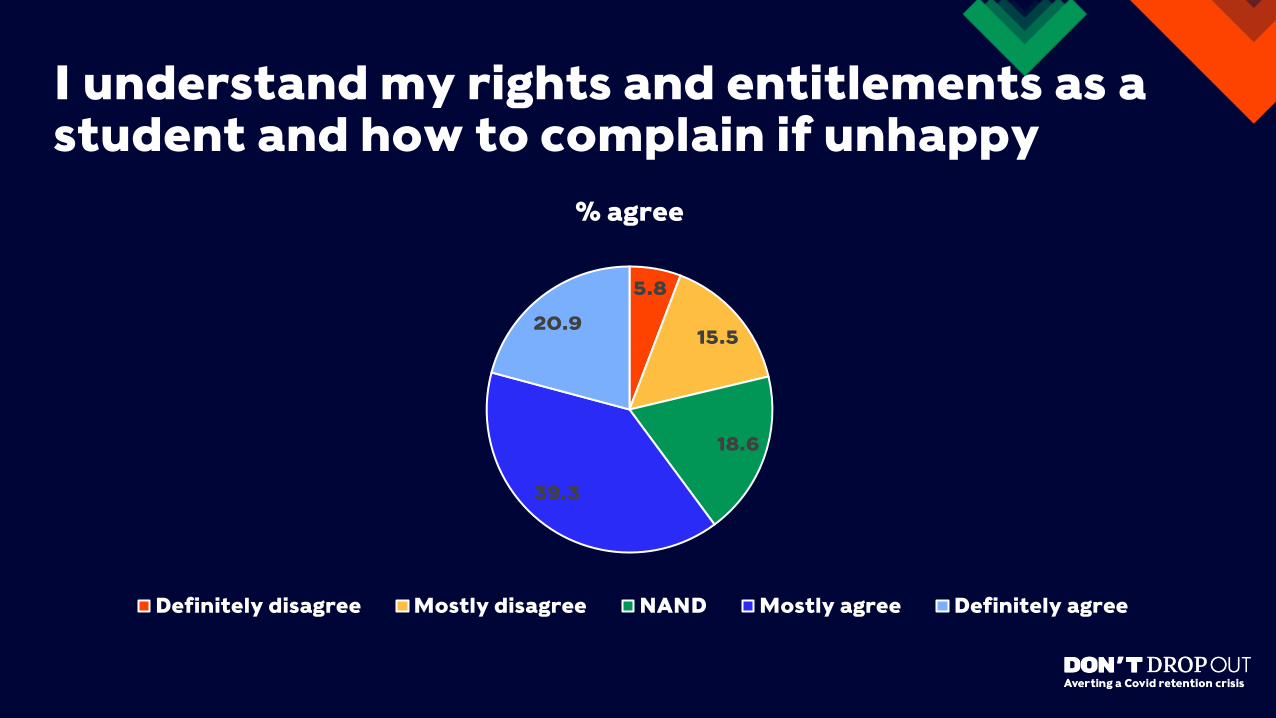
5.8
15.5
18.6
39.3
20.9
% agree
Definitely disagree Mostly disagree NAND Mostly agree Definitely agree
I understand my rights and entitlements as a student and how to complain if unhappy

50.6
36.4
20.5 17.7
18.4
28.6
24.2
17.3
31 35
55.365
0
20
40
60
80
100
120
Drop out daily Drop out weekly Drop out less often Drop out never
Rights negative Rights NAND Rights positive
Rights understanding by drop out risk

38.7
22.112.5
23
28.4
14.8
38.3
49.5
72.7
0
20
40
60
80
100
120
Academic disagree Academic NAND Academic agree
Rights negative Rights NAND Rights positive
Rights understanding by drop out risk
•
•
•
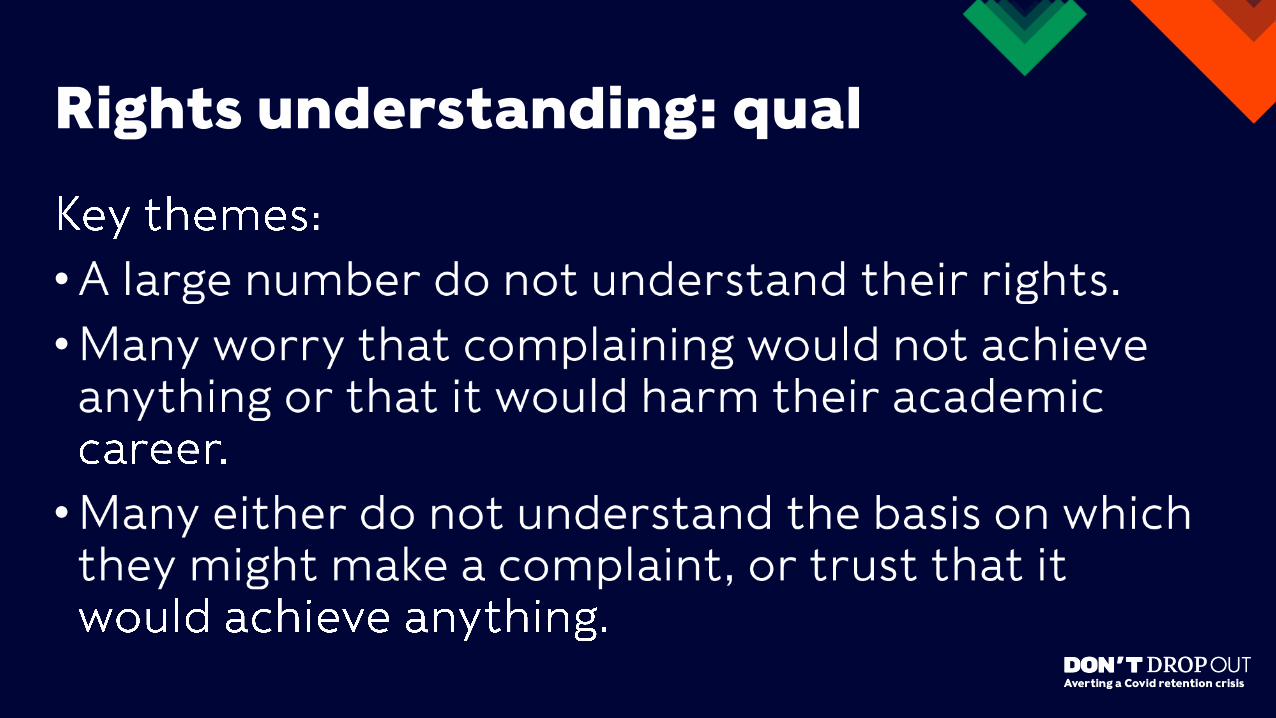
Rights understanding: qual

•
•
Conclusions