Embed Size (px)
Citation preview
Why Do Nonprofits Retain Unrestricted Net Assets? Evidence from Panel Data, and PolicyImplications
Thad CalabreseAssistant Professor
Baruch College – CUNY, School of Public Affairs
Paper prepared for presentation at the National Conference of the Association for Budgeting andFinancial Management
Washington, DCSeptember 24 – 26, 2009
DRAFT
Please do not cite without permission.Comments and suggestions are welcome.
2
1. Introduction
Despite large public investment in the nonprofit sector, no public policy exists regarding
how much surplus a nonprofit organization (“NPOs”) may earn in any given year, or how long
these accumulated surpluses (net assets) may be retained by a nonprofit. Even though these
surpluses are themselves tax-exempt (from corporate or income taxes) and possibly acquired
with tax-deductible donations, the Internal Revenue Service has no regulations regarding these
nonprofit net asset accumulation. While investors or owners may influence how much earnings a
company retains or distributes, the “nondistribution constraint” of the nonprofit sector – in which
there is “the absence of stock or other indicia of ownership that give their owners a simultaneous
share in both profits and control” (Hansmann 1980) – leaves this choice primarily in the hands of
nonprofit decision makers.
Existing literature has focused little on nonprofit net asset accumulation. To date, no
analysis has examined why NPOs choose to retain unrestricted net assets, the only class of net
assets controllable by nonprofit decision makers rather than donors. This paper adds to the
existing literature by testing several competing hypotheses that might motivate a nonprofit to
retain unrestricted net assets rather than increase current output (operating expenses). The
empirical strategy used in this analysis also adds to the literature by suggesting a method for
overcoming several significant statistical estimation issues, namely endogeneity in regressors,
omitted variable bias, and persistence in the dependent variable. These estimation issues are
common when modeling organizational financial characteristics. Further, the dynamic panel data
estimation employed in this analysis is the first empirical examination of NPO unrestricted net
asset accumulation over time.
3
The results suggest that NPOs do seek to increase unrestricted net assets over time, and
that some nonprofits retain unrestricted net assets primarily to hedge against fiscal shocks.
Rather than simply accumulating unrestricted net assets for their own sake, these nonprofits do
appear to act rationally and in manners consistent with sound business practices. However,
certain subsectors (notably Arts and Higher Education) do not seem to accumulate unrestricted
net assets as a response to potential risk; rather, these organizations simply retain more as they
increase in size.
The rest of the paper proceeds as follows: section 2 defines nonprofit net assets, discusses
why they are important to nonprofit organizations, differentiates nonprofit net assets from other
organizations’ retained earnings, and describes the policy relevance of nonprofit unrestricted net
assets; section 3 summarizes the existing literature as well as hypotheses regarding nonprofit net
asset accumulation; section 4 defines the variables used in the analysis, outlines the empirical
strategy employed, and describes the data used; section 5 discusses the results of the empirical
estimation; section 6 outlines several policy implications to the empirical findings; while section
7 concludes.
2.1 Defining Nonprofit Net Assets, and the Importance of Net Assets to Nonprofits
Just as with a for-profit entity, any annual excess of revenues over expenses results in an
operating surplus (referred to as “change in net assets” in the nonprofit sector). NPOs that earn
an operating surplus in any period essentially have three options: 1) increase operating expenses
so that the operating surplus is used up in current operations; 2) invest in fixed assets which
presumably are used in providing mission-oriented services;1 or 3) retain these operating
surpluses. These retained annual operating profits accumulate on an organization’s balance sheet
and are reflected as “Net Assets.” These net assets are comparable to the equity portion of a for-
4
profit entity’s balance sheet and are stock financial measures (that is, measures at one point in
time, typically the last day of fiscal year); profits (or change in net assets), on the other hand,
appear on organizations’ operating statements and are flow financial measures (that is, measures
over a range of time, typically a whole fiscal year).
Net assets on the nonprofit balance sheet must equal Total Assets less Total Liabilities,
or:
Total Assets – Total Liabilities = Total Net Assets (1)
Therefore, net assets do not represent cash balances of the organization; rather, net assets
represent a claim of ownership on assets owned by the organization.2 In effect, net assets
represent those assets reinvested within the NPO (since the nonprofit is unable to distribute
profits, due to the “nondistribution constraint”) rather than used up.
Net assets also comprise part of a nonprofit’s capital structure, since:
Total Assets = Total Liabilities + Total Net Assets (2)
Equation 2 indicates that an organization must finance its assets using borrowing (Total
Liabilities), accumulated surpluses (Total Net Assets), or some combination of the two. Assets –
such as cash, inventory, property, equipment, etc. – are necessary for any organization to provide
services to its clients. Without accumulated net assets, a nonprofit would have to finance its
assets with debt only (Total Liabilities, in equation 2); yet debt itself is difficult to obtain without
some collateral (assets) that protects the lender in the case of financial bankruptcy or insolvency
by the borrower. Tuckman (1993) suggests that other sources of capital (such as debt or
donations, as examples) might be easier to obtain if a NPO can use accumulated net assets as
5
evidence of fiscal strength and prudence. Net assets, then, are essential for NPOs to finance
assets and provide mission-oriented services.
Net assets can also be viewed as one definition of organizational fiscal slack since it
represents all resources on which the nonprofit may draw before becoming insolvent. Net assets
serve as an operating reserve so that operating deficits (when operating expenses exceed
operating revenues) do not threaten organizational viability. While different from working
capital reserves (which tend to be cash), net assets serve to protect nonprofits by helping preserve
core mission services during times of deficit-financing (Bowman 2007).
2.2 Unique Feature of Nonprofit Net Assets
Nonprofit net assets are differentiated from for-profit equity by the ability of donors to
restrict certain assets, a feature that is nonexistent in the corporate sector with equity
investments. Generally Accepted Accounting Principles (GAAP) require nonprofit organizations
to report on three classes of net assets – unrestricted, temporarily restricted, and permanently
restricted net assets. These classes are based on whether or not a donor has imposed such a
restriction upon the gift (FASB 1993). Reporting on these donor-imposed restrictions is one of
the central characteristics of nonprofit financial accounting.
There is no financial account termed “Restricted Retained Earnings” in corporate
accounting; retained earnings can be reinvested in the firm or distributed to shareholders as
dividends. NPOs may have net assets that functionally appear synonymous with corporate
retained earnings, but the resources may be unavailable to the nonprofit due to a donor-imposed
restriction as to use or timing.3 For example, a donor may dictate that resources provided to the
nonprofit must be used for a specific purpose (for example, a certain program operated by the
nonprofit); further, a donor may even forbid the nonprofit from spending the donated resources
6
at all (for example, an endowment), giving the organization access only to the earnings from the
endowment. While “net assets” might represent a form of fiscal slack, “unrestricted net assets”
might be a better definition since assets financed by donor-restricted resources cannot be
disposed of as the nonprofit desires in the case of fiscal need. Releasing restrictions requires
either the involvement of the donor or the State Attorney General (assuming that the Attorney
General has the power to change such restrictions – called the cy pres doctrine).
Restrictions on donation usage, then, may limit a NPO’s options in regard to surplus
accumulation. In fact, the three options facing the nonprofit (increase operating expenses,
investment in fixed assets, or retention) may be decided by an external party: the donor may
require that the organization spend the money in a specific way (a temporarily restricted net
asset) or may forbid spending the donation at all, thereby requiring the nonprofit to retain it (a
permanently restricted net asset). This paper analyzes why nonprofits themselves choose to
retain net assets that they do have control over (unrestricted net assets) rather than simply using
up all available resources in operations (implying breakeven operations).
2.3 Policy Relevancy of Nonprofit Net Assets
Recently, public confidence in nonprofit performance, efficiency, and financial
management has eroded (Light 2008), focusing attention in part on net asset accumulations by
certain segments of the nonprofit sector. In 2001, the American Red Cross came under fire for
choosing to retain a portion of the donations it had collected in the aftermath of the 9/11 terrorist
attacks. Although such retention is organizational policy to ensure available funds for future
disasters, the negative publicity led some to criticize public charities that appeared more
interested in retaining money rather than spending it on programmatic output.4 Criticism
culminated in a November 2001 special House of Representative hearing on the matter. In 2006,
7
the Senate Finance Committee held hearings focusing on the increase in college tuition despite
the accumulation of reserves by universities. One recommendation from the hearing was that
universities be subject to a minimum payout requirement similar to the law governing private
foundations. In February 2008, the Higher Education Act reauthorization passed in the House of
Representatives required universities to spend at least five percent of their accumulated net assets
annually in ways that would reduce students’ costs of attending universities. In September 2008,
the Senate Finance Committee again held hearings focused on college endowment levels and the
affordability of higher education. As noted by Irvin (2007), the well-publicized growth in
university and foundation endowments may make the public even more distrustful of the
nonprofit sector as a whole. This distrust may manifest itself in fewer donations from the public
or even additional regulatory requirements.
With the onset of the 2008 economic recession, NPOs saw operating revenues decline
while demand for services increased. In one survey, over three-quarters of nonprofits indicated
they expected increased demand for their services in 2009, while 93 percent of “lifeline”
nonprofits (that is, those that primarily serve low-income populations) anticipated increased
service demand from clients. At the same time, only 12 percent of respondents expected to
operate better than breakeven during 2009. Over 60 percent of nonprofits lacked reserves in
excess of three months operating expenses, and nearly 40 percent of organizations were
contemplating terminating mission-related programs (all statistics derived from Nonprofit
Finance Fund 2009).
Governments rarely provide direct social services to individuals; rather, these services –
perhaps even more critical during a recession - are often contracted out, and nonprofits receive
many of these contracts (DeVita 1999). Yet, just as NPOs were needed for providing services
8
(including additional publicly financed ones), the sector seemed financially vulnerable and was
struggling for financial survival, let alone able to increase program output. The effectiveness of
government social policy in addressing the effects of the economic downturn depends in part on
the financial capacity of the nonprofit sector. Within one year the public discourse went from
whether certain elite NPOs held too large an accumulation of net assets to whether the nonprofit
sector overall held too little as hedge against economic downturns. Since nonprofit financial
vulnerability or strength may affect the implementation of public policies, the issue of nonprofit
net asset accumulation is an important policy concern.
3.1 Existing Literature and Theories about Nonprofit Net Asset Accumulation
Limited existing research explores nonprofit net assets, and none empirically addresses
unrestricted net asset accumulation. To maintain client and public trust, Hansmann (1980)
reasons that NPOs are expected to devote any excess earnings (termed “endowments”) to
additional output, either in the current time period or in the future. He also notes that
“endowments” may be valuable due to the imperfection of nonprofit capital markets (in which
financing is limited since NPOs cannot raise money by selling ownership interests in itself).
Thus, these “endowments” may serve operating and capital needs of NPOs.
Hansmann (1990) broadens his analysis of “endowments” to include the ability of such
accumulations to smooth consumption over business cycles as well. The investment income
derived from such “endowments” reduces the natural fluctuations of other operating revenues.
Therefore, Hansmann (1980) might best be thought of describing expendable resources (that is,
unrestricted and temporarily restricted net assets), while Hansmann (1990) might best be
understood as describing resources that are not expendable but generate additional revenue for
the nonprofit (that is, permanently restricted net assets). Bowman (2007) expands upon
9
Hansmann (1990) to discuss the limitations of endowments from donor-imposed restrictions.
Chang and Tuckman (1990) contend that net assets (which they term “equity”) may be
valuable to nonprofit managers as an end in itself. Nonprofit managers value net asset
intrinsically, and establish such accumulations as a goal of operations (above and beyond
charitable outputs alone). The authors do not distinguish between restricted and unrestricted net
assets, however.
Tuckman and Chang (1992) expand on their prior work and provide the first empirical
analysis concerning nonprofit net asset accumulation. The authors hypothesize that net assets
allow the nonprofit manager to attain satisfaction through specific behaviors:
1) A NPO may wish to subsidize certain clients who would be unable to cover the
full costs of receiving services from the nonprofit.5 Because a NPO subsidizes
certain clients, it may set aside certain net assets to ensure these populations have
access to program services, especially in the future.
2) Net assets serve as an internal (rather than external) capital source for nonprofits.
3) Net assets provide a rainy day fund for temporary downturns in revenues. Thus,
net assets help reduce the financial vulnerability of NPOs.
4) Net assets provide nonprofit managers with independence from donors’
expectations. Investment income helps generate operating surpluses (and net
assets), providing NPOs with independence from market output (since investment
income does not depend on donor or client satisfaction);
5) Finally, net assets may be a measure of success in the sector – similar to equity
accumulation in the for-profit sector. This might be because nonprofit boards are
populated with members from the business community, or even because nonprofit
10
managers are enthusiastic fund-raisers.
Their analysis derives a nonprofit demand function for net assets constrained by total revenues
and total expenses, and their cross-sectional results suggest that nonprofit decision makers do
deliberately and methodically increase total net assets.
Recently, Fisman and Hubbard (2005) analyze whether public oversight of NPOs through
State Attorneys General might help overcome potential agency problems when nonprofits
accumulate large levels of “endowments” (net assets). They find that increased oversight does
have an effect on donations and retention levels. Although they do not explicitly tie their results
to the nonprofit behavioral theories of Tuckman and Chang (1992), the results are suggestive that
public oversight of NPOs may help alleviate the possible hoarding behavior by nonprofits as
outlined in the fifth behavioral theory above.
Given that NPOs may not have access to all their retained net assets, the link to total net
assets in existing theories is problematic: “net assets” is viewed as a choice variable of the
nonprofit decision maker (that is, the manager can choose to use or retain a particular resource);
yet, donors have the ability to remove this choice as a requirement of giving to the NPO. Hence,
“net assets” is not what nonprofit managers are choosing to retain; rather, the manager is
choosing to retain “unrestricted net assets” or not. In other words, “unrestricted net assets” ought
to be the choice variable, not “total net assets.” Except for theory 5 above, the implicit
assumption of the outlined nonprofit behavioral theory and the exiting literature is that the
nonprofit manager is able to utilize all retained net assets for a specific purpose (that is, a rainy
day fund, for investment, etc.). Net assets restricted by donors, however, may not be utilized as
the nonprofit manager desires.
Since donors can restrict certain net assets, the extant literature has not empirically
11
examined whether nonprofits themselves choose to accumulate unrestricted net assets. Nor has
the existing literature empirically analyzed whether the theories of how and why NPOs retain
unrestricted assets are valid. Tuckman and Chang (1992) provide empirical support that a goal of
NPOs is to increase total net assets, but not necessarily unrestricted net assets. Data limitations
limit their analysis to a single year of data, making conclusions about net asset accumulations
over time difficult to ascertain: the data is unable to shed light on how NPOs might change net
asset balances over time. Further, Fisman and Hubbard (2005) provide empirical support for the
role of government in overcoming potential agency problems within NPOs in regards to total net
assets, but do not explore the determinants of nonprofit net assets (total or unrestricted).
The analysis presented here fills these gaps in the literature by examining whether NPOs
actually do seek to accumulate unrestricted net assets, examining reasons why NPOs would
derive satisfaction from these retained resources rather than maximizing programmatic output
annually (implying no unrestricted net assets retained), as well as examining how unrestricted net
assets might grow or be acquired over time.
3.2 Hypotheses Development
The following testable hypotheses emerge from the existing literature when applied
specifically to nonprofit retention of unrestricted net assets:
1) NPOs seek to accumulate unrestricted net assets over time;
2) NPOs increase unrestricted net assets as the need to subsidize clients increases, thereby
increasing the likelihood that these (and future) clients will receive services;
3) NPOs decrease unrestricted net assets as long-term borrowing increases, since long-term
debt reduces the need for an internal financing source;
4) NPOs increase unrestricted net assets to hedge against fiscal shocks as financial risk
12
increases;
5) NPOs increase unrestricted net assets as investment returns increase, since there are no
client or donor demands on this revenue.
4. Explanatory Model of Unrestricted Net Asset Accumulation
The strategy devised to test the preceding hypotheses is described fully in this section.
The variables used in the analysis are first defined, followed by the statistical specification.
4.2 The Variables and the Expected Relationships
The dependent variable in this analysis is the unrestricted net assets balance of nonprofit i
at the end of year t, or UNAit. To account for size differences between organizations, UNAit is
transformed by taking the natural logarithm of the variable.6
To evaluate whether unrestricted net assets increase as the need to subsidize clients
increases (Hypothesis 2), the variable SUBSIDIZEit is included. Since data are not available on
direct subsidies to particular clients served by particular nonprofits, a proxy is developed.
SUBSIDIZEit is defined as the ratio of revenues earned by providing goods and services (that is,
program service revenues plus membership and dues revenue) to total program expenses. The
variable captures the degree to which a nonprofit can cover program expenses for output with
program revenue directly tied to this output. A higher ratio implies that a NPO’s programmatic
output (measured using expenses) generates the revenues associated with incurring these
expenses – for example, patient expenses at a hospital being offset by patient revenues earned by
providing the output. A lower ratio implies the opposite, that a NPO may need to seek other
revenue (such as donations, investment income, government grants, etc.) to subsidize
programmatic output.
13
To test the hypothesis that unrestricted net assets decrease as long-term borrowing
increases (Hypothesis 3), a debt ratio variable is included. The variable LEVERAGEit is defined
as the ratio between ending-year balances in total long-term liabilities (tax-exempt debt,
mortgages, and other notes payable) and total assets.
To test whether nonprofits increase unrestricted net assets to hedge against potential
fiscal shocks (Hypothesis 4), a variable is included to measure revenue diversity.7 Chang and
Tuckman (1991), Greenlee and Trussel (2000), Greenlee and Tuckman (2007), and Li, et al
(2009) suggest that revenue diversification is a risk-reducing strategy employed by NPOs.
CONCENTRATIONit is defined using a Herfindahl index of revenue sources, as in Chang and
Tuckman (1991), defined as the sum of (Revenuej/Total Revenues)2. Revenue values less than
zero confound this measure, and so, following Hager (2001), annual losses for a particular
revenue source are set to $0.8 A measure approaching one would indicate extreme revenue
concentration, whereas a measure approaching zero would indicate revenue diversity.9
NPOs may address fiscal shocks by shedding expenses (programmatic, overhead, or
both). Fixed costs cannot be reduced in such instances since the nonprofit is obligated for these
expenses. The variable FIXED_COSTSit is defined as the ratio of fixed costs (occupancy,
interest, and depreciation) to total expenses.
To test the hypothesis that unrestricted net assets increase as investment return increases
(Hypothesis 5), a measure of the nonprofit’s return on investments, ROIit, defined as all
investment income for the year divided by the average annual balance of invested assets, is
included. This hypothesis implies that the NPO is invested in certain assets that are producing
additional income – such as interest, dividends, or rents – allowing the nonprofit to free itself
from market output (Bowman, et al 2007). Since investment income for the year can be negative
14
(such as a realized investment loss), this definition includes negative as well as positive returns.10
An additional control variable, SIZEit, is included, which is defined as the natural
logarithm of total revenues, as in Core et al (2006). Larger organizations might have a different
ability to retain unrestricted net assets as compared to smaller organizations. Further, Krishnan et
al (2006) find that smaller organizations have a higher probability of misreporting program
expense ratios (specifically, they tend to overstate program expenses), to appear more “efficient”
to existing and potential donors. A concern might be that since program expenses is part of the
SUBSIDIZEit variable, the ratio will be understated (since the denominator may be larger than it
ought to be); in this case, the expected negative coefficient might actually represent expense
manipulation by smaller organizations. Since the direction of the bias is known and consistent,
SIZEit is included in part to address this concern.
All variables are winsorized at the 1 percent and 99 percent level to reduce the effect of
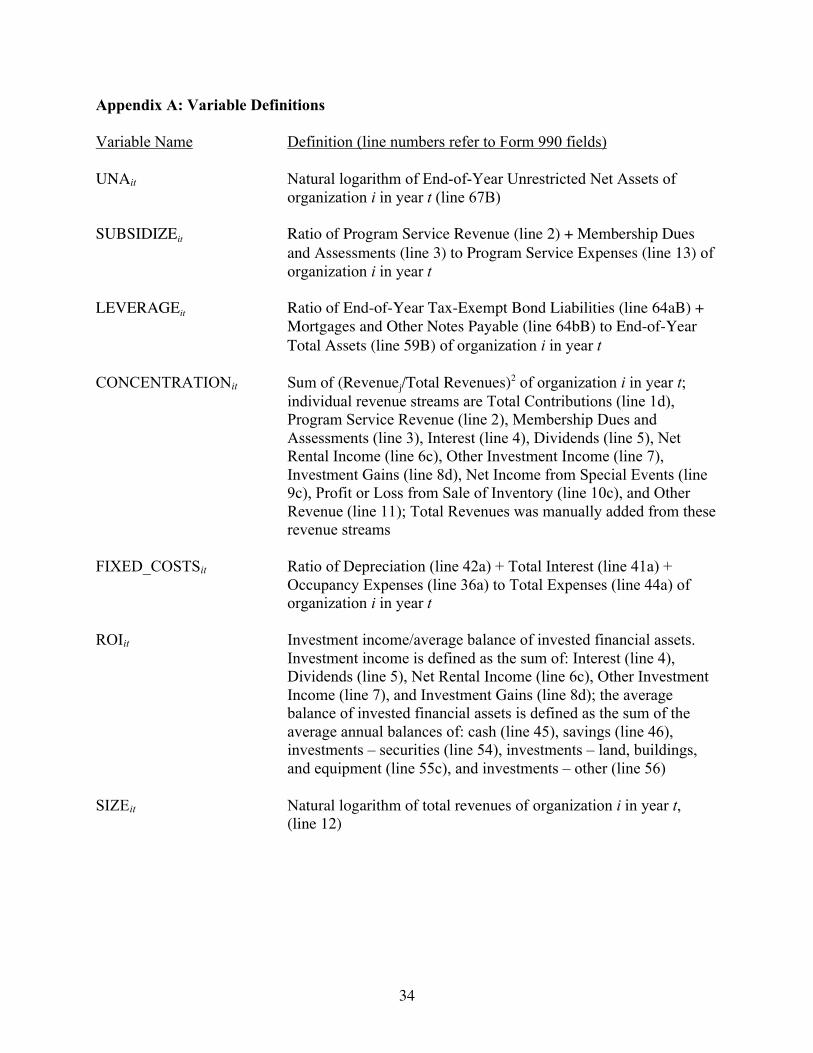
extreme outliers. Appendix A summarizes all variables used in the empirical analysis.
4.3 Specification of the Model
Based on the previous discussion in section 4.2, the following regression model can be
expressed:
UNAit = !1SUBSIDIZEit + !2LEVERAGEit + !3CONCENTRATIONit + !4FIXED_COSTSit +
!5ROIit + !6SIZEit + "i + #t + µit (3)
where "i are organizational fixed effects, #t are year effects, and µit is the error term. Equation 3,
however, does not account for the persistence in the dependent variable. More specifically,
unrestricted net assets are balance sheet measures that are dependent upon prior values. The

15
relationship is clear when expressed as:
UNAit = UNAit-1 + $UNAit (4)
Equation 4 indicates that the current unrestricted net asset balance is equal to the prior year’s
balance plus any annual surplus or deficit (the change in net assets) during the current year.
Unrestricted net assets, then, are highly correlated from one period to the next by definition.
Equation 3 can be expanded, then, to include a lagged dependent variable on the right-hand side
of the equation to address this persistence:
UNAit = !1UNAit-1 + !2SUBSIDIZEit + !3LEVERAGEit + !4CONCENTRATIONit +
!5FIXED_COSTSit + !6ROIit + !7SIZEit + "i + #t + µit (5)
Including the lagged dependent variable addresses a specification issue, but, as Nickell
(1981) demonstrates, it is correlated with the individual NPO fixed effect. Further, Nickell
(1981) shows that this correlation results in sizable estimate bias in panel data structure that is
“small T, large N” (that is few years, but many cross-sections), as the current analysis uses.
An additional issue with the specification is that the model may have issues of
endogeneity with respect to the regressors, potentially biasing the estimated results. The
variables used in this regression may be determined simultaneously with the amount of
unrestricted net assets retained by the NPO. For example, the variable LEVERAGEit may be
endogenous – an organization might decide simultaneously to either assume long-term debt or to
retain unrestricted net assets to finance some asset purchase. All regressors except for the time
effects are therefore treated as endogenous.
I use the general method of moments (GMM) difference estimator proposed by Arellano
16
and Bond (1991) to address these specification issues (that is, potential endogeneity in the
regressors, as well as a correlation between the individual effect and the lagged dependent
variable). This method first differences the equation, which removes the constant and the
organizational fixed effect – as well as any associated omitted variable bias (Baum 2006).
However, this results in correlation between regressors (including the lagged dependent variable)
and the error term. The Arellano-Bond (1991) estimator uses lags of all endogenous variables as
instrumental variables to overcome this correlation. In this case, the lags begin with the second
period (t-2), since the second lag is, by definition, not correlated with the current error term (µit);
all additional available lags are also used. The use of lags as instruments addresses the potential
endogeneity issue of the independent variables since lagged regressors are predetermined (and
not endogenous). The coefficients on the independent variables and the lagged dependent
variable are interpreted in dynamic panel modeling as the rate of adjustment of each variable,
since they are first differenced. In the case of the lagged dependent variable, it captures whether
NPOs do in fact seek to accumulate unrestricted net assets over time (Hypothesis 1).
Finally, due to potential heteroskedasticity in panel data, robust standard errors are
calculated. More specifically, I use Roodman’s (2006) two-step Arellano-Bond estimator with
the Windmeijer finite-sample correction to adjust the reported standard errors.
4.4 Data
The data used in this paper comes from the “The National Center on Charitable Statistics
(NCCS)-GuideStar National Nonprofit Research Database” (hereafter called the “digitized data”)
for fiscal years 1998 through 2003. The digitized data cover all public charities required to file
the Form 990,11 a standardized report that must be submitted by public charities with gross
receipts in excess of $25,000 annually with the IRS. The digitized data contain financial
17
variables on each organization, specifically all revenue, functional expenses, and balance sheet
items. The digitized data is verified by the NCCS, thereby increasing the quality of the reported
data.
The digitized database contains 1,388,480 observations for 338,863 organizations.
Approximately 20 percent of the sample (283,814 observations for 75,583 organizations) filed
the Form 990EZ, which does not contain data on unrestricted net assets, the dependent variable
for estimation. These observations are not included in the final analysis.
The theory developed in section 3 is relevant for nonprofits that are formed to provide
voluntary services for various segments of society for the public’s benefit. Many nonprofits,
however, are formed to provide benefits to their members primarily (that is, private goods). This
includes professional associations, societies, sororities and fraternities, fund-raising
organizations, political parties, religious organizations, social and country clubs, labor unions,
research organizations, block associations, professional sports leagues, among others. Fischer, et
al (2007) hypothesize that the public or private nature of a nonprofit is intrinsically linked to how
it finances itself (and, by extension, how it chooses to retain unrestricted net assets or not);
further, Bowman (2002), in his analysis of capital structure, excludes NPOs with excessive levels
of unrelated business income since these organizations’ finances are more likely similar to for-
profits than other NPOs. Therefore, NPOs that exist for the provision of private goods and
services were eliminated from the sample.12 This eliminated 398,241 observations covering
99,275 organizations.
An additional 165,327 observations for 37,172 organizations were dropped because the
organizations did not report their financial information in accordance with GAAP, requiring
restricted and unrestricted net assets to be segregated. Further, 124,802 observations covering
18
43,073 organizations were eliminated because they report their financial information on the cash
or modified cash basis of accounting, and not on the accrual basis of accounting (as required by
GAAP). Since the measurement of net assets in general is influenced by the accounting basis
used by an organization (see Chapter 2 of Finkler 2005 for an illustration), only those NPOs that
measured their financial information consistent with GAAP were included. The final sample for
analysis is 416,296 observations covering 83,760 organizations.
The dynamic panel modeling estimation requires the use of lags and differencing. Using
second lags (and beyond) as instruments reduces the number of years in the data from six to four
years, and also eliminates organizations with insufficient and missing data for estimation.
Further, the use of the difference GMM estimator reduces an additional year of data. The final
sample, once accounting for the statistical estimation needs, is 174,069 observations covering
56,669 organizations. The reduction in sample size is comparable to Fisman and Hubbard (2002
and 2005), and Core et al (2006). These other studies do not employ dynamic panel models,
which necessarily reduces sample size by definition, nor do these other studies ensure
measurement consistency across organizations by only including GAAP-compliant financial
reporters, as this study does.
5. Results
5.1 Summary Statistics for Whole Sample
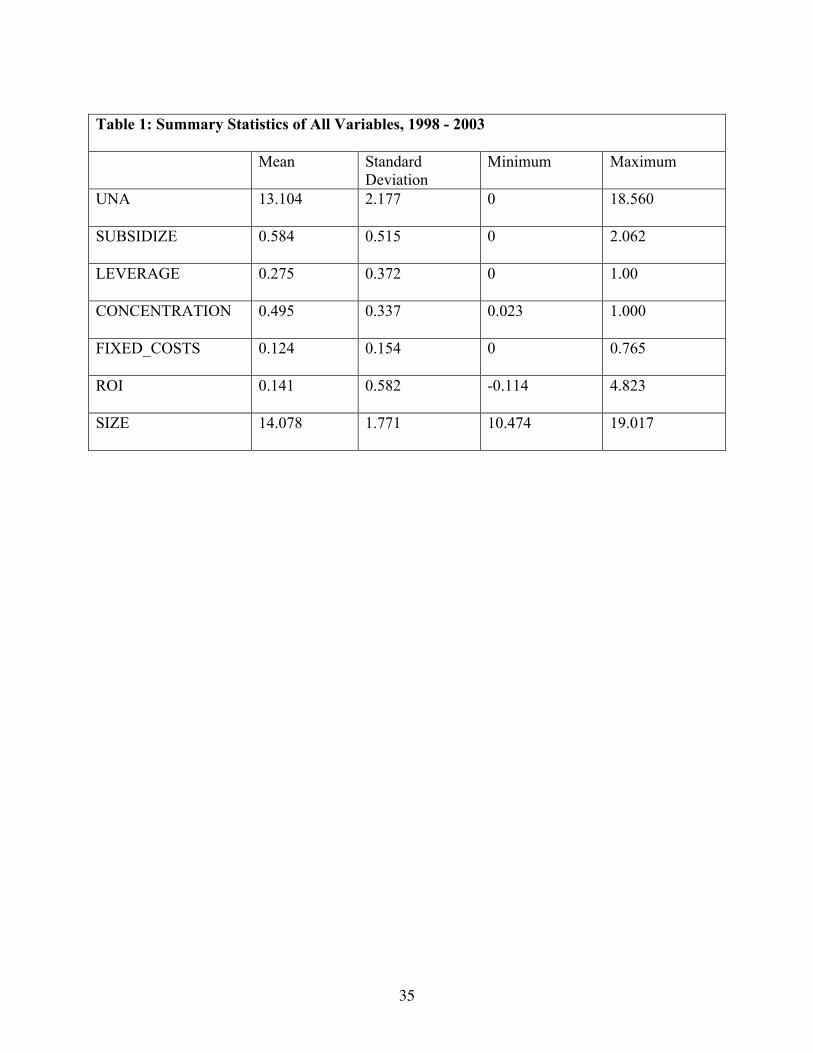
Table 1 shows the descriptive statistics for the variables used in the empirical analysis.
Importantly, the average size of NPOs included in the sample is $1.3 million (the antilog of
$14.08) in total revenues, which is much smaller than the average size of other recent nonprofit
analyses. The average Total Revenue in Fisman and Hubbard (2002) is nearly $35 million, while
the average Total Revenue in Core et al (2006) is over $63 million. This reflects the digitized
19
database’s inclusion of all Form 990 filers rather than large filers only, as in the Statistics of
Income (used in both mentioned studies). To the extent that the nonprofit sector is populated
with small organizations, the sample used in the current analysis may be more representative of
the sector as a whole than prior studies that use the Statistics of Income database.
<Insert Table 1 about here>
Further, the average balance of unrestricted net assets retained by NPOs is slightly under
$500,000 (the antilog of $13.10). While elected officials and public concern have focused on
large accumulations of “endowments” by certain institutions (especially colleges and
universities), the average NPO chooses to retain a relatively low level of unrestricted net assets.
On average, nonprofits in the sample are able to pay for almost 60 percent of their
program spending (a proxy for output) with self-generated revenues. The level of subsidy needed
to maintain such output seems significant. The importance of donations, government contracts,
foundation support, and investment earnings for the maintenance of program output is clear,
since such revenues pay for nearly 40 percent of the programmatic spending for organizations
within the sample.
The average leverage ratio implies that nonprofits within the sample have financed nearly
28 percent of total assets using long-term debt. This is consistent with leverage variables found
in other studies (such as Yetman 2007).
Average revenue concentration of 0.5 is middling. This is nearly identical to revenue
concentration measures in Chang and Tuckman (1996) and Li et al (2009).
Only about 12 percent of costs, on average, are fixed, indicating a relatively high degree
of flexibility with respect to changing costs in the face of revenue shocks. This may indicate that
the sector is more labor intensive than capital intensive (as noted by Weisbrod 1988), since

20
capital intensity would likely result in higher levels of fixed costs (from depreciation, interest
costs from financing, etc.).
The return on investment variable is relatively high at 14 percent. This is likely due to
the strong returns from financial investments during a portion of the data’s time period (1998-
2003), as well as strong returns to property investments during the sample period. The time
period also experienced a decline in the financial markets, as evidenced by the wide range and
standard deviation of the variable. The return variable also reflects gains from property sales
during the time period.
5.2 Summary Statistics for Specific Subsectors
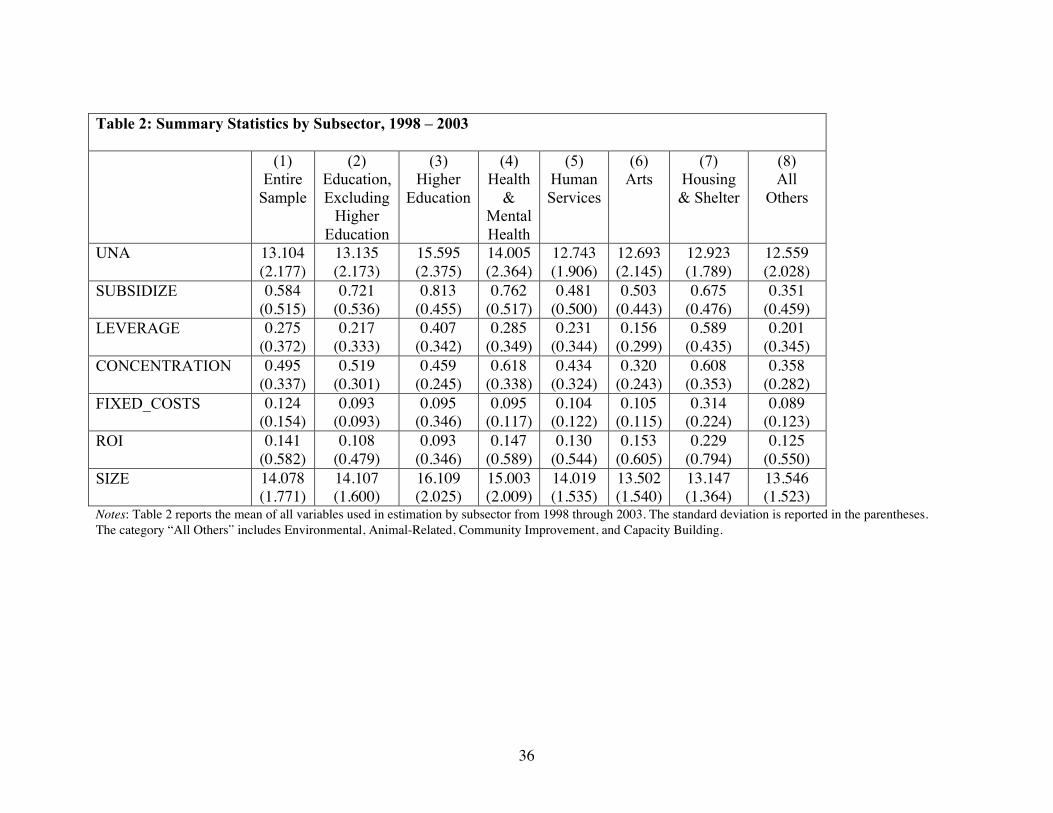
Prior authors (such as Tuckman and Chang 1992, Okten and Weisbrod 2000, Marudas
2004, and Fischer et al 2007, among others) have analyzed individual nonprofit subsectors, due
to significant differences in financial characteristics, missions, revenue diversity, etc. Table 2
presents the summary statistics by several major subsectors: Education (excluding Higher
Education), Higher Education, Health and Mental Health, Human Services, and Arts. Nonprofits
in other subsectors are reported under “All Others.” Colleges and universities (Higher Education)
are broken out from Education since they have largely been the cause of much public concern
about net asset accumulation.
<Insert Table 2 about here>
Colleges and universities report the highest levels of unrestricted net assets, while the All
Others category the lowest levels. Not surprisingly, Health and Education organizations have the
highest levels of self-generated revenues with respect to program expenses (SUBSIDIZE), while
Human Services organizations have the lowest level. Again, this shows the importance of
donations and investment revenue for providing such outputs in the Human Services subsector. It
21
is also interesting that Higher Education has the highest rate of self-generated revenues to
program spending given the extent of public investment in the subsector. For example, Waldeck
(2008) estimates that the foregone federal tax revenue from exempting endowment income just
in higher education institutions alone is approximately $18 billion in 2007.
The Health and Mental Health subsector has the highest level of revenue concentration,
likely from its dependence on program revenues (derived primarily from patient service
revenues). The Housing and Shelter subsector also has a higher than average revenue
concentration, with revenues also largely dependent on program revenues. The arts subsector has
the highest level of revenue diversity, similar to Yi et al (2009).
The Housing and Shelter subsector has the highest level of fixed costs. This is
unsurprising given its high level of leverage, relative to the rest of the sample. This subsector is
more invested in property, and has financed its asset acquisitions through debt. Both financial
aspects result in fixed costs far in excess of other susbectors.
Finally, the return on investment variable is surprisingly lowest for colleges and
universities (although it is still a healthy 9.3 percent on average). Despite the focus on higher
education as a policy concern, this indicates the importance of investment income for the entire
nonprofit sector, not just for large wealthy schools. Housing and Shelter organizations report the
highest return on investment, at nearly 23 percent; this high average return likely reflects gains
from property sales during the time period.
5.3 Estimation Results
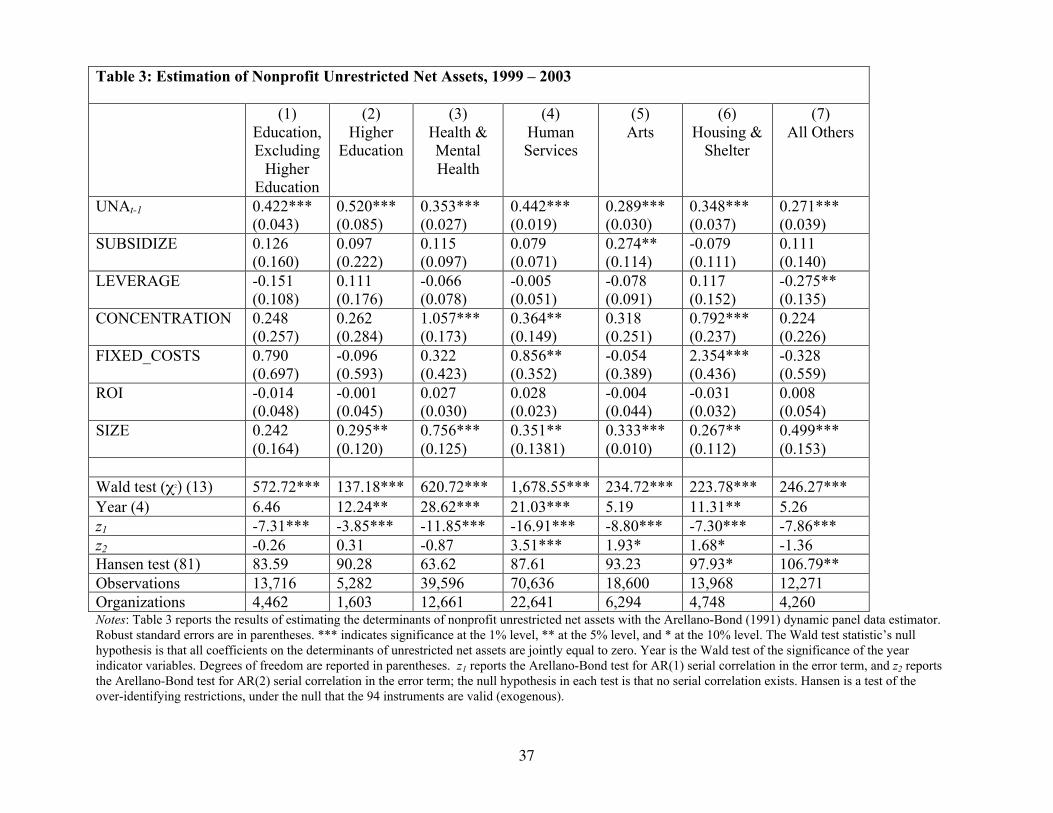
The results of the estimation for individual subsectors based on the strategy outlined in
section 3 appear in Table 3. The results include two Wald tests: one that tests the joint
22
significance of the reported coefficients, and the other is a test of the joint significance of the
time dummies. To check for potential misspecification of the estimated model, the z1 and z2
statistics test for the existence of first and second-order autocorrelation in the error term. First-
order serial correlation is expected in Arellano-Bond estimations (Baum 2006). To test for
correlation between the instruments (that is, the lagged endogenous variables) and the error term
in the first-differenced equation, the Hansen J statistic is reported.13
<Insert Table 3 about here>
Columns 1 through 7 report the results for nonprofit subsectors. In all cases except for the
Human Services subsector, the results indicate that second-order serial correlation is not biasing
the reported errors. Further, the Hansen test indicates that the instruments are valid for the
subsectors reported, except for the All Others subsector. The results for Human Services and All
Others subsectors should be interpreted with caution due to these concerns. The overall results
suggest that, as found by prior research, different subsectors tend to financially behave
differently. Given the breadth of the nonprofit sector, it is unsurprising that different types of
nonprofits finance their operations, retain resources, spend resources, etc. differently. This
finding is no more surprising than discovering that banks and manufacturing firms – operating in
different for-profit subsectors – finance themselves and behave differently.
The results in Table 3 indicate that NPOs in general do in fact seek net asset
accumulation over time (Hypothesis 1), evidenced by the positive and significant coefficient on
the lagged UNA variable. The results indicate that NPOs positively adjust their unrestricted net
asset balances over time; in other words, nonprofits add operating surpluses to their existing
unrestricted net asset balances over time. This finding lends longitudinal support to Tuckman and
Chang’s (1992) cross-sectional finding (although their focus was on total net asset
23
accumulation). The coefficient on the lagged UNA variable shows variation across the various
subsectors, indicating that nonprofits with different missions (defined by activities) are able to
retain unrestricted net assets differently.
The results do not lend empirical support to Hypothesis 2, that NPOs increase
unrestricted net assets as client subsidy increases, ceteris paribus. Only Arts organizations show
a significant coefficient on SUBSIDIZE. The positive coefficient, however, indicates that as Art
nonprofits’ program revenues increase as a ratio of program expenses (indicating less need for
subsidies), unrestricted net assets increase. Despite the results being contrary to expectations,
they do support a finding of Tuckman and Chang (1992) that organizations with increased profit
margins on program output (defined using program revenues and program expenses, similar to
the definition in this analysis) report higher total net asset balances. One explanation might be
that organizations that rely on subsidies for operations do not wish to appear too wealthy.
Marudas (2004), for example, finds that increased total net asset levels result in lower donations
for nonprofits; it is likely that these findings can be extended to unrestricted net assets as well.
Another explanation might be that donors provide such subsidies to NPOs through restricted
giving, ensuring client subsidy but removing the organization’s choice in the matter.14 The
overall implication of this finding, however, is that nonprofits requiring comparatively higher
levels of subsidies have less unrestricted net assets to draw upon should these subsidies fail to
materialize.
LEVERAGE is only significant for NPOs in the “All Others” subsector. These results
indicate that as leverage increases, NPOs in general do not offset the increased leverage with
lower unrestricted net assets. In other words, leverage does not appear to induce NPOs to reduce
their retained unrestricted net assets. Perhaps as leverage increases, NPOs maintain unrestricted
24
net assets to avoid potential default on the debt. In the “All Others” susbector (the only
significant subsector), the coefficient indicates that a one percent increase in leverage (from, for
example, 49 to 50 percent) decreases unrestricted net assets approximately 0.28 percent.
Leverage, therefore, does not seem to be a complete substitute for unrestricted net assets even for
these NPOs, since the increase in leverage is not fully offset by an equal amount of unrestricted
net assets.
The coefficients on CONCENTRATION and FIXED_COSTS provide mixed support for
Hypothesis 4, that unrestricted net assets increase as financial risk increases. Health, Human
Services, and Housing NPOs do seem to retain increased levels of unrestricted net assets as
revenue concentration increases. This is a rational response, especially for Health organizations
that may see delays from third-party insurance payers – the bulk of their revenue source - for
various reasons (for example, a Health organization with a high degree of Medicaid patients
could see Medicaid revenue temporarily cease during a State budget negotiation or crisis, as
happened in California during 2007). Recall, Health and Housing organizations within the
sample have a relatively high degree of revenue concentration. Human Services organizations,
meanwhile, have high levels of needed subsidy to maintain output. Disruptions in such subsidies
appear to be hedged partially through the retention of unrestricted net assets. Since Arts
organizations have the highest level of revenue diversity, these NPOs may not view the risk from
revenue concentration with the same level of concern as Health, Human Services, or Housing
nonprofits.
The coefficient on FIXED_COSTS is significant and positive for the Human Services
and Housing subsectors. The coefficient on FIXED_COSTS for the Housing subsector indicates
that a one percent increase in fixed costs (for example, an increase from 15 to 16 percent) is

25
associated with a nearly 2.4 percent increase in unrestricted net assets, ceteris paribus. The
coefficient on FIXED_COSTS may indicate that Housing NPOs are very risk averse since they
over-retain relative to changes in fixed costs; further, both risk variables are positive and
significant for Housing. Similarly, Human Services also report positive and significant results for
both risk variables.
The Education and Higher Education subectors, on the other hand, do not report
significant risk variables at all. A possible explanation for this result is that the Education and
Higher Education subsectors cover a large proportion of their program expenses with program
revenues (such as tuition, user fees, etc.) and these revenues are relatively stable and knowable in
advance; therefore, revenue risk may be relatively low for these subsectors as a whole. Further,
Higher Education NPOs may operate in a countercyclical industry, where a worsening
macroeconomy – which leads to reductions in donor support (and an increase in revenue
concentration) – may be offset by increasing enrollments (and, therefore, increasing program
revenues).
The overall results for Hypothesis 3, then, are mixed. Several large and important
nonprofit subsectors do seem to retain unrestricted net assets as a form of rainy day fund. Yet,
Arts and Education NPOs do not appear to engage in such risk hedging behavior, which may
indicate that these subsectors are on average more risk neutral than other NPOs.
The coefficient on ROI is not significant, indicating that NPOs do not appear to increase
unrestricted net assets as investment returns increase (Hypothesis 5). The ROI results suggest
that investment returns are not retained, but instead may be used for current operating expenses
(programmatic and overhead). As mentioned, since program revenues only cover between 50 and
80 percent of program expenses on average, investment income may be providing nonprofits

26
with at least a portion of their spending needs. This extends the findings of Hughes and
Luksetich (2004) who find that increased investment revenue among Arts NPOS lead primarily
to increased program output (expenses). In fact, this behavior appears across all nonprofit
subsectors.
Finally, the control variable SIZE is significant in all subsectors except Education (minus
Higher Education), indicating that as most NPOs grow, unrestricted net assets increase as well.
The coefficient indicates that a one percent increase in total revenues results in unrestricted net
assets increasing between 0.3 percent (for colleges and universities) and 0.8 percent for Health,
ceteris paribus.
Overall, the results are indicative of three important findings: 1) NPOs in general choose
to increase unrestricted net assets over time; 2) NPOs within specific subsectors – such as
Health, Human Services, and Housing – do seem to increase unrestricted net assets as financial
risk increases; and 3) in general, NPOs increase retention of unrestricted net assets as they
increase in size.
6. Discussion and Policy Implications
Public unease with NPO net asset accumulation over the past decade has diminished trust
in the entire sector, even though the data here show average accumulations are quite small. This
erosion of trust, however, is problematic for the sector and needs to be addressed. One important
economic theory that explains the existence of NPOs within certain sectors is the “contract
failure” theory. This theory, as articulated by Arrow (1963) and Hansmann (1980) rests on the
notion that NPOs are more trustworthy economic actors than for-profits. If this theory accurately
describes the economic rationale for NPOs, then nonprofits must inform donors and other
27
stakeholders that unrestricted net assets are a reasonable and necessary financing method to
ensure program continuity across business cycles and during uncertain times. If donors, clients,
or society at large lose confidence in the sector – expecting NPOs to behave no differently than
for-profits - then the rationale for the sector itself is eroded. Failing to address the public’s
concerns may lead to a lack of public confidence in the sector and a questioning of the benefits
received by nonprofits from the public at large. As suggested by Irvin (2007), a loss of
confidence in the sector as a whole could lead to increased public regulation that is not
necessarily appropriate for the entire sector.
Secondly, attempts to urge nonprofits to use their net assets for current spending, as
recent Congressional actions suggest, should take into account the realities of the sector, the
motivations for holding net assets, and the findings presented here. Retaining unrestricted net
assets as a hedge against risk (as the results suggest for some NPOs) is sound business practice
that ought not be discouraged necessarily; hoarding net assets – the focus of Congressional
action – should be the focus. Yet, the results here suggest that such hoarding may not be a
sectorwide issue, despite popular perceptions to the contrary. Recent public scrutiny of wealthy
universities can distract from this reality, that the bulk of the sector does not have large
endowments, does not maintain excessive levels of unrestricted net assets, and appears to be
hedging primarily against potential revenue losses.
The results do suggest that organizational size (when measured by total revenues) is an
important determinant of unrestricted net assets. Recent proposals to induce wealthy nonprofits
to spend their net assets – such as requiring wealthy universities to spend five percent of net
assets annually as foundations are required – perhaps are more appropriately focused. In other
words, policies ought not to dampen net assets sectorwide since net assets can aid nonprofits in
28
continuity of service provision; rather, policies should be progressive and tilted towards inducing
larger and wealthier nonprofits into spending down their net assets.
The results presented here also suggest that the recent economic recession coupled with
impaired credit markets have potentially serious consequences for the nonprofit sector.
Anecdotal accounts have emerged that “certain and safe” government funding has recently been
delayed and even cut, while donations have fallen (Strom 2009). Since some nonprofits do not
appear to hedge against fiscal shocks despite their reliance on subsidies to maintain output, it is
unsurprising that nonprofits are reporting service reductions in a time of increasing need
(Nonprofit Finance Fund 2009). Further, given that small nonprofits have smaller levels of
unrestricted net assets relative to larger organizations, fiscal shocks seem more likely to affect
the financial health of small nonprofits since they are more likely to have inadequate reserves to
absorb any change in the financial environment.
7. Conclusion
Nonprofits in the United States face no regulation regarding net asset accumulation,
unlike in other Western nations (for example, see Fisman and Hubbard 2003 and Feenstra and
van Helden 2003 for illustrations of regulation regarding net asset accumulation in Canada and
the Netherlands, respectively). Public scrutiny of nonprofit net asset accumulation has primarily
questioned whether or not nonprofits retain “too much” relative to current spending. Yet, the
answer to this question is inherently a subjective one, dependent upon whether one believes
nonprofits ought to devote more or less resources to current usage.
The analysis presented here takes a different approach. First, it recognizes that nonprofits
are limited by donor choice in what resources it may or may not retain. The idea that nonprofits

29
retain “too much” ignores that the choice may not be at the behest of the nonprofit. Secondly, it
reviews the motivations for nonprofit unrestricted net asset accumulation. These motivations
have been articulated in prior research, yet no formal empirical test of these motivations has been
undertaken. Further, the estimation strategy used in this analysis overcomes serious statistical
issues, such as endogenous regressors, serial correlation of the error term, and potential omitted
variable bias.
The results presented here are mixed. They do confirm that NPOs do increase
unrestricted net assets over time, as prior research has claimed. And certain subsectors do retain
unrestricted net assets as a hedge against risk, as articulated in Hypothesis 3. Yet several
important and large subsectors, such as Education, Higher Education, and Arts, appear to
increase unrestricted net assets holdings for none of the reasons articulated. Instead, some NPOs
appear to increase unrestricted net assets levels as a function of size only. If unrestricted net
assets – which are public resources - become concentrated within larger (and fewer) elite NPOs,
then the decision as to how these resources will ultimately be used will be based on the NPO’s
interest, not necessarily the public’s best interest.
Further research on nonprofit unrestricted net asset accumulation is still warranted. For
example, future research ought to examine how a NPO’s revenue portfolio influences
unrestricted net asset accumulation. It is plausible that NPOs with significant public revenues
(from government contracts and grants) retain unrestricted net assets differently than NPOs that
rely instead on private donations or self-generated revenues. Additional research should explore
the role of governance on unrestricted net asset accumulation: board attitudes towards
unrestricted net asset accumulation, how board composition affects such retention patterns,
whether increased organizational financial oversight (through finance and audit committees)
30
influence unrestricted net asset accumulations, among others. Such questions have yet to be
explored in any detail in existing literature, and yet seem essential to understanding and
predicting nonprofit unrestricted net asset retention patterns.
References
Arellano, M. and S. Bond, 1991. Some Tests of Specification for Panel Data: Monte CarloEvidence and an Application to Employment Equations. Review of Economics Studies58, 277-297.
Arrow, K., 1963. Uncertainty and the Welfare Economics of Medical Care. The AmericanEconomic Review 53 (5), 941-973.
Baum, C. F., 2006. An Introduction to Modern Econometrics Using Stata. Stata Press, CollegeStation, TX.
Bowman, W. 2002. The Uniqueness of Nonprofit Finance and the Decision to Borrow. NonprofitManagement and Leadership 12 (3), 293-311.
Bowman, W., 2007. Managing Endowment and Other Assets. In Financing Nonprofits: PuttingTheory Into Practice, D. R. Young (Ed.), Rowman-Altamira Publishing, Lenham, MDpp. 271-290.
Bowman, W., E. Keating, and M. Hager, 2007. Investment Income. In Financing Nonprofits:Putting Theory Into Practice, D. R. Young (Ed.), Rowman-Altamira Publishing, Lenham,MD pp. 157-182.
Chang, C. F. and H. P. Tuckman, 1990. Why Do Nonprofit Managers Accumulate Surpluses,and How Much Do They Accumulate? Nonprofit Management and Leadership 1 (2),117-135.
Chang, C. F. and H. P. Tuckman, 1991. A Methodology for Measuring the FinancialVulnerability of Charitable Nonprofit Organizations. Nonprofit and Voluntary SectorQuarterly 20, 445 - 460.
Chang, C. F. and H. P. Tuckman, 1996. The Goods Produced by Nonprofit Organizations. PublicFinance Quarterly 24 (1), 25-43.
Core, J. E., W. R. Guay, and R. S. Verdi, 2006. Agency Problems of Excess EndowmentHoldings in Not-For-Profit Firms. Journal of Accounting and Economics 41, 307-333.
31
Denison, D. V. and A. Beard, 2003. Financial Vulnerability of Charitable Organizations: Lessonsfrom Research. Journal for Nonprofit Management 23-31.
DeVita, C. J., 1999. Nonprofits and Devolution: What Do We Know? In Nonprofits andGovernment: Collaboration and Conflict, E. T. Boris and C. E. Steuerle (Eds.), TheUrban Institute Press, Washington, DC pp. 213 -233.
Feenstra, D. W. and G. J. van Helden, 2003. Policy Making on Reserves of Dutch UniversityHospitals: A Case Study. Financial Accountability and Management19 (1), 1-20.
Financial Accounting Standards Board (FASB), 1993. Financial Statements of Not-for-ProfitOrganizations. Statement of Financial Accounting Standards no. 117. FinancialAccounting Standards Board, Stanford, CT.
Finkler, S., 2005. Financial Management for Public, Health, and Not-for-Profit Organizations,2nd Edition. Pearson Prentice Hall, Upper Saddle River, NJ.
Fischer, R. L., A. L. Wilsker, and D. R. Young, 2007. Exploring the Revenue Mix of NonprofitOrganizations – Does It Relate to Publicness? Andrew Young School of Policy Studies,working paper 07-32.
Fisman, R. and R. G. Hubbard, 2002. Endowments, Governance, and the Nonprofit Form.Columbia University, working paper.
Fisman, R. and R. G. Hubbard, 2003. The Role of Nonprofit Endowments. In The Governance ofNot-for-Profit Organizations, E. Glaeser (Ed.), University of Chicago, Chicago, IL pp.217-232.
Fisman, R. and R. G. Hubbard, 2005. Precautionary Savings and the Governance of NonprofitOrganizations. Journal of Public Economics 89, 2231-2243.
Froelich, K. A. and T. W. Knoepfle, 1996. Internal Revenue Service 990 Data: Fact of Fiction?Nonprofit and Voluntary Sector Quarterly 25 (1), 40-52.
Froelich, K. A., T. W. Knoepfle, and T. H. Pollak, 2000. Financial Measures in NonprofitOrganization Research: Comparing IRS 990 Return and Audited Financial StatementData. Nonprofit and Voluntary Sector Quarterly 29 (2), 232 -254.
Greenlee, J. S. and J. M. Trussel, 2000. Predicting the Financial Vulnerability of CharitableOrganizations. Nonprofit Management & Leadership 11 (2), 199-210.
Greenlee, J. S. and H. Tuckman, 2007. Financial Health. In Financing Nonprofits: PuttingTheory Into Practice, D. R. Young (Ed.), Rowman-Altamira Publishing, Lenham, MDpp. 315-336.
32
Hager, M. A., 2001. Financial Vulnerability among Arts Organizations: A Test of the Tuckman-Chang Measures. Nonprofit and Voluntary Sector Quarterly 30 (2), 376-392.
Hansmann, H., 1980. The Role of Nonprofit Enterprise. The Yale Law Journal 89 (5), 835-901.
Hansmann, H., 1990. Why Do Universities Have Endowments? Journal of Legal Studies 19, 3-42.
Hughes, P. and W. Luksetich, 2004. Nonprofit Arts Organizations: Do Funding SourcesInfluence Spending Patterns? Nonprofit and Voluntary Sector Quarterly 33 (2), 203-220.
Irvin, R. A., 2007. Endowments: Stable Largesse or Distortion of the Polity? PublicAdministration Review 67 (3), 445-457.
Krishnan, R., M. H. Yetman, and R. J. Yetman, 2006. Expense Misreporting in NonprofitOrganizations. The Accounting Review 81 (2), 399-420.
Lampkin, L. M. and E. T. Boris, 2002. Nonprofit Organization Data. American BehavioralScientist 45 (11), 1675-1715.
Light, P. C., 2008. How Americans View Charities: A Report on Charitable Confidence, 2008.Governance Studies at the Brookings Institution.
Marudas, N. P., 2004. Effects of Nonprofit Organization Wealth and Efficiency on PrivateDonations to Large Nonprofit Organizations. Research in Governmental and NonprofitAccounting 11, 71-91.
Nickell, S., 1981. Biases in Dynamic Models with Fixed Effects. Econometrica 49 (6), 1417-1426.
Nonprofit Finance Fund, 2009. Nonprofit Finance Fund Survey: America’s Nonprofits inDanger. Available at http://www.nonprofitfinancefund.org/content.php?autoID=166.
Okten, C. and B. A. Weisbrod, 2000. Determinants of Donations in Private Nonprofit Markets.Journal of Public Economics 75 (2), 255-272.
Roodman, D., 2006. How to Do xtabond2: An Introduction to Difference and System GMM inStata. Washington, DC: Center for Global Development working paper No. 103.
Strom, S. March 4, 2009. Charities Say Government Is Ignoring Them in Crisis, The New YorkTimes.
Tuckman, H. P., 1993. How and Why Nonprofit Organizations Obtain Capital. In NonprofitOrganizations in a Market Economy, D. C. Hammack and D. R. Young (Eds.), Jossey-Bass Publishers, San Francisco, CA pp 203-252.
33
Tuckman, H. P. and C. F. Chang, 1992. Nonprofit Equity: A Behavioral Model and Its PolicyImplications. Journal of Policy Analysis and Management 11 (1), 76 - 87.
Waldeck, S. E., 2008. The Coming Showdown Over University Endowments: Enlisting theDonors. Available at: http://works.bepress.com/sarah_waldeck/1.
Weisbrod, B. A., 1988. The Nonprofit Economy. Harvard University Press, Cambridge, MA.
Yan, W., D. V. Denison, and J.S. Butler, 2009. Revenue Structure and Nonprofit Borrowing.Public Finance Review 37 (1), 47-67.
Yetman, R. J., 2007. Borrowing and Debt. In Financing Nonprofits: Putting Theory Into Practice,D. R. Young (Ed.), Rowman-Altamira Publishing, Lenham, MD pp. 315-336.
34
Appendix A: Variable Definitions
Variable Name Definition (line numbers refer to Form 990 fields)
UNAit Natural logarithm of End-of-Year Unrestricted Net Assets oforganization i in year t (line 67B)
SUBSIDIZEit Ratio of Program Service Revenue (line 2) + Membership Duesand Assessments (line 3) to Program Service Expenses (line 13) oforganization i in year t
LEVERAGEit Ratio of End-of-Year Tax-Exempt Bond Liabilities (line 64aB) +Mortgages and Other Notes Payable (line 64bB) to End-of-YearTotal Assets (line 59B) of organization i in year t
CONCENTRATIONit Sum of (Revenuej/Total Revenues)2 of organization i in year t;individual revenue streams are Total Contributions (line 1d),Program Service Revenue (line 2), Membership Dues andAssessments (line 3), Interest (line 4), Dividends (line 5), NetRental Income (line 6c), Other Investment Income (line 7),Investment Gains (line 8d), Net Income from Special Events (line9c), Profit or Loss from Sale of Inventory (line 10c), and OtherRevenue (line 11); Total Revenues was manually added from theserevenue streams
FIXED_COSTSit Ratio of Depreciation (line 42a) + Total Interest (line 41a) +Occupancy Expenses (line 36a) to Total Expenses (line 44a) oforganization i in year t
ROIit Investment income/average balance of invested financial assets.Investment income is defined as the sum of: Interest (line 4),Dividends (line 5), Net Rental Income (line 6c), Other InvestmentIncome (line 7), and Investment Gains (line 8d); the averagebalance of invested financial assets is defined as the sum of theaverage annual balances of: cash (line 45), savings (line 46),investments – securities (line 54), investments – land, buildings,and equipment (line 55c), and investments – other (line 56)
SIZEit Natural logarithm of total revenues of organization i in year t,(line 12)
35
Table 1: Summary Statistics of All Variables, 1998 - 2003
Mean StandardDeviation
Minimum Maximum
UNA 13.104 2.177 0 18.560
SUBSIDIZE 0.584 0.515 0 2.062
LEVERAGE 0.275 0.372 0 1.00
CONCENTRATION 0.495 0.337 0.023 1.000
FIXED_COSTS 0.124 0.154 0 0.765
ROI 0.141 0.582 -0.114 4.823
SIZE 14.078 1.771 10.474 19.017
36
Table 2: Summary Statistics by Subsector, 1998 – 2003
(1)Entire
Sample
(2)Education,Excluding
HigherEducation
(3)Higher
Education
(4)Health
&MentalHealth
(5)HumanServices
(6)Arts
(7)Housing& Shelter
(8)All
Others
UNA 13.104(2.177)
13.135(2.173)
15.595(2.375)
14.005(2.364)
12.743(1.906)
12.693(2.145)
12.923(1.789)
12.559(2.028)
SUBSIDIZE 0.584(0.515)
0.721(0.536)
0.813(0.455)
0.762(0.517)
0.481(0.500)
0.503(0.443)
0.675(0.476)
0.351(0.459)
LEVERAGE 0.275(0.372)
0.217(0.333)
0.407(0.342)
0.285(0.349)
0.231(0.344)
0.156(0.299)
0.589(0.435)
0.201(0.345)
CONCENTRATION 0.495(0.337)
0.519(0.301)
0.459(0.245)
0.618(0.338)
0.434(0.324)
0.320(0.243)
0.608(0.353)
0.358(0.282)
FIXED_COSTS 0.124(0.154)
0.093(0.093)
0.095(0.346)
0.095(0.117)
0.104(0.122)
0.105(0.115)
0.314(0.224)
0.089(0.123)
ROI 0.141(0.582)
0.108(0.479)
0.093(0.346)
0.147(0.589)
0.130(0.544)
0.153(0.605)
0.229(0.794)
0.125(0.550)
SIZE 14.078(1.771)
14.107(1.600)
16.109(2.025)
15.003(2.009)
14.019(1.535)
13.502(1.540)
13.147(1.364)
13.546(1.523)
Notes: Table 2 reports the mean of all variables used in estimation by subsector from 1998 through 2003. The standard deviation is reported in the parentheses.The category “All Others” includes Environmental, Animal-Related, Community Improvement, and Capacity Building.
37
Table 3: Estimation of Nonprofit Unrestricted Net Assets, 1999 – 2003
(1)Education,Excluding
HigherEducation
(2)Higher
Education
(3)Health &MentalHealth
(4)HumanServices
(5)Arts
(6)Housing &
Shelter
(7)All Others
UNAt-1 0.422***(0.043)
0.520***(0.085)
0.353***(0.027)
0.442***(0.019)
0.289***(0.030)
0.348***(0.037)
0.271***(0.039)
SUBSIDIZE 0.126(0.160)
0.097(0.222)
0.115(0.097)
0.079(0.071)
0.274**(0.114)
-0.079(0.111)
0.111(0.140)
LEVERAGE -0.151(0.108)
0.111(0.176)
-0.066(0.078)
-0.005(0.051)
-0.078(0.091)
0.117(0.152)
-0.275**(0.135)
CONCENTRATION 0.248(0.257)
0.262(0.284)
1.057***(0.173)
0.364**(0.149)
0.318(0.251)
0.792***(0.237)
0.224(0.226)
FIXED_COSTS 0.790(0.697)
-0.096(0.593)
0.322(0.423)
0.856**(0.352)
-0.054(0.389)
2.354***(0.436)
-0.328(0.559)
ROI -0.014(0.048)
-0.001(0.045)
0.027(0.030)
0.028(0.023)
-0.004(0.044)
-0.031(0.032)
0.008(0.054)
SIZE 0.242(0.164)
0.295**(0.120)
0.756***(0.125)
0.351**(0.1381)
0.333***(0.010)
0.267**(0.112)
0.499***(0.153)
Wald test (!2) (13) 572.72*** 137.18*** 620.72*** 1,678.55*** 234.72*** 223.78*** 246.27***Year (4) 6.46 12.24** 28.62*** 21.03*** 5.19 11.31** 5.26z1 -7.31*** -3.85*** -11.85*** -16.91*** -8.80*** -7.30*** -7.86***z2 -0.26 0.31 -0.87 3.51*** 1.93* 1.68* -1.36Hansen test (81) 83.59 90.28 63.62 87.61 93.23 97.93* 106.79**Observations 13,716 5,282 39,596 70,636 18,600 13,968 12,271Organizations 4,462 1,603 12,661 22,641 6,294 4,748 4,260Notes: Table 3 reports the results of estimating the determinants of nonprofit unrestricted net assets with the Arellano-Bond (1991) dynamic panel data estimator.Robust standard errors are in parentheses. *** indicates significance at the 1% level, ** at the 5% level, and * at the 10% level. The Wald test statistic’s nullhypothesis is that all coefficients on the determinants of unrestricted net assets are jointly equal to zero. Year is the Wald test of the significance of the yearindicator variables. Degrees of freedom are reported in parentheses. z1 reports the Arellano-Bond test for AR(1) serial correlation in the error term, and z2 reportsthe Arellano-Bond test for AR(2) serial correlation in the error term; the null hypothesis in each test is that no serial correlation exists. Hansen is a test of theover-identifying restrictions, under the null that the 94 instruments are valid (exogenous).
38
1 When a nonprofit invests in fixed assets, these are depreciated over time. Therefore, the surplusis transitory since depreciation expenses will reduce any accumulated net assets resulting fromfixed asset investment over time.2 This assumes that the nonprofit reports its financial operations on the accrual basis ofaccounting, as required by Generally Accepted Accounting Principles. If the organization reportson a cash basis of accounting, net assets are synonymous with a cash balance; however, this cashbalance provides no information about outstanding claims (liabilities) or assets of theorganization. Hence, it provides no information about the organization’s net worth as net assetsdo under the accrual basis.3 A Board-designated restriction does not qualify as a donor-imposed restriction. Hence, if anonprofit Board establishes a reserve – a “quasi-endowment” – these net assets would beaccounted for as unrestricted net assets.4 Critics included New York State Attorney General Elliot Spitzer, and television personality BillO’Reilly, among others. See http://archives.cnn.com/2001/US/11/06/rec.charity.hearing/.5 The most obvious examples of such behavior include hospitals that provide charity care to theindigent and educational institutions that provide financial aid or scholarships to needy students.6 Using natural logarithms eliminates nonprofits with negative or $0 of unrestricted net assets.Chang and Tuckman (1991) show that inadequate net asset balances is a characteristic offinancially unstable organizations. This instability often leads to change in their organizationalbehavior and ultimately may result in program elimination or closure (Denison and Beard 2003).Nonprofits with negative or no unrestricted net assets are thus believed to behave differently thannonprofits with positive levels.7 In finance, two forms of risk have been identified – systematic and unsystematic. Systematicrisks are those that affect all organizations, and unsystematic are idiosyncratic to specificorganizations. Systematic effects are captured in year fixed effects in the statistical model.8 From the perspective of revenue concentration, this is a logical step. Suppose an organizationhas $50 in donations and $50 in investment income in year 1, for a revenue concentration indexof 0.5. The next year, donations remain at $50 and investment losses are ($50). Not adjusting theconcentration index would show that the organization had no change in revenue concentration. Inreality, the organization's concentration of revenues increased to 1.0 since it had no investmentrevenue with which to operate. A dummy variable was included in the regressions fororganizations in which specific revenue streams were set to $0, although the variable is notincluded in the reported results.9 Another option for measuring revenue risk might be to include a variance measure, such as thecoefficient of variation of unrestricted revenues. Given the limited years of the data, there is aserious data limitation, however. A two-year coefficient of variation was the only value I couldcalculate and use the statistical techniques outlined in the strategy section. Measuring risk as atwo-year variance is problematic, since such measures usually require additional years toestablish actual trends and not just simple aberrations. However, even including such a variablein the specification does not change the results, and the variable itself is not statisticallysignificant.10 Because of the real possibility of investment income being negative from investment losses,the ROI measure was chosen over a logarithmic transformation of investment income.

39
11 Concerns about the data in the Form 990 have been raised (see Lampkin and Boris 2002 for acataloguing of potential limitations). Despite the limitations, Froelich and Knoepfle (1996) andFroelich, Knoepfle, and Pollack (2000) find that Form 990 data are generally accurate. Further,the Form 990 databases are widely used by academic researchers. Tuckman and Chang (1992)utilize Form 990 data to test their hypotheses regarding nonprofit “equity.” Further, Fisman andHubbard (2002, 2003, and 2005) utilize Form 990 data to test their hypotheses regarding theeffects of oversight on “endowments.”12 The National Taxonomy of Exempt Entities (NTEE) codes that were retained for the samplewere the Arts, Education, Environment/Animals, Health, Mental Health and Crisis Intervention,Crime and Legal Related, Employment, Food/Agriculture/Nutrition, Housing and Shelter, YouthDevelopment, Human Services, and Community Improvement. Within these retainedsubsamples, any organization coded as Alliance & Advocacy, Management &TechnicalAssistance, Professional Societies & Associations, Research Institutes, Single OrganizationSupport, Fund Raising & Fund Distribution, or Support (nteecc codes 01 – 19) were excluded.13 Measures of goodness-of-fit such as the R-squared or Adjusted R-squared statistics are notavailable with the Arellano-Bond estimator.14 For example, a donor might give a university a permanently restricted donation and require theschool to use the earnings for a specific purpose, such as scholarships.