Embed Size (px)
Citation preview
8/6/2019 Which Statistical Method to Use
http://slidepdf.com/reader/full/which-statistical-method-to-use 1/15
Test Number of groups Data type
T-test 2 groups Numerical
ANOVA 3 or more groups Numerical
Binomial Test 2 groups Binary
Chi-square 2 groups Categorical
Which statistical method to use?
8/6/2019 Which Statistical Method to Use
http://slidepdf.com/reader/full/which-statistical-method-to-use 2/15
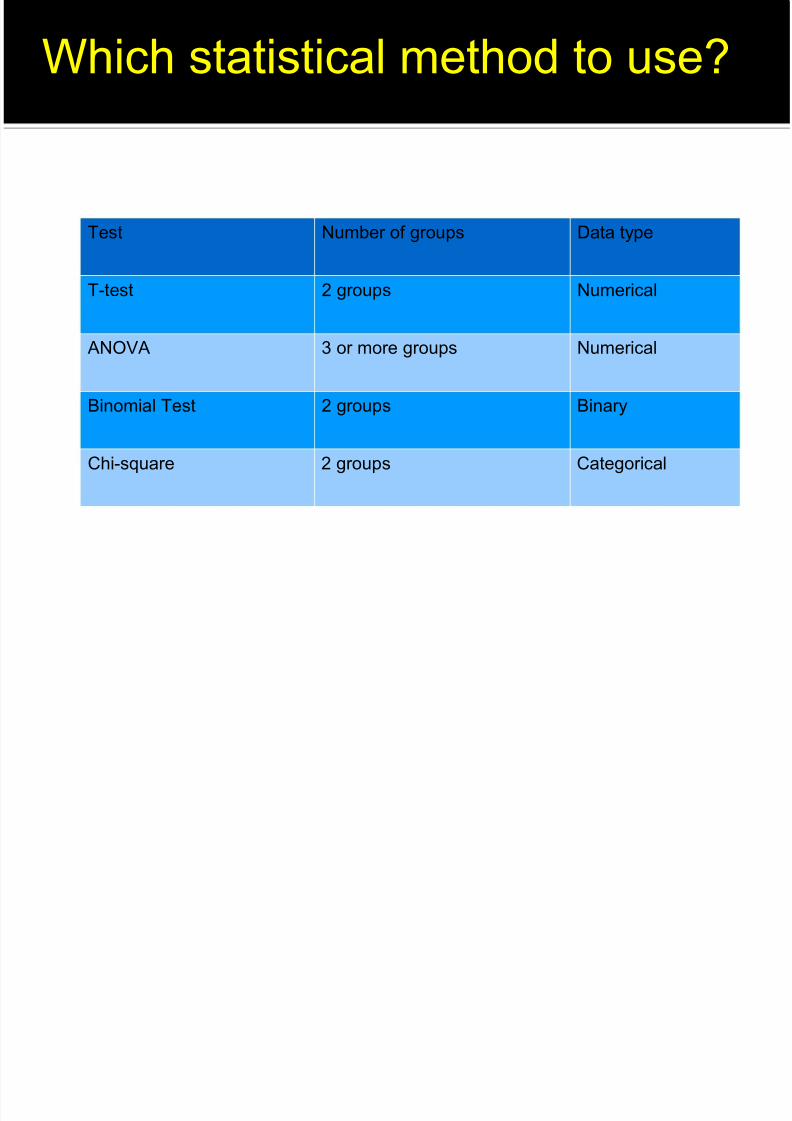
If you have two variables (numerical)You want to compare if the two means of
the two variables is statistical different
For between subjects experimentUse Independent samples t-test
For within subjects experimentUse Paired-samples t-test
T-test
8/6/2019 Which Statistical Method to Use
http://slidepdf.com/reader/full/which-statistical-method-to-use 3/15
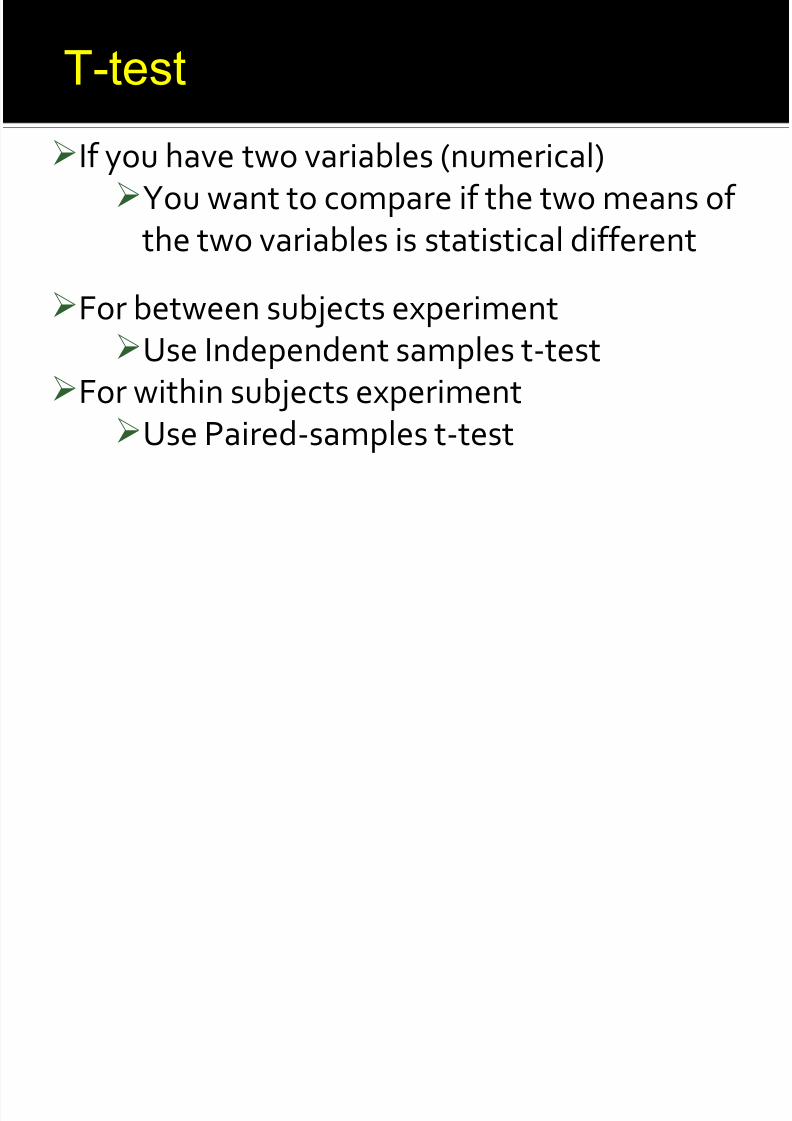
Paired-samples t-test
A paired-samples t-test was conducted to
compare variable 1 in condition 1 and condition 2.There was no significant difference in the score of
variable 1 for condition 1 (M= 52.2, SD=10.25) andcondition 2 (M= 52.8, SD= 9.48); t(199)=-.87 ,p=0.387 .
8/6/2019 Which Statistical Method to Use
http://slidepdf.com/reader/full/which-statistical-method-to-use 4/15
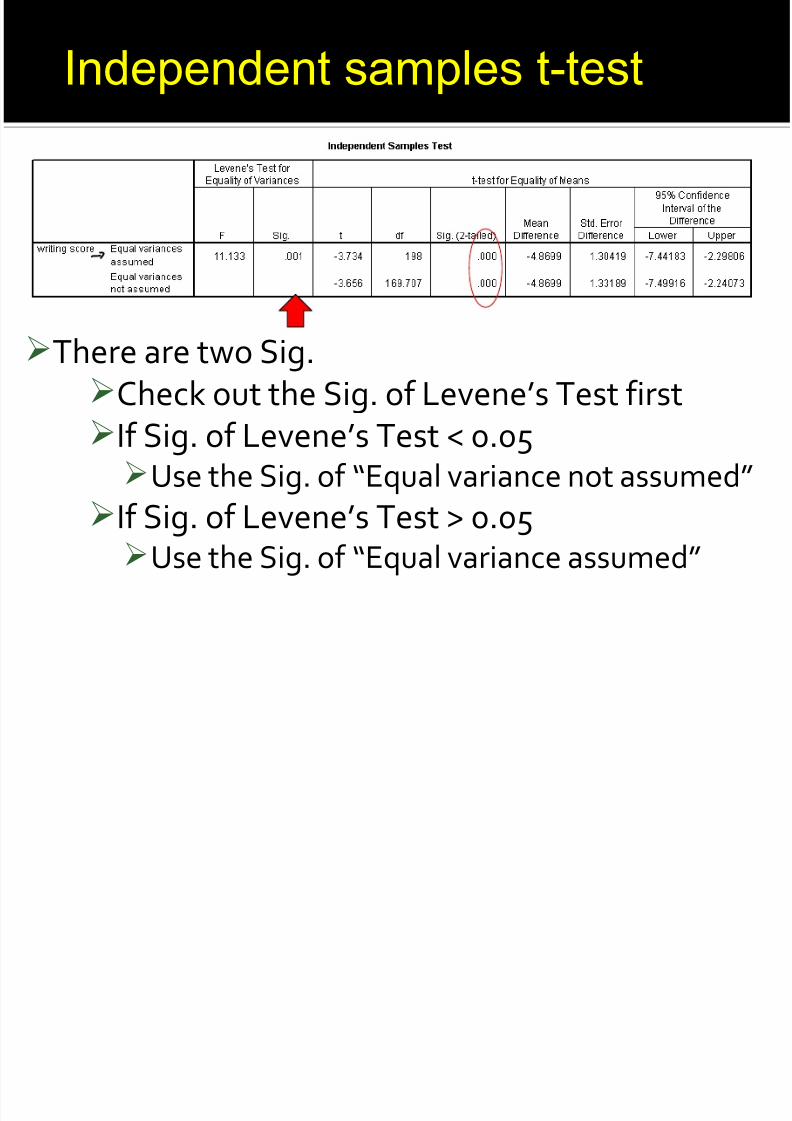
Independent samples t-test
There are two Sig.Check out the Sig. of Levene’s Test firstIf Sig. of Levene’s Test < 0.05Use the Sig. of “Equal variance not assumed”
If Sig. of Levene’s Test > 0.05
Use the Sig. of “Equal variance assumed”
8/6/2019 Which Statistical Method to Use
http://slidepdf.com/reader/full/which-statistical-method-to-use 5/15
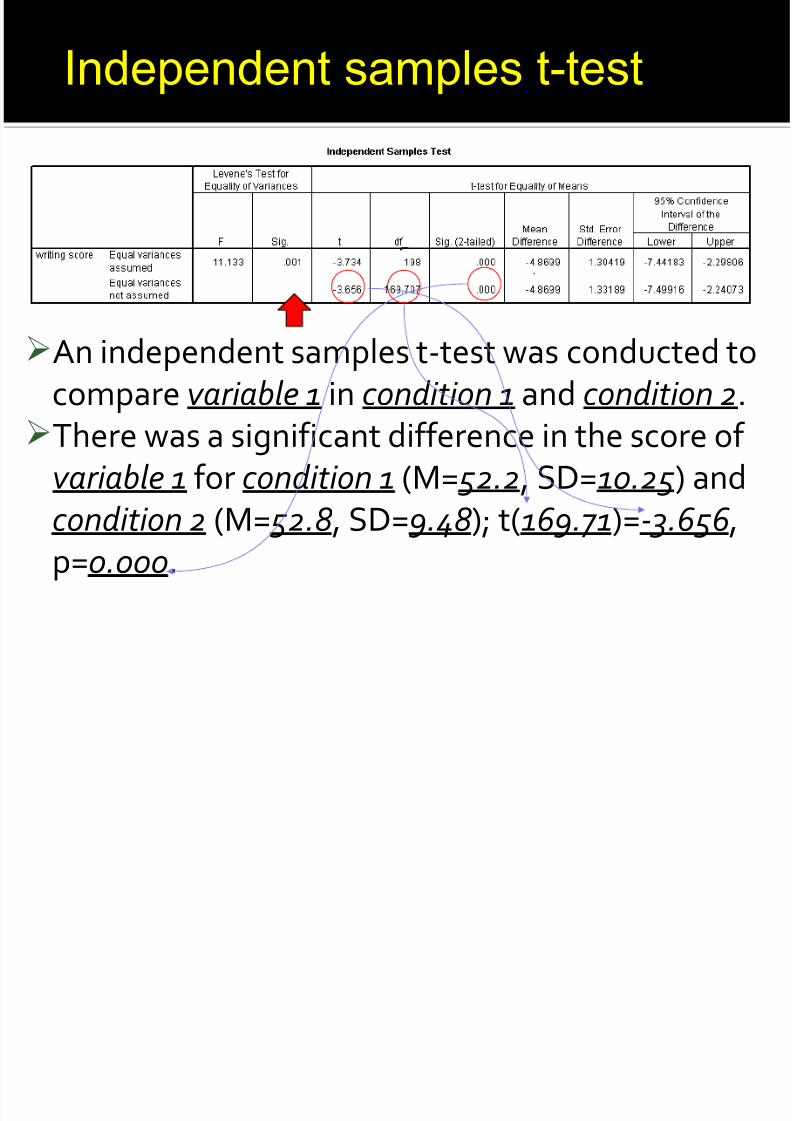
An independent samples t-test was conducted tocompare variable 1 in condition 1 and condition 2.There was a significant difference in the score of
variable 1 for condition 1 (M= 52.2, SD=10.25) andcondition 2 (M= 52.8, SD= 9.48); t(169.71)=-3.656,
p=0.000.
Independent samples t-test

8/6/2019 Which Statistical Method to Use
http://slidepdf.com/reader/full/which-statistical-method-to-use 6/15
If you have more than two variables (numerical)You want to compare if the means of the
variables is statistical different
Use ANOVA!
ANOVA
8/6/2019 Which Statistical Method to Use
http://slidepdf.com/reader/full/which-statistical-method-to-use 7/15
SPSS – Between Subjects ANOVA
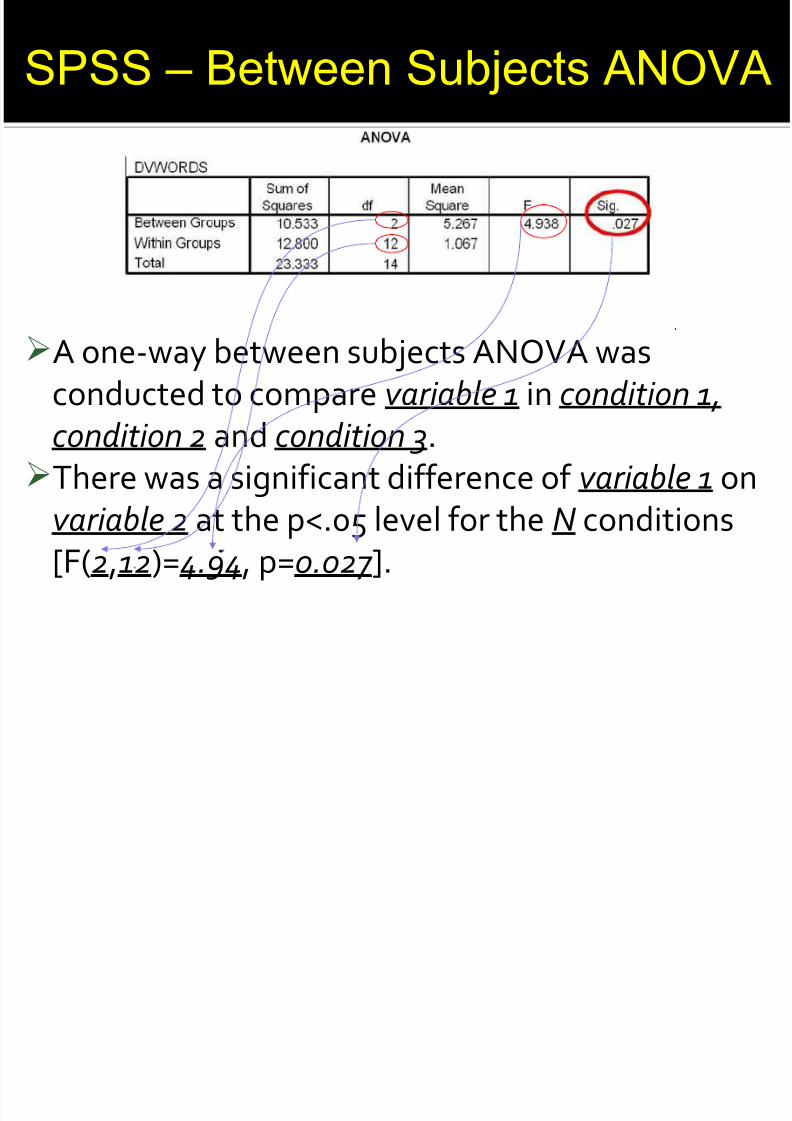
A one-way between subjects ANOVA wasconducted to compare variable 1 in condition 1,
condition 2 and condition 3.There was a significant difference of variable 1 on
variable 2 at the p<.05 level for the N conditions
[F(2,12)=4.94, p=0.027 ].
8/6/2019 Which Statistical Method to Use
http://slidepdf.com/reader/full/which-statistical-method-to-use 8/15
Problem: When Sig. < .05, there exists an effectbetween the some of the conditions, but we donot know specifically between which condition(s)
E.g. If we have 3 conditions, and Sig. <.05Effect between 1&2, no effect between 1&3; 2&3Effect between 1&3, no effect between 1&2; 2&3Effect between 2&3, no effect between 1&2; 1&3Effect between 1&2; 2&3, no effect between 1&3Effect between 1&3; 2&3, no effect between 1&2Effect between 1&2; 2&3, no effect between 1&3
SPSS – Between Subjects ANOVA
8/6/2019 Which Statistical Method to Use
http://slidepdf.com/reader/full/which-statistical-method-to-use 9/15
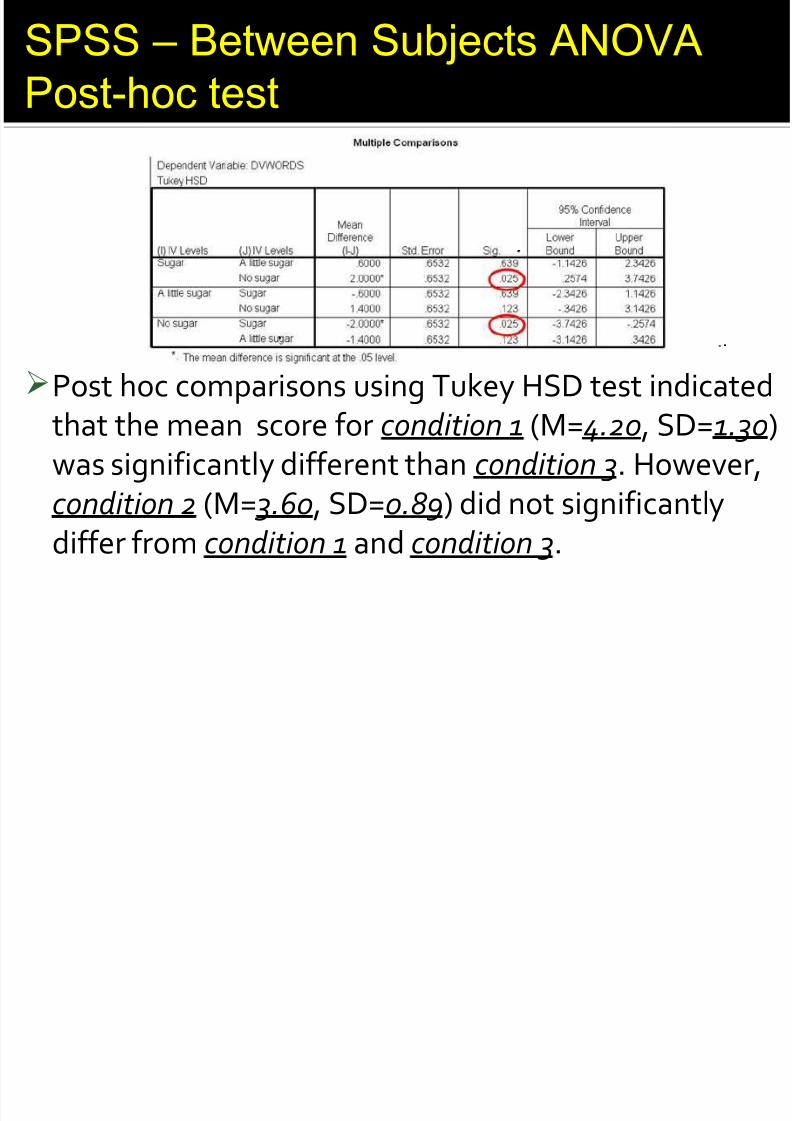
SPSS – Between Subjects ANOVA
Post-hoc test
Post hoc comparisons using Tukey HSD test indicated
that the mean score for condition 1 (M=4.20, SD=1.30)was significantly different than condition 3. However,condition 2 (M= 3.60, SD=0.89) did not significantly
differ from condition 1 and condition 3.
8/6/2019 Which Statistical Method to Use
http://slidepdf.com/reader/full/which-statistical-method-to-use 10/15
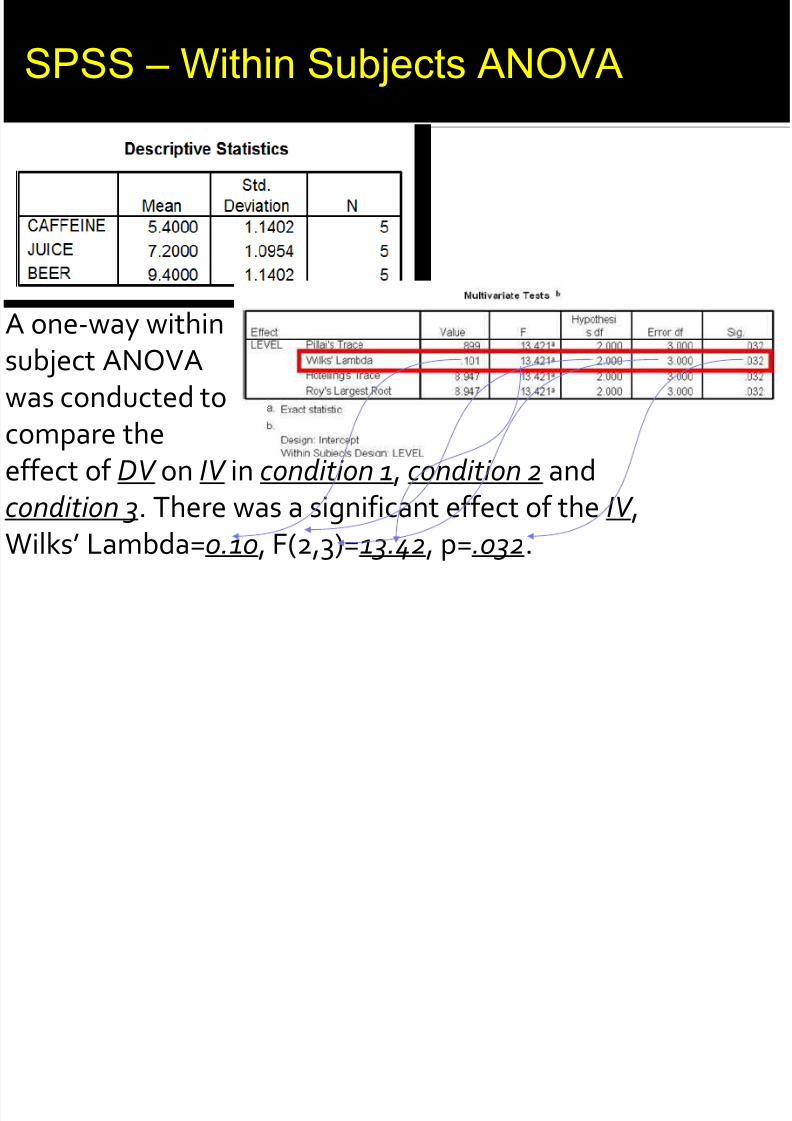
A one-way withinsubject ANOVAwas conducted tocompare theeffect of DV on IV in condition 1, condition 2 andcondition 3. There was a significant effect of the IV ,
Wilks’ Lambda=0.10, F(2,3)=13.42, p=.032.
SPSS – Within Subjects ANOVA
8/6/2019 Which Statistical Method to Use
http://slidepdf.com/reader/full/which-statistical-method-to-use 11/15
Perform post hoc paired-sample t-test for eachpair of conditionsIf you have 3 conditions
• T-test #1 for condition 1&2• T-test #2 for condition 1&3• T-test #3 for condition 2&3
For test of significance,Use Sig. Value of .05 / # of test
• For 3 conditions, .05/3 = .017• For 4 conditions (6 post hoc tests), .05/6 = .008
Follow the aired-sam le t-test rocedure...
SPSS – Post hoc paired-samples t-test
8/6/2019 Which Statistical Method to Use
http://slidepdf.com/reader/full/which-statistical-method-to-use 12/15
For binary variables (Yes, No)E.g. Prospect Theory
• You have 2 identical choice
• You want to show a bias in making choicei.e. people tend to make one choice than the
other, even though the choices are identical•
H0: No bias in choice – 50/50 in the twoconditions
• H1: Bias in choice – not 50/50 in the twoconditions
Binomial Test
8/6/2019 Which Statistical Method to Use
http://slidepdf.com/reader/full/which-statistical-method-to-use 13/15
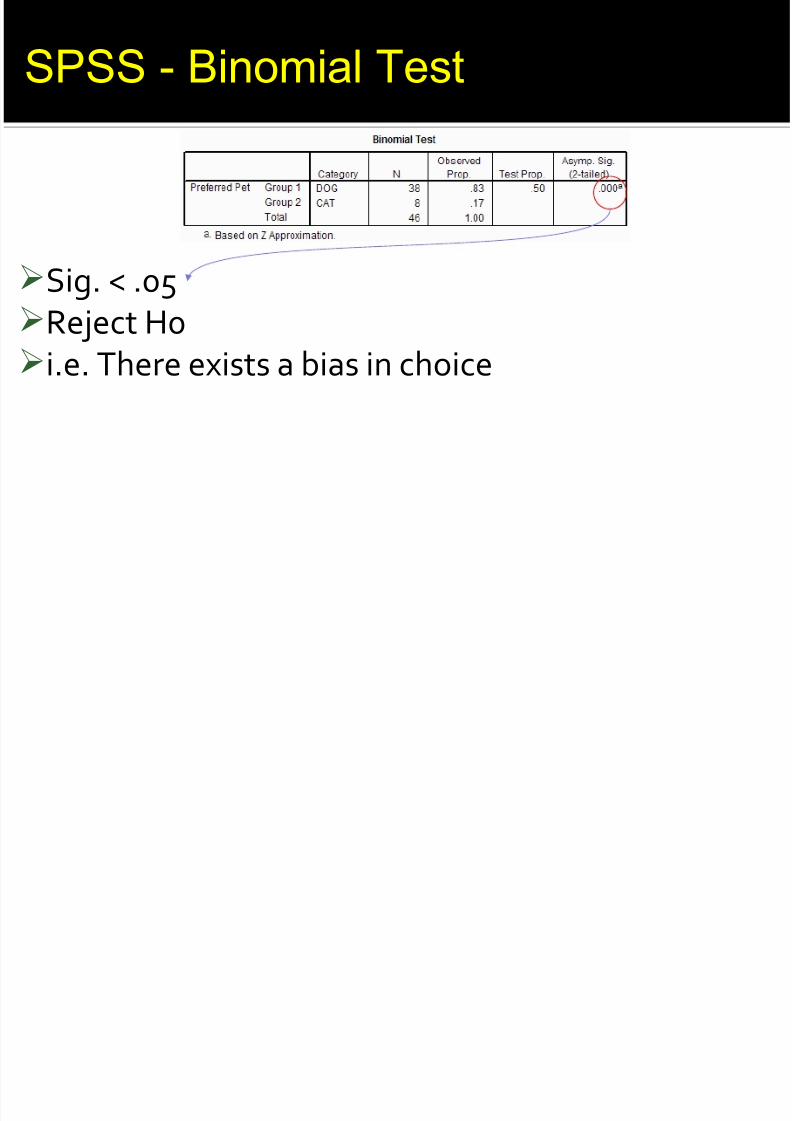
Sig. < .05Reject H0i.e. There exists a bias in choice
SPSS - Binomial Test
8/6/2019 Which Statistical Method to Use
http://slidepdf.com/reader/full/which-statistical-method-to-use 14/15
Two categorical variables [Yes, No] [Male, Female]See if there is a relation between the two variablesUse Chi-Square Test
H0: No relation between the two variablesH1: There exists a relation between the two
variables
Reject H0 is p<.05i.e. there exist a significant effect between the
two variables
Chi-Square Test
8/6/2019 Which Statistical Method to Use
http://slidepdf.com/reader/full/which-statistical-method-to-use 15/15
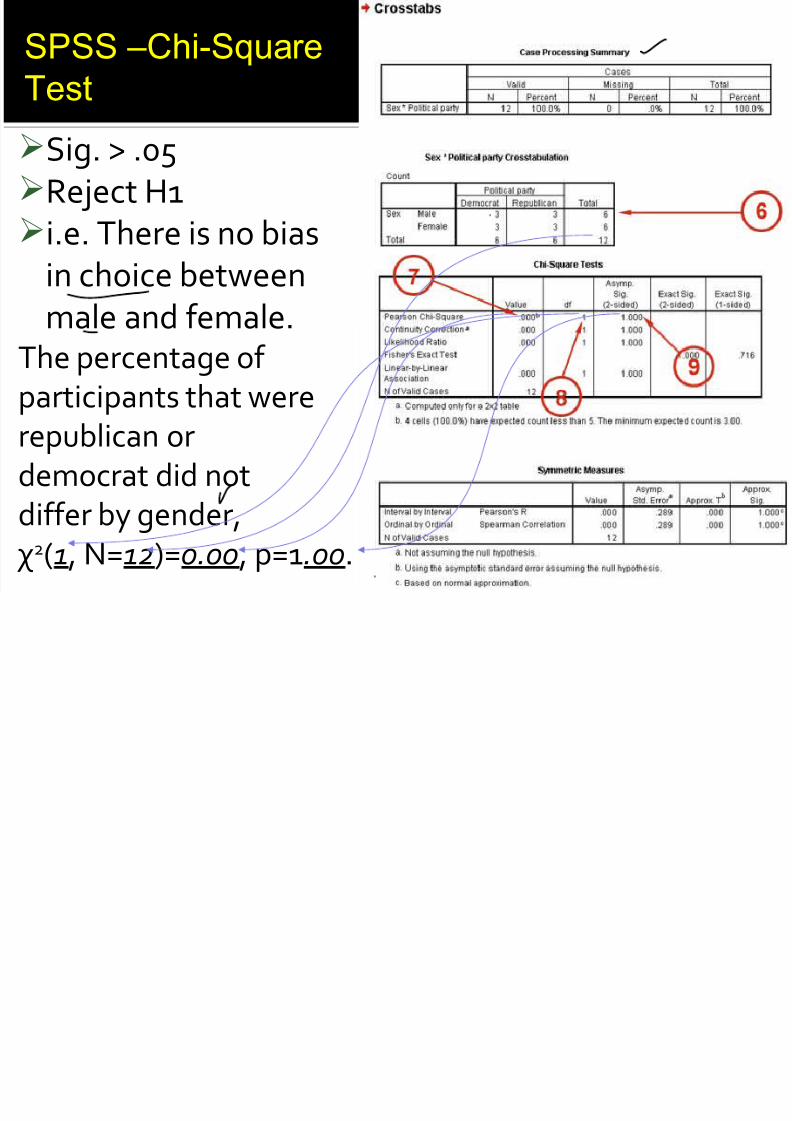
Sig. > .05Reject H1i.e. There is no bias
in choice betweenmale and female.
The percentage of participants that wererepublican ordemocrat did notdiffer by gender,
χ2(1, N=12)=0.00, p=1.00.
SPSS –Chi-Square
Test