Embed Size (px)
Citation preview

Analytical Studies Branch Research Paper Series
Catalogue no. 11F0019M — No. 456 ISSN 1205-9153ISBN 978-0-660-36555-8
by Jiang Li, Benoit Dostie and Gaëlle Simard-Duplain
What Is the Role of Firm-specific Pay Policies on the Gender Earnings Gap in Canada?
Release date: November 16, 2020

How to obtain more informationFor information about this product or the wide range of services and data available from Statistics Canada, visit our website, www.statcan.gc.ca. You can also contact us by Email at [email protected] Telephone, from Monday to Friday, 8:30 a.m. to 4:30 p.m., at the following numbers:
• Statistical Information Service 1-800-263-1136 • National telecommunications device for the hearing impaired 1-800-363-7629 • Fax line 1-514-283-9350
Depository Services Program
• Inquiries line 1-800-635-7943 • Fax line 1-800-565-7757
Note of appreciationCanada owes the success of its statistical system to a long-standing partnership between Statistics Canada, the citizens of Canada, its businesses, governments and other institutions. Accurate and timely statistical information could not be produced without their continued co-operation and goodwill.
Standards of service to the publicStatistics Canada is committed to serving its clients in a prompt, reliable and courteous manner. To this end, Statistics Canada has developed standards of service that its employees observe. To obtain a copy of these service standards, please contact Statistics Canada toll-free at 1-800-263-1136. The service standards are also published on www.statcan.gc.ca under “Contact us” > “Standards of service to the public.”
Published by authority of the Minister responsible for Statistics Canada
© Her Majesty the Queen in Right of Canada as represented by the Minister of Industry, 2020
All rights reserved. Use of this publication is governed by the Statistics Canada Open Licence Agreement.
An HTML version is also available.
Cette publication est aussi disponible en français.

What Is the Role of Firm-specific Pay Policies on the Gender Earnings Gap in Canada?
Jiang Li Economic Analysis Division
Statistics Canada
Benoit Dostie HEC Montréal
Gaëlle Simard-Duplain Centre for Innovative Data in Economics Research (CIDER),
University of British Columbia
11F0019M No. 456
2020019
ISSN 1205-9153
ISBN 978-0-660-36555-8
November 2020
Analytical Studies Branch Research Paper Series
The Analytical Studies Branch Research Paper Series provides for the circulation of research conducted by Analytical Studies Branch staff and collaborators. The Series is intended to stimulate discussion on a variety of topics, such as labour, immigration, education and skills, income mobility, well-being, aging, firm dynamics, productivity, economic transitions, and economic geography. Readers of the Series are encouraged to contact the authors with their comments and suggestions.
All the papers in the Analytical Studies Branch Research Paper Series go through institutional and peer review to ensure that they conform to Statistics Canada's mandate as a governmental statistical agency and adhere to generally accepted standards of good professional practice.
Acknowledgements
We are grateful to Wendy Cukier, Marie Drolet, René Morrissette and Nicole Yaansah for their helpful comments and suggestions. We would also like to thank the reviewers from Women and Gender Equality Canada for their comments. This study was funded by Women and Gender Equality Canada.

Analytical Studies Branch— Research Paper Series - 5 - Statistics Canada—Catalogue no. 11F0019M, no. 456
Table of contents
Abstract ..................................................................................................................................... 6
Executive summary .................................................................................................................. 7
1 Introduction ......................................................................................................................... 8
2 Literature review ............................................................................................................... 10
3 Empirical model ................................................................................................................ 12
3.1 Firm effects normalization and the dual connected set ................................................ 13
3.2 Decomposing the effect of firm-level pay premiums .................................................... 14
4 Data .................................................................................................................................... 15
4.1 Data source ................................................................................................................. 15
4.2 Summary statistics ...................................................................................................... 16
5 Results ............................................................................................................................... 19
5.1 Coefficient estimates: AKM model ............................................................................... 19
5.2 AKM model: analysis of variance ................................................................................ 21
5.3 Normalizing the firm fixed effect: hockey stick regression results ................................ 22
5.4 Decomposition results: contribution of firm premiums, role of sorting and pay setting effects .............................................................................................................. 23
5.5 Life-cycle effects ......................................................................................................... 25
5.6 Interprovincial differences ........................................................................................... 25
5.7 Differences by marital status ....................................................................................... 26
5.8 Children ...................................................................................................................... 27
6 Conclusion ........................................................................................................................ 28
7 Appendix A ........................................................................................................................ 29
7.1 Tables ......................................................................................................................... 29
References .............................................................................................................................. 33

Analytical Studies Branch— Research Paper Series - 6 - Statistics Canada—Catalogue no. 11F0019M, no. 456
Abstract
Using data from the Canadian Employer–Employee Dynamics Database between 2001 and 2015, this study examines the impact of firms’ hiring and pay-setting policies on the gender earnings gap in Canada. Consistent with the existing literature and following Card, Cardoso and Kline (2016), this study finds that firm-specific premiums explain nearly one-quarter of the 27% average earnings gap between female and male workers. On average, firms’ hiring practices, or sorting (i.e., differences in the relative proportion of women hired at high-wage firms), and pay setting (i.e., differences in pay by gender within similar firms) each explain about one-half of this firm effect. The compositional difference between the two channels varies substantially over the lifecycle and by province, and marital and family status. This study is the first to apply the work of Card, Cardoso and Kline (2016) to the study of the gender earnings gap in a Canadian context, and the first to document the importance of marital status in decomposing the role of firms into sorting and pay-setting effects.

Analytical Studies Branch— Research Paper Series - 7 - Statistics Canada—Catalogue no. 11F0019M, no. 456
Executive summary
The wages of Canadian women have caught up substantially to those of their male counterparts, particularly from the 1970s to the early 1990s. However, the convergence in earnings by gender has slowed down since 1998. Researchers have struggled to explain this phenomenon with human capital alone (e.g., education and job tenure). Meanwhile, a growing body of literature following Abowd, Kramarz and Margolis (AKM) (1999) points to the important role firms play in contributing to this gender pay gap even after accounting for workers’ observed and unobserved characteristics.
In this context, this study seeks to determine whether and how firms influence the earnings of women and men differently in Canada. Specifically, the study examines the impact of firms’ hiring and pay-setting policies on the gender earnings gap. Following Card, Cardoso and Kline (2016), this study applies the AKM model to the Canadian context by leveraging data from the Canadian Employer–Employee Dynamics Database between 2001 and 2015. This administrative dataset offers comprehensive social and economic information on workers and their employers, making it possible to characterize firm effects on the gender earnings gap among individuals with different living arrangements and family compositions.
Consistent with the existing literature using the AKM model, this study finds that firm-specific premiums explain nearly one-quarter of the 27% earnings gap between female and male workers. On average, firms’ hiring practices, or sorting (i.e., differences in the relative proportion of women hired at high-wage firms), and pay setting (i.e., differences in pay by gender within similar firms) each explain about one-half of this firm effect.
This study finds substantial provincial differences in the role of firms. Comparisons across the three largest provinces reveal that British Columbia has the highest earnings gap, with a preponderant role for sorting, while the gap in Quebec is approximately two-thirds as high and is explained in greater part by pay-setting policies. Ontario lies somewhere in between the two. Moreover, the results of this study confirm that the gender earnings gap increases over the lifecycle, as does the importance of the sorting channel. Similar observations are found when comparing parents with non-parents. Lastly, the role of firms’ hiring and pay-setting policies is meaningfully different by marital status—a key aspect in understanding the gender earnings gap that is missing from previous work. In particular, the gender earnings gap faced by women in common-law relationships is narrower than that of married women, and less of it can be explained by sorting into lower-paying jobs.
This study is the first to apply the methodology developed by Card, Cardoso and Kline (2016) to the Canadian context, and the first to document the importance of marital status in decomposing the role of firms into sorting and pay-setting effects.

Analytical Studies Branch— Research Paper Series - 8 - Statistics Canada—Catalogue no. 11F0019M, no. 456
1 Introduction
The wages of female Canadians have caught up significantly to those of their male counterparts over the past decades. In 2018, the female-to-male wage ratio was 0.9 (Pelletier, Patterson and Moyser 2019), compared with 0.8 in 1981 (Baker and Drolet 2010).1 However, a large part of these gains date back to the late 1990s and early 2000s, and researchers have struggled to explain the slowed down convergence between female and male outcomes since 1998 (Drolet 2011; Morissette, Picot and Lu 2013; Pelletier, Patterson and Moyser 2019). Recent evidence suggests that the remaining gap stems not from differences in human capital, such as education and work experience, but from the differential sorting of women and men across industries (Pelletier, Patterson and Moyser 2019). In this context, this study examines whether firms influence the earnings of women and men differently and, if so, to what extent. It also investigates how these differential firm effects evolve over the lifecycle and vary by marital status and presence of children.
A growing body of literature has documented the important role employers play in setting their workers’ wages or firm-specific pay policies, even after accounting for workers’ observed and unobserved productivity (e.g., Abowd, Kramarz and Margolis 1999).2 In other words, otherwise identical workers may differ in terms of their wages, based only on the firm at which they are employed. Recently, Card, Cardoso and Kline (2016) brought this insight to the study of the gender pay gap by contrasting the impact of firms’ hiring and wage-setting practices on women and men. Although these practices are seldom observed by researchers, Card, Cardoso and Kline (2016) adapted an existing statistical method that allows them to characterize a firm’s hiring practices by relying on the mix of employees that work for that firm. The composition of a firm’s workforce reflects the firm’s propensity to hire certain workers over others, as well as workers’ preferences for different types of firms and their social and professional networks. Similarly, Card, Cardoso and Kline (2016) characterized firms’ wage-setting practices in the context of the gender wage gap by comparing the average wages of men in a given firm with those of women in that same firm. Together, they estimated that firms’ hiring and wage-setting practices accounted for approximately 20.0% of the gender wage gap in Portugal.3
In this paper, the methodology developed by Card, Cardoso and Kline (2016) is applied to the Canadian context, by using the Canadian Employer–Employee Dynamics Database (CEEDD), a linked administrative dataset that covers all individual workers and their employers who have filed corporate tax returns since 2001. The analysis relies on the possibility to observe individual workers over time and across firms. It also benefits from the key variables in the large-scale administrative dataset on workers (e.g., annual earnings, age, sex and province of residence), on their families (e.g., marital status, and presence and age of children) and on the firms for which they work (e.g., industry, and firm size and age). This comprehensive information makes it possible to characterize the firm effects on the gender earnings gap among individuals with different living arrangements and family compositions. This is important because the gender pay gap may change when women’s labour supply changes with the intra-household resource allocation between spouses (e.g., Chiappori, Fortin and Lacroix 2002; Goussé and Leturcq 2018;
1. In the dataset sourced from administrative data, sex is biological and assigned at birth. It is not possible to distinguish between sex assigned at birth and gender, gender identity or gender expression. Most of the evidence on the “gender” wage gap in Canada is limited in a similar way, including the literature reviewed in Section 2. The general scarcity of evidence on the labour market outcomes of LGBTQ2S+ individuals in Canada was documented in a recent survey by Waite, Ecker and Ross (2019). Statistics Canada data collection is increasingly adapting in ways that should facilitate gender-inclusive research going forward (Moyser 2019).
2. Firm-specific pay policies—or firm-specific pay premiums—refer to pay premiums offered by firms, relative to the overall labour market. Empirical specification captures them with firm fixed effects. For the remainder of this paper, the terms “firm-specific pay premiums” and “firm fixed effects” are used interchangeably.
3. The methodology employed by Card, Cardoso and Kline (2016) does not explain the factors underlying the two different mechanisms. See Section 2, “Literature review,” for a detailed discussion on these mechanisms.

Analytical Studies Branch— Research Paper Series - 9 - Statistics Canada—Catalogue no. 11F0019M, no. 456
Stevenson 2007; Voena 2015). Furthermore, the gender pay gap may change over a woman’s lifecycle, in part because of childbirth (e.g., Bruns 2019; Coudin, Maillard and Tô 2018).
This study shows that firm-specific pay premiums explain nearly one-quarter of the 27.0% gender earnings gap in Canada. These results are in line with the existing literature. In turn, firms’ hiring and pay-setting practices each explain approximately one-half of that effect. Importantly, this study finds substantial provincial differences in the role of firms. Comparisons across the three largest provinces reveal that British Columbia has the highest gap, with a preponderant role for sorting, while the gap in Quebec is approximately two-thirds as high and is explained in greater part by pay-setting policies. Ontario lies somewhere between the other two provinces. Moreover, these results confirm that the gender earnings gap increases over the lifecycle, as does the importance of the sorting channel. Similar observations are found when comparing parents with non-parents. Lastly, the role of firms’ hiring and pay-setting policies is meaningfully different by marital status—a key aspect in understanding the gender earnings gap that is missing from previous work. In particular, the gender earnings gap that women in common-law relationships face is smaller than that of married women, and less of it can be explained by sorting into lower-paying jobs.
The present study is the first to apply the methodology developed by Card, Cardoso and Kline (2016) to further understand the gender earnings gap in Canada. This is of particular importance because pay convergence has slowed down over the past two decades, and the remaining gap no longer stems from differences in human capital among women and men. Advancing gender parity in the labour market requires alternative mechanisms to be explored, and employers have been found to play a significant role in other advanced economies around the world. Firm–worker interactions are regulated by collective agreements, labour laws (e.g., minimum wage and pay equity legislation) and a broad range of policies (e.g., parental leave policies). This study does not attempt to disentangle how all these elements contribute to the role played by firms in determining earnings. However, the findings are discussed in light of a broader policy context, and they suggest future lines of enquiry.
The rest of this study is organized as follows: Section 2 reviews the literature, Section 3 outlines the analytical framework, Section 4 describes the data and presents descriptive statistics, Section 5 presents and discusses the empirical results, and Section 6 concludes.

Analytical Studies Branch— Research Paper Series - 10 - Statistics Canada—Catalogue no. 11F0019M, no. 456
2 Literature review
Women’s labour market outcomes have improved significantly over the past few decades. Among women aged 25 to 54, labour force participation increased from 60% in 1980 to more than 80% in 2015, well over the 21.6% observed in 1950 (Moyser 2019). Median real hourly wages also grew, from $15.72 (in 2010 constant dollars) in 1981 among women aged 17 to 64, to $19.37—a 23.2% change (Table 1 in Morissette, Picot and Lu 2013). These trends have also translated into improvements for women relative to men, although to a lesser extent. Between 1970 and 1990, the ratio of female-to-male earnings increased from 0.60 to 0.67, before plateauing at around 0.70 in the early 1990s (Baker et al. 1995; Baker and Drolet 2010). Moreover, the ratio of female-to-male hourly wages suggests that women gained further ground in the late 1990s into the early 2000s—increasing from 0.81 among individuals aged 25 to 54 in 1995 to 0.86 in 2005 (Baker and Drolet 2010). More recent estimates suggest that this ratio has been relatively stable ever since, reaching approximately 0.87 in 2018 (Pelletier, Patterson and Moyser 2019).
Consistent with these trends, women’s human capital has also improved, often at a rate faster than that of men (Morissette, Picot and Lu 2013). For example, the proportion of women with a university degree increased by 145.6% between 1981 and 2011, from 13.6% to 33.4%, compared with a 62.7% increase among men. Similarly, average job tenure increased by 32.8% among women, from 74.3 to 98.7 months, compared with a 3.9% decrease among men.
Morissette, Picot and Lu (2013) used Oaxaca-Blinder decompositions to evaluate the extent to which the evolution of educational attainment, job tenure, industry and occupation, and unionization explained the narrowing of the gender wage gap between 1981 and 2011. While these factors accounted fully for changes in the gender wage gap between 1981 and 1998, their role diminished substantially after 1998. These findings are in line with earlier work by Drolet (2011), who studied the period between 1998 and 2008, and with later work by Pelletier, Patterson and Moyser (2019), who covered the period from 1998 to 2018. After 1998, there is consistent evidence across sources that changes in observable characteristics can only explain approximately half of the narrowing of the gender wage gap. Furthermore, Boudarbat and Connolly (2013) observed that this trend was particularly pronounced among university graduates. All three papers also used Oaxaca-Blinder decompositions.
Of the remaining gap, Pelletier, Patterson and Moyser (2019) showed that very little can be explained by differences in human capital between women and men. They estimated that women’s greater education level and job tenure caused the 2018 gender pay gap to decrease by 6.1 percentage points. Conversely, the differential distribution of women and men across industries explained nearly 40% of the 2018 gender gap. Specifically, Pelletier, Patterson and Moyser (2019) reported that men were more likely than women to work in construction; manufacturing; and mining, quarrying, and oil and gas extraction—three sectors with high wages. In earlier work, Drolet (2002) provided more detailed evidence on the importance of workplace characteristics in the gender pay gap. Using the 1999 Workplace Employment Survey, Drolet confirmed that these characteristics—industry, high-performance workplace practices, training expenses and workplace part-time rates—explained more of the gender pay gap than worker characteristics. She also noted that men and women sorted into different types of firms. For example, women were less likely to participate in self-directed work groups, a practice associated with longer hours and additional compensation. Women were also more likely to work for non-profit organizations and firms where a larger proportion of the employees work part time. These findings are in line with those of Drolet and Mumford (2012) and Javdani (2015), who found that women sorted more heavily into low-paying firms, which contributed substantially to the gender pay gap.

Analytical Studies Branch— Research Paper Series - 11 - Statistics Canada—Catalogue no. 11F0019M, no. 456
In brief, two key facts characterize the gender wage gap in Canada in recent decades. First, changes in worker characteristics have had a diminishing role in explaining the slowed down convergence between female and male outcomes. Second, the current gap cannot be explained by differences in human capital, but rather stems in large part from the differential sorting of women and men, not only into various industries but also into different types of firms.
More broadly, a growing body of literature has documented the role of firms in the determination of wages. Abowd, Kramarz and Margolis (1999) showed that employers contribute to wage differentials across workers beyond what can be explained based on the latter’s observed and unobserved individual-level characteristics, i.e., some firms offer higher or lower wages on average to otherwise identical workers. In practice, this implies that firm-specific pay policies are relevant determinants of workers’ wages. More recently, this insight, along with the methodology developed by Abowd, Kramarz and Margolis (1999) to implement it, was adopted by Card, Cardoso and Kline (2016) to study the role of employers in the gender wage gap.
To do so, they estimated an equation for wages that controls for worker characteristics and includes both worker and firm fixed effects. They did this for women and men separately, making it possible to compare the role of firms in determining wages for the two groups. In this context, firms may impact the gender wage gap through two channels. First, firms with different characteristics may be more or less likely to hire men or women. For example, if more profitable firms are more likely to hire men, then men’s earnings are expected to be higher than those of women. Second, a firm may pay higher wages to men than to women, thereby contributing to the gender earnings gap. This could be the case if women and men are differentially successful in negotiating for higher wages. Card, Cardoso and Kline (2016) referred to the two channels respectively as the sorting and bargaining channels. Using a large administrative dataset on private sector workers from Portugal, they found that 20.9% of the gender wage gap in the early 2000s could be attributed to firm effects. Approximately three-quarters of this firm-specific pay premium resulted from the sorting of women into lower-paying firms, with the remainder stemming from gender disparities in bargaining.4
Subsequent work has produced comparable results for other countries, with the portion of the gender pay gap attributable to firm effects ranging from 8% in France (Coudin, Maillard and Tô 2018) and 11% in 1990s West Germany (Bruns 2019) to nearly 50% in Chile (Cruz and Rau 2017). In addition to Portugal, mid-range countries include 2000s West Germany (Bruns 2019) and Italy (Casarico and Lattanzio 2019), where 25.9% and 30.5%—respectively—of the gender pay gap resulted from firm effects. Notably, Bruns (2019) also found that the growth of within-firm gender inequality accounted for the stagnation of the gender wage gap in West Germany since the 1990s. Similar forces may be at play in Canada. This body of literature is still young, and much more comparative work is needed to determine, with certainty, what drives cross-country differences. However, separate authors have offered conjectures in that respect. For example, Coudin, Maillard and Tô (2018) attributed the limited role of firms in France to the large minimum wage and the structure of collective agreements in that country. Similarly, Bruns (2019) linked the growing importance of firm effects in explaining the gender wage gap in West Germany to the decline of unionization and decentralization of collective bargaining.
4. The methodology employed by Card, Cardoso and Kline (2016) does not make it possible to explain what drives sorting and bargaining. However, laboratory experiments suggest that women have greater preferences for job flexibility than men (e.g., Wiswall and Zafar 2018), which may lead to sorting, and that they have worse outcomes than men when bargaining for their wages (e.g., Dittrich, Knabe and Leipold 2014). Using panel survey data from Australia, Stevens and Whelan (2019) also found that women were less likely to have the opportunity to bargain over their pay. Furthermore, some of the characteristics of firms with relatively more women workers also suggest that at least part of the sorting effect was driven by differences in preferences. For example, Coudin, Maillard and Tô (2018) observed that mothers sorted more heavily into firms that were closer to their homes.

Analytical Studies Branch— Research Paper Series - 12 - Statistics Canada—Catalogue no. 11F0019M, no. 456
Common to these studies is the central role of sorting. Depending on the country in question, sorting is estimated to account for 15.0% to 34.7% of the gender pay gap, explaining at least 70.0% of the firm effect. Relying on different methodologies, Jewell, Razzu and Singleton (2020) and Sorkin (2017) also found that sorting played an important role in the United States and United Kingdom—accounting for 16.1% and 27.8% of the overall gender gap, respectively.
Lastly, while there has been a general decrease in the gender pay gap, both in Canada and elsewhere, this observation conceals more complex dynamics relating to economic disparities between women and men and key lifecycle events, childbirth in particular. In Sweden, Angelov, Johansson and Lindahl (2016) showed that the gender wage gap increased by approximately 10 percentage points over the 15 years following the birth of the first child. Although child penalties varied in magnitude across countries, Kleven et al. (2019) showed that women from Denmark, Sweden, Germany, Austria, the United Kingdom and the United States all experienced long-run penalties in earnings from the birth of their first child. Furthermore, Gallen, Lesner and Vejlin (2018) found that Danish women without children experienced a decoupling of pay and productivity during their childbearing years. Unsurprisingly, the literature studying the role of the firm in the gender pay gap has also found evidence that this role changes over the lifecycle, notably as women have children. Although Card, Cardoso and Kline (2016) could not account for the timing of childbirth, they observed that sorting increases in importance as women age, beginning in their early 30s. This is in line with Coudin, Maillard and Tô (2018), who estimated that sorting increased among French women after childbirth. They found that mothers sorted more heavily into firms that were closer to their homes or that offered more flexible hours.
3 Empirical model
The model employed in this study follows the well-known Abowd, Kramarz and Margolis (1999) linear model with non-nested worker and firm fixed effects. The dependent variable used in this study is the worker’s annual earnings. A concern associated with annual earnings is that they incorporate both wages and work intensity (number of hours and weeks of work). To extrapolate the results of this study to represent earnings differentials between men and women, a full-time equivalent income threshold was applied to the analysis sample selection. The sample selection procedure is discussed in more detail in the next section.
ity represents yearly earnings for worker i in firm j in year t . The complete econometric
specification is given by Equation (1):
,ln ,it it i itj i t
y X (1)
where is a constant, i is a time-invariant worker-specific effect, ,j i t is a time-invariant
firm-specific effect for firm j where worker i is employed at time t and it is a residual error
term. The firm-specific fixed effects capture whether a firm systematically overpays or underpays its workers relative to other firms. Recent evidence suggests that these firm effects explain a significant proportion of the variance of wages or earnings. Proportions vary between 15% and 25%, depending on the country. This means that 15% to 25% of wage or earnings differentials are the result of firm-specific time-invariant factors. This is consistent with the widely documented unobserved firm-specific productivity differences (Syverson 2011).

Analytical Studies Branch— Research Paper Series - 13 - Statistics Canada—Catalogue no. 11F0019M, no. 456
itX includes observed characteristics of the worker, the firm or the job, the impacts of which on
income are captured by . For the time-varying covariates used in this study, a quartic function
of age, marital status, family status, province of residence and year fixed effects were used.
Because worker fixed effect also captures the time-invariant cohort effect, the linear impact of age cannot be identified. This is because age is perfectly collinear with time-invariant year of birth and year. Instead, age was normalized at 46 and a linear restriction was imposed by dropping the linear term in the quartic function. This restriction effectively restricts the age profile to be flat at age 46, which is supported by the age-earnings profile in the data.
As with the use of any administrative data, information on workers’ characteristics such as education or ethnicity is limited. However, because of the time-invariant nature of these characteristics, they are well captured by worker fixed effect. Similarly, firm fixed effect captures time-invariant characteristics, such as industry.
Any time-varying characteristics other than the observables mentioned above were included in the error term. This captures any measurement errors, labour market shocks, shocks to personal conditions (e.g., health) and job transitions.
Many articles have debated the appropriateness of a linear model with non-nested worker and firm effects. In particular, inference on parameters of the model is valid, as long as
| , , 0,E X D F
where D and F are the design matrices for worker and firm effects, i.e., worker and firm effects will be biased unless worker mobility is uncorrelated with the time-varying residual components of earnings. Dostie et al. (2020), who also used the same data used in this study, provided a number of specification checks and found no indication that this assumption failed to hold in the data.
Comparisons of the firm fixed effects depend on observing a worker in two different firms. This set of workers and firms connected by movements of workers between firms is referred to as the connected set. The estimation was done using ordinary least squares regressions involving special routines to account for the high dimensionality of the problem. This model was estimated for men and women separately.
3.1 Firm effect normalization and the dual connected set
Because the equations for the determinants of earnings were estimated for men and women separately, and because the objective of this study is to compare how firm effects contribute to earnings, it is necessary to find a way to compare firm effects estimated from the two separate models. This is because, in each equation, the firm-specific earnings premium is identified only relative to a reference set of firms. To identify a reference set of firms, the following equations were estimated for men (M) and women (W):
0
0 1, , ,0, ,ˆ M M M M
j i t j i t j i tmax S
0
0 1, , ,0, ,ˆW W W W
j i t j i t j i tmax S (2)
in which 0
,j i tS is the average value added per worker in firm j , and 0 is typically interpreted
as a threshold after which the firm begins to share rents (Card, Cardoso and Kline 2016). These

Analytical Studies Branch— Research Paper Series - 14 - Statistics Canada—Catalogue no. 11F0019M, no. 456
equations assume that true firm effects are zero for low value-added firms and start rising after
threshold 0 , meaning that firms start sharing surpluses with workers after this threshold is
passed.
3.2 Decomposing the effect of firm-level pay premiums
By denoting the firm effect estimated from the AKM model for women by ,
W
j i t and for men by
,
M
j i t , it is possible to decompose the difference in the expected firm effect for women and men
into a bargaining component and a sorting component.5 This yields
, , , ,[ | ] [ | ] |M W M W
j i t j i t j i t j i tE Men E Women E Men
, ,[ | ] [ | ].W W
j i t j i tE Men E Women (3)
The first term on the right-hand side
, , |M W
j i t j i tE Men
is the bargaining effect as defined by Card, Cardoso and Kline (2016). This effect measures the degree to which women obtain a smaller share of the surplus generated by the firms than their male counterparts. Using the terminology employed by Dostie et al. (2020), this component is referred to as the pay-setting effect in the description of the results.
The second term on the right-hand side of the equation
, ,[ | ] [ | ]W W
j i t j i tE Men E Women
is the sorting effect. The sorting component measures the extent to which women sort into different types of firms relative to men.
The sorting component captures the degree to which women are segregated between employers that pay differently, while the pay-setting component is thought to result from differences in how men and women are paid by the same employer.6 The degree to which these two factors impact gender earnings differentials will likely depend on labour market institutions, such as the minimum wage or the importance of collective wage settings, as well as the degree of labour market fluidity.
The set of workers for which such a comparison can be made must work in firms that employ both men and women simultaneously. This set is called the dual connected set. This selection rule effectively drops all firms that employ only women or only men. The impact of these selection rules is discussed in the next section.
5. Like most decompositions, results depend on the choice of the reference group. The results of this study, using men and women as the reference group—respectively—are very similar. As a result, the former is presented in this paper.
6. A growing body of literature has found that employer segregation contributes more to the gender wage gap than occupational segregation (e.g., Jewell, Razzu and Singleton 2020).

Analytical Studies Branch— Research Paper Series - 15 - Statistics Canada—Catalogue no. 11F0019M, no. 456
4 Data
4.1 Data sources
This study uses data from the CEEDD between 2001 and 2015. The CEEDD is a linked database of workers and employers that covers all individual and corporate taxfilers. It can be accessed from the Canadian Centre for Data Development and Economic Research.
The target population of this study was all workers aged 25 to 54 and employed by incorporated (T2) businesses in the business sector in Canada.7 For a given worker, income was measured using annual earnings from T2 employment. For a worker with multiple jobs (including self-employment), the highest-paying job was considered only if their primary income was sourced from employment.8 Moreover, nominal annual earnings were deflated by provincial Consumer
Price Index (CPI, 2012=100).9 Lastly, as annual earnings confound gender differences in both pay and hours worked, only full-time equivalent workers were considered. The nature of work (full-time vs. part-time work) was not available in the administrative data, so an annual earnings threshold of roughly $18,000 derived from the 2012 minimum wage and full-time hours from the Labour Force Survey microdata file was applied.10
For employers, labour productivity (used to capture firm characteristics) was measured using real value added per employee.11 Value added was measured as the sum of T4 payrolls and net income before taxes and extraordinary items and was reported in current dollars. Industry-specific deflators from the Canadian productivity program were used to deflate nominal values to real terms. Employment was measured by the average monthly number of employees according to a given firm’s payroll deductions and remittances (PD7) files. This accounts for possible seasonality and double counting as a result of multiple-job holders. Moreover, to allow for direct earnings comparisons by gender for a given employer, the sample used in this study includes incorporated (T2) businesses with a minimum of two employees throughout the period of study.12 The identification of the worker and firm fixed effects requires each worker to be observed over multiple years and multiple workers to be observed in each firm. Firms with very low output or value added below $100 were excluded. Lastly, for firms that engaged in multiple activities over the study period, their primary industry was used to define their dominant activities.13
The final study sample contained all prime-age full-time workers whose main job was with firms in the business sector that had two or more employees. It is worth noting that the exclusion of public sector and part-time employees likely resulted in a widening of the gender earnings gap for two reasons (see next subsection). The gender wage gap is narrower in the public sector. In 2015, the gender wage gap for workers aged 25 to 54 was between 7% and 10%, compared with
7. This study includes all T2 businesses in the business sector only and excludes incorporated businesses operating in education (North American Industry Classification System code 61), health (62) and public administration (91).
8. An individual may have multiple sources of income, i.e., from employment or self-employment. Employment income sums all Statement of Remuneration Paid forms (T4 slips) issued by incorporated businesses. Self-employment income sources include business, farming, fishing, rental, commission and professional income. The two sources were compared, and only workers whose primary income was from employment were selected. Individuals with zero employment income were excluded, as were those with equal employment and self-employment income. The latter comprised an extremely small proportion of all workers.
9. The CPI was rebased to 2012 from 2002, as industry price deflators (which are used to deflate value added at the firm level) have a base year of 2012.
10. The monetary threshold of $18,733 was calculated by multiplying the minimum wage of $10.07 converted in 2012 constant dollars (Galarneau and Fecteau 2014) by the average full-time working hours of 38.8 (Labour Force Survey) and a total of 48 weeks. This is equivalent to working full time all year.
11. Value added is the sum of capital costs, labour costs and profits. Profits are the gross output net of total costs. 12. The final sample included all incorporated businesses in Canada that had employed at least two employees
according to PD7 files. Incorporated businesses with fewer than two employees were excluded. 13. Primary industry was defined as the mode of industry classification between 2001 and 2015.

Analytical Studies Branch— Research Paper Series - 16 - Statistics Canada—Catalogue no. 11F0019M, no. 456
14% for the economy as a whole (Statistics Canada table 14-10-0064-01). In addition, female part-time workers aged 25 to 54 accounted for a significant proportion of the female workforce—19% in 2015, compared with 6% of their male counterparts (Statistics Canada table 14-10-0327-01). Female part-time workers also earned more than their male counterparts. In 2015, the average wage for prime-age female workers was $21.21, vs. $20.72 for male workers (Statistics Canada table 14-10-0062-01).14
4.2 Summary statistics
Table 1 summarizes the mean annual earnings in 2015. Mean earnings on the main job for an individual who earned at least the minimum threshold were $72,600 for male workers and $52,000 for female workers, implying a gender earnings gap of 28%. This gap was greater for older workers, workers who were married or in a common-law relationship, and those with children. The gap widened slightly over time (Chart 1). This widening gap contrasts with what has been observed in the workforce overall, which includes the public sector (where the gender earnings gap has been fairly stable since the 1990s) and part-time workers (where female workers earn more than their male counterparts).15 The pace at which the gap widened over the 15-year period was fastest among younger workers, single workers (i.e., widowed, divorced, separated or never married) and those without children.
14.Full-time female workers earned less than their male counterparts—$26.11 vs. $29.86 in 2015. 15. Drolet (2002) found that the gender wage gap in Canada appeared smaller in workplaces than in the economy as
a whole, which speaks to the low-wage nature of workplaces in which women work.
Male w orkers Female w orkers Gender earnings gap
Column 1 Column 2 Column 3
2012 constant dollars 2012 constant dollars ratio
Total 72,556 52,001 0.72
By age group
25 to 29 50,664 40,020 0.79
30 to 39 66,506 49,264 0.74
40 to 49 82,470 57,215 0.69
50 to 54 85,400 56,597 0.66
By marital status
Union 80,507 54,288 0.67
Alone 57,421 48,273 0.84
By family status
Without children 70,721 51,923 0.73
With children 85,539 52,334 0.61
Source: Authors' tabulation of the Canadian Employer–Employee Dynamics Database, 2001 to 2015.
Notes: Annual earnings from top-paying employment are included. Annual earnings are set to missing if they are less than the
rough threshold of $18,000 (in 2012 real dollars); see text. Columns 1 and 2 show mean earnings by male and female w orkers,
respectively. Column 3 show s the female-to-male earnings ratio by dividing Column 2 by Column 1. Marital status is categorized into
union (married or common law ) and alone (separated, w idow ed, divorced or single). The children indicator divides w orkers into
those w ith children and those w ithout.
Table 1
Mean annual earnings in 2015

Analytical Studies Branch— Research Paper Series - 17 - Statistics Canada—Catalogue no. 11F0019M, no. 456
Female workers represented about 35% of the workforce in the study sample. Such representation varied by age, and marital and family status (Appendix Table 1). The degree to which female representation varied increased according to the characteristics of their employers, such as industry, and firm age and size (appendix tables 2.0 to 2.3), which suggests that firms play an important role in explaining earnings by gender.
Table 2 provides a descriptive overview of the characteristics of workers aged 25 to 54 who had earnings in at least one year in the CEEDD data from 2001 to 2015. The sample selection procedure used in this study may have dropped full-time workers who did not work the entire year and—therefore—did not reach the income cut-off threshold. Because earnings can only be counted if they were received from a given employer in a year and were above the full-time equivalent threshold, this procedure has two implications. First, workers would experience a mechanical reduction in earnings in a given year if their main job ended partway through the year. In contrast, workers starting a new job in the middle of the year would experience a mechanical
0.5
0.6
0.7
0.8
0.9
2001 2003 2005 2007 2009 2011 2013 2015
mean
At the national level
0.5
0.6
0.7
0.8
0.9
2001 2003 2005 2007 2009 2011 2013 2015
meanBy age group
25 to 29 years 30 to 39 years
40 to 49 years 50 to 54 years
0.5
0.6
0.7
0.8
0.9
2001 2003 2005 2007 2009 2011 2013 2015
mean
By marital status
Married or common law Windowed, divorced, separated or single
0.5
0.6
0.7
0.8
0.9
2001 2003 2005 2007 2009 2011 2013 2015
mean
By family status
With children Without children
Notes: The study sample includes all prime-age, full-time workers whose main job is with a firm in the business sector with two or more employees. Annual earnings are set to missing if they are less than the rough threshold of $18,000 (in 2012 real dollars); see text. Marital status is categorized into union (married or common law) and alone (separated, widowed, divorced or single). The children indicator divides workers into those with children and those without.Source: Authors' tabulation of the Canadian Employer–Employee Dynamics Database, 2001 to 2015.
Chart 1Mean gender earnings gap, 2001 to 2015

Analytical Studies Branch— Research Paper Series - 18 - Statistics Canada—Catalogue no. 11F0019M, no. 456
increase in earnings. Second, the selection procedure creates gap years for workers who are not employed for a substantial share of the year.
Columns 1 and 2 summarize the characteristics of male and female workers in the CEEDD sample. As described in the bottom row, there were approximately 40 million male workers and 22 million female workers in the sample. On average over the 15-year period, there were approximately 9 years of earnings data for each worker. This fraction of 9/15 reflects the workers with earnings less than $18,000 who were removed from the study sample because they changed jobs or entered the workforce or retired partway through the year.
Mean earnings on the main jobs for a worker who earned more than the minimum threshold were $66,000 for male workers and $48,032 for female workers, suggesting a 27% earnings gap. The samples of male and female workers both had a mean age of 40, with nearly 70% of workers in their 30s and 40s. The provincial distribution of male and female workers was also similar—24% in Quebec, approximately 40% in Ontario and 11% in British Columbia. Female workers tended to be employed at larger firms (308 employees vs. 199 for male workers) and tended to work at firms with a higher presence of women (52% vs. 29% for men) and immigrants (19% vs. 16% for male workers) in their workforce.
The worker and firm fixed effects in the AKM-style model were identified only in the connected set (Abowd, Creecy and Kramarz 2002). Columns 4 and 5 summarize the characteristics of men and women in the connected set of male and female workers, respectively. For men, the connected set included 97% of all person-year observations, 84% of people and 87% of firms. The exclusions correspond to firms wherein no employees worked at other firms in the connected set at some point between 2001 and 2015. Similarly, the connected set for women contained 96% of person-year observations, 81% of people and 85% of firms. The characteristics of the connected sets were fairly similar to the full set used in columns 1 and 2, with one exception—the median firm size increased slightly for both connected sets to 207 and 323, respectively.
Column 1 Column 2 Column 3 Column 4 Column 5 Column 6
Male Female Male Female Male Female
Mean age 40.0 40.3 40.1 40.5 40.2 40.5
Fraction of age at 25 to 29 (percent) 14.0 13.7 13.5 12.9 13.3 12.9
Fraction of age at 30 to 39 (percent) 32.9 31.1 33.0 31.3 32.9 31.4
Fraction of age at 40 to 49 (percent) 36.4 38.0 36.9 38.7 37.0 38.7
Fraction of age at 50 to 54 (percent) 16.7 17.1 16.6 17.2 16.7 17.0
Mean earnings 66,056 48,032 66,891 48,694 68,704 49,220
Fraction in Quebec (percent) 24.1 23.3 24.4 23.4 24.1 23.4
Fraction in Ontario (percent) 38.9 42.6 39.2 42.8 39.8 43.2
Fraction in British Columbia (percent) 11.4 11.9 11.4 11.8 11.2 11.6
Median f irm size 199 308 207 323 307 419
Fraction of men (percent) 71.3 48.2 71.2 48.3 69.8 50.1
Fraction of immigrants (percent) 16.0 18.8 15.9 18.7 16.2 18.9
Mean log (value added/PD7) 11.3 11.2 10.8 10.6 11.3 11.2
Number of person-year observations 40,853,476 21,564,688 39,572,671 20,738,690 35,979,209 19,640,363
Number of persons 6,603,544 4,018,592 5,558,251 3,243,861 5,341,050 3,137,873
Number of f irms 484,751 421,625 423,876 356,756 299,973 299,973
Notes: PD7 employment is the average number of employees at a f irm, calculated from the mean of all non-zero monthly employment
submissions from payroll deductions and remittances (PD7). Annual earnings are set to missing if they are less than the rough threshold of
$18,000 (in 2012 real dollars); see text. Labour productivity is the value added per PD7 employment.
Source: Authors' tabulation of the Canadian Employer–Employee Dynamics Database, 2001 to 2015.
Table 2
Descriptive statistics: Employees in selected samples from the Canadian Employer–Employee
Dynamics Database, 2001 to 2015
Overall analysis sample
Connected sets of workers at firms
All Dual connected set

Analytical Studies Branch— Research Paper Series - 19 - Statistics Canada—Catalogue no. 11F0019M, no. 456
To compare firm effects between men and women, the dual connected set was used. This step excludes firms with no connected male or female workers. Columns 5 and 6 summarize the workers’ characteristics in the dual connected set. The restriction to have at least one connected female worker has a more pronounced impact on firms in the connected set for male workers, eliminating 29% of firms (Column 5), compared with 16% of the connected set of female workers (Column 6). This implies that there are more firms in Canada with an all-male workforce than those with an all-female workforce.
The selection also has an impact on mean earnings and firm size. For the former, the mean earnings were higher in the dual connected set—3% for all men and 1% for women. For the latter, median firm size was substantially higher, at 310 for men (from 207 in the connected set)—an increase of 48%—and 424 for women (from 323 in the connected set)—an increase of 30%. The rest of the characteristics remained similar to those in the connected sets.
5 Results
In this section, the coefficient estimates obtained from the linear model with worker and firm fixed effects—including a variance decomposition of earnings—are discussed, and the way firm fixed effects are normalized is explained. The decomposition results are then discussed, showing the extent to which firm effects contribute to the gender earning gaps and the role sorting and firm-specific pay-setting policies play in explaining this earnings gap.
5.1 Coefficient estimates: AKM model
The coefficient estimates from Equation (1) are shown in Table 3. It is important to note that the model incorporates both worker and firm fixed effects, which are invariant over time. This modelling strategy makes it possible to take into account all fixed-over-time characteristics (e.g., education) implicitly for a given worker or managerial quality within a firm. Moreover, the earnings models used in this study were estimated for male and female workers separately. Lastly, worker characteristics, including age, marital status, presence of children and province of residence, and year fixed effects were included in all regressions.

Analytical Studies Branch— Research Paper Series - 20 - Statistics Canada—Catalogue no. 11F0019M, no. 456
In that context, coefficient estimates show interesting gender differences with respect to the impact of many observable characteristics on earnings. For example, for male workers, all marital statuses other than married were associated with lower earnings, with the biggest difference being for widowed (-6.2%) and single (-3.8%) men. On average, divorced or separated men earned less than married men by 2.9% and 2.8% respectively. For female workers, nearly all marital statuses other than married were associated with higher earnings, with the biggest difference observed among single women, who earned 3.3% more than married women. Interestingly, there was a small earnings difference between divorced and separated women, the former earning 3.2% more than married women and the latter earning just 2.0% more. One exception is widowed women,
Male workers Female workers
Column 1 Column 2
Quadratic normalized age / 100
Coefficient -103.026 *** -109.738 ***
Standard error (0.467) (0.587)
Cubic normalized age / 1,000
Coefficient 988.075 *** -1,195.57 ***
Standard error (32.321) (40.774)
Quartic normalized age / 10,000
Coefficient -1,152.255 *** -1,778.428 ***
Standard error (56.387) (72.005)
Married (baseline: omitted)
Common law
Coefficient -0.021 *** 0.006 ***
Standard error (0.000) (0.000)
Widowed
Coefficient -0.062 *** -0.016 ***
Standard error (0.001) (0.001)
Divorced
Coefficient -0.029 *** 0.032 ***
Standard error (0.000) (0.000)
Separated
Coefficient -0.028 *** 0.020 ***
Standard error (0.000) (0.000)
Single
Coefficient -0.038 *** 0.033 ***
Standard error (0.000) (0.000)
Children indicator
Coefficient -0.002 *** -0.001 ***
Standard error (0.000) (0.000)
Share of children aged younger than 1
Coefficient 0.000 -0.013 ***
Standard error (0.001) (0.001)
Share of children aged 1 to 5
Coefficient 0.002 *** 0.000
Standard error (0.000) (0.001)
Year fixed effects Yes Yes
Province fixed effects Yes Yes
Number of observations 39,572,671 20,738,690
R-squared 0.838 0.836
R-squared_within 0.319 0.330
*** signif icantly different from reference category (p < 0.01)
Source: Authors' tabulation of the Canadian Employer–Employee Dynamics Database, 2001 to 2015.
Notes: AKM stands for Abow d, Kramarz and Margolis (AKM 1999). This table presents a summary of the estimated tw o-w ay
f ixed effects model. The model w as estimated for male (Column 1) and female w orkers (Column 2). Standard errors are in
parentheses.
Table 3
Summary of Abowd, Kramarz and Margolis (AKM 1999) estimation results

Analytical Studies Branch— Research Paper Series - 21 - Statistics Canada—Catalogue no. 11F0019M, no. 456
who earned less than married women (-1.6%). Because earnings are the dependent variable used in this study (effectively the product of hourly wages and hours of work per year), it is not possible to ascertain whether those differences are the result of differing wages or different work intensities.
Having children also has different impacts based on gender, but those effects were very small. A small earnings penalty for both male and female workers was observed. For male workers, the penalty was minimal (-0.2%). For female workers, the penalty was larger (-1.4%) when children were younger than 1, and became marginally negative as children grew older.
5.2 AKM model: Analysis of variance
Table 4 presents the summary statistics from the previous regression. To better understand the role of firms in determining earnings, Table 4 also includes results from decomposing the variance of earnings. The most important contributor to total variance was person effects, which explained 58.1% of the variance of earnings for male workers and 68.5% of that for female workers. This lower contribution of person effects for male workers was compensated by a higher contribution
of the variance of predicted earnings based on observable characteristics (���) and associated covariances, contributing to 11.2% of the variance for male workers, compared with only 3.9% for female workers.
Male workers Female workers
Column 1 Column 2
Standard deviation of log earnings 0.575 0.499
Number of person-year observations 39,572,671 20,738,690
Summary of parameter estimates
Number of person effects 5,558,251 3,243,861
Number of f irm effects 423,876 356,756
Standard deviation of person effects (across person-year observations) 0.438 0.413
Standard deviation of f irm effects (across person-year observations) 0.192 0.167
Standard deviation of predicted log earnings (across person-year
observations) 0.229 0.220
Correlation of person–firm effects 0.068 0.000
Root-mean-square error of model 0.251 0.222
Adjusted R-squared of model 0.810 0.803
Correlation of estimated male–female firm effects1 … 0.599
Inequality decomposition of two-way fixed effects model
Share of variance of log earnings attributable to
Person effects 58.1 68.5
Firm effects 11.1 11.3
Covariance of person and firm effects 3.5 0.0
Predicted log earnings and associated covariances 11.2 3.9
Residual 16.2 16.4
… not applicable
Table 4
Summary of the estimated two-way fixed effects model for male and female workers
Notes: This table presents a summary of the estimated tw o-w ay f ixed effects model from Table 3. The model w as estimated
for male (Column 1) and female w orkers (Column 2).
1.The correlation of estimated firm effects for male and female w orkers across all f irms in the dual connected set. The figure
does not correspond to Column 2: female w orkers.
Source: Authors' tabulation of the Canadian Employer–Employee Dynamics Database, 2001 to 2015.

Analytical Studies Branch— Research Paper Series - 22 - Statistics Canada—Catalogue no. 11F0019M, no. 456
Firm fixed effects explained a residual 11.1% and 11.3% for male and female workers, respectively. Interestingly, the covariance between person and firm effect was positive (3.5%) for male workers and zero for female workers.16 This positive covariance for male workers is indicative of some amount of positive assortative matching for them, a phenomenon by which high-wage male workers are more likely to be employed in high-paying firms, i.e., those with above-average wages for unobserved reasons compared with their peers. The results show no evidence of positive assortative matching for female workers. This, in turn, suggests that differential sorting between genders is likely to explain part of the gender earnings gap.
5.3 Normalizing the firm fixed effect: Hockey stick regression results
Because firm fixed effects are obtained from separate regressions for male and female workers, they need to be normalized first to ensure meaningful comparisons. Chart 2 plots firm fixed effects against real value added per worker in logarithms for male and female workers. The plot is relatively flat followed by an upswing—known in Canada as a hockey stick figure. The strategy taken in this study relies on identifying the inflection point in Chart 2 and normalizing the firm fixed effects according to their average value for low value-added firms in the flat portion of the curve.
16. This correlation is similar to the one found by Abowd, Lengermann and McKinney (2003), who reported a correlation of 0.08 for U.S. workers. A recent working paper by Bonhomme et al. (2020) claimed that limited mobility bias tends to overstate the contribution of firm effects to the earnings dispersion. While previous research found that firms contributed 15% to 25% to the earnings dispersion, these authors claimed the bias-adjusted contribution is closer to 5% to 15%. However, echoing Andrews et al. (2008), these authors also found this bias to be less important in longer panels (see Bonhomme et al. 2020, Figure 9), such as the one used in this paper covering a 15-year period. Moreover, Bonhomme et al. (2020) showed that excluding relatively small firms helped mitigate this bias (Figure 11). Small firms with fewer than two employees and those with less than $100 in real value added were excluded from the study sample. Future work is needed to assess whether the longer panel and the removal of very small firms are sufficient to produce unbiased estimates of the firms’ contribution to the earnings gap in this data setting.
-0.25
-0.20
-0.15
-0.10
-0.05
0.00
0.05
0.10
0.15
0 20 40 60 80 100 120
mean firm effect
100 quantiles of real value added per worker
Mean firm effect on female workers
-0.25
-0.20
-0.15
-0.10
-0.05
0.00
0.05
0.10
0.15
0 20 40 60 80 100 120
mean firm effect
100 quantiles of real value added per worker
Mean firm effect on male workers
Note: The figure plots the firm effect and logarithmic firms' labour productivity (real value added per worker) in 100 quantiles from Table 3.Source: Authors' tabulation of the Canadian Employer–Employee Dynamics Database, 2001 to 2015.
Chart 2Firm effects and labour productivity, 2001 to 2015

Analytical Studies Branch— Research Paper Series - 23 - Statistics Canada—Catalogue no. 11F0019M, no. 456
Table 5 shows the results from estimating Equation (2) separately for male and female workers. The identified inflection point was similar for both genders. Interestingly, the slope of the curve after the inflection point was higher for men than for women (0.139 vs. 0.108), indicating that male workers were able to capture a higher share of the surplus in high value-added firms. This, in turn, suggests that the impact of firm-specific pay policies will differ between genders. In the decomposition results below, the exact contribution these policies make to the gender earnings gap was computed.
5.4 Decomposition results: Contribution of firm premiums, role of sorting and pay-setting effects
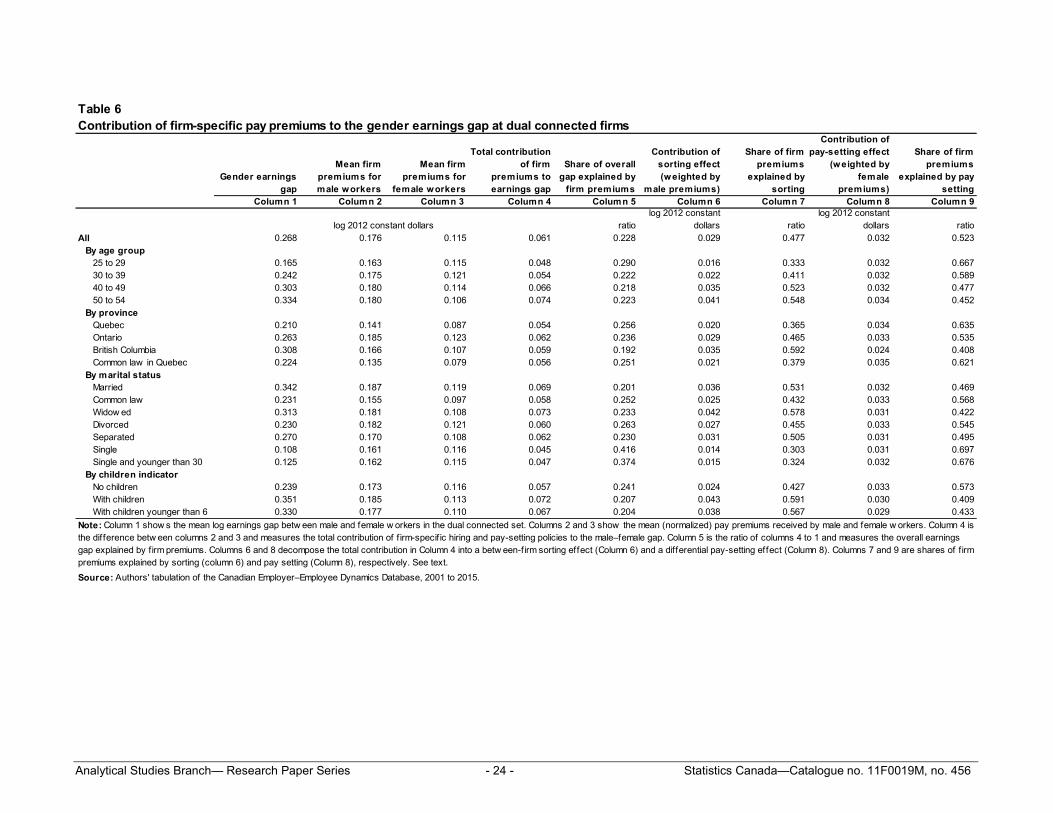
Table 6 presents the main decomposition results. Different rows refer to various subgroups for which the decomposition was computed. The results are presented by age group, marital status, presence of children and some selected provinces. Column 1 shows the gender earnings gap, columns 2 and 3 show the average firm effects for male and female workers, and Column 4 shows the total contribution of firm premiums to the gender earnings gap—or the difference between columns 2 and 3.
Male workers Female workers
Column 1 Column 2
Breakpoint
Coeff icient 10.076 *** 10.055 ***
Standard error (0.001) (0.001)
Slope coefficient
Coeff icient 0.138 *** 0.108 ***
Standard error (0.000) (0.000)
Constant
Coeff icient -0.162 *** -0.109 ***
Standard error (0.000) (0.000)
Number of observations 55,747,455 55,747,455
R-squared 0.289 0.199
Source: Authors' tabulation of the Canadian Employer–Employee Dynamics Database, 2001 to 2015.
*** signif icantly dif ferent from reference category (p < 0.01)
Notes: The table displays coeff icient estimates for the nonlinear regression of unnormalized estimated f irm effects for f irms in
the dual connected set. Standard errors are in parentheses.
Table 5
Regression of estimated firm effects on mean logged value added per worker
Analytical Studies Branch— Research Paper Series - 24 - Statistics Canada—Catalogue no. 11F0019M, no. 456
Gender earnings
gap
Mean firm
premiums for
male workers
Mean firm
premiums for
female workers
Total contribution
of firm
premiums to
earnings gap
Share of overall
gap explained by
firm premiums
Contribution of
sorting effect
(weighted by
male premiums)
Share of firm
premiums
explained by
sorting
Contribution of
pay-setting effect
(weighted by
female
premiums)
Share of firm
premiums
explained by pay
setting
Column 1 Column 2 Column 3 Column 4 Column 5 Column 6 Column 7 Column 8 Column 9
ratio
log 2012 constant
dollars ratio
log 2012 constant
dollars ratio
All 0.268 0.176 0.115 0.061 0.228 0.029 0.477 0.032 0.523
By age group
25 to 29 0.165 0.163 0.115 0.048 0.290 0.016 0.333 0.032 0.667
30 to 39 0.242 0.175 0.121 0.054 0.222 0.022 0.411 0.032 0.589
40 to 49 0.303 0.180 0.114 0.066 0.218 0.035 0.523 0.032 0.477
50 to 54 0.334 0.180 0.106 0.074 0.223 0.041 0.548 0.034 0.452
By province
Quebec 0.210 0.141 0.087 0.054 0.256 0.020 0.365 0.034 0.635
Ontario 0.263 0.185 0.123 0.062 0.236 0.029 0.465 0.033 0.535
British Columbia 0.308 0.166 0.107 0.059 0.192 0.035 0.592 0.024 0.408
Common law in Quebec 0.224 0.135 0.079 0.056 0.251 0.021 0.379 0.035 0.621
By marital status
Married 0.342 0.187 0.119 0.069 0.201 0.036 0.531 0.032 0.469
Common law 0.231 0.155 0.097 0.058 0.252 0.025 0.432 0.033 0.568
Widow ed 0.313 0.181 0.108 0.073 0.233 0.042 0.578 0.031 0.422
Divorced 0.230 0.182 0.121 0.060 0.263 0.027 0.455 0.033 0.545
Separated 0.270 0.170 0.108 0.062 0.230 0.031 0.505 0.031 0.495
Single 0.108 0.161 0.116 0.045 0.416 0.014 0.303 0.031 0.697
Single and younger than 30 0.125 0.162 0.115 0.047 0.374 0.015 0.324 0.032 0.676
By children indicator
No children 0.239 0.173 0.116 0.057 0.241 0.024 0.427 0.033 0.573
With children 0.351 0.185 0.113 0.072 0.207 0.043 0.591 0.030 0.409
With children younger than 6 0.330 0.177 0.110 0.067 0.204 0.038 0.567 0.029 0.433
Source: Authors' tabulation of the Canadian Employer–Employee Dynamics Database, 2001 to 2015.
log 2012 constant dollars
Note: Column 1 show s the mean log earnings gap betw een male and female w orkers in the dual connected set. Columns 2 and 3 show the mean (normalized) pay premiums received by male and female w orkers. Column 4 is
the dif ference betw een columns 2 and 3 and measures the total contribution of f irm-specif ic hiring and pay-setting policies to the male–female gap. Column 5 is the ratio of columns 4 to 1 and measures the overall earnings
gap explained by firm premiums. Columns 6 and 8 decompose the total contribution in Column 4 into a betw een-f irm sorting effect (Column 6) and a differential pay-setting effect (Column 8). Columns 7 and 9 are shares of firm
premiums explained by sorting (column 6) and pay setting (Column 8), respectively. See text.
Table 6
Contribution of firm-specific pay premiums to the gender earnings gap at dual connected firms
Analytical Studies Branch— Research Paper Series - 25 - Statistics Canada—Catalogue no. 11F0019M, no. 456
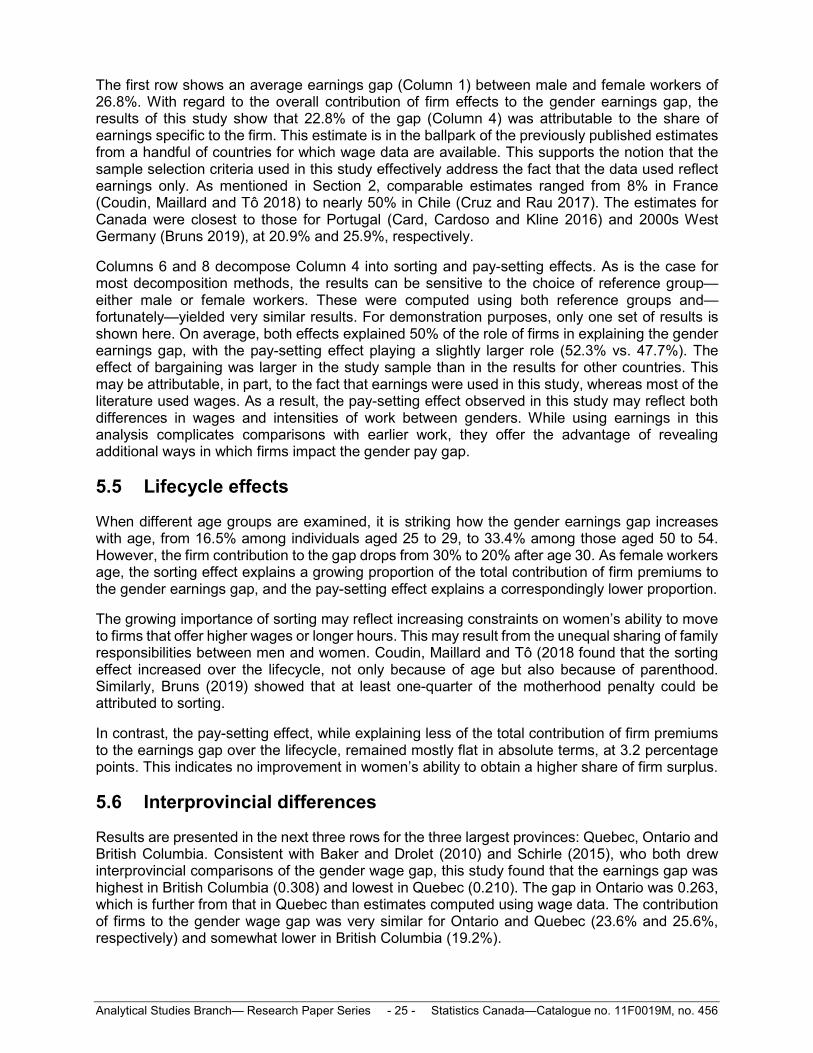
The first row shows an average earnings gap (Column 1) between male and female workers of 26.8%. With regard to the overall contribution of firm effects to the gender earnings gap, the results of this study show that 22.8% of the gap (Column 4) was attributable to the share of earnings specific to the firm. This estimate is in the ballpark of the previously published estimates from a handful of countries for which wage data are available. This supports the notion that the sample selection criteria used in this study effectively address the fact that the data used reflect earnings only. As mentioned in Section 2, comparable estimates ranged from 8% in France (Coudin, Maillard and Tô 2018) to nearly 50% in Chile (Cruz and Rau 2017). The estimates for Canada were closest to those for Portugal (Card, Cardoso and Kline 2016) and 2000s West Germany (Bruns 2019), at 20.9% and 25.9%, respectively.
Columns 6 and 8 decompose Column 4 into sorting and pay-setting effects. As is the case for most decomposition methods, the results can be sensitive to the choice of reference group—either male or female workers. These were computed using both reference groups and—fortunately—yielded very similar results. For demonstration purposes, only one set of results is shown here. On average, both effects explained 50% of the role of firms in explaining the gender earnings gap, with the pay-setting effect playing a slightly larger role (52.3% vs. 47.7%). The effect of bargaining was larger in the study sample than in the results for other countries. This may be attributable, in part, to the fact that earnings were used in this study, whereas most of the literature used wages. As a result, the pay-setting effect observed in this study may reflect both differences in wages and intensities of work between genders. While using earnings in this analysis complicates comparisons with earlier work, they offer the advantage of revealing additional ways in which firms impact the gender pay gap.
5.5 Lifecycle effects
When different age groups are examined, it is striking how the gender earnings gap increases with age, from 16.5% among individuals aged 25 to 29, to 33.4% among those aged 50 to 54. However, the firm contribution to the gap drops from 30% to 20% after age 30. As female workers age, the sorting effect explains a growing proportion of the total contribution of firm premiums to the gender earnings gap, and the pay-setting effect explains a correspondingly lower proportion.
The growing importance of sorting may reflect increasing constraints on women’s ability to move to firms that offer higher wages or longer hours. This may result from the unequal sharing of family responsibilities between men and women. Coudin, Maillard and Tô (2018 found that the sorting effect increased over the lifecycle, not only because of age but also because of parenthood. Similarly, Bruns (2019) showed that at least one-quarter of the motherhood penalty could be attributed to sorting.
In contrast, the pay-setting effect, while explaining less of the total contribution of firm premiums to the earnings gap over the lifecycle, remained mostly flat in absolute terms, at 3.2 percentage points. This indicates no improvement in women’s ability to obtain a higher share of firm surplus.
5.6 Interprovincial differences
Results are presented in the next three rows for the three largest provinces: Quebec, Ontario and British Columbia. Consistent with Baker and Drolet (2010) and Schirle (2015), who both drew interprovincial comparisons of the gender wage gap, this study found that the earnings gap was highest in British Columbia (0.308) and lowest in Quebec (0.210). The gap in Ontario was 0.263, which is further from that in Quebec than estimates computed using wage data. The contribution of firms to the gender wage gap was very similar for Ontario and Quebec (23.6% and 25.6%, respectively) and somewhat lower in British Columbia (19.2%).

Analytical Studies Branch— Research Paper Series - 26 - Statistics Canada—Catalogue no. 11F0019M, no. 456
Of particular interest is the relative role of sorting and pay setting in the three provinces considered in this study. In absolute terms, sorting contributed only 2.0 percentage points to the gender earnings gap in Quebec, 2.9 percentage points in Ontario and 3.5 percentage points in British Columbia. Similarly, pay setting accounted for 2.4 percentage points of the gender earnings gap in British Columbia, well below the 3.3 percentage points in Ontario and 3.4 percentage points in Quebec. As a result, the overall role of firms in the gender earnings gap in British Columbia was primarily driven by sorting, which accounted for 59.2% of the effect. Notably, the relative roles of sorting and pay setting in British Columbia were comparable to those observed in the literature. In comparison, the opposite was observed in Quebec, where only one-third of the firm effect stemmed from sorting (36.5%). In Ontario, the relative roles of sorting and pay setting were almost equal, at 46.5% and 53.5%, respectively. For context, it is worth noting that Schirle (2015) estimated that differential sorting across industries and occupations explained approximately 42.5% of the gender wage gap in British Columbia in 2014, and only 31.0% of the gap in Quebec and 30.5% in Ontario.
Understanding interprovincial differences in firm-specific pay premiums requires more research. On the one hand, Ontario and Quebec are the only two provinces that adopted pay equity legislation for the private sector (Schirle 2015). However, it remains unclear whether these types of policies are effective in reducing the gender gap (Baker and Fortin 2004). On the other hand, there are important differences between Quebec and the rest of Canada in terms of family policies, which have been shown to have significant impacts on women’s employment. For example, Baker, Gruber and Milligan (2008) demonstrated that the introduction of affordable universal childcare in Quebec in the 1990s led to increases in the labour supply of mothers. Quebec also differs from the rest of Canada in terms of its parental leave program, which affects the amount of time mothers spend away from work following childbirth, but also their likelihood of return to their pre-birth employer (Baker and Milligan 2008a, 2008b). These policies may interact with the role of firms in determining the gender earnings gap. For example, widely available affordable childcare may reduce pressure on women to sort into lower-hour firms. Similarly, more generous parental leave in Quebec may help women avoid sorting into lower-paying firms following childbirth. Recall that Coudin, Maillard and Tô (2018) observed that sorting increased among French women after childbirth. Bruns (2019) also showed that, for women, the gender gap increased from their mid-30s to their mid-40s because of their movement to lower-wage firms. While it can only be speculated at this point, the results of this study are the first to suggest that family policy differences between Quebec and the rest of Canada could impact women’s employment through their interaction with firms’ role with respect to pay.
5.7 Differences by marital status
Before the relationship between firm-specific pay premiums and marital status is discussed, it is worth noting the significant differences between married and common-law individuals in terms of the gender earnings gap alone—the gap among common-law workers was only two-thirds the size of that among married workers (23.1% vs. 34.2%). The gap was lowest for single workers (10.8%). There was also a non-negligible difference with respect to the role of firms. The total contribution of firm premiums to the earnings gap was lowest for married female workers (20.1%) and highest for single female workers (41.6%).
Similar to the findings with respect to age, the pay-setting effect did not vary much by marital status—it contributed 3.1 to 3.3 percentage points to the gender earnings gap. In comparison, sorting varied substantially by marital status, accounting for 1.4 to 4.2 percentage points of the gap. In other words, the differences in the role of firms in the gender earnings gap were driven almost entirely by differences in the strength of the sorting channel. Correspondingly, the relative importance of the pay-setting and sorting channels varied considerably by marital status. For

Analytical Studies Branch— Research Paper Series - 27 - Statistics Canada—Catalogue no. 11F0019M, no. 456
example, the share explained by sorting was 50% higher for married female workers than for those in a common-law relationship.
It can only be speculated as to why this may be the case. While several contributions to the literature on the role of firms have examined changes around childbirth, to the best of the authors’ knowledge, the current study is the first to examine differences by marital status. The literature on intra-household decision making has highlighted how the legal framework of marriage and common-law unions may impact resource allocation among spouses (e.g., Chiappori, Fortin and Lacroix 2002; Goussé and Leturcq 2018; Stevenson 2007; Voena 2015). In this context, previous research has shown that women decrease their labour supply in response to an increase in their intra-household bargaining power. As such, the results of this study would be consistent with married women having more bargaining power at home and selecting into lower-hour firms as a result. Alternatively, they could also be consistent with common-law women choosing higher-hour jobs to strengthen their labour market attachment to protect themselves against union dissolution. Importantly, the results suggest that common-law couples in Quebec may be driving the diminished role of sorting among common-law couples (vs. married couples). This is consistent with the fact that being in a common-law relationship in Quebec has drastically different implications than it does in the rest of Canada.
5.8 Children
The gap is quite a bit wider among individuals with children, and it is substantially more attributable to the sorting channel. For example, Coudin, Maillard and Tô (2018) found that mothers earned 21.4% less than fathers, while childless women earned only 2.4% less than childless men. Furthermore, they estimated that the role of firms among parents was driven entirely by sorting, whereas women without children tended to sort into higher-paying firms. In addition, the results of the present study for children were consistent with the lifecycle patterns discussed in Section 5.5 and with comparable results from previous work (e.g., Bruns 2019; Card, Cardoso and Kline 2016).
Analytical Studies Branch— Research Paper Series - 28 - Statistics Canada—Catalogue no. 11F0019M, no. 456
6 Conclusion
Using data from the CEEDD from 2001 to 2015, this study looks at the Canadian gender earnings gap from a novel point of view—examining the contribution of firm-specific pay policies to this gap in detail. This was done by estimating a linear model with worker and firm fixed effects (AKM model) and employing the decomposition methods first introduced by Card, Cardoso and Kline (2016). This study makes two important contributions specific to the Canadian context and one more novel general contribution.
First, based on the fact that female workers earn 27% less than their male counterparts, the results of this study show that if female workers benefited from the same firm premiums as male workers, the gender earnings gap would fall to slightly less than 21%. This study found that the relative importance of the total contribution of firm premiums to the earnings gap decreased with age and was similar across the three largest provinces.
Second, this contribution was decomposed into two components, one related to the fact that female workers may sort into different types of firms than male workers and the other related to the fact that women may be paid less than men in similar types of firms. On average, both channels were found to contribute equally to the total contribution of firm premiums to the gender earnings gap.
However, once again there were significant differences observed with respect to age and province—the relative importance of sorting increased with age, whereas the relative importance of pay setting declined. In absolute value, this latter effect showed no improvement as women aged, while the sorting effect increased, which explains why the absolute contribution of firm premiums to the gender earnings gap increases with age. With respect to province, while the total contribution of firm-specific pay premiums was relatively constant (explaining 19% to 25% of the gender earnings gap), there were significant differences observed in the relative roles of sorting and pay setting. Sorting explained 59% of the role of firms in the gender earnings gap in British Columbia, 47% in Ontario and only 37% in Quebec.
Third, this study examined how the role of firms in determining earnings varies with marital status. For married women, it was found that 20% of the 34% gender earnings gap was attributable to firms. In comparison, the gap was narrower for single women (11%). However, firms played a more important role—accounting for 42% of that gap. Moreover, differences in the role of firms by marital status were driven almost entirely by differences in the strength of the sorting channel. In absolute terms, the pay-setting effect did not change according to marital status, while the sorting effect varied substantially. To the authors’ knowledge, this study is the first to show how marital status interacts with the decomposition of the role of the firm into sorting and pay-setting effects.
Like any data source based on administrative data, the dataset used in this study does not include workers’ gender, sexual orientation and race or firms’ human resources policies. As these data become available, the gender earnings gap could be examined along these dimensions. Future work could also examine whether institutional differences by province, such as parental leave policies and access to childcare, explain differences in the importance of sorting. This would contribute to the growing body of literature that documents the various ways in which these policies impact the outcomes of parents and children. It would also inform an alternative channel through which government could improve pay equity.

Analytical Studies Branch— Research Paper Series - 29 - Statistics Canada—Catalogue no. 11F0019M, no. 456
7 Appendix
7.1 Tables
Male workers Female workers
percent percent
Age group
25 to 29 65.9 34.1
30 to 39 66.6 33.4
40 to 49 64.5 35.5
50 to 54 64.8 35.2
Marital status
Union 67.2 32.8
Alone 62.0 38.0
Family status
Without children 67.0 33.0
With children 60.7 39.3
Total 65.5 34.5
Notes: Annual earnings are set to missing if they are less than the rough threshold of $18,000 (in 2012 real dollars); see text.
Marital status is categorized into union (married or common law ) and alone (separated, w idow ed, divorced or single). The
children indicator divides w orkers into those w ith children and those w ithout.
Appendix Table 1
Mean gender composition by age group, marital status and children indicator,
2001 to 2015
Source: Authors' tabulation of the Canadian Employer–Employee Dynamics Database, 2001 to 2015.

Analytical Studies Branch— Research Paper Series - 30 - Statistics Canada—Catalogue no. 11F0019M, no. 456
Male
workers
Female
workers
Male
workers
Female
workers
Male
w orkers
Female
workers
Male
workers
Female
w orkers
Male
workers
Female
workers
New foundland and Labrador 71.1 28.9 72.4 27.6 68.0 32.0 72.3 27.7 68.0 32.0
Prince Edw ard Island 68.1 31.9 70.0 30.0 63.5 36.5 69.8 30.2 64.0 36.0
Nova Scotia 67.2 32.8 69.4 30.6 62.9 37.1 68.4 31.6 63.9 36.1
New Brunsw ick 67.4 32.6 69.3 30.7 63.5 36.5 68.9 31.1 63.7 36.3
Quebec 66.3 33.7 67.6 32.4 63.6 36.4 67.7 32.3 62.0 38.0
Ontario 63.4 36.6 65.4 34.6 59.2 40.8 65.1 34.9 58.6 41.4
Manitoba 68.2 31.8 69.4 30.6 65.4 34.6 69.7 30.3 63.9 36.1
Saskatchew an 68.4 31.6 68.9 31.1 67.3 32.7 70.3 29.7 63.0 37.0
Alberta 67.9 32.1 69.5 30.5 64.8 35.2 69.3 30.7 62.8 37.2
British Columbia 64.6 35.4 66.6 33.4 61.0 39.0 66.0 34.0 59.8 40.2
Territories 67.3 32.7 67.8 32.2 66.7 33.3 69.3 30.7 60.9 39.1
Total 65.5 34.5 67.2 32.8 62.0 38.0 67.0 33.0 60.7 39.3
Appendix Table 2.0
Mean gender composition by province or territory, 2001 to 2015
Source: Authors' tabulation of the Canadian Employer–Employee Dynamics Database, 2001 to 2015.
Notes: Annual earnings are set to missing if they are less than the rough threshold of $18,000 (in 2012 real dollars); see text. Marital status is categorized into union
(married or common law ) and alone (separated, w idow ed, divorced or single). The children indicator divides w orkers into those w ith children and those w ithout.
Province or territory
Business sector
Among workers in a
union: married or
common law
Among alone
w orkers: single,
divorced or w idowed
Among workers
without children
Among workers with
children
percent

Analytical Studies Branch— Research Paper Series - 31 - Statistics Canada—Catalogue no. 11F0019M, no. 456
Male
workers
Female
workers
Male
workers
Female
workers
Male
workers
Female
workers
Male
workers
Female
workers
Male
workers
Female
workers
Agriculture, forestry, f ishing and hunting 81.2 18.8 81.9 18.1 79.4 20.6 83.6 16.4 73.2 26.8
Mining, oil and gas extraction 83.2 16.8 84.5 15.5 80.4 19.6 83.2 16.8 83.3 16.7
Utilities 71.5 28.5 74.4 25.6 63.6 36.4 71.7 28.3 71.2 28.8
Construction 87.6 12.4 87.4 12.6 88.0 12.0 88.9 11.1 83.6 16.4
Manufacturing 75.0 25.0 76.4 23.6 71.6 28.4 76.3 23.7 71.5 28.5
Wholesale trade 68.3 31.7 70.3 29.7 63.9 36.1 69.7 30.3 64.4 35.6
Retail trade 54.8 45.2 55.7 44.3 53.1 46.9 57.2 42.8 47.8 52.2
Transportation and w arehousing 73.1 26.9 75.0 25.0 69.6 30.4 74.7 25.3 68.7 31.3
Information and cultural industries 58.2 41.8 61.4 38.6 52.5 47.5 59.9 40.1 52.1 47.9
Finance, insurance and real estaste 41.0 59.0 41.7 58.3 39.4 60.6 44.0 56.0 31.9 68.1
Professional, scientif ic and technical services 62.3 37.7 64.9 35.1 57.3 42.7 63.3 36.7 58.0 42.0
Management of companies and enterprises 61.1 38.9 63.3 36.7 56.6 43.4 62.7 37.3 55.8 44.2
Administration and support, w aste management and
remediation 58.9 41.1 60.7 39.3 56.3 43.7 61.2 38.8 50.7 49.3
Arts, entertainment and recreation 54.2 45.8 56.2 43.8 51.6 48.4 56.7 43.3 44.9 55.1
Accommodation and food 49.5 50.5 50.3 49.7 48.5 51.5 52.6 47.4 38.1 61.9
Other services (except public administration) 55.2 44.8 57.7 42.3 50.6 49.4 56.3 43.7 52.0 48.0
Total 65.5 34.5 67.2 32.8 62.0 38.0 67.0 33.0 60.7 39.3
Source: Authors' tabulation of the Canadian Employer–Employee Dynamics Database, 2001 to 2015.
Appendix Table 2.1
Mean gender composition by industry, 2001 to 2015
percent
Notes: Annual earnings are set to missing if they are less than the rough threshold of $18,000 (in 2012 real dollars); see text. Marital status is categorized into union (married or
common law ) and alone (separated, w idow ed, divorced or single). The children indicator divides w orkers into those w ith children and those w ithout.
Industry
Business sector
Among workers in a
union: married or
common law
Among alone
workers: single,
divorced or w idowed
Among workers
w ithout children
Among workers with
children

Analytical Studies Branch— Research Paper Series - 32 - Statistics Canada—Catalogue no. 11F0019M, no. 456
Male
w orkers
Female
workers
Male
workers
Female
workers
Male
workers
Female
workers
Male
workers
Female
workers
Male
workers
Female
w orkers
Younger than 5 years 66.9 33.1 68.9 31.1 63.1 36.9 68.4 31.6 63.0 37.0
5 to 9 years 67.0 33.0 68.8 31.2 63.2 36.8 68.4 31.6 62.9 37.1
10 to 29 years 65.0 35.0 66.7 33.3 61.6 38.4 66.6 33.4 59.9 40.1
30 years or older 63.7 36.3 65.1 34.9 60.7 39.3 64.9 35.1 60.1 39.9
Total 65.4 34.6 67.2 32.8 62.0 38.0 67.0 33.0 60.7 39.3
Source: Authors' tabulation of the Canadian Employer–Employee Dynamics Database, 2001 to 2015.
Appendix Table 2.2
Mean gender composition by firm age, 2001 to 2015
percent
Notes: Annual earnings are set to missing if they are less than the rough threshold of $18,000 (in 2012 real dollars); see text. Marital status is
categorized into union (married or common law ) and alone (separated, w idow ed, divorced or single). The children indicator divides w orkers into those
w ith children and those w ithout.
Firm age
Business sector
Among workers in a
union: married or
common law
Among alone
workers: single,
divorced or w idowed
Among workers
without children
Among workers with
children
Male
workers
Female
w orkers
Male
workers
Female
w orkers
Male
workers
Female
w orkers
Male
workers
Female
workers
Male
workers
Female
workers
1 to 4 employees 66.1 33.9 65.8 34.2 67.1 32.9 68.0 32.0 61.4 38.6
5 to 19 employees 67.1 32.9 67.7 32.3 65.8 34.2 68.9 31.1 62.0 38.0
20 to 99 employees 68.1 31.9 69.6 30.4 65.3 34.7 69.8 30.2 62.8 37.2
100 to 499 employess 67.1 32.9 69.1 30.9 63.3 36.7 68.7 31.3 62.1 37.9
500 or more employees 62.7 37.3 65.1 34.9 58.0 42.0 64.1 35.9 58.5 41.5
Total 65.5 34.5 67.2 32.8 62.0 38.0 67.0 33.0 60.7 39.3
Source: Authors' tabulation of the Canadian Employer–Employee Dynamics Database, 2001 to 2015.
percent
Appendix Table 2.3
Mean gender composition by firm size, 2001 to 2015
Notes: Annual earnings are set to missing if they are less than the rough threshold of $18,000 (in 2012 real dollars); see text. Marital status is categorized
into union (married or common law ) and alone (separated, w idow ed, divorced or single). The children indicator divides w orkers into those w ith children and
those w ithout.
Firm size
Business sector
Among w orkers in a
union: married or
common law
Among alone
w orkers: single,
divorced or w idowed
Among workers
w ithout children
Among w orkers with
children

Analytical Studies Branch— Research Paper Series - 33 - Statistics Canada—Catalogue no. 11F0019M, no. 456
References
Abowd, J., R.H. Creecy, and F. Kramarz. 2002. Computing Person and Firm Effects Using Linked Longitudinal Employer-employee Data. Longitudinal Employer-Household Dynamics Technical Papers. Center for Economic Studies, U.S. Census Bureau.
Abowd, J., P.A. Lengermann, and K. McKinney. 2003. The Measurement of Human Capital in the U.S. Economy. Longitudinal Employer-Household Dynamics Technical Papers. Center for Economic Studies, U.S. Census Bureau.
Abowd, J.M., F. Kramarz, and D.N. Margolis. 1999. “High wage workers and high wage firms.” Econometrica 67 (2): 251–333.
Andrews, M.J., L. Gill, T. Schank, and R. Upward. 2008. “High wage workers and low wage firms: Negative assortative matching or limited mobility bias?” Journal of the Royal Statistical Society: Series A 171 (3): 673–697.
Angelov, N., P. Johansson, and E. Lindahl. 2016. “Parenthood and the gender gap in pay.” Journal of Labor Economics 34 (3): 545–579.
Baker, M., D. Benjamin, A. Desaulniers, and M. Grant. 1995. “The distribution of the male/female earnings differential, 1970-1990.” Canadian Journal of Economics 28 (3): 479–501.
Baker, M., and M. Drolet. 2010. “A new view of the male/female pay gap.” Canadian Public Policy36 (4): 429–464.
Baker, M., and N.M. Fortin. 2004. “Comparable worth in a decentralized labour market: The case of Ontario.” Canadian Journal of Economics 37 (4): 850–878.
Baker, M., J. Gruber, and K. Milligan. 2008. “Universal child care, maternal labor supply, and family well-being.” Journal of Political Economy 116 (4): 709–745.
Baker, M., and K. Milligan. 2008a. “How does job-protected maternity leave affect mothers’ employment?” Journal of Labor Economics 26 (4): 655–691.
Baker, M., and K. Milligan. 2008b. “Maternal employment, breastfeeding, and health: Evidence from maternity leave mandates.” Journal of Health Economics 27 (4): 871–887.
Bonhomme, S., K. Holzheu, T. Lamadon, E. Manresa, M. Mogstad, and B. Setzler. 2020. How Much Should We Trust Estimates of Firm Effects and Worker Sorting? NBER Working Paper Series, no. 27368. Cambridge, Massachusetts: National Bureau of Economic Research.
Boudarbat, B., and M. Connolly. 2013. “The gender wage gap among recent postsecondary graduates in Canada: A distributional approach.” Canadian Journal of Economics 46 (3): 1037–1065.
Bruns, B. 2019. “Changes in workplace heterogeneity and how they widen the gender wage gap.” American Economic Journal: Applied Economics 11 (2): 74–113.
Card, D., A.R. Cardoso, and P. Kline. 2016. “Bargaining, sorting, and the gender wage gap: Quantifying the impact of firms on the relative pay of women.” The Quarterly Journal of Economics131 (2): 633–686.
Casarico, A., and S. Lattanzio. 2019. What Firms Do: Gender Inequality in Linked Employer-employee Data. Cambridge Working Papers in Economics, no. 1966. Cambridge: University of Cambridge.

Analytical Studies Branch— Research Paper Series - 34 - Statistics Canada—Catalogue no. 11F0019M, no. 456
Chiappori, P.A., B. Fortin, and G. Lacroix. 2002. “Marriage market, divorce legislation, and household labor supply.” Journal of Political Economy 110 (1): 37–72.
Coudin, E., S. Maillard, and M. Tô. 2018. Family, Firms and the Gender Wage Gap in France. Institute for Fiscal Studies Working Papers, no. W18/01. London: The Institute for Fiscal Studies.
Cruz, G., and T. Rau. 2017. “The effects of firm pay policies and equal pay laws on the gender wage gap in Chile.” Working paper.
Dittrich, M., A. Knabe, and K. Leipold. 2014. “Gender differences in experimental wage negotiations.” Economic Inquiry 52 (2): 862–873.
Dostie, B., J. Li, D. Card, and D. Parent. 2020. Employer Policies and the Immigrant-Native Earnings Gap. NBER Working Paper Series, no. 27096. Cambridge, Massachusetts: National Bureau of Economic Research.
Drolet, M. 2002. “Can the workplace explain Canadian gender pay differentials?” Canadian Public Policy 28: S41–S63.
Drolet, M. 2011. “Why has the gender wage gap narrowed?” Perspectives on Labour and Income11 (12): 3–13.
Drolet, M., and K. Mumford. 2012. “The gender pay gap for private‐sector employees in Canada and Britain.” British Journal of Industrial Relations 50 (3): 529–553.
Galarneau, D., and E. Fecteau. 2014. The Ups and Downs of Minimum Wage. Insights on Canadian Society. Statistics Canada Catalogue no. 75-006-X. Ottawa: Statistics Canada.
Gallen, Y., R.V. Lesner, and R. Vejlin. 2019. “The labor market gender gap in Denmark: Sorting out the past 30 years.” Labour Economics 56: 58–67.
Goussé, M., and M. Leturcq. 2018. “More or less unmarried: The impact of legal settings of cohabitation on labor market outcomes.” CRREP Working Paper Series, 2018-08. Québec: Université Laval.
Javdani, M. 2015. “Glass ceilings or glass doors? The role of firms in male‐female wage disparities.” Canadian Journal of Economics 48 (2): 529–560.
Jewell, S.L., G. Razzu, and C. Singleton. 2020. “Who works for whom and the UK gender pay gap.” British Journal of Industrial Relations 58 (1): 50–81.
Kleven, H., C. Landais, J. Posch, A. Steinhauer, and J. Zweimüller. 2019. Child Penalties Across Countries: Evidence and Explanations. NBER Working Paper Series, no. 25524. Cambridge, Massachusetts: National Bureau of Economic Research.
Morissette, R., W. Picot, and Y. Lu. 2013. The Evolution of Canadian Wages Over the Last Three Decades. Analytical Studies Branch Research Paper Series, no. 347. Statistics Canada Catalogue no. 11F0019M. Ottawa: Statistics Canada.
Moyser, M. 2019. Measuring and Analyzing the Gender Pay Gap: A Conceptual and Methodological Overview. Studies on Gender and Intersecting Identities. Statistics Canada Catalogue no. 45200002. Ottawa: Statistics Canada.
Pelletier, R., M. Patterson, and M. Moyser. 2019. The Gender Wage Gap in Canada: 1998 to 2018. Labour Statistics: Research Papers. Statistics Canada Catalogue no. 75-004-X. Ottawa: Statistics Canada.

Analytical Studies Branch— Research Paper Series - 35 - Statistics Canada—Catalogue no. 11F0019M, no. 456
Schirle, T., 2015. “The gender wage gap in the Canadian provinces, 1997–2014.” Canadian Public Policy 41 (4): 309–319.
Sorkin, I. 2017. “The role of firms in gender earnings inequality: Evidence from the United States.” American Economic Review 107 (5): 384–387.
Statistics Canada. Table 14-10-0064-01 Employee wages by industry, annual. Last updated September 25, 2020. Available at: https://www150.statcan.gc.ca/t1/tbl1/en/tv.action?pid=1410006401 (accessed June 26, 2020).
Statistics Canada. Table 14-10-0327-01 Labour force characteristics by sex and detailed age group, annual. Last updated September 25, 2020. Available at:https://www150.statcan.gc.ca/t1/tbl1/en/tv.action?pid=1410032701 (accessed June 26, 2020)
Statistics Canada. Table 14-10-0062-01 Labour force survey estimates (LFS), wages of employees by type of work, National Occupational Classification for Statistics (NOC-S), sex and age group, annual. Last updated September 25, 2020. Available at: https://www150.statcan.gc.ca/t1/tbl1/en/tv.action?pid=1410006201 (accessed June 26, 2020).
Stevens, K., and S. Whelan. 2019. “Negotiating the gender wage gap.” Industrial Relations: A Journal of Economy and Society 58 (2): 141–188.
Stevenson, B. 2007. “The impact of divorce laws on marriage-specific capital.” Journal of Labor Economics 25 (1): 75–94.
Syverson, C. 2011. “What determines productivity?” Journal of Economic Literature 49 (2): 326–365.
Voena, A. 2015. “Yours, mine, and ours: Do divorce laws affect the intertemporal behavior of married couples?” American Economic Review 105 (8): 2295–2332.
Waite, S., J. Ecker, and L.E. Ross. 2019. “A systematic review and thematic synthesis of Canada’s LGBTQ2S+ employment, labour market and earnings literature.” PLOS ONE 14 (10): e0223372.
Wiswall, M., and B. Zafar. 2018. “Preference for the workplace, investment in human capital, and gender.” The Quarterly Journal of Economics 133 (1): 457–507.