Embed Size (px)
Citation preview
CEO Pay and Firm Size: an Update after the Crisis∗
Xavier Gabaix Augustin Landier Julien Sauvagnat
Abstract
In the ‘size of stakes’ view quantitatively formalised in Gabaix and Landier (2008), CEO
compensation reflects the size of firms affected by talent in a competitive market. The years
2004-2011 were not part of the initial study and offer a laboratory to examine the theory
with new positive and negative shocks. Executive compensation (measured ex ante) did
closely track the evolution of average firm value, supporting the ‘size of stakes’ view out of
sample. During 2007 - 2009, firm value decreased by 17%, and CEO pay by 28%. During
2009-2011, firm value increased by 19% and CEO pay by 22%.
Executive compensation remains very much at the center-stage of academic and policy de-
bates. A relative lack of consensus seems to prevail regarding the origins of the large rise of
executive compensation observed in the US since the 70s. According to some scholars (see e.g.
Bebchuck and Fried (2004) for a summary of this view), rising compensation is due to a higher
ability of CEOs to extract rents from shareholders, e.g. by capturing their board (Shivdasani
and Yermack, 1999) or appointing compensation consultants that cater to their interests (Mur-
phy and Sandino, 2010). Hermalin (2005) argues instead that the rise in CEO pay reflects
tighter corporate governance: pay increases to compensate CEOs for the greater risk of being
fired. Others argue that the very function of CEOs has changed over time: they are now more
often poached from outside firms than before (Murphy and Zabojnik, 2004; Frydman, 2005);
shareholders have become more convinced of the importance of financial incentives (Jensen et
al., 2004). By contrast, Gabaix and Landier (2008, henceforth GL) argue that the bulk of vari-
ations in CEO compensation across time and across companies can be explained as the result
of competitive market forces. They show that under fairly general assumptions, in a market
∗Corresponding author: Xavier Gabaix, New York University, Stern School, 44 West 4th street, New York,NY 10012. Email: [email protected]. We thank the editor, the referee and Alex Edmans for very usefulcomments.
1
where the impact of CEO talent is scaled linearly by firm size, and where matching CEOs with
firms is frictionless (as in Sattinger, 1993; Tervio, 2008), one should expect the compensation
of CEOs to follow the following formula:
w(n) = DS(n∗)β/αS(n)1−β/α (1)
where w(n) is the dollar compensation of the CEO of the nth biggest firm by decreasing size,
n∗ denotes the index of the reference firm (e.g. the 250th largest firm); α is given by the
distribution of firm size at the top: S(n) = An−α ; and β depends on the distribution of talent
at the top. GL calibrate β/α ' 2/3. In particular, this formula predicts that if all firm sizes rise
(resp. decline) over time by a factor x, compensation should rise (resp. decline) by that same
factor. We call the theory of managerial pay proposed by GL the ‘size of stakes’ view, because
it implies that as the size of large firms has increased over time, executive compensation has
increased by a similar factor, as all firms have a higher willingness to pay for talent. GL, using
data from 1970-2003, provide evidence consistent with the size of stakes view.
In this paper, we examine whether the size of stakes view of executive compensation, pro-
posed by GL, passes the test of time.1 The years 2004-2011, which include the great recession,
were not part of the initial study and provide the opportunity to run an informative ‘out-of-
sample’ assessment of the theory. During the financial crisis, the market capitalisation of large
companies was strongly negatively impacted. Between 2007 and 2009, the average firm market
total value of the largest 500 US firms decreased by 17.4%, which represents the largest two-year
drop over the last forty years. This offers an exceptional laboratory to potentially reject the
size of stakes view, which predicts that changes in average CEO compensation in the largest
firms should follow the changes in the average size of these firms. In line with the theory, we
do find that executive compensation at the top did closely track the evolution of average firm
value during those years. The recent data thus tend to be supportive of the equilibrium model
developed in GL; the estimates that we find for β/α are very close to those of our original
study and we confirm the constant linear scaling of talent impact with size. Note that what is
particularly non-trivial is the one-to-one relationship between firm size and CEO pay.
Our focus on the years 2004-2011 is also motivated by a number of recent developments
1Of course, any short time sample does not allow to accept or reject a theory. It simply updates a Bayesianestimate of its predictive power.
2
that affected CEO pay practises, potentially ‘distorting’ the economic link between CEO pay
and firm size identified in GL.2 In 2004, the end of ‘free’ accounting for stock options has been
followed by a shift toward restricted stock and then, toward the use of performance-based vest-
ing conditions in equity grants (see Bettis et al., 2012). In 2006, the SEC promulgated new
executive pay disclosure rules. Those rules required the disclosure of compensation consultants,
which has potentially affected the incentives of a key player in the pay-setting process (Mur-
phy and Sandino, 2010; Cadman et al., 2010). They also required the disclosure of peers used
for benchmarking compensation, another key driver of pay levels (Faulkender and Yang, 2013;
Albuquerque et al., forth; and Bizjak et al., 2011). Moreover, after the Enron-type scandals
and the burst of the dotcom bubble, there has been a ‘change in sentiment’ over the useful-
ness of option-based pay – also related to the option backdating scandal – and an increase
in compensation-related shareholder activism through shareholder proposals and vote-no cam-
paigns against compensation committee members (Ertimur et al., 2011). As a result of the
above activism, the mandatory adoption of ‘say on pay’ in 2011 leads firms to change their pay
practises both before and after the vote, in an attempt to obtain a favourable voting outcome
(Ertimur et al., 2013; Larcker et al., 2012). Finally, incentive pay has been viewed as a potential
reason for the excessive risk-taking underlying the financial crisis.
To evaluate the theory, we update the two compensation indices used in GL: between 1980
and 2011, the Jensen - Murphy - Wruck (JMW) compensation index increased by 569% while
the Frydman - Saks (FS) compensation index increased by 341% (here, as everywhere in this
article, increases are in real, inflation-adjusted quantities). By taking the average, we obtain
a rise in CEO pay of 405%. In the same period, the average firm market value of the largest
500 US firms increased by 425% while the average equity value of the largest 500 US firms (in
terms of equity value) increased by 467%. Thus the evidence supports the broadly proportional
evolution of pay and firm size in the period 1980-2011.
Interestingly, over the recent period 2004 - 2011, firm size successively sharply dropped and
then rebounded. This offers a fairly strong test for the size of stakes view. According to this
view, proportional changes in compensation should be observed as markets drop and rebound.
We find that movements in CEO compensation did indeed closely track movements in firm
size: over 2007-2009, average total firm values decreased by 17.4%, equity values by 37.9%, and
2Special thanks to the referee for suggesting to us these arguments.
3
compensation indices by 27.7%. During 2009-2011, we observe a rebound of firm values by 19%,
equity values by 27%, and compensation indices by 22%.
We want to highlight that the size of stakes view does not hinge on the fact that stock-
markets are perfectly efficient. Even if market values were a poor proxy for fundamental values
of firms, the market view developed in GL still applies; it states that the market for talents
and the market for assets are deeply intertwined. If shareholders overvalue asset prices, it is
a natural market outcome that talent be overvalued by the same factor (this is because in a
frictionless framework, shareholders, who are the owners of assets, also have control over hiring
decisions). If they overvalue assets, they will exhibit a higher than normal willingness to pay
for talent.
It is difficult to assess whether the recent years, that are the focus of the present study, are
compatible with the ‘rent-extraction view’ of compensation. Indeed without a specific form for
the ‘stealing technology’ used by managers, it is not possible to predict how rents should vary
over time. If one believes that the ‘outrage constraint’ faced by managers is tighter in downturns
(see Bebchuk and Grinstein, 2005), then one should expect rents to fall as aggregate market
performance is negative, but it is hard to know by what factor. By contrast, our prediction that
pay in the largest firms should change over time in the same proportions as the size of large
firms is easy to reject.
Our results are very much in line with Kaplan (2012), who documents that the ratio of
average CEO pay to average firm market capitalisation has been constant over time since 1960.
Kaplan (2012) uses market capitalisation whereas our benchmark approach uses total firm value
(i.e. debt plus equity market value). We revisit whether total firm value is a better proxy for firm
size in our theory than other measures of size such as market capitalisation or sales. Total firm
value (debt+equity) yields estimates that are theoretically more appealing (as it is independent
of leverage choice), but pure equity has a good explanatory power, especially for short-term
movements (see Figure 1). Perhaps firms that are riskier and that have more upside potential
choose to have less debt (to avoid bankruptcy costs). Then, equity is likely to be a better proxy
than debt+equity for how much a CEO can impact the firm.
4
1. Data Description
We incorporate the recent period in the regressions and graphs presented in GL. For this, we
follow the methodology of GL. However, there are two noteworthy differences. First, we restrict
our attention to US-based firms. The original study took all firms in Compustat. However,
since Compustat has been including many more foreign firms, an additional filtering is in order.
Second, the procedure followed to construct total firm value in GL unwittingly excluded some
banks because the item Deferred Taxes is often missing in Compustat for these firms.3 As shown
below, we thus set deferred taxes to 0 when missing before computing total firm value. As a
novelty with respect to GL, prompted by interesting results in Kaplan (2012), we introduce
equity market value as an alternative measure of firm size. We first describe in details the data,
and then present the results.
1.1. Datasets
We use two datasets. Execucomp provides us with data on CEO compensation. Regressions
presented in this paper were performed with Execucomp data extracted from WRDS in Septem-
ber 2012. We use Compustat to retrieve information on the size of US-based firms. US-based
companies are identified with Compustat variable FIC.
CEO Compensation. The Execucomp panel provides data on compensation of the five
best paid executives of the largest US firms from 1992. We identify the CEO of each firm-year in
Execucomp with the dummy variable CEOANN. However, using the CEOANN variable, some
firm-year observations have no CEO in Execucomp. We are however able in some cases to infer
the CEO’s identity from the BECAMECEO variable indicating the date at which the individual
became CEO. Specifically, when the CEOANN variable indicates no CEOs for a given firm-year,
we consider an executive as the CEO of the firm in year t when (i) the BECAMECEO variable
indicates that the executive was appointed as the CEO in year t or before and (ii) the dummy
variable CEOANN indicates the executive as the CEO of the firm in year t+ 1 or after.
CEO compensation is then measured with Execucomp variable, TDC1, which includes
salary, bonus, restricted stock granted and the Black-Scholes value of stock-options granted.
3This effect was noted by Nagel (2010). We obtain very similar results in what follows when Deferred Taxesare excluded from the computation of total firm value.
5
Finally, CEO compensation is converted into 2000 constant dollars using the GDP deflator of
the Bureau of Economic Analysis.
Firm size. We will use different proxies for firm size, namely total firm value, earnings
before interest and taxes, sales and equity value. We construct these variables from Compustat.
Total firm value is the sum of the market value of equity, defined as number of shares outstanding
(item CSHO) multiplied by the end-of-fiscal-year stock price (item PRCC F), and the book value
of debt, defined as total assets (item AT) minus the sum of book value of equity (item CEQ)
and deferred taxes (item TXDB); we set deferred taxes to 0 when missing. Earnings before
interest and taxes is (item OIBDP-item DP). Sales is measured with Compustat item SALE.
Equity value is (item CSHO*item PRCC F). All quantities are converted into 2000 constant
dollars using the GDP deflator of the Bureau of Economic Analysis. Finally, we construct the
48 Fama-French industry dummies from the conversion table in the Appendix of Fama and
French (1997) using the firm’s 4 digit SIC industry code.
1.2. Compensation Indices
To evaluate changes in CEO pay over the long run, we rely on the same compensation indices
used in GL, namely the JMW and FS compensation indices.
The FS compensation index is based on Frydman and Saks (2010). Total Compensation
is the sum of salaries, bonuses, long-term incentive payments, and the Black-Scholes value of
options granted. The data are based on the three highest-paid officers in the largest 50 firms
in 1940, 1960, and 1990. The data appendix in Frydman and Saks (2010) provides detailed
information on the sample selection.
The JMW Compensation Index is based on the data of Jensen et al. (2004). Their sample
encompasses all CEOs included in the S&P 500, using data from Forbes and ExecuComp. CEO
total pay includes cash pay, restricted stock, payouts from long-term pay programs, and the
value of stock options granted from 1992 onward using ExecuComp’s modified Black-Scholes
approach. Compensation prior to 1978 excludes option grants and is computed between 1978
and 1991 using the amounts realised from exercising stock options.
Reproducing Figure 1 and Table III of GL for the period 1970 - 2011 requires extending
both compensation indices over the recent period, i.e. 2004 - 2011. We proceed in the following
6
way: for every year between 2005 and 2011, the FS compensation index (respectively, the
JMW compensation index) in year t equals the FS compensation index (respectively, the JMW
compensation index) in year t − 1 times the annual percentage increase in the mean CEO
compensation of the largest 500 US-based firms.
Specifically, we first rank for every fiscal year between 2005 and 2011 US-based companies in
terms of total firm value, computed at the end of the previous fiscal year. For every year between
2005 and 2011, we then merge Compustat and Execucomp with the GVKEY identifier and keep
the largest 500 US companies for which we can retrieve CEO compensation in Execucomp. We
use the procedure mentioned above to identify CEOs in Execucomp. Before computing the
annual percentage increase in the mean CEO compensation, we deflate it using the Bureau of
Economic Analysis GDP Deflator.
Figure 1 compares the evolution of CEO pay and firm size over the period 1970-2011. We
again restrict our attention to firms with non-missing information on CEO pay in Execucomp
when computing the average market total value of the largest 500 US-based firms between 1992
and 2011. Before 1992 (the earliest date for the Execucomp database), we simply compute the
average market total value of the largest 500 US-based firms present in Compustat. Finally,
using a symmetric procedure, we compute the average equity value of the largest 500 US-based
firms in terms of equity value. After 1992, as above, we again exclude firms for which Execucomp
does not provide information on CEO compensation.
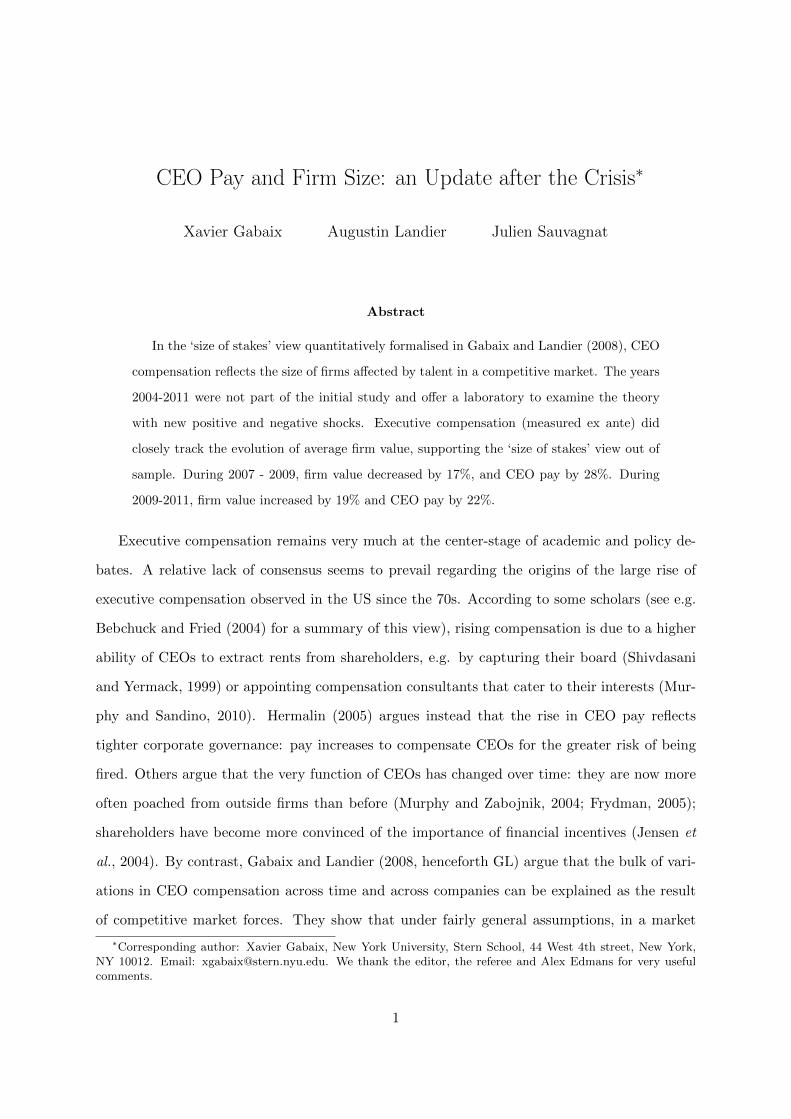
Figure 2 plots the firm size distribution confirming a fat-tailed distribution of firms, consis-
tent with a Zipf’s law for firm size (Simon, 1955; Gabaix, 1999; Axtell, 2001; Luttmer, 2007),
here firm size being firm total market value rather than the usual ‘size’ expressed by number of
employees.
2. Results
2.1. CEO Pay and Proxies For Firm Size
As in GL, we first consider three proxies for firm size - namely total firm value, earnings before
interest and taxes (EBIT) and sales. We then regress the logarithms of CEO compensation of
the largest 1000 US-based companies in terms of firm value on the logarithms of the different
7
size proxies, controlling for year and industry.4
[Table 1 here]
In the GL model, the most relevant measure for size depends on the nature of the CEO’s
job. If the impact of the talent of the CEO hired for year t is to induce a temporary shock on
productivity (e.g. via leadership) or sales (e.g. via better marketing), then size can be measured
by sales or earnings during that year. However, if one believes that the impact of the CEO hired
at time t is long-lasting and affects all future profits, then, the relevant measure of size is the
net present value of future profits, i.e. firm total market value (i.e. the value of its debt and
its equity). This view is coherent if one believes that an important role of the CEO is to take
strategic decisions that affect the future growth path of the firm, to implement technological (or
organisational) innovations that push the firm’s product line (or productivity) to a new level
(and thus affect all future generations of products (resp. profits)). Such view of the CEO’s job
could be for instance formalised in a vertical quality ladder model of innovation a la Aghion-
Howitt, in which a new innovation permanently impacts productivity. In addition, the full firm
value is a measure of size that is neutral to the choice of capital structure: the impact of a CEO
should not depend directly on whether the firm is financed with debt or equity. We include
results with equity value as a proxy of size because it is a popular measure of firm size – it is
used notably by Kaplan (2012). A possible rationale for using equity value, rather than full
firm value (equity + debt) may be as follows. It involves a theory of the capital structure;
debt largely reflects the ‘safe’ assets of the firm, whose value the CEO does not directly affect
– because those safe assets back debt, while equity reflects the ‘risky assets’, which the CEO
does affect.
Table 1 presents the results. The three size proxies have positive and significant coefficients
when used together to predict compensation (column (1)). Moreover, as shown in columns (2)
to (4), total market value, EBIT and sales have similar predictive power when used alone to
predict compensation, as can be seen by comparing R2, with a slight edge for firm value. In
column (5), we introduce equity value as an alternative measure of firm size. Again, equity
4Note that the selection criterion is not the same as in GL, where CEO compensation of the 1000 highestpaid CEOs is regressed on the size proxies each year. Running the regression for the largest 1000 US firms ismotivated by the fact that in GL theory, firm size is a more exogenous object than CEO pay.
8
value turns out to be a valid proxy for firm size.
2.2. Panel Evidence, 1992 - 2011
As in GL, we estimate:
ln(wi,t) = d+ e× ln(Sn∗,t−1) + f × ln(Si,t−1) (2)
where wi,t is CEO compensation in firm i and year t, Sn∗=250,t−1 is market total value of the
firm number n∗ = 250 in the sample at the end of fiscal year t − 1 and Si,t−1 is firm i total
market value. We cluster standard errors at either the firm level or at the year level. The
sample consists of either the top 500 or top 1000 US-based companies in terms of firm value
for which we can retrieve CEO compensation in Execucomp (using the procedure mentioned
above). The sample period is from 1992 to 2011.
[Table 2 here]
Columns (1) to (3) (respectively columns (4) to (6)) in Table 2 present the results for the
largest 1000 (respectively 500) US firms. Columns (2) and (4) include industry fixed effects
while columns (3) and (6) include firm fixed effects. The results obtained over the sample
period 1992 - 2011 remain consistent with the size of stakes theory. For all specifications, the
coefficients (and standard errors) are similar to those in GL. Moreover, p values for the null
hypothesis that e + f = 1 are above 0.1 in specifications (1), (2) and (5), which is consistent
with the constant returns to scale hypothesis in firm size.
[Table 3 here]
Then, we reestimate equation 2 using equity value as an alternative proxy for size. Specifi-
cally, wi,t is CEO compensation in firm i and year t, Sn∗=250,t−1 is market equity value of the
firm number n∗ = 250 (in terms of market equity value) in the sample at the end of fiscal year
t − 1 and Si,t−1 is firm i market equity value. Taken together, regression results presented in
Table 3 are also consistent with the constant returns to scale hypothesis in firm size.
9
2.3. Times-Series US Evidence, 1971 - 2011
Figure 1 shows the evolution of CEO pay and firm size for the largest US-based firms between
1971 and 2011.
[Figure 1 here]
Between 1980 and 2011, the JMW compensation index has increased by 569% while the FS
compensation index has increased by 341%. By taking the average, we obtain a rise in CEO
pay of 405%. In the same period, the average firm market value of the largest 500 US firms has
increased by 425% while the average equity value of the largest 500 US firms (in terms of equity
value) has increased by 467%. Thus the evidence supports the broadly proportional evolution
of pay and firm size in the period 1980-2011. Note that since the levels of compensation reflect
dollar values on an ex-ante basis (e.g. values of stock-options are evaluated at time granted, as
opposed to time exercised), there is no hard wired link between compensation and stock-market
values.
[Table 4 here]
As shown in Table 4, over the recent period 2004 - 2011, movements in CEO compensation
closely follow movements in firm size. In particular, CEO pay and firm size have both decreased
during the crisis (2007 - 2009): average total firm values decreased by 17.4%, equity values by
37.9%, and compensation indices by 27.7%. During 2009-2011, we observe a rebound of firm
values by 19%, equity values by 27%, and compensation indices by 22%. We see these fairly
proportional changes over successive episodes of market drops and market rebound as a strong
validity test for the size of stakes view.
It is important to notice that the size of stakes view does not hinge on the fact that stock-
markets be perfectly efficient. Even if market values were a poor proxy for fundamental values
of firms, the market view developed in GL still applies; it states that the market for talents
and the market for assets are deeply intertwined. If shareholders overvalue asset prices, it is a
10
natural market outcome that talent be overvalued by the same factor (this is because in our
frictionless framework shareholders have control over hiring decisions).
As in GL, we estimate:
∆t(ln wt) = γ ×∆tln S∗,t−1 (3)
where w is either the JMW index or the FS index and S∗ is the mean firm total value of the
top 500 largest US-based firms. Again, we restrict our attention to US-based firms for which
we can retrieve CEO compensation in Execucomp. The sample period is 1971-2011.
[Table 5 here]
GL find estimates γ = 1.14 using the JMW compensation index and γ = 0.87 using FS
compensation index over the period 1971 - 2003. As shown in Table 5, we find extremely close
estimates between 1971 and 2011: γ = 1.01 using the JMW compensation index and γ = 0.82
using FS compensation index.
[Table 6 here]
Table 6 presents the result of the estimation of equation 3 when S∗ is the mean firm equity
value of the top 500 largest US-based firms in terms of equity value. The fit is rather less
good. This may be because the method puts all the weight on the contemporaneous changes in
firm size and pay. Of course, while the economics predicts that pay will track size one-for-one,
there could be some delay in that relation. Kaplan (2012) has proposed a graphical devise that
captures the medium-frequency relation between pay and size (represented by firms size) better
than regression (3). Interestingly, he finds good support for a stable ratio between average pay
and average firm size since 1960.
11
2.4. Application of the Model to non-CEO Executives
We see the GL model as particularly adapted to studying CEO pay because the top job in
a firm clearly has firm-wide implications: this makes the hypothesis that the impact of CEO
talent increases in firm size particularly natural. The question of how the impact of other
high-paid executives depends on firm size is highly interesting but opens several debates on
the production function of these executives: the relevant size variable for the impact of non-
CEO talent might be that of a division that the executive is managing; in the cross-section, it
might be that some positions that are held by a single individual in small firms are transformed
into two distinct positions in larger firms; last, in the time-series, organisational trends might
have changed the composition of the executive suite, such as the elimination of intermediate
hierarchical layers (e.g. the elimination of the COO function in many firms: see Rajan and
Wulf, 2006). But, beyond these caveats, we find that estimating the GL model on non-CEO
executives is an interesting and natural empirical question. Thus, we provide a version of our
benchmark regression on non-CEO executives (see Tables 7 and 8 below). To do this, we simply
compute for each firm the average non-CEO compensation as reported in execucomp; we use the
same definitions of compensation and market value as those used in the CEO comp regressions.
We find results that are highly similar to those on CEOs: in particular, we do not reject the
fact that the sum of coefficients on firm total value and reference firm value is one. In the time
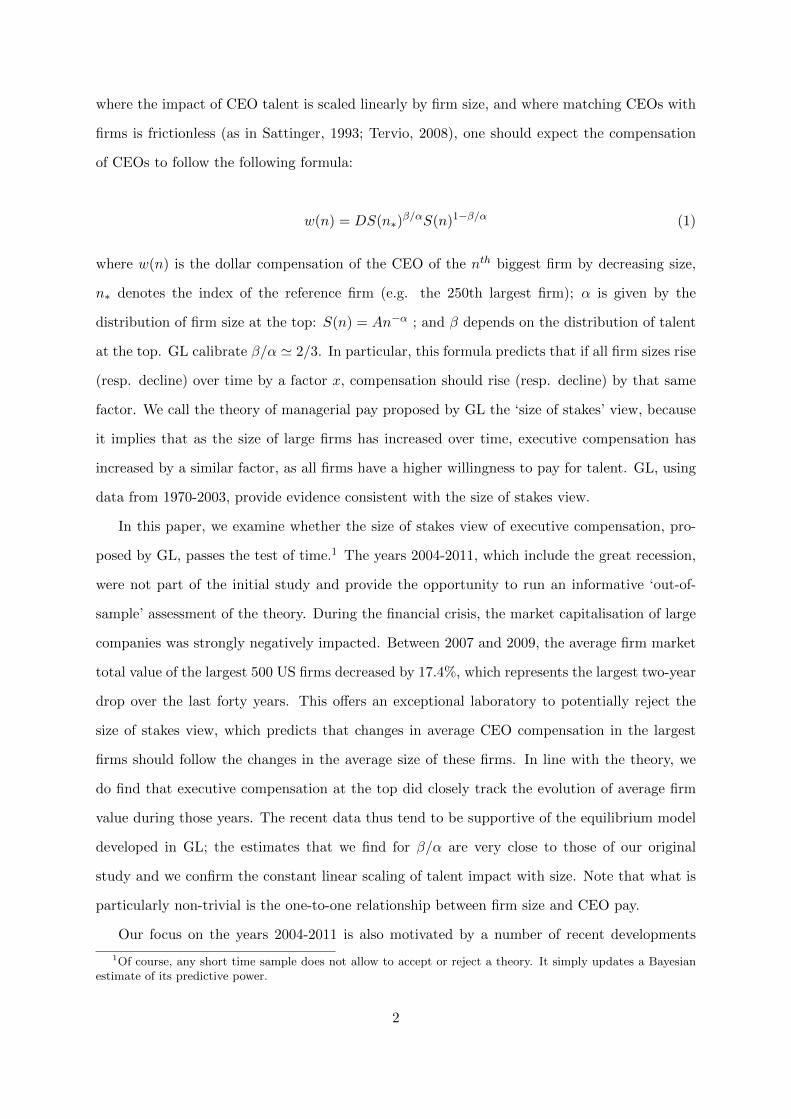
series, it turns out that non-CEO pay has followed an evolution strikingly similar to that of
CEO pay: between 1992 (which is the first year in Execucomp) and 2011, it has increased by a
factor of 2.5, while CEO pay has increased by a factor of 3 (see Figure 3). These results suggest
that the GL model can be used to describe the market of non-CEO executives.
2.5. Robustness Checks
In the online appendix, we present robustness checks of the regression results in Tables 2 and
3.5
5We thank the referee for suggesting to us these robustness checks.
12
2.5.1. Sticky equity awards
Some firms follow a ‘fixed number’ policy for the design of the CEO long term incentive plan
(see e.g. Hall, 1999) – i.e, the same number of, say, options is granted to the CEO over a certain
number of years. For these firms, an increase in the stock price mechanically increases the value
of equity grants. Accordingly, part of the association between CEO pay and firm size presented
in Table 2 might be ‘mechanical’. We address this concern by excluding the observations for
which we suspect the presence of a ‘fixed number’ policy. For this, we look at the number
of options (execucomp variable OPTION AWARDS NUM), the number of performance shares
(execucomp variable SHRTARG in the pre-2006 format, and EQ TARG in the new format),
and the number of shares granted under non-performance-based plans (execucomp variable
SHARES GRT, available only from 2006) to capture ‘fixed number’ policies.
Specifically, we exclude from the estimation of equation 2 the observations for which the
number of options (respectively performance shares, shares granted under non-performance-
based plans) granted to the CEO in year t is positive and the same as in year t−1. This criterion
excludes around 9% of the observations. As shown in Tables B1 and B2, the coefficients remain
very similar to those in Tables 2 and 3.
2.5.2. Changes in the definition of TDC1
Execucomp changed in 2006 the definition of TDC1 to reflect new reporting rules mandated
by the SEC. FAS 123 (R) required equity compensation to be based on the ex ante value of
the awards. In the pre-2006 format, the execucomp variable TDC1 included the ex post value
of performance shares. To deal with this problem, we follow Walker (2011) and construct a
consistent definition of CEO pay over the whole sample period: when measured in its pre-2006
format, we subtract from TDC1 the amount paid under the company’s long-term incentive plan
(execucomp variable LTIP). We then add the ex ante value of performance shares by multiplying
the target number of performance shares granted (execucomp variable SHRTARG) by the stock
price at the end of the fiscal year. When missing, the variable SHRTARG is replaced by 0.6
Tables B3 and B4 reproduce the regressions presented in Tables 2 and 3 when TDC1 is
adjusted as mentioned above. Again, the coefficients turn out to be very similar.
6Unfortunately, the variable SHRTARG is often missing. We thus do not know whether this adjustmentintroduces more or less bias in the estimation of equation 2.
13
3. Conclusion and Some Open Questions
The crisis offered new events to see the reaction of compensation to firm size, and the GL theory
appears to pass the test. We wish to highlight that there are still many things about this view
to explore, enrich, or perhaps correct. For instance, behavioral factors in the perception of
CEO talent could be important (Malmendier and Tate, 2009). Because of this possibility, GL
works out how contagion effects could potentially strongly affect CEO pay. Bereskin and Cicero
(2013) present some evidence in support of that effect.
On the theoretical side, it would be good to extend the model to incentives (see Edmans,
Gabaix and Landier (2009) and Edmans and Gabaix (2011) for static models that integrate well
with GL, and Dittmann et al. (2010) for a behavioral approach), in particular with dynamic
incentives and CEO turnover (see Jenter and Kanaan, forth; Eisfeldt and Kuhnen, 2012). This
remains difficult, though perhaps within reach.
Also, integrating the CEO market with other talent markets (as in Kaplan and Rauh (2010)
and the spirit of Rosen (1981)) would be good. Conceptually, we would expect some integration
with the market for CEO of private companies and for hedge fund managers, for instance. It is
likely that studying this integration might shed light on the increase in inequality, particularly
with the rise of top incomes (Piketty and Saez, 2003; Lemieux et al., 2009). In that respect,
relatedly, progress in the measurement of ‘talent’ and ‘CEO skill’ is encouraging (Bertrand and
Schoar, 2003; Falato et al., 2012; Bennedsen et al., 2012; Custodio et al., forth.).
Kaplan (2012), building on Frydman and Saks (2010), finds that the GL theory works well
in the 1960-2010 sample, but less so before. Why is that? One reason is that stock market
values were depressed, so perhaps the full firm value (debt + equity) was higher than pure
equity (which is what Kaplan (2012) uses). Another important under-researched channel is the
supply of skills. One possibility that would be reasonably researchable would be that the supply
of skills was lower before 1960 (perhaps because of technology, GI bill etc.), and that supply of
MBA and college graduates increased after World War II. That hypothesis seems researchable
as more data becomes available (Goldin and Katz, 2008).
Finally, as many countries now have started forcing the disclosure of pay, investigating pay
in those countries seems both doable and informative.
14
A. Summary of Gabaix and Landier (2008)
We summarise the GL model here, paraphrasing in part earlier expositions in GL and Edmans
et al. (2009).
A continuum of firms and potential managers are matched together. Firm n ∈ [0, N ] has
size S (n) and manager m ∈ [0, N ] has talent T (m). Low n denotes a larger firm and low m
a more talented manager: S′ (n) < 0, T ′ (m) < 0. n (m) can be thought of as the rank of the
manager (firm), or a number proportional to it, such as its quantile of rank.
We consider the problem faced by one particular firm. The firm has a ‘baseline’ value of
S. At t = 0, it hires a manager of talent T for one period. The manager’s talent increases the
firm’s value according to
S′ = S + CTSγ , (A.1)
where C parameterises the productivity of talent. If large firms are more difficult to change
than small firms, then γ < 1. If γ = 1, the model exhibits constant returns to scale (CRS) with
respect to firm size.
Let w (m) denote the equilibrium compensation of a CEO with index m. Firm n, taking the
market compensation of CEOs as given, selects manager m to maximise its value net of wages:
maxm
CS (n)γ T (m)− w (m) . (A.2)
The competitive equilibrium involves positive assortative matching, i.e. m = n, and so
w′ (n) = CS (n)γ T ′ (n). Let wN denote the reservation wage of the least talented CEO (n = N).
Hence we obtain the classic assignment equation (Sattinger, 1993; Tervio, 2007):
w (n) = −∫ N
nCS (u)γ T ′ (u) du+ wN . (A.3)
Specific functional forms are required to proceed further. We assume a Pareto firm size
distribution with exponent 1/α: S (n) = An−α. Using results from extreme value theory, GL
use the following asymptotic value for the spacings of the talent distribution: T ′ (n) = −Bnβ−1.
These functional forms give the wage equation in closed form, taking the limit as n/N → 0:
15
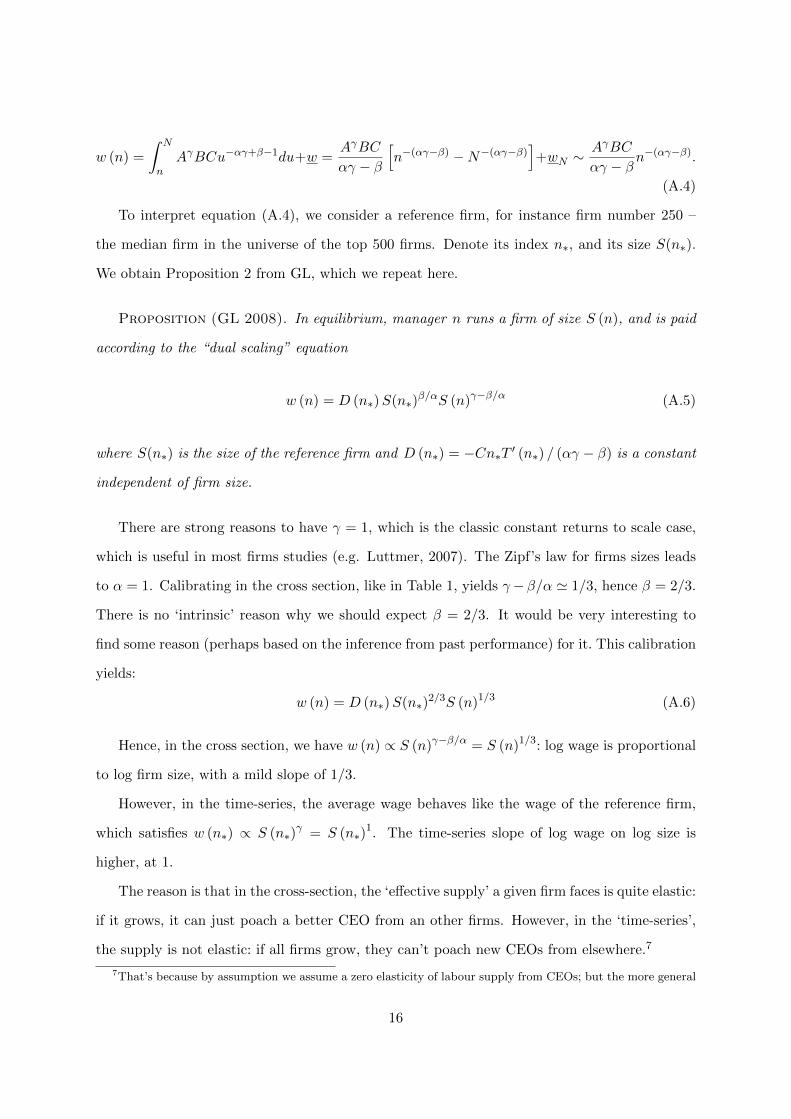
w (n) =
∫ N
nAγBCu−αγ+β−1du+w =
AγBC
αγ − β
[n−(αγ−β) −N−(αγ−β)
]+wN ∼
AγBC
αγ − βn−(αγ−β).
(A.4)
To interpret equation (A.4), we consider a reference firm, for instance firm number 250 –
the median firm in the universe of the top 500 firms. Denote its index n∗, and its size S(n∗).
We obtain Proposition 2 from GL, which we repeat here.
Proposition (GL 2008). In equilibrium, manager n runs a firm of size S (n), and is paid
according to the “dual scaling” equation
w (n) = D (n∗)S(n∗)β/αS (n)γ−β/α (A.5)
where S(n∗) is the size of the reference firm and D (n∗) = −Cn∗T ′ (n∗) / (αγ − β) is a constant
independent of firm size.
There are strong reasons to have γ = 1, which is the classic constant returns to scale case,
which is useful in most firms studies (e.g. Luttmer, 2007). The Zipf’s law for firms sizes leads
to α = 1. Calibrating in the cross section, like in Table 1, yields γ−β/α ' 1/3, hence β = 2/3.
There is no ‘intrinsic’ reason why we should expect β = 2/3. It would be very interesting to
find some reason (perhaps based on the inference from past performance) for it. This calibration
yields:
w (n) = D (n∗)S(n∗)2/3S (n)1/3 (A.6)
Hence, in the cross section, we have w (n) ∝ S (n)γ−β/α = S (n)1/3: log wage is proportional
to log firm size, with a mild slope of 1/3.
However, in the time-series, the average wage behaves like the wage of the reference firm,
which satisfies w (n∗) ∝ S (n∗)γ = S (n∗)
1. The time-series slope of log wage on log size is
higher, at 1.
The reason is that in the cross-section, the ‘effective supply’ a given firm faces is quite elastic:
if it grows, it can just poach a better CEO from an other firms. However, in the ‘time-series’,
the supply is not elastic: if all firms grow, they can’t poach new CEOs from elsewhere.7
7That’s because by assumption we assume a zero elasticity of labour supply from CEOs; but the more general
16
Stern School of Business, CEPR and NBER
Toulouse School of Economics
Toulouse School of Economics and ENSAE-CREST
Submitted: 9 October 2012
Accepted: 2 August 2013
References
Albuquerque, A., De Franco, G. and Verdi, R.S. (forth.). ‘Peer choice in CEO compensation’,
Journal of Financial Economics.
Axtell, R. (2001). ‘Zipf Distribution of U.S. Firm Sizes’, Science, vol. 293, pp. 1818-20.
Bebchuk, L. and Fried, J. (2004). Pay without Performance: The Unfulfilled Promise of
Executive Compensation’, Cambridge, MA: Harvard University Press.
Bebchuk, L. and Grinstein, Y. (2005). ‘The growth of executive pay’, Oxf. Rev. Econ.
Policy, vol. 21, pp. 283-303.
Bennedsen, M., Nielsen, K., Perez-Gonzalez, F. and Wolfenzon, D. (2012). ‘Do CEOs
matter?’, Working Paper, Stanford.
Bereskin, F. and Cicero, D. (2013). ‘CEO Compensation Contagion: Evidence from an
Exogenous Shock’, Journal of Financial Economics, vol. 107(2), pp. 477-493.
Bertrand, M. and Schoar, A. (2003). ‘Managing With Style: The Effect Of Managers On
Firm Policies’, Quarterly Journal of Economics, vol. 118(4), pp. 1169-1208.
Bettis, J.C., Bizjak J., Coles J. and Kalpathy, S. (2012). ‘Performance-Vesting Provisions
in Executive Compensation’, Working Paper.
point of a higher elasticity in the cross-section than in the time-series is generally valid.
17
Bizjak, J., Lemmon, M.L. and Nguyen, T. (2011). ‘Are All CEOs Above Average: An
Empirical Examination of Compensation Peer Groups and Pay Design’, Journal of Financial
Economics, vol. 100(3), pp. 538-555.
Cadman, B., Carter, M.E. and Hillegeist, S. (2010). ‘The incentives of compensation con-
sultants and CEO pay’, Journal of Accounting and Economics, vol. 49(3), pp. 263-280.
Custodio, C., Ferreira, M. and Matos, P. (forth). ‘Generalists Versus Specialists: Lifetime
Work Experience and CEO Pay’, Journal of Financial Economics.
Dittmann, I., Maug, M. and Spalt, O. (2010). ‘Sticks or carrots? Optimal CEO compensa-
tion when managers are loss-averse’, Journal of Finance, vol. 65, pp. 2015-2050.
Edmans, A., Gabaix, X. and Landier, A. (2009). ‘A Multiplicative Model of Optimal CEO
Incentives in Market Equilibrium’, Review of Financial Studies, vol. 22(12), pp. 4881–4917.
Edmans, A. and Gabaix X. (2011). ‘The Effect of Risk on the CEO Market’, Review of
Financial Studies, vol. 24(8), pp. 2822–2863.
Eisfeldt, A. and Kuhnen, C. (2012). ‘CEO turnover in a competitive assignment framework’,
Working Paper, UCLA.
Ertimur, Y., Ferri, F. and Muslu, V. (2011). ‘Shareholder Activism and CEO Pay’, Review
of Financial Studies, vol. 24(2), pp. 535–592.
Ertimur, Y., Ferri, F. and Oesch, D. (2013). ‘Shareholder Votes and Proxy Advisors: Evi-
dence from Say on Pay’, Working Paper.
Falato, A., Li, D. and Milbourn, T. (2012). ‘Which Skills Matter in the Market for CEOs?
Evidence from Pay for CEO Credentials’, Working Paper, Federal Reserve Board.
Fama, E. and French, K. (1997). ‘Industry Costs of Equity’, Journal of Financial Economics,
vol. 43(2), pp. 153-193.
Faulkender, M. and Yang, J. (2013). ‘Is Disclosure an Effective Cleansing Mechanism? The
Dynamics of Compensation Peer Benchmarking’, Review of Financial Studies, vol. 26(3), pp.
806-839.
18
Frydman, C. (2005). ‘Rising Through the Ranks. The Evolution of the Market for Corporate
Executives, 1936-2003’, Working Paper.
Frydman, C. and Saks, R. (2010). ‘Executive Compensation: A New View from a Long-
Term Perspective, 1936-2005’, Review of Financial Studies, vol. 23(5), pp. 2099–2138.
Gabaix, X. (1999). ‘Zipf’s Law for Cities: An Explanation’, Quarterly Journal of Economics,
vol. 114(3), pp. 739-67.
Gabaix, X. and Landier, A. (2008). ‘Why Has CEO Pay Increased So Much?’, Quaterly
Journal of Economics, vol. 121(1), pp. 49-100.
Gabaix, X. and Ibragimov, R. (2011). ‘Rank-1/2: A Simple Way to Improve the OLS
Estimation of Tail Exponents’, Journal of Business Economics and Statistics, vol. 29(1), pp.
24-39.
Goldin, C. and Katz L. (2008). The Race between Education and Technology, Belknap Press.
Hall, B. (1999). ‘The Design of Multi-Year Option Plans’, Journal of Applied Corporate
Finance, vol. 12(2), pp. 97-106.
Hermalin, B.E. (2005). ‘Trends in Corporate Governance’, Journal of Finance, vol. 60(5),
pp. 2351-2384.
Jensen, M., Murphy, K.J. and Wruck E. (2004). ‘Remuneration: Where We’ve Been, How
We Got to Here, What Are the Problems, and How to Fix Them’, Mimeo, Harvard University.
Jenter, D. and Kanaan, F. (forth.). ‘CEO Turnover and Relative Performance Evaluation’,
Journal of Finance.
Kaplan, S.N. and Rauh, J. (2010). ‘Wall Street and Main Street: What Contributes to the
Rise in the Highest Incomes?’, Review of Financial Studies, vol. 23(3), pp. 1004-1050.
Kaplan, S.N. (2012). ‘Executive Compensation and Corporate Governance in the U.S.:
Perceptions, Facts and Challenges’, NBER, Working Paper 18395.
19
Larcker, D.F., McCall, A.L. and Ormazabal, G. (2012). ‘The Economic Consequences of
Proxy Advisor Say-on-Pay Voting Policies’, Working Paper.
Lemieux, T., MacLeod, W.B. and Parent, D. (2009). ‘Performance Pay and Wage Inequal-
ity’, Quarterly Journal of Economics, vol. 124(1), pp. 1-49.
Luttmer, E.G.J. (2007). ‘Selection, Growth, and the Size Distribution of Firm’, Quaterly
Journal of Economics, vol. 122(3), pp. 1103-1144.
Malmendier, U. and Tate, G. (2009). ‘Superstar CEOs’, Quarterly Journal of Economics,
vol. 124(4), pp. 1593-1638.
Murphy, K. and Zabojnik, J. (2004). ‘CEO Pay and Appointments: A Market Based
Explanation for Recent Trends’, American Economic Review Papers and Proceedings, vol. 94(2),
pp. 192-196.
Murphy, K. and Sandino, T. (2010). ‘Executive pay and “independent” compensation con-
sultants’, Journal of Accounting and Economics, vol. 49(3), pp. 247-262.
Nagel, G.L. (2010). ‘The Effect of Labor Market Demand on U.S. CEO Pay Since 1980’,
The Financial Review, vol. 45, pp. 931-950.
Piketty, T. and Saez, E. (2003). ‘Income Inequality In The United States, 1913-1998’,
Quarterly Journal of Economics, vol. 118(1), pp. 1-39.
Rajan, R.G. and Wulf, J. (2006). ‘The Flattening Firm: Evidence from Panel Data on
the Changing Nature of Corporate Hierarchies’, The Review of Economics and Statistics, Vol.
88(4), pp. 759-773.
Rosen, S. (1981). ‘The Economics of Superstars’, American Economic Review, vol. 71(5),
pp. 845-858.
Sattinger, M. (1993). ‘Assignment Models of the Distribution of Earnings’, Journal of
Economic Literature, vol. 31(2), pp. 831–880.
Shivdasani, A. and Yermack, D. (1999). ‘CEO involvement in the selection of new board
members: an empirical analysis’, Journal of Finance, vol. 54(5), pp. 1829–53.
20
Simon, H.A. (1955). ‘On a Class of Skew Distribution Functions’, Biometrika, vol. 42, pp.
425-440.
Tervio, M. (2008). ‘The Difference That CEOs Make: An Assignment Model Approach’,
American Economic Review, vol. 98(3), pp. 642-668.
Walker, D.I. (2011). ‘Evolving Executive Equity Compensation and the Limits of Optimal
Contracting’, Vanderbilt Law Review, vol. 64, pp. 611-674.
21
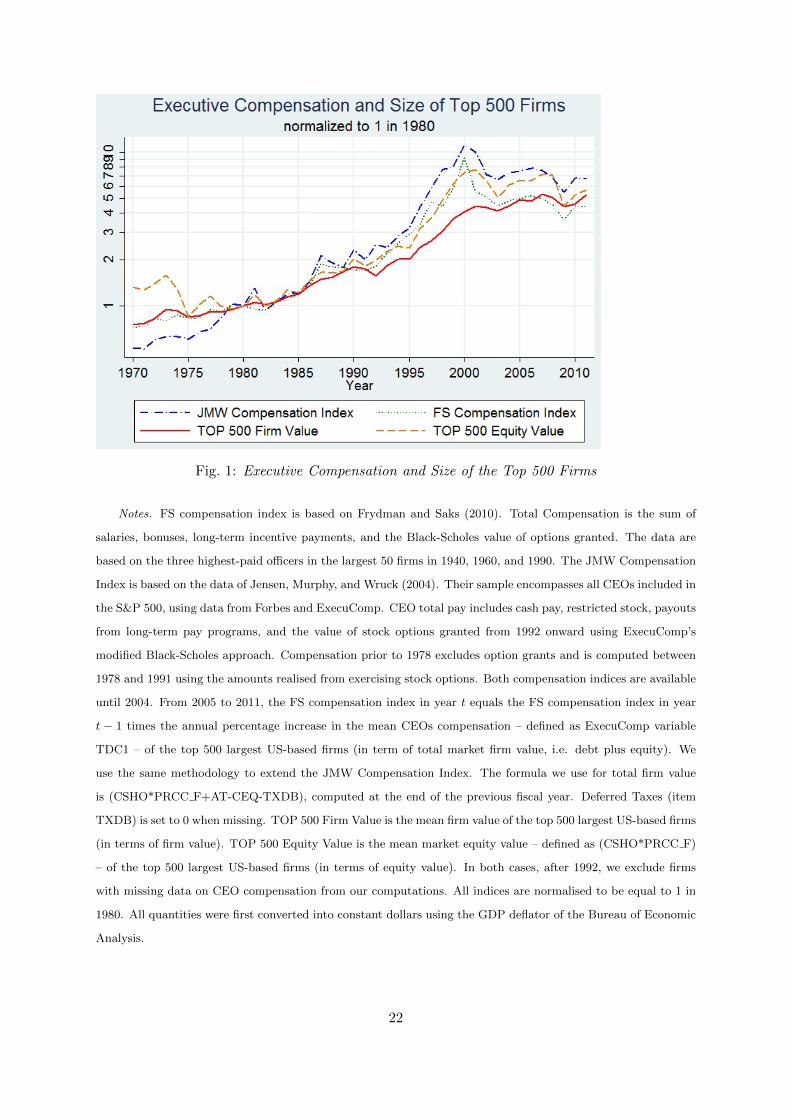
Fig. 1: Executive Compensation and Size of the Top 500 Firms
Notes. FS compensation index is based on Frydman and Saks (2010). Total Compensation is the sum of
salaries, bonuses, long-term incentive payments, and the Black-Scholes value of options granted. The data are
based on the three highest-paid officers in the largest 50 firms in 1940, 1960, and 1990. The JMW Compensation
Index is based on the data of Jensen, Murphy, and Wruck (2004). Their sample encompasses all CEOs included in
the S&P 500, using data from Forbes and ExecuComp. CEO total pay includes cash pay, restricted stock, payouts
from long-term pay programs, and the value of stock options granted from 1992 onward using ExecuComp’s
modified Black-Scholes approach. Compensation prior to 1978 excludes option grants and is computed between
1978 and 1991 using the amounts realised from exercising stock options. Both compensation indices are available
until 2004. From 2005 to 2011, the FS compensation index in year t equals the FS compensation index in year
t − 1 times the annual percentage increase in the mean CEOs compensation – defined as ExecuComp variable
TDC1 – of the top 500 largest US-based firms (in term of total market firm value, i.e. debt plus equity). We
use the same methodology to extend the JMW Compensation Index. The formula we use for total firm value
is (CSHO*PRCC F+AT-CEQ-TXDB), computed at the end of the previous fiscal year. Deferred Taxes (item
TXDB) is set to 0 when missing. TOP 500 Firm Value is the mean firm value of the top 500 largest US-based firms
(in terms of firm value). TOP 500 Equity Value is the mean market equity value – defined as (CSHO*PRCC F)
– of the top 500 largest US-based firms (in terms of equity value). In both cases, after 1992, we exclude firms
with missing data on CEO compensation from our computations. All indices are normalised to be equal to 1 in
1980. All quantities were first converted into constant dollars using the GDP deflator of the Bureau of Economic
Analysis.
22
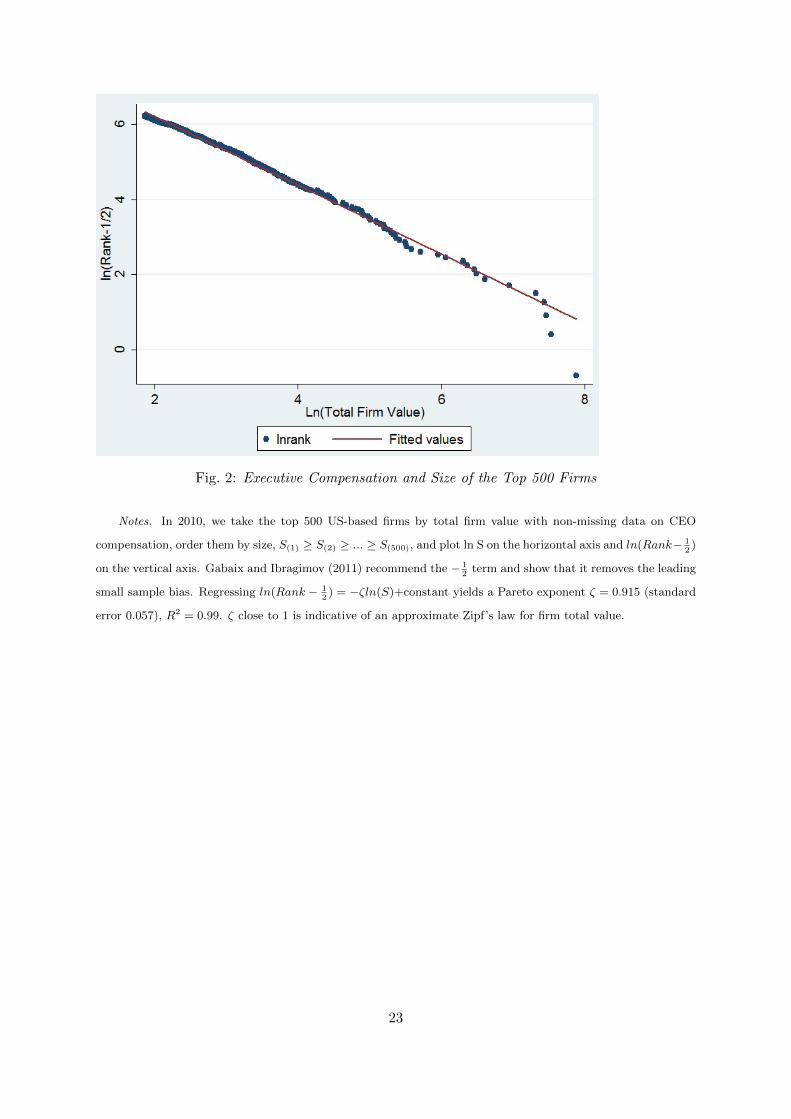
Fig. 2: Executive Compensation and Size of the Top 500 Firms
Notes. In 2010, we take the top 500 US-based firms by total firm value with non-missing data on CEO
compensation, order them by size, S(1) ≥ S(2) ≥ ... ≥ S(500), and plot ln S on the horizontal axis and ln(Rank− 12)
on the vertical axis. Gabaix and Ibragimov (2011) recommend the − 12
term and show that it removes the leading
small sample bias. Regressing ln(Rank − 12) = −ζln(S)+constant yields a Pareto exponent ζ = 0.915 (standard
error 0.057), R2 = 0.99. ζ close to 1 is indicative of an approximate Zipf’s law for firm total value.
23

Table 1: CEO Pay and Different Proxies for Firm Size
ln(Total compensation)(1) (2) (3) (4) (5)
ln(Firm Value) 0.176 0.383(0.0413) (0.0178)(0.0311) (0.0135)
ln(Income) 0.0772 0.339(0.0218) (0.0143)(0.0180) (0.0116)
ln(Sales) 0.146 0.364(0.0309) (0.0150)(0.0143) (0.0115)
ln(Equity Value) 0.338(0.0182)(0.0174)
Industry fixed effects Yes Yes Yes Yes YesYear fixed effects Yes Yes Yes Yes Yes
Observations 17949 17949 17949 17949 17949R2 0.295 0.286 0.277 0.282 0.266
Notes. The sample consists of all US-based firms between 1992 and 2011 for which we can retrieve both firm size
in Compustat and CEO compensation in Execucomp. We select each year the top 1000 largest firms (in term
of total market firm value, i.e. debt plus equity). We then regress the log compensation of the CEO – using
the ExecuComp total compensation variable TDC1, which includes salary, bonus, restricted stock granted, and
the Black-Scholes value of stock-options granted – in year t on the log of the firm’s size proxies at the end of
year t− 1. All nominal quantities were first converted into 2000 constant dollars using the GDP deflator of the
Bureau of Economic Analysis. The formula we use for total firm value is (CSHO*PRCC F+AT-CEQ-TXDB).
Deferred Taxes (item TXDB) is set to 0 when missing. Income is measured as earnings before interest and
taxes, defined from Compustat as (OIBDP-DP). Sales is measured with Compustat item SALE. Equity value
is (CSHO*PRCC F). The industries are the Fama and French (1997) 48 sectors. We report standard errors
clustered at the firm level (first line) and at the year level (second line).
24
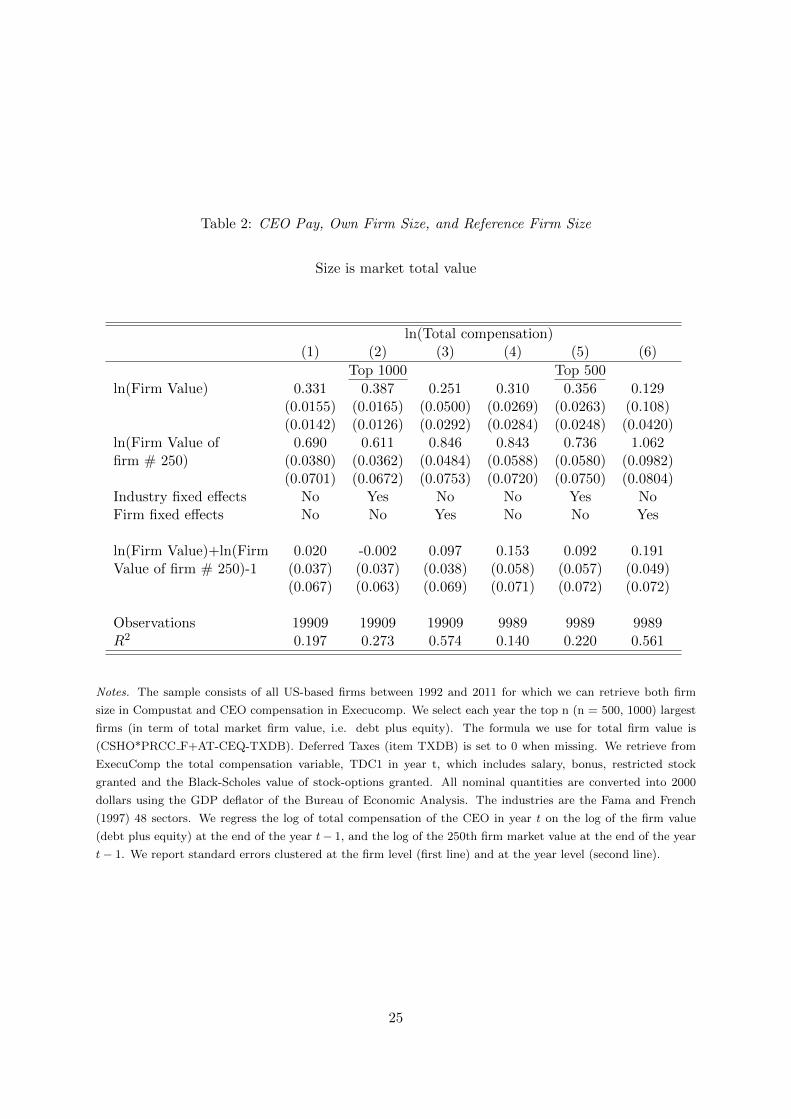
Table 2: CEO Pay, Own Firm Size, and Reference Firm Size
Size is market total value
ln(Total compensation)(1) (2) (3) (4) (5) (6)
Top 1000 Top 500
ln(Firm Value) 0.331 0.387 0.251 0.310 0.356 0.129(0.0155) (0.0165) (0.0500) (0.0269) (0.0263) (0.108)(0.0142) (0.0126) (0.0292) (0.0284) (0.0248) (0.0420)
ln(Firm Value of 0.690 0.611 0.846 0.843 0.736 1.062firm # 250) (0.0380) (0.0362) (0.0484) (0.0588) (0.0580) (0.0982)
(0.0701) (0.0672) (0.0753) (0.0720) (0.0750) (0.0804)Industry fixed effects No Yes No No Yes NoFirm fixed effects No No Yes No No Yes
ln(Firm Value)+ln(Firm 0.020 -0.002 0.097 0.153 0.092 0.191Value of firm # 250)-1 (0.037) (0.037) (0.038) (0.058) (0.057) (0.049)
(0.067) (0.063) (0.069) (0.071) (0.072) (0.072)
Observations 19909 19909 19909 9989 9989 9989R2 0.197 0.273 0.574 0.140 0.220 0.561
Notes. The sample consists of all US-based firms between 1992 and 2011 for which we can retrieve both firm
size in Compustat and CEO compensation in Execucomp. We select each year the top n (n = 500, 1000) largest
firms (in term of total market firm value, i.e. debt plus equity). The formula we use for total firm value is
(CSHO*PRCC F+AT-CEQ-TXDB). Deferred Taxes (item TXDB) is set to 0 when missing. We retrieve from
ExecuComp the total compensation variable, TDC1 in year t, which includes salary, bonus, restricted stock
granted and the Black-Scholes value of stock-options granted. All nominal quantities are converted into 2000
dollars using the GDP deflator of the Bureau of Economic Analysis. The industries are the Fama and French
(1997) 48 sectors. We regress the log of total compensation of the CEO in year t on the log of the firm value
(debt plus equity) at the end of the year t− 1, and the log of the 250th firm market value at the end of the year
t− 1. We report standard errors clustered at the firm level (first line) and at the year level (second line).
25
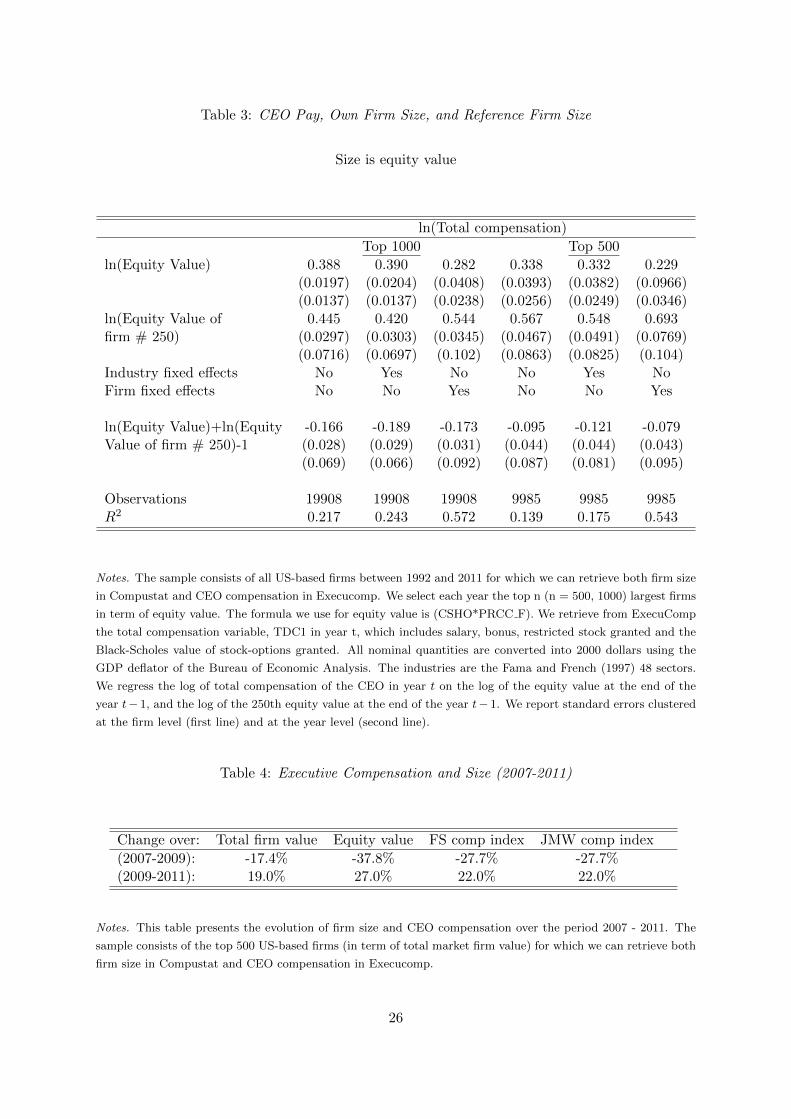
Table 3: CEO Pay, Own Firm Size, and Reference Firm Size
Size is equity value
ln(Total compensation)
Top 1000 Top 500
ln(Equity Value) 0.388 0.390 0.282 0.338 0.332 0.229(0.0197) (0.0204) (0.0408) (0.0393) (0.0382) (0.0966)(0.0137) (0.0137) (0.0238) (0.0256) (0.0249) (0.0346)
ln(Equity Value of 0.445 0.420 0.544 0.567 0.548 0.693firm # 250) (0.0297) (0.0303) (0.0345) (0.0467) (0.0491) (0.0769)
(0.0716) (0.0697) (0.102) (0.0863) (0.0825) (0.104)Industry fixed effects No Yes No No Yes NoFirm fixed effects No No Yes No No Yes
ln(Equity Value)+ln(Equity -0.166 -0.189 -0.173 -0.095 -0.121 -0.079Value of firm # 250)-1 (0.028) (0.029) (0.031) (0.044) (0.044) (0.043)
(0.069) (0.066) (0.092) (0.087) (0.081) (0.095)
Observations 19908 19908 19908 9985 9985 9985R2 0.217 0.243 0.572 0.139 0.175 0.543
Notes. The sample consists of all US-based firms between 1992 and 2011 for which we can retrieve both firm size
in Compustat and CEO compensation in Execucomp. We select each year the top n (n = 500, 1000) largest firms
in term of equity value. The formula we use for equity value is (CSHO*PRCC F). We retrieve from ExecuComp
the total compensation variable, TDC1 in year t, which includes salary, bonus, restricted stock granted and the
Black-Scholes value of stock-options granted. All nominal quantities are converted into 2000 dollars using the
GDP deflator of the Bureau of Economic Analysis. The industries are the Fama and French (1997) 48 sectors.
We regress the log of total compensation of the CEO in year t on the log of the equity value at the end of the
year t− 1, and the log of the 250th equity value at the end of the year t− 1. We report standard errors clustered
at the firm level (first line) and at the year level (second line).
Table 4: Executive Compensation and Size (2007-2011)
Change over: Total firm value Equity value FS comp index JMW comp index
(2007-2009): -17.4% -37.8% -27.7% -27.7%(2009-2011): 19.0% 27.0% 22.0% 22.0%
Notes. This table presents the evolution of firm size and CEO compensation over the period 2007 - 2011. The
sample consists of the top 500 US-based firms (in term of total market firm value) for which we can retrieve both
firm size in Compustat and CEO compensation in Execucomp.
26
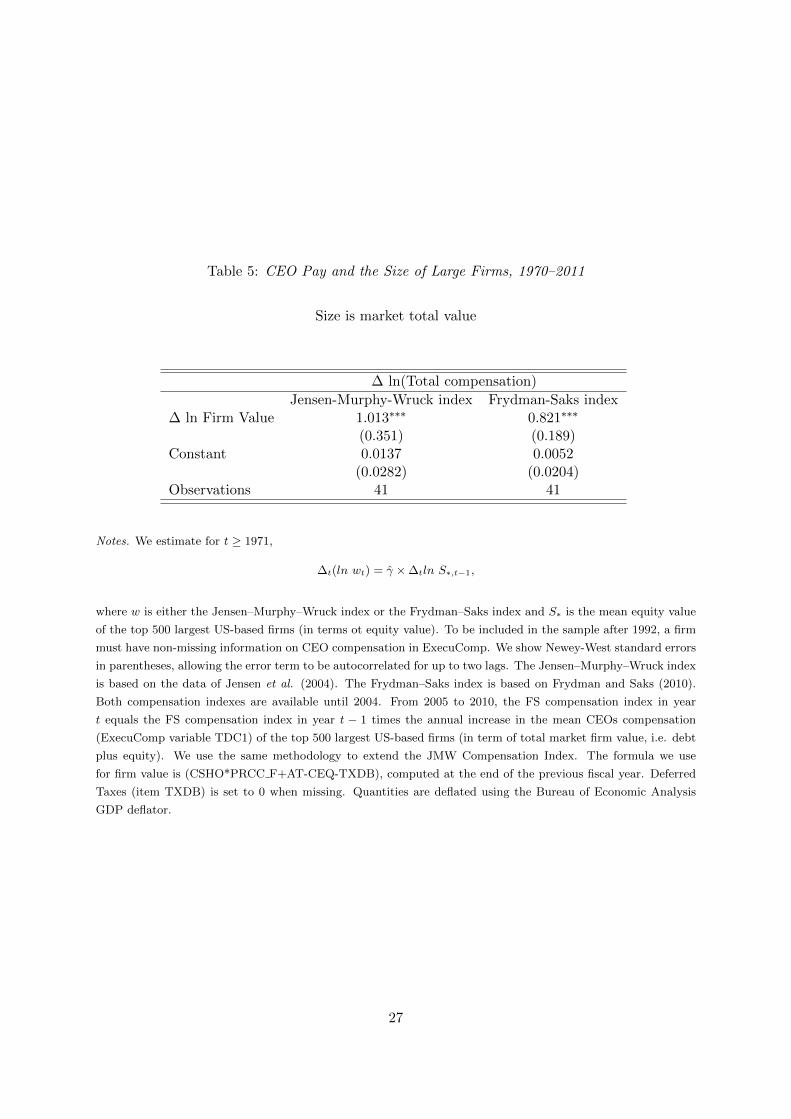
Table 5: CEO Pay and the Size of Large Firms, 1970–2011
Size is market total value
∆ ln(Total compensation)
Jensen-Murphy-Wruck index Frydman-Saks index∆ ln Firm Value 1.013∗∗∗ 0.821∗∗∗
(0.351) (0.189)Constant 0.0137 0.0052
(0.0282) (0.0204)Observations 41 41
Notes. We estimate for t ≥ 1971,
∆t(ln wt) = γ × ∆tln S∗,t−1,
where w is either the Jensen–Murphy–Wruck index or the Frydman–Saks index and S∗ is the mean equity value
of the top 500 largest US-based firms (in terms ot equity value). To be included in the sample after 1992, a firm
must have non-missing information on CEO compensation in ExecuComp. We show Newey-West standard errors
in parentheses, allowing the error term to be autocorrelated for up to two lags. The Jensen–Murphy–Wruck index
is based on the data of Jensen et al. (2004). The Frydman–Saks index is based on Frydman and Saks (2010).
Both compensation indexes are available until 2004. From 2005 to 2010, the FS compensation index in year
t equals the FS compensation index in year t − 1 times the annual increase in the mean CEOs compensation
(ExecuComp variable TDC1) of the top 500 largest US-based firms (in term of total market firm value, i.e. debt
plus equity). We use the same methodology to extend the JMW Compensation Index. The formula we use
for firm value is (CSHO*PRCC F+AT-CEQ-TXDB), computed at the end of the previous fiscal year. Deferred
Taxes (item TXDB) is set to 0 when missing. Quantities are deflated using the Bureau of Economic Analysis
GDP deflator.
27
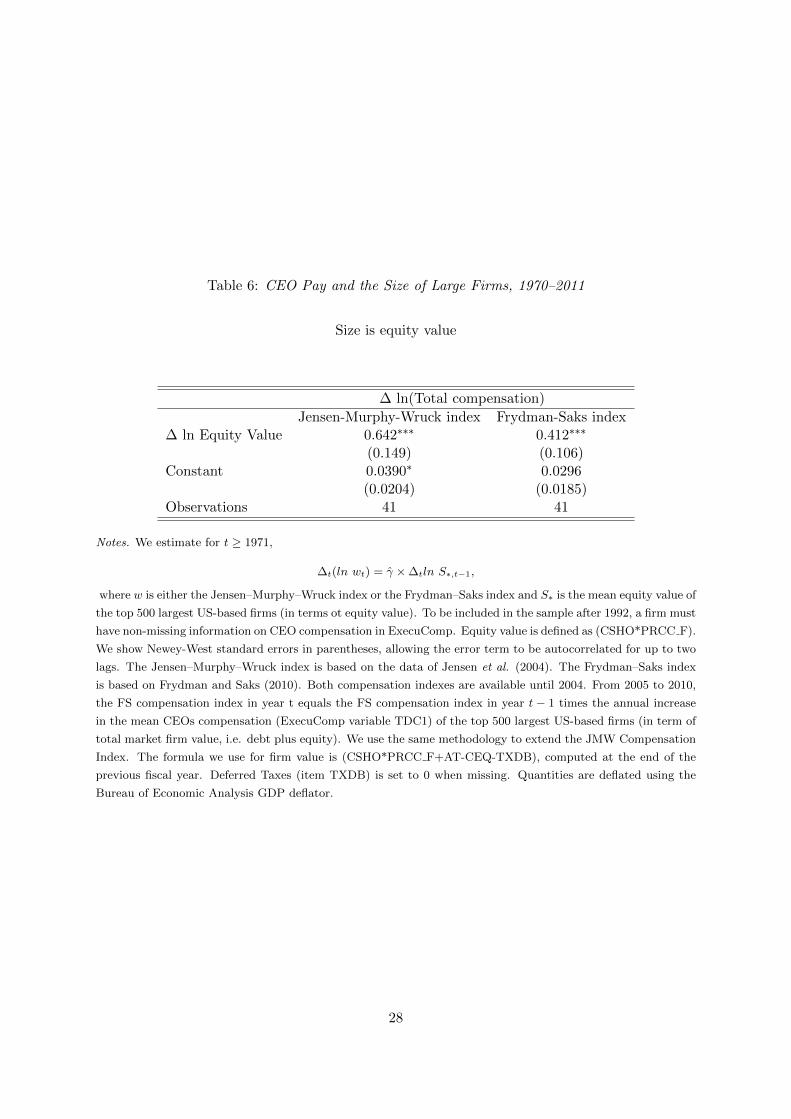
Table 6: CEO Pay and the Size of Large Firms, 1970–2011
Size is equity value
∆ ln(Total compensation)
Jensen-Murphy-Wruck index Frydman-Saks index∆ ln Equity Value 0.642∗∗∗ 0.412∗∗∗
(0.149) (0.106)Constant 0.0390∗ 0.0296
(0.0204) (0.0185)Observations 41 41
Notes. We estimate for t ≥ 1971,
∆t(ln wt) = γ × ∆tln S∗,t−1,
where w is either the Jensen–Murphy–Wruck index or the Frydman–Saks index and S∗ is the mean equity value of
the top 500 largest US-based firms (in terms ot equity value). To be included in the sample after 1992, a firm must
have non-missing information on CEO compensation in ExecuComp. Equity value is defined as (CSHO*PRCC F).
We show Newey-West standard errors in parentheses, allowing the error term to be autocorrelated for up to two
lags. The Jensen–Murphy–Wruck index is based on the data of Jensen et al. (2004). The Frydman–Saks index
is based on Frydman and Saks (2010). Both compensation indexes are available until 2004. From 2005 to 2010,
the FS compensation index in year t equals the FS compensation index in year t − 1 times the annual increase
in the mean CEOs compensation (ExecuComp variable TDC1) of the top 500 largest US-based firms (in term of
total market firm value, i.e. debt plus equity). We use the same methodology to extend the JMW Compensation
Index. The formula we use for firm value is (CSHO*PRCC F+AT-CEQ-TXDB), computed at the end of the
previous fiscal year. Deferred Taxes (item TXDB) is set to 0 when missing. Quantities are deflated using the
Bureau of Economic Analysis GDP deflator.
28
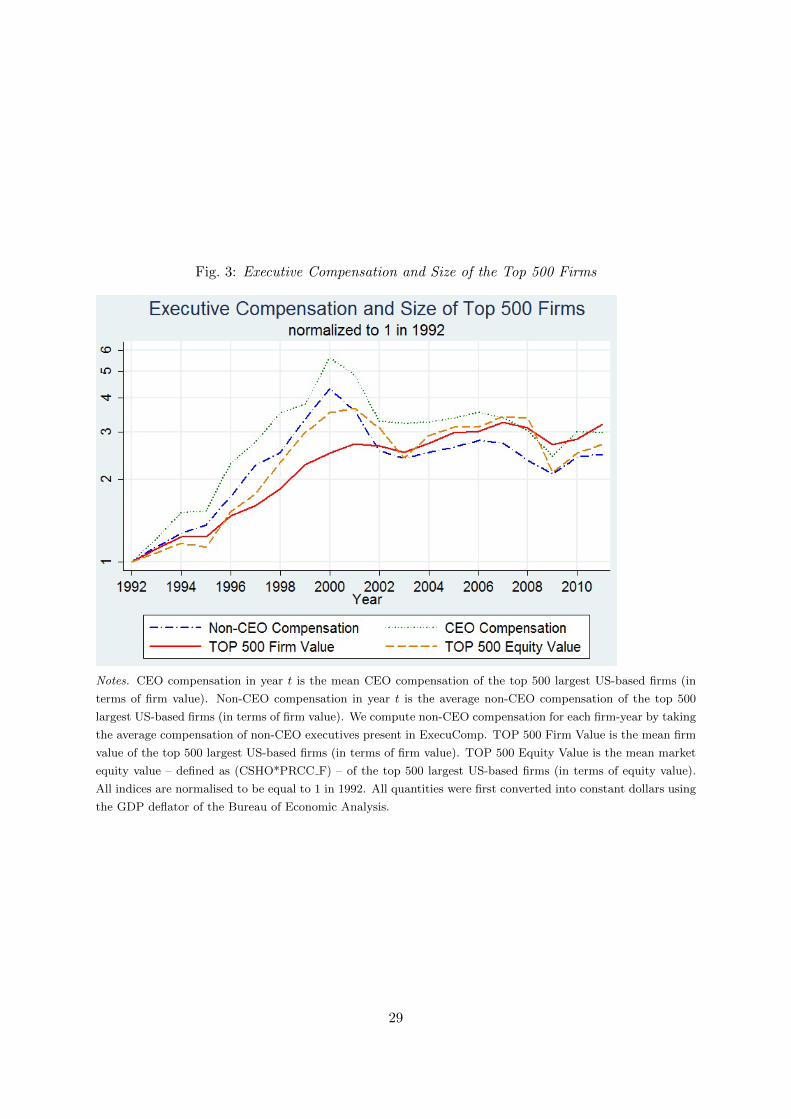
Fig. 3: Executive Compensation and Size of the Top 500 Firms
Notes. CEO compensation in year t is the mean CEO compensation of the top 500 largest US-based firms (in
terms of firm value). Non-CEO compensation in year t is the average non-CEO compensation of the top 500
largest US-based firms (in terms of firm value). We compute non-CEO compensation for each firm-year by taking
the average compensation of non-CEO executives present in ExecuComp. TOP 500 Firm Value is the mean firm
value of the top 500 largest US-based firms (in terms of firm value). TOP 500 Equity Value is the mean market
equity value – defined as (CSHO*PRCC F) – of the top 500 largest US-based firms (in terms of equity value).
All indices are normalised to be equal to 1 in 1992. All quantities were first converted into constant dollars using
the GDP deflator of the Bureau of Economic Analysis.
29
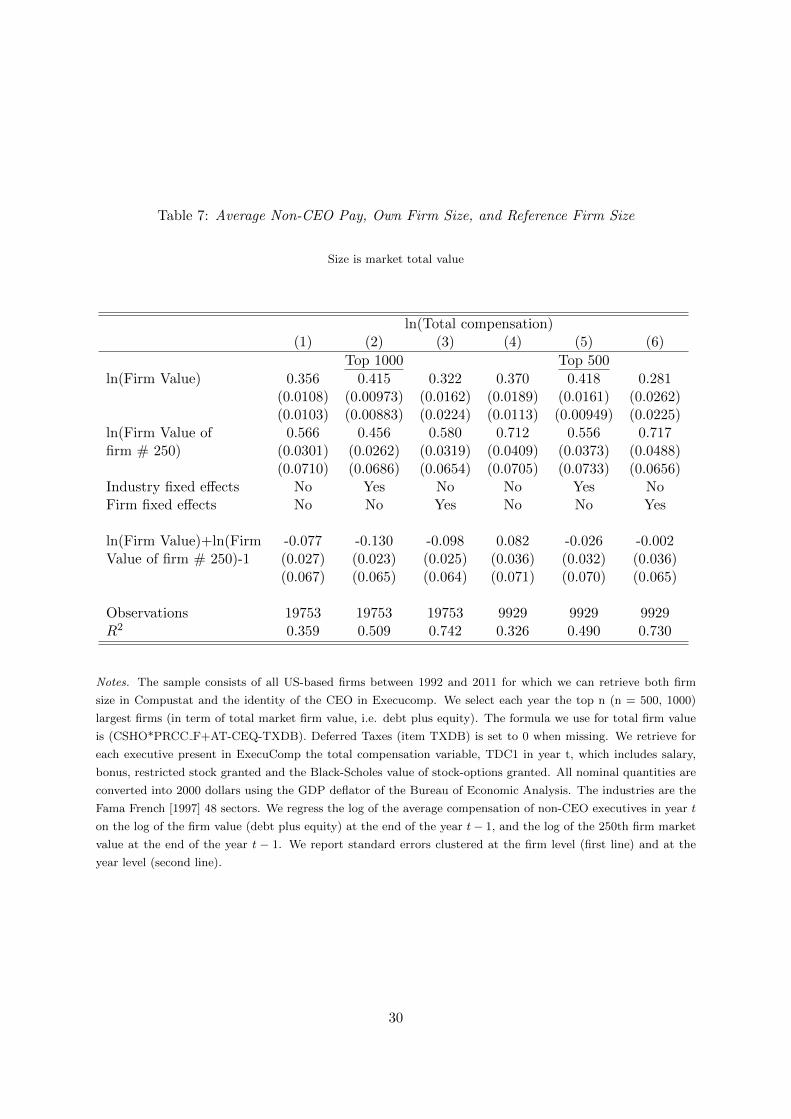
Table 7: Average Non-CEO Pay, Own Firm Size, and Reference Firm Size
Size is market total value
ln(Total compensation)(1) (2) (3) (4) (5) (6)
Top 1000 Top 500
ln(Firm Value) 0.356 0.415 0.322 0.370 0.418 0.281(0.0108) (0.00973) (0.0162) (0.0189) (0.0161) (0.0262)(0.0103) (0.00883) (0.0224) (0.0113) (0.00949) (0.0225)
ln(Firm Value of 0.566 0.456 0.580 0.712 0.556 0.717firm # 250) (0.0301) (0.0262) (0.0319) (0.0409) (0.0373) (0.0488)
(0.0710) (0.0686) (0.0654) (0.0705) (0.0733) (0.0656)Industry fixed effects No Yes No No Yes NoFirm fixed effects No No Yes No No Yes
ln(Firm Value)+ln(Firm -0.077 -0.130 -0.098 0.082 -0.026 -0.002Value of firm # 250)-1 (0.027) (0.023) (0.025) (0.036) (0.032) (0.036)
(0.067) (0.065) (0.064) (0.071) (0.070) (0.065)
Observations 19753 19753 19753 9929 9929 9929R2 0.359 0.509 0.742 0.326 0.490 0.730
Notes. The sample consists of all US-based firms between 1992 and 2011 for which we can retrieve both firm
size in Compustat and the identity of the CEO in Execucomp. We select each year the top n (n = 500, 1000)
largest firms (in term of total market firm value, i.e. debt plus equity). The formula we use for total firm value
is (CSHO*PRCC F+AT-CEQ-TXDB). Deferred Taxes (item TXDB) is set to 0 when missing. We retrieve for
each executive present in ExecuComp the total compensation variable, TDC1 in year t, which includes salary,
bonus, restricted stock granted and the Black-Scholes value of stock-options granted. All nominal quantities are
converted into 2000 dollars using the GDP deflator of the Bureau of Economic Analysis. The industries are the
Fama French [1997] 48 sectors. We regress the log of the average compensation of non-CEO executives in year t
on the log of the firm value (debt plus equity) at the end of the year t− 1, and the log of the 250th firm market
value at the end of the year t − 1. We report standard errors clustered at the firm level (first line) and at the
year level (second line).
30
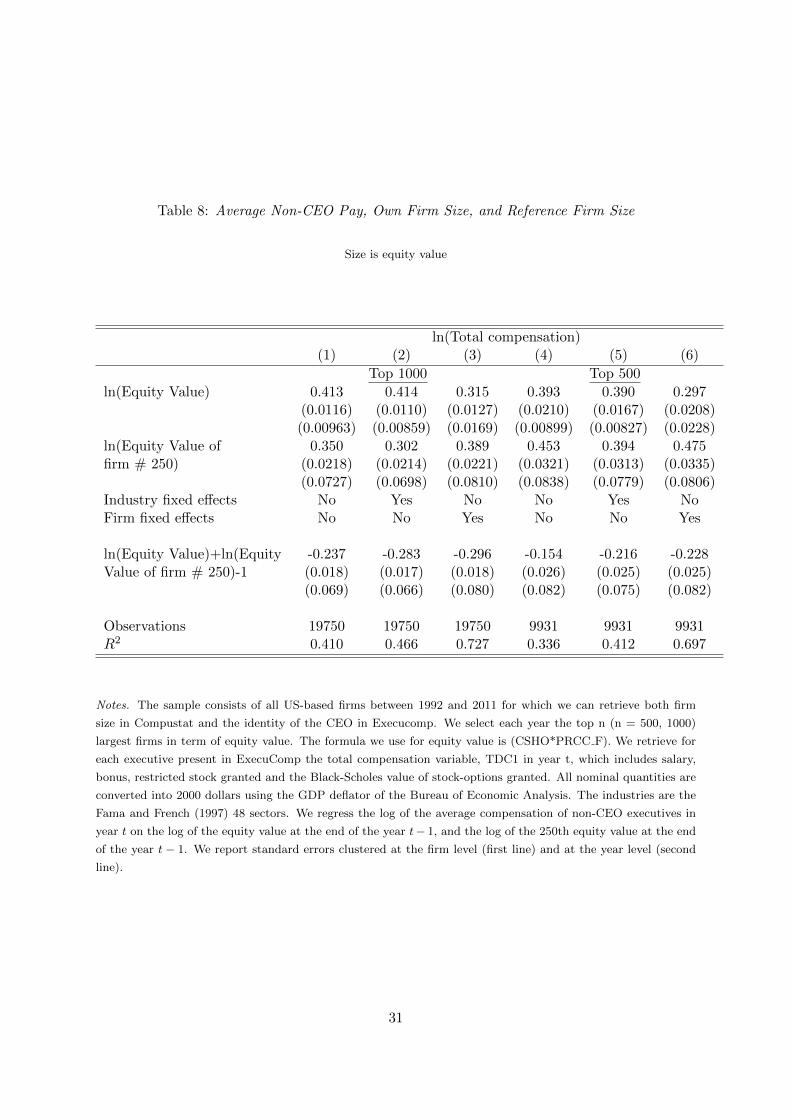
Table 8: Average Non-CEO Pay, Own Firm Size, and Reference Firm Size
Size is equity value
ln(Total compensation)(1) (2) (3) (4) (5) (6)
Top 1000 Top 500
ln(Equity Value) 0.413 0.414 0.315 0.393 0.390 0.297(0.0116) (0.0110) (0.0127) (0.0210) (0.0167) (0.0208)(0.00963) (0.00859) (0.0169) (0.00899) (0.00827) (0.0228)
ln(Equity Value of 0.350 0.302 0.389 0.453 0.394 0.475firm # 250) (0.0218) (0.0214) (0.0221) (0.0321) (0.0313) (0.0335)
(0.0727) (0.0698) (0.0810) (0.0838) (0.0779) (0.0806)Industry fixed effects No Yes No No Yes NoFirm fixed effects No No Yes No No Yes
ln(Equity Value)+ln(Equity -0.237 -0.283 -0.296 -0.154 -0.216 -0.228Value of firm # 250)-1 (0.018) (0.017) (0.018) (0.026) (0.025) (0.025)
(0.069) (0.066) (0.080) (0.082) (0.075) (0.082)
Observations 19750 19750 19750 9931 9931 9931R2 0.410 0.466 0.727 0.336 0.412 0.697
Notes. The sample consists of all US-based firms between 1992 and 2011 for which we can retrieve both firm
size in Compustat and the identity of the CEO in Execucomp. We select each year the top n (n = 500, 1000)
largest firms in term of equity value. The formula we use for equity value is (CSHO*PRCC F). We retrieve for
each executive present in ExecuComp the total compensation variable, TDC1 in year t, which includes salary,
bonus, restricted stock granted and the Black-Scholes value of stock-options granted. All nominal quantities are
converted into 2000 dollars using the GDP deflator of the Bureau of Economic Analysis. The industries are the
Fama and French (1997) 48 sectors. We regress the log of the average compensation of non-CEO executives in
year t on the log of the equity value at the end of the year t− 1, and the log of the 250th equity value at the end
of the year t − 1. We report standard errors clustered at the firm level (first line) and at the year level (second
line).
31

Online Appendix for “CEO Pay and Firm Size: an Update af-
ter the Crisis”, by Xavier Gabaix, Augustin Landier and Julien
Sauvagnat
32
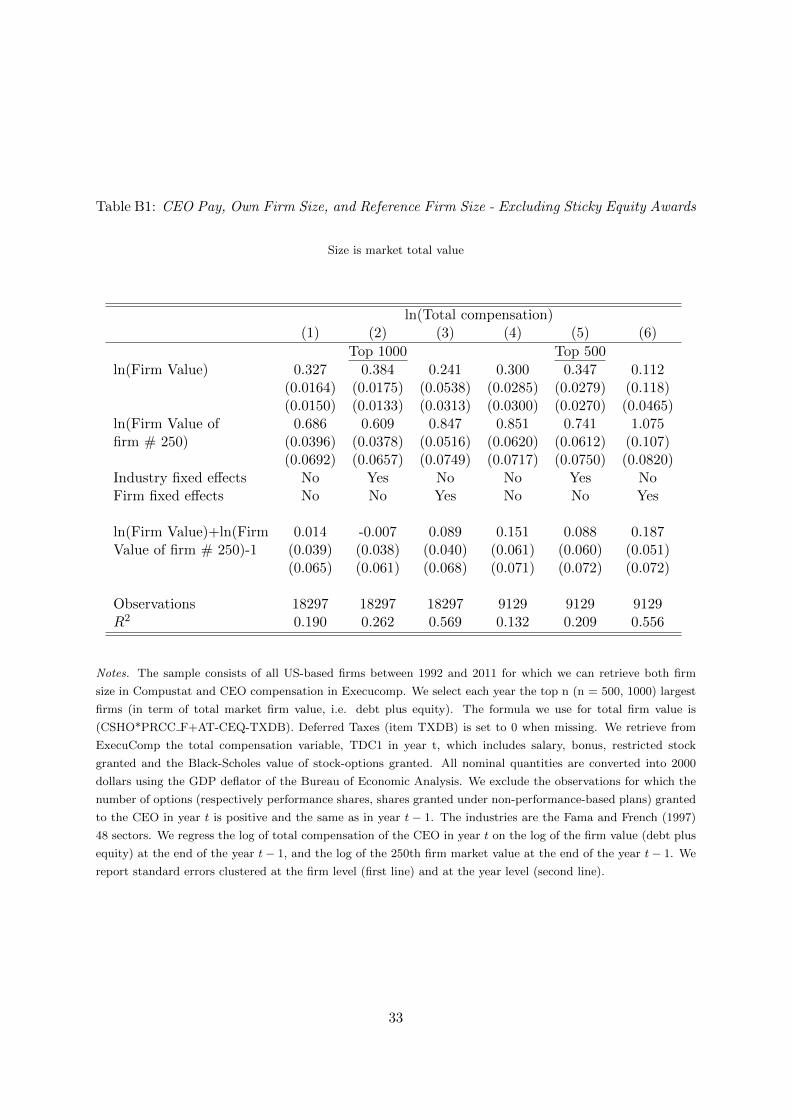
Table B1: CEO Pay, Own Firm Size, and Reference Firm Size - Excluding Sticky Equity Awards
Size is market total value
ln(Total compensation)(1) (2) (3) (4) (5) (6)
Top 1000 Top 500
ln(Firm Value) 0.327 0.384 0.241 0.300 0.347 0.112(0.0164) (0.0175) (0.0538) (0.0285) (0.0279) (0.118)(0.0150) (0.0133) (0.0313) (0.0300) (0.0270) (0.0465)
ln(Firm Value of 0.686 0.609 0.847 0.851 0.741 1.075firm # 250) (0.0396) (0.0378) (0.0516) (0.0620) (0.0612) (0.107)
(0.0692) (0.0657) (0.0749) (0.0717) (0.0750) (0.0820)Industry fixed effects No Yes No No Yes NoFirm fixed effects No No Yes No No Yes
ln(Firm Value)+ln(Firm 0.014 -0.007 0.089 0.151 0.088 0.187Value of firm # 250)-1 (0.039) (0.038) (0.040) (0.061) (0.060) (0.051)
(0.065) (0.061) (0.068) (0.071) (0.072) (0.072)
Observations 18297 18297 18297 9129 9129 9129R2 0.190 0.262 0.569 0.132 0.209 0.556
Notes. The sample consists of all US-based firms between 1992 and 2011 for which we can retrieve both firm
size in Compustat and CEO compensation in Execucomp. We select each year the top n (n = 500, 1000) largest
firms (in term of total market firm value, i.e. debt plus equity). The formula we use for total firm value is
(CSHO*PRCC F+AT-CEQ-TXDB). Deferred Taxes (item TXDB) is set to 0 when missing. We retrieve from
ExecuComp the total compensation variable, TDC1 in year t, which includes salary, bonus, restricted stock
granted and the Black-Scholes value of stock-options granted. All nominal quantities are converted into 2000
dollars using the GDP deflator of the Bureau of Economic Analysis. We exclude the observations for which the
number of options (respectively performance shares, shares granted under non-performance-based plans) granted
to the CEO in year t is positive and the same as in year t − 1. The industries are the Fama and French (1997)
48 sectors. We regress the log of total compensation of the CEO in year t on the log of the firm value (debt plus
equity) at the end of the year t− 1, and the log of the 250th firm market value at the end of the year t− 1. We
report standard errors clustered at the firm level (first line) and at the year level (second line).
33
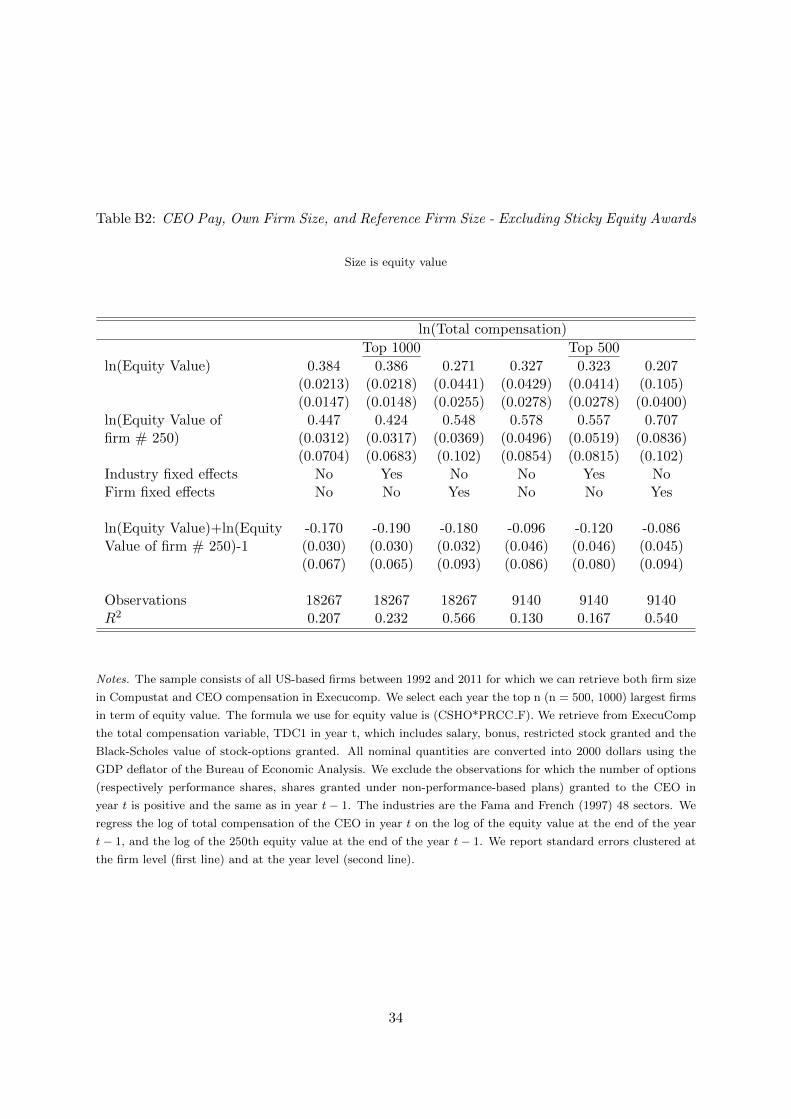
Table B2: CEO Pay, Own Firm Size, and Reference Firm Size - Excluding Sticky Equity Awards
Size is equity value
ln(Total compensation)
Top 1000 Top 500
ln(Equity Value) 0.384 0.386 0.271 0.327 0.323 0.207(0.0213) (0.0218) (0.0441) (0.0429) (0.0414) (0.105)(0.0147) (0.0148) (0.0255) (0.0278) (0.0278) (0.0400)
ln(Equity Value of 0.447 0.424 0.548 0.578 0.557 0.707firm # 250) (0.0312) (0.0317) (0.0369) (0.0496) (0.0519) (0.0836)
(0.0704) (0.0683) (0.102) (0.0854) (0.0815) (0.102)Industry fixed effects No Yes No No Yes NoFirm fixed effects No No Yes No No Yes
ln(Equity Value)+ln(Equity -0.170 -0.190 -0.180 -0.096 -0.120 -0.086Value of firm # 250)-1 (0.030) (0.030) (0.032) (0.046) (0.046) (0.045)
(0.067) (0.065) (0.093) (0.086) (0.080) (0.094)
Observations 18267 18267 18267 9140 9140 9140R2 0.207 0.232 0.566 0.130 0.167 0.540
Notes. The sample consists of all US-based firms between 1992 and 2011 for which we can retrieve both firm size
in Compustat and CEO compensation in Execucomp. We select each year the top n (n = 500, 1000) largest firms
in term of equity value. The formula we use for equity value is (CSHO*PRCC F). We retrieve from ExecuComp
the total compensation variable, TDC1 in year t, which includes salary, bonus, restricted stock granted and the
Black-Scholes value of stock-options granted. All nominal quantities are converted into 2000 dollars using the
GDP deflator of the Bureau of Economic Analysis. We exclude the observations for which the number of options
(respectively performance shares, shares granted under non-performance-based plans) granted to the CEO in
year t is positive and the same as in year t− 1. The industries are the Fama and French (1997) 48 sectors. We
regress the log of total compensation of the CEO in year t on the log of the equity value at the end of the year
t− 1, and the log of the 250th equity value at the end of the year t− 1. We report standard errors clustered at
the firm level (first line) and at the year level (second line).
34
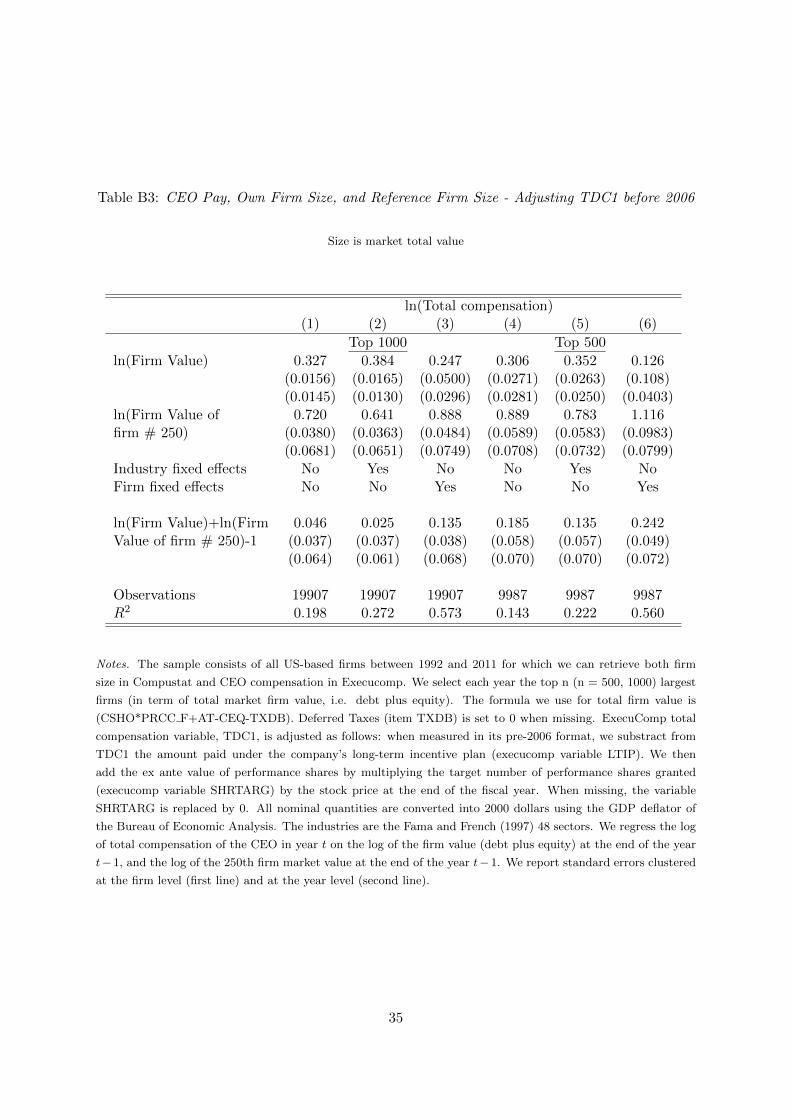
Table B3: CEO Pay, Own Firm Size, and Reference Firm Size - Adjusting TDC1 before 2006
Size is market total value
ln(Total compensation)(1) (2) (3) (4) (5) (6)
Top 1000 Top 500
ln(Firm Value) 0.327 0.384 0.247 0.306 0.352 0.126(0.0156) (0.0165) (0.0500) (0.0271) (0.0263) (0.108)(0.0145) (0.0130) (0.0296) (0.0281) (0.0250) (0.0403)
ln(Firm Value of 0.720 0.641 0.888 0.889 0.783 1.116firm # 250) (0.0380) (0.0363) (0.0484) (0.0589) (0.0583) (0.0983)
(0.0681) (0.0651) (0.0749) (0.0708) (0.0732) (0.0799)Industry fixed effects No Yes No No Yes NoFirm fixed effects No No Yes No No Yes
ln(Firm Value)+ln(Firm 0.046 0.025 0.135 0.185 0.135 0.242Value of firm # 250)-1 (0.037) (0.037) (0.038) (0.058) (0.057) (0.049)
(0.064) (0.061) (0.068) (0.070) (0.070) (0.072)
Observations 19907 19907 19907 9987 9987 9987R2 0.198 0.272 0.573 0.143 0.222 0.560
Notes. The sample consists of all US-based firms between 1992 and 2011 for which we can retrieve both firm
size in Compustat and CEO compensation in Execucomp. We select each year the top n (n = 500, 1000) largest
firms (in term of total market firm value, i.e. debt plus equity). The formula we use for total firm value is
(CSHO*PRCC F+AT-CEQ-TXDB). Deferred Taxes (item TXDB) is set to 0 when missing. ExecuComp total
compensation variable, TDC1, is adjusted as follows: when measured in its pre-2006 format, we substract from
TDC1 the amount paid under the company’s long-term incentive plan (execucomp variable LTIP). We then
add the ex ante value of performance shares by multiplying the target number of performance shares granted
(execucomp variable SHRTARG) by the stock price at the end of the fiscal year. When missing, the variable
SHRTARG is replaced by 0. All nominal quantities are converted into 2000 dollars using the GDP deflator of
the Bureau of Economic Analysis. The industries are the Fama and French (1997) 48 sectors. We regress the log
of total compensation of the CEO in year t on the log of the firm value (debt plus equity) at the end of the year
t−1, and the log of the 250th firm market value at the end of the year t−1. We report standard errors clustered
at the firm level (first line) and at the year level (second line).
35
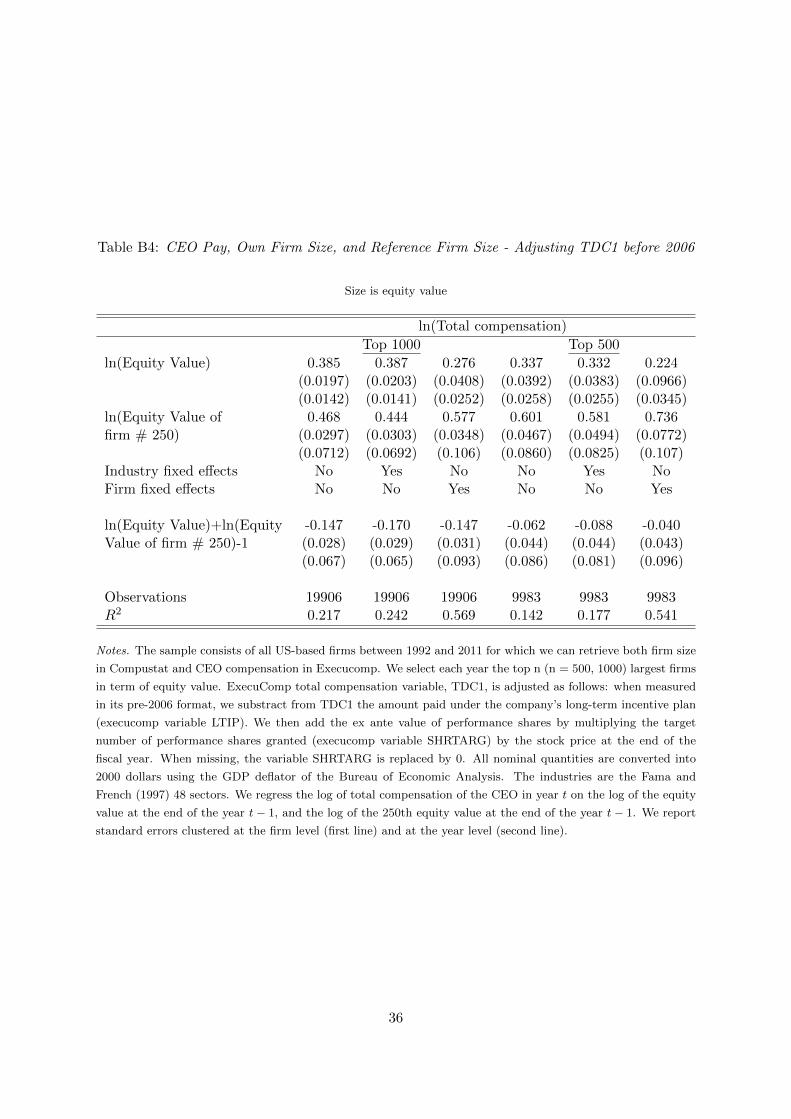
Table B4: CEO Pay, Own Firm Size, and Reference Firm Size - Adjusting TDC1 before 2006
Size is equity value
ln(Total compensation)
Top 1000 Top 500
ln(Equity Value) 0.385 0.387 0.276 0.337 0.332 0.224(0.0197) (0.0203) (0.0408) (0.0392) (0.0383) (0.0966)(0.0142) (0.0141) (0.0252) (0.0258) (0.0255) (0.0345)
ln(Equity Value of 0.468 0.444 0.577 0.601 0.581 0.736firm # 250) (0.0297) (0.0303) (0.0348) (0.0467) (0.0494) (0.0772)
(0.0712) (0.0692) (0.106) (0.0860) (0.0825) (0.107)Industry fixed effects No Yes No No Yes NoFirm fixed effects No No Yes No No Yes
ln(Equity Value)+ln(Equity -0.147 -0.170 -0.147 -0.062 -0.088 -0.040Value of firm # 250)-1 (0.028) (0.029) (0.031) (0.044) (0.044) (0.043)
(0.067) (0.065) (0.093) (0.086) (0.081) (0.096)
Observations 19906 19906 19906 9983 9983 9983R2 0.217 0.242 0.569 0.142 0.177 0.541
Notes. The sample consists of all US-based firms between 1992 and 2011 for which we can retrieve both firm size
in Compustat and CEO compensation in Execucomp. We select each year the top n (n = 500, 1000) largest firms
in term of equity value. ExecuComp total compensation variable, TDC1, is adjusted as follows: when measured
in its pre-2006 format, we substract from TDC1 the amount paid under the company’s long-term incentive plan
(execucomp variable LTIP). We then add the ex ante value of performance shares by multiplying the target
number of performance shares granted (execucomp variable SHRTARG) by the stock price at the end of the
fiscal year. When missing, the variable SHRTARG is replaced by 0. All nominal quantities are converted into
2000 dollars using the GDP deflator of the Bureau of Economic Analysis. The industries are the Fama and
French (1997) 48 sectors. We regress the log of total compensation of the CEO in year t on the log of the equity
value at the end of the year t− 1, and the log of the 250th equity value at the end of the year t− 1. We report
standard errors clustered at the firm level (first line) and at the year level (second line).
36


![CEO pay Q[1] · When an owner that controls the firm serves also as its CEO, this owner-CEO can pay himself inflated unjustified pay. Any such excessive compensation to the owner](https://img.pdfslide.us/doc/110x75/5ec229311ed38d58ed33ab2c/ceo-pay-q1-when-an-owner-that-controls-the-firm-serves-also-as-its-ceo-this-owner-ceo.jpg)