Embed Size (px)
Citation preview
Does Corporate Culture Matter for Firm Policies?*
Henrik Cronqvist, Angie Low, and Mattias Nilsson**
January 3, 2007
Abstract
Economic theories suggest that a firm’s corporate culture matters for its policy choices. We construct a parent-spinoff firm panel dataset that allows us to identify culture effects in firm policies from behavior that is inherited by a spinoff firm from its parent after the firms split up. We find positive and significant relations between spinoff firms’ and their parents’ choices of investment, financial, and operational policies. Consistent with predictions from economic theories of corporate culture, we find that the culture effects are long-term and stronger for internally grown business units and older firms. Our evidence also suggests that firms preserve their cultures by selecting managers who fit into their cultures. Finally, we find a strong relation between spinoff firms’ and their parents’ profitability, suggesting that corporate culture ultimately also affects economic performance. These results are robust to a series of robustness checks, and cannot be explained by alternatives such as governance or product market links. The contribution of this paper is to introduce the notion of corporate culture in a formal empirical analysis of firm policies and performance.
Keywords: Economics of corporate culture; firm policies; firm performance
JEL Classification: G32; G34; G35; L22; L25; Z10
* We thank Steve Buser, David Hirshleifer, Andrew Karolyi, René Stulz, Richard Thaler, and Bruce Weinberg, and seminar participants at the Ohio State University for very insightful comments. Suhail Gupta provided outstanding research assistance.We thank Karen and Eric Wruck for generously sharing with us their data on corporate spinoffs. Cronqvist is thankful for financial support from Fisher College of Business’s “Small Grant Program.” ** Assistant Professor of Finance, The Ohio State University; Ph.D. student in Finance, The Ohio State University; and Assistant Professor of Finance, Worcester Polytechnic Institute. Address correspondence to Henrik Cronqvist, The Ohio State University, Fisher College of Business, Department of Finance, 840 Fisher Hall, 2100 Neil Avenue, Columbus, OH 43210, or e-mail at [email protected].
1
“The way we do things around here” ---Marvin Bower, McKinsey & Company’s former managing director, defines corporate culture in his book The Will to Manage
1. Introduction
The view of the business press, many executives, and the management consulting
profession is that a firm’s corporate culture matters a lot for the firm’s policy choices and
economic performance. However, the empirical literature in economics and finance has so far
paid little attention to the potential role that corporate culture plays in explaining what firms do,
largely due to the difficulty of measuring and quantifying corporate culture, but also due to the
lack of economic theories that explicitly model corporate culture as a determinant of firm
policies. But, as pointed out by Kreps (1990) and Hermalin (2001), understanding corporate
culture is necessary if we want to understand firms’ policy choices and ultimately their
performance. The contribution of this paper is therefore to bring the notion of corporate culture
into a formal empirical analysis of firm policies and performance.1
What exactly is corporate culture and why should it matter for corporate decisions?
There exist many definitions of corporate culture. One common element in economic theories of
corporate culture seems to be that a firm has a specific set of norms, values, beliefs, and
preferences that is shared among its managers and workers.2 Under this view, the firm’s culture
1 There is a substantial body of work in the management literature that studies corporate culture (e.g., Chatman (1991) and Kotter and Heskett (1992)). As far as we know, the term “corporate culture” first appeared in this literature with an article in Sloan Management Review by Silverzweig and Allen (1976), and gained significant popularity after two bestselling books that both appeared in 1982: Deal and Kennedy’s Corporate Cultures: The Rites and Rituals of Corporate Life and Peters and Waterman’s In Search of Excellence: Lessons from America’s Best-Run Companies. Both the empirical methodology of these studies and the firm behavior analyzed differ substantially from the study we are undertaking in this paper. First, a lot of management studies are based on specific case studies. Second, much work is based on surveying managers and workers on some dimensions, and then using their responses to infer the appropriateness or strength of a firm’s corporate culture. Finally, whereas the outcomes considered in the management literature are often process-related, e.g., a corporation’s structure or its communication practices, in this paper we study firm policies related to investments, financing, and operations. 2 The General Social Survey (GSS), a national attitude survey performed by the NORC at the University of Chicago, included a work organization module in 1991, which shows that 78% of those surveyed agree with the following statement: “I find that my values and the organization’s values are very similar.”
2
can matter for its policy choices because the culture defines the “right” behavior when players
within a firm are confronted with unforeseen contingencies or when faced with situations with
multiple equilibria (Kreps (1990)). As shown in Hermalin (1994), competitive pressures can
lead to asymmetric equilibria where different firms, even within the same industry or market
segment, choose different strategies and policies -- it is not an equilibrium to behave similarly.
Corporate culture, defined as a mechanism for choosing among multiple equilibria, can thus help
explain the existence and persistence of such asymmetric equilibria (Hermalin (2001)).
As an illustration, consider the U.S. investment banking industry, a competitive industry
where many have a business education. Yet, there is ample anecdotal evidence that firms’
cultures matter a lot for what these firms do and for their performance. For example, the book
Goldman Sachs: The Culture of Success describes how important the corporate culture of
Goldman Sachs is, and how the firm instills its culture into its employees, in particular newly
hired ones. Casual observation also suggests that different investment banks have different
corporate cultures. Morgan Stanley is often said to have a conservative and risk-averse culture,
where employees tend to analyze “too much.” In contrast, Citibank’s culture is described as
aggressive, and the firm has a history of rapid growth through a series of large and risky mergers
and acquisitions. These examples suggest that cultural differences can matter for what policies
firms choose, and also for who the firms select to hire to implement these policies.3
The motivation for an empirical study of the effects of corporate culture on firm policies
is further illustrated when we consider how much of the heterogeneity in policies across firms
that is left unexplained by standard models. Consider for example a firm’s capital structure
decision, an important policy variable for most firms. In recent work, Lemmon, Roberts and
3 The Wall Street Journal’s business school rankings shows that “Fit with the corporate culture” is one of the most important attributes for M.B.A. recruiters, one which 74.5% of those surveyed say is “very important” (Wall Street Journal, September 20, 2006).
3
Zender (2006) show that firm-specific effects account for more than 90% of the explained
variation in capital structures across firms, whereas explanations based on standard models
account for about 6%. They conclude that the main determinants of cross-sectional variation in
leverage must thus be largely firm-specific and time-invariant, and to understand firms’ capital
structure decisions, one has to examine firm factors that remain largely fixed over long periods
of time.4 A firm’s corporate culture is one such factor.
A natural experiment of the following type would provide an ideal setting for an
empirical analysis of corporate culture. Suppose that a firm, for some exogenous reason, is split
up into at least two separate stand-alone firms. A concrete example is the 1984 antitrust split-up
of AT&T. After the split-up, the “Baby Bells” could choose their own practices independently
of “Ma Bell,” AT&T. Standard economic models predict that there should be no relation
between the policy choices of an “offspring firm” and those of its parent, after controlling for
year, industry, and firm factors. In contrast, the “corporate culture matters” view predicts that an
offspring firm would choose similar policies to those of the parent even when it operates as a
stand-alone firm because it shares its parent’s norms, values, and beliefs about the right firm
behavior. We would for example expect parent firms with abnormally low levels of leverage to
produce offspring firms which also have an abnormally low appetite for debt in their capital
structures. Because split-ups of AT&T-type are rare events, our analysis also involves stock-
market transactions, spinoffs, in which a business unit is spun off as a separate publicly traded
firm for reasons other than antitrust rulings.5
4 Analyzing extreme capital structure choices, Strebulaev and Yang (2006) find that a surprisingly large number of large U.S. firms (9%) have essentially no debt at all, and most importantly, this policy is found to be persistent over a long period of time. They test a number of explanations for such a zero-leverage policy, but they are not able to explain their results with any standard model. 5 The choice to spin off a business unit is often endogenous, and the evidence in the literature suggest that firms do spinoffs to improve incentive-based contracts (Schipper and Smith (1983)), facilitate mergers (Cusatis, Miles and Woolridge (1993)), or to allow parent managers to focus on their core operations (Daley, Mehrotra and Sivakumar
4
We use a simple and intuitive empirical methodology to examine whether a firm’s
corporate culture matters for its policy choices. In statistical terms, our definition of corporate
culture implies that the effect of a firm’s culture on a specific policy can be captured by a
component of the firm’s fixed effect in a panel regression framework. Thus, in a first step, for
each corporate policy of interest, we estimate the component of a firm’s policy choice that is
attributable specifically to the firm, controlling for industry effects, aggregate year-to-year
fluctuations, and time-varying firm characteristics. In a second step, using the estimated spinoff
and parent fixed effects from the first step, we examine whether a spinoff firm’s policy choice is
related to that of its parent. If corporate culture matters, we expect to find a positive correlation
between spinoffs’ and their parent firms’ corporate practices because shared norms and beliefs
about what is the right firm behavior make them both deviate in a similar way vis-à-vis a
benchmark sample of firms. That is, our empirical methodology identifies culture effects in firm
policies from behavior that is “inherited” by offspring firms from their parents.6
Our results are consistent with a firm’s corporate culture playing a role for firm policy
choices. We find that there is a strong and positive relation between spinoffs’ and their parents’
policy choices for a broad range of variables related to investment, financial, and operational
decisions. That is, spinoff firms seem to inherit important firm behavior from their parents. We
show that these associations are not likely to be the result of the endogenous choice to split up
the firm, and cannot be explained by alternatives such as governance or product market links.
(1997) and Ahn and Denis (2004)). Some of the potential biases introduced by the endogeneity of the spinoff decision do not seem to be working in favor of finding effects of corporate culture. For example, if a business unit is spun off because it has a different “subculture” than its parent, and therefore does not “fit in,” then we will find small corporate culture effects by studying this setting. 6 With a non-corporate setting in mind, several authors have previously proposed that an economic analysis of culture should involve behavior that is “inherited by an individual from previous generations” (Guiso, Sapienza and Zingales (2006), p. 24). Parents have a natural tendency to teach their children what they in turn have learned from their own parents, without a full reassessment of the current efficiency of these beliefs and practices (e.g., Bisin and Verdier (2000)).
5
Consistent with predictions from existing economic theories of corporate culture, we also find
that the corporate culture effects in firm policies are long-term, stronger for internally grown
business units, and older firms. Our evidence is also consistent with firms preserving their
cultures by selecting management teams that fit in their cultures. Finally, we find corporate
culture effects also in measures of firms’ economic performance.7
Our study complements a recently emerging literature which documents that individual
managers, such as CEOs and CFOs, play an important role for firms’ policy choices (e.g.,
Bertrand and Schoar (2003), Malmendier and Tate (2005), and Ben-David, Graham and Harvey
(2006)). Some of these authors have alluded to the possibility that corporate culture may matter
for firm policies, in addition to management style effects. For example, Ben-David, Graham,
and Harvey find that CFOs’ personal traits affect corporate decision, but at the same time they
suggest that “a latent firm characteristic, potentially corporate culture” (p. 26) may also explain
firms’ policy choices.
In using the parent-spinoff setting as a way to examine whether a firm’s corporate culture
matters for its policy choices, we recognize that important research has been done in the past, for
example on spinoff firms’ capital structure decisions (e.g., Mehrotra, Mikkelson and Partch
(2003) and Dittmar (2004)). However, for our purposes it does not matter whether spinoffs on
average have significantly lower leverage ratios than their parents, as found by these authors.
What we are interested in is whether a spinoff’s policy choices deviate from what standard
models prescribe in the same way as its parent.
7 Note that while we in this paper study corporate culture, some recent papers in economics and finance study the effects of national or regional culture differences. For example, Stulz and Williamson (2003) find that a country’s culture (measured by its principal religion) is a predictor of variation in creditor rights across countries. Guiso, Sapienza and Zingales (2005) find that cultural aspects, such as religion and genetic similarities, are important determinants of economic outcomes, e.g., trade and foreign direct investments between countries. For a comprehensive review of this emerging literature, see Guiso, Sapienza and Zingales (2006).
6
We proceed as follows. Section 2 briefly reviews existing economic theories of corporate
culture, and explains why corporate culture can matter for firm policies. Section 3 describes the
construction of our spinoff-parent dataset, and reports some descriptive statistics. Section 4
presents our empirical methodology. Section 5 reports our results and robustness checks.
Section 6 concludes the paper.
2. Economic theories of corporate culture
In a standard neoclassical model of the firm, corporate culture has no meaningful
economic role to play. Firms that have similar production technologies and inputs, and face the
same product market conditions, will choose a similar set of corporate policies and show similar
performance, no matter what corporate cultures they might have. Under this view, the role of
corporate culture is relegated to explain the overt behavior of firms’ workers, such as the firm’s
dress code (e.g., whether the firm has “casual Fridays”), the internal jargon, common gossip or
jokes about the firm’s founders, and the like.
However, starting with the seminal work by Kreps (1990), economists have explained
corporate culture using economic theory.8 Kreps sketches a model in which a firm’s culture acts
as a substitute for costly communication and contracting by specifying what the right firm
behavior is.9 In cases of unforeseen contingencies or when multiple equilibria exist, a firm’s
culture is the set of shared expectations that provides a mechanism for making decisions. He
concludes that a firm’s culture thus “gives identity to the organization” (Kreps (1990, p. 256)).
Modeling how identity affects economic outcomes, Akerlof and Kranton (2000, 2005)
argue that agents within an organization can lose utility if they deviate from the norms prescribe
8 Hermalin (2001) provides an extensive review the existing economic theories of corporate culture. 9 Crémer (1993) models corporate culture as a stock of shared information, such as common knowledge about the right firm behavior, possessed by all workers, and shows how such shared beliefs help in aligning actions.
7
by the organization. In their view, corporate culture is “the division of workers into different
groups, the prescribed behavior for each group and the extent to which workers identify with the
organization or with the work group and adopt their respective goals” (Akerlof and Kranton
(2005, p. 10). Using the idea of norms, Akerlof (2006) describes how a firm can pursue different
types of policies because the norms in the firm define the right behavior for the manager. These
theories provide a role for corporate culture in economics, and imply that a firm’s culture can
matter for its choices of policies and strategy (and not only for the decision to have casual
Fridays).
Theory argues that a firm’s culture can arise and be preserved through several economic
mechanisms. Kreps (1990) argues that as firms adapt to unforeseen contingencies, they find out
what works and what does not work and this forms the basis of what the right behavior is.
Kreps’s theory does not involve changing employees’ preferences. His theory just requires
employees to have expectations of what is the right thing to do; they can hate the norms, but they
follow them because they expect others to do the same because deviations from the norm are
costly.
Another set of models argues that employees can over time internalize a firm’s corporate
culture (Akerlof and Kranton (2000) and Lazear (1995)). For example, in the evolutionary
model by Lazear, preferences are like genetic endowments, and when an employee in the firm
meets (“mates with”) another employee, he is replaced by a new one, whose preferences is a
mixture of his former preferences and those of the employee he met.10
A final set of economic theories of corporate culture formalizes the notion that workers
may be selected from the population based on how they “fit in” a firm’s culture (Lazear (1995)
10 Lazear (1999) uses a random encounter model to analyze common language as one aspect of a culture.
8
and Van den Steen (2005a, b)).11 For example, Van den Steen models how a firm selects and
promotes like-minded employees who share similar beliefs about the right firm behavior. In his
models, the shared beliefs can remain in the firm even when all original members of the firm
have exited. Thus, a firm’s culture is pervasive and largely independent of the management.
These economic theories of corporate culture come with some directly testable
hypotheses. First, each theory predicts that a firm’s culture remains largely fixed over long
periods of time because it is costly and takes time to change established norms, values, and
beliefs within a firm. Theory also predicts that the culture is stronger in firms that have grown
internally, rather than through mergers and acquisitions, and there is experimental evidence
supporting the notion of “culture clashes” in mergers.12 In addition, both Lazear’s (1995) and
Van den Steen’s (2005a, b) models predict that a firm’s culture is stronger in older and more
established firms because internalization of a firm’s culture takes time. Also, since a firm hires
from the overall population, it comes to be dominated by one type of employees only through
selection or selective hiring, both of which are costly and take time. Finally, Lazear’s (1995)
theory predicts that small firms are more likely to have strong cultures, because direct
interactions with other employees are relatively more frequent in smaller firms.
3. Data
3.1. Data sources and construction of dataset
Our dataset of spinoff-parent pairs comes from the Securities Data Corporation (SDC)
Mergers and Acquisitions Database and New Issues Database, which contains data starting in
11 See also the model by Bernhardt, Hughson and Kutsoati (2006), in which a firm’s managers select to hire and promote employees with similar skills as their own, because they can evaluate the employees easier. 12 In the experiment by Weber and Camerer (2003), subjects in “firms” are allowed to develop a culture, and when two firms merge, performance is found to decrease, subjects overestimate the performance of the merged firm, and attribute the decrease in performance to members of the other firm.
9
1980. SDC reports the announcement and effective dates, the names and CUSIPs of the spinoff
and the parent firms, and other information about the transactions. The resulting raw dataset
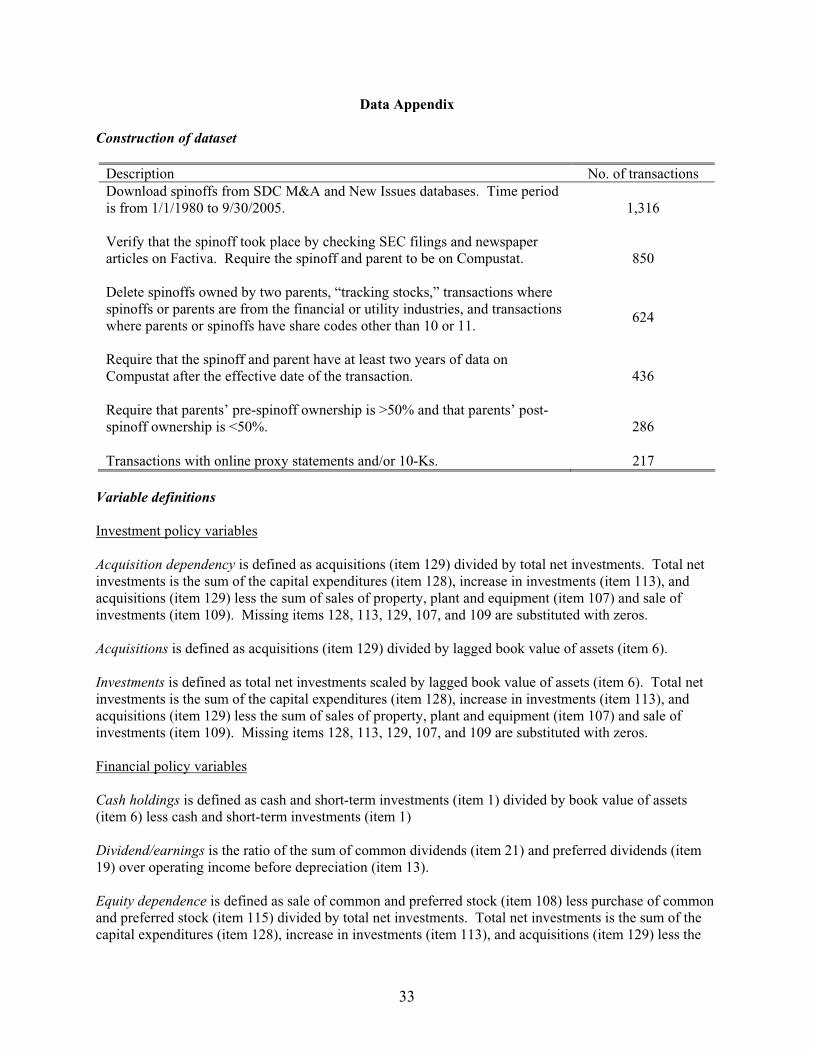
consists of 1,316 completed spinoff-parent pairs from 1/1/1980 to 9/30/2005.
We then carefully clean the raw dataset in the following way:
i.) We check that the transactions in the SDC databases were completed, and we exclude
transactions that cannot be confirmed by searching SEC filings and news articles on
Factiva.
ii.) We require the spinoff and parent firms to be in the Compustat-CRSP merged database.
iii.) We drop spinoffs owned by multiple parents, “tracking stocks,” transactions where the
spinoff or parents are from the financial or utility industries, and transactions where
parents or spinoffs have share codes other than 10 or 11, such as REITs and closed-end
investment funds.
iv.) We require the spinoff and parent firms to have at least two years of data on Compustat
after the effective dates of the transactions.
v.) We exclude spinoff firms that are the direct result of mergers.
vi.) We require that parents’ pre-spinoff ownership is >50%, and that parents’ post-spinoff
ownership is <50%.13
The resulting dataset consists of 286 spinoff-parent pairs. For 217 spinoff transactions, we are
able to complement the data from SDC by hand-collecting data on firms’ corporate histories,
governance and product market links, and management team backgrounds from online SEC
filings, downloaded from the Thomson ONE Banker database. The Data Appendix has further
details on the dataset construction.
13 This requirement makes sure that the parent does not control the spinoff after the transaction, in which case consolidation of balance sheets would introduce a mechanical positive relation between a majority-controlled spinoff and its parent for some of the corporate variables that we analyze.
10
For this dataset of parent-spinoff pairs and a benchmark sample of Compustat firms, we
construct a panel of annual accounting variables from 1980 to 2004. Our analysis involves a
broad range of important firm policies: investment policy (investments, acquisitions, acquisition
dependency), financial policy (leverage, debt maturity, interest coverage, equity dependence,
cash holdings, dividends), and operational policy (research and development expenditures
(R&D), advertising expenditures, selling, general, and administrative expenditures (SG&A)).
We also analyze corporate culture effects in firms’ performance, measured by return on assets
(ROA) and return on sales (ROS). Our set of control variables includes lagged logarithm of
book assets, cash flow, lagged q, lagged ROA, and lagged net property, plant, and equipment
(PPE). The definitions of all variables are available in the Data Appendix.
3.2. Summary statistics
Table 1 reports means, medians, and standard deviations of the corporate policies of
interest from 1980 to 2004.14 The first set of columns presents descriptive statistics for the
spinoff firms. The middle set reports statistics for the parents. As a comparison, the final set of
columns reports statistics for the other Compustat firms (i.e., excluding spinoff and parent firms)
over the time period studied. We note that parent firms have similar rates of investment and
acquisition intensity compared to their spinoffs and to other Compustat firms. Both book
leverage and short-term leverage are also similar across the subsets of firms. The mean values of
equity dependence, which is a proxy for the fraction of investments financed by equity, indicates
that parent firms depend less on equity financing than do spinoffs and other Compustat firms.
Parents also pay more dividends, and hold less cash. Some of these differences can be explained
by differences in firm characteristics. For example, parents are more profitable, have higher cash
14 We winsorize all accounting variables at the 1% level in both tails to deal with extreme values.
11
flow and lower q, and the average parent is much larger than the average spinoff. We therefore
control for these firm characteristics in our empirical models of firms’ policy choices.
4. Empirical methodology
An implication of the economic theories of corporate culture discussed in Section 2 is
that a firm’s culture is specific to the firm and largely fixed over long periods of time. That is, a
firm’s culture can be viewed as a component of the firm’s fixed policy effect in a panel
regression framework. The first step of our analysis is therefore to estimate the following OLS
regression specification for each policy variable of interest:
, , ,i t t i t s p c b i ty X e s p c b (1)
where ,i ty is a firm policy variable for firm i in year t, t is a year fixed effect, ,i tX is a vector
of time-varying firm-level controls, and ,i te is an error term. To account for industry differences,
,i ty and ,i tX are industry-adjusted each year by subtracting the two-digit SIC code industry
means from the raw values.
The remaining variables are firm fixed effects: s is a vector of spinoff fixed effects, p
is a vector of parent fixed effects, c are fixed effects for combined firms prior to the split-ups,
and b are fixed effects for benchmark firms, i.e., Compustat firms that are neither parents nor
spinoff firms. It is important not to measure the parent fixed effects using years prior to the split-
up as the consolidation of balance sheets would then mechanically introduce a positive relation
between spinoff and parent fixed effects in step two of our analysis.
We can provide some more intuition for our identification strategy in this parent-spinoff
setting. Each parent and spinoff fixed effect can be decomposed into two parts: p p pc o and
12
s s sc o . The first component is shared among a spinoff and its parent (i.e., s pc c ). This
commonality arises because the two firms share a corporate culture.15 The second component is
not shared. so captures an effect that is specific to a spinoff but not shared with its parent, and
vice versa for po . From equation (1), it is not feasible to identify the culture component
separately from the non-shared component. Our identification strategy is therefore to use the
split-up of the firm to estimate firm behavior that is inherited by a spinoff firm from its parent.
The second step therefore involves estimating the following OLS regression specification
for each policy variable of interest:
, ,j s j p ja b u (2)
where ,j s and ,j p have been defined above, ju is an error term, and j denotes specific spinoff-
parent pairs.16 We estimate this equation with robust standard errors (White (1980)). Standard
economic models predict that there should be no relation between the policy choices of an
offspring firm and those of its parent, after controlling for year, industry, and firm factors. In
contrast, the “corporate culture matters” view predicts a positive and statistically significant b in
equation (2) because a spinoff firm inherits its parent’s norms, values, and beliefs about the right
firm behavior, i.e., the spinoff inherits the parent’s corporate culture.
15 A firm’s corporate culture can directly involve a particular policy variable. In an interview in an August 2006 issue of BusinessWeek, Dell Computer’s CEO describes the firm’s culture, and notes that “Being a hero at Dell means saving money,” illustrating Dell’s “cost cutting culture.” On the other hand, a firm’s corporate culture can also be one of, for example, risk aversion or conservatism, such as the culture of Morgan Stanley, mentioned in the introduction. In this case, the effect on firms’ policy choices is more indirect. 16 We recognize that the right-hand-side variable in equation (2) is an estimated coefficient from the first step, which is noisy by definition. This will lead to a downward bias in an OLS estimation of b in the second step. In subsection 5.3, we therefore also use an alternative estimation method that involves regressions on the collapsed dataset, and we also use a simulation procedure to estimate the empirical distribution of b, thus allowing us to learn about the properties of the estimated coefficient. In unreported regressions we have also used a weighted least squares (WLS) estimation procedure to account for the measurement error in the right-hand-side variable, where we weigh each observation by the inverse of the square root of the number of years for which the right-hand-side variable was estimated in the first step. Using this WLS procedure produces similar results.
13
We recognize that there must have been some economic reason for why the parent and
spinoff firms were organized as a combined firm in the first place. For example, they might have
shared some production technology, allowing them to exploit economies of scale or economies
of scope. Changes in the firm’s environment can eliminate such benefits, prompting a split-up of
the firm.17 However, although the firm splits up, the parent might still retain a significant equity
ownership stake in the spinoff, creating a governance link, or there might be a customer-supplier
relationship between the firms. Like shared norms and beliefs about the right firm behavior,
such economic links can also result in commonality in spinoffs’ and parents’ policy choices. In
our analysis we will therefore consider, as carefully as our dataset allows, economic links that
remain between parents and their spinoffs after they split up.
5. Results
5.1. Firm fixed effects in firm policies
Table 2 reports firm fixed effects distributions and model fit measures from estimating
equation (1) for investment, financial, and operational policies. For each policy, we describe the
distribution by reporting the mean, standard deviation, and the 10th and 90th percentiles. We
find that the average spinoff firm is more similar to the average parent firm than the benchmark
sample of other Compustat firms, but there is significant heterogeneity in the firm fixed effects:
the standard deviations and the differences between the 10th and 90th percentiles are very large
for all distributions. The table also shows that firm fixed effects matter economically and
statistically for all policy variables. Each F-test rejects the null hypothesis that all firm fixed
effects are zero (p-values < 0.00), and the average increase in adjusted R-square when we
include firm fixed effects is about 25 percentage points. The evidence that the main
17 See, e.g., Zingales (2000) for a discussion of changing firm boundaries.
14
determinants of variation in policy choices across firms are firm-specific and time-invariant is an
important motivation for our search for corporate culture effects in firms’ policy choices.
5.2. Corporate culture effects in firm policies
Table 3 examines the relation between spinoffs’ and parents’ policy fixed effects.
Column (1) reports the number of observations. Column (2) reports coefficient estimates of b
from equation (2) for the different sets of corporate policies. Column (3) reports standardized
coefficients, which measure the relation between spinoffs’ and parents’ policy choices in
numbers of standard deviations, thus facilitating comparisons across policies. Column (4)
reports R-squares. The number of spinoff-parent pairs available for analysis varies across
policies due to missing data.
Overall, the findings show that parents and spinoffs are similar in terms of their policy
choices. All the 12 estimated coefficients of b in equation (2) are positive and statistically
significant at least at the 10% level. This evidence suggests that spinoffs inherit some firm
behavior from their parents even after they split up and operate as separate stand-alone firms.
The standardized coefficients, ranging from 0.11 to 0.45, show that there are differences as to
which policies are correlated the most. Also, the average R-square across policies is about 9%,
with the highest being 20%, and points to the economic importance of the estimated relations.
We now discuss our results in more detail.
The first variable in Table 3 that we analyze is investments, measured as net investments
scaled by lagged book value of assets.18 The relation between spinoffs’ and parents’ investments
is positive and significant at the 1% level. Parents and their spinoffs are also similar in terms of
18 The results are unaffected if we use alternative measures of investments, such as capital expenditures over lagged net property, plant, and equipment.
15
acquisitions activities (measured by acquisitions scaled by lagged book value of assets) and their
acquisition dependency, as shown by the positive and significant coefficients. The latter variable
is our proxy for a firm’s growth strategy, and measures the extent to which a firm relies on
acquisitions rather than internal growth. Thus, spinoff firms and their parents display similar
investment behavior even after they split up.
Next, we examine financial policies. There are strong positive correlations also between
spinoffs’ and parents’ capital structure decisions. Parents and their spinoffs have similar
leverage; the estimated coefficient is positive and significant at the 1% level.19 The result is
similar if we analyze other leverage measures, such as a firm’s interest coverage ratio, i.e.,
income before depreciation divided by interest expenses. Thus, offspring firms seem to inherit
their parents’ appetite for debt. Parent firms with, say, abnormally low levels of leverage tend to
produce spinoffs which also have an abnormally low appetite for debt in their capital structures.
This evidence is interesting in light of recent studies that find that “informal rules” guide firms’
debt policy (Graham and Harvey (2001)) and that firm fixed effects largely explain leverage
policy (Lemmon, Roberts and Zender (2006)). We notice strong similarities also in choices of
debt maturity, measured by the portion of short-term debt in the capital structure.20 We also see
19 Our results are not affected by using alternative measures of book leverage, e.g., the sum of long-term debt and debt in current liabilities over the sum of long-term debt, debt in current liabilities, and the book value of common equity. The results are also unaffected by the use of market-value based capital structure variables. We prefer to use a book value measure in our reported specifications because of the evidence of stock market mispricing around some equity-carveout transactions (Lamont and Thaler (2003)). 20 A much more detailed examination would involve analyzing the relation between parents’ and spinoffs’ debt durations. Unreported regressions show that the estimated coefficient is positive for a firm’s debt duration, but it is not statistically significant. One plausible explanation for this result is that our proxy for debt duration is very noisy, e.g., we do not have data from Compustat on the exact maturity of any debt with a longer maturity than five years. Another reason is that while a firm’s corporate culture may matter for overall capital structure decisions, it may not affect very detailed capital structure decisions, after controlling for year, industry, and firm factors.
16
that parents and spinoffs also choose similar levels of cash holdings, after controlling for year,
industry, and firm factors.21
One obvious concern is that some of the positive associations for these financial policies
may be mechanical, since they are based on balance sheet items. For example, if there is no debt
in the combined firm prior to the split-up, then the spinoff cannot receive any debt from its
parent. Because of these concerns, we also analyze a financing flow measure: equity
dependence, measured by net sale of equity as a fraction of investments (see, e.g., Rajan and
Zingales (1998)). We find positive and significant associations for this flow measure. Thus,
spinoffs that access external equity markets more for financing are likely to come from parents
that do the same. Because our variables are industry-adjusted, the fact that some industries are
more dependent on equity financing than others cannot explain this result.
We also analyze dividend policy. Parents and their spinoffs have similar payout policy;
the estimated association is positive and significant at the 5% level. Since the study by Lintner
(1956), it is well-known that firms’ payout ratios are sticky.22 Our results complement existing
evidence on dividend policy choices by suggesting that the behavior of sticky payout ratios is
strong enough to survive the split-up of a firm. Offspring firms that pay out low dividends are
likely to originate from parent firms that also have low payout ratios.
Finally, we also examine various operational policies. Similar to the other policies
analyzed, the relations between spinoffs’ and parents’ R&D policy, marketing policy (measured
by the ratio of advertising expenses to sales), and cost cutting policy (measured by the ratio of
21 An alternative measure of cash holdings, commonly used by CFOs and other practitioners, is the firm’s quick ratio, measured as current assets less inventories scaled by current liabilities. Since all results in this study are unaffected if we analyze quick ratios rather than cash holdings, and since much more work has been devoted in the literature to explaining cash holdings (e.g., Opler, Pinkowitz, Stulz and Williamson (1999)) than quick ratios, we choose not to report our results on quick ratios in the tables. 22 For a recent study of dividend policy, see Brav, Graham, Harvey and Michaely (2005). Their evidence provides little support for standard models of payout policy, such as agency, signaling, and clientele hypotheses.
17
selling, general, and administrative expenses to sales) are positive and significant at least at the
10% level. One interpretation of this evidence of strong and pervasive similarities across a broad
range of policies is that spinoff firms and their parents share a corporate culture, i.e., they share
norms, beliefs, and expectations about right firm behavior.
5.3. Robustness of results
We perform a series of tests to verify the robustness of the above results. First, in Table
4, we present results from an alternative estimation method where we first collapse our industry-
adjusted dataset at the firm level, and then reestimate the relations between spinoff firms’ and
parents’ policy choices. More specifically, starting with the firm-year dataset, we compute
within-firm means of the industry-adjusted policy variables for spinoffs and parents using all
available years of data after the split-up. In column (1), we then report Spearman’s rank
correlation coefficients. We find that all correlations are positive and significant at the 1% level.
In column (2), we regress the collapsed data for spinoffs on those of their parents. Again, all
associations are positive and statistically significant. In column (3), we replicate the regression
of the previous column, but add the same set of firm-level controls for spinoff firms as in our
firm fixed effects regressions. We find that all relations but one are positive and significant.
Second, because the variables in equation (2) are estimated with error, one worry is that
the distribution of the estimated b is non-normal, and that we overstate the significance level in
Table 3. We therefore use a simulation procedure to obtain the empirical distribution of b. We
reassign each spinoff to a random Compustat firm, and reestimate b.23 This procedure is
23 We reestimate the following model:
s sim sim b sima b u (3)
where s and b are randomly matched pairs of spinoffs and Compustat benchmark firms.
18
repeated 100,000 times per policy. Table 5 shows that the estimates of b all fall above the 95th
percentile of the simulated distributions. Because this procedure does not take into account that
parent firms may be different from other Compustat firms, an alternative is to reassign each
spinoff to a random parent, and then reestimate b.24 Again, the table shows that the estimates of
b fall above the 95th percentile of the simulated distributions. Thus, inferring statistical
significance based on the simulated distributions does not alter our conclusion regarding
similarities of spinoffs’ and parent firms’ policy choices.
Finally, we verify that spinoffs’ and parents’ policy choices are more similar than what is
to be expected if we instead compare parents to firms that appear very similar to actual spinoff
firms. We therefore match each spinoff based on industry, firm size and q. A “placebo spinoff”
is in the same two-digit SIC industry as the actual spinoff, and has firm size that is 70% to 130%
of the spinoff’s. The firm with the closest q is selected as the placebo.25 Table 6 shows that only
one policy, equity dependence, is associated with a positive and significant coefficient when
estimating the relation for parents’ and their placebo spinoffs, and the economic magnitude is
much smaller than in Table 3. An alternative is to match each spinoff firm to another firm in the
same industry that goes public within +/- 1 year of the split-up, but that is not the result of a
spinoff. If more than one firm meets this criterion, the firm with the closest size is selected as
the placebo. Again, the table shows that none of the estimated relations are positive and
significant. That is, spinoffs’ and parents’ policy choices are more similar than what is to be
expected if comparing parents to firms that appear very similar to actual spinoff firms.
24 We reestimate the following model:
s sim sim p sima b u (4)
where s and p are randomly matched pairs of spinoffs and parents, i.e., p’ is most often not equal to p.25 The procedure of matching based on industry, size, and q follows the standard in the finance literature (see, e.g., Barber and Lyon (1997)).
19
5.4. Are the effects long-term?
Each economic theory of corporate culture that we discuss in Section 2 predicts that a
firm’s culture remains largely fixed over long periods of time because it is costly and takes time
to change shared norms, values, and beliefs that exist within a firm. We therefore test whether
the positive relations between spinoffs’ and parents’ policy choices are long-term rather than
transitory. We do so by estimating the spinoff and parent fixed effects in equation (1) starting T
years after the split-up, and then correlating these fixed effects by estimating equation (2).
Evidence that the effects persists over time would be economically more interesting and also
more convincing that we are documenting a culture effect and not simply transitory effects.
The first set of columns of Table 7 present results for T = 1, i.e., we estimate the fixed
effects starting one year after the split-up. Excluding the first year does not alter our results. The
middle set of columns examine longer term effects by reporting results for T = 5. All the
relations between spinoff firms’ and parents’ policy choices are positive and all but two are
significant at the 10% level. The final set of columns report results for T = 10 years.26 We see
that all of the relations remain positive, and all but three are statistically significant. Most
importantly, all the coefficients that were strongly significant in Table 3 remain significant over
the longer term. Thus, more than a decade after the firms split up into separate stand-alone
firms, we find that parents and spinoff firms still behave very similarly when compared to other
Compustat firms.27
26 Because our dataset starts in 1980 and because firms exit the panel, we lose an average of 77% of the spinoff-parent pairs when we set T = 10 years, preventing us from analyzing the effects over an even longer period of time. 27 In principle we could also study spinoffs that are spun off from firms that are themselves spinoff firms, and examine how similar their policy choices are to those of their “grandparent” firms. However, there are only nine such transactions in our dataset, preventing us from any statistical analysis.
20
5.5. Observable firm characteristics and corporate culture effects
We have so far presented suggestive evidence that there are corporate culture effects in
firms’ policy choices: offspring firms seem to inherit firm-specific practices from their parents
after they have split up and these similarities remain strong even after long periods of time. In
this sub-section, we provide evidence to show that the similarities correlate with several firm
characteristics that determine the strength of a firm’s culture. Economic theories of corporate
culture provide specific predictions for what characterizes firms in which we can expect the
shared norms, values, and beliefs to be particularly strong. Thus, based on these theories we can
predict which offspring firms will inherit more of their parents’ behavior. Evidence based on
tests of these theories would not only provide more convincing evidence that a firm’s corporate
culture matter for its policy choices, but also shed light on how a firm’s culture affects its
behavior.28
5.5.1. Internal growth versus mergers and acquisitions
Economic theories on corporate culture and experimental evidence on culture clashes in
mergers suggest that a firm’s culture is stronger in firms that have largely grown internally,
rather than through mergers and acquisitions.29 We therefore expect corporate culture effects to
be stronger in business units that are the product of internal growth. To test this prediction, we
start by collecting data on the spinoff firm’s corporate history, in particular how the spinoff
became a business unit of the parent. Our data sources are SEC filings and newspaper articles.
28 The firm characteristics we study in this paper are only a small subset of those that we think might be related to the strength of a firm’s culture. However, to limit the risk of estimating spurious correlations, our focus is on firm characteristics for which economic theories of corporate culture have specific predictions. 29 The relevance of this argument relies on the assumption that some firms select to merge although their respective corporate cultures are not perfectly similar. While an important question for future research, it is beyond the scope of this paper to systematically examine whether corporate culture matters for which firms select to merge. However, we note that many news paper articles seem to suggest that there are culture clashes in some mergers.
21
We find that 46% of the spinoff firms are the result of internal growth within the parent rather
than a merger or acquisition. Next, we add to equation (2) an interaction term between the
parent fixed effect and a dummy variable for whether the spinoff firm is the result of internal
growth. The first set of columns in Table 8 show that most of the interaction terms are positive
and significant. That is, spinoffs seem to inherit relatively more of their parents’ behavior when
they are the product of internal growth compared to when they are the result of a merger or
acquisition. This evidence supports our conjecture that firms’ corporate cultures can explain
their policy choices. Implicitly, this evidence also suggests that in some mergers and
acquisitions, firms’ corporate cultures may clash.
5.5.2. Firm age
Several of the models discussed in Section 2 predict that a firm’s corporate culture is
stronger in older and more established firms because internalization of a firm’s culture and
selective hiring take time and are costly (e.g., Lazear (1995) and Van den Steen (2005a, b)).
Therefore, the corporate culture effects are likely to be stronger in older parents. We measure
firm age for the parent at the time of the split-up by computing the number of years that the
parent has been in the Compustat database. We separate the parents into two groups, older
versus younger firms, based on the median age.30 With this cutoff, the average age among older
parents is 43 years, compared to only 14 years for younger ones. We then add to equation (2) an
interaction term between the parent fixed effect and a dummy variable for whether the parent is
an older firm. The majority of the interaction terms in the middle set of columns in Table 8 are
30 Although standard in the literature, this is clearly a crude proxy of firm age because some firms may go public, and thus enter the Compustat database, when they are older firms. Also, the firm age of some older firms is downward biased because the Compustat database does not start till 1950. However, it seems unlikely to us that potentially noisy estimates of firm age would introduce any systematic bias in our analysis.
22
positive and significant. That is, spinoffs seem to inherit significantly more of their parents’
corporate practices when they come from older parents compared to when they come from young
ones. This evidence is consistent with theories that argue that a firm’s shared norms, beliefs, and
expectations about the right firm behavior are stronger in older and more established firms.
5.5.3. Firm size
Lazear’s (1995) model predicts that smaller firms have stronger corporate cultures
because direct interactions among employees are more frequent in smaller firms. Our proxy for
firm size is the total number of employees of the combined firm as of the fiscal year end just
prior to the split-up. Because the average parent firm is larger than the average Compustat firm,
we use the median size among all Compustat firms to separate parents into two groups: larger
and smaller firms. With this cutoff, the average size among larger parents is 15,500 employees,
compared to only 260 for smaller parents. Next, we add to equation (2) an interaction term
between the parent fixed effect and a dummy variable for whether the combined firm is a smaller
firm. We find that only three of the interaction terms in the final set of columns in Table 8 are
significant, two of them positive while the other is negative.31
These insignificant interaction terms contrast sharply with our results for the other
observable firm characteristics that we analyze. Although shared norms and beliefs may be
propagated more easily within smaller firms, the benefits from a stronger corporate culture might
be greater in larger firms, where coordination problems regarding policy and strategy choices are
common and can be very complex.32 As argued by Hermalin (2001), the benefits to investing in
31 In unreported regressions, we also use the book value of total assets as an alternative proxy for firm size. The results are very similar, except that the negative interaction term on dividend policy is no longer significant. 32 Consider for example General Electric (GE). The business press often suggests that the “GE culture” is very strong, although GE is a very large company with business units all over the world and in many different industries.
23
a stronger corporate culture can therefore be greater in larger firms. If both of these opposing
economic mechanisms are at work in equilibrium, then the lack of an association between firm
size and the extent to which offspring firms inherit their parent firms’ behavior is not surprising.
5.6. Management and corporate culture effects
Economic theories of corporate culture predict that managers and workers are, at least in
part, selected from the population based on how they will “fit in” a firm’s corporate culture
(Lazear (1995) and Van den Steen (2005a, b)). That is, firms select and promote like-minded
employees who share similar beliefs about the right firm behavior. We therefore expect that the
extent to which offspring firms inherit their parents’ policy choices is not any less significant
when an outside CEO or management team, with little or no prior exposure to the firm’s culture,
is brought in to run the spinoff firm.
To test this prediction, we collect data on management’s background from the biography
sections of firms’ SEC filings. We find that 18% of the spinoff CEOs are outsiders in the sense
that they have a background of at most three years in the combined firm prior to the split up.
This three-year requirement is arbitrary but helps ensure that spinoff managers have little or no
exposure to the parent firm’s corporate culture prior to managing the spinoff firm. We then add
to equation (2) an interaction term between the parent fixed effect and a dummy variable for
whether the spinoff CEO is an outsider. We find that none of the interaction terms in the first set
of columns in Table 9 are significant at the 10% level. The joint F-tests show that, for five
policies, we cannot reject the null hypothesis of no inherited behavior when an outside CEO is
brought in. Because relatively few CEOs are outsiders, we also add an interaction term between
the parent fixed effect and a dummy variable that is one if the spinoff’s management team has
24
more outsiders than the median spinoff firm. Only one of the interaction terms in the second set
of columns is negative and significant at the 10% level. The joint F-tests are not significant for
five of the firm policy variables we study.
Our results suggest that offspring firms’ policy choices are somewhat less similar to those
of their parent when an outside CEO or management team is brought in to run the spinoff firm.
This evidence complements a recently emerging literature which documents that top managers
matter for firms’ policies because they have their own individual “style” (e.g., Bertrand and
Schoar (2003), Malmendier and Tate (2005), and Ben-David, Graham and Harvey (2006)).
However, consistent with theories of selective hiring, we also find that firm behavior is inherited
even when those with little or no prior exposure to the firm’s culture are brought in as top
managers. Thus, a firm’s culture is a latent firm characteristic that do not come and go with a
specific CEO or management team.
5.7. Corporate culture and firm performance
If a firm’s corporate culture affects its policy choices, we would expect it to ultimately
matter also for its economic performance (Kreps (1990) and Hermalin (2001)). In Table 10, we
therefore study culture effects in corporate performance measures by estimating the relation
between spinoffs’ and parents’ performance fixed effects. One measure we examine is the rate
of return on assets, measured by the ratio of operating income before depreciation (EBITDA)
divided by lagged book assets. We also examine the firm’s return on sales, where we scale
operating income by total revenues rather than assets. We focus on these two measures because
the numerator is cash flows from a firm’s operations, and thus not particularly sensitive to a
25
firm’s specific accounting practices.33 Consistent with corporate culture effects in firm
performance, we find a positive and significant relation between spinoff firms’ and parents’
corporate performance. Thus, better-performing parents seem to produce better-performing
offspring firms, after controlling for year, industry, and firm factors.
However, our evidence also suggests that a firm’s corporate culture is an economic
mechanism through which poor corporate performance can persist: poorly performing spinoffs
tend to come from parent firms that are themselves not performing well.34 This evidence
supports economic theories of corporate culture which suggest that a potential cost of a firm’s
culture is that the firm’s shared norms, beliefs, and expectations sometimes make it difficult to
change firm behavior even when doing so is required by the firm’s environment (e.g., Lazear
(1995)). Thus, although the shared cultural norms in a firm likely were efficient when they were
first introduced, they might continue to be instilled into managers and workers even after they
are no longer efficient.35
5.8. Alternative explanations
Like a common corporate culture and shared norms and beliefs about the right firm
behavior, economic links that remain between parents and their spinoffs after they split up can
also result in commonality in policy choices and corporate performance. In our analysis below,
we therefore consider whether governance links, industry links, customer-supplier relationships,
33 While an important question for future research, it is beyond the scope of this paper to systematically examine the relevance of a firm’s corporate culture for specific accounting practices and earnings management. A firm’s corporate culture may matter for the aggressiveness of a firm’s accounting practices, or even the likelihood of corporate fraud. 34 As a robustness check, we have verified that the performance similarities between spinoffs and their parents are present also among firms that perform very poorly. There is a positive and significant performance relation among parent-spinoff pairs for which parents’ performance fixed effects are negative, i.e., for which parents underperformed the benchmark sample of Compustat firms, after controlling for year, industry, and firm factors. 35 For examples of delayed adjustment behavior of culture in a non-corporate setting and for a discussion of some explanations for such behavior, see Guiso, Sapienza, and Zingales (2006).
26
or contractual agreements regarding shared assets can explain the observed similarities between
spinoffs and their parents.
5.8.1. Governance links
To examine whether governance links can explain our results, we first examine equity
ownership by the parent after the split-up. A parent firm that retains significant equity ownership
might be able to influence the spinoff towards firm behavior that the parent firm considers
appropriate, which is likely to be the behavior of the parent itself. To check that our results are
not driven by such ownership stakes, we reexamine our main results in Table 3 by focusing on
spinoff-parent pairs where the parent retains no ownership after the split-up. We find that 87%
of the parents retain no equity ownership. Conditional on a parent retaining a stake, the mean
equity ownership is 29%, ranging from 6.4% to 49.9%. The first set of columns in Table 11
shows that the relations between parents’ and spinoffs’ policy choices and firm performance
measures are positive and all but one are statistically significant when we focus on transactions
where the parent retains no equity ownership after the split-up.
Next, we focus on governance links where the parent firm’s CEO sits on their spinoff’s
board of directors after the split-up, thereby potentially influencing the spinoff’s policy choices
and performance. Data from firms’ SEC filings show that 34% of the parent CEOs sit on the
spinoff’s board, although many likely sit there only temporarily, till a new slate of directors has
been elected. The second set of columns shows that the relations between parents’ and spinoffs’
policy choices and performance are positive, and all but two are significant at least at the 10%
level. Thus, alternative explanations based on parental influence through equity ownership or
parent CEO’s board seat are unlikely to explain our results.
27
5.8.2. Product market links
We first examine whether industry links not captured by industry adjustment of the
policy and performance variables can provide an explanation for why spinoff firms inherit their
parents’ behavior. That is, firms in the same industry are more likely to share commonalities that
may not be captured by our control variables. For example, spinoffs and their parents may share
the same production technology relevant to the industry. To verify that our results are not driven
by such industry links, we first focus our analysis on spinoffs and parents that operate in
different industries after the split-up. Defining industries according to three-digit SIC codes, we
find that 73% operate in different industries.36 The first set of columns in Table 12 shows that
the relations between parents’ and spinoffs’ policy choices and operating performance measures
are positive and all but two are statistically significant. Thus, industry links and commonalities
that come from same-industry affiliations are unlikely to explain our results.
Next, we turn to more specific product market relationships after the split-up. Suppose
that the parent is a major customer of the spinoff.37 Then the parent (spinoff) firm can
potentially affect the policy choices and the profitability of the spinoff (parent) also bound by the
relationship.38 To check that such links do not drive our results, we now focus on spinoffs that
do not have a major customer or supplier relationship with their parent. We use data from the
Compustat customer segment files.39 The vast majority, 85%, of our sample does not have any
such relationships after the split-ups. The middle set of columns shows that the relations
36 The results are unaffected if we use two-digit or four-digit SIC codes to define industries. 37 A specific example of such a parent-spinoff pair is Ford Motor Company and its spinoff, parts-supplier Visteon Corporation. Ford is a rather extreme case in that the firm makes up as much as 74% of Visteon’s total sales during the period that we study. 38 In recent studies, Kale and Shahrur (2006) find that the characteristics of a firm’s suppliers and customers matter for its capital structure decisions, and Cohen and Frazzini (2006) find that an economic shock to a firm can have an effect on its customers. 39 Regulation SFAS No. 131 requires firms to report customers representing more than 10% of the total sales in financial reports to shareholders.
28
between parents’ and spinoffs’ policy choices and profitability measures are positive, and all but
one are statistically significant when we focus on transactions where there is no customer-
supplier relationship after the split-up. Thus, an alternative explanation based on customer-
supplier relationships is unlikely to explain our results.
Finally, we verify that our results are not driven by parents and spinoffs that share control
over a critical asset or production technology, e.g., strategic alliances or shared patents. We
consider shared assets to be “material” if they are reported in firms’ SEC filings. We find that
85% of the spinoff-parent pairs do not share assets after the split-up. The final set of columns
shows that the relations between parents’ and spinoffs’ policy choices are positive, and all but
three are significant at least at the 10% level. The performance relations are significant at all
levels. Thus, shared assets cannot explain most of our results for policy choices, and they cannot
explain our firm performance results. It is possible that there exist contracts between parents and
their spinoffs that are not disclosed in SEC filings. However, it seems unlikely that contractual
agreements that are not sufficiently important to be reported in SEC filings would be a
significant driver behind any of our results.
6. Conclusion and extensions
The contribution of this paper is to bring the notion of corporate culture into a formal
empirical analysis of firm policies and performance. To do so, we construct a parent-spinoff
firm dataset which enables us to identify corporate culture effects in firm policies from behavior
that is inherited by a spinoff firm from its parent after the firms split up and operate as separate
stand-alone firms. Our results are consistent with a firm’s corporate culture playing a role for its
policy choices. We find strong and positive relations between spinoffs’ and their parents’ policy
29
choices for a broad range of variables related to investment, financial, and operational decisions.
Consistent with predictions from economic theories of corporate culture, we also find that the
corporate culture effects in firm policies are long-term, stronger for internally grown business
units, and older firms. Our evidence is also consistent with firms preserving their cultures by
selecting management teams that fit in their cultures. Finally, we find corporate culture effects
also in measures of firms’ economic performance.
The evidence that a firm’s corporate culture matters for its policy choices and
performance raises a series of questions for future research. How is a firm’s corporate culture
created? Kreps (1990) emphasizes the importance of a firm’s early history in the formation of a
particular culture, and Schein (1983) suggest that a firm’s founder can play a central role in the
development of the culture as she draws on her own experience when the firm faces unforeseen
contingencies. Perhaps fiscally conservative founders (possibly due to their upbringing) will
create conservative firms, with a cost cutting culture and very low appetite for debt even when
standard economic models prescribe more debt financing. Also, can corporate cultures change
over time? If so, what economic forces prompt such changes to a firm’s identity? Another
important question is: What characterizes a successful corporate culture? That is, why are some
shared norms and beliefs superior to others? And what economic mechanisms prevent other
firms from simply adapting them? Finally, in this paper we study culture effects in firms that
split up, but the reverse exercise of studying firms that merge is equally important, in particular
in light of business press suggestions of “culture clashes” in mergers, and recent experimental
evidence by Weber and Camerer (2003). Answers to these questions would add to our
understanding of the role of culture in a corporate setting.
30
References
Ahn, Seoungpil, and David J. Denis, 2004, Internal Capital Markets and Investment Policy: Evidence from Corporate Spinoffs, Journal of Financial Economics 71, 489-516.
Akerlof, George A., 2006, The Missing Motivation in Macroeconomics (Presidential Address for the 2007 AEA Meeting), Working paper, University of California at Berkley, Department of Economics.
Akerlof, George A., and Rachel E. Kranton, 2000, Economics and Identity, Quarterly Journal of Economics 115, 715-753.
Akerlof, George A., and Rachel E. Kranton, 2005, Identity and the Economics of Organizations, Journal of Economic Perspectives 19, 9-32.
Barber, Brad M., and John D. Lyon, 1997, Firm Size, Book-to-Market Ratio, and Security Returns: A Holdout Sample of Financial Firms, Journal of Finance 52, 875-883.
Ben-David, Itzhak , John R. Graham, and Campbell R. Harvey, 2006, Managerial Overconfidence and Corporate Policies, Working paper, Duke University, Fuqua School of Business.
Bernhardt, Dan, Eric Hughson, and Edward Kutsoati, 2006, The Evolution of Managerial Expertise: How Corporate Culture Can Run Amok, American Economic Review 96, 195-221.
Bertrand, Marianne, and Antoinette Schoar, 2003, Managing with Style: The Effect of Managers on Firm Policies, Quarterly Journal of Economics 118, 1169-1208.
Bisin, Alberto, and Thierry Verdier, 2000, 'Beyond the Melting Pot': Cultural Transmission, Marriage, and the Evolution of Ethnic and Religious Traits, Quarterly Journal of Economics 115, 955-988.
Brav, Alon, John R. Graham, Campbell R. Harvey, and Roni Michaely, 2005, Payout Policy in the 21st Century, Journal of Financial Economics 77, 483-527.
Chatman, Jennifer A., 1991, Matching People and Organizations: Selection and Socialization in Public Accounting Firms, Administrative Science Quarterly 36, 459-484.
Cohen, Lauren, and Andrea Frazzini, 2006, Economic Links and Predictable Returns, Working paper, University of Chicago.
Crémer, Jacques, 1993, Corporate Culture and Shared Knowledge, Industrial and Corporate Change 2, 351-386.
Cusatis, Patrick J., James A. Miles, and J. Randall Woolridge, 1993, Restructuring through Spinoffs: The Stock Market Evidence, Journal of Financial Economics 33, 293-311.
Daley, Lane, Vikas Mehrotra, and Ranjini Sivakumar, 1997, Corporate Focus and Value Creation: Evidence from Spinoffs, Journal of Financial Economics 45, 257-281.
Dittmar, Amy, 2004, Capital Structure in Corporate Spin-Offs, Journal of Business 77, 9-43. Graham, John R., and Campbell R. Harvey, 2001, The Theory and Practice of Corporate
Finance: Evidence from the Field, Journal of Financial Economics 60, 187-243. Guiso, Luigi, Paola Sapienza, and Luigi Zingales, 2005, Cultural Biases in Economic Exchange,
Working paper, University of Chicago. Guiso, Luigi, Paola Sapienza, and Luigi Zingales, 2006, Does Culture Affect Economic
Outcomes?, Journal of Economic Perspectives 20, 23-48. Hermalin, Benjamin E., 1994, Heterogeneity in Organizational Form: Why Otherwise Identical
Firms Choose Different Incentives for Their Managers, RAND Journal of Economics 25, 518-537.
31
Hermalin, Benjamin E., 2001, Economics and Corporate Culture, in Cary L. Cooper, Sue Cartwright, and P. Christopher Earley, eds.: The International Handbook of Organizational Culture and Climate (John Wiley & Sons, Chichester, England).
Kale, Jayant R., and Husayn Shahrur, 2006, Corporate Capital Structure and the Characteristics of Suppliers and Customers, forthcoming Journal of Financial Economics.
Kotter, John P., and James L. Heskett, 1992. Corporate Culture and Performance (The Free Press, New York, NY).
Kreps, David M., 1990, Corporate Culture and Economic Theory, in James E. Alt, and Kenneth A. Shepsle, eds.: Perspectives on Positive Political Economy (Cambridge University Press, Cambridge, England).
Lamont, Owen A., and Richard H. Thaler, 2003, Can the Market Add and Subtract? Mispricing in Tech Stock Carve-Outs, Journal of Political Economy 111, 227-268.
Lazear, Edward P., 1995, Corporate Culture and the Diffusion of Values, in Horst Siebert, ed.: Trends in Business Organization: Do Participation and Cooperation Increase Competitiveness? (Institut für Weltwirtschaft an der Universität Kiel, J.C.B. Mohr / Paul Siebeck, Tübingen, Germany).
Lazear, Edward P., 1999, Culture and Language, Journal of Political Economy 107, 95-126. Lemmon, Michael L., Michael R. Roberts, and Jamie F. Zender, 2006, Back to the Beginning:
Persistence and the Cross-Section of Corporate Capital Structure, Working paper, Wharton, University of Pennsylvania.
Lintner, John, 1956, Distribution of Incomes of Corporations among Dividends, Retained Earnings, and Taxes, American Economic Review 46, 97-113.
Malmendier, Ulrike M., and Geoffrey Tate, 2005, Ceo Overconfidence and Corporate Investment, Journal of Finance 60, 2661-2700.
Mehrotra, Vikas, Wayne Mikkelson, and Megan Partch, 2003, The Design of Financial Policies in Corporate Spin-Offs, Review of Financial Studies 16, 1359-1388.
Opler, Tim C., Lee Pinkowitz, René M. Stulz, and Rohan Williamson, 1999, The Determinants and Implications of Corporate Cash Holdings, Journal of Financial Economics 52, 3-46.
Rajan, Raghuram G., and Luigi Zingales, 1998, Financial Dependence and Growth, AmericanEconomic Review 88, 559-586.
Schein, Edgar H., 1983, The Role of the Founder in Creating Organizational Culture, Organizational Dynamics 12, 13-28.
Schipper, Katherine, and Abbie Smith, 1983, Effects of Recontracting on Shareholder Wealth: The Case of Voluntary Spin-Offs, Journal of Financial Economics 12, 437-467.
Silverzweig, Stan, and Robert F. Allen, 1976, Changing the Corporate Culture, SloanManagement Review 17, 33-49.
Strebulaev, Ilya A., and Baozhong Yang, 2006, The Mystery of Zero-Leverage Firms, Working paper, Graduate School of Business, Stanford University.
Stulz, René M., and Rohan Williamson, 2003, Culture, Openness, and Finance, Journal of Financial Economics 70, 313-349.
Van den Steen, Eric, 2005a, On the Original of Shared Beliefs (and Corporate Culture), Working paper, MIT Sloan School of Management.
Van den Steen, Eric, 2005b, Organizational Beliefs and Managerial Vision, Journal of Law, Economics, and Organization 21, 256-283.
Weber, Roberto A., and Colin F. Camerer, 2003, Cultural Conflict and Merger Failure: An Experimental Approach, Management Science 49, 400–415.
32
White, H., 1980, A Heteroskedasticity-Consistent Covariance Matrix Estimator and a Direct Test for Heteroskedasticity, Econometrica 48, 817-838.
Zingales, Luigi, 2000, In Search of New Foundations, Journal of Finance 55, 1623-1653.
33
Data Appendix
Construction of dataset
Description No. of transactions Download spinoffs from SDC M&A and New Issues databases. Time period is from 1/1/1980 to 9/30/2005. 1,316
Verify that the spinoff took place by checking SEC filings and newspaper articles on Factiva. Require the spinoff and parent to be on Compustat. 850
Delete spinoffs owned by two parents, “tracking stocks,” transactions where spinoffs or parents are from the financial or utility industries, and transactions where parents or spinoffs have share codes other than 10 or 11.
624
Require that the spinoff and parent have at least two years of data on Compustat after the effective date of the transaction. 436
Require that parents’ pre-spinoff ownership is >50% and that parents’ post-spinoff ownership is <50%. 286
Transactions with online proxy statements and/or 10-Ks. 217
Variable definitions
Investment policy variables
Acquisition dependency is defined as acquisitions (item 129) divided by total net investments. Total net investments is the sum of the capital expenditures (item 128), increase in investments (item 113), and acquisitions (item 129) less the sum of sales of property, plant and equipment (item 107) and sale of investments (item 109). Missing items 128, 113, 129, 107, and 109 are substituted with zeros.
Acquisitions is defined as acquisitions (item 129) divided by lagged book value of assets (item 6).
Investments is defined as total net investments scaled by lagged book value of assets (item 6). Total net investments is the sum of the capital expenditures (item 128), increase in investments (item 113), and acquisitions (item 129) less the sum of sales of property, plant and equipment (item 107) and sale of investments (item 109). Missing items 128, 113, 129, 107, and 109 are substituted with zeros.
Financial policy variables
Cash holdings is defined as cash and short-term investments (item 1) divided by book value of assets (item 6) less cash and short-term investments (item 1)
Dividend/earnings is the ratio of the sum of common dividends (item 21) and preferred dividends (item 19) over operating income before depreciation (item 13).
Equity dependence is defined as sale of common and preferred stock (item 108) less purchase of common and preferred stock (item 115) divided by total net investments. Total net investments is the sum of the capital expenditures (item 128), increase in investments (item 113), and acquisitions (item 129) less the

34
sum of sales of property, plant and equipment (item 107) and sale of investments (item 109). Missing items 115, 128, 113, 129, 107, and 109 are substituted with zeros.
Interest coverage is defined as operating income before depreciation (item 13) divided by interest expenses (item 15).
Leverage is defined as the sum of long-term debt (item 9) and debt in current liabilities (item 34) scaled by book assets (item 6).
Short-term leverage is defined as debt in current liabilities (item 34) divided by book assets (item 6).
Operational policy variables
Advertising is the ratio of advertising expense (item 45) over sale (item 12). Missing item 45 is substituted with zeros.
R&D is the ratio of R&D expenditures (item 46) over lagged book assets (item 6). Missing item 46 is substituted with zeros.
SG&A is the ratio of selling, general, and administrative expenses (item 189) over sales (item 12). Missing item 189 is substituted with zeros.
Operating profitability variables
Return on assets is the ratio of operating income before depreciation (item 13) over lagged book assets (item 6).
Return on sales is the ratio of operating income before depreciation (item 13) over sales (item 12).
Control variables
Cash flow is defined as the sum of earnings before extraordinary items (item 18) and depreciation (item 14) divided by lagged book value of assets (item 6).
Net property, plant, and equipment ratio is defined as the net property plant and equipment (item 8) divided by book value of assets (item 6). This variable is lagged.
Size is defined as the natural logarithm of book assets (item 6) in 2004 million dollars. This variable is lagged.
Tobin’s q is defined as the market value of assets divided by the book value of assets (item 6). The market value of assets equals the book value of assets plus the market value of common equity (item 25 item 199) less the sum of the book value of common equity (item 60) and balance sheet deferred taxes (item 74). This variable is lagged.
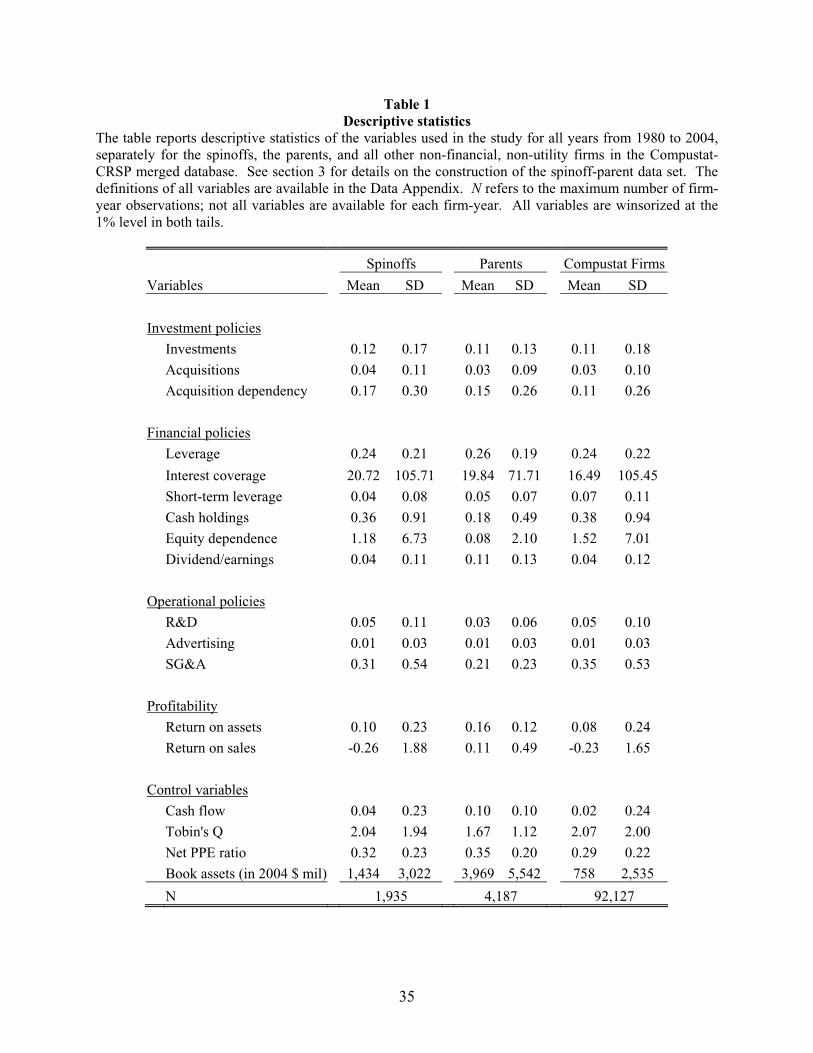
35
Table 1 Descriptive statistics
The table reports descriptive statistics of the variables used in the study for all years from 1980 to 2004, separately for the spinoffs, the parents, and all other non-financial, non-utility firms in the Compustat-CRSP merged database. See section 3 for details on the construction of the spinoff-parent data set. The definitions of all variables are available in the Data Appendix. N refers to the maximum number of firm-year observations; not all variables are available for each firm-year. All variables are winsorized at the 1% level in both tails.
Spinoffs Parents Compustat Firms
Variables Mean SD Mean SD Mean SD
Investment policies
Investments 0.12 0.17 0.11 0.13 0.11 0.18
Acquisitions 0.04 0.11 0.03 0.09 0.03 0.10
Acquisition dependency 0.17 0.30 0.15 0.26 0.11 0.26
Financial policies
Leverage 0.24 0.21 0.26 0.19 0.24 0.22
Interest coverage 20.72 105.71 19.84 71.71 16.49 105.45
Short-term leverage 0.04 0.08 0.05 0.07 0.07 0.11
Cash holdings 0.36 0.91 0.18 0.49 0.38 0.94
Equity dependence 1.18 6.73 0.08 2.10 1.52 7.01
Dividend/earnings 0.04 0.11 0.11 0.13 0.04 0.12
Operational policies
R&D 0.05 0.11 0.03 0.06 0.05 0.10
Advertising 0.01 0.03 0.01 0.03 0.01 0.03
SG&A 0.31 0.54 0.21 0.23 0.35 0.53
Profitability
Return on assets 0.10 0.23 0.16 0.12 0.08 0.24
Return on sales -0.26 1.88 0.11 0.49 -0.23 1.65
Control variables
Cash flow 0.04 0.23 0.10 0.10 0.02 0.24
Tobin's Q 2.04 1.94 1.67 1.12 2.07 2.00
Net PPE ratio 0.32 0.23 0.35 0.20 0.29 0.22
Book assets (in 2004 $ mil) 1,434 3,022 3,969 5,542 758 2,535
N 1,935 4,187 92,127
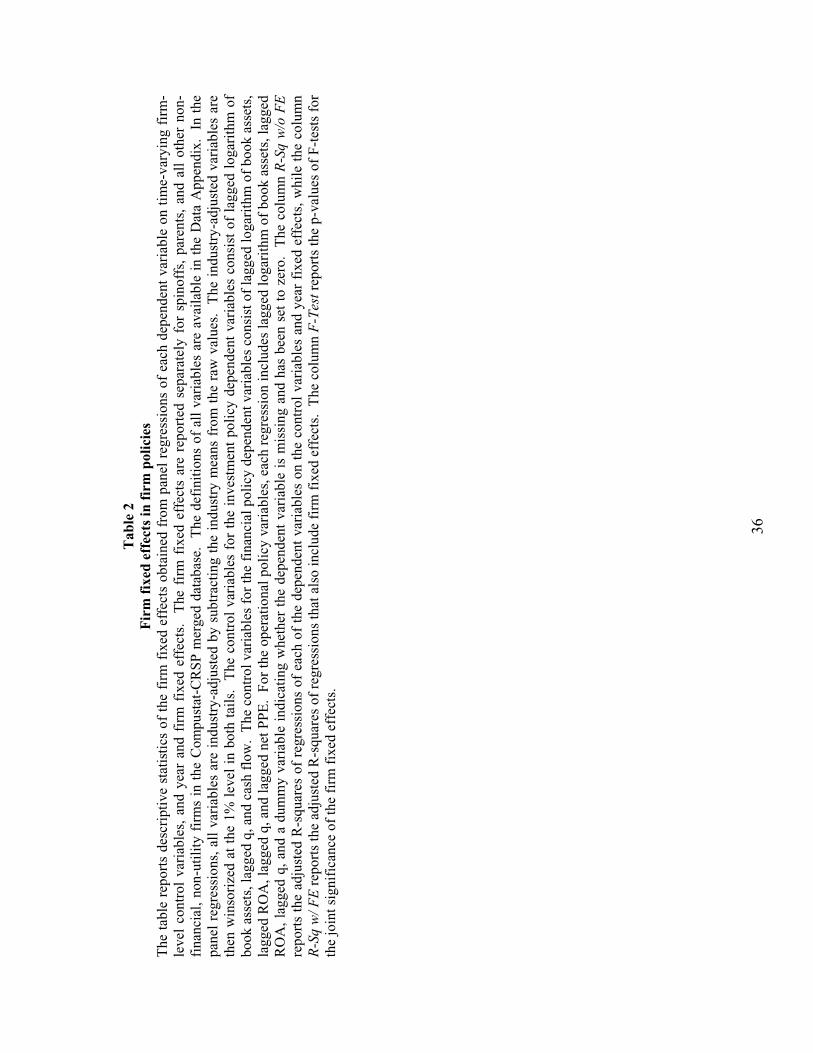
36
Tab
le 2
F
irm
fix
ed e
ffec
ts in
fir
m p
olic
ies
T
he t
able
rep
orts
des
crip
tive
stat
istic
s of
the
fir
m f
ixed
eff
ects
obt
aine
d fr
om p
anel
reg
ress
ions
of
each
dep
ende
nt v
aria
ble
on t
ime-
vary
ing
firm
-le
vel
cont
rol
vari
able
s, a
nd y
ear
and
firm
fix
ed e
ffec
ts.
The
fir
m f
ixed
eff
ects
are
rep
orte
d se
para
tely
for
spi
noff
s, p
aren
ts,
and
all
othe
r no
n-fi
nanc
ial,
non-
utili
ty f
irm
s in
the
Com
pust
at-C
RSP
mer
ged
data
base
. T
he d
efin
ition
s of
all
vari
able
s ar
e av
aila
ble
in t
he D
ata
App
endi
x.
In t
he
pane
l re
gres
sion
s, a
ll va
riab
les
are
indu
stry
-adj
uste
d by
sub
trac
ting
the
indu
stry
mea
ns f
rom
the
raw
val
ues.
T
he i
ndus
try-
adju
sted
var
iabl
es a
re
then
win
sori
zed
at t
he 1
% l
evel
in
both
tai
ls.
The
con
trol
var
iabl
es f
or t
he i
nves
tmen
t po
licy
depe
nden
t va
riab
les
cons
ist
of l
agge
d lo
gari
thm
of
book
ass
ets,
lagg
ed q
, and
cas
h fl
ow.
The
con
trol
var
iabl
es f
or th
e fi
nanc
ial p
olic
y de
pend
ent v
aria
bles
con
sist
of
lagg
ed lo
gari
thm
of
book
ass
ets,
la
gged
RO
A, l
agge
d q,
and
lagg
ed n
et P
PE.
For
the
oper
atio
nal p
olic
y va
riab
les,
eac
h re
gres
sion
incl
udes
lagg
ed lo
gari
thm
of
book
ass
ets,
lagg
ed
RO
A, l
agge
d q,
and
a d
umm
y va
riab
le i
ndic
atin
g w
heth
er t
he d
epen
dent
var
iabl
e is
mis
sing
and
has
bee
n se
t to
zer
o.
The
col
umn
R-S
q w
/o F
Ere
port
s th
e ad
just
ed R
-squ
ares
of
regr
essi
ons
of e
ach
of t
he d
epen
dent
var
iabl
es o
n th
e co
ntro
l va
riab
les
and
year
fix
ed e
ffec
ts, w
hile
the
col
umn
R-S
q w
/ FE
rep
orts
the
adju
sted
R-s
quar
es o
f re
gres
sion
s th
at a
lso
incl
ude
firm
fix
ed e
ffec
ts.
The
col
umn
F-T
est r
epor
ts th
e p-
valu
es o
f F-
test
s fo
r th
e jo
int s
igni
fica
nce
of th
e fi
rm f
ixed
eff
ects
.
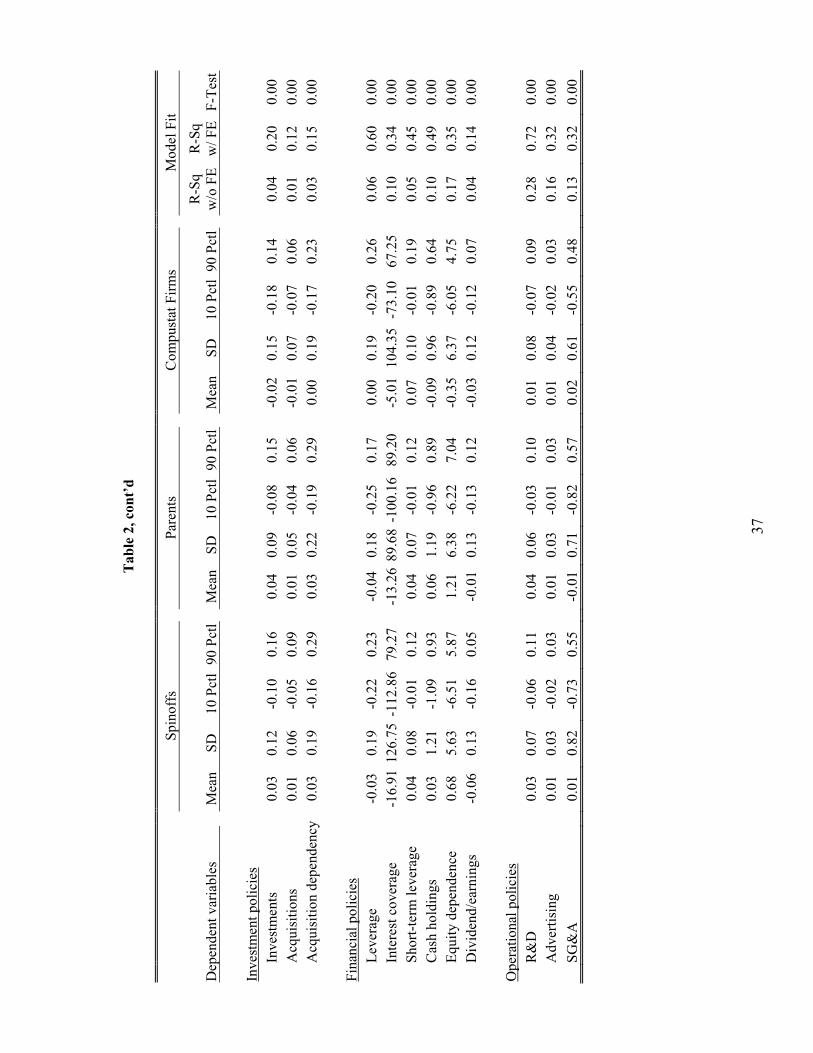
37
Tab
le 2
, con
t’d
Sp
inof
fs
Pare
nts
C
ompu
stat
Fir
ms
Mod
el F
it
Dep
ende
nt v
aria
bles
Mea
n SD
10
Pct
l90
Pct
lM
ean
SD
10 P
ctl
90 P
ctl
M
ean
SD
10 P
ctl
90 P
ctl
R-S
qw
/o F
ER
-Sq
w/ F
EF-
Tes
t
Inve
stm
ent p
olic
ies
Inve
stm
ents
0.03
0.
12
-0.1
0 0.
16
0.04
0.
09-0
.08
0.15
-0.0
20.
15
-0.1
8 0.
14
0.04
0.
20
0.00
Acq
uisi
tions
0.01
0.
06
-0.0
5 0.
09
0.01
0.
05-0
.04
0.06
-0.0
10.
07
-0.0
7 0.
06
0.01
0.
12
0.00
Acq
uisi
tion
depe
nden
cy
0.03
0.
19
-0.1
6 0.
29
0.03
0.
22-0
.19
0.29
0.00
0.
19
-0.1
7 0.
23
0.03
0.
15
0.00
Fina
ncia
l pol
icie
s
L
ever
age
-0.0
3 0.
19
-0.2
2 0.
23
-0.0
40.
18-0
.25
0.17
0.00
0.
19
-0.2
0 0.
26
0.06
0.
60
0.00
Inte
rest
cov
erag
e
-16.
91 1
26.7
5-1
12.8
679
.27
-13.
2689
.68
-100
.16
89.2
0
-5.0
110
4.35
-73.
1067
.25
0.10
0.
34
0.00
Shor
t-te
rm le
vera
ge
0.
04
0.08
-0
.01
0.12
0.
04
0.07
-0.0
1 0.
12
0.
07
0.10
-0
.01
0.19
0.
05
0.45
0.
00
C
ash
hold
ings
0.03
1.
21
-1.0
9 0.
93
0.06
1.
19-0
.96
0.89
-0.0
90.
96
-0.8
9 0.
64
0.10
0.
49
0.00
Equ
ity d
epen
denc
e
0.68
5.
63
-6.5
1 5.
87
1.21
6.
38-6
.22
7.04
-0.3
56.
37
-6.0
5 4.
75
0.17
0.
35
0.00
Div
iden
d/ea
rnin
gs
-0
.06
0.13
-0
.16
0.05
-0
.01
0.13
-0.1
3 0.
12
-0
.03
0.12
-0
.12
0.07
0.
04
0.14
0.
00
O
pera
tiona
l pol
icie
s
R
&D
0.03
0.
07
-0.0
6 0.
11
0.04
0.
06-0
.03
0.10
0.01
0.
08
-0.0
7 0.
09
0.28
0.
72
0.00
Adv
ertis
ing
0.
01
0.03
-0
.02
0.03
0.
01
0.03
-0.0
1 0.
03
0.
01
0.04
-0
.02
0.03
0.
16
0.32
0.
00
SG
&A
0.01
0.
82
-0.7
3 0.
55
-0
.01
0.71
-0.8
2 0.
57
0.
02
0.61
-0
.55
0.48
0.13
0.
32
0.00
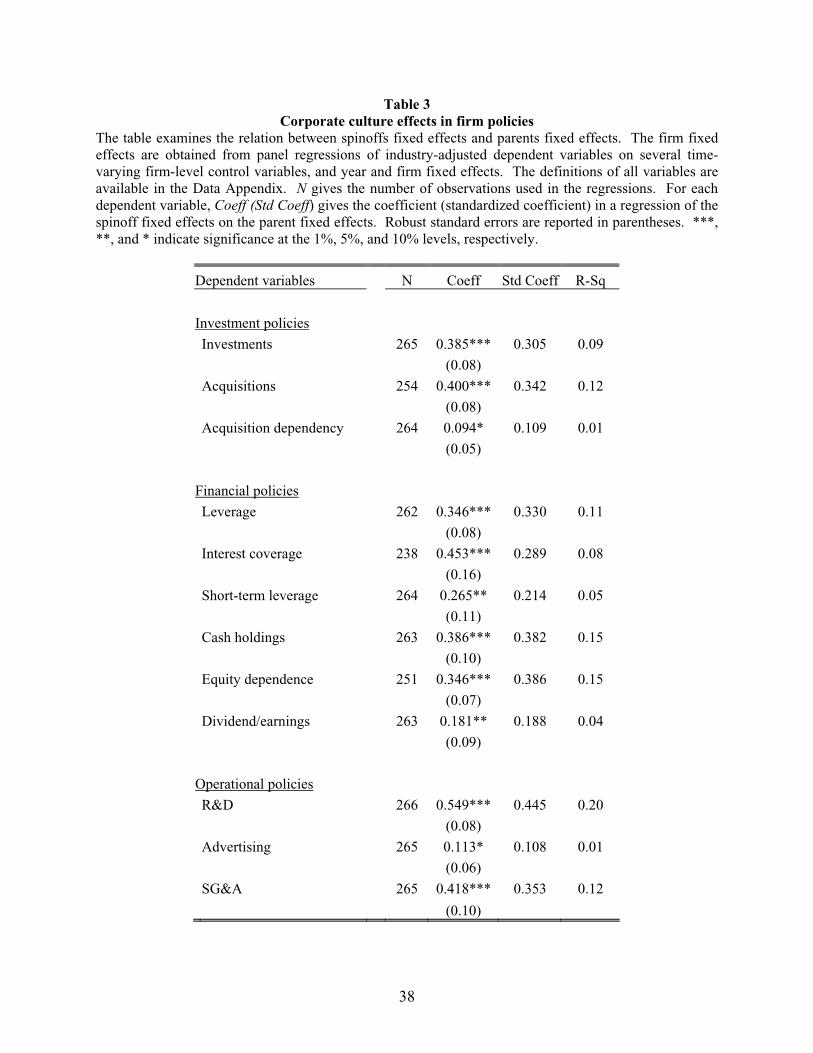
38
Table 3Corporate culture effects in firm policies
The table examines the relation between spinoffs fixed effects and parents fixed effects. The firm fixed effects are obtained from panel regressions of industry-adjusted dependent variables on several time-varying firm-level control variables, and year and firm fixed effects. The definitions of all variables are available in the Data Appendix. N gives the number of observations used in the regressions. For each dependent variable, Coeff (Std Coeff) gives the coefficient (standardized coefficient) in a regression of the spinoff fixed effects on the parent fixed effects. Robust standard errors are reported in parentheses. ***, **, and * indicate significance at the 1%, 5%, and 10% levels, respectively.
Dependent variables N Coeff Std Coeff R-Sq
Investment policies
Investments 265 0.385*** 0.305 0.09
(0.08)
Acquisitions 254 0.400*** 0.342 0.12
(0.08)
Acquisition dependency 264 0.094* 0.109 0.01
(0.05)
Financial policies
Leverage 262 0.346*** 0.330 0.11
(0.08)
Interest coverage 238 0.453*** 0.289 0.08
(0.16)
Short-term leverage 264 0.265** 0.214 0.05
(0.11)
Cash holdings 263 0.386*** 0.382 0.15
(0.10)
Equity dependence 251 0.346*** 0.386 0.15
(0.07)
Dividend/earnings 263 0.181** 0.188 0.04
(0.09)
Operational policies
R&D 266 0.549*** 0.445 0.20
(0.08)
Advertising 265 0.113* 0.108 0.01
(0.06)
SG&A 265 0.418*** 0.353 0.12
(0.10)
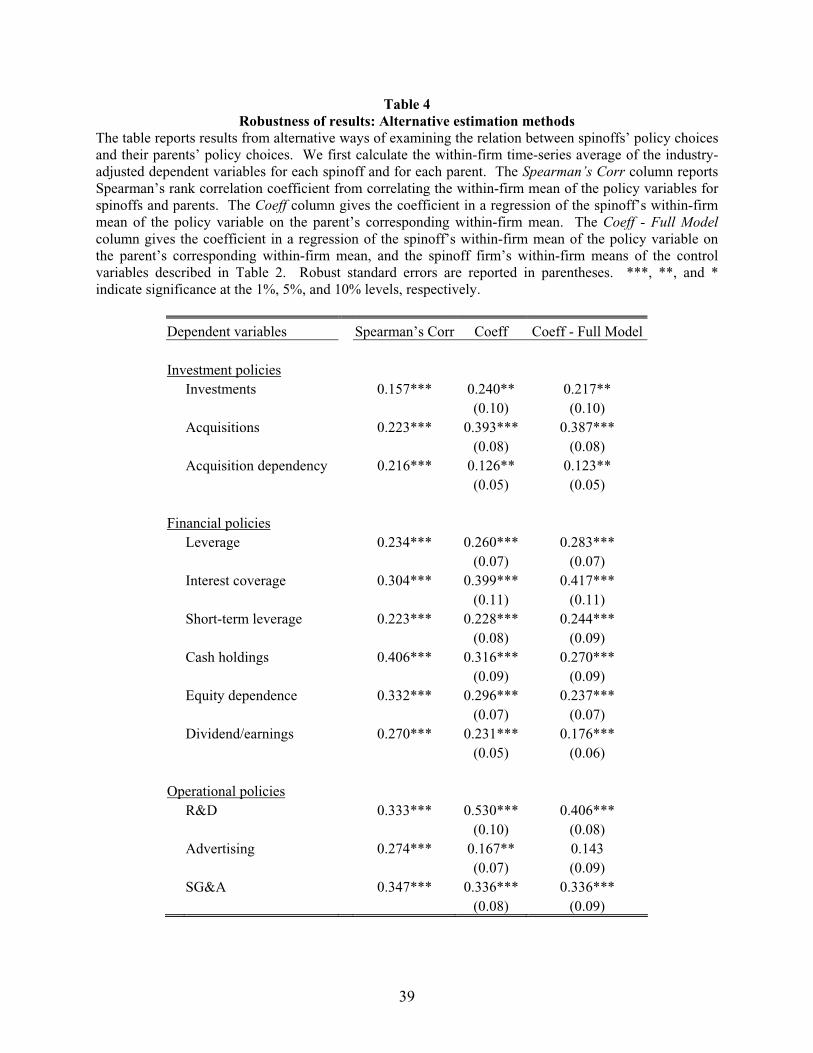
39
Table 4Robustness of results: Alternative estimation methods
The table reports results from alternative ways of examining the relation between spinoffs’ policy choices and their parents’ policy choices. We first calculate the within-firm time-series average of the industry-adjusted dependent variables for each spinoff and for each parent. The Spearman’s Corr column reports Spearman’s rank correlation coefficient from correlating the within-firm mean of the policy variables for spinoffs and parents. The Coeff column gives the coefficient in a regression of the spinoff’s within-firm mean of the policy variable on the parent’s corresponding within-firm mean. The Coeff - Full Model column gives the coefficient in a regression of the spinoff’s within-firm mean of the policy variable on the parent’s corresponding within-firm mean, and the spinoff firm’s within-firm means of the control variables described in Table 2. Robust standard errors are reported in parentheses. ***, **, and * indicate significance at the 1%, 5%, and 10% levels, respectively.
Dependent variables Spearman’s Corr Coeff Coeff - Full Model Investment policies Investments 0.157*** 0.240** 0.217** (0.10) (0.10) Acquisitions 0.223*** 0.393*** 0.387*** (0.08) (0.08) Acquisition dependency 0.216*** 0.126** 0.123** (0.05) (0.05) Financial policies Leverage 0.234*** 0.260*** 0.283*** (0.07) (0.07) Interest coverage 0.304*** 0.399*** 0.417*** (0.11) (0.11) Short-term leverage 0.223*** 0.228*** 0.244*** (0.08) (0.09) Cash holdings 0.406*** 0.316*** 0.270*** (0.09) (0.09) Equity dependence 0.332*** 0.296*** 0.237*** (0.07) (0.07) Dividend/earnings 0.270*** 0.231*** 0.176*** (0.05) (0.06)
Operational policies R&D 0.333*** 0.530*** 0.406*** (0.10) (0.08) Advertising 0.274*** 0.167** 0.143 (0.07) (0.09) SG&A 0.347*** 0.336*** 0.336***
(0.08) (0.09)
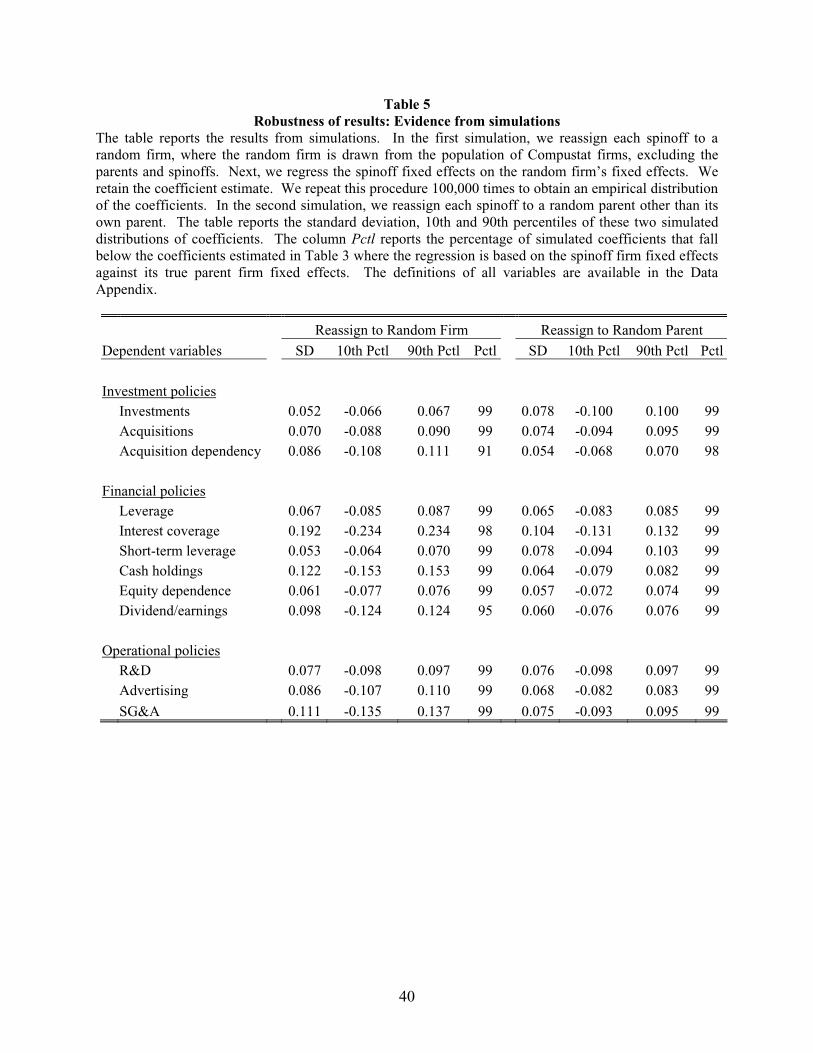
40
Table 5 Robustness of results: Evidence from simulations
The table reports the results from simulations. In the first simulation, we reassign each spinoff to a random firm, where the random firm is drawn from the population of Compustat firms, excluding the parents and spinoffs. Next, we regress the spinoff fixed effects on the random firm’s fixed effects. We retain the coefficient estimate. We repeat this procedure 100,000 times to obtain an empirical distribution of the coefficients. In the second simulation, we reassign each spinoff to a random parent other than its own parent. The table reports the standard deviation, 10th and 90th percentiles of these two simulated distributions of coefficients. The column Pctl reports the percentage of simulated coefficients that fall below the coefficients estimated in Table 3 where the regression is based on the spinoff firm fixed effects against its true parent firm fixed effects. The definitions of all variables are available in the Data Appendix.
Reassign to Random Firm Reassign to Random Parent
Dependent variables SD 10th Pctl 90th Pctl Pctl SD 10th Pctl 90th Pctl Pctl Investment policies Investments 0.052 -0.066 0.067 99 0.078 -0.100 0.100 99 Acquisitions 0.070 -0.088 0.090 99 0.074 -0.094 0.095 99 Acquisition dependency 0.086 -0.108 0.111 91 0.054 -0.068 0.070 98 Financial policies Leverage 0.067 -0.085 0.087 99 0.065 -0.083 0.085 99 Interest coverage 0.192 -0.234 0.234 98 0.104 -0.131 0.132 99 Short-term leverage 0.053 -0.064 0.070 99 0.078 -0.094 0.103 99 Cash holdings 0.122 -0.153 0.153 99 0.064 -0.079 0.082 99 Equity dependence 0.061 -0.077 0.076 99 0.057 -0.072 0.074 99 Dividend/earnings 0.098 -0.124 0.124 95 0.060 -0.076 0.076 99 Operational policies R&D 0.077 -0.098 0.097 99 0.076 -0.098 0.097 99 Advertising 0.086 -0.107 0.110 99 0.068 -0.082 0.083 99
SG&A 0.111 -0.135 0.137 99 0.075 -0.093 0.095 99
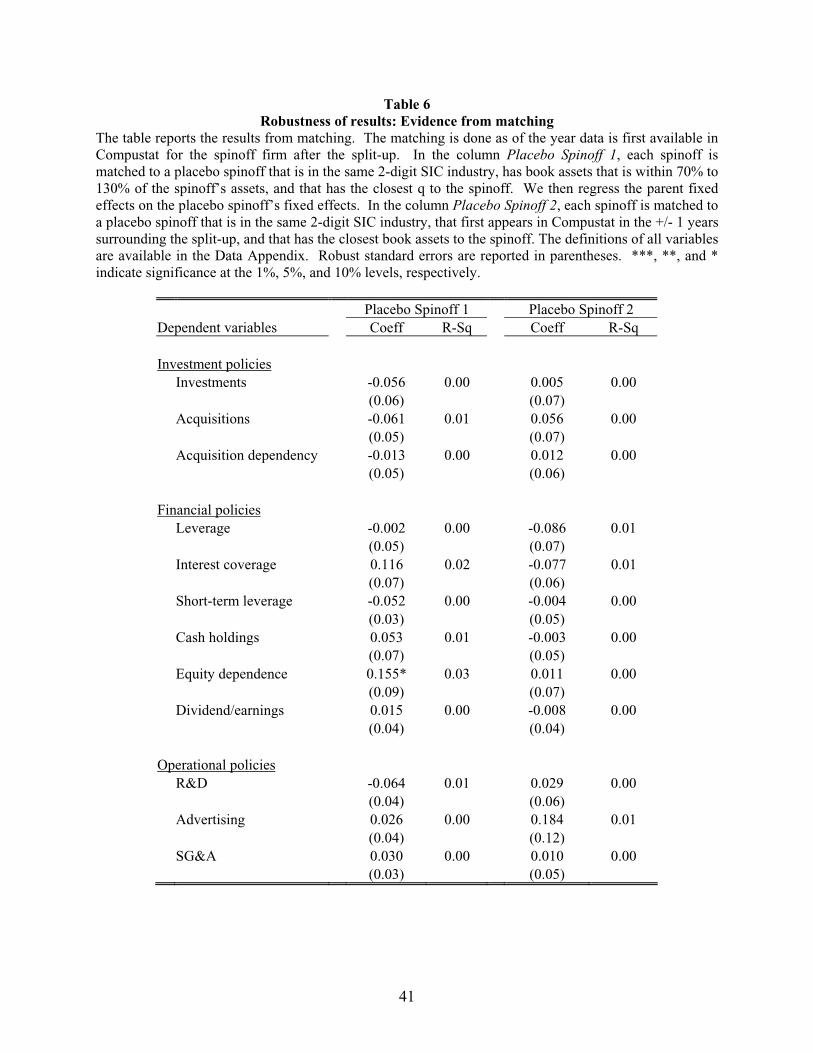
41
Table 6 Robustness of results: Evidence from matching
The table reports the results from matching. The matching is done as of the year data is first available in Compustat for the spinoff firm after the split-up. In the column Placebo Spinoff 1, each spinoff is matched to a placebo spinoff that is in the same 2-digit SIC industry, has book assets that is within 70% to 130% of the spinoff’s assets, and that has the closest q to the spinoff. We then regress the parent fixed effects on the placebo spinoff’s fixed effects. In the column Placebo Spinoff 2, each spinoff is matched to a placebo spinoff that is in the same 2-digit SIC industry, that first appears in Compustat in the +/- 1 years surrounding the split-up, and that has the closest book assets to the spinoff. The definitions of all variables are available in the Data Appendix. Robust standard errors are reported in parentheses. ***, **, and * indicate significance at the 1%, 5%, and 10% levels, respectively.
Placebo Spinoff 1 Placebo Spinoff 2 Dependent variables Coeff R-Sq Coeff R-Sq Investment policies Investments -0.056 0.00 0.005 0.00 (0.06) (0.07) Acquisitions -0.061 0.01 0.056 0.00 (0.05) (0.07) Acquisition dependency -0.013 0.00 0.012 0.00 (0.05) (0.06) Financial policies Leverage -0.002 0.00 -0.086 0.01 (0.05) (0.07) Interest coverage 0.116 0.02 -0.077 0.01 (0.07) (0.06) Short-term leverage -0.052 0.00 -0.004 0.00 (0.03) (0.05) Cash holdings 0.053 0.01 -0.003 0.00 (0.07) (0.05) Equity dependence 0.155* 0.03 0.011 0.00 (0.09) (0.07) Dividend/earnings 0.015 0.00 -0.008 0.00 (0.04) (0.04) Operational policies R&D -0.064 0.01 0.029 0.00 (0.04) (0.06) Advertising 0.026 0.00 0.184 0.01 (0.04) (0.12) SG&A 0.030 0.00 0.010 0.00
(0.03) (0.05)
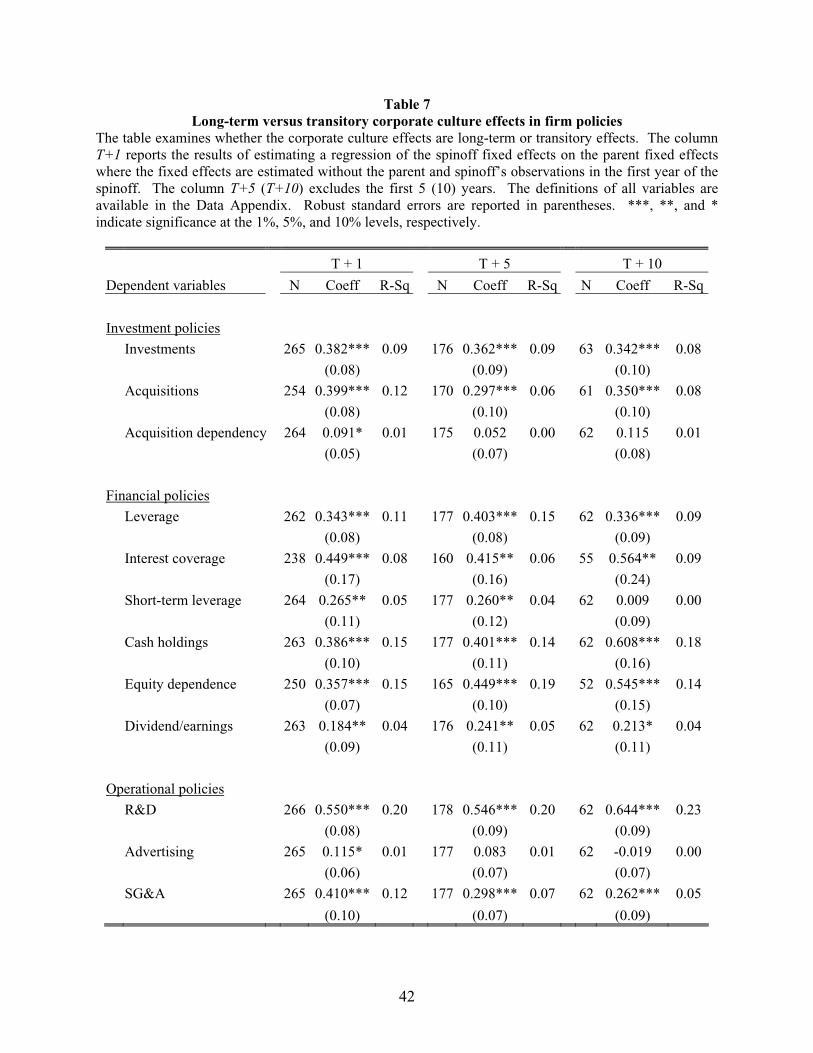
42
Table 7Long-term versus transitory corporate culture effects in firm policies
The table examines whether the corporate culture effects are long-term or transitory effects. The column T+1 reports the results of estimating a regression of the spinoff fixed effects on the parent fixed effects where the fixed effects are estimated without the parent and spinoff’s observations in the first year of the spinoff. The column T+5 (T+10) excludes the first 5 (10) years. The definitions of all variables are available in the Data Appendix. Robust standard errors are reported in parentheses. ***, **, and * indicate significance at the 1%, 5%, and 10% levels, respectively.
T + 1 T + 5 T + 10
Dependent variables N Coeff R-Sq N Coeff R-Sq N Coeff R-Sq
Investment policies
Investments 265 0.382*** 0.09 176 0.362*** 0.09 63 0.342*** 0.08
(0.08) (0.09) (0.10)
Acquisitions 254 0.399*** 0.12 170 0.297*** 0.06 61 0.350*** 0.08
(0.08) (0.10) (0.10)
Acquisition dependency 264 0.091* 0.01 175 0.052 0.00 62 0.115 0.01
(0.05) (0.07) (0.08)
Financial policies
Leverage 262 0.343*** 0.11 177 0.403*** 0.15 62 0.336*** 0.09
(0.08) (0.08) (0.09)
Interest coverage 238 0.449*** 0.08 160 0.415** 0.06 55 0.564** 0.09
(0.17) (0.16) (0.24)
Short-term leverage 264 0.265** 0.05 177 0.260** 0.04 62 0.009 0.00
(0.11) (0.12) (0.09)
Cash holdings 263 0.386*** 0.15 177 0.401*** 0.14 62 0.608*** 0.18
(0.10) (0.11) (0.16)
Equity dependence 250 0.357*** 0.15 165 0.449*** 0.19 52 0.545*** 0.14
(0.07) (0.10) (0.15)
Dividend/earnings 263 0.184** 0.04 176 0.241** 0.05 62 0.213* 0.04
(0.09) (0.11) (0.11)
Operational policies
R&D 266 0.550*** 0.20 178 0.546*** 0.20 62 0.644*** 0.23
(0.08) (0.09) (0.09)
Advertising 265 0.115* 0.01 177 0.083 0.01 62 -0.019 0.00
(0.06) (0.07) (0.07)
SG&A 265 0.410*** 0.12 177 0.298*** 0.07 62 0.262*** 0.05
(0.10) (0.07) (0.09)
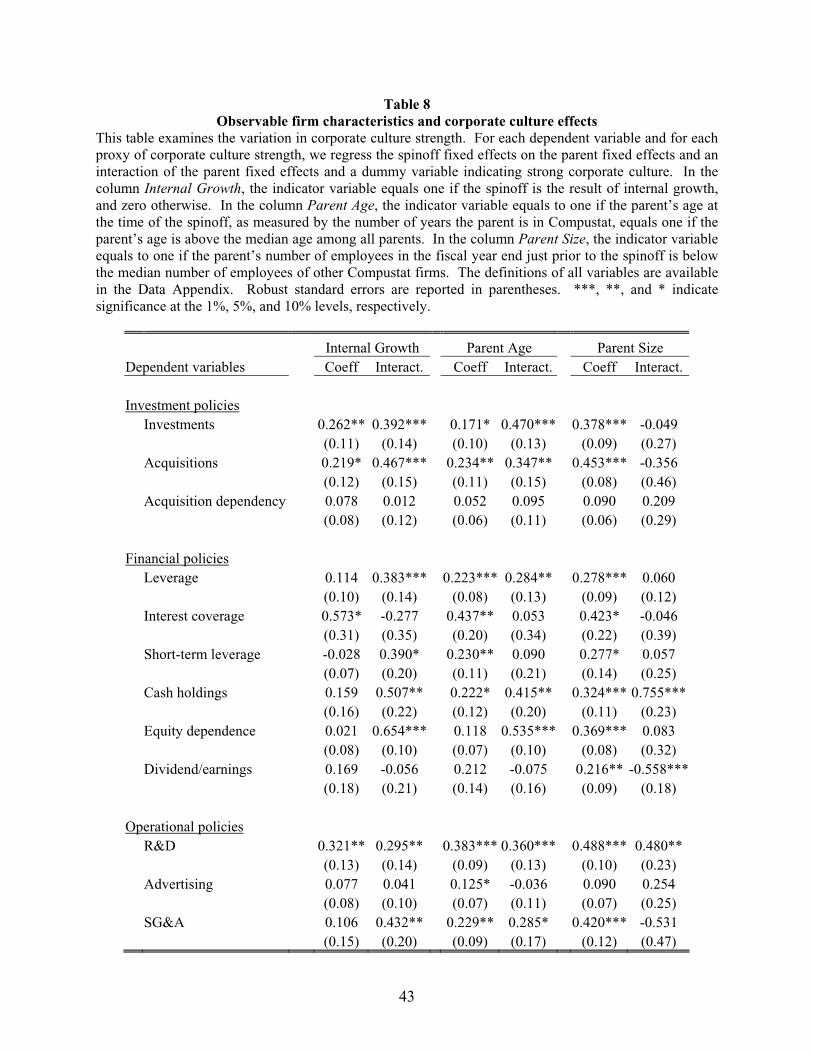
43
Table 8 Observable firm characteristics and corporate culture effects
This table examines the variation in corporate culture strength. For each dependent variable and for each proxy of corporate culture strength, we regress the spinoff fixed effects on the parent fixed effects and an interaction of the parent fixed effects and a dummy variable indicating strong corporate culture. In the column Internal Growth, the indicator variable equals one if the spinoff is the result of internal growth, and zero otherwise. In the column Parent Age, the indicator variable equals to one if the parent’s age at the time of the spinoff, as measured by the number of years the parent is in Compustat, equals one if the parent’s age is above the median age among all parents. In the column Parent Size, the indicator variable equals to one if the parent’s number of employees in the fiscal year end just prior to the spinoff is below the median number of employees of other Compustat firms. The definitions of all variables are available in the Data Appendix. Robust standard errors are reported in parentheses. ***, **, and * indicate significance at the 1%, 5%, and 10% levels, respectively.
Internal Growth Parent Age Parent Size Dependent variables Coeff Interact. Coeff Interact. Coeff Interact. Investment policies Investments 0.262** 0.392*** 0.171* 0.470*** 0.378*** -0.049 (0.11) (0.14) (0.10) (0.13) (0.09) (0.27) Acquisitions 0.219* 0.467*** 0.234** 0.347** 0.453*** -0.356 (0.12) (0.15) (0.11) (0.15) (0.08) (0.46) Acquisition dependency 0.078 0.012 0.052 0.095 0.090 0.209 (0.08) (0.12) (0.06) (0.11) (0.06) (0.29) Financial policies Leverage 0.114 0.383*** 0.223*** 0.284** 0.278*** 0.060 (0.10) (0.14) (0.08) (0.13) (0.09) (0.12) Interest coverage 0.573* -0.277 0.437** 0.053 0.423* -0.046 (0.31) (0.35) (0.20) (0.34) (0.22) (0.39) Short-term leverage -0.028 0.390* 0.230** 0.090 0.277* 0.057 (0.07) (0.20) (0.11) (0.21) (0.14) (0.25) Cash holdings 0.159 0.507** 0.222* 0.415** 0.324*** 0.755*** (0.16) (0.22) (0.12) (0.20) (0.11) (0.23) Equity dependence 0.021 0.654*** 0.118 0.535*** 0.369*** 0.083 (0.08) (0.10) (0.07) (0.10) (0.08) (0.32) Dividend/earnings 0.169 -0.056 0.212 -0.075 0.216** -0.558*** (0.18) (0.21) (0.14) (0.16) (0.09) (0.18) Operational policies R&D 0.321** 0.295** 0.383*** 0.360*** 0.488*** 0.480** (0.13) (0.14) (0.09) (0.13) (0.10) (0.23) Advertising 0.077 0.041 0.125* -0.036 0.090 0.254 (0.08) (0.10) (0.07) (0.11) (0.07) (0.25) SG&A 0.106 0.432** 0.229** 0.285* 0.420*** -0.531
(0.15) (0.20) (0.09) (0.17) (0.12) (0.47)
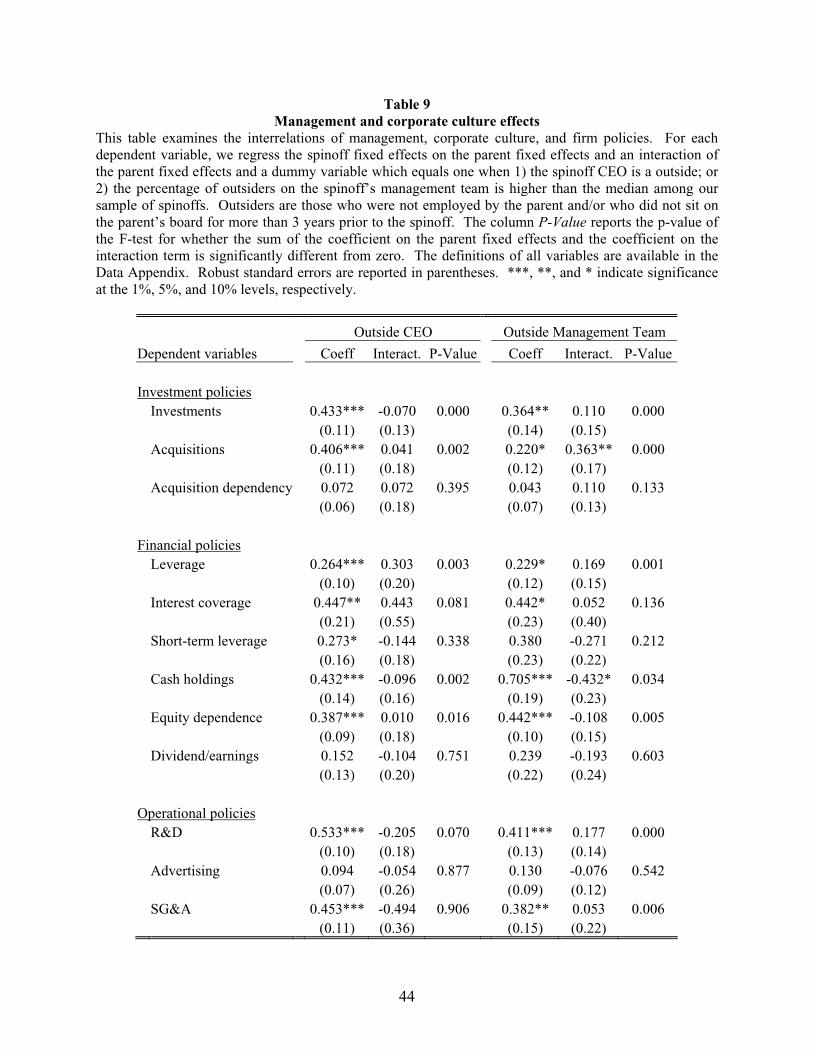
44
Table 9 Management and corporate culture effects
This table examines the interrelations of management, corporate culture, and firm policies. For each dependent variable, we regress the spinoff fixed effects on the parent fixed effects and an interaction of the parent fixed effects and a dummy variable which equals one when 1) the spinoff CEO is a outside; or 2) the percentage of outsiders on the spinoff’s management team is higher than the median among our sample of spinoffs. Outsiders are those who were not employed by the parent and/or who did not sit on the parent’s board for more than 3 years prior to the spinoff. The column P-Value reports the p-value of the F-test for whether the sum of the coefficient on the parent fixed effects and the coefficient on the interaction term is significantly different from zero. The definitions of all variables are available in the Data Appendix. Robust standard errors are reported in parentheses. ***, **, and * indicate significance at the 1%, 5%, and 10% levels, respectively.
Outside CEO Outside Management Team
Dependent variables Coeff Interact. P-Value Coeff Interact. P-Value Investment policies Investments 0.433*** -0.070 0.000 0.364** 0.110 0.000 (0.11) (0.13) (0.14) (0.15) Acquisitions 0.406*** 0.041 0.002 0.220* 0.363** 0.000 (0.11) (0.18) (0.12) (0.17) Acquisition dependency 0.072 0.072 0.395 0.043 0.110 0.133 (0.06) (0.18) (0.07) (0.13) Financial policies Leverage 0.264*** 0.303 0.003 0.229* 0.169 0.001 (0.10) (0.20) (0.12) (0.15) Interest coverage 0.447** 0.443 0.081 0.442* 0.052 0.136 (0.21) (0.55) (0.23) (0.40) Short-term leverage 0.273* -0.144 0.338 0.380 -0.271 0.212 (0.16) (0.18) (0.23) (0.22) Cash holdings 0.432*** -0.096 0.002 0.705*** -0.432* 0.034 (0.14) (0.16) (0.19) (0.23) Equity dependence 0.387*** 0.010 0.016 0.442*** -0.108 0.005 (0.09) (0.18) (0.10) (0.15) Dividend/earnings 0.152 -0.104 0.751 0.239 -0.193 0.603 (0.13) (0.20) (0.22) (0.24) Operational policies R&D 0.533*** -0.205 0.070 0.411*** 0.177 0.000 (0.10) (0.18) (0.13) (0.14) Advertising 0.094 -0.054 0.877 0.130 -0.076 0.542 (0.07) (0.26) (0.09) (0.12) SG&A 0.453*** -0.494 0.906 0.382** 0.053 0.006
(0.11) (0.36) (0.15) (0.22)
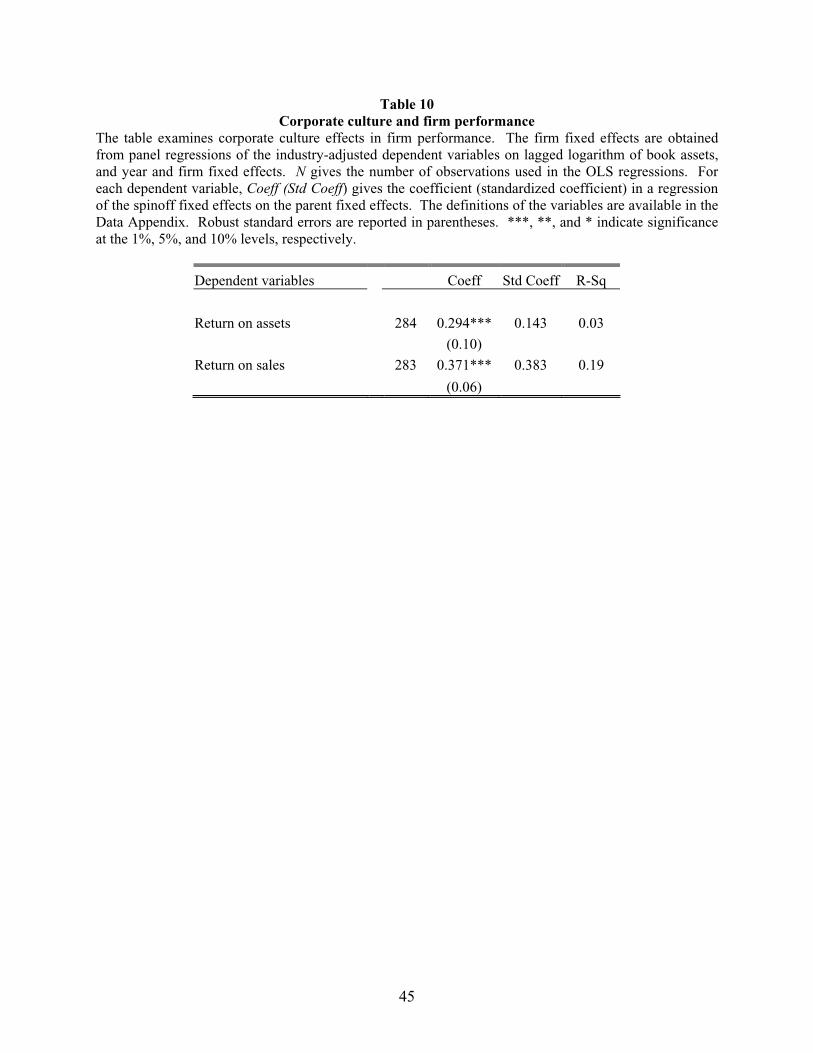
45
Table 10 Corporate culture and firm performance
The table examines corporate culture effects in firm performance. The firm fixed effects are obtained from panel regressions of the industry-adjusted dependent variables on lagged logarithm of book assets, and year and firm fixed effects. N gives the number of observations used in the OLS regressions. For each dependent variable, Coeff (Std Coeff) gives the coefficient (standardized coefficient) in a regression of the spinoff fixed effects on the parent fixed effects. The definitions of the variables are available in the Data Appendix. Robust standard errors are reported in parentheses. ***, **, and * indicate significance at the 1%, 5%, and 10% levels, respectively.
Dependent variables Coeff Std Coeff R-Sq
Return on assets 284 0.294*** 0.143 0.03
(0.10)
Return on sales 283 0.371*** 0.383 0.19
(0.06)
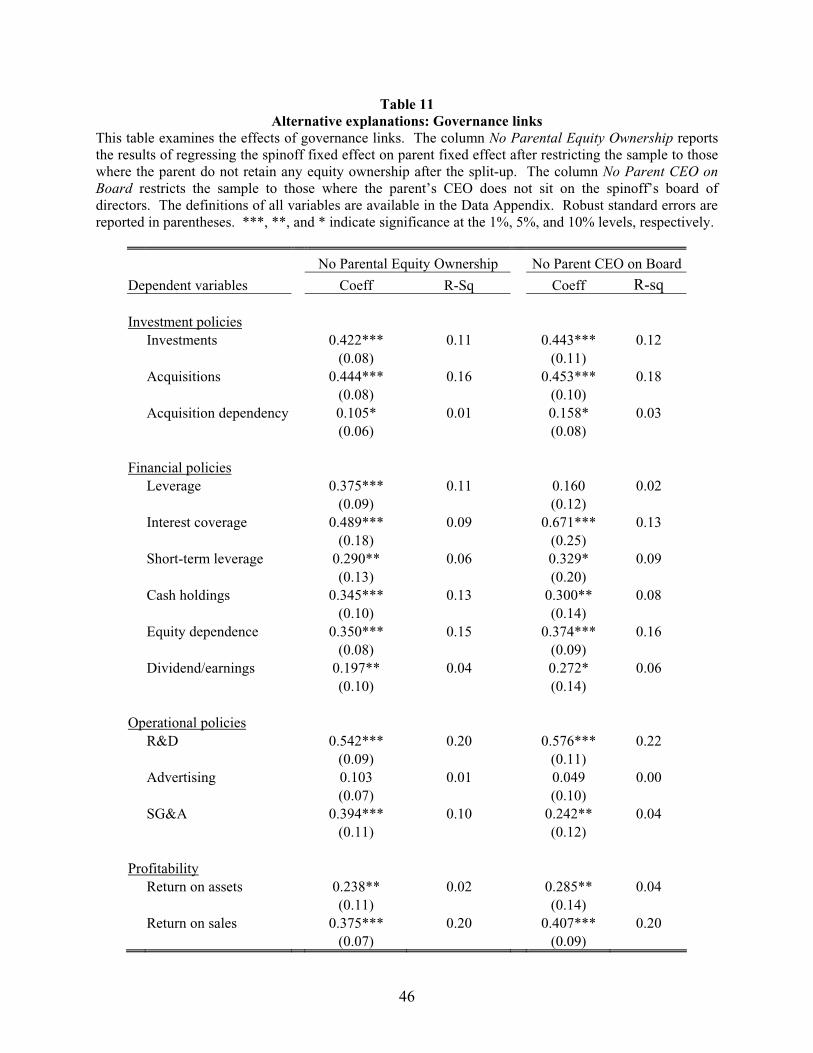
46
Table 11 Alternative explanations: Governance links
This table examines the effects of governance links. The column No Parental Equity Ownership reportsthe results of regressing the spinoff fixed effect on parent fixed effect after restricting the sample to those where the parent do not retain any equity ownership after the split-up. The column No Parent CEO on Board restricts the sample to those where the parent’s CEO does not sit on the spinoff’s board of directors. The definitions of all variables are available in the Data Appendix. Robust standard errors are reported in parentheses. ***, **, and * indicate significance at the 1%, 5%, and 10% levels, respectively.
No Parental Equity Ownership No Parent CEO on Board
Dependent variables Coeff R-Sq Coeff R-sq Investment policies Investments 0.422*** 0.11 0.443*** 0.12 (0.08) (0.11) Acquisitions 0.444*** 0.16 0.453*** 0.18 (0.08) (0.10) Acquisition dependency 0.105* 0.01 0.158* 0.03 (0.06) (0.08) Financial policies Leverage 0.375*** 0.11 0.160 0.02 (0.09) (0.12) Interest coverage 0.489*** 0.09 0.671*** 0.13 (0.18) (0.25) Short-term leverage 0.290** 0.06 0.329* 0.09 (0.13) (0.20) Cash holdings 0.345*** 0.13 0.300** 0.08 (0.10) (0.14) Equity dependence 0.350*** 0.15 0.374*** 0.16 (0.08) (0.09) Dividend/earnings 0.197** 0.04 0.272* 0.06 (0.10) (0.14) Operational policies R&D 0.542*** 0.20 0.576*** 0.22 (0.09) (0.11) Advertising 0.103 0.01 0.049 0.00 (0.07) (0.10) SG&A 0.394*** 0.10 0.242** 0.04
(0.11) (0.12) Profitability Return on assets 0.238** 0.02 0.285** 0.04
(0.11) (0.14) Return on sales 0.375*** 0.20 0.407*** 0.20 (0.07) (0.09)
47
Table 12 Alternative explanations: Product market links
This table examines the effects of industry links, customer-supplier relationships and contractual agreements regarding shared assets. The column No Industry Link reports the results of regressing the spinoff fixed effect on parent fixed effect after restricting the sample to those where the parent and spinoff belong to different 3-digit SIC industries. The column No Customer-Supplier Rel. restricts the sample to those where the spinoff is neither a major customer nor a supplier of the parent as recorded in the Compustat customer segment files. The column No Contract restricts the sample to those where the spinoff and parent do not have any product market relationship of non-transitional nature as reported in the proxy statements or 10-K filings, other than a customer-supplier relationship. The definitions of all variables are available in the Data Appendix. Robust standard errors are reported in parentheses. ***, **, and * indicate significance at the 1%, 5%, and 10% levels, respectively.
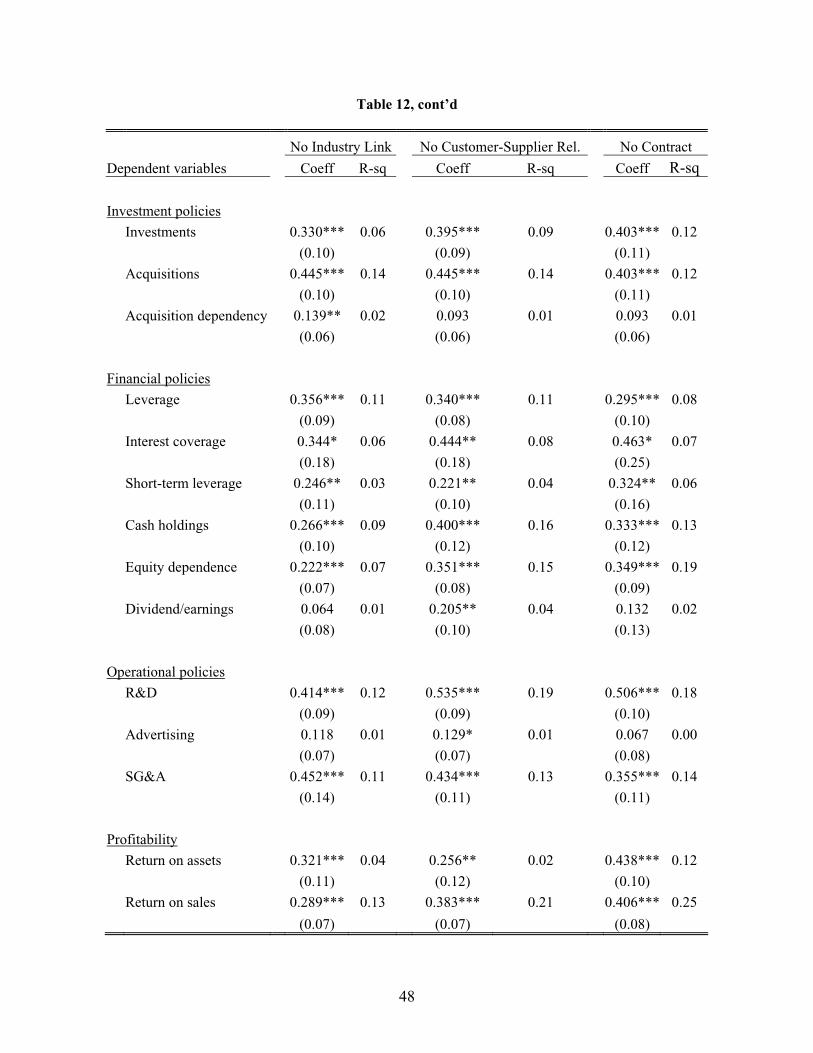
48
Table 12, cont’d
No Industry Link No Customer-Supplier Rel. No Contract
Dependent variables Coeff R-sq Coeff R-sq Coeff R-sq
Investment policies
Investments 0.330*** 0.06 0.395*** 0.09 0.403*** 0.12
(0.10) (0.09) (0.11)
Acquisitions 0.445*** 0.14 0.445*** 0.14 0.403*** 0.12
(0.10) (0.10) (0.11)
Acquisition dependency 0.139** 0.02 0.093 0.01 0.093 0.01
(0.06) (0.06) (0.06)
Financial policies
Leverage 0.356*** 0.11 0.340*** 0.11 0.295*** 0.08
(0.09) (0.08) (0.10)
Interest coverage 0.344* 0.06 0.444** 0.08 0.463* 0.07
(0.18) (0.18) (0.25)
Short-term leverage 0.246** 0.03 0.221** 0.04 0.324** 0.06
(0.11) (0.10) (0.16)
Cash holdings 0.266*** 0.09 0.400*** 0.16 0.333*** 0.13
(0.10) (0.12) (0.12)
Equity dependence 0.222*** 0.07 0.351*** 0.15 0.349*** 0.19
(0.07) (0.08) (0.09)
Dividend/earnings 0.064 0.01 0.205** 0.04 0.132 0.02
(0.08) (0.10) (0.13)
Operational policies
R&D 0.414*** 0.12 0.535*** 0.19 0.506*** 0.18
(0.09) (0.09) (0.10)
Advertising 0.118 0.01 0.129* 0.01 0.067 0.00
(0.07) (0.07) (0.08)
SG&A 0.452*** 0.11 0.434*** 0.13 0.355*** 0.14
(0.14) (0.11) (0.11)
Profitability Return on assets 0.321*** 0.04 0.256** 0.02 0.438*** 0.12
(0.11) (0.12) (0.10)
Return on sales 0.289*** 0.13 0.383*** 0.21 0.406*** 0.25
(0.07) (0.07) (0.08)