Embed Size (px)
Citation preview
1
ENVIRONMENTAL POLICIES AND FIRM-LEVEL MANAGEMENT PRACTICES IN JAPAN
Akira HIBIKI
National Institute for Environmental Studies & Tokyo Institute of Technology
and
Toshi H. ARIMURA Sophia University
in cooperation with
OECD Environment Directorate
The views expressed in this report are those of the authors and do not necessarily reflect those of the institutes with which they are affiliated, or the OECD.

2
Acknowledgements
We are grateful to Nick Johnstone (OECD) for his helpful comments on this report, and Yoshinao Kohzuma (Sophia Univ.) and Koichi Kawano (Japanese Ministry of the Environment) for the helpful comments on the Japanese survey.
3
1. INTRODUCTION
The OECD Environment Directorate has initiated a multi-country study of ‘environmental policy design and firm-level management’, seeking to examine the impacts of environmental policy on firm-level and facility-level decision-making. Alongside research being undertaken in six other OECD countries (Hungary, Germany, France, Norway, Canada and the United States) data was collected from a large number of Japanese facilities. This report represents an overview of the contents of the database. It is to be followed by econometric analyses of the links between environmental policy, management and performance. One motivating factor for this work is the need for an assessment of recent environmental policy initiatives, including the more widespread use of economic instruments. In addition, the voluntary approach is increasingly being regarded, both in Japan and abroad, as an effective means of achieving the emissions targets set by the Kyoto Protocol. A growing number of cases where firms’ voluntary initiatives are promoted by means of a contract method, such as an agreement, or a method in which a nation develops specific programs are being observed overseas, especially in the United States and Europe.1 In Japan, the government defines voluntary initiatives as “actions that firms take voluntarily, in which they establish non-binding targets as a means of implementing environmental conservation measures” and its Basic Environmental Plan has characterised them as a tool for actively working on issues such as preserving the global environment and treatment of industrial waste and chemical substances. The government’s growing interest in voluntary initiatives can mainly be attributed to two facts: (1) It takes tremendous time to reach consensus on the implementation of economic measures such as regulations and environmental taxes, and (2) Voluntary approaches give firms flexibility and assist in the reduction of costs incurred when reducing their environmental impacts. The adoption of environmental management systems is expected to help firms significantly reduce their environmental impacts, in spite of being entirely voluntary. In Japan, a growing number of firms and facilities are introducing environmental management system, most of which follow ISO 14001, an environmental management system certified by the International Standardization Organization (ISO). The number of acquisitions of ISO 14001 certification has been increasing rapidly since it was first introduced in Japan in 1995. The number of acquisitions was 1,395 at the end of 1998, and exceeded 10,000 in 2002. It stood at 12,392 as of June 30, 2003. The cumulative number of acquisitions has grown almost 10-fold during the past four years, indicating that attitudes towards its acquisition are generally positive. Recent empirical work (Nakamura et al. 2000, Welch et al. 2002, Anton et al. forthcoming, and Hibiki et al. 2003) provide empirical evidence on the determinants and benefit of environmental management, all of which analyze the incentive of acquisition of ISO 14001 certification in Japan, with the exception of Anton et al.(forthcoming). Nakamura et al. (2000) implemented a survey on environmental management systems with manufacturing firms selected randomly from those listed in the First Section of the Tokyo Stock Exchange (1997). They analyzed the incentives for corporate-wide acquisition of ISO 14001 certification using cross-sectional data collected in the survey as well as the firms’ performance of the 193 sampled firms, of which 21% had obtained ISO 14001 certification.

4
The empirical results indicated that larger firms and higher advertisement spending, gives greater incentives for firms to acquire ISO 14001 certification. However, the authors made it clear that neither the debt ratio (the firm’s debt) nor the age distribution of the employees affected acquisition. In some model specifications, the greater the proportion of a firm’s total turnover accounted for by export shipments, the greater the incentive for acquisition. In addition, social pressure was also found to influence firms’ acquisition. Welch et al. (2002) implemented a survey in March 1999 that covered four industrial fields: chemicals, electrical machinery, electronics, and power generation. They analyzed the incentives of the facility to be certified using data collected in the survey (721 facilities, of which 48% were certified). The results obtained implied that, tight regulations, pressure from the media, and larger firm-size had positive impacts on the likelihood of obtaining certification. On the other hand, consumer pressure did not affect the firms’ incentive to acquire ISO 14001. Hibiki et al. (2003) analyzed incentives for corporate-wide acquisition and the influence of acquisition on the market valuation of the firm (Tobin’s Q) for all manufacturing firms listed in the First Section of the Tokyo Stock Exchange using cross-sectional data, including firms’ business performance as of March 31, 2002 (573 samples, of which 60.4% were certified). The empirical results revealed the following three points. 1) Firm size, profit rate (rate of operating profit to sales), the export ratio, and R&D spending, had
positive incentives for acquisition by firms. 2) Firms in the pharmaceutical industry, metal industry, transportation machinery industry, and
precision machinery industry have lower incentives for ISO acquisition than firms in other industries.
3) Incentives for acquisition are not affected by growth rate, sales, debt ratio, capital turnover ratio, nor advertising spending.
In addition to the points made above, the study revealed that ISO 14001 acquisition raised the market valuation of firms. Investors presumably consider that acquisition helps a firm to reduce its environmental impact and therefore the risk of future liability caused by environmental pollution, contributing to an increase in its profits on a long-term basis. In other words, the Japanese stock market plays the role of encouraging firms to promote environmental conservation activities because environmental conservation efforts are included in the criteria used in stock market valuation. As described above, there are several empirical analyses on acquisitions of ISO 14001 certification by Japanese firms. However, there are also a number of outstanding issues.
• The situation may have changed markedly because the analyses were undertaken at the initial stage of certification (Nakamura et al., 2000 and Welch et al., 2002).
• Analyses are based on research that centers on the chemical industry, electrical machinery industry, electronics industry, and power generation industry, all of which have a higher than average rate of ISO 14001 acquisition. Because the data of the business and financial performance of the firm are used for individual facilities, it remains to be seen how much the management of individual facilities affects decision-making (Welch et al., 2002). • The research focused only on listed firms. That is, only firms that are larger than a certain size were covered by the research. Facilities usually make decisions independently as to whether to acquire certification, but, for simplicity, analyses were carried out only on corporate-wide decision-making. (Nakamura et al., 2000, Hibiki et al., 2003)
5
Accordingly, the objective of this project is to improve upon previous studies by analyzing facility-level decision-making on the adoption of environmental management system. We adopt the following three research strategies.
• Our analysis is made on facility-level decision-making in the sampled firms, including small facilities.
• We cover the manufacturing industry in its entirety, distinguishing between different sectoral branches.
• Our analysis takes into consideration the influences of business performance on facility-level decision-making.
The objective of this report is to describe the current status of Japanese environmental policies and to carry out a preliminary analysis and discuss the results of the survey of firms and facilities conducted from April to May 2003. In Section 2, the implementation method of the survey is explained and a summary is given of the collected samples. Japanese environmental policies are outlined in Section 3, and in Section 4 the relationship between environmental management and environmental performance are reviewed in the light of the survey results. Section 5 covers incentives and factors which affect motivation to introduce environmental management system, and Section 6 analyses the relationship between government environmental policies and firm efforts for environmental preservation. The relationship between a firm’s management situation and environmental conservation activities are analyzed in Section 7.
6
2. OVERVIEW OF THE SAMPLE
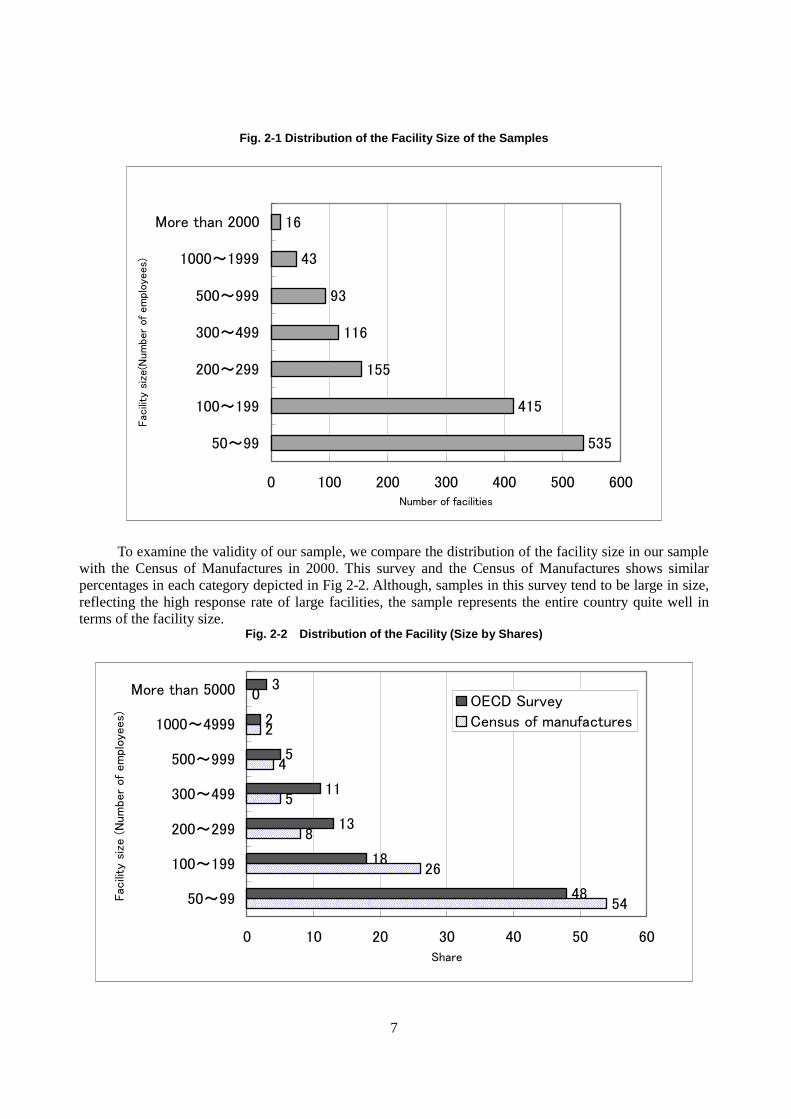
In this section, we outline the survey and the responding firms. Executed as one of seven surveys undertaken amongst OECD countries, this survey focuses on facility-level environmental management and prevention in Japan. We used the database from Teikoku Databank which keeps data of firms nationwide (number of employees, capital, financial condition, and asset position etc.). Firstly, using the database, we excluded firms with less than 50 employees. From the remaining firms, we used the industry codes and firm size to create categories. Then we selected firms from each category using random sampling. Finally, we sent questionnaires to the selected firms in April 2003. The purpose of the survey was to examine the structure of the decision-making process within a representative manufacturing facility of each individual firm and the influence of the financial status of the firm on the decision-making process of the representative facility. To achieve this, the questionnaire consisted of two parts. Part one was designed for the firm selected by random sampling. Part two was constructed for the representative facility of the selected firm. The representative facility was selected by the firm itself when the firm had more than one facility. We sent questionnaires to 4,757 firms, and received replies from 1,499 firms and their facilities, which is approximately 32%. This is relatively a high response rate considering the length of the questionnaire of this kind. Using the database of Teikoku Databank, we categorized the 1,499 firms into three categories depending on the firm size; 50-299, 300-999, and greater than 1000 employees. The response rate for each category was 30%, 40%, and 55% respectively. If the survey population represents the entire population, the response rate implies that the sample obtained was skewed towards large firms due to the fact that small firms had a low response rate. However, the response rate of 30% for firms with less than 300 employees is high enough a response rate for small firms. The sectoral response rate by type of industry can be compared using the industrial classifications of Teikoku Databank. The response rate of the industry, based on1 Teikoku Databank’s classification, to which we sent more than 50 questionnaires recorded a response rate between 20% and 40%. It was also found that respondent facilities have diverse customers for their products. Facilities that ship products nationally have the largest share of 68%, and those that ship products globally followed with a share of 19%. Facilities that ship products locally account for 12% of the sample. In sum, although more than half of the respondents ship products mainly to the domestic market, many facilities ship products internationally. Fig 2-1 shows the distribution of facilities according to the number of employees. The average employees per facility was 285. The facility with 50-99 employees has the largest share within the entire sample with 39%, or 535 facilities out of the total of 1499 facilities. The distribution of employees ranges from 50 to 28,618 with a relatively large standard deviation of 1,123.
1 It should be noted that the industrial classifications of Teikoku Databank basically corresponds to Japan
Standard Industrial Classification, but does not perfectly correspond to the International Standard Industrial Classification (SIC).
7
Fig. 2-1 Distribution of the Facility Size of the Samples
535
415
155
116
93
43
16
0 100 200 300 400 500 600
50~99
100~199
200~299
300~499
500~999
1000~1999
More than 2000
Fac
ility
siz
e(N
um
ber
of em
ploye
es)
Number of facilities
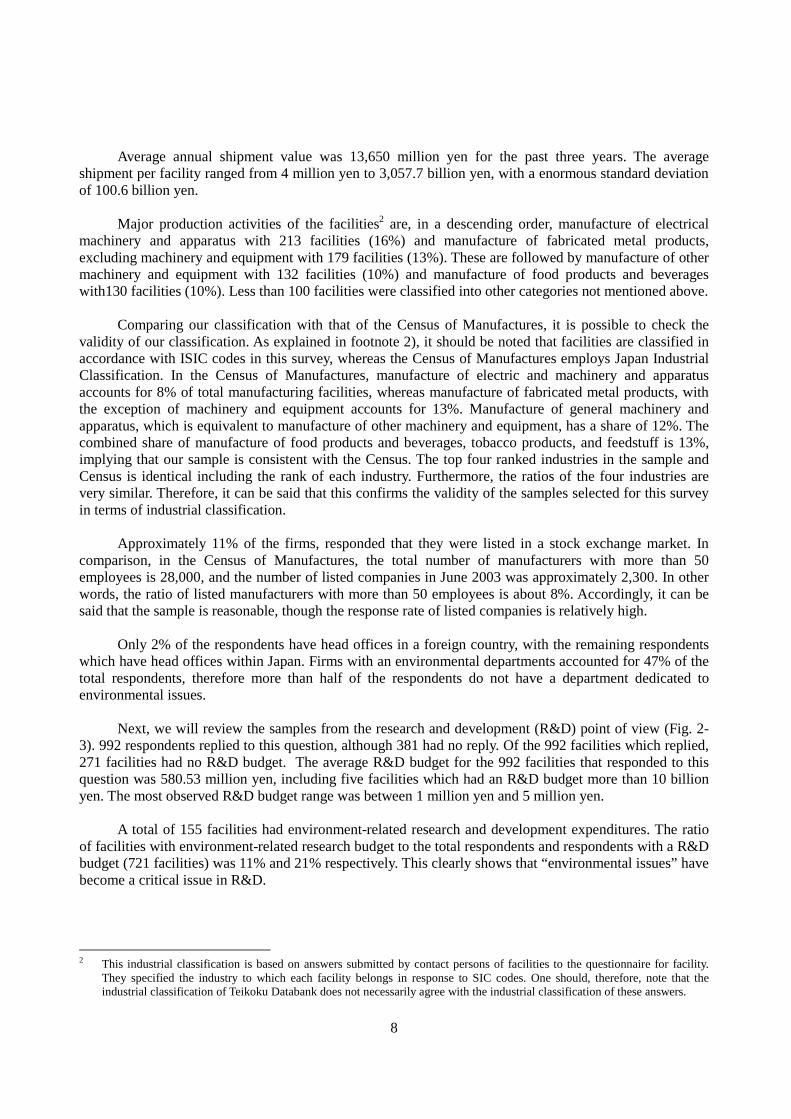
To examine the validity of our sample, we compare the distribution of the facility size in our sample with the Census of Manufactures in 2000. This survey and the Census of Manufactures shows similar percentages in each category depicted in Fig 2-2. Although, samples in this survey tend to be large in size, reflecting the high response rate of large facilities, the sample represents the entire country quite well in terms of the facility size.
Fig. 2-2 Distribution of the Facility (Size by Shares)
54
26
8
5
4
2
0
48
18
13
11
5
2
3
0 10 20 30 40 50 60
50~99
100~199
200~299
300~499
500~999
1000~4999
More than 5000
Fac
ility
siz
e (
Num
ber
of
em
plo
yees)
Share
OECD Survey
Census of manufactures
8
Average annual shipment value was 13,650 million yen for the past three years. The average shipment per facility ranged from 4 million yen to 3,057.7 billion yen, with a enormous standard deviation of 100.6 billion yen. Major production activities of the facilities2 are, in a descending order, manufacture of electrical machinery and apparatus with 213 facilities (16%) and manufacture of fabricated metal products, excluding machinery and equipment with 179 facilities (13%). These are followed by manufacture of other machinery and equipment with 132 facilities (10%) and manufacture of food products and beverages with130 facilities (10%). Less than 100 facilities were classified into other categories not mentioned above. Comparing our classification with that of the Census of Manufactures, it is possible to check the validity of our classification. As explained in footnote 2), it should be noted that facilities are classified in accordance with ISIC codes in this survey, whereas the Census of Manufactures employs Japan Industrial Classification. In the Census of Manufactures, manufacture of electric and machinery and apparatus accounts for 8% of total manufacturing facilities, whereas manufacture of fabricated metal products, with the exception of machinery and equipment accounts for 13%. Manufacture of general machinery and apparatus, which is equivalent to manufacture of other machinery and equipment, has a share of 12%. The combined share of manufacture of food products and beverages, tobacco products, and feedstuff is 13%, implying that our sample is consistent with the Census. The top four ranked industries in the sample and Census is identical including the rank of each industry. Furthermore, the ratios of the four industries are very similar. Therefore, it can be said that this confirms the validity of the samples selected for this survey in terms of industrial classification. Approximately 11% of the firms, responded that they were listed in a stock exchange market. In comparison, in the Census of Manufactures, the total number of manufacturers with more than 50 employees is 28,000, and the number of listed companies in June 2003 was approximately 2,300. In other words, the ratio of listed manufacturers with more than 50 employees is about 8%. Accordingly, it can be said that the sample is reasonable, though the response rate of listed companies is relatively high. Only 2% of the respondents have head offices in a foreign country, with the remaining respondents which have head offices within Japan. Firms with an environmental departments accounted for 47% of the total respondents, therefore more than half of the respondents do not have a department dedicated to environmental issues. Next, we will review the samples from the research and development (R&D) point of view (Fig. 2-3). 992 respondents replied to this question, although 381 had no reply. Of the 992 facilities which replied, 271 facilities had no R&D budget. The average R&D budget for the 992 facilities that responded to this question was 580.53 million yen, including five facilities which had an R&D budget more than 10 billion yen. The most observed R&D budget range was between 1 million yen and 5 million yen. A total of 155 facilities had environment-related research and development expenditures. The ratio of facilities with environment-related research budget to the total respondents and respondents with a R&D budget (721 facilities) was 11% and 21% respectively. This clearly shows that “environmental issues” have become a critical issue in R&D.
2 This industrial classification is based on answers submitted by contact persons of facilities to the questionnaire for facility.
They specified the industry to which each facility belongs in response to SIC codes. One should, therefore, note that the industrial classification of Teikoku Databank does not necessarily agree with the industrial classification of these answers.

9
Fig. 2-3 Distribution of R&D Expenditure
271
32
157
91
112
120
66
90
20
28
5
0 50 100 150 200 250 300
0 Yen
~1 Mill Yen
1 Mill~Less than 5 Mill Yen
5 Mill~Less than 10 Mill Yen
10 Mill~Less than 20 Mill Yen
20 Mill~Less than 50 Mill Yen
50 Mill~Less than 100 Mill Yen
100 Mill~Less than 500 Mill Yen
500 Mill~Less than 1 Bill Yen
1 Bill~Less than 10 Mill Yen
More than 10 Bill Yen
R&D
exp
endi
ture
Number of facilities
Forty-one percent of respondents indicated a decrease and 14% reported a considerable decrease in sales for the past three years. These responses imply Japan’s stagnant economy caused by deflation for the past several years. However, some industries recorded a sales increase. For example, 42% had sale increases and the 8% of facilities in the motor vehicles, trailers, and semi-trailers industry reporting tremendous sales increases due to the success the auto industry had undergone. As for business performance for the past three years, 35% replied they had a balanced budget and 40% replied that they show a favorable balance. This shows that respondents were able to retain a favorable balance by reducing costs amid decreasing sales. The two figures seem to reflect the recent situation of the Japanese economic conditions precisely. In sum, the survey in Japan achieved a response rate that are higher than response rates recorded by surveys in other OECD countries, with the sample correctly representing the Japanese manufacturing industry in terms of distribution of industries and ratio of listed companies. Moreover, the sample has little bias in terms of the distribution of facility size.
10
3. PUBLIC POLICY BACKGROUND
In this section, firstly, we will discuss the Japanese environmental policies which impact upon manufacturing industries in Japan. Then we will analyze which regulations have effects on individual facilities, which facilities encounter.
3.1 Environmental issues and environmental polices in Japan
In Japan, top priority environmental issues include air pollution in urban areas (NOx, SPM, hazardous chemical substances), solid waste, eutrophication, environmental protection, and climate change. To solve these environmental issues, the regulatory approach has been widely used in Japan, neglecting incentive-based approaches such as environment taxes. According to OECD (2003), Japan imposes more stringent standards on air pollution but less stringent standards on water pollution in catchment areas, such as rivers, lakes, and coastal regions, compared to other OECD countries. To keep local environments clean, municipalities are empowered to implement ordinances that set more stringent emissions standards than those imposed by Japanese National Law. Accordingly, many municipalities have more stringent standards than the national versions. In addition to regulations imposed by the country or municipality, pollution control agreements, between individual facilities and the municipality governing it, has played and continue to play an important role as a government measure for environmental management. If regulations are not sufficiently effective to improve the regional environment, municipalities often make agreements with newly established facilities, in order to protect the environment by setting more stringent contracts than regulations on emissions of contaminants. By the late 1990s, more than 30,000 facilities which were sources of pollution had made agreements with their local municipality. These agreements cover air pollutants, water pollutants, vibration, noise, and waste, and often include special limits on emissions, utilization of the best possible technologies that are available, and reporting obligations. (Welch & Hibiki 2002, OECD 2003)
3.1.1 Air Pollution
Japan has set environmental standards on contaminants, such as SOx, NOx, SPM, and photochemical oxidants, that are far more stringent than their equivalents in EU and the United States (OECD 2003). To meet these stringent standards, traditionally, Japan has applied end-of-pipe emission standards or regulation of total emissions (for SOx and NOx) to fixed sources of these pollutants in order to reduce overall environmental impacts. As of March 1998, a total of 206,400 facilities were subject to regulation on emissions of SOx, NOx, and particulates. In addition, 59,500 facilities and 2,100 facilities, respectively, had been made subject to regulation on general coarse particulates and asbestos. At the same time, the sulfur emission charges are imposed on fixed sources such as manufacturing plants which emit SOx, depending on the amount emitted. The charge per unit of SOx varies according to region. Large cities like Osaka and Tokyo are subject to higher charges than other cities.
11
As for toxic air pollutants, the legal framework was completed in 1997 to regulate emission of benzene, trichloroethylene, tetrachloroethylene, and dioxin-related substances. Managers of fixed contaminant sources are subject to a fine of a maximum one million yen or a prison term of up to one year if they fail to meet regulations on pollutants, such as SOx, NOx, or dioxin-related substances. On the other hand, no legal penalty is imposed on administrators for excess emissions of benzene, trichloroethylene, and tetrachloroethylene.
3.1.2 Water Pollution
Japan regulates the drainage of soluble nutrients like phosphorous and nitrogen to lakes and closed waters. In addition to regulations on drainage, to prevent over-pollution to designated areas (Tokyo Bay, Ise Bay, and Seto Inland Sea) total emission regulations are enforced on all pollution sources since 1979. Due to eutrophication, one-fourth of lakes in Japan still suffer from damage caused by algae, creating unsuitable drinking water. With regard to water pollution caused by organic pollutants, the percentage of lakes and sea areas meeting COD standards have been decreasing recently, with only 45% of lakes and 75% of sea areas in 1999.
3.1.3 Waste
Waste problems in Japan can roughly be divided into three types: controlling the amount of waste, shortage of waste disposal sites and environmental pollution at disposal sites, and illegal dumping. Some municipalities impose a levy on industrial waste coming from outside the area for disposal as a means of controlling waste volume and eliminating problems caused by local shortages of waste disposal sites. In addition, the Containers and Packaging Recycling Law, the Home Appliance Recycling Law, the Construction Material Recycling Act, and the Food Recycling Law have been put into effect to encourage recycling in order to reduce over all waste volume. The Containers and Packaging Recycling Law (enforced in 1995) obligates firms that manufacture or utilize containers (PET bottles, glass containers, cardboard, paper, and other plastic containers and packaging) to recycle a certain ratio of containers and packaging waste. The Home Appliance Recycling Law (partly enforced in 1998 and fully enforced in 2001) is designed to facilitate the collection of parts and materials from end-of-life air conditioners, TV sets, refrigerators, and washing machines, and reutilize them as raw materials, parts, or fuel. Under this Law, manufacturing firms are obligated to collect their products and reutilize a certain proportion commercially as raw materials and parts. The Construction Materials Recycling Act (enforced in 2002) makes it obligatory to sort out in the field specific construction materials (concrete, wooden building materials, and asphalt-concrete) used for buildings larger than a certain level when they are dismantled, thus facilitating the recycling and re-use of what would otherwise be considered waste. The Food Recycling Law (enforced in 2001) is designed to facilitate the utilization of food waste created in the process of food manufacturing as feedstuff, fertilizer, fat, oil and fat products, and methane. Under this Law, food-related firms (food manufacturing, distribution, sales, and catering) are obligated to contribute in the reduction of food waste by outsourcing the recyclable waste to recycling companies.
12
A manifest system was introduced in 1990 to tighten surveillance of illegal disposal and incorrect treatment which occurred during the process of transporting and processing of industrial wastes. Penalties were made more severe for illegal dumpers (Hibiki and Arimura 2002).
3.1.4 Chemicals
Japan enacted a law in 1973 regulating the manufacture, import, and use of chemicals. Presently, 712 types of chemicals are regulated. However, up until 1999, when the Pollutant Release and Transfer Register (PRTR) Law was brought into force, notification of chemical emissions was not necessary. Recently, from 2002, facilities are obligated to report the emission and transfer of 354 chemicals substances under this Law.
3.1.5 Soil Contamination
Soil contamination regulation in Japan is underdeveloped compared to other countries. Environmental quality standards for soil were established for the first time in August 1992, and the Soil Contamination Countermeasures Law was introduced recently in 2002. Under this Law, landowners of plants or facilities that have used toxic substances in the past or land contaminated by previously existing facilities, which have the threat of causing health hazards are obligated to conduct a survey on soil contamination. If the soil falls below the environmental standards they are publicized, and landowners are obligated to remove the toxins within the soil.3
3.1.6 Climate Change
In 1999, CO2 emission exceeded the 1990 level by approximately 9%. On the other hand, emissions of methane, dinitrogen monoxide, hydrofluorocarbons, perfluorocarbons, and sulfur hexafluoride decreased, respectively, by 11%, 21%, 3%, 4%, and 50% compared to the 1990 level. By 2010 emissions of carbon dioxide and dinitrogen monoxide are estimated to increase by 20% and 24% relative to 1990, respectively, whereas methane emissions are expected to decrease by 6% (OECD 2003). The Kyoto Protocol set target emission for greenhouse gases in the First Commitment Period (2008-2012) at a 6% level lower than 1990. Judging from this target, it is an urgent task to reduce emissions of carbon dioxide because, they are estimated to have increased greatly and are the largest contributor to global warming potential among the six greenhouse gases. To reduce emissions of carbon dioxide, the government is reviewing existing energy taxes and promoting special greening accounts. As one measure, the government will introduce the Petroleum and Coal Tax after revising the current petroleum tax on October 1, 2003. The current petroleum tax is applied to crude oil, imported petroleum products, liquefied petroleum gas (LPG), domestically produced natural gas, and liquid natural gas (LNG). After the revision, however, the taxation level of domestically produced natural gas, LPG, and LNG will be raised gradually, and coal will also become subject to taxation. As a result, the revision is equivalent to introducing a carbon tax of approximately ¥500 per carbon ton for natural gas, LNG, and LPG, and 1,100 yen per carbon ton for coal. In addition to these tax increases, the government is planning to implement a tax on global warming of ¥3,000 per carbon ton between 2005 and 2007 and implement a policy package. The tax collected will be used to subsidize facilities investing in energy conservation (Hibiki 2003).
3 Landowners can charge removal costs to whom was responsible for the polluted soil.
13
3.2 Environmental policies and their influence on production activities at facilities
In the following, we will analyze the environmental policies which facilities face using our survey results.
3.2.1 Environmental Policies and their Influence on Production Activities at Facilities
Based on all manufacturing industries, shown in Table 3-1, we find that more than 50% of facilities replied that the influence of “performance-based standards”, “input taxes (including energy)”, “liability for environmental damages”, and “supply information measures” was “important” or “very important” in regulation of production activities. On the other hand, facilities replying that they are significantly affected by “input bans”, “technology-based standards”, and “technical assistance programs” account for 20% to 30%. Japanese environmental policies are mainly composed of regulatory measures such as emission controls and effluent controls. These policies have significant effects on production activities of individual facilities shown by the high percentage of replies of “performance-based standards” (62%). Furthermore, “input taxes (including energy)” had a relatively high response (53%), which implies that taxation on fuels (the Petroleum and Coal Tax) affects facility production. As for the high response rates for “liability for environmental damages” as restrictions on the production activities of firms and facilities, can be considered to reflect the recent implementation of laws covering the environmental area (recycling laws, including the Containers and Packaging Recycling Law, Home Appliance Recycling Law, and Soil Contamination Countermeasures Law) and the increasing number of successful cases demanding that firms, facilities, and the government be made liable for environmental damage. These policy changes affecting firms and facilities have changed the recognition of environmental issues because of the high penalties for illegal actions. With respect to other manufacturing facilities, facilities which manufacture chemicals and chemical products, rubber and plastic products, fabricated metal products, and electrical machinery and apparatus replied that “supply information measures” had significant effects on production activities, with greater ratios. This presumably suggests that the PRTR law, which obliges firms and facilities to report and disclose information on chemical emissions, significantly affects production activities. Next, we will review which environmental policy has “significant” effects on facilities, focusing on industries with more than 50 respondents.4 (Here, “significant” refers to facilities which replied “very important” and “important” in the survey and this characterisation will be used in the discussion which follows unless otherwise specified.) Table 3-1 shows the ratio of “significant” by type of industry and by type of environmental policy5.
4 A total of 10 industries that had responses from more than 50 facilities are manufacture of food products and beverages
(131 facilities), manufacture of textile (59 facilities), publishing, printing and reproduction of recorded media (77 facilities), manufacture of chemicals and chemical products (89 facilities), manufacture of rubber and plastics products (93 facilities), manufacture of basic metals (74 facilities), manufacture of fabricated metal products (181 facilities), manufacture of other machinery and equipment (132 facilities), manufacture of electrical machinery and apparatus (217 facilities), and manufacture of other transport equipment (82 facilities).
5 In the following chapter, unless notification, industrial classification based on the responses to the question on “the main
production activity of your facility” in this survey (selected from SIC classification) is used in the analysis by industry.

14
For example, 16% of the facilities in the Manufactures of Food products and beverages replied that “Input bans” had an significant effect towards production activities, while 74% replied that “Performance-based standards” had an important effect.

15
Table 3-1 Influence of environmental policy instruments on production activities (by industry in percentages)
Foo
d pr
oduc
ts a
nd b
ever
ages
Tex
tile
s
Pub
lishi
ng, p
rint
ing
and
repr
oduc
tion
of
reco
rded
m
edia
.
Che
mic
als
and
chem
ical
pr
oduc
ts.
Rub
ber
amd
plas
tics
pro
duct
s.
Oth
er n
on-m
etal
lic
prod
ucts
Bas
ic m
etal
s
Oth
er m
achi
nery
and
eq
uipm
ent
Ele
ctri
cal m
achi
nery
and
ap
para
tus
Mot
or v
ehic
les,
trai
lers
and
se
mi-
trai
lers
Tota
l
Input bans
16 12 14 25 22 18 22 14 38 20 22
Technology-based standards (e.g. abatement equipment)
15 19 7 33 21 26 26 15 30 23 23
Performance-based standards (e.g. emission levels)
74 56 47 76 67 55 63 42 67 60 62
Input taxes (including energy)
71 41 30 73 59 54 52 39 51 56 52
Emission or effluent taxes or charges 56 35 30 69 46 45 44 30 38 47 43
Tradable emission permits or credits 39 35 23 52 38 38 34 24 39 44 37
Liability for environmental damages
64 43 42 74 59 51 60 44 56 62 57
Demand information measures (e.g.recognition programs)
52 40 42 54 49 47 32 36 41 25 43
Supply information measures (e.g.recognition programs)
42 41 43 75 64 49 54 39 62 67 55
Voluntary/negotiated agreements
49 32 26 57 40 38 32 34 41 44 39
Subsidies/tax preferences
55 34 33 44 34 36 38 34 34 46 38
Technical assistance programmes
26 24 21 36 25 27 35 22 28 29 28
Judging from the reported figure lower than 50% in every category of environmental policy, the influence of environmental policies on publishing, printing and reproduction of recorded media and manufacture of other machinery and equipment industries can be concluded to be very limited. In addition, the only significant environmental policy which regulates the textile industry is reported to be “performance-based standards”, which had a response rate greater than 50%, although other forms of environmental policies had limited effects on production activities. In sum, these three industries are affected by environmental policies to a lesser degree than other industries. Conversely, manufacturers of food products and beverages have 6 influential environmental policies with percentages greater than 50% - “performance-based standards”, “input taxes (including energy)”, “emission or effluent taxes or charges”, “liability for environmental damages”, “demand information measures”, and “subsidies / tax preferences”. In addition, manufacturers of chemicals and chemical
16
products has 8 influential environmental policies with responses greater than 50% being “performance-based standards”, “input taxes (including energy)”, “emission or effluent taxes or charges”, “tradable emission permits or credits”, “liability for environmental damages”, “demand information measures”, “supply information measures”, and “voluntary / negotiated agreements”. This industry is likely to be the industry which is affected by environmental policy to the greatest extent. It is very important to note that 37% of valid responses replied that “tradable emission permits or credits” was “significant” for current facility-level production activities. Japan is currently considering the introduction of an emission trading system to reduce emission of greenhouse gases, but has not actually introduced one yet. However, the government and the industries have implemented an experimental emission trading system to prepare for a forthcoming “tradable emission permits and credits” system, along with a variety of strategies to reduce emissions. From the responses, it is evident that, industries have interest in the “emission trading” system and are preparing for the future without present restrictions on hand.
3.2.2 Stringency of Environmental Administration
Of the 1,262 valid respondents (excluding unanswered), 65% replied that the environmental policy regime was “not stringent”, 32% replied “stringent”, and 4% answered “very stringent”. The average number of employees per facility was 244, 413, and 290 for those responding “not stringent”, “stringent”, and “very stringent”, respectively. In general, small facilities are often not subject to various regulations and laws. These responses provide evidence that the government decides the degree of stringency of regulations according to facility size; thus, the degree of incentives applied for facility-level environmental measures partly depends on facility size.
A reply of “not stringent” was recorded from 42% of facilities in manufacture of food products and beverages, and 44% of facilities in the manufacture of chemicals and chemical products. Likewise, the reply “stringent” was given by 42% and 45% facilities, and the reply “very stringent” was recorded by 7% and 6% of facilities, respectively. In industries other than the two noted above, 55-72% of facilities replied “not stringent”. That is, the manufacturers of food products and beverages and manufacturers of chemicals and chemical products are subjected to relatively more stringent environmental policies than average.
One of the indicators of the stringency of environmental policies is the number of on-site regulatory inspections of environmental policies by the government over the past three years. All the industries in this survey had undergone an average of 2.2 inspections. If we focus on sampled industries that have more than 50 facilities and that have more on-site regulatory inspections than average, manufacturers of chemicals and chemical products had 6.5 inspections, the largest average number for inspection, followed by manufacturers of food products and beverages with 3.0 inspections and manufacture of textiles with 2.6 inspections, showing these three industries are subjected to relatively more inspections.
3.2.3 Environmental policies and adoption of environmental management systems
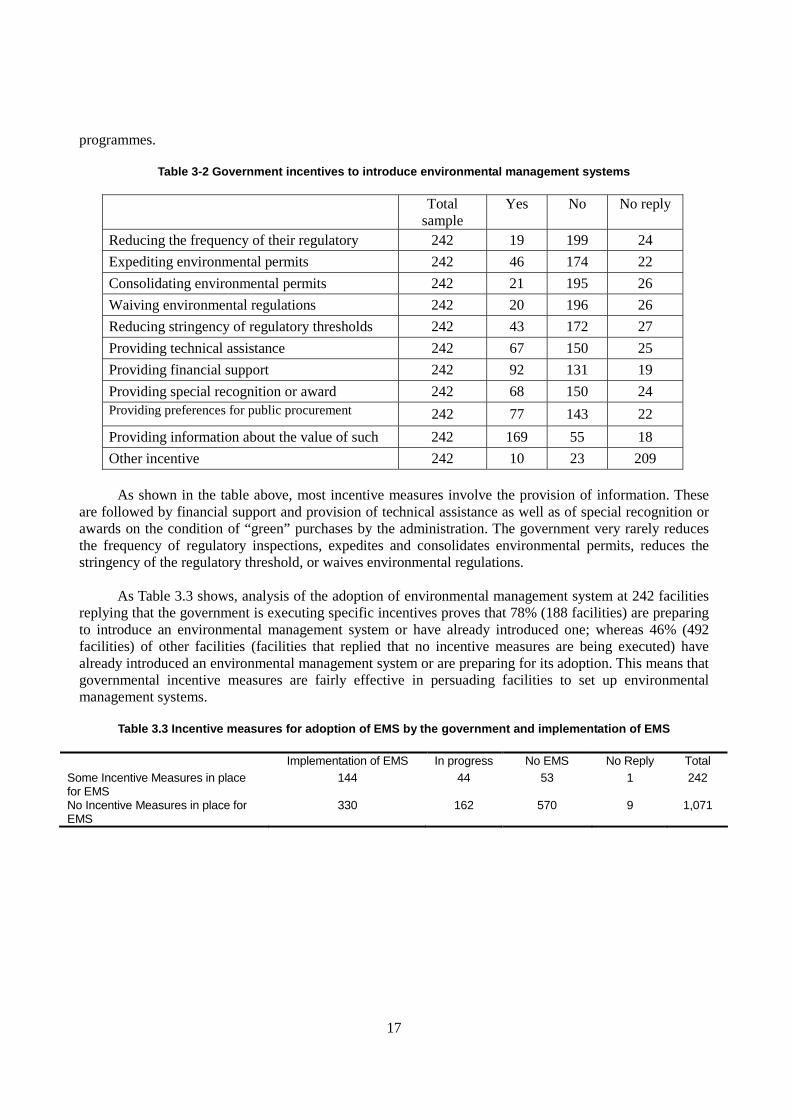
We now review incentive measures introduced by the government, including municipalities, to introduce environmental management system. 242 facilities replied that the “regulatory authorities have programmes and policies in place to encourage the facility to use an environmental management system”, accounting for 18% of all valid responses (excluding unanswered). This indicates that not many municipalities are implementing incentive measures, although incentive measures are not chiefly executed by the central government but by municipalities. Table 3-2 reviews the concrete incentive measures for environmental management of the 242 facilities responding that the government has introduced specific
17
programmes.
Table 3-2 Government incentives to introduce environmental management systems
Total
sample Yes No No reply
Reducing the frequency of their regulatory 242 19 199 24
Expediting environmental permits 242 46 174 22
Consolidating environmental permits 242 21 195 26
Waiving environmental regulations 242 20 196 26
Reducing stringency of regulatory thresholds 242 43 172 27
Providing technical assistance 242 67 150 25
Providing financial support 242 92 131 19
Providing special recognition or award 242 68 150 24 Providing preferences for public procurement 242 77 143 22
Providing information about the value of such 242 169 55 18
Other incentive 242 10 23 209 As shown in the table above, most incentive measures involve the provision of information. These are followed by financial support and provision of technical assistance as well as of special recognition or awards on the condition of “green” purchases by the administration. The government very rarely reduces the frequency of regulatory inspections, expedites and consolidates environmental permits, reduces the stringency of the regulatory threshold, or waives environmental regulations. As Table 3.3 shows, analysis of the adoption of environmental management system at 242 facilities replying that the government is executing specific incentives proves that 78% (188 facilities) are preparing to introduce an environmental management system or have already introduced one; whereas 46% (492 facilities) of other facilities (facilities that replied that no incentive measures are being executed) have already introduced an environmental management system or are preparing for its adoption. This means that governmental incentive measures are fairly effective in persuading facilities to set up environmental management systems.
Table 3.3 Incentive measures for adoption of EMS by the government and implementation of EMS
Implementation of EMS In progress No EMS No Reply Total Some Incentive Measures in place for EMS
144 44 53 1 242
No Incentive Measures in place for EMS
330 162 570 9 1,071
18
4. ENVIRONMENTAL MANAGEMENT AND PERFORMANCE
4.1 Environmental management system and tools
This section reviews the degree of adoption of EMS by firms and facilities, along with the analysis of which EMS has actually been introduced.
4.1.1 Overview of environmental management systems in Japan
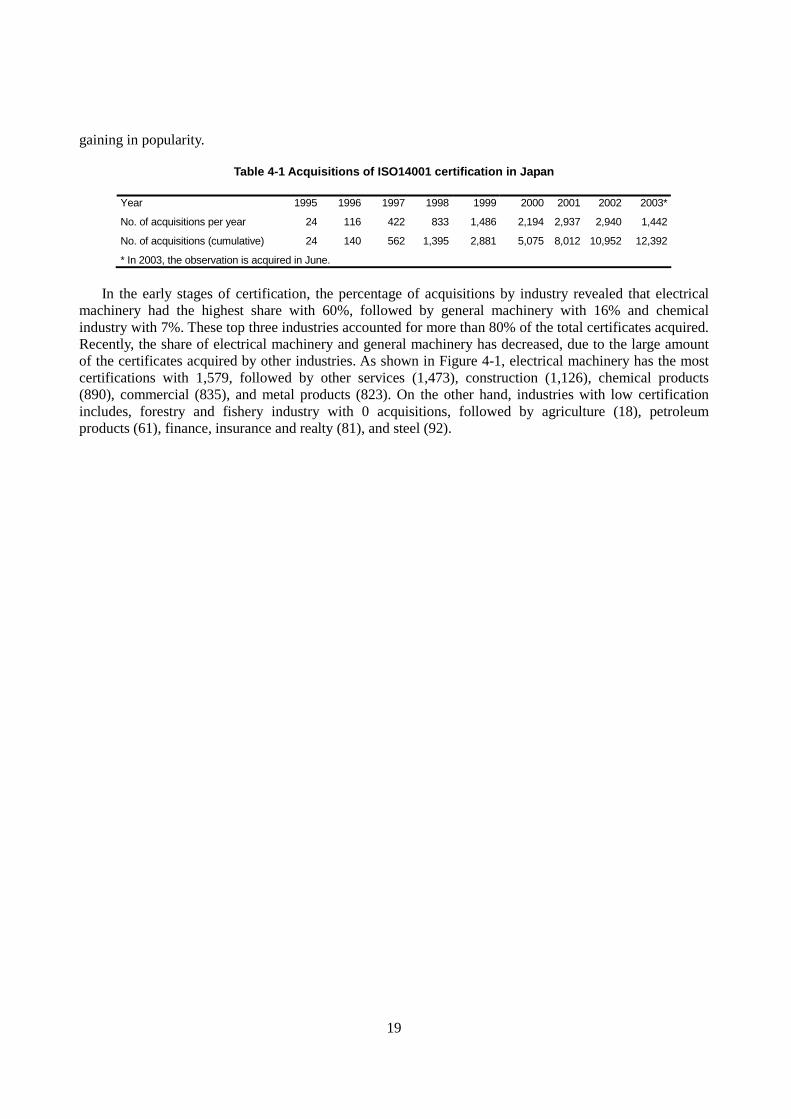
Advantages of acquisition of certification such as (1) publicizing the firms’ effort in environmental conservation, (2) increasing awareness of the need for environmental protection by employees, directors, and shareholders, (3) empowerment of the firm to respond rapidly to environmental problems and resource problems and avoid preliminary risks, (4) attracting investors of the firm by eco-funds, and (5) favorable procedural treatment for the acquisition of administrative permits and favorable conditions for tenders. On the other hand, acquiring certification and maintaining EMS is very costly. The relationship between benefits and costs associated with acquisition varies among the type of firm (or facility), depending on firm size, profitability, industry type and other characteristics of the firm (or facility). Accordingly, incentives for acquisition of certification differ among firms (facilities) depending on the type of firm (facility). Examples of certification of EMS include the Eco-management and Audit Scheme (EMAS) and ISO 14001. In Japan, firms and facilities mainly acquire ISO 14001. It has been mentioned that ISO 14001 is very difficult to acquire for small-sized firms due to the costly acquisition and maintenance fee. To assist these small firms to acquire EMS, new certification standards, Eco Action 21 (EA21) and Kyoto Environmental System Standard (KES), have been established to supplement existing systems. As a result, firms and facilities have acquired EA21 and KES recently, without the acquisition of ISO 14001. EA21, [http://www.env.go.jp/policy/j-hiroba/04-5.html], established in 1993 and encouraged by the Ministry of Environment with the assistance from the National Association for Promotion of Environmental Conservation (an environmental activity evaluation programme) is a simplified environmental management method. As of July 31, 2003, EA21 has 772 registered participants. On the other hand, KES, [http://web.kyoto-inet.or.jp/org/kesma21f/index.htm], is the Kyoto version of an environmental certification standard established by the “Miyako Agenda 21 Forum”, the organization promoting “Miyako Agenda 21”, with goals to establish co-existence of a sustainable society and natural environment. The Forum started to register certifications in May 2001 and issued 254 certificates to firms by the end of July 2003. This certification is a simplified version of ISO 14001 which is easier for small firms to acquire, since acquisition fees are approximately one-tenth of that of ISO 14001. Table 4-1 shows the cumulative acquisitions of ISO 14001 along with the yearly number of acquisition. As the table indicates, acquisitions have increased rapidly yearly, since they were first certified in 1995. The cumulative number of acquisitions increased from 1,395 at the end of December 1998, to more than 10,000 in 2002, and has reached 12,392 by the end of June 2003. The cumulative number of acquisitions has in fact increased approximately 10-fold in less than four years, showing that ISO 14001 acquisition is
19
gaining in popularity.
Table 4-1 Acquisitions of ISO14001 certification in Japan
Year 1995 1996 1997 1998 1999 2000 2001 2002 2003*
No. of acquisitions per year 24 116 422 833 1,486 2,194 2,937 2,940 1,442
No. of acquisitions (cumulative) 24 140 562 1,395 2,881 5,075 8,012 10,952 12,392
* In 2003, the observation is acquired in June.
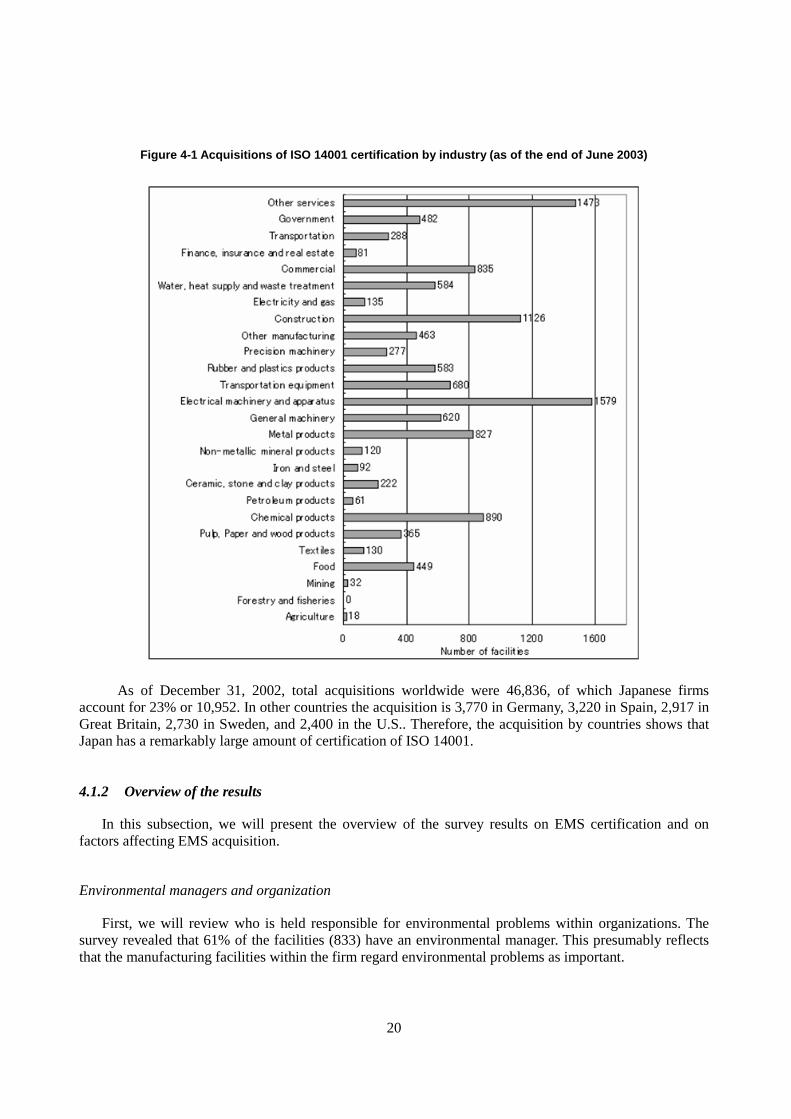
In the early stages of certification, the percentage of acquisitions by industry revealed that electrical machinery had the highest share with 60%, followed by general machinery with 16% and chemical industry with 7%. These top three industries accounted for more than 80% of the total certificates acquired. Recently, the share of electrical machinery and general machinery has decreased, due to the large amount of the certificates acquired by other industries. As shown in Figure 4-1, electrical machinery has the most certifications with 1,579, followed by other services (1,473), construction (1,126), chemical products (890), commercial (835), and metal products (823). On the other hand, industries with low certification includes, forestry and fishery industry with 0 acquisitions, followed by agriculture (18), petroleum products (61), finance, insurance and realty (81), and steel (92).
20
Figure 4-1 Acquisitions of ISO 14001 certification by industry (as of the end of June 2003)
As of December 31, 2002, total acquisitions worldwide were 46,836, of which Japanese firms account for 23% or 10,952. In other countries the acquisition is 3,770 in Germany, 3,220 in Spain, 2,917 in Great Britain, 2,730 in Sweden, and 2,400 in the U.S.. Therefore, the acquisition by countries shows that Japan has a remarkably large amount of certification of ISO 14001.
4.1.2 Overview of the results
In this subsection, we will present the overview of the survey results on EMS certification and on factors affecting EMS acquisition.
Environmental managers and organization
First, we will review who is held responsible for environmental problems within organizations. The survey revealed that 61% of the facilities (833) have an environmental manager. This presumably reflects that the manufacturing facilities within the firm regard environmental problems as important.
21
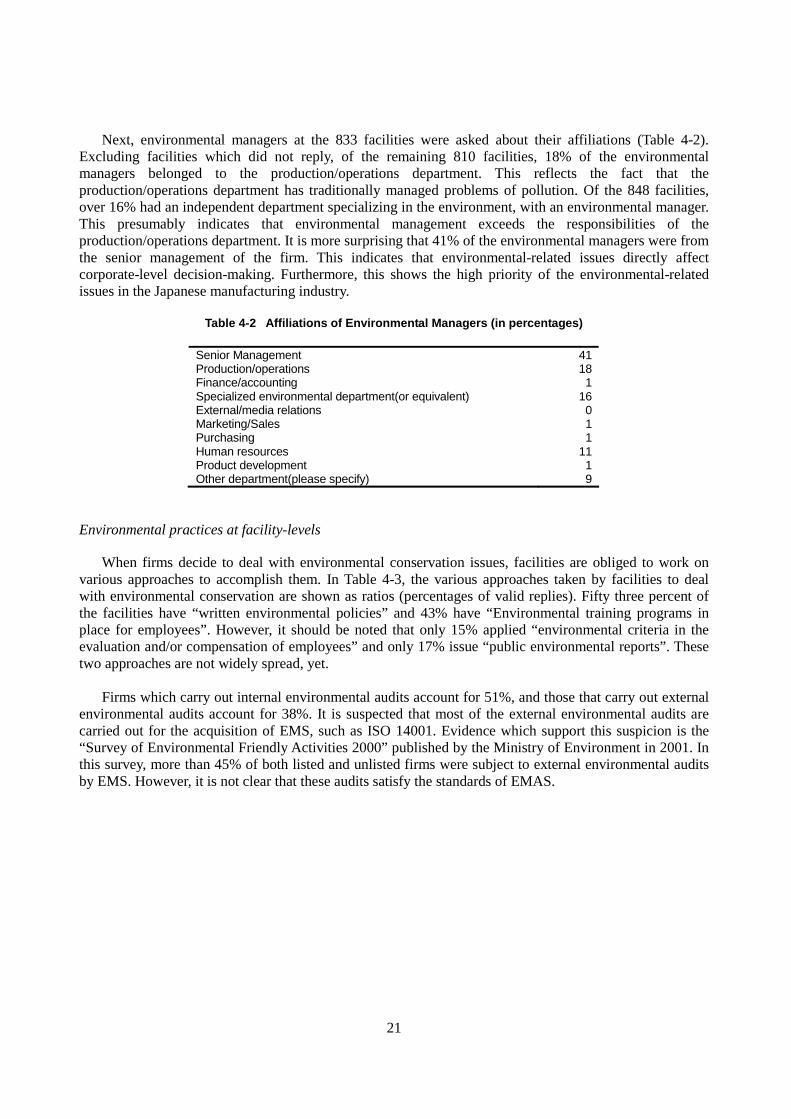
Next, environmental managers at the 833 facilities were asked about their affiliations (Table 4-2). Excluding facilities which did not reply, of the remaining 810 facilities, 18% of the environmental managers belonged to the production/operations department. This reflects the fact that the production/operations department has traditionally managed problems of pollution. Of the 848 facilities, over 16% had an independent department specializing in the environment, with an environmental manager. This presumably indicates that environmental management exceeds the responsibilities of the production/operations department. It is more surprising that 41% of the environmental managers were from the senior management of the firm. This indicates that environmental-related issues directly affect corporate-level decision-making. Furthermore, this shows the high priority of the environmental-related issues in the Japanese manufacturing industry.
Table 4-2 Affiliations of Environmental Managers (in percentages)
Senior Management 41 Production/operations 18 Finance/accounting 1 Specialized environmental department(or equivalent) 16 External/media relations 0 Marketing/Sales 1 Purchasing 1 Human resources 11 Product development 1 Other department(please specify) 9
Environmental practices at facility-levels
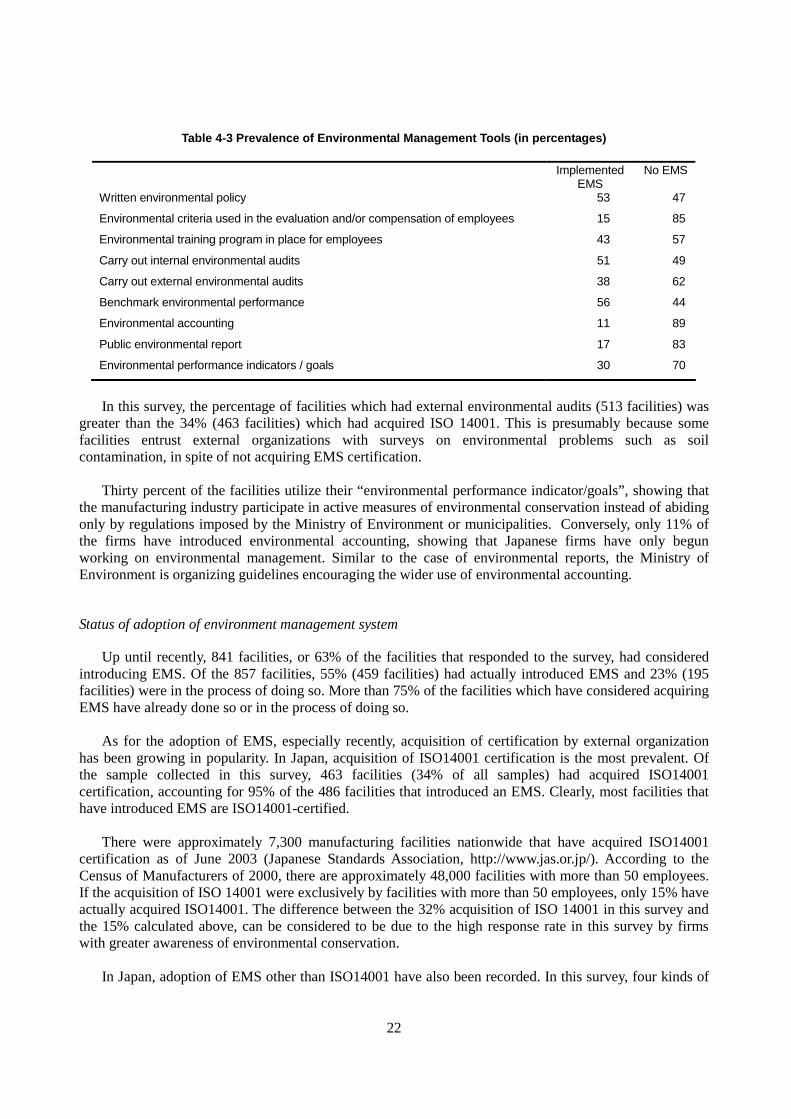
When firms decide to deal with environmental conservation issues, facilities are obliged to work on various approaches to accomplish them. In Table 4-3, the various approaches taken by facilities to deal with environmental conservation are shown as ratios (percentages of valid replies). Fifty three percent of the facilities have “written environmental policies” and 43% have “Environmental training programs in place for employees”. However, it should be noted that only 15% applied “environmental criteria in the evaluation and/or compensation of employees” and only 17% issue “public environmental reports”. These two approaches are not widely spread, yet. Firms which carry out internal environmental audits account for 51%, and those that carry out external environmental audits account for 38%. It is suspected that most of the external environmental audits are carried out for the acquisition of EMS, such as ISO 14001. Evidence which support this suspicion is the “Survey of Environmental Friendly Activities 2000” published by the Ministry of Environment in 2001. In this survey, more than 45% of both listed and unlisted firms were subject to external environmental audits by EMS. However, it is not clear that these audits satisfy the standards of EMAS.
22
Table 4-3 Prevalence of Environmental Management Tools (in percentages)
Implemented EMS
No EMS
Written environmental policy 53 47
Environmental criteria used in the evaluation and/or compensation of employees 15 85
Environmental training program in place for employees 43 57
Carry out internal environmental audits 51 49
Carry out external environmental audits 38 62
Benchmark environmental performance 56 44
Environmental accounting 11 89
Public environmental report 17 83
Environmental performance indicators / goals 30 70
In this survey, the percentage of facilities which had external environmental audits (513 facilities) was greater than the 34% (463 facilities) which had acquired ISO 14001. This is presumably because some facilities entrust external organizations with surveys on environmental problems such as soil contamination, in spite of not acquiring EMS certification. Thirty percent of the facilities utilize their “environmental performance indicator/goals”, showing that the manufacturing industry participate in active measures of environmental conservation instead of abiding only by regulations imposed by the Ministry of Environment or municipalities. Conversely, only 11% of the firms have introduced environmental accounting, showing that Japanese firms have only begun working on environmental management. Similar to the case of environmental reports, the Ministry of Environment is organizing guidelines encouraging the wider use of environmental accounting.
Status of adoption of environment management system
Up until recently, 841 facilities, or 63% of the facilities that responded to the survey, had considered introducing EMS. Of the 857 facilities, 55% (459 facilities) had actually introduced EMS and 23% (195 facilities) were in the process of doing so. More than 75% of the facilities which have considered acquiring EMS have already done so or in the process of doing so. As for the adoption of EMS, especially recently, acquisition of certification by external organization has been growing in popularity. In Japan, acquisition of ISO14001 certification is the most prevalent. Of the sample collected in this survey, 463 facilities (34% of all samples) had acquired ISO14001 certification, accounting for 95% of the 486 facilities that introduced an EMS. Clearly, most facilities that have introduced EMS are ISO14001-certified. There were approximately 7,300 manufacturing facilities nationwide that have acquired ISO14001 certification as of June 2003 (Japanese Standards Association, http://www.jas.or.jp/). According to the Census of Manufacturers of 2000, there are approximately 48,000 facilities with more than 50 employees. If the acquisition of ISO 14001 were exclusively by facilities with more than 50 employees, only 15% have actually acquired ISO14001. The difference between the 32% acquisition of ISO 14001 in this survey and the 15% calculated above, can be considered to be due to the high response rate in this survey by firms with greater awareness of environmental conservation. In Japan, adoption of EMS other than ISO14001 have also been recorded. In this survey, four kinds of

23
certification: Responsible Care, KES, Eco Action 21, and EMAS (Eco-Management & Audit Scheme) were reported, with Responsible Care introduced in 7 facilities, 3 for KES, 1 for Eco Action 21, and 2 facilities for MAS. The number of adoptions of KES and Eco Action 21 is much smaller than that shown in section 4-1-1. This is due to the exclusion of firms with less than 50 employees, because both KES and EA21 are designed for small facilities. The average cost of certification and the certification maintenance fee were found to be 19.36 million yen and 6.6 million yen respectively for ISO 14001, 0.4 million yen and 0.3 million yen for KES, and 1.25 million yen and 1.05 million yen for EA21. Within the cost of certification, labor costs and the like were included for the preparation for the acquisition of certification. Therefore, these expenses depend upon the facilities’ attitudes towards certification, creating large diversions on certification expenses. As these figures shows, the cost of obtaining KES and EA21 is at a lower level than ISO 14001, making it easier for certification by small scale facilities. To check the validity of the sample from the survey, we examined EMS introduced by industry to ISO 14001. The distribution of ISO 14001 certification by industry is shown in Figure 4-2. Manufacturers of electrical machinery and apparatus have by far the largest number of certifications of ISO 14001 with 118 facilities. Manufacturers of fabricated metal products follow with 48 facilities and other transport equipment with 42 facilities. Compared with Figure 4-1, samples of this survey show a low degree of deviation from the standpoint of the number of acquisitions of ISO14001 certification by industry.

24
Figure 4-2 Number of facilities that have acquired ISO14001 certification
3
3
3
4
42
12
12
5
13
39
48
20
2
32
37
4
18
16
2
0
3
11
0
16
118
0 30 60 90 120
No Reply
Other
Recycling
Furniture
Other transport equipment
Motor vehicles, trailers and semi-trailers
Medical, precision and optical instruments,watches and clocks
Radio, television and communicationequipment
Electrical machinery and apparatus
Office, accounting and computingmachinery
Other machinery and equipment
Fabricated metal products, except machineryand equipment
Basic metals
Other non-metallic mineral products
Rubber and plastics products
Chemicals and chemical products
Coke, refined petroleum products andnuclear fuel
Publishing, printing and reproduction ofrecorded media
Paper and paper products
Wood and products of wood and cork,except furniture
Tanning and dressing of leather;manufacture of luggage, handbags,
Wearing apparel, dressing and dyeing of fur
Textiles
Tobacco products
Food products and beverages
Number of facilities

25
Management tools and environmental management systems
Here, we will discuss the degree of which the introduction of an EMS affects management tools when implementing environmental activities. As shown in Table 4-4, firms approximately 92% of the facilities that have an EMS have implemented a “quality management system”, while only 62% of those without an EMS have done so. However, in other cases (i.e. health and safety management systems, full-cost accounting) the implementation of an EMS is not associated with a higher propensity to introduced other management tools.
Table 4-4 Adoption of management systems by status of EMS implementation
EMS In Process No EMS
Quality management system(e.g.ISO 9000) 92 82 62
Health and safety management system 50 59 57
Full-cost or activity management system 5 7 2
Management accounting system 34 26 22
Process or job control system 15 11 5
Inventory or materials requirement planning 22 17 13
Table 4-5 analyzes how seriously environmental protection is regarded in facilities that responded affirmatively to the two questions, “quality management system” and “health and safety management system”. The combined ratio of “partially”, “considerably”, and “fully” indicates that more than half of the facilities shows the extent of environmental preservation effort when implementing “Quality management system” and “Health and safety management system”.
Table 4-5 Integration of environmental activities of facilities with management practices (in percentages)
Not at all Little Partially Fully Perfectly
Quality management system(e.g.ISO 9000) 10 17 33 27 13
Health and safety management system 16 20 36 24 4
Next, the relationship between management tools and the adoption of EMS is examined. As shown
in Table 4-5, more than 90% of firms that have introduced EMS have also introduced a quality management system. This suggests that quality management and EMS are complements. EMS is closely related to ISO9000, so the adoption of ISO9000 before hand possibly makes it easier to introduce ISO14001. This is consistent with the results of Nakamura et al. (2001). However, no distinctive relationship can be seen between other management tools and the adoption of EMS.
Table 4-6 Adoption of quality management system (by type of adoption of EMS in percentages)
Quality Management No Quality Management
EMS Implemented 93 7
In progress 84 16
No EMS 63 37
26
Adoption of Environmental Management System and environmental conservation practices
As described above, although more than half of the respondents prepared a “written environmental policy”, and selected “carry out internal environmental audits”, and “benchmark environmental performance”, the percentage of respondents that release “public environmental reports”, conduct “environmental accounting”, and have used “environmental criteria in the evaluation and/or compensation of employees” were low. The implementation of these conservation practices varies markedly by facility.
As shown in Table 4-7, the measures taken by facilities depend greatly upon whether they introduce EMS. Table 4-7 summarizes the implementation of environmental management tools at facilities in which EMS is introduced or not introduced, or whether adoption of EMS is in progress. As shown in this table, more facilities that have introduced EMS implement environmental management tools than those that have not. Therefore, facilities that have not adopted EMS take fewer environmental measures and have limited awareness of the issues involved.

27
Tab
le 4
-7 A
do
pti
on
of
EM
S a
nd
imp
lem
enta
tio
n o
f en
viro
nm
enta
l man
agem
ent
too
ls a
t fa
cilit
ies
Writ
ten
envi
ronm
enta
l pol
icy
Env
ironm
enta
l crit
eria
use
d in
the
eval
uatio
n an
d/or
co
mpe
nsat
ion
of e
mpl
oyee
s
Yes
N
o N
o R
eply
Yes
N
o N
o R
eply
EM
S
100
0 0
EM
S
29
69
2
In p
rogr
ess
62
36
2 In
pro
gres
s 12
84
4
No
EM
S
15
82
3 N
o E
MS
5
92
3
Env
ironm
enta
l tra
inin
g pr
ogra
m in
pla
ce
for
empl
oyee
s C
arry
out
inte
rnal
env
ironm
enta
l aud
its
Yes
N
o N
o R
eply
Yes
N
o N
o R
eply
EM
S
94
6 0
EM
S
98
1 0
In p
rogr
ess
37
60
3 In
pro
gres
s 38
59
3
No
EM
S
6 91
3
No
EM
S
18
79
3
Car
ry o
ut e
xter
nal
envi
ronm
enta
l aud
its
Ben
chm
ark
envi
ronm
enta
l per
form
ance
Yes
N
o N
o R
eply
Yes
N
o N
o R
eply
EM
S
84
16
1 E
MS
96
3
1
In p
rogr
ess
19
77
4 In
pro
gres
s 54
43
3
No
EM
S
10
87
3 N
o E
MS
24
73
3
Env
ironm
enta
l acc
ount
ing
Env
ironm
enta
l rep
ort
Y
es
No
No
Rep
ly
Y
es
No
No
Rep
ly
EM
S
28
70
2 E
MS
35
63
2
In p
rogr
ess
2 93
4
In p
rogr
ess
8 88
4
No
EM
S
1 95
4
No
EM
S
6 90
4
Env
ironm
enta
l per
form
ance
indi
cato
rs /
goal
s
Yes
N
o N
o R
eply
EM
S
60
38
2
In p
rogr
ess
22
74
4
No
EM
S
10
87
4
28
Facility characteristics and environmental management system
The adoption of EMS is affected by various kinds of characteristics of the facilities. We focus on six facility characteristics in order to analyze the extent to which different characteristics affect the adoption of EMS.
The first aspect is the facility size. Survey results shows that greater the size of the facility, the higher the percentage of EMS adoption. More specifically, the ratio of EMS adoption is 32% for facilities with fewer than 750 employees, although 100% for those with more than 2,000 employees. Due to the fixed cost of acquiring EMS, economies of scale possibly exists. This agrees with the conclusions of Welch et al. (2002)6.
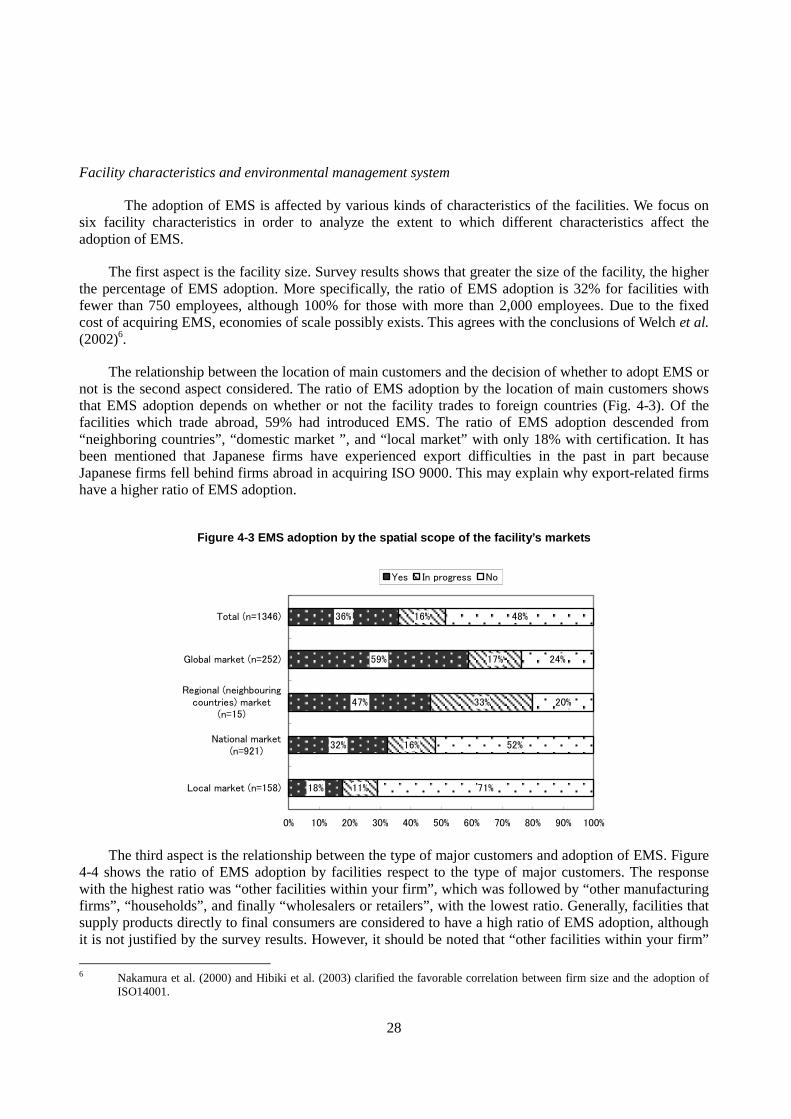
The relationship between the location of main customers and the decision of whether to adopt EMS or not is the second aspect considered. The ratio of EMS adoption by the location of main customers shows that EMS adoption depends on whether or not the facility trades to foreign countries (Fig. 4-3). Of the facilities which trade abroad, 59% had introduced EMS. The ratio of EMS adoption descended from “neighboring countries”, “domestic market ”, and “local market” with only 18% with certification. It has been mentioned that Japanese firms have experienced export difficulties in the past in part because Japanese firms fell behind firms abroad in acquiring ISO 9000. This may explain why export-related firms have a higher ratio of EMS adoption.
Figure 4-3 EMS adoption by the spatial scope of the facility’s markets
18%
32%
47%
59%
36%
11%
16%
33%
17%
16%
71%
52%
20%
24%
48%
0% 10% 20% 30% 40% 50% 60% 70% 80% 90% 100%
Local market (n=158)
National market(n=921)
Regional (neighbouringcountries) market
(n=15)
Global market (n=252)
Total (n=1346)
Yes In progress No
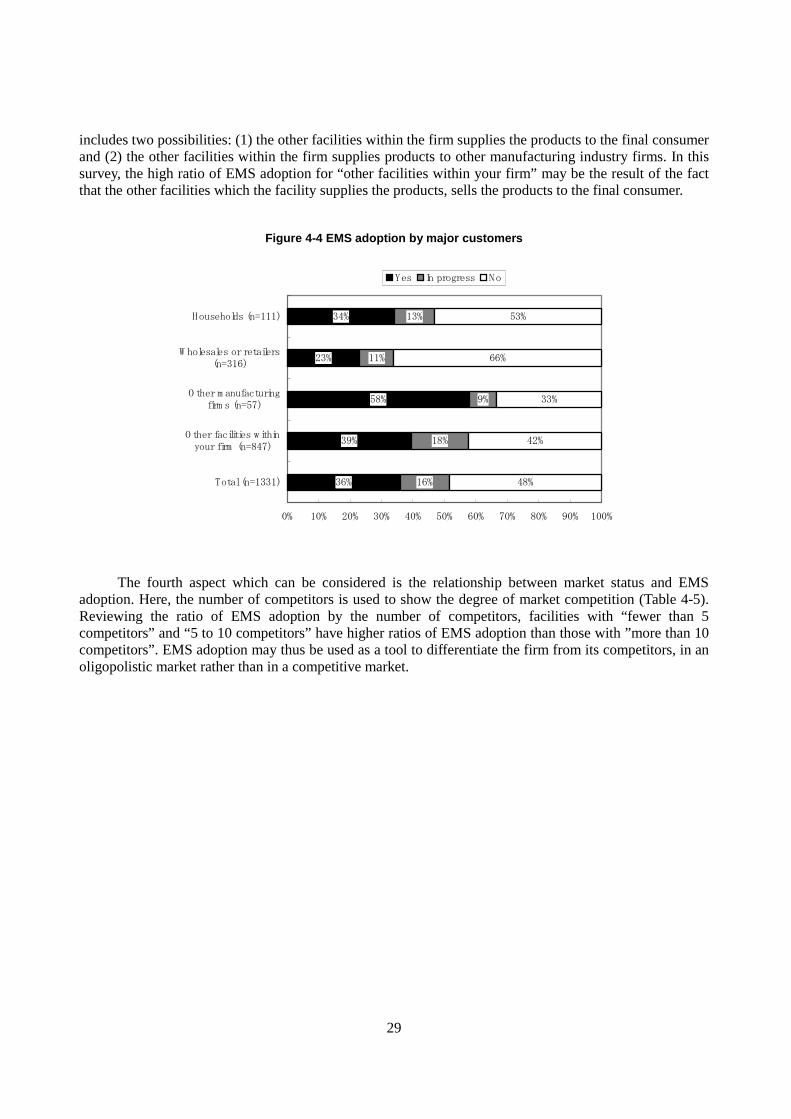
The third aspect is the relationship between the type of major customers and adoption of EMS. Figure
4-4 shows the ratio of EMS adoption by facilities respect to the type of major customers. The response with the highest ratio was “other facilities within your firm”, which was followed by “other manufacturing firms”, “households”, and finally “wholesalers or retailers”, with the lowest ratio. Generally, facilities that supply products directly to final consumers are considered to have a high ratio of EMS adoption, although it is not justified by the survey results. However, it should be noted that “other facilities within your firm”
6 Nakamura et al. (2000) and Hibiki et al. (2003) clarified the favorable correlation between firm size and the adoption of
ISO14001.
29
includes two possibilities: (1) the other facilities within the firm supplies the products to the final consumer and (2) the other facilities within the firm supplies products to other manufacturing industry firms. In this survey, the high ratio of EMS adoption for “other facilities within your firm” may be the result of the fact that the other facilities which the facility supplies the products, sells the products to the final consumer.
Figure 4-4 EMS adoption by major customers
36%
39%
58%
23%
34%
16%
18%
9%
11%
13%
48%
42%
33%
66%
53%
0% 10% 20% 30% 40% 50% 60% 70% 80% 90% 100%
Total (n=1331)
O ther facilities withinyour firm (n=847)
O ther m anufacturingfirm s (n=57)
W holesales or retailers(n=316)
Households (n=111)
Yes In progress No
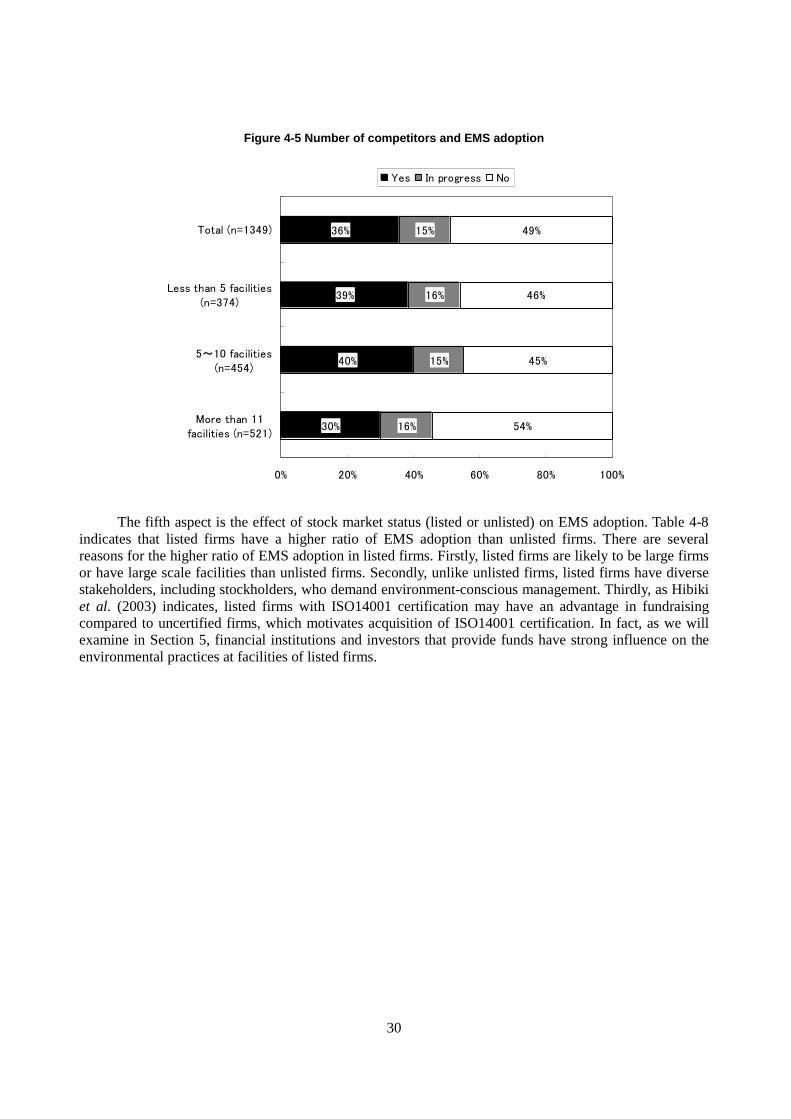
The fourth aspect which can be considered is the relationship between market status and EMS adoption. Here, the number of competitors is used to show the degree of market competition (Table 4-5). Reviewing the ratio of EMS adoption by the number of competitors, facilities with “fewer than 5 competitors” and “5 to 10 competitors” have higher ratios of EMS adoption than those with ”more than 10 competitors”. EMS adoption may thus be used as a tool to differentiate the firm from its competitors, in an oligopolistic market rather than in a competitive market.
30
Figure 4-5 Number of competitors and EMS adoption
30%
40%
39%
36%
16%
15%
16%
15%
54%
45%
46%
49%
0% 20% 40% 60% 80% 100%
More than 11facilities (n=521)
5~10 facilities(n=454)
Less than 5 facilities(n=374)
Total (n=1349)
Yes In progress No
The fifth aspect is the effect of stock market status (listed or unlisted) on EMS adoption. Table 4-8 indicates that listed firms have a higher ratio of EMS adoption than unlisted firms. There are several reasons for the higher ratio of EMS adoption in listed firms. Firstly, listed firms are likely to be large firms or have large scale facilities than unlisted firms. Secondly, unlike unlisted firms, listed firms have diverse stakeholders, including stockholders, who demand environment-conscious management. Thirdly, as Hibiki et al. (2003) indicates, listed firms with ISO14001 certification may have an advantage in fundraising compared to uncertified firms, which motivates acquisition of ISO14001 certification. In fact, as we will examine in Section 5, financial institutions and investors that provide funds have strong influence on the environmental practices at facilities of listed firms.
31
Table 4-8 EMS adoption by listed or unlisted status (No reply excluded)
EMS Implemented In progress No EMS Total
Listed 112 15 17 144
Unlisted 373 192 639 1,204
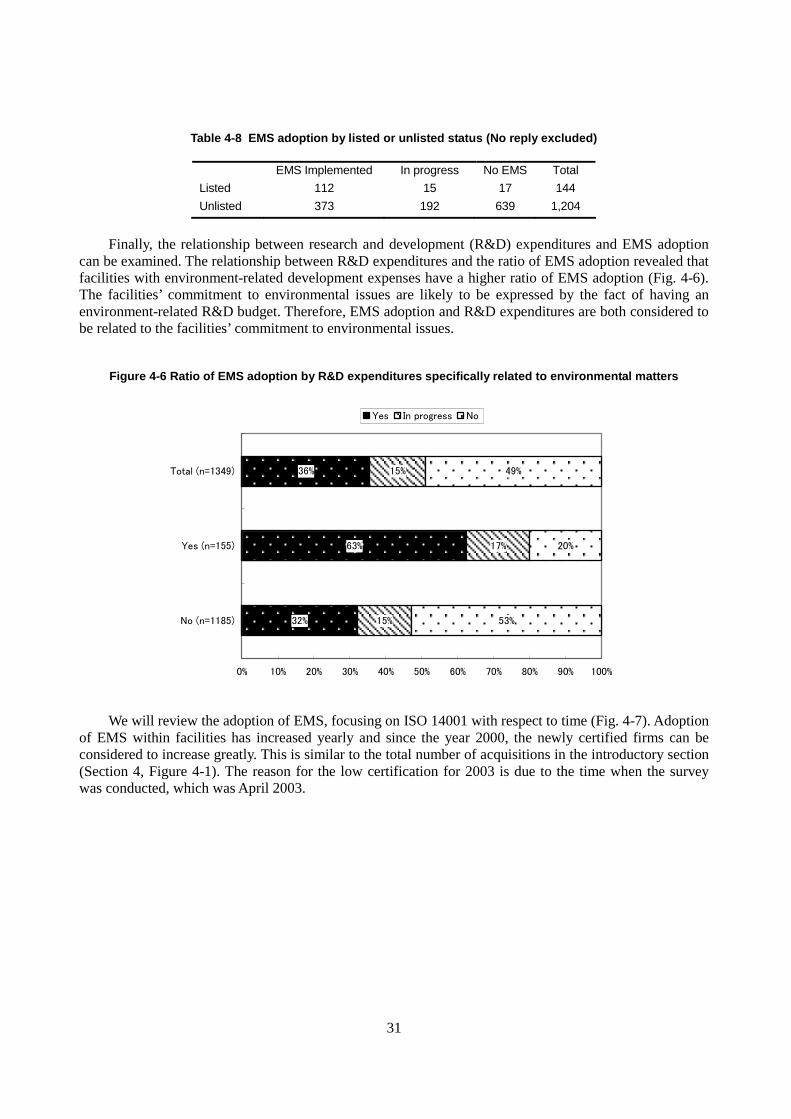
Finally, the relationship between research and development (R&D) expenditures and EMS adoption
can be examined. The relationship between R&D expenditures and the ratio of EMS adoption revealed that facilities with environment-related development expenses have a higher ratio of EMS adoption (Fig. 4-6). The facilities’ commitment to environmental issues are likely to be expressed by the fact of having an environment-related R&D budget. Therefore, EMS adoption and R&D expenditures are both considered to be related to the facilities’ commitment to environmental issues.
Figure 4-6 Ratio of EMS adoption by R&D expenditures specifically related to environmental matters
32%
63%
36%
15%
17%
15%
53%
20%
49%
0% 10% 20% 30% 40% 50% 60% 70% 80% 90% 100%
No (n=1185)
Yes (n=155)
Total (n=1349)
Yes In progress No
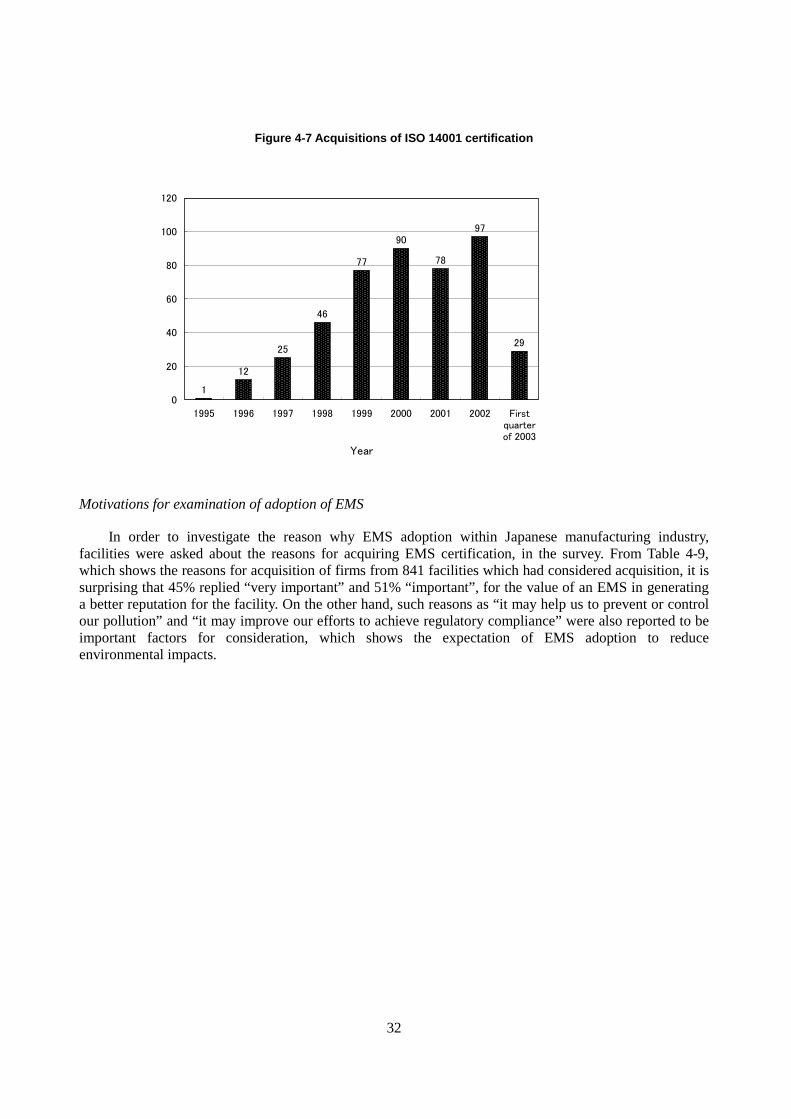
We will review the adoption of EMS, focusing on ISO 14001 with respect to time (Fig. 4-7). Adoption of EMS within facilities has increased yearly and since the year 2000, the newly certified firms can be considered to increase greatly. This is similar to the total number of acquisitions in the introductory section (Section 4, Figure 4-1). The reason for the low certification for 2003 is due to the time when the survey was conducted, which was April 2003.
32
Figure 4-7 Acquisitions of ISO 14001 certification
1
12
77
90
78
29
97
46
25
0
20
40
60
80
100
120
1995 1996 1997 1998 1999 2000 2001 2002 Firstquarterof 2003
Year
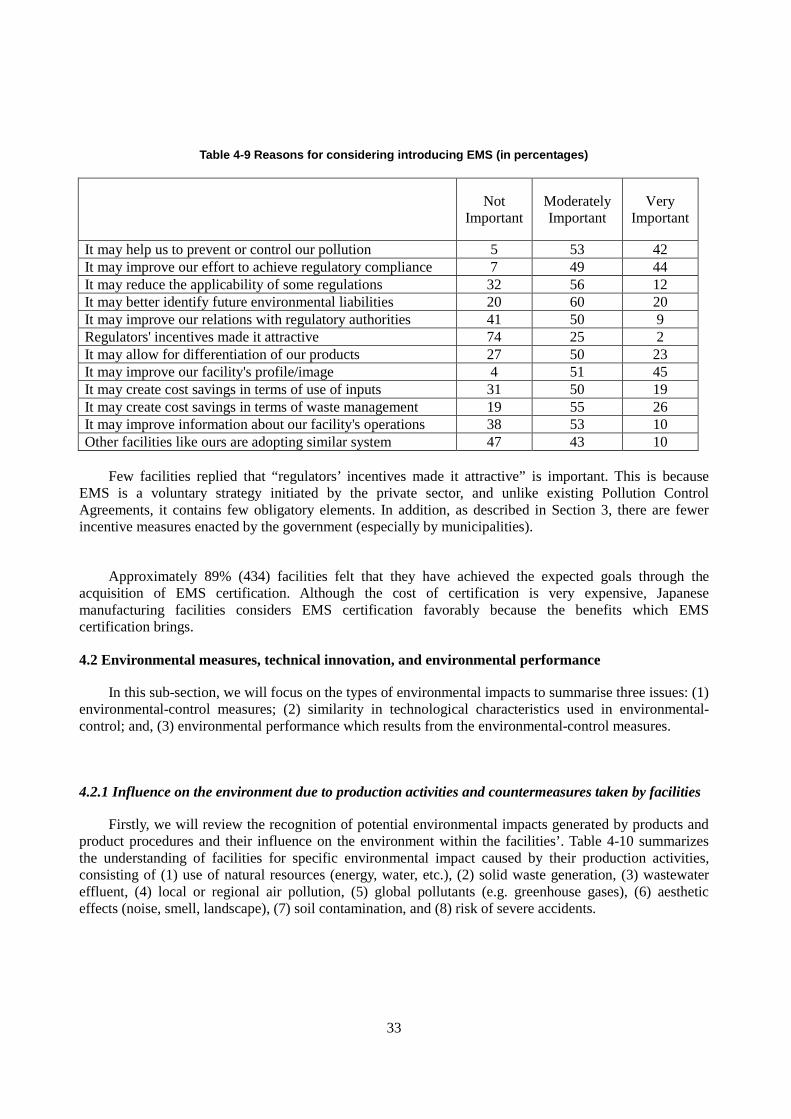
Motivations for examination of adoption of EMS
In order to investigate the reason why EMS adoption within Japanese manufacturing industry, facilities were asked about the reasons for acquiring EMS certification, in the survey. From Table 4-9, which shows the reasons for acquisition of firms from 841 facilities which had considered acquisition, it is surprising that 45% replied “very important” and 51% “important”, for the value of an EMS in generating a better reputation for the facility. On the other hand, such reasons as “it may help us to prevent or control our pollution” and “it may improve our efforts to achieve regulatory compliance” were also reported to be important factors for consideration, which shows the expectation of EMS adoption to reduce environmental impacts.
33
Table 4-9 Reasons for considering introducing EMS (in percentages)
Not Important
Moderately Important
Very Important
It may help us to prevent or control our pollution 5 53 42 It may improve our effort to achieve regulatory compliance 7 49 44 It may reduce the applicability of some regulations 32 56 12 It may better identify future environmental liabilities 20 60 20 It may improve our relations with regulatory authorities 41 50 9 Regulators' incentives made it attractive 74 25 2 It may allow for differentiation of our products 27 50 23 It may improve our facility's profile/image 4 51 45 It may create cost savings in terms of use of inputs 31 50 19 It may create cost savings in terms of waste management 19 55 26 It may improve information about our facility's operations 38 53 10 Other facilities like ours are adopting similar system 47 43 10
Few facilities replied that “regulators’ incentives made it attractive” is important. This is because
EMS is a voluntary strategy initiated by the private sector, and unlike existing Pollution Control Agreements, it contains few obligatory elements. In addition, as described in Section 3, there are fewer incentive measures enacted by the government (especially by municipalities).
Approximately 89% (434) facilities felt that they have achieved the expected goals through the
acquisition of EMS certification. Although the cost of certification is very expensive, Japanese manufacturing facilities considers EMS certification favorably because the benefits which EMS certification brings.
4.2 Environmental measures, technical innovation, and environmental performance
In this sub-section, we will focus on the types of environmental impacts to summarise three issues: (1) environmental-control measures; (2) similarity in technological characteristics used in environmental-control; and, (3) environmental performance which results from the environmental-control measures.
4.2.1 Influence on the environment due to production activities and countermeasures taken by facilities
Firstly, we will review the recognition of potential environmental impacts generated by products and product procedures and their influence on the environment within the facilities’. Table 4-10 summarizes the understanding of facilities for specific environmental impact caused by their production activities, consisting of (1) use of natural resources (energy, water, etc.), (2) solid waste generation, (3) wastewater effluent, (4) local or regional air pollution, (5) global pollutants (e.g. greenhouse gases), (6) aesthetic effects (noise, smell, landscape), (7) soil contamination, and (8) risk of severe accidents.
34
Table 4.10 Potential negative environmental impacts from your facility (in percentages)
No Negative Impacts
Moderately Negative Impacts
Very Negative Impacts
Not Applicable
Use of natural resources(energy, water, etc) 25 46 22 7
Solid waste generation 22 51 21 6
Wastewater effluent 37 34 17 12
Local or regional air pollution 39 36 10 16
Global pollutants(e.g. greenhouse gases) 39 36 8 16
Aesthetic effects(noise, smell, landscape) 44 39 7 11
Risk of severe accidents 54 21 4 21
Other negative environmental impact 48 25 9 19
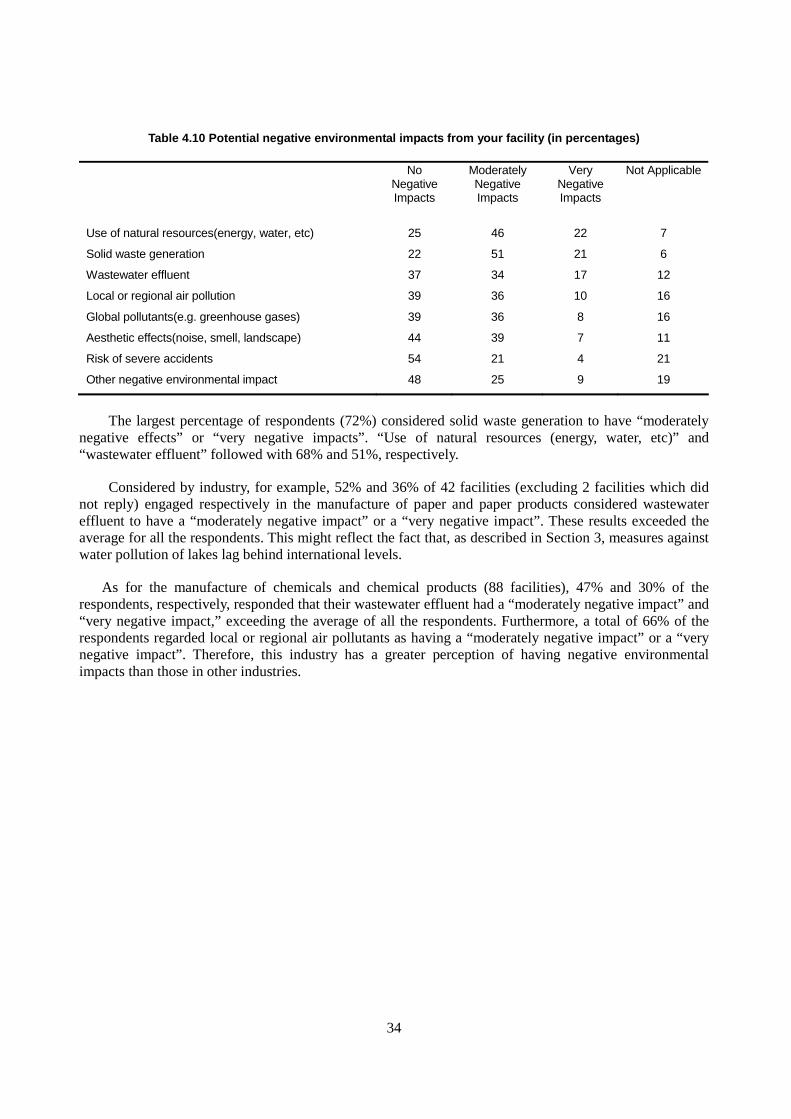
The largest percentage of respondents (72%) considered solid waste generation to have “moderately
negative effects” or “very negative impacts”. “Use of natural resources (energy, water, etc)” and “wastewater effluent” followed with 68% and 51%, respectively.
Considered by industry, for example, 52% and 36% of 42 facilities (excluding 2 facilities which did not reply) engaged respectively in the manufacture of paper and paper products considered wastewater effluent to have a “moderately negative impact” or a “very negative impact”. These results exceeded the average for all the respondents. This might reflect the fact that, as described in Section 3, measures against water pollution of lakes lag behind international levels.
As for the manufacture of chemicals and chemical products (88 facilities), 47% and 30% of the respondents, respectively, responded that their wastewater effluent had a “moderately negative impact” and “very negative impact,” exceeding the average of all the respondents. Furthermore, a total of 66% of the respondents regarded local or regional air pollutants as having a “moderately negative impact” or a “very negative impact”. Therefore, this industry has a greater perception of having negative environmental impacts than those in other industries.
35
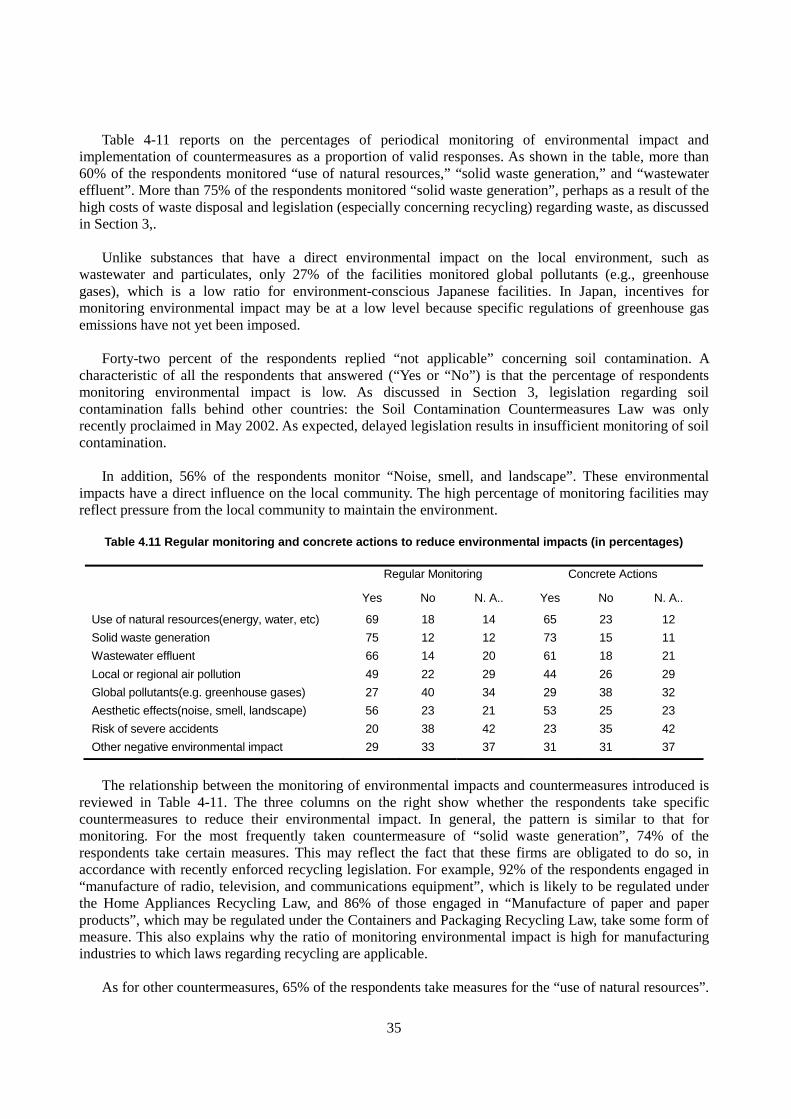
Table 4-11 reports on the percentages of periodical monitoring of environmental impact and implementation of countermeasures as a proportion of valid responses. As shown in the table, more than 60% of the respondents monitored “use of natural resources,” “solid waste generation,” and “wastewater effluent”. More than 75% of the respondents monitored “solid waste generation”, perhaps as a result of the high costs of waste disposal and legislation (especially concerning recycling) regarding waste, as discussed in Section 3,. Unlike substances that have a direct environmental impact on the local environment, such as wastewater and particulates, only 27% of the facilities monitored global pollutants (e.g., greenhouse gases), which is a low ratio for environment-conscious Japanese facilities. In Japan, incentives for monitoring environmental impact may be at a low level because specific regulations of greenhouse gas emissions have not yet been imposed. Forty-two percent of the respondents replied “not applicable” concerning soil contamination. A characteristic of all the respondents that answered (“Yes or “No”) is that the percentage of respondents monitoring environmental impact is low. As discussed in Section 3, legislation regarding soil contamination falls behind other countries: the Soil Contamination Countermeasures Law was only recently proclaimed in May 2002. As expected, delayed legislation results in insufficient monitoring of soil contamination. In addition, 56% of the respondents monitor “Noise, smell, and landscape”. These environmental impacts have a direct influence on the local community. The high percentage of monitoring facilities may reflect pressure from the local community to maintain the environment.
Table 4.11 Regular monitoring and concrete actions to reduce environmental impacts (in percentages)
Regular Monitoring Concrete Actions
Yes No N. A.. Yes No N. A..
Use of natural resources(energy, water, etc) 69 18 14 65 23 12
Solid waste generation 75 12 12 73 15 11
Wastewater effluent 66 14 20 61 18 21
Local or regional air pollution 49 22 29 44 26 29
Global pollutants(e.g. greenhouse gases) 27 40 34 29 38 32
Aesthetic effects(noise, smell, landscape) 56 23 21 53 25 23
Risk of severe accidents 20 38 42 23 35 42
Other negative environmental impact 29 33 37 31 31 37
The relationship between the monitoring of environmental impacts and countermeasures introduced is reviewed in Table 4-11. The three columns on the right show whether the respondents take specific countermeasures to reduce their environmental impact. In general, the pattern is similar to that for monitoring. For the most frequently taken countermeasure of “solid waste generation”, 74% of the respondents take certain measures. This may reflect the fact that these firms are obligated to do so, in accordance with recently enforced recycling legislation. For example, 92% of the respondents engaged in “manufacture of radio, television, and communications equipment”, which is likely to be regulated under the Home Appliances Recycling Law, and 86% of those engaged in “Manufacture of paper and paper products”, which may be regulated under the Containers and Packaging Recycling Law, take some form of measure. This also explains why the ratio of monitoring environmental impact is high for manufacturing industries to which laws regarding recycling are applicable. As for other countermeasures, 65% of the respondents take measures for the “use of natural resources”.
36
Energy conservation has been considered to have assisted in overcoming the two oil shocks in Japan. The results of this survey may reflect in part the fact that firms have a history of being highly aware of the need to conserve energy. On the other hand, only 23% of the respondents take measures against soil contamination. This result is still low when it is taken into consideration that 42% of the respondents answered “not applicable”. Similar to the results for monitoring impact, this is due to the late introduction of legislation regarding soil contamination up until the Soil Contamination Countermeasures Law was enforced. Fewer measures are taken for “global pollutants (e.g., greenhouse gases)” and “risk of severe accidents”. However, more than 60% of the respondents take measures concerning the “use of natural resources (energy, water, etc.)”, many of which may be considered to contribute to energy conservation. Therefore, manufacturers in Japan do in fact take certain measures against global warming, due to the high rate of energy conservation.
4.2.2 Measures adopted by the facility
In this section we will overview the actual measures that the facilities take to reduce environmental impacts.
Changes in production processes or end-of-pipe technologies?
Environmental measures can be broadly divided into “changes in production processes which reduce pollution emissions and/or resource use” (hereinafter referred to as “changes in production processes”) and “end-of-pipe technologies which reduce pollution emissions or allow for resource recovery” (hereinafter referred to as “end-of-pipe technologies”), and discuss what type of technological measures are taken by these facilities. Of valid responses, 87% implemented “changes in production processes,” while 14% adopted “end-of-pipe technologies,” indicating that the former is overwhelmingly the more common choice. Next, the sample is classified by firm size (number of employees). Figure 4-8 shows the percentage of measures per size of facility. More facilities with over 1000 employees adopted “end-of-pipe technologies” than those with fewer employees. Since the introduction of “end-of-pipe technologies” has expensive initial costs, larger scale facilities may be more likely to adopt end-of-pipe technologies. However, this tendency is not a general trend when observing facilities that are smaller than 1000 employees.
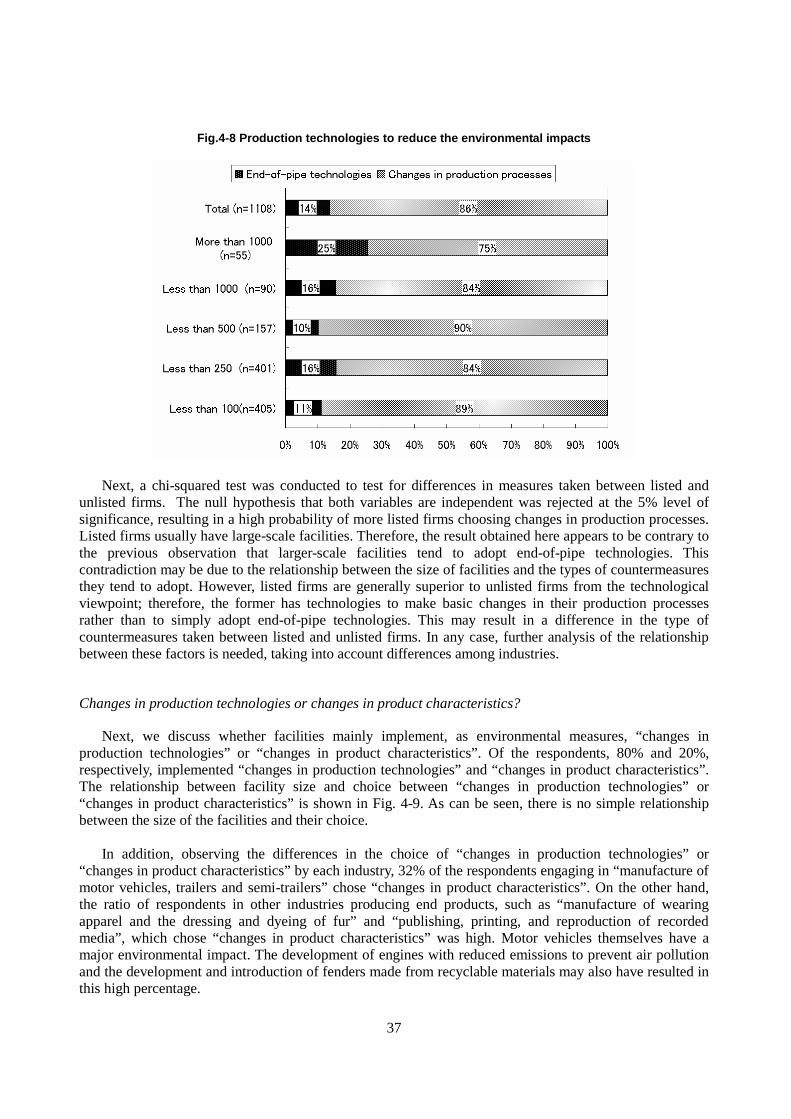
37
Fig.4-8 Production technologies to reduce the environmental impacts
Next, a chi-squared test was conducted to test for differences in measures taken between listed and unlisted firms. The null hypothesis that both variables are independent was rejected at the 5% level of significance, resulting in a high probability of more listed firms choosing changes in production processes. Listed firms usually have large-scale facilities. Therefore, the result obtained here appears to be contrary to the previous observation that larger-scale facilities tend to adopt end-of-pipe technologies. This contradiction may be due to the relationship between the size of facilities and the types of countermeasures they tend to adopt. However, listed firms are generally superior to unlisted firms from the technological viewpoint; therefore, the former has technologies to make basic changes in their production processes rather than to simply adopt end-of-pipe technologies. This may result in a difference in the type of countermeasures taken between listed and unlisted firms. In any case, further analysis of the relationship between these factors is needed, taking into account differences among industries.
Changes in production technologies or changes in product characteristics?
Next, we discuss whether facilities mainly implement, as environmental measures, “changes in production technologies” or “changes in product characteristics”. Of the respondents, 80% and 20%, respectively, implemented “changes in production technologies” and “changes in product characteristics”. The relationship between facility size and choice between “changes in production technologies” or “changes in product characteristics” is shown in Fig. 4-9. As can be seen, there is no simple relationship between the size of the facilities and their choice. In addition, observing the differences in the choice of “changes in production technologies” or “changes in product characteristics” by each industry, 32% of the respondents engaging in “manufacture of motor vehicles, trailers and semi-trailers” chose “changes in product characteristics”. On the other hand, the ratio of respondents in other industries producing end products, such as “manufacture of wearing apparel and the dressing and dyeing of fur” and “publishing, printing, and reproduction of recorded media”, which chose “changes in product characteristics” was high. Motor vehicles themselves have a major environmental impact. The development of engines with reduced emissions to prevent air pollution and the development and introduction of fenders made from recyclable materials may also have resulted in this high percentage.
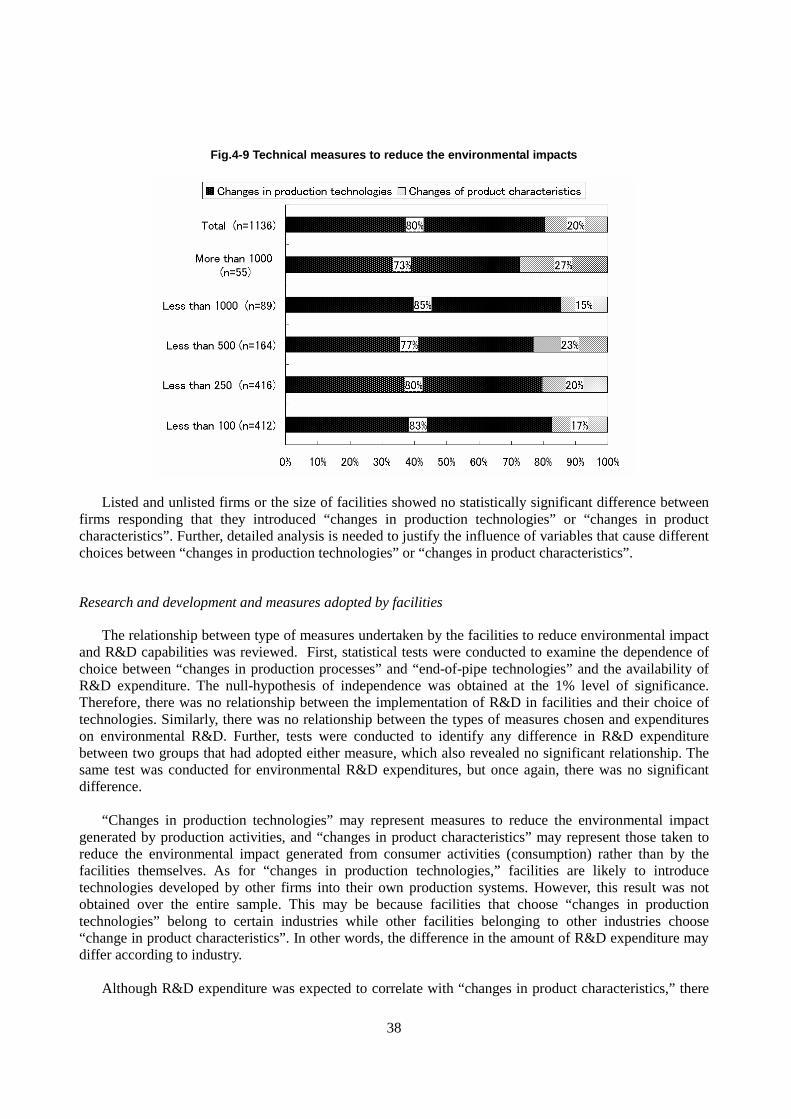
38
Fig.4-9 Technical measures to reduce the environmental impacts
Listed and unlisted firms or the size of facilities showed no statistically significant difference between firms responding that they introduced “changes in production technologies” or “changes in product characteristics”. Further, detailed analysis is needed to justify the influence of variables that cause different choices between “changes in production technologies” or “changes in product characteristics”.
Research and development and measures adopted by facilities
The relationship between type of measures undertaken by the facilities to reduce environmental impact and R&D capabilities was reviewed. First, statistical tests were conducted to examine the dependence of choice between “changes in production processes” and “end-of-pipe technologies” and the availability of R&D expenditure. The null-hypothesis of independence was obtained at the 1% level of significance. Therefore, there was no relationship between the implementation of R&D in facilities and their choice of technologies. Similarly, there was no relationship between the types of measures chosen and expenditures on environmental R&D. Further, tests were conducted to identify any difference in R&D expenditure between two groups that had adopted either measure, which also revealed no significant relationship. The same test was conducted for environmental R&D expenditures, but once again, there was no significant difference. “Changes in production technologies” may represent measures to reduce the environmental impact generated by production activities, and “changes in product characteristics” may represent those taken to reduce the environmental impact generated from consumer activities (consumption) rather than by the facilities themselves. As for “changes in production technologies,” facilities are likely to introduce technologies developed by other firms into their own production systems. However, this result was not obtained over the entire sample. This may be because facilities that choose “changes in production technologies” belong to certain industries while other facilities belonging to other industries choose “change in product characteristics”. In other words, the difference in the amount of R&D expenditure may differ according to industry. Although R&D expenditure was expected to correlate with “changes in product characteristics,” there

39
was no such relationship seen in the whole sample. Further analysis will be needed, including analyses by industry. A test was conducted to see if there was a differences in the amount of R&D expenditure between both groups. The test revealed that the amount of R&D expenditure of those firms that chose “changes in production technologies” was greater than firms choosing “changes in product characteristics” at the 10% level of significance, possibly suggesting that more R&D expenditure is needed for changing production technologies. The relationship between R&D and technical countermeasures is clearly complex. In addition to examining the relationship between two variables, a detailed model analysis is needed.
Environmental performance in facilities
Now we will discuss whether environmental management and technical environmental measures taken by facilities actually reduces environmental impact. Table 4-12 summaries changes in the degree of environmental impact per unit of production over the past three years. For all types of impact, more respondents replied “decrease (including “significant decrease”)” rather than “increase (including “significant increase”)”, indicating that environmental impact per unit of production has been reduced. In particular, the result for solid waste generation shows a dramatic decrease. Almost 50% of the respondents answered that environmental impact per unit of production had been reduced significantly. This may be because of legislation regarding recycling and resource conservation, as presented in Section 3. On the other hand, only 20% of the respondents answered “decreased” (including “significantly decreased”) for soil contamination and global pollutants, which may be due to the late introduction of regulations and legislation.
Table 4.12 Change in the environmental impacts per unit of output in the last three years (in percentages)
Significant Decrease
Decrease No Change
Increase Increase
Significant Increase
Not Applicable
Use of natural resources (energy, water, etc) 4 41 37 7 0 11 Solid waste generation 8 43 32 7 0 11 Wastewater effluent 3 25 48 4 - 20 Local or regional air pollution 4 23 42 1 0 30 Global pollutants (e.g. greenhouse gases) 3 20 41 3 - 34 Aesthetic effects (noise, smell, landscape) 2 22 51 1 - 23 Risk of severe accidents 2 8 43 0 - 47 Other negative environmental impact 3 17 40 0 - 39
The extent to which the adoption of environmental management system has contributed to the reduction of environmental impacts is now reviewed. The respondents were divided into three categories: those who had introduced EMS, those who had not introduced EMS, and those in the process of implementing one. Changes in environmental impact per unit of production during the past three years were examined for each category. Table 4-13 shows changes in waste generation by the categorization above, and Table 4-14 shows changes in the use of natural resources per unit of production in the same manner. From Table 4-13, facilities that have adopted EMS, shows a dramatic reduction of waste. Likewise, Table 4-14 shows that facilities that have adopted EMS, show reductions of use of natural resources. As shown in the two tables, the ratio of facilities with EMS certification, which considered almost all types of environmental impact to have “Decreased” and “Significantly decreased” were high. Therefore, adoption of EMS appears be positively correlated with reduction of environmental impact.

40
Table 4.13 EMS and change in solid waste generation per unit of output in the last three years (in %)
Significant Decrease
Decrease No Change
Increase Increase
Significant Increase
N. A.
EMS 17 59 17 5 - 2
In progress 4 39 37 13 - 7
No EMS 2 32 41 6 0 19
Table 4.14 EMS and change in the use of natural resource per unit of output in the last three years (in %)
Significant Decrease
Decrease No Change
Increase Increase
Significant Increase
N. A.
EMS 8 64 19 8 0 1
In progress 1 40 45 8 - 6
No EMS 1 24 47 6 - 20
However, caution is needed when interpreting the reduction of environmental impact due to the introduction of an EMS. Reduction of environmental impact may not have been reduced by the adoption of EMS, but rather, facilities that are conscious of reducing environmental impact are more likely to adopt EMS. Further detailed model analysis will also be needed to investigate the effects of adoption of EMS.

41
5. INFLUENCE OF STAKEHOLDERS ON AND MOTIVATION FOR IMPLEMENTING ENVIRONMENTAL PRACTICES
The adoption of environmental practices in facilities is influenced by various stakeholders. In this section, we will overview the influence of stakeholders on environmental practices performed by the facilities.
5.1 Environmental practices by facilities and the influence of stakeholders
In Table 5-1, the level of influence different groups and organizations have on facilities in environmental issues is shown. From the table, public authorities have the greatest influence with 53% of the respondents replying that the public authorities have an “important” influence and 28% replying a “very important” influence, indicating that more than 80% of facilities felt influenced by the public authorities. Having an equally large influence, “commercial buyers” had 34% of the respondents replying “Very important”, exceeds that of public authorities. Ordinary business partners may thus urge facilities to implement environmental practices. Demands for adoption of environmental practices within firms also have a major influence. More than 60% of the respondents were aware of demands being made by management and non-management employees. Therefore, firms are influenced by their internal stakeholders as well as outside stakeholders. This means that not only environmental policy instruments but also these stakeholders give an incentive for facilities to voluntarily implement environmental practices.
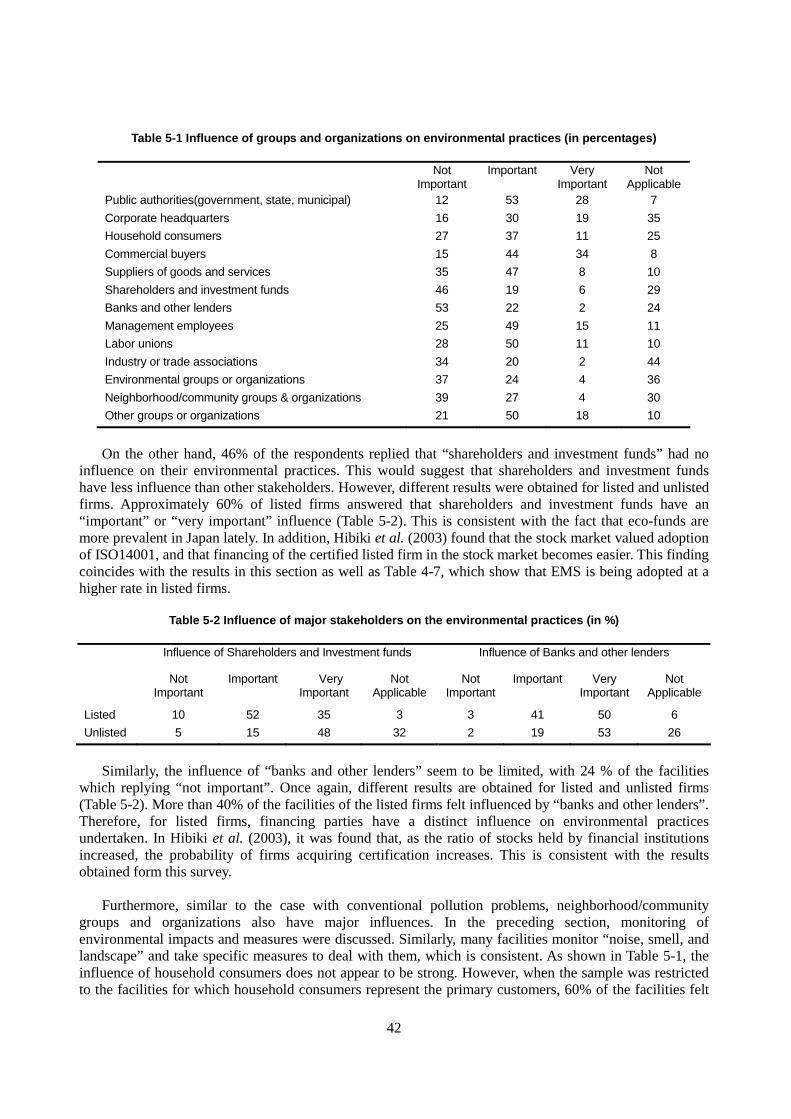
42
Table 5-1 Influence of groups and organizations on environmental practices (in percentages)
Not Important
Important Very Important
Not Applicable
Public authorities(government, state, municipal) 12 53 28 7
Corporate headquarters 16 30 19 35
Household consumers 27 37 11 25
Commercial buyers 15 44 34 8
Suppliers of goods and services 35 47 8 10
Shareholders and investment funds 46 19 6 29
Banks and other lenders 53 22 2 24
Management employees 25 49 15 11
Labor unions 28 50 11 10
Industry or trade associations 34 20 2 44
Environmental groups or organizations 37 24 4 36
Neighborhood/community groups & organizations 39 27 4 30
Other groups or organizations 21 50 18 10
On the other hand, 46% of the respondents replied that “shareholders and investment funds” had no influence on their environmental practices. This would suggest that shareholders and investment funds have less influence than other stakeholders. However, different results were obtained for listed and unlisted firms. Approximately 60% of listed firms answered that shareholders and investment funds have an “important” or “very important” influence (Table 5-2). This is consistent with the fact that eco-funds are more prevalent in Japan lately. In addition, Hibiki et al. (2003) found that the stock market valued adoption of ISO14001, and that financing of the certified listed firm in the stock market becomes easier. This finding coincides with the results in this section as well as Table 4-7, which show that EMS is being adopted at a higher rate in listed firms.
Table 5-2 Influence of major stakeholders on the environmental practices (in %)
Influence of Shareholders and Investment funds Influence of Banks and other lenders
Not Important
Important Very Important
Not Applicable
Not Important
Important Very Important
Not Applicable
Listed 10 52 35 3 3 41 50 6
Unlisted 5 15 48 32 2 19 53 26
Similarly, the influence of “banks and other lenders” seem to be limited, with 24 % of the facilities which replying “not important”. Once again, different results are obtained for listed and unlisted firms (Table 5-2). More than 40% of the facilities of the listed firms felt influenced by “banks and other lenders”. Therefore, for listed firms, financing parties have a distinct influence on environmental practices undertaken. In Hibiki et al. (2003), it was found that, as the ratio of stocks held by financial institutions increased, the probability of firms acquiring certification increases. This is consistent with the results obtained form this survey. Furthermore, similar to the case with conventional pollution problems, neighborhood/community groups and organizations also have major influences. In the preceding section, monitoring of environmental impacts and measures were discussed. Similarly, many facilities monitor “noise, smell, and landscape” and take specific measures to deal with them, which is consistent. As shown in Table 5-1, the influence of household consumers does not appear to be strong. However, when the sample was restricted to the facilities for which household consumers represent the primary customers, 60% of the facilities felt
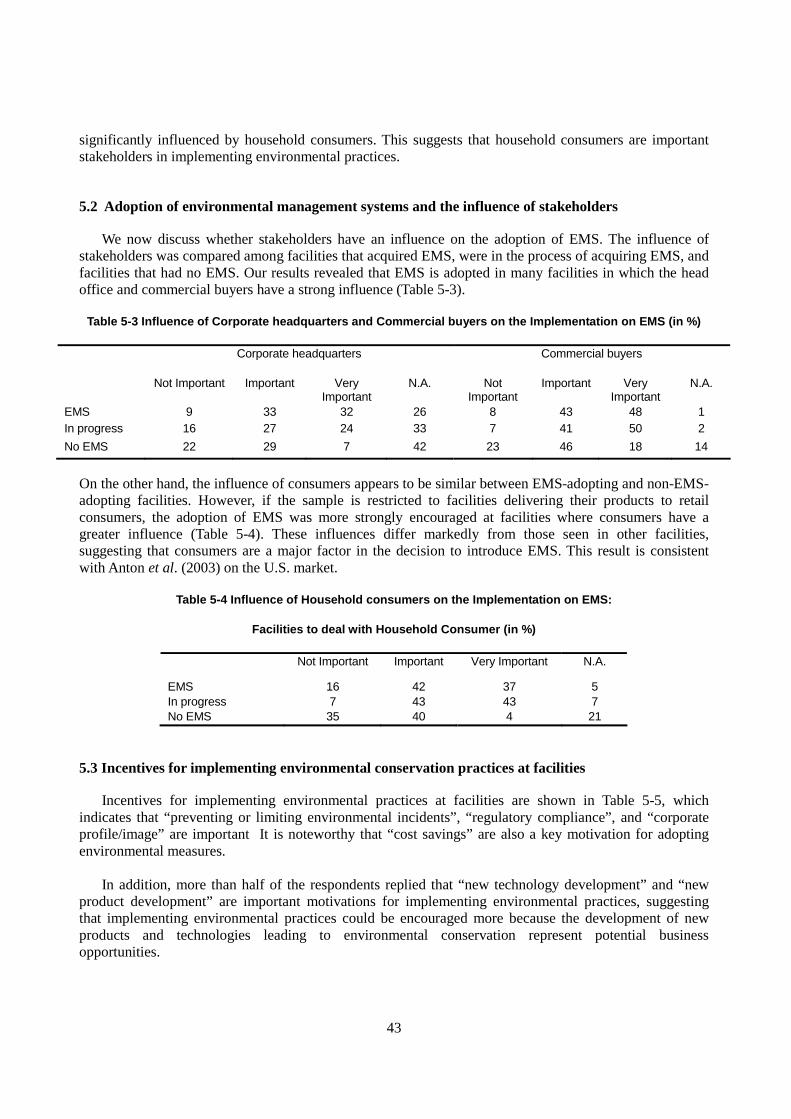
43
significantly influenced by household consumers. This suggests that household consumers are important stakeholders in implementing environmental practices.
5.2 Adoption of environmental management systems and the influence of stakeholders
We now discuss whether stakeholders have an influence on the adoption of EMS. The influence of stakeholders was compared among facilities that acquired EMS, were in the process of acquiring EMS, and facilities that had no EMS. Our results revealed that EMS is adopted in many facilities in which the head office and commercial buyers have a strong influence (Table 5-3).
Table 5-3 Influence of Corporate headquarters and Commercial buyers on the Implementation on EMS (in %)
Corporate headquarters Commercial buyers
Not Important Important Very Important
N.A. Not Important
Important Very Important
N.A.
EMS 9 33 32 26 8 43 48 1 In progress 16 27 24 33 7 41 50 2
No EMS 22 29 7 42 23 46 18 14
On the other hand, the influence of consumers appears to be similar between EMS-adopting and non-EMS-adopting facilities. However, if the sample is restricted to facilities delivering their products to retail consumers, the adoption of EMS was more strongly encouraged at facilities where consumers have a greater influence (Table 5-4). These influences differ markedly from those seen in other facilities, suggesting that consumers are a major factor in the decision to introduce EMS. This result is consistent with Anton et al. (2003) on the U.S. market.
Table 5-4 Influence of Household consumers on the Implementation on EMS:
Facilities to deal with Household Consumer (in %)
Not Important Important Very Important N.A.
EMS 16 42 37 5 In progress 7 43 43 7 No EMS 35 40 4 21
5.3 Incentives for implementing environmental conservation practices at facilities
Incentives for implementing environmental practices at facilities are shown in Table 5-5, which indicates that “preventing or limiting environmental incidents”, “regulatory compliance”, and “corporate profile/image” are important It is noteworthy that “cost savings” are also a key motivation for adopting environmental measures. In addition, more than half of the respondents replied that “new technology development” and “new product development” are important motivations for implementing environmental practices, suggesting that implementing environmental practices could be encouraged more because the development of new products and technologies leading to environmental conservation represent potential business opportunities.

44
Table 5-5 Motivations with respect to the environmental practices (in percentages)
Not Important Moderately Important Very Important N. A.
Prevent or control environmental incidents 2 42 50 6
Regulatory compliance 2 43 51 4
Corporate profile/image 3 52 41 4
Cost savings 5 53 37 5
New technology development 11 52 26 11
New product development 11 46 25 18
How environmental measures implemented by the facilities differ due to different motivations for implementing environmental conservation causes are now discussed. We analyzed the relationship between motivation for and choice of changes in production processes which reduce pollution emissions and/or resource use (hereinafter referred to as “changes in production processes”) or end-of-pipe technologies which reduce pollution emissions or allow for resource recovery (hereinafter referred to as “end-of-pipe technologies”) (Table 5-9). It is found that facilities which regard “preventing or controlling environmental incidents” and “regulatory compliance” as important are more likely to choose end-of-pipe technologies, suggesting that use of end-of-pipe technologies can assist with achieving regulatory compliance.
Table 5-6 Motivation and The Choice of Technology (in percentages)
Changes in production processes End-of-pipe technologies Total Not Important 95 5 100 Moderately Important
87 13 100 Prevent or control
environmental incidents
Very Important
85 15 100
Not Important 94 6 100 Moderately Important
89 11 100 Regulatory compliance
Very Important
84 16 100
As for the relationship between the motivation to cut costs and the choice of technologies, we could not find a tendency for changes in production processes, including an investment in energy conservation which helps to save the cost of raw materials and fuel to be chosen in preference to end-of-pipe technologies, even if they have a strong motivation for reducing costs. There may be several reasons for this, including 1) a potentially wide range of technologies within “changes in production processes” and 2) the potential for saving costs by introducing end-of-pipe technologies in facilities that can reduce levies on emissions or effluent by decreasing their environmental impact. Finally, motivations for the uptake of new technologies and products, and the relationship between these motives and measures to reduce environmental impact were analyzed. There was no correlation between the two types of motives and motivations in technology and methods in reduction of environmental impact, and motivations in technology as a whole. The motivation for new technology or new products can be considered to have a fundamental relationship with R&D. Therefore, the sample was restricted to facilities with R&D budgets to examine the relationship between the type of methods in reduction of environmental impact and the motives for developing new technologies or new products. Once again there was no correlation. However, concerning the relationship between recognition of the importance of new technology development as a motive for implementing environmental practices and changes in production technologies and product characteristics,
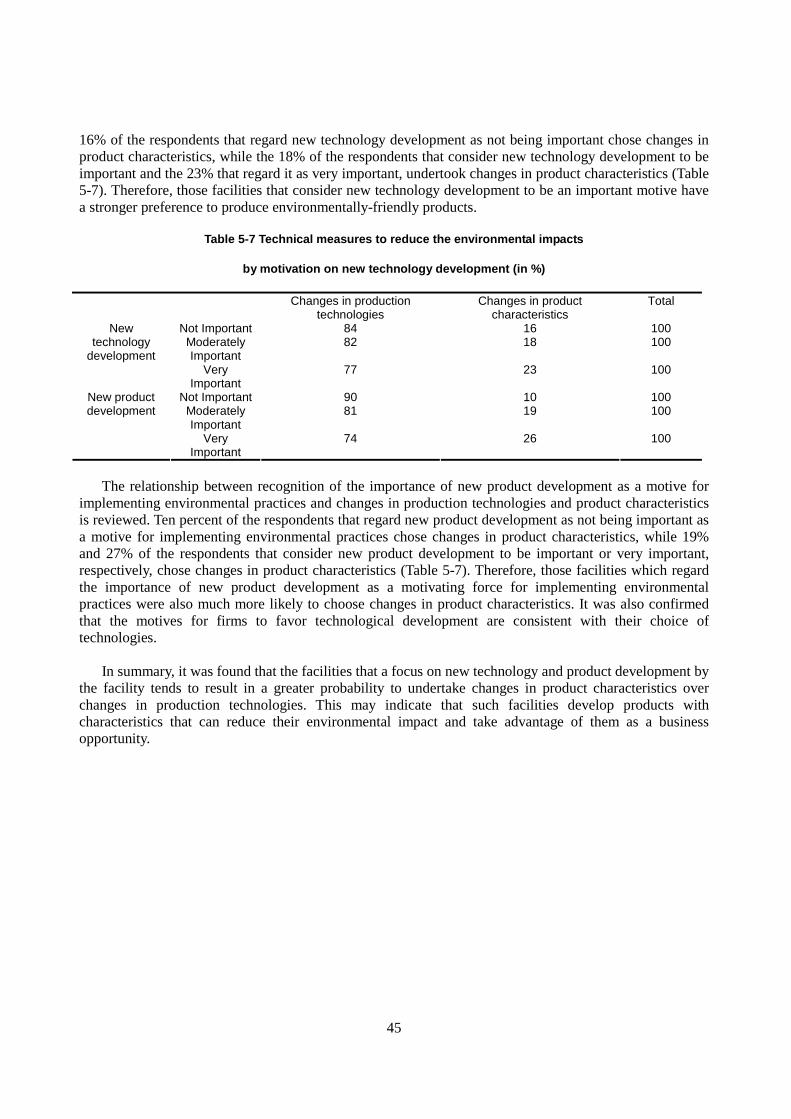
45
16% of the respondents that regard new technology development as not being important chose changes in product characteristics, while the 18% of the respondents that consider new technology development to be important and the 23% that regard it as very important, undertook changes in product characteristics (Table 5-7). Therefore, those facilities that consider new technology development to be an important motive have a stronger preference to produce environmentally-friendly products.
Table 5-7 Technical measures to reduce the environmental impacts
by motivation on new technology development (in %)
Changes in production technologies
Changes in product characteristics
Total
Not Important 84 16 100 Moderately Important
82 18 100 New
technology development
Very Important
77 23 100
Not Important 90 10 100 Moderately Important
81 19 100 New product development
Very Important
74 26 100
The relationship between recognition of the importance of new product development as a motive for implementing environmental practices and changes in production technologies and product characteristics is reviewed. Ten percent of the respondents that regard new product development as not being important as a motive for implementing environmental practices chose changes in product characteristics, while 19% and 27% of the respondents that consider new product development to be important or very important, respectively, chose changes in product characteristics (Table 5-7). Therefore, those facilities which regard the importance of new product development as a motivating force for implementing environmental practices were also much more likely to choose changes in product characteristics. It was also confirmed that the motives for firms to favor technological development are consistent with their choice of technologies. In summary, it was found that the facilities that a focus on new technology and product development by the facility tends to result in a greater probability to undertake changes in product characteristics over changes in production technologies. This may indicate that such facilities develop products with characteristics that can reduce their environmental impact and take advantage of them as a business opportunity.
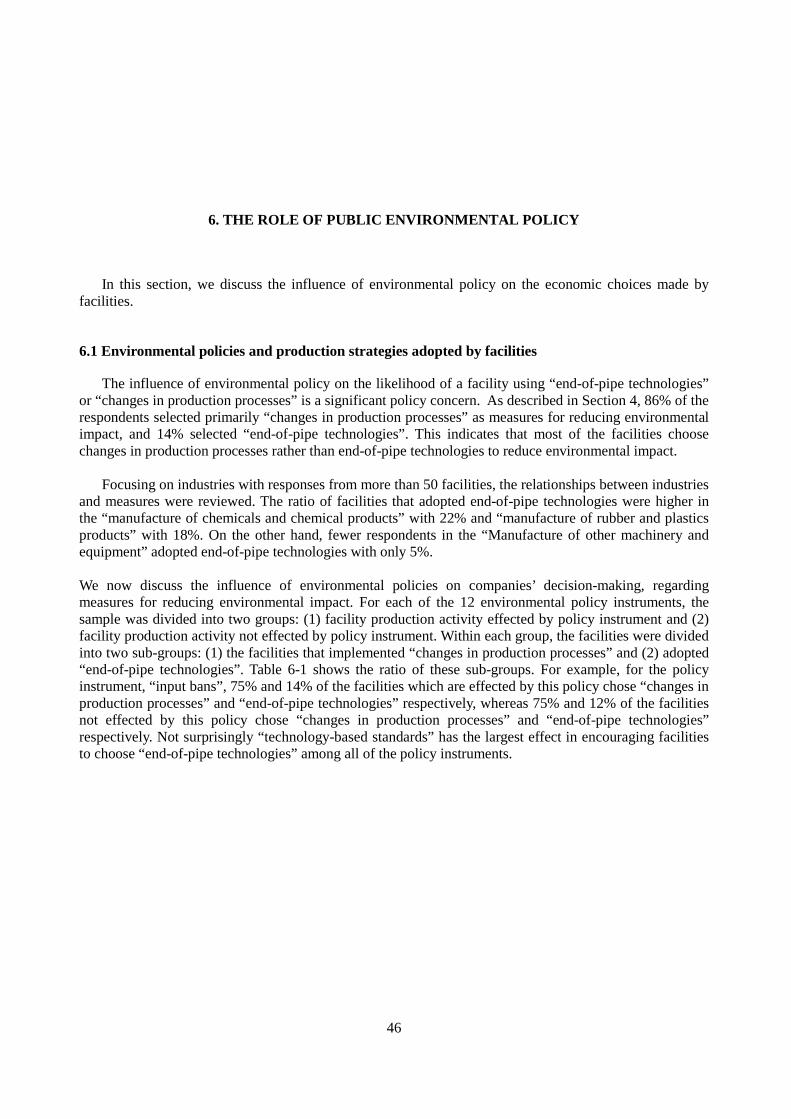
46
6. THE ROLE OF PUBLIC ENVIRONMENTAL POLICY
In this section, we discuss the influence of environmental policy on the economic choices made by facilities.
6.1 Environmental policies and production strategies adopted by facilities
The influence of environmental policy on the likelihood of a facility using “end-of-pipe technologies” or “changes in production processes” is a significant policy concern. As described in Section 4, 86% of the respondents selected primarily “changes in production processes” as measures for reducing environmental impact, and 14% selected “end-of-pipe technologies”. This indicates that most of the facilities choose changes in production processes rather than end-of-pipe technologies to reduce environmental impact. Focusing on industries with responses from more than 50 facilities, the relationships between industries and measures were reviewed. The ratio of facilities that adopted end-of-pipe technologies were higher in the “manufacture of chemicals and chemical products” with 22% and “manufacture of rubber and plastics products” with 18%. On the other hand, fewer respondents in the “Manufacture of other machinery and equipment” adopted end-of-pipe technologies with only 5%. We now discuss the influence of environmental policies on companies’ decision-making, regarding measures for reducing environmental impact. For each of the 12 environmental policy instruments, the sample was divided into two groups: (1) facility production activity effected by policy instrument and (2) facility production activity not effected by policy instrument. Within each group, the facilities were divided into two sub-groups: (1) the facilities that implemented “changes in production processes” and (2) adopted “end-of-pipe technologies”. Table 6-1 shows the ratio of these sub-groups. For example, for the policy instrument, “input bans”, 75% and 14% of the facilities which are effected by this policy chose “changes in production processes” and “end-of-pipe technologies” respectively, whereas 75% and 12% of the facilities not effected by this policy chose “changes in production processes” and “end-of-pipe technologies” respectively. Not surprisingly “technology-based standards” has the largest effect in encouraging facilities to choose “end-of-pipe technologies” among all of the policy instruments.
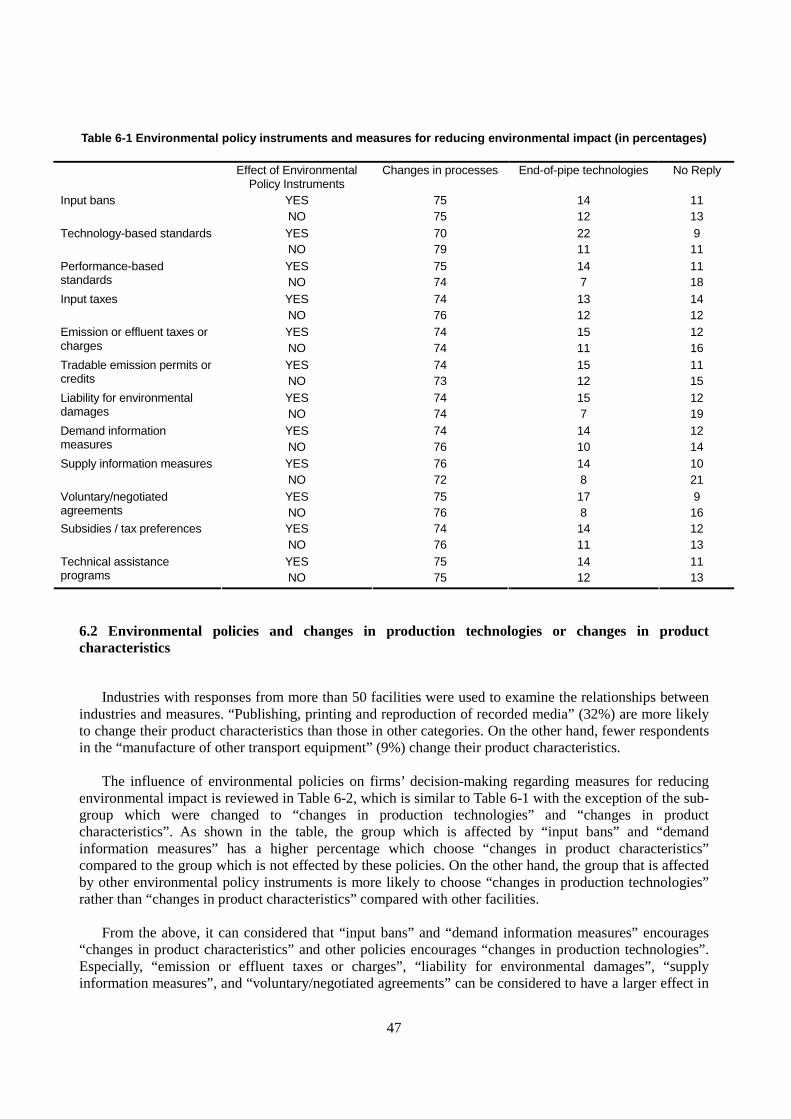
47
Table 6-1 Environmental policy instruments and measures for reducing environmental impact (in percentages)
Effect of Environmental Policy Instruments
Changes in processes End-of-pipe technologies No Reply
YES 75 14 11 Input bans NO 75 12 13 YES 70 22 9 Technology-based standards NO 79 11 11 YES 75 14 11 Performance-based
standards NO 74 7 18 YES 74 13 14 Input taxes NO 76 12 12 YES 74 15 12 Emission or effluent taxes or
charges NO 74 11 16 YES 74 15 11 Tradable emission permits or
credits NO 73 12 15 YES 74 15 12 Liability for environmental
damages NO 74 7 19 YES 74 14 12 Demand information
measures NO 76 10 14 YES 76 14 10 Supply information measures NO 72 8 21 YES 75 17 9 Voluntary/negotiated
agreements NO 76 8 16 YES 74 14 12 Subsidies / tax preferences NO 76 11 13 YES 75 14 11 Technical assistance
programs NO 75 12 13
6.2 Environmental policies and changes in production technologies or changes in product characteristics
Industries with responses from more than 50 facilities were used to examine the relationships between industries and measures. “Publishing, printing and reproduction of recorded media” (32%) are more likely to change their product characteristics than those in other categories. On the other hand, fewer respondents in the “manufacture of other transport equipment” (9%) change their product characteristics. The influence of environmental policies on firms’ decision-making regarding measures for reducing environmental impact is reviewed in Table 6-2, which is similar to Table 6-1 with the exception of the sub-group which were changed to “changes in production technologies” and “changes in product characteristics”. As shown in the table, the group which is affected by “input bans” and “demand information measures” has a higher percentage which choose “changes in product characteristics” compared to the group which is not effected by these policies. On the other hand, the group that is affected by other environmental policy instruments is more likely to choose “changes in production technologies” rather than “changes in product characteristics” compared with other facilities. From the above, it can considered that “input bans” and “demand information measures” encourages “changes in product characteristics” and other policies encourages “changes in production technologies”. Especially, “emission or effluent taxes or charges”, “liability for environmental damages”, “supply information measures”, and “voluntary/negotiated agreements” can be considered to have a larger effect in

48
choosing “changes in production technologies” compared to other policies. Table 6-2 Environmental policy instruments and measures for reducing environmental impact (in percentages)
Effect of
Environmental Policy Instruments
Changes in production technologies
Changes in product characteristics
No Reply
YES 72 19 9 Input bans NO 75 16 10 YES 80 13 7 Technology-based standards NO 75 18 7 YES 73 17 9 Performance-based
standards NO 69 16 15 YES 73 16 11 Input taxes NO 68 21 11 YES 77 14 9 Emission or effluent taxes or
charges NO 67 19 14 YES 72 18 9 Tradable emission permits
or credits NO 72 15 13 YES 74 16 10 Liability for environmental
damages NO 64 19 18 YES 71 20 10 Demand information
measures NO 71 17 12 YES 77 16 7 Supply information
measures NO 64 16 20 YES 78 16 6 Voluntary/negotiated
agreements NO 67 18 15 YES 75 15 10 Subsidies / tax preferences NO 70 19 12 YES 77 15 8 Technical assistance
programs NO 72 16 11
6.3 Government policies and the adoption of environmental management systems
First, we discuss the relationship between governmental policies encouraging the adoption of EMS and actual adoption by facilities. The total sample, was divided into two groups according to whether they were subject to incentive measures or not. Within each group percentages are shown according to the present status in adoption of EMS (Table 3-3 shown in percentages). From this table, percentages of implementation of EMS is higher for the group with “some incentive measures for EMS” compared to the group with “no incentive measures for EMS”. Therefore, it is likely that the policy of Incentive measures for EMS is efficiently acting as a stimulant in the acquisition of EMS. Table 6-3 summarizes to what extent facilities have adopted EMS, or are preparing to, in relation to others. As shown in the table, EMSs are more likely to be adopted when incentive measures for adoption of EMS are applied.
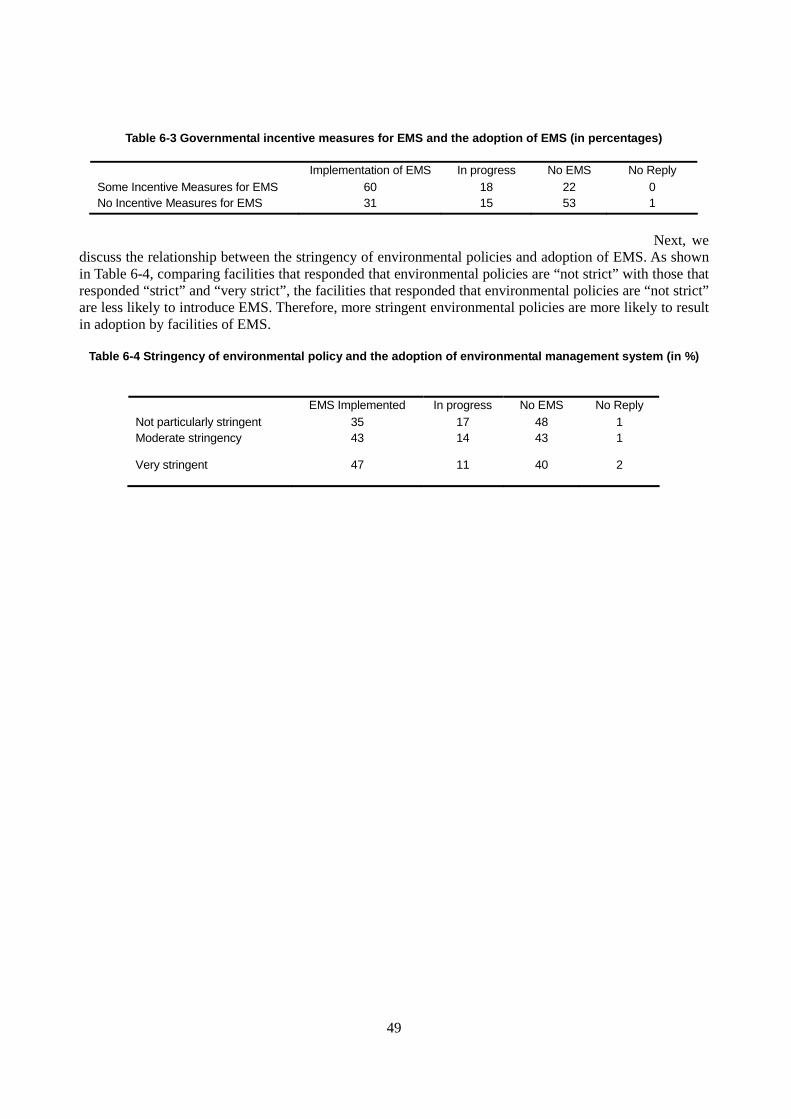
49
Table 6-3 Governmental incentive measures for EMS and the adoption of EMS (in percentages)
Implementation of EMS In progress No EMS No Reply Some Incentive Measures for EMS 60 18 22 0 No Incentive Measures for EMS 31 15 53 1
Next, we discuss the relationship between the stringency of environmental policies and adoption of EMS. As shown in Table 6-4, comparing facilities that responded that environmental policies are “not strict” with those that responded “strict” and “very strict”, the facilities that responded that environmental policies are “not strict” are less likely to introduce EMS. Therefore, more stringent environmental policies are more likely to result in adoption by facilities of EMS.
Table 6-4 Stringency of environmental policy and the adoption of environmental management system (in %)
EMS Implemented In progress No EMS No Reply
Not particularly stringent 35 17 48 1 Moderate stringency 43 14 43 1
Very stringent 47 11 40 2
50
7. ENVIRONMENTAL PRACTICES AND COMMERCIAL PERFORMANCE
This section outlines the relationships between business performance of facilities and their environmental activities.
7.1 Business performance of facilities and their environmental management tools
The relationship between commercial performance and the presence of environmental management tools such as7 ”written environmental policy”, “carrying out internal environmental audits” and “benchmarking of environmental performance”, indicates higher implementation rates than other practices. Tables 7-1 and 7-2 show the relationship between environmental practices and commercial performance, and the relationship between environmental practices and changes in sales levels, respectively. For both items of environmental management tools, facilities which enacted more environmental management tools have higher rates of excess revenues and experience lower rates of sales decrease. These results indicate that both the profitability and growth potential of facilities have positive correlations with environmental conservation activities.
Table 7-1 Relationship between environmental management tools and commercial performances
Rev
enue
has
bee
n lo
w a
s to
pr
oduc
e la
rge
loss
es
Rev
enue
has
bee
n in
suffi
cien
t to
cov
er c
osts
Rev
enue
has
allo
wed
us
to
brea
k ev
en
Rev
enue
has
bee
n su
ffici
ent t
o m
ake
a sm
all p
rofit
Rev
enue
has
bee
n w
ell i
n ex
cess
of c
osts
No
Rep
ly
YES 3 15 33 45 1 0 Written environmental policy NO 4 24 37 33 1 0 YES 3 16 31 46 1 0 Carry out external
environmental audits NO 5 23 38 32 1 0 YES 4 16 33 43 1 0 Benchmark environmental
performance NO 4 23 37 34 1 0
7 For detailed information, see Section 4 and Table 4-3.

51
Table 7-2 Relationship between environmental management tools and changes in sales (in percentages)
Significant Increase
Increase No Change Decrease Significant Decrease
No Reply
YES 3 19 26 37 12 0 Written environmental policy NO 2 16 22 43 15 0
YES 4 20 26 37 11 0 Carry out internal environmental audits NO 2 16 23 42 16 0
YES 3 18 26 39 12 0 Benchmark environmental performance
NO 2 17 23 41 16 0
The relationship between the importance of “corporate image” as a competition strategy and the implementation of environmental management tools is presented in Table 7-3. This shows the rates of both implemented and unimplemented environmental management tools for each group of facilities that regard “corporate image” to be “not important”, “important” or “very important”, respectively (with the exception of those who did not reply). The table indicates that those facilities that contribute the most to their “corporate image” as part of their competition strategy show higher rates of implementation of individual environmental management tools. This shows that for these firms, generating a good image brings benefits such as, higher sales in the market, easier access to funds in the stock market, and facilitating permitting when constructing new facilities. Therefore, the incentives for reducing environmental impacts by implementing environmental management tools are strong.
Table 7-3 Relationship between corporate image and environmental management tools (in percentages)
Written environmental policy Carry out internal environmental audits
Benchmark environmental performance
YES NO No Reply YES NO No Reply YES NO No Reply Not Important 55 43 2 53 46 2 57 41 2
Important 43 53 4 40 57 3 47 49 4 Very Important 50 50 0 75 25 0 75 25 0
7.2 Business performance of facilities and adoption of EMS
As described in Section 4, Table 4-11 shows that 486 facilities (36%) have introduced EMS and 662 facilities (49%) have not. However, if facilities which are “in progress” are included, approximately half (697 facilities) of the facilities are interested in the adoption of EMS. Here, we address the relationship between facilities’ commercial performance and the adoption of EMS. As shown in Table 7-4, which illustrates the relationship between the commercial performance of facilities and the adoption of EMS, profit-making facilities tend to introduce EMS, while deficit-making facilities tend to reject its adoption. These results indicate that in decision-making, facilities are experiencing difficulties with the adoption of EMS under the present unfavorable economic conditions, even if commercial performance is expected to improve as a result. In addition, for facilities that have introduced EMS, the average annual value of shipments and change in value of shipments are 31.7 billion yen and 4.7%, respectively. In contrast, for facilities that have not introduced EMS, the average annual value of shipments and change in value of shipments are 3.4 billion yen (standard deviation: 5.8 billion yen) and 1.5% (standard deviation: 16%), respectively. This indicates that facilities operating on a large scale and with high growth potential are more likely to introduce EMS.
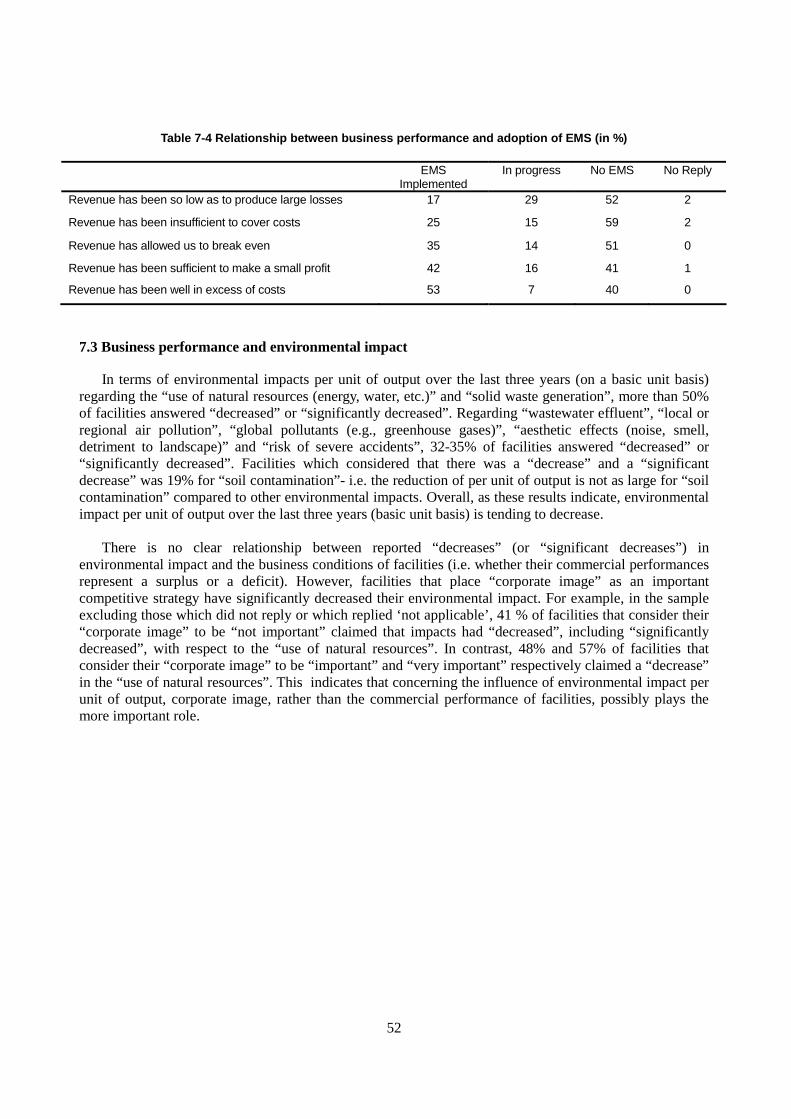
52
Table 7-4 Relationship between business performance and adoption of EMS (in %)
EMS Implemented
In progress No EMS No Reply
Revenue has been so low as to produce large losses 17 29 52 2
Revenue has been insufficient to cover costs 25 15 59 2
Revenue has allowed us to break even 35 14 51 0
Revenue has been sufficient to make a small profit 42 16 41 1
Revenue has been well in excess of costs 53 7 40 0
7.3 Business performance and environmental impact
In terms of environmental impacts per unit of output over the last three years (on a basic unit basis) regarding the “use of natural resources (energy, water, etc.)” and “solid waste generation”, more than 50% of facilities answered “decreased” or “significantly decreased”. Regarding “wastewater effluent”, “local or regional air pollution”, “global pollutants (e.g., greenhouse gases)”, “aesthetic effects (noise, smell, detriment to landscape)” and “risk of severe accidents”, 32-35% of facilities answered “decreased” or “significantly decreased”. Facilities which considered that there was a “decrease” and a “significant decrease” was 19% for “soil contamination”- i.e. the reduction of per unit of output is not as large for “soil contamination” compared to other environmental impacts. Overall, as these results indicate, environmental impact per unit of output over the last three years (basic unit basis) is tending to decrease. There is no clear relationship between reported “decreases” (or “significant decreases”) in environmental impact and the business conditions of facilities (i.e. whether their commercial performances represent a surplus or a deficit). However, facilities that place “corporate image” as an important competitive strategy have significantly decreased their environmental impact. For example, in the sample excluding those which did not reply or which replied ‘not applicable’, 41 % of facilities that consider their “corporate image” to be “not important” claimed that impacts had “decreased”, including “significantly decreased”, with respect to the “use of natural resources”. In contrast, 48% and 57% of facilities that consider their “corporate image” to be “important” and “very important” respectively claimed a “decrease” in the “use of natural resources”. This indicates that concerning the influence of environmental impact per unit of output, corporate image, rather than the commercial performance of facilities, possibly plays the more important role.
53
8. CONCLUSION
To encourage the reduction in the emission of various pollutants at the facility level, it is necessary to explore what are the stakeholders and factors affecting the actions of facilities, including measures to reduce environmental impacts and to adopt EMS. For this purpose, the survey was conducted in April 2003. The conclusions of the analysis using the data collected in the survey are summarized as follows. In Section 2, the overview of the samples obtained by the firm-facility survey was presented. Firstly, the response rate of the survey was 32% (1,499 firms and facilities replied), which was very high, although large firms and facilities had higher response rates. Therefore, the sample was somewhat biased towards large firms. When the sample was restricted to firms with more than 50 employees, the sample closely represented the total population in general. In Section 3, environmental problems in Japan and environmental policies were reviewed, followed by an analysis of which policy instruments affected production activities from the survey sample. The results revealed that, in Japan, “performance-based standards”, “input taxes (including energy)”, “liability for environmental damages”, and “supply information measures” had important effects on production activities. On the other hand, “input bans”, “technology-based standards”, and “technical assistance programmes” had less important effects. In addition, larger firms perceived themselves to be subjected to more strict environmental regulations. Government incentives for the implementation of EMS were recognised by only 18%, indicating that these incentive measures were not abundant. In Section 4, implementation of EMS and environmental management tools was analyzed. In particular, the facilities’ actions in reducing environmental impact and performance of these actions were analyzed. The results obtained from the sample revealed that 53% of the facilities had “written environmental policy” and 43% of the facilities had “environmental training program in place for employees”. On the other hand, “environmental accounting”, “environmental criteria used in the evaluation and/or compensation of employees”, and “public environmental report” were not widely implemented. As for adoption of EMS, 34% of the sample had introduced EMS, of which most were ISO 14001. The relationship between business management and adoption of EMS, revealed that only 63% of the facilities without EMS acquisition had “quality management” such as TQC and TQM, although almost every facility which had acquired EMS had some sort of quality management. This suggests that quality management is a key qualification making acquisition of EMS much easier. When the characteristics of facilities and probability of acquisition of EMS was focused upon, facilities which viewed the world market as the major market, had a large number of competitors, had many employees, were listed on the stock exchange, and which had environment-related R&D had relatively higher EMS acquisition rates. This suggests that these factors possibly create stronger incentives for acquisition of EMS. When focusing on the relationship between the adoption of EMS and environmental management tools actually taken by the facilities and the consideration of environmental issues in business procedures, in facilities where EMS were introduced, various environmental management tools were also applied. The rate of consideration of environmental issues such as “quality management” and “health and safety management” systems was higher than in non-EMS introduced facilities. Therefore, facilities which introduced EMS, takes various other management actions in environmental conservation. Furthermore, focusing on the environmental performance of facilities, approximately 70% of the facilities replied that “solid waste generation” and “use of natural resource” has the largest effect on the environment. Compared to other environmental impacts, the measure for these two environmental impacts

54
is important. Changes in production process rather than end-of-pipe technologies and changes in production technologies rather than changes in product characteristics where more frequently applied by facilities to reduce these environmental impacts. Focusing on the change of environmental impact per unit of production for the past three years, for every item, the ratio which replied “increased” were smaller than those ratios which replied “decreased”, implying that per production of environmental impact is decreasing. Focusing on the relationship between acquisition of EMS and changes in per production environmental impacts, there was a positive correlation between the two. In Section 5, the effects of stakeholders on environmental measures undertaken by facilities were analyzed. From the survey results, “public authorities”, “commercial buyers”, and “neighborhood/community groups & organizations” were important stakeholders of facilities in reduction of environmental impacts. Other factors such as “shareholders and investment funds” and “banks and other lenders” were important stakeholders for facilities of listed firms. Specifically focusing on the relationship between adoption of EMS and stakeholders, “corporate headquarters” and “commercial buyers”, among a variety of stakeholders, had the greatest influence. In addition, “prevention or control environmental incidents”, “regulatory compliance”, and “corporate profile/image” were important motives for the environmental measures of facilities. In Section 6, the effects of environmental policies on facility activities were discussed. As a result, environmental policies possibly promote facilities to use end-of-pipe technologies as means to reduce their environmental impact and “input bans” and “demand information measures” possibly promotes changes in product characteristics, while other policies promotes changes in production technologies. In Japan, less than 20% of the facilities replied that “governmental incentive measures” were conducted, implying that governmental incentive measures are not abundant, although they appear to increase the rate of EMS adoption. In addition, facilities faced with more strict environmental authorities tend to introduce EMS, implying that strict regulations promote the acquisition of EMS. In Section 7, the relationship between environmental conservation measures of facilities and business performance was analyzed. There was a positive correlation between environmental management measures actually practiced and profitability and growth potential of facilities. In addition, the higher placement of “firm image” as competitive strategy, leads to a higher adoption rate of EMS. This implies that stronger incentives exist for the adoption of EMS for firms wanting to generate a good “firm images” in order to gain benefits such as higher sales of products in the market, better access to funds in the stock market, and easier construction permits for new facilities. Focusing on the relationship between the adoption of EMS and the business performance of facilities and change in average production, facilities with larger excess budget and facilities with higher production have introduced EMS, whereas, facilities with higher losses and facilities with greater decreases in production discourages the adoption of EMS. Finally, focusing upon the relationship between changes in environmental impact and business performance of facilities (excess budget or budget deficit), there was no evident relationship between the two. The higher placement of “firm image” as a means competitive strategy for the facility resulted in larger ratios of reduction for their environmental impact. From these results, firm image plays an important role, rather than the business performance of the facility, in the reduction of environmental impact (per unit of production). In this report, as shown in the results obtained by the analyses using the survey data, environmental measures by facilities and the status of the adoption of EMS was clarified, and various factors were examined to see the relationship between the two variables. However, due to the simultaneous effects of the various factors, it is not adequate to focus only on the relationship between two specific variables in analyzing the effects of these factors on environmental management measures, incentives for the adoption of EMS, and environmental activities. This problem can be solved by analyzing the decision-making problem of facilities concerning environmental management measures and adoption of EMS by applying

55
the probit or logit models. These tasks are left for further research.
56
REFERENCES
Ministry of the Environment Japan (2001). "Survey of Environmentally Friendly Activities 2000" (in Japanese). Hibiki, Akira and Toshi Arimura (2002) “Introductory Environmental Economics” Chukoshinsho Publishing (in Japanese). Hibiki, Akira (2003) “Japanese Trend towards Environmental Tax for Global Warming”, Energy and Resource, Vol.24,No.5, 330-334 (in Japanese). Hibiki, Akira, Masato Higashi and Akimi Matsuda (2003). “Determinants of the Firm to Acquire ISO14001 Certificate and Market Valuation of the Certified Firm”, Tokyo Institute of Technology Discussion Paper, No. 03-06 (Available at http://www.soc.titech.ac.jp/titsoc/discuss/index_e.html ) Nakamaura, Masao, Takahashi, Takuya and Vertinsky, Ilan (2001) “Why Japanese Firms Choose to Certify: A Study of Managerial Responses to Environmental Issues”, Journal of Environmental Economics and Management, Vol.42. 23-52. OECD (2003) OECD Performance Review: Japan, OECD Pub. Wilma Rose Q. Anton, George Deltas and Madhu Khanna “Incentives for Environmental Self-regulation and Implications for Environmental Performance”, forthcoming in Journal of Environmental Economics and Management Welch, Eric and Akira Hibiki (2002) “Japanese Voluntary Environmental Agreements: Bargaining Power and Reciprocity as Contributors to Effectiveness”, Policy Science, Vol. 35, No. 4, 401-424. Welch, Eric, Yasufumi Mori and Midori Aoyagi-Usui (2002) “Voluntary Adoption of ISO14001 in Japan: Mechanism, Stages and Effects”, Bus. Strat. Env., Vol.11, 43-62.