Embed Size (px)
Citation preview


What is Social Insurance andWhy Consider it in Welfare State Reinvention?
• Introduction• The Objectives of Social Insurance• Some Design Features• Why Social Insurance?• The Australian Experience• The Contemporary “Demand” for Social Insurance• Why Does Interest in Social Insurance Persist? • What Does this Mean for the Future of the Welfare State in
the 21st Century and Social Insurance as One of Its Important Institutions?

Introduction
Through social insurance “mankind [will be] secured from all the miseries, indigences, and distress that happen in the world”
Daniel Defoe, An Essay on Projects, 1697
Attempts to introduce social insurance legislation into the British Parliament in 1772 and 1786.
First compulsory national social insurance schemes were established in Germany under Chancellor Bismarck in late 19th century ‐‐ health insurance, workers’ compensation for accidental injury, and old‐age and invalidity (disability) pensions
Germany’ was soon followed by Austria and Hungary, and by Britain under the National Insurance Act of 1911.
Since that time many other countries in Europe, the Americas, Asia and Oceania have adopted various types of social insurance schemes.

Introduction
Reasons for birth ad growth of social insurance:• gives dissenting social groups a stake in the continuity of the state• a luxury good that is created when countries get rich• an inexorable outcome of leviathan government • the recognition of certain risks as a constant of the human condition
Specifically, • the risk of economic insecurity associated with commonly‐experienced
adverse life events which are beyond the individual’s control, or contingencies
• the inability of most people to properly prepare for those contingencies• even if able to prepare to some degree, the failure of many to do so due to
myopia.
Introduction
The risk of economic insecurity arises from :• the loss of earned income due to such contingencies as unemployment,
the need to opt out of the workforce to care for a newborn child, and retirement or widowhood.
• the potentially catastrophic costs associated with illness, injuries from accidents, and the provision of care to the elderly and those with either congenital or acquired disabilities.
The recognition of the need to provide protection against the risk of economic insecurity arose at different times in different places and in relation to different contingencies. e.g., Australia’s Medibank scheme (the predecessor to Medicare) was introduced in 1974 in response to concerns about the barrier to health care access experienced by those who could not afford expensive private health insurance.
The Objectives of Social Insurance
• redistribute income in order to alleviate poverty (the social adequacy objective),
• provide indexed benefits that are contributions‐ and, hence, earnings‐related in order to assure some degree of protection of accustomed living standards (the individual equity objective)
• an amalgam of both• income smoothing• social solidarity• easing the burden of care on informal carers • supporting people with a permanent and significant
disability …

Some Design Features
• Mandatory contributions make possible a pooling solution to risk protection and, thereby, substantially avoids the problems caused by adverse selection
• access to social insurance benefits is a right subject only to a contribution test and the occurrence of a specified contingency
• social insurance contributions are typically held in a dedicated (“hypothecated”) fund
• mandatory contributions are made by employers and employees and sometime by government too
A common characteristic of many social insurance schemes is that they promise benefits whose cost is greater than the revenue generated by their mandatory contributions!

Why Social Insurance at All?
• Private insurance markets are only inclined to cover contingencies in which individual risk and premiums can be reasonably linked across the risk pool (the insured).
• Moral hazard is a problem that cannot be overcome and inexorably leads to market failure ‐‐ the unwillingness of private insurers to develop a needed insurance product.
Insured?Insurable?

Social Insurance: The Australian Experience
• Australia a social insurance laggard … but not for lack of trying!• 1928 National Insurance Bill to cover sickness, old age and invalidity
(disability), widowhood and being orphaned. Bill lapsed in 1929 with a change of government.
• The National Pensions and Health Insurance Act was passed in 1938 to cover old‐age, sickness, disability and widow pensions and medical benefits. Abandoned by early 1939.
• 1974 National Compensation Bill based on recommendations of Woodhouse Committee of Inquiry into a National Rehabilitation and Compensation Scheme for Personal Injury established in 1973. Proposed a no‐fault compensation scheme with compensation to be primarily earnings‐related. Lapsed due to change of government.
• Hancock National Superannuation Committee of Inquiry in 1973. Recommendations rejected by succeeding government.
• Medibank, the precursor to Medicare, introduced in 1974.
The Contemporary “Demand” for Social Insurance
• Interest in extending the range of contingencies covered by social insurance has persisted.
• Exemplified by the NDIS launched in July 2013 subsequent to framing disability as an economic issue and a sustained, sophisticated policy advocacy.
• ACTU has recommended consideration be given to the introduction of an unemployment social insurance scheme.
• Many submissions made to Productivity Commission's inquiry into aged care (2011) supported introduction of a long‐term aged care social insurance scheme.
• Elsewhere … A (voluntary) long‐term aged care social insurance scheme provided for under the United States CLASS Act of 2010 (part of the Obamacare legislation). Taiwan is on the threshold of introducing long‐term aged care social insurance

Why Does Interest in Social Insurance Persist?
Some reasons:• The effectiveness of existing social insurance schemes• Demographic factors (paid parental leave insurance, long‐term aged
care insurance)• The growing precariousness of modern life resulting in income
instability

What Does this Mean for the Future of the Welfare State in the 21st Century and Social Insurance as One of Its Important
Institutions?
• The neoliberalism of the late 20th and early 21st centuries suggests that the future prospects for ne social insurance schemes are poor … and that NDID is an aberration.
• .However, the role of neoliberalism in shaping social policy is contested.
• Empirical research suggests that welfare state retrenchment has not taken place.
• Therefore, there may, in fact, be some scope for the introduction of new social insurance schemes, e.g., community‐based long‐term aged care social insurance.

The Fiscal Side of Social Insurance
Daniel BélandCanada Research Chair in Public Policy
www.danielbeland.org

What is Social Insurance?
• Social insurance is typically defined in contrast to two other types of social programs: social assistance and universal benefits and services.
• What is specific about social insurance is the relationship between social benefits and payroll contributions.
• Social assistance benefits are derived from need; universal benefits from citizenship.

The Fiscal Side of Social Insurance
• A fiscal‐centred perspective: payroll contributions are not only a way to finance social benefits and services; they are also embedded in the fiscal side of state building.
• Payroll contributions increase fiscal capacity of the state and can matter in their own right, as a fiscal and economic instrument.
The Example of Canada (I)
• The creation of the Québec and Canada Pension Plans in the mid‐1960s is an example of how fiscal imperatives can drive the development of social insurance programs.
• Quiet Revolution and state‐building in Québec: using pension contributions to feed a new provincial investment board rooted in economic nationalism.

The Example of Canada (II)
• In the end, Québec created its own old‐age insurance scheme (QPP), which was identical to the Canada Pension Plan, except for the way payroll contributions were handled.
• The main rationale behind the creation of QPP alongside CPP was economic nationalism and the related need to increase the fiscal capacity of the provincial state in Québec.
Other Examples
• United States: the creation of Social Security during the New Deal, which favoured the expansion of the fiscal capacity of the federal government at a time when the federal income tax had a narrow base.
• Israel: advent of social insurance schemes after the creation of the country in 1948 to increase the fiscal capacity of the new state.
Conclusion
• Social insurance payroll contributions are fiscal and economic tool in their own right.
• Studying the fiscal side of social insurance requires to take this state‐ and nation‐building reality into account, instead of understanding payroll contributions solely as financing devices for social benefits and services.
• More historical‐comparative research needed!
The Gendered Effects of Social Insurance Schemes:
A Case Study of Ageing and Pensions
Sara ArberCentre for Research on Ageing and Gender (CRAG)
Department of Sociology,University of Surrey, Guildford, UK
Academy of the Social Sciences in Australia Symposium on‘Social Insurance for the 21st Century? Exploring Pathways for a
Sustainable, Equitable and effective Welfare System’Shine Dome, Canberra, 17th November 2015

Gender and Social Insurance Systems
Gender is fundamental to the design of Social Insurance Systems, but we need to consider:
- Changes in women’s roles, especially increases in women’s paid employment
- How welfare states vary in their approach to women’s roles, including childcare provision
- The Impact of pension policy changes associated with concerns about an Ageing Society – are they gender neutral?

Welfare States and Women’s RolesWelfare states vary in approach to women’s roles:
Primarily as mothers or as workers
1. Male Breadwinner model (family support)– women as dependent wives, mothers, carers (with ‘derived rights’ from husbands)
E.g. UK state Pension system based on ‘social insurance’ was formulated after 2WW
2. Adult Worker model (Individualised)– women as equal workers - Nordic countries
3. Adult Worker/part-carer model (current UK reality)
– women juggling caring and paid work (with inadequate state-supported childcare)
Derived rights based on marriage UK ‘breadwinner’ model:Most Married women gained a State pension based on their
husband’s employment record;
Widows inherited (50% of) state pension from husband
In most Defined Benefit Occupational Pensions – wives (and ?male dependent spouses) inherit 50% of husbands pension
Are derived benefits outdated and ineffective?• Women’s greater employment participation & Education
• Separation of marriage and motherhood (Cohabitation)
• Married women may be childless, yet receive a subsidy
• Divorced women and Lone parents are especially vulnerable to poverty

Individualised rights -
‘Independence model’ of benefits provides rights through:
• Own Employment – length of employment career (years of contributions)
• Level of earnings
• Allowances for family caring? (May be provided in state pensions, but not in private pensions)
• Residence/Citizenship – in some countries
BUT – Gender inequalities in the labour market and in caring remain. However, - Variation between societies in support for women’s labour force participation, e.g. state childcare, maternity benefits.
Lower income of older women
Reflects their pension-building experience- depends on family, state and labour market
But changing gendered norms affect all these.
Today:1. Can women earn on equal terms with men?
2. Have pension systems adapted to women’s working lives?
Or do women’s family roles still limit their employment, earnings and pensions?

Labour Force Participation and Pensions
1. Women’s participation in the labour market• Occupational segregation• Lower hourly earnings• Family caring roles – if lack of state support
Career breaksPart-time work
• Fewer years of full-time employment
Hence lower lifetime earnings
2. Most pension schemes are designed for a ‘masculine life-course’ - full time continuous employment for a full pension

Percentage of British mothers employed full and part time, by partnership status and age of youngest child
living at home
Source: ONS 2012

Towards an Adult Worker (Individualised) model in 21st century
Nordic countries- State services replace much of women’s family work (childcare, eldercare)
France - Pro-natalist policies, so childcare a priority
But Britain, Germany, Netherlands
Lack of affordable childcare/eldercare services contribute to women’s part time employment
However, Increasing Inequality between highly educated (well-paid) women who can afford childcare and most other women.
Plus, Increasing role of grandmothers in providing childcare, often reducing own mid-life employment and pension building.

Median earnings by lifecourse category and education.
British women aged 20-59
Source: Ginn and Arber 2002
0
50
100
150
200
250
300
350
Nev child,<35
Child 0-4 Child 5-9 Child 10-15 Child 16+ Nev child,35+
Lifecourse stage
£/w
eek Degree+
Alevels
O/GCSE
Other
None

Childcare and eldercare allowances in pensions
A) Flat rate State schemes
• UK allows for carer credits in the basic pension – but pension is low
• Netherlands and Denmark provide a residence based pension
B) Earnings-related State schemes
• All allow some pension cover for child-care
• Time allowed varies from 3 months to 5 years
• Allowances for eldercare are rare
C) Private Pension schemes (Defined Benefit & Defined Contribution)
• No pension allowance to cover for child-care (or elder-care)

UK Pension System from 1970s to 2010s
1. State (Basic) Pension (1st Tier) – based on 35 contribution years with carer credits for women. - Women as dependent wives, widows inherit husbands’ pensionBUT – at a VERY Low level. Well below ‘means-tested’
income support levelTherefore high and growing % of women (and men)
eligible for ‘Pensioner Credit’ (Income support)
2. State earnings-related Pension (SERPS/SP2) (2nd Tier) – mainly for those without private pensions, ie lower earners – subject to many policy changes
3. Private Pensions (3rd Tier) – Occupational -Defined Benefit (DB) – declined. Defined Contribution (DC) – increased. - Benefit mainly men – with full-time careers, especially in high paid jobs & public sector- Huge tax subsidises for ‘private pension saving’

UK Pension Reforms from 2016
1. State Single Tier Pension (STP) from 2016 –based on 30 contribution years with ‘carer credits’. Individualised – removed all derived benefits for women. - Removed state earnings-related Pension completely. - Set at a higher level – above ‘the poverty’ line (£150 per week) – flat-rate. ‘Triple lock’ of pension rises. - Aim reduce numbers claiming ‘means tested’ support.
2. ‘Auto-enrollment’ into private (DC) pensions by all employers from 2016 – Unless ‘opt-out’ by paying into a ‘recognised’ Occupational pension scheme - Employee pays 4%, Employer pays 3%, State pays 1% - BUT ‘no carer credits’ – and huge risks of DC schemes
3. Private Pensions – Defined Benefit (DB) remain, but fewer & becoming less generous. Defined Contribution (DC) – Rapid increases. - NB. ‘no carer credits’ – Huge risks of DC schemes - Reduction in tax-subsidies for private pensions, but are still substantial.
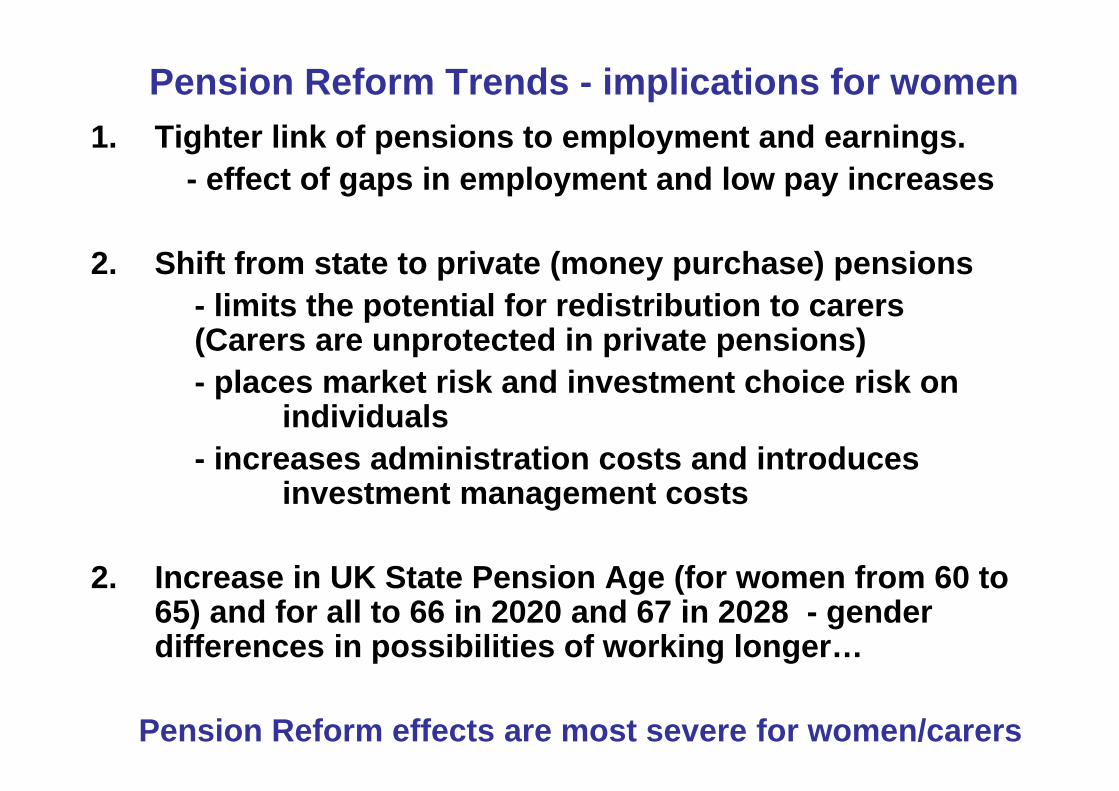
Pension Reform Trends - implications for women1. Tighter link of pensions to employment and earnings.
- effect of gaps in employment and low pay increases
2. Shift from state to private (money purchase) pensions- limits the potential for redistribution to carers (Carers are unprotected in private pensions)- places market risk and investment choice risk on
individuals- increases administration costs and introduces
investment management costs
2. Increase in UK State Pension Age (for women from 60 to 65) and for all to 66 in 2020 and 67 in 2028 - gender differences in possibilities of working longer…
Pension Reform effects are most severe for women/carers

Gender and inequalityNon-carers/men(economic rationality)
• Freed to engage in full time employment
• Can maximise lifetime earnings and pension rights
Carers/women(social quality)
• Reproduce next generation, physically and socially. (Mainly mothers & grandmothers)
Care for parents/partners. Save state costs.
• Fewer years paid work and lower earnings
• Smaller pensions, greater risk of poverty in old age
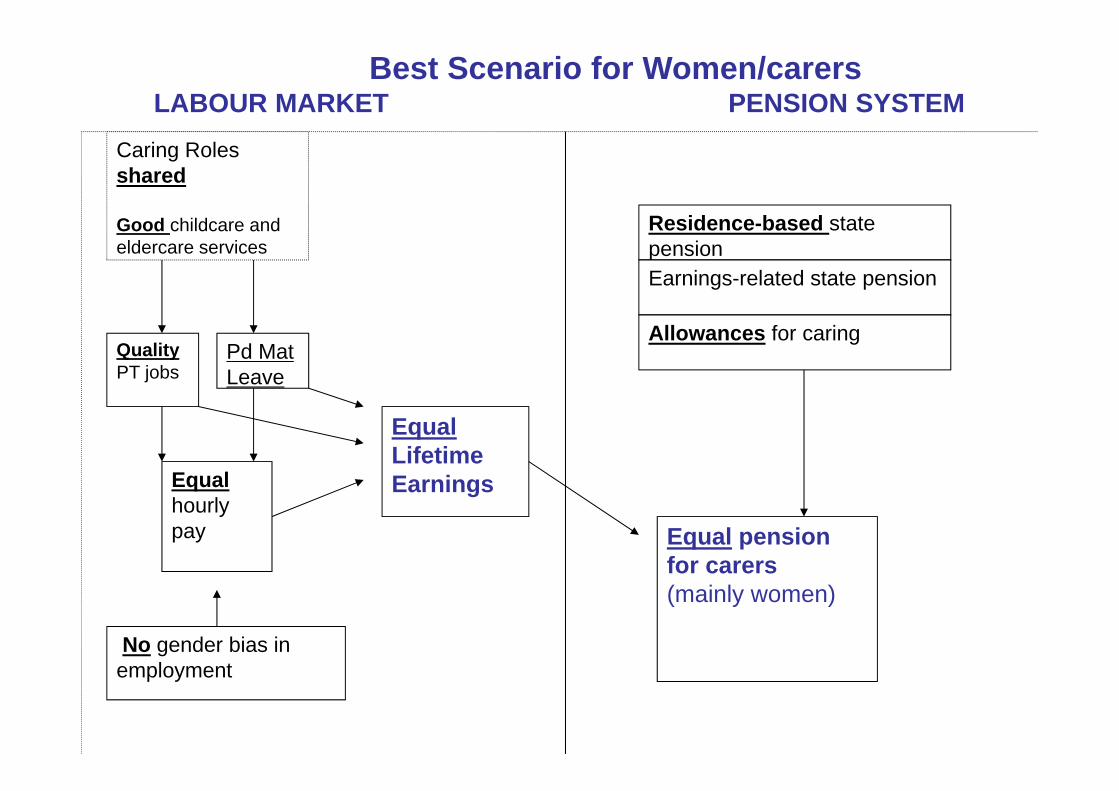
Best Scenario for Women/carersLABOUR MARKET PENSION SYSTEM
Caring Roles shared
Good childcare and eldercare services
QualityPT jobs
Pd Mat Leave
Equal hourly pay
No gender bias inemployment
EqualLifetimeEarnings
Residence-based state pensionEarnings-related state pension
Allowances for caring
Equal pension for carers(mainly women)

Conclusions1. Can women earn on equal terms with men?
No: Family caring still restricts women’s ability to build equal pensions in UK and most EU countries.Plus role of Grandmothers in supporting daughters(in law) reduces their pension building and potential for ‘active ageing’.
2. Have pension systems adapted to women’s working lives?Slightly. But increase in private (especially DC) pensions and increase in state pension age for women reverses these gains.
3. Fairer and more equal policies are possible
But cross-country variation in women’s:-
• Full time employment rate• Employment continuity • Earnings relative to men• Pension income and poverty risk
Shows that carer-friendly welfare policies are possible

Design of state pension schemes – can be gender equal – depends on…
AccessEarnings or hours thresholdsResidence thresholdsTreatment of periods of caring (for children and elders?)Age for pension entitlement (major recent UK changes)
AmountFlat rate or earnings-relatedYears required for full pension Maximum pension may be low, relative to average earnings (as in the UK)
Social Policy Research Centre
The Topsy-turvy World of Australian Parental LeaveDeborah Brennan
Presented at: Reinventing the Welfare State? The Future of Social Insurance in Australia and Internationally
ASSA Annual Symposium, 17 November 2015
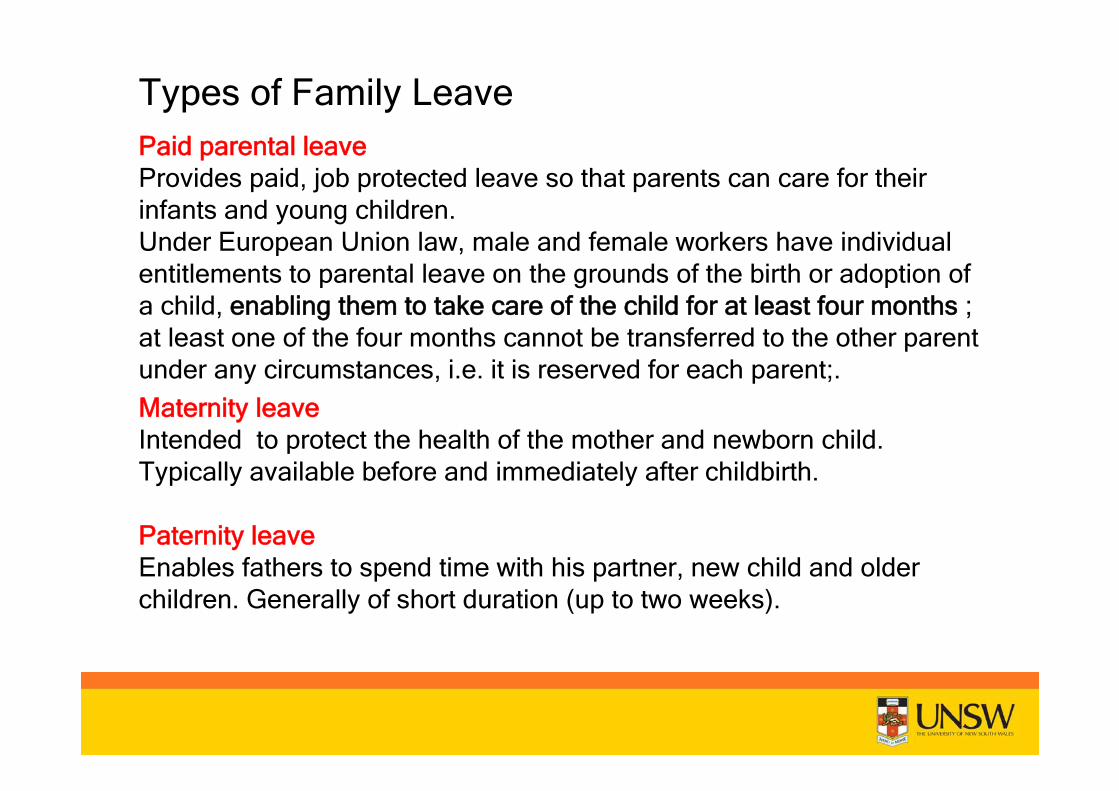
Types of Family LeavePaid parental leaveProvides paid, job protected leave so that parents can care for their infants and young children. Under European Union law, male and female workers have individual entitlements to parental leave on the grounds of the birth or adoption of a child, enabling them to take care of the child for at least four months ; at least one of the four months cannot be transferred to the other parent under any circumstances, i.e. it is reserved for each parent;.Maternity leaveIntended to protect the health of the mother and newborn child. Typically available before and immediately after childbirth.
Paternity leaveEnables fathers to spend time with his partner, new child and older children. Generally of short duration (up to two weeks).

Parental Leave Pay (Australia)
• Up to 18 weeks Parental Leave Pay at Minimum Wage regardless of previous earnings. Current Minimum Wage = $657 per week.
• Eligibility: • Employed full-time, part-time or self-employed and have worked for 10
of the previous 13 months for 330 hours (approx. 1 day per week)• Earn less than $150,000 per year
• Up to 2 weeks Dad and Partner Pay, at Minimum Wage
Assessing alternative approaches to Unemployment Insurance and Unemployment Assistance: A comparative perspectivePresentation for Symposium, Academy of the Social Sciences in Australia, Canberra , November 17, 2015
Peter Whiteford, Crawford School of Public Policy, Australian National [email protected]
Outline
• Defining social insurance• Comparing protection for the unemployed• Advantages and disadvantages of different
approaches• Australian challenges
2
What do social policies deal with?
• The life course• Individual risks and income changes• Macroeconomic change – recessions and
labour market changes• Redistribution, inequality and poverty,
disadvantage• Social investment
3

How are the benefits of social policies allocated?• Social insurance• Individual accounts• Universal programs• Means-tested or targeted programs• Entitlements based on:
– Contributions– Citizenship– Need
4

“The federal government is basically an insurance company with an army …” http://krugman.blogs.nytimes.com/2013/09/12/insurance-company-with-an-army-blogging/?_r=0
• “Most of what we call social policy is actually public insurance. Social Security and Medicare insure against the risk of having little or no money in your retirement years. Unemployment compensation insures against the risk of losing your job. Disability payment programs insure against the risk of suffering a physical, mental, or psychological condition that renders you unable to earn a living.
• Other public services and benefits also are insurance programs, even if we don’t usually think of them as such. Public schools insure against the risk that private schools are unavailable, too expensive, or poor in quality… The Earned Income Tax Credit (EITC) insures against the risk that your job pays less than what’s needed for a minimally decent standard of living. Social assistance programs such as the Supplemental Nutrition Assistance Program (SNAP, or “food stamps”) and Temporary Assistance for Needy Families (TANF) insure against the risk that you will find yourself unable to get a job but ineligible for unemployment or disability compensation.
• http://lanekenworthy.net/public-insurance-and-the-least-well-off/
5

Risks and income changes• Around 3% of the Australian population are fired or made redundant each year
and 10% over four years (HILDA).• In the twelve months to February 2011, more than four million people changed
their labour force status. While the average number of unemployed persons in each month of 2011 was around 600,000, 1.7 million persons overall looked for work at some time during the year, but of these fewer than 150,000 (8 per cent) spent the whole year looking for work. (ABS, 2011)
• Roughly 16 per cent of those who worked during the year ceased a job during the twelve months to February 2013. Nearly 40 per cent of these people left their last job involuntarily. (ABS, 2013)
• The share of workers dismissed each year somewhat higher in Australia than in Great Britain, at just under 4 per cent of all dependent employees; both had lower dismissal rates than USA (around 5 per cent), but both higher than France or Germany (closer to 3 per cent). (OECD, 2010)
• Between 2001 and 2008 40 to 50 per cent of Australians experienced a drop in income and roughly 10 per cent fell more than 20 percentiles in income distribution. Over the whole period, 44 per cent of the population moved more than 20 percentiles.
6

Welfare receipt in Australia% of working age households receiving income support payments by period
7

Comparing protection for the unemployed
8
Defining the quality of social protection• Benefit levels – how much do I get paid?• Coverage – who is included or excluded?• Duration – how long does it last?• Ancillary benefits and services
9
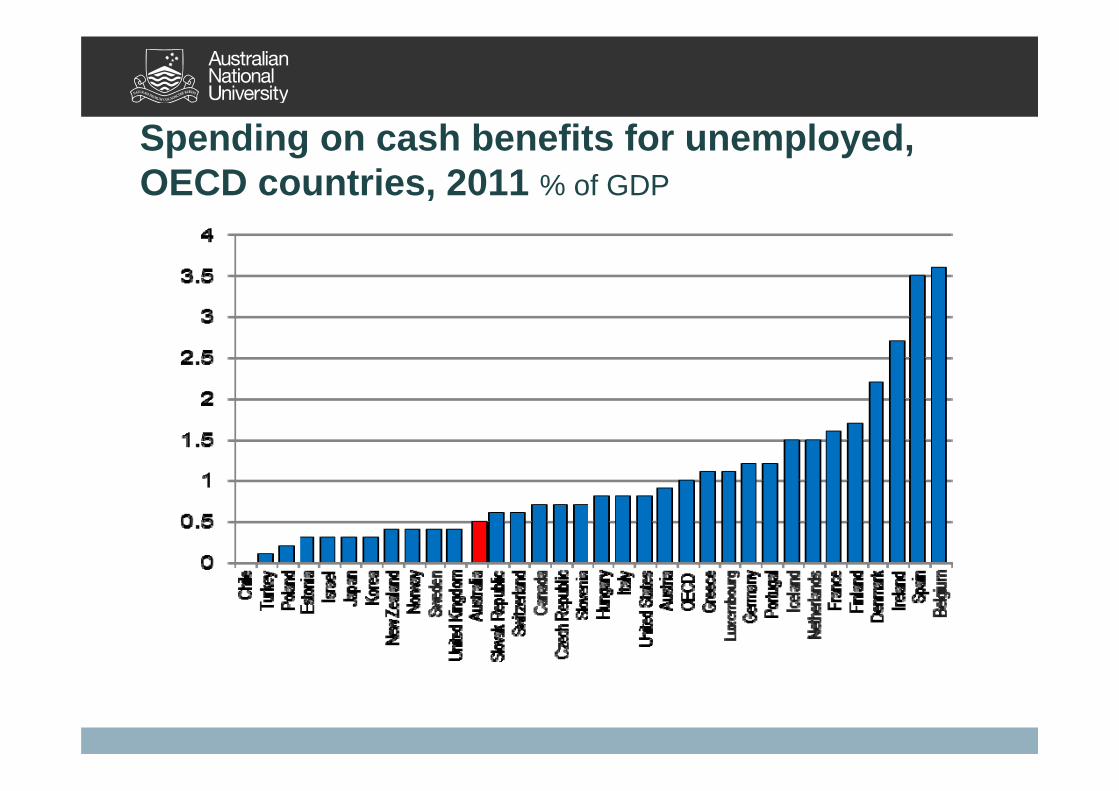
Spending on cash benefits for unemployed, OECD countries, 2011 % of GDP

Spending on active labour market programmes, OECD countries, 2011 % of GDP
11

Standardised spending on cash benefits for unemployed, OECD countries, 2011% of GDP/ Unemployment rate
12

Participants (% of labour force) in ALMPS and income support for the unemployed, selected countries, 2013
Social insurance
Social assistance Other ALMPs
Australia - 6.71 1.85
Denmark 1.79 3.41 0.94 6.08
Finland 3.99 4.63 1.13 4.41
France 8 1.58 0.07 5.11
Germany 2.14 4.45 - 3.07
Italy 4.41 - 2.4 4.65
Netherlands 4.91 4.68 - 4.08
New Zealand - 2.18 - 2.33
Sweden 2.51 - 1.93 5.34United Kingdom (2009) - 5.04 - 0.23
13

Comparing benefit levels
• Relative measures of adequacy– % of net wages at different levels– % of median income (poverty line)– % of GDP per capita/HDI per capita
• Adjustment by purchasing power parities• Caveats

Model families data sources
– Kamerman and Kahn (various)– Bradshaw et al. (various)– Social Assistance and Minimum Income
Protection Dataset (Nelson, 2006) – CSB Minimum Income Protection Indicators
Dataset (Van Mechelen et al ., 2011)– OECD tax benefit models (e.g. Immervoll,
2010)

Components of OECD tax benefit models• What is included
– Social insurance and income support benefits– Family benefits– Income tests – Interactions with taxes– Housing benefits – Child care (sometimes)
• What is not included– Assets tests– Child support– Eligibility, activation, conditionality, benefit duration– Policy administration

Net replacement rates for low paid workers in first six months of unemployment, OECD countries, 2013

Net replacement rates for low paid workers in sixtieth month of unemployment, OECD countries, 2013
18
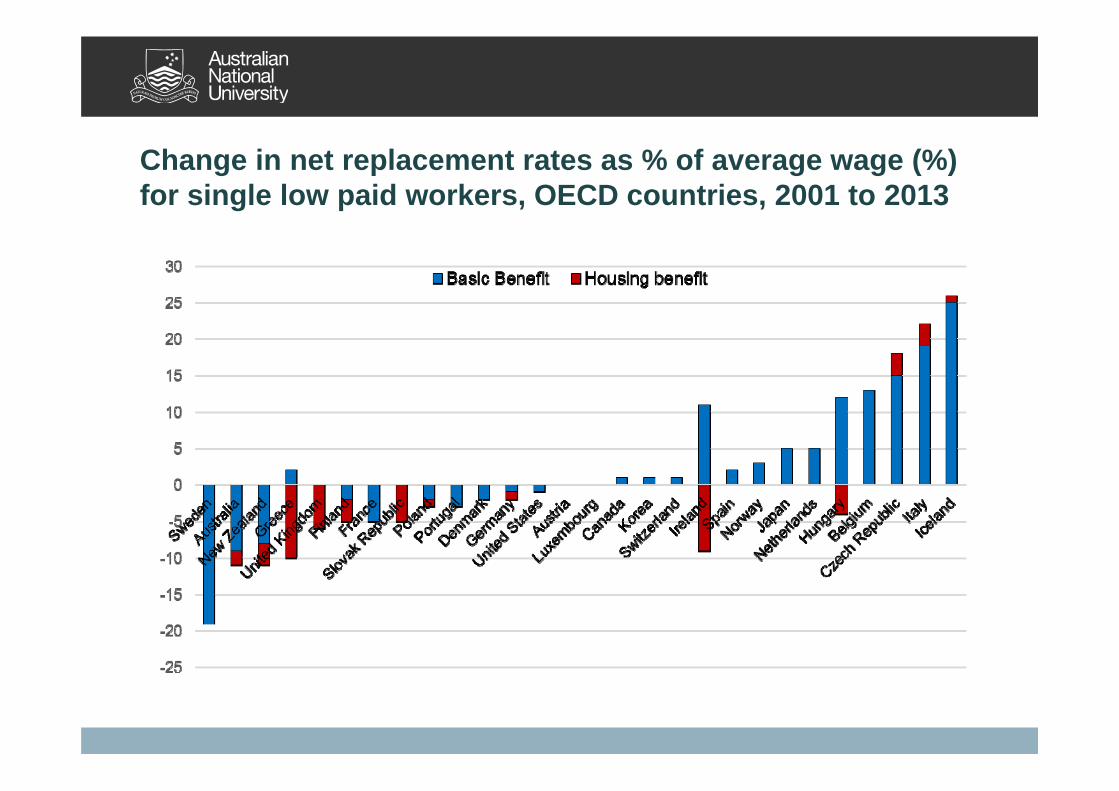
Change in net replacement rates as % of average wage (%) for single low paid workers, OECD countries, 2001 to 2013

Trends in the number (000s) of unemployed and unemployment benefit recipients, 1978 to 2009
20
0
100
200
300
400
500
600
700
800
900
1000
Unemployed Recipients

Australian challenges
21
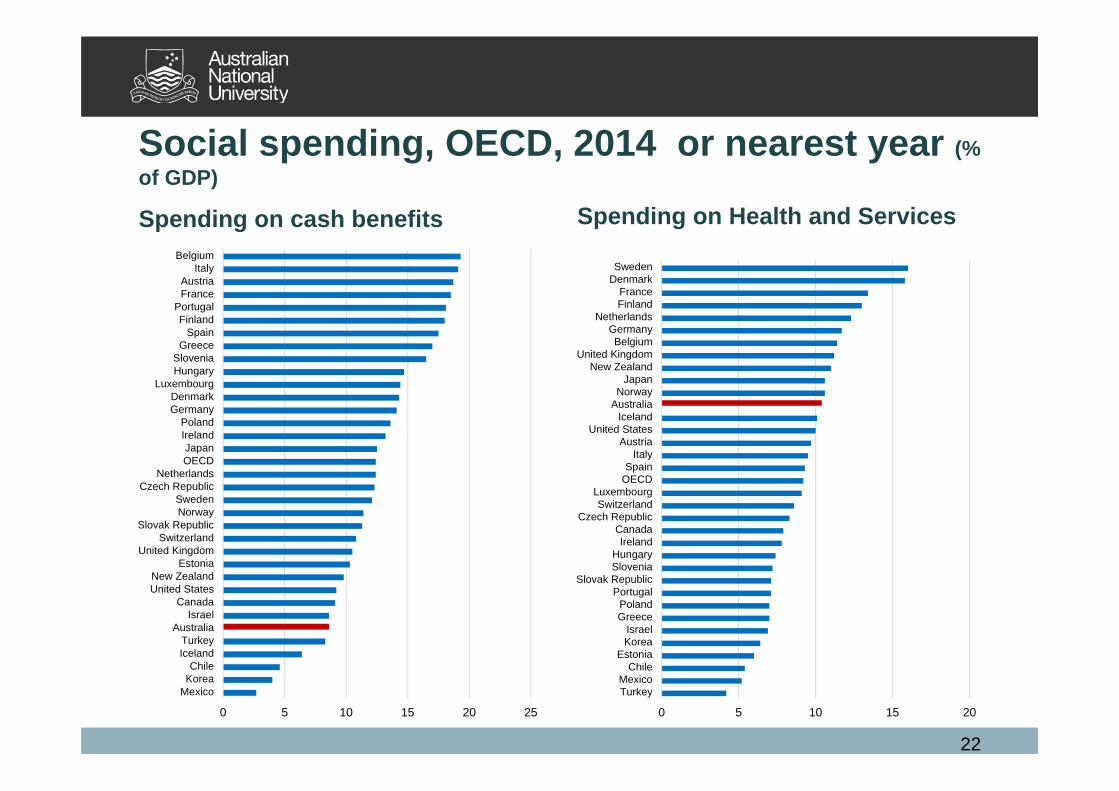
Social spending, OECD, 2014 or nearest year (% of GDP)
Spending on cash benefits Spending on Health and Services
22
0 5 10 15 20 25
MexicoKoreaChile
IcelandTurkey
AustraliaIsrael
CanadaUnited StatesNew Zealand
EstoniaUnited Kingdom
SwitzerlandSlovak Republic
NorwaySweden
Czech RepublicNetherlands
OECDJapan
IrelandPoland
GermanyDenmark
LuxembourgHungarySlovenia
GreeceSpain
FinlandPortugal
FranceAustria
ItalyBelgium
0 5 10 15 20
TurkeyMexico
ChileEstonia
KoreaIsrael
GreecePoland
PortugalSlovak Republic
SloveniaHungary
IrelandCanada
Czech RepublicSwitzerland
LuxembourgOECDSpain
ItalyAustria
United StatesIceland
AustraliaNorway
JapanNew Zealand
United KingdomBelgium
GermanyNetherlands
FinlandFrance
DenmarkSweden

The share of social benefits going to low income households varies considerably across OECD Percentage of public social benefits in cash paid to the lowest and highest quintiles, total population, 2011
23
0
10
20
30
40
50
60
Lowest quintile (↘) Highest quintile
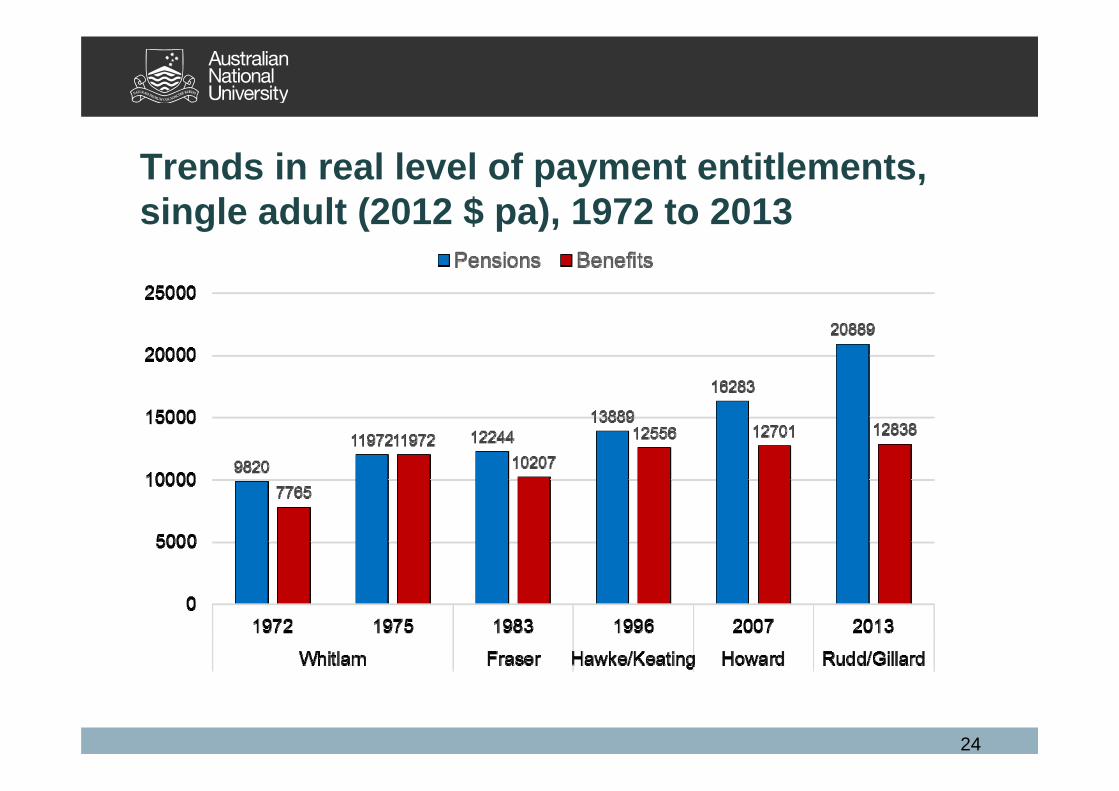
Trends in real level of payment entitlements, single adult (2012 $ pa), 1972 to 2013
24

The growing divergence between benefits and pensions
Payments for single person as % of median equivalent income
Peter Whiteford, Crawford School of Public Policy, [email protected] 25
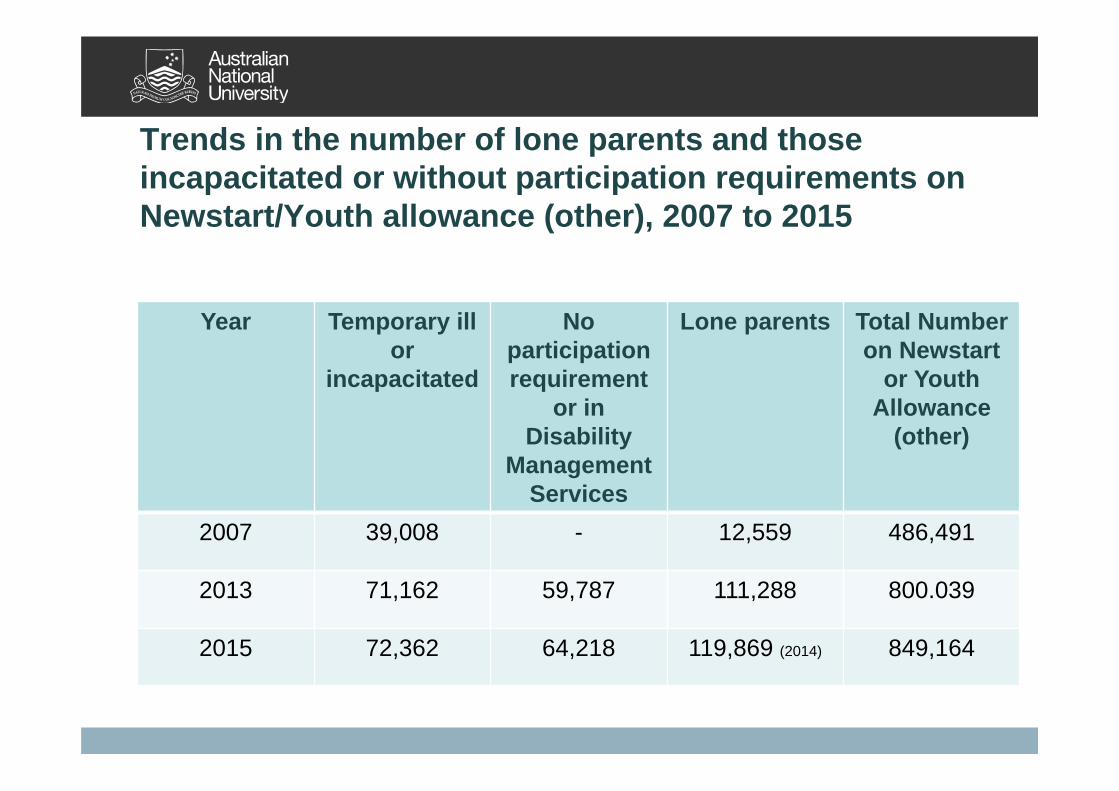
Trends in the number of lone parents and those incapacitated or without participation requirements on Newstart/Youth allowance (other), 2007 to 2015
Year Temporary ill or
incapacitated
No participation requirement
or in Disability
Management Services
Lone parents Total Number on Newstart
or Youth Allowance
(other)
2007 39,008 - 12,559 486,491
2013 71,162 59,787 111,288 800.039
2015 72,362 64,218 119,869 (2014) 849,164

Summary and Conclusions
• Social insurance can be provided through a range of mechanisms, each with advantages and disadvantages
• The degree of protection also needs to take account of duration and coverage, employment services and other supports
• Is Australia residualising the unemployed (and other less favoured groups)?
27

IMPROVING EQUITY IN AUSTRALIAN RETIREMENT
INCOME: CAN WE LEARN FROM OTHER COUNTRIES’ EXPERIENCES
WITH SOCIAL INSURANCE?
SIOBHAN AUSTENSCHOOL OF ECONOMICS AND FINANCE
CURTIN UNIVERSITY
FRAMING RETIREMENT INCOME AS AN INSURANCE ISSUE

FRAMING RETIREMENT INCOME AS AN INSURANCE ISSUE

FRAMING RETIREMENT INCOME AS AN INSURANCE ISSUE

FRAMING RETIREMENT INCOME AS AN INSURANCE ISSUE
FRAMING RETIREMENT INCOME AS AN INSURANCE ISSUE
Retirement Income Systems: an Institutional response to longevity risk

INSTITUTIONS OF LONGEVITY INSURANCE FROM AN
INTERNATIONAL PERSPECTIVE
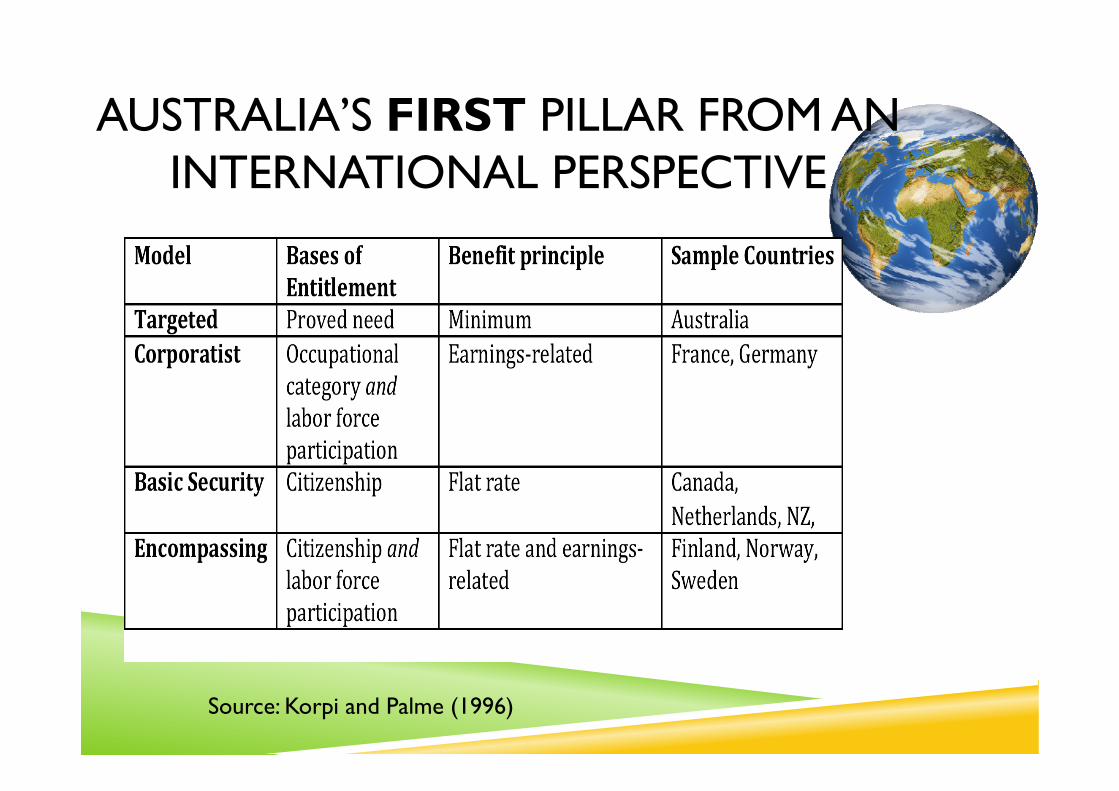
AUSTRALIA’S FIRST PILLAR FROM AN INTERNATIONAL PERSPECTIVE
Source: Korpi and Palme (1996)

AUSTRALIA’S SECOND PILLAR FROM AN INTERNATIONAL PERSPECTIVE
Type of earnings‐related pensionscheme
Australia NoneFrance Defined benefit /pointsGermany PointsCanada Defined benefitNetherlands Defined benefitNZ NoneFinland Defined benefitNorway Notional accountsSweden Notional accounts
Source: OECD (2013) Pensions at a Glance 2013, Table 3.6
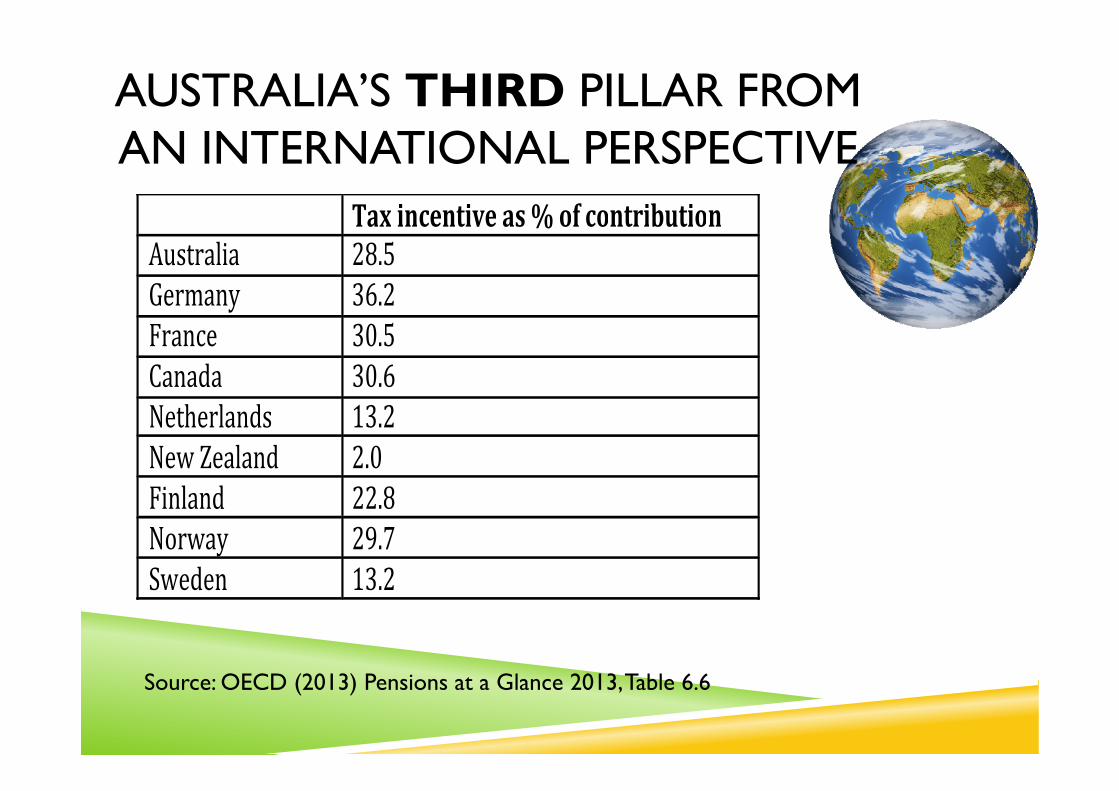
AUSTRALIA’S THIRD PILLAR FROM AN INTERNATIONAL PERSPECTIVE
Source: OECD (2013) Pensions at a Glance 2013, Table 6.6
Tax incentive as % of contributionAustralia 28.5Germany 36.2France 30.5Canada 30.6Netherlands 13.2New Zealand 2.0Finland 22.8Norway 29.7Sweden 13.2
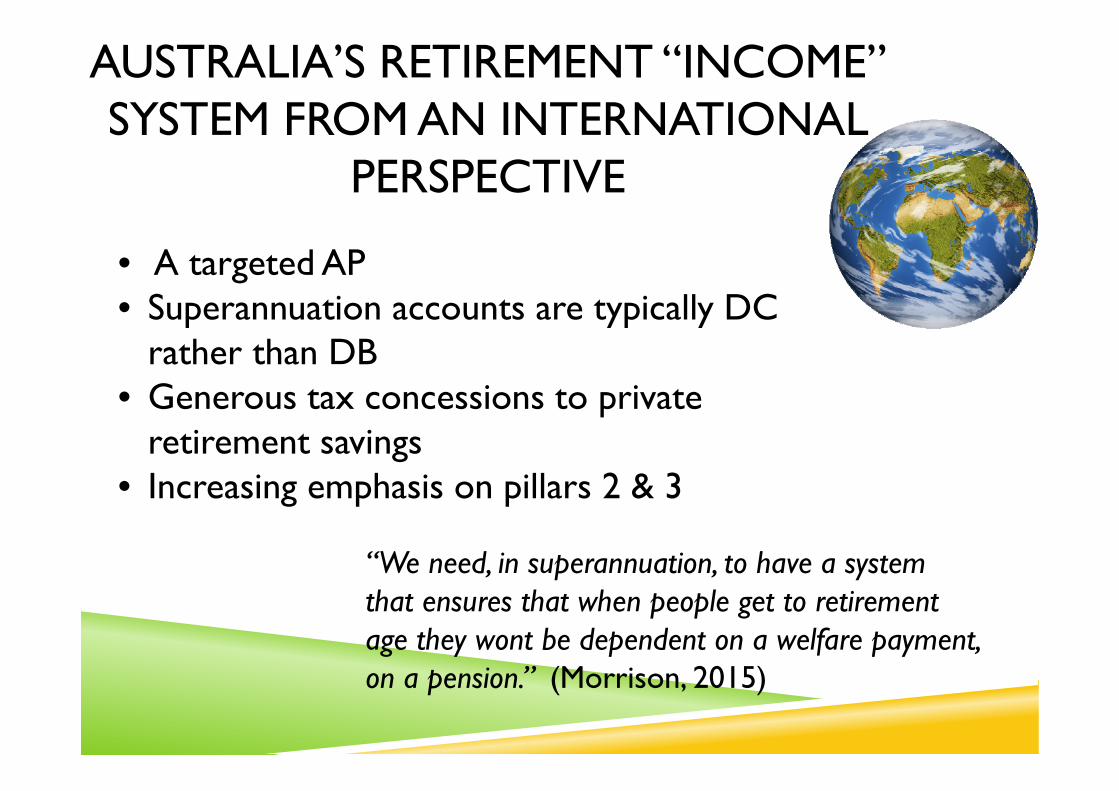
AUSTRALIA’S RETIREMENT “INCOME” SYSTEM FROM AN INTERNATIONAL
PERSPECTIVE
• A targeted AP• Superannuation accounts are typically DC
rather than DB• Generous tax concessions to private
retirement savings• Increasing emphasis on pillars 2 & 3
“We need, in superannuation, to have a system that ensures that when people get to retirement age they wont be dependent on a welfare payment, on a pension.” (Morrison, 2015)

EQUITY ISSUES?The shifting of risk onto individuals challenges
Rawlsian notions of justice

AUSTRALIA’S EQUITY PERFORMANCE FROM AN INTERNATIONAL PERSPECTIVE
Source: OECD (2013) Pensions at a Glance 2013, Table 5.5
Old age poverty rate(%withincome>50%below
medianincome)Australia 35.5France 5.4Germany 10.5Canada 7.2Netherlands 1.4New Zealand 12.5Finland 9.7Norway 5.5Sweden 9.5
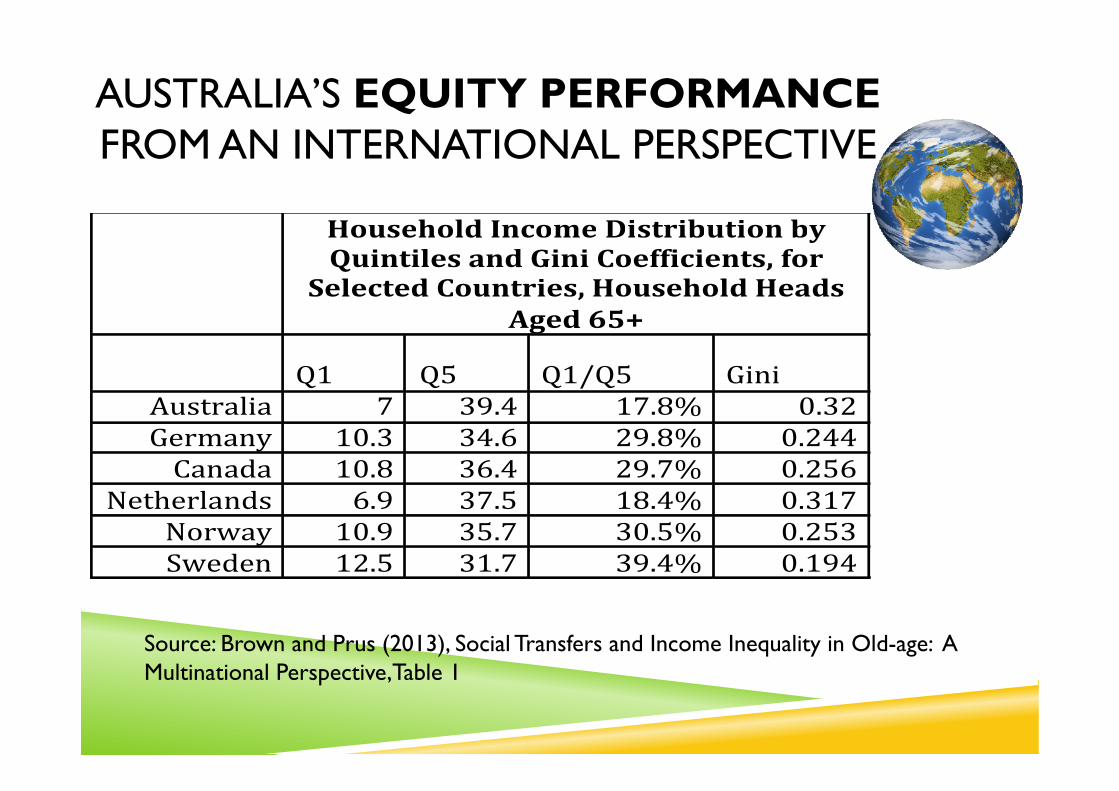
AUSTRALIA’S EQUITY PERFORMANCE FROM AN INTERNATIONAL PERSPECTIVE
Source: Brown and Prus (2013), Social Transfers and Income Inequality in Old-age: A Multinational Perspective,Table 1
Household Income Distribution byQuintilesandGiniCoefficients,for
SelectedCountries,HouseholdHeadsAged65+
Q1 Q5 Q1/Q5 Gini
Australia 7 39.4 17.8% 0.32Germany 10.3 34.6 29.8% 0.244Canada 10.8 36.4 29.7% 0.256
Netherlands 6.9 37.5 18.4% 0.317Norway 10.9 35.7 30.5% 0.253Sweden 12.5 31.7 39.4% 0.194
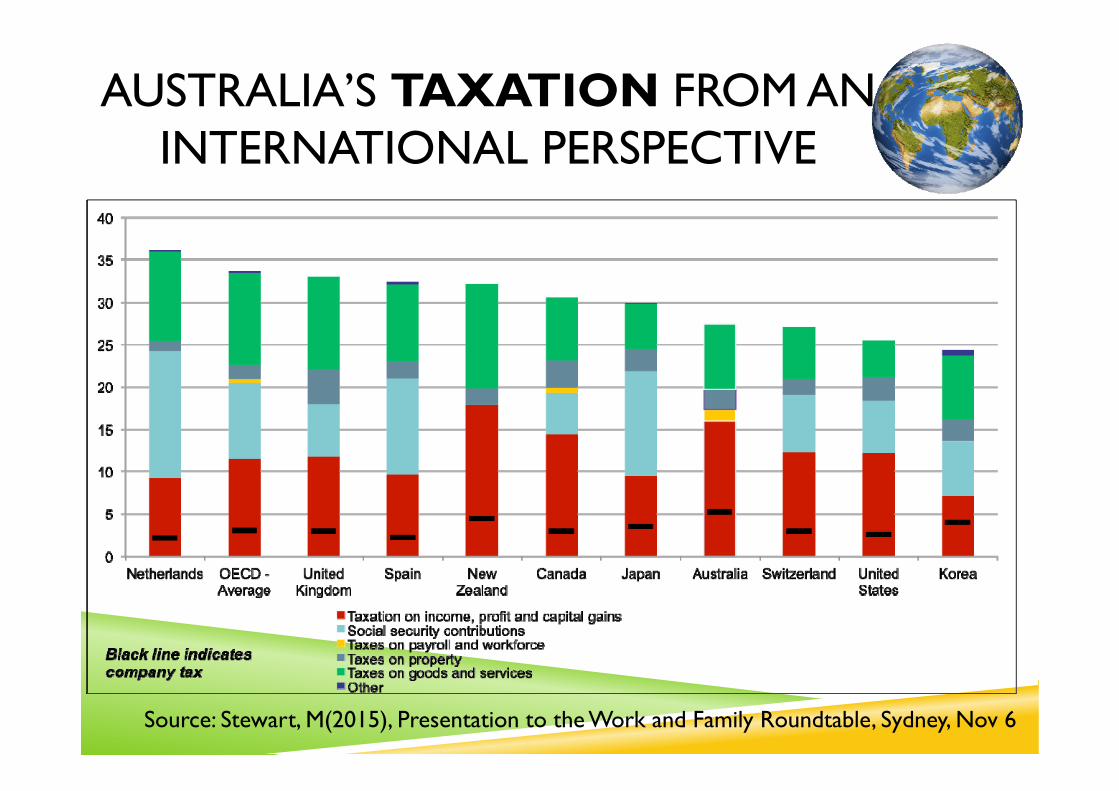
AUSTRALIA’S TAXATION FROM AN INTERNATIONAL PERSPECTIVE
Source: Stewart, M(2015), Presentation to the Work and Family Roundtable, Sydney, Nov 6

IMPROVING EQUITY IN AUSTRALIAN RETIREMENT
INCOME: WE CAN LEARN FROM OTHER COUNTRIES’ EXPERIENCES
WITH SOCIAL INSURANCE
SIOBHAN AUSTENSCHOOL OF ECONOMICS AND FINANCE
CURTIN UNIVERSITY
The University of Sydney Page 1
The Past and Future of Universal Health Care: A political perspective
Presented byJames GillespieMenzies Centre for Health PolicySydney School of Public Health

The University of Sydney Page 2
Outline
– Concepts of Universality and health insurance– Limits of universality: coverage; out of packet payments.– Reshaping Medicare: 1. price signals?– Reshaping Medicare: 2. waste and inefficiency– Reshaping Medicare: 3 Models of care and funding
– The WentWest proposal.

The University of Sydney Page 3
Concepts of universality
– The goal of universal health coverage is to ensure that all people obtain the health services they need without suffering financial hardship when paying for them. This requires:
• a strong, efficient, well-run health system;• a system for financing health services; • access to essential medicines and technologies;• a sufficient capacity of well-trained, motivated health workers.
WHO. World Health Report 2010
The University of Sydney Page 4
Medicare and universality
– Medicare ‘has had as one of its two principal foundations a concern for equity - equal access to equal care for equal need for rich and poor alike -in an age of high health care costs. In combination with Medicare's other foundation - efficiency through control of health care costs - it has allowed Australia to steer a middle course through the minefield of health care financing’
Stephen Leeder

The University of Sydney Page 5
Questions for universal coverage in Australia
– Unequal access – under serviced sectors: Indigenous, rural and remote– What should be included within the scope of subsidised or ‘free’ health
care? – What level of contribution (if any) should be expected from individuals? – What place is there for a parallel system of generously subsidized private
health insurance: allowing ‘queue jumping’ to those who can afford its premiums?

The University of Sydney Page 6
Australian perspectives
– Health and welfare– Health and the welfare state
• Solidarity or middle class welfare?• Private health insurance: undermining universality?
– Medicare as Industry policy• health as an industry, not just a welfare system• Medicare as a system for remunerating the medical profession.
– The dominance of fee-for-service
– The changing burden of disease• From short term acute episodes to chronic illness, long term care.

The University of Sydney Page 7
Is Australian health care spending sustainable?
0.0
2.0
4.0
6.0
8.0
10.0
12.0
14.0
16.0
18.0
Chart Title
Australia Canada United Kingdom United States

The University of Sydney Page 8
Reshaping Medicare 1
– Price signals? – No lack of co-payments and out-of-pocket payments. Incremental
growth has led to poorly designed structure and cumulative effects– Political barriers:
• Barriers to deliberate action• ‘Policy drift’: Freezing of GP rebate and creeping co-payments.
another political crisis as in early 2000s?

The University of Sydney Page 9
Out of pocket payments: Australia Compared.
Source: OECD Health Data: Health expenditure and financing: OECD Health Statistics (database
0.0
5.0
10.0
15.0
20.0
25.0
30.0
35.0
40.0
HEALTH EXPENDITURE Out-of-pocket expenditure on health, % of current expenditure on health 2013
(or nearest year)

The University of Sydney Page 10
Reshaping Medicare 2.
– Waste and efficiency– The area of most activity: MBS Review, large research activity on ‘value
in health care’. – Politics of professional entitlements, especially amongst specialist groups
and entrenched cultures of system gaming. Change will be difficult after low hanging fruit are harvested.
The University of Sydney Page 11
Reshaping Medicare 3.
– Changing models of care, integrating services, consumer engagement.– The most challenging area: where Medicare meets the changing burden
of disease.– Building patient-centred care
– Experiments with payment and incentive systems– WentWest/Menzies/Ernst and Young: Australian Medical Home project.

The University of Sydney Page 12
Paying the doctor

The University of Sydney Page 13
Dilemmas of policy reform
Medicare and fee for service as settled policy• 1951. The end of capitation and the entrenchment of publicly
subsidized fee-for-service• Part of the deal between AMA, medical profession and government:
unquestioned element in Medibank and Medicare.• A system based on public funding (c. 65%) and private provision (c.
65%)The rise of chronic illness and the breakdown of consensus.

The University of Sydney Page 14
Experiments with Medicare
– Chronic illness and the continuity of care • 1990s: Coordinated Care Trials experimented with pooled payments.• 1999 Enhanced Primary Care package: care planning for chronic illness• 2004 Strengthening Medicare: added allied health services to chronic
disease plans• 2005 Chronic Disease Management items.• 2006 Better Access Mental Health Plans• 2007 Allied health group services within Diabetes 2 GP management plans• 2011 Better Start to Disability: children’s care planning

The University of Sydney Page 15
The new consensus
– there is increasing international evidence about the benefits of a blended payment system – mixing fee for service, pre-payment and pay for performance with salaried arrangements.
Standing Council on Health. National Primary Care Strategic Framework. April 2013.
– While [fee for service] is a practical way of reimbursing service providers for isolated episodes of care, it does not provide incentives for the efficient management of care delivered to patients requiring ongoing health care.
Primary Health Care Advisory Group. Discussion Paper (2015)

The University of Sydney Page 16
Business Council of Australia and reform
– The system which has serviced Australia well for many decades is built on an incentive structure which can create adverse costs and perverse behaviours. Australia’s funding system is built on fee-for service and fee –for –service can incentivise volume of care….
– Putting Australia’s health system on a path of continuous improvement will require disruption of existing institutions.
Business Council of Australia The Future of Health: A Discussion Starter. October 2015.
The University of Sydney Page 17
Turnbull government
– Medicare is based on a fee for service model. This works well for episodic and acute care.But what about the one in two Australians who now live with some form of chronic disease? Is fee for service the appropriate funding model for these patients, who have ongoing expensive costs and require ongoing interaction with multiple health professionals for the rest of their lives?The fact the Medicare services are now hitting one million per day suggests not. And its little surprise really, when you consider there is no incentive for doctors to work with other health professionals for the good of patients with complex conditions who need different types of care.
– Sussan Ley. 28 October 2015

The University of Sydney Page 18
The implementation gap
– Reform continues to take a ‘top-down’ command and control perspective.– Assumptions that incentive structures can be changed, and this will lead
to changes in behaviour.
– Complexity of general practice: little is known about variety of operating cost and business models that underlie general practice –– how incentives play out and how to move to optimal patient
management.– Reform that ignores the conditions of general practice will come unstuck

The University of Sydney Page 19
Fee-for-service and the reform of Medicare.
– The growth in demand for and expenditure on health care is exacerbated by the current fee-for-service model:– Unmanaged growth in volume and the potential duplication of services– Growing financial and professional challenges for GPs– Patients experiencing disconnected care and an increasing level of co-
payments.– Undefined variation in the quality or type of care delivered through
General Practice and primary care, and we lack a mechanism to rewardproviders for delivering high-quality care.

The University of Sydney Page 20
Changing the delivery of primary care within Medicare: Optimising the solution for consumers by disregarding boundaries

The University of Sydney Page 21
New models of care within the Australian health care system (Chart: EY 2015)

The University of Sydney Page 22
Conclusions
– Health reform in Australia: beyond the ‘Big Bang’
– Towards a politics of incremental and experimental change
– Medicare is not just part of the welfare state:– Medicare as ‘industry policy’ in Australia’s mixed health economy.

The University of Sydney Page 23
References
– A-m Boxall and J.A. Gillespie. Making Medicare: the politics of universal health care in Australia. UNSW 2013
– Business Council of Australia The Future of Health: A Discussion Starter. October 2015
– Nicole Mckee, ‘Medical Home Potential’, MJA InSight, 8 June 2015.– Primary Health Care Advisory Group. Discussion Paper (2015)– Standing Council on Health. National Primary Care Strategic Framework.
April 2013– WentWest, EY, Menzies Centre for Health Policy, A Model for Australian
General Practice: the Australian Person-centred Medical Home. November 2015.
– World Health Organization. Health Systems Finance: the Road to Universal Coverage. Geneva
Enabling active citizenship? Disability services insurance in Australia and lessons from international experience
Karen FisherSocial Policy Research Centre, UNSW Australia
Academy of Social Sciences of Australia, 2015 Symposium, Social insurance for the 21st Century? Exploring pathways for a sustainable, equitable and effective welfare system, Canberra, 17 November

• Australian policy context
• NDIS policy and implementation
• Social policy parallels
• Implications
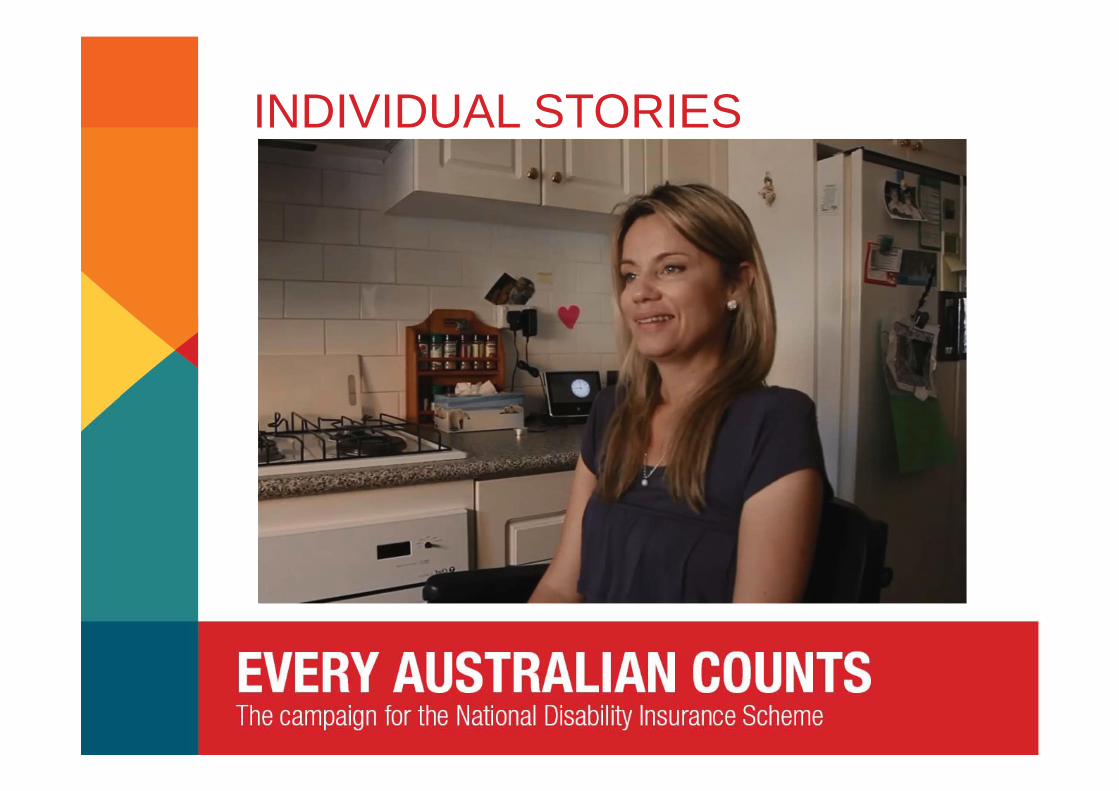
When I first opened up the door, I knew that this was it, was freedom ... these days I’ve got a smile on my face, got my own food and can come and go as I please … I’m just loving it.
Outline
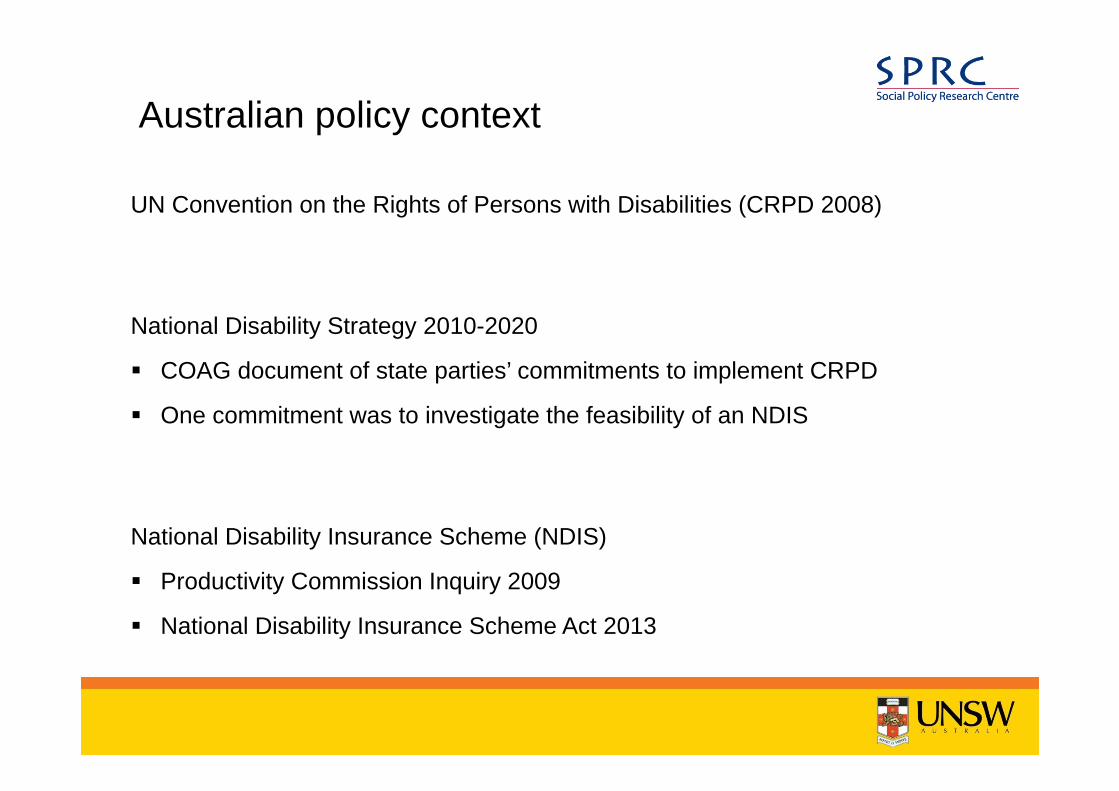
UN Convention on the Rights of Persons with Disabilities (CRPD 2008)
National Disability Strategy 2010-2020
COAG document of state parties’ commitments to implement CRPD
One commitment was to investigate the feasibility of an NDIS
National Disability Insurance Scheme (NDIS)
Productivity Commission Inquiry 2009
National Disability Insurance Scheme Act 2013
Australian policy context
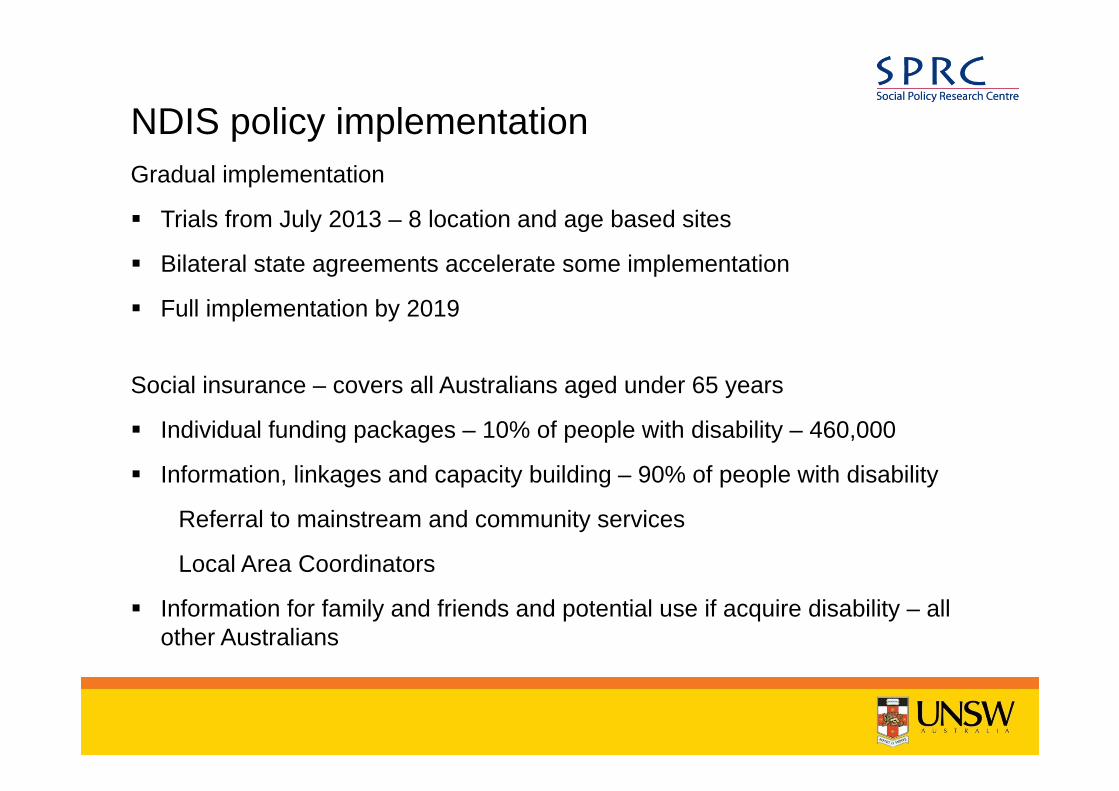
Gradual implementation
Trials from July 2013 – 8 location and age based sites
Bilateral state agreements accelerate some implementation
Full implementation by 2019
Social insurance – covers all Australians aged under 65 years
Individual funding packages – 10% of people with disability – 460,000
Information, linkages and capacity building – 90% of people with disability
Referral to mainstream and community services
Local Area Coordinators
Information for family and friends and potential use if acquire disability – all other Australians
NDIS policy implementation
National Disability Insurance Agency (NDIA) manages a fund
Fund sources
0.5% added to Medicare Levy
Reorganisation of federal-state transfers from National Disability Agreements
Fund predicted to be unsustainable from 2020
General federal revenue?
Financial viability relies on
NDIS enabling economic participation of people with disability and carers
Most people with disability using mainstream community services
NDIS financing
NDIA assessor determines eligibility
NDIA planner develops an individual plan with the person
Outcome goals
Reasonable and necessary supports to achieve goals
Costed with price guide
Package allocated to the person
Self manage (or with a nominee) or financial intermediary agency
Spend on workers employed by the person, service providers registered with NDIA, equipment
NDIS individual package process

17,000 individual packages
$38,000 p.a. average, 70% under $30,000
6% self-manage the package, 61% agency managed, 33% mixed
NDIS to June 2015
Individualised funding
Direct payments, personal budgets
Funded through general taxation – none are social insurance based
Rationales
Human rights – outcomes and control
Consumerist – efficiency and choice
Impact depends on entitlement or rationed approach – eligibility, package size, access to mainstream services
Accident compensation eg. ACC NZ – personal injury
Levy organisations and activities likely to cause injury and general taxation
Was lump-sum, now time-limited plans, shifting to self-managed packages
Social policy parallels

Risks to NDIS
Cost shifting between NDIS and other social support
Workforce conditions in individualised settings
Pressure on cost and quality from privatising support
Inequality of access – complex needs, living in institutions or corrective services
High transaction costs of capacity and administrative process
Strengths of NDIS
Gradual identification of problems and policy response through trials
Wider context of human rights through CRPD and National Disability Strategy
Platform to generalise to other services – ageing, children, Indigenous?
Implications for social insurance and welfare states

www.sprc.unsw.edu.au/research/areas/disability/
[email protected] 9385 7800@KarenRFisher
Disability policy research and publications
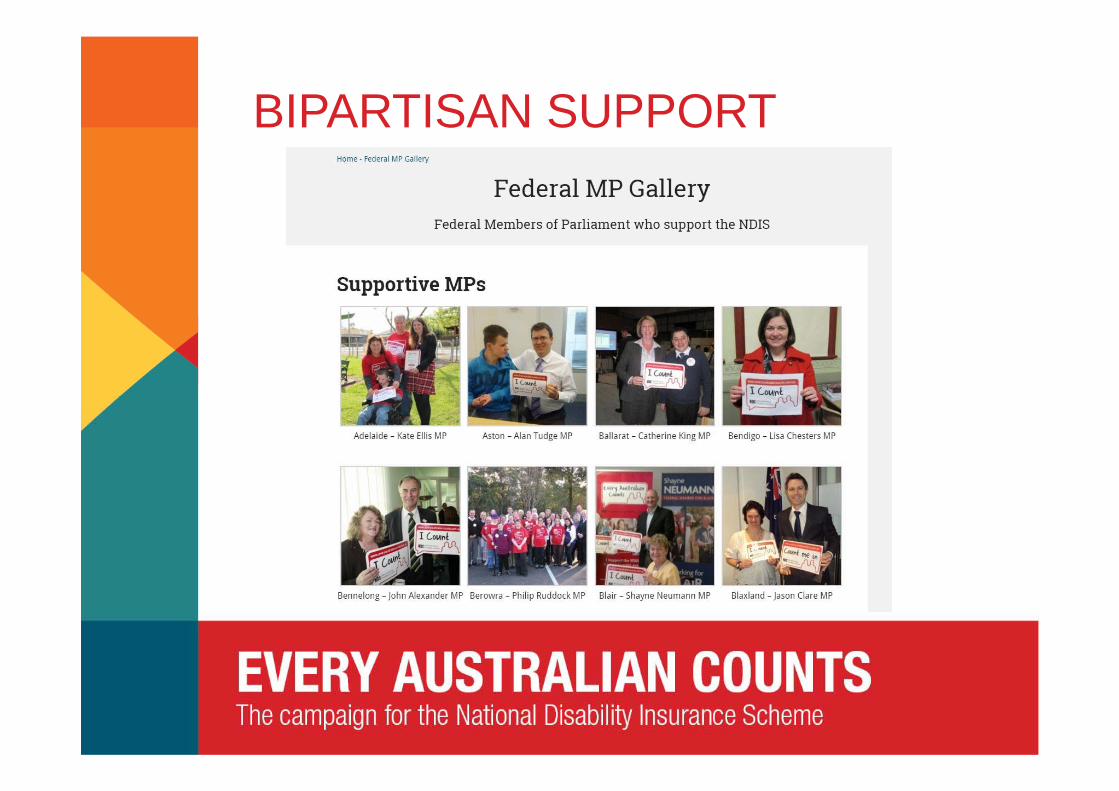
BIPARTISAN SUPPORT

BIPARTISAN SUPPORT

INDIVIDUAL STORIES

INDIVIDUAL STORIES

INDIVIDUAL STORIES
INDIVIDUAL STORIES

Housing CampaignCAMPAIGN ACTIONS

NEPEAN BLUE MOUNTAINS ROLLOUT

NEPEAN BLUE MOUNTAINS ROLLOUT
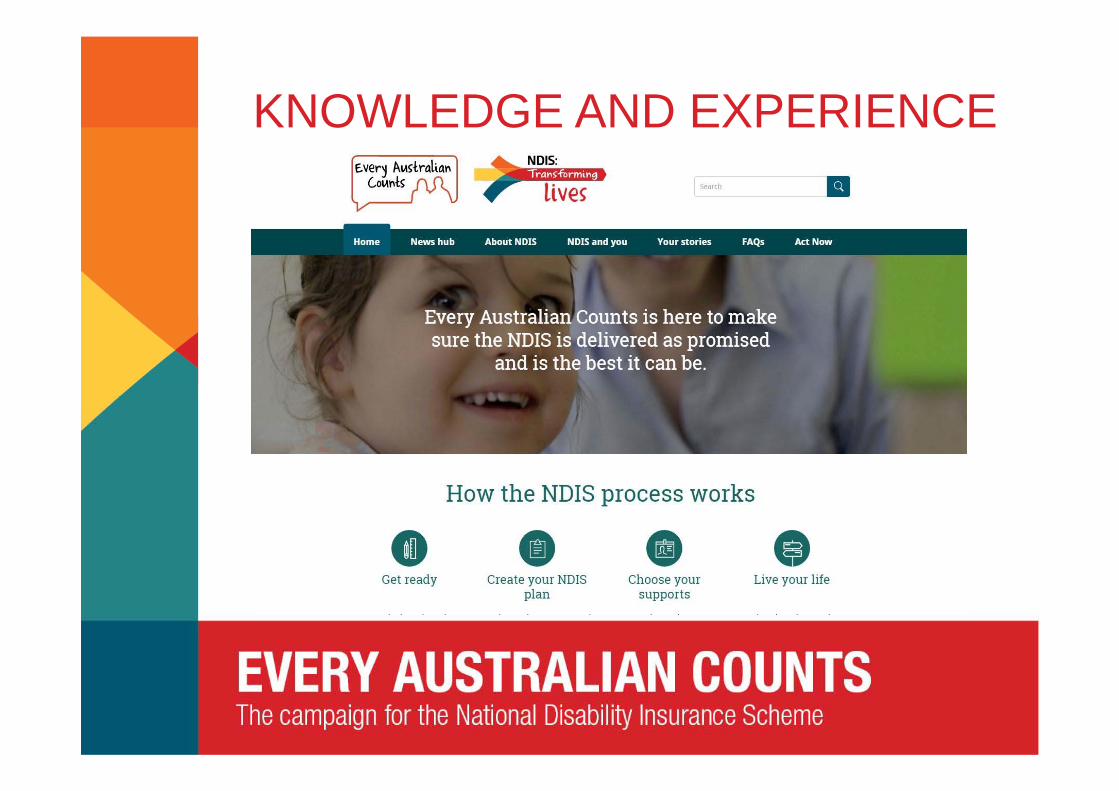
KNOWLEDGE AND EXPERIENCE

NDIS TRANSFORMING LIVES
SocialInsuranceAdvocacyintheUnitedStates:TheShortStoryandLessonsof“SocialSecurityWorks”
EricR.Kingson*NancyJ.Altman**
FoundingCo‐directors,SocialSecurityWorksFoundingCo‐chairs,StrengthenSocialSecurityCoalition
Preparedfor
ReinventingtheWelfareState?TheFutureofSocialInsuranceinAustraliaandInternationallyAnnualSymposiumoftheAcademyofSocialSciencesinAustralia
Canberra,AustraliaNovember17,2015
*EricKingsonisProfessoratSyracuseUniversity’sSchoolofSocialWork**NancyAltmanChairsthePensionRightsCenterinWashington,DC

2
The story, strategies & lessons
Definition of terms
Changing Narratives: 1935 to present
Social Security Works: Advocacy Approach, Strategies & Outcomes
Lessons

3
Shifting Narratives:
Emergence in Economic Crisis of 1930s Narrative
Consensus & Incremental Expansion Narrative
Easy Votes Come to an End Narrative
Leninist Strategy, Generational Conflict, Unaffordability Narrative
Austerity Narrative
Retirement Crisis Narrative

4
New attack on Social Security Outgrowth of 75 years of attacks
$1 billion from Peterson advocacy organization
Defining SS as cause to long‐term deficit/debt problems
Elite consensus
More difficult than 2005
Few champions
Focus on “How Much to Cut?” and “Everyone Knows
Fast track/Behind closed doors strategy
Austerity Narrative & Strategy
5
Defending & Reframing Debate
Defense and offense
Take issue to public
Support champions
Redefine Social Security as a solution
Build consensus for expansion

6
Our Approach
Build sustainable capacity : partners & SSW
Inside/outside strategy
Progressive legislation to promote expansion
Widen policy frame
Internet media strategy

Critical Roles of AFL‐CIOand Netroots drawing line in the sand
Progressive Organizations Shifted from Defense to Offense
Social Security Opponents Arguing Increasingly on Expansion Proponent’s Turf
Growing Number of Congressional Champions
Growing Number of Legislative Proposals
2014 Election Was Wake‐Up Call for Democrats
Rediscovery of Social Security as Issue by Many Democrats
Growing Awareness of Impending Retirement Income Crisis
Shift in Media Coverage
Expanding Social Security is Gaining Traction

Selected Recent Social Security Expansion Bills
Better Inflation Protection
Across the Board Benefit Increase
Benefit to Support Family Care or Medical Leave
Other Special BenefitImprove‐ment
ExtendsSolvency
Social Security Expansion ActS. 731 ‐‐ Sen. Bernie Sanders (I – VT)
The Social Security 2100 ActH.R. 1391 ‐‐ Rep. John Larson (D‐CT‐1)S. 1904 Sen. Richard Blumenthal
Protecting and Preserving Social Security Act S. 960 ‐‐ Sen. Mazzie Hirono(D‐AK) HR.1811 ‐‐ Rep. Theodore Deutch (D‐FL‐21)
Social Security Enhancement & Protection Act H.R. 1756 ‐‐ Rep. Gwen Moore (D‐WI‐4)
SAFE Social Security Act S. 1940 Sen. Brian Schatz (D‐HI)
Caregiver Credit ActH.R. 3377 Rep. Nita Lowey (D‐NY‐)
h
CPI‐E Act H.R. 3351 Rep. Mike Honda (D‐CA‐1)
Lessons
Coalition with broad reach critical
Foundation other sustainable funding
Strong & committed staff
Knowing what needs to be done/Flexible approach
Thoughtful messagingFrame issues in terms of values
Play on own courtRetirement Income Crisis
Engage grassroots
Internet strategies: alternative media, outreach & fundraising
Social Security Works!Why Social Security Isn’t Going Broke and
How Expanding It will Help All of Us (The New Press, January, 2015)
11
The Future of Social Security in Australia17 November 2014
Serena WilsonDeputy Secretary
Department of Social Services
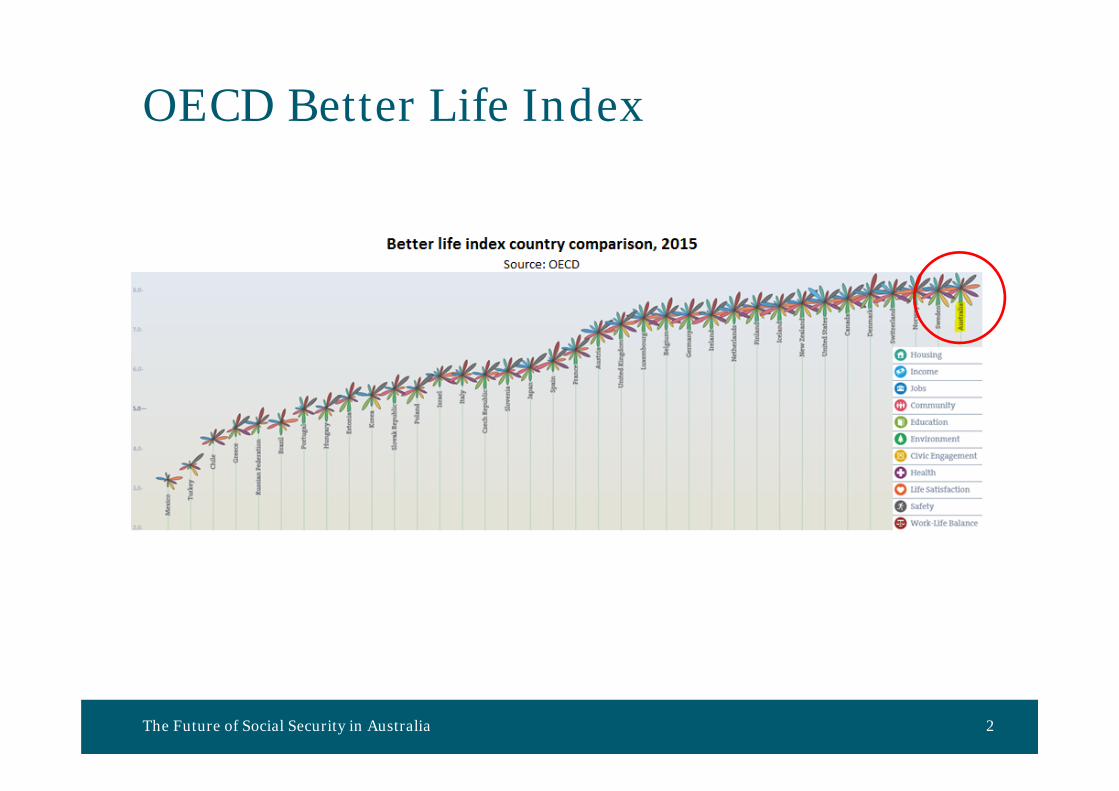
OECD Better Life Index
The Future of Social Security in Australia 2
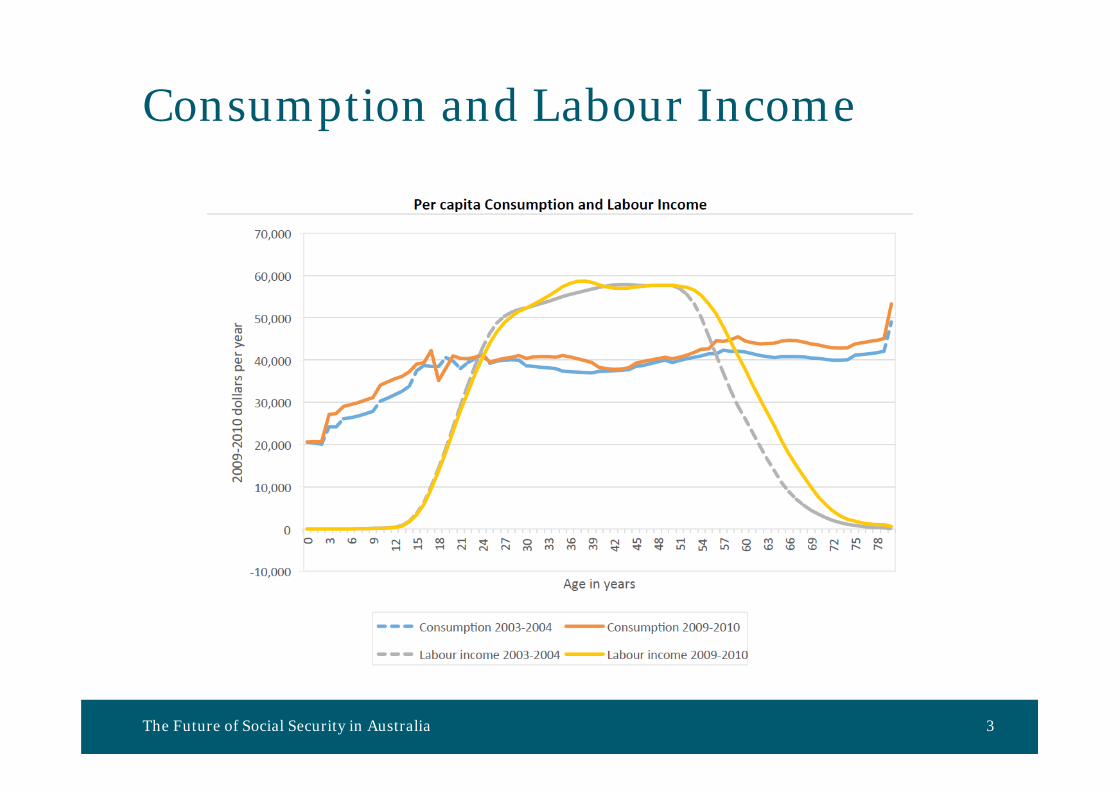
Consumption and Labour Income
The Future of Social Security in Australia 3
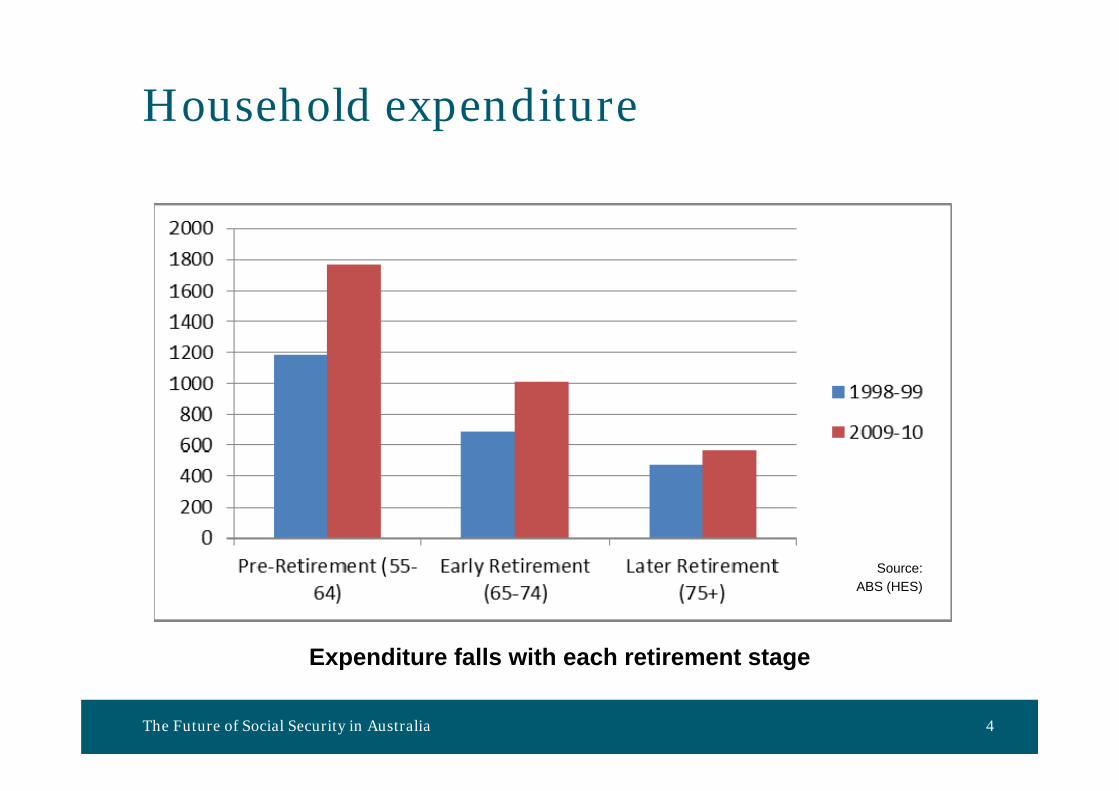
Household expenditure
The Future of Social Security in Australia 4
Expenditure falls with each retirement stage
Source: ABS (HES)

The Future of Social Security in Australia 5
Welfare Expenditure (excludes Health)
Thank youSerena WilsonDeputy SecretaryDepartment of Social [email protected]
The Future of Social Security in Australia 6

Zhiming Cheng, Centre for the Health Economy, Macquarie UniversityRussell Smyth, Department of Economics, Monash University
Social Insurance in China: Current and Future State
2015 Academy of the Social Sciences in Australia Annual Symposium
Social insurance in China
2
• A relatively new concept
• Not a completely new system
• Socialist ‘from-cradle-to-grave’ welfare system
• Reforms and massive layoffs of state workers dismantled the old system
• The 2008 Labour Contract Law began to establish the legal framework

The 2011 Social Insurance Law
3
• The first national social insurance legal framework1) Enroll all employees in five social insurance programmes + housing provident fund2) Contribution bases and rates vary across cities/provinces3) The biggest system in the world
Table 1 National Enrolment in, and Contribution to, Social Insurance, 2014Pension insurance
Medical insurance
Work‐related injury insurance
Unemployment insurance
Maternity insurance
Housing provident fund
Enrolment (million)
842 597 206 170 170 119
Received contribution (billion RMB)
3,983 1,296
Source: Ministry of Housing and Urban-Rural Development, 2015; Zhang et al., 2015.
Notes: 1. The pension insurance scheme includes the Basic Pension Insurance for Urban and Rural Residents for non-employees, which merged the New Rural Social Pension Insurance and Urban Resident Social Pension Insurance in 2014; 2. The average exchange rate in December 2014: 1 AUD = 5 RMB.
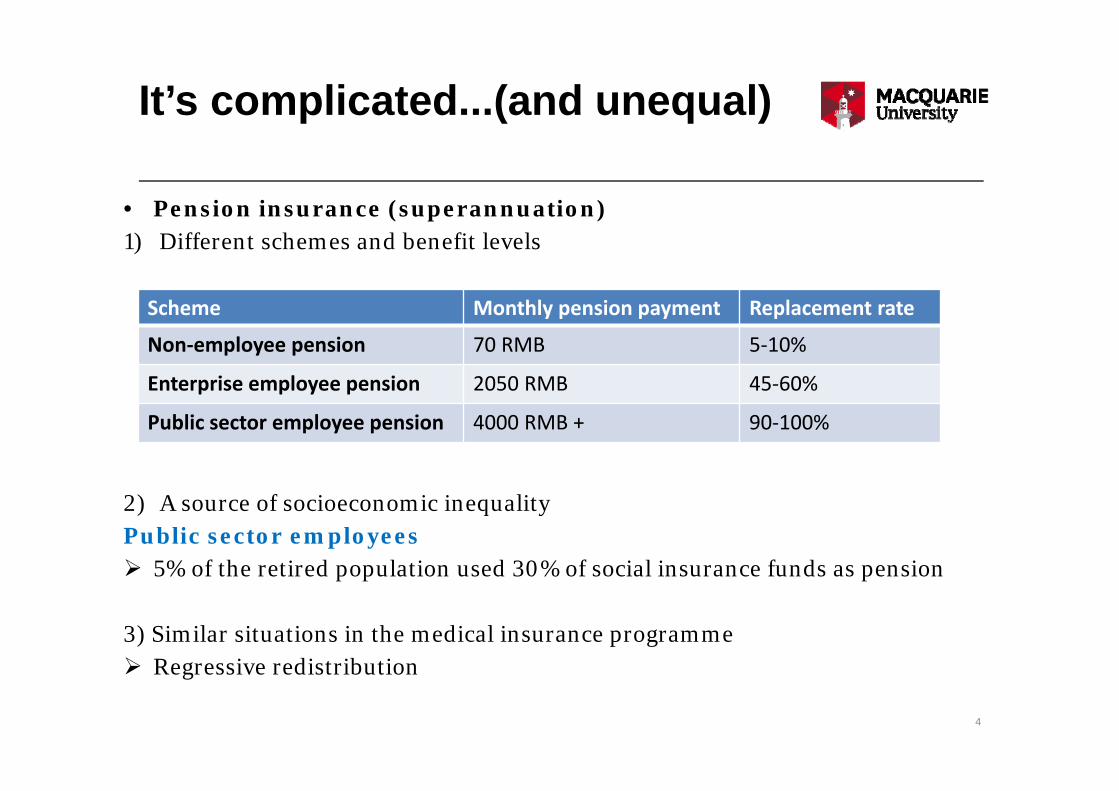
It’s complicated...(and unequal)
4
• Pension insurance (superannuation) 1) Different schemes and benefit levels
2) A source of socioeconomic inequalityPublic sector employees 5% of the retired population used 30% of social insurance funds as pension
3) Similar situations in the medical insurance programme Regressive redistribution
Scheme Monthly pension payment Replacement rate
Non‐employee pension 70 RMB 5‐10%
Enterprise employee pension 2050 RMB 45‐60%
Public sector employee pension 4000 RMB + 90‐100%

Recent developments
5
• Rural-urban migrants Better access to social insurance (if they have a labour contract)
• Rural residents and urban non-employees Covered by the non-employee pension and medical insurance
• Public sector employees Before Jan 2015: did not need to contribute to social insurance After Jan 2015: need to contribute; but salaries are increased to offset
• From 2016, allow 30% of the pension fund (600 billion RMB) to invest in share market

The future
6
• Sustainability is the biggest problem
In 2014, 22 out of 31 provinces had pension funds in deficit
Annual national surplus of pension insurance fund (billion RMB)
100 99
196 192
129
150
50
100
150
200
250
2009 2010 2011 2012 2013 2014
Billion
RMB
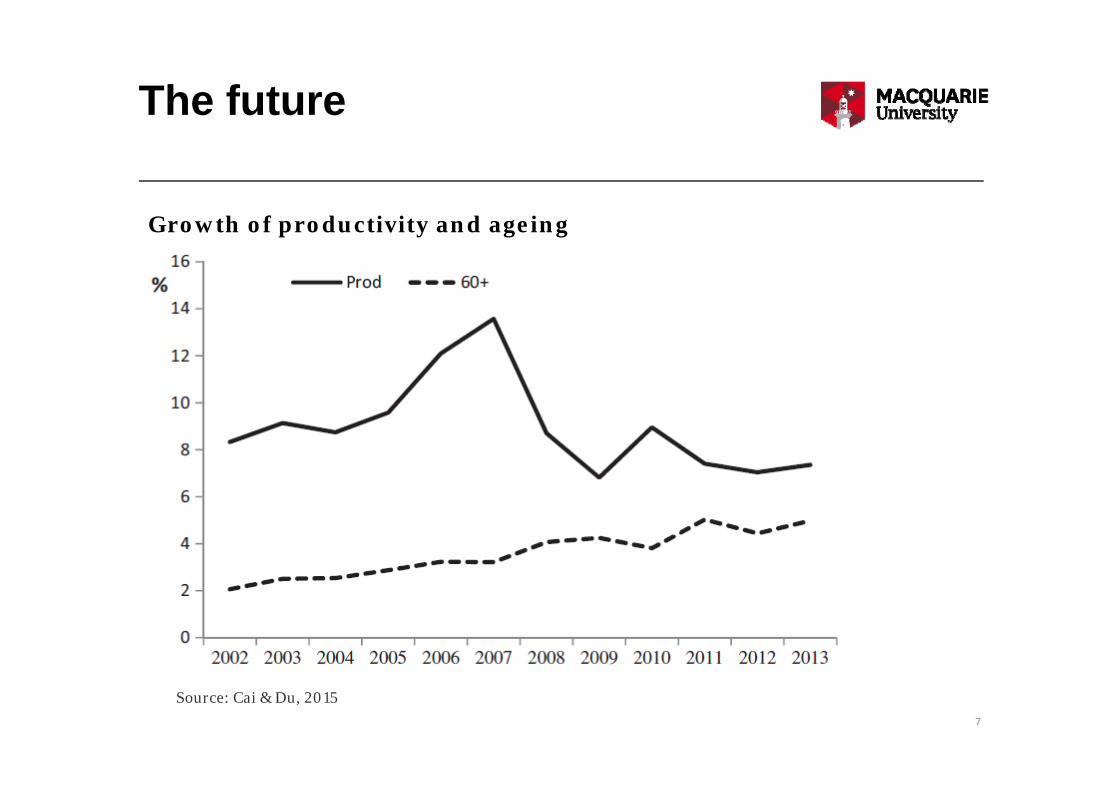
The future
7
Growth of productivity and ageing
Source: Cai & Du, 2015

Thank you