Embed Size (px)
Citation preview
Consultants
for water and environment
56116
June, 2001
West Siberia Oil IndustryEnvironmental and Social Profile
Final Report
Client Greenpeace
Consultants
for water and environment
All rights reserved. No part of this publication may be stored in a retrieval system, or transmitted in any form or by any means,electronic, mechanical, photocopying, recording or otherwise, without the prior written permission of the Client.
Document title West Siberia Oil Industry Environmental andSocial Profile
Document type Final Report | June, 2001
Project title West Siberia Oil Industry Environmental and Social Profile
Project number 56116
Client Greenpeace
Responsible person(s) Mr. M. Lodewijkx
Project Manager Mr. Henk Blok
Co-authors Mrs. Verina Ingram / Mr. Reimond Willemse
Department Environment International
Project Director Mr. T.F. Huber
|…………… …………………………. ………………
dated |…………… …………………………. ………………
Division International Projects
Hoofdweg 490
P.O. Box 8520
3009 AM Rotterdam
The Netherlands
Telephone +31 10 286 54 32
Fax +31 10 220 10 05
E-mail [email protected]
Quality and continuous improvement are the highest priority at IWACO. Our quality systems areperiodically evaluated and approved by independent agencies, according to a number of qualitystandards. These standards are:- ISO-9001: for the organisation wide quality management system;- STERLAB: for the activities of our Environmental Laboratory and Technical Environmental Services(accreditation number L51 resp. L152);- VCA*: the safety management system for Technical Environmental Services
Division International Projects IWACO B.V.
West Siberia Oil Industry
Final Report | June, 2001
Summary
56116
Summary
IntroductionIWACO BV Consultants for Water and Environment was commissioned to undertake aproject for the Dutch, German and Russian Greenpeace offices in 2000, to assess theenvironmental and social impacts of the oil industry in West Siberia. The project wasinitiated by Greenpeace to support their scientific field trips to West Siberia in thesummer of 2000 as part of a campaign targeted at the Russian oil industry. IWACO was requested to provide independent scientific data and views to support theGreenpeace campaign. The project that aims to provide an impression of theenvironmental and social impacts of the oil industry in West Siberia is focussing on theNizhnevartovsk region. The location, extent and degree of oil pollution in West Siberiawill be indicated. The Profile includes an environmental and social baseline of the oilsector in the region, an analysis of the potential key environmental and social issues,with which an assessment of impacts was made. Mitigation, monitoring andmanagement measures are proposed for the sector.
The project focussed on the Nizhnevartovsk region in West Siberia. This region maybe representative of the oil industry in Western Siberia, allowing the environmentaland social impacts of the oil sector in this area to be extrapolated, with care and subjectto stipulations, to other areas with oil industries in Western Siberia.
Greenpeace requirementsThe ambitious Greenpeace campaign aims to initiate changes in Russian energy policyand practices of both Russian and international oil companies working in WesternSiberia. International Financing Institutes (IFIs) are also targeted in the campaign astheir financial aid and loan conditions to the oil sector can influence policy. It isunderstood that Greenpeace will use the IWACO Environmental and Social Profile aspart of their Russian oil sector campaign. The long term aims of Greenpeace are toendorse IFI funding for oil pollution remediation, upgrading existing infrastructure andinvestment in energy efficiency and renewable energy in Russia. The short term goalsof Greenpeace include convincing Russian authorities and public that Greenpeacewants to be actively involved to find a solution to reduce the negative effects of oilproduction. This includes raising awareness in Europe of the present status of theRussian oil industry, to influence the Russian government and IFI decision-makers andinduce them to approve major loans to protect or mitigate the environmental and socialimpacts of the sector.
Aim and scope of the Environmental and Social ProfileThe project that aims to provide an impression of the environmental and social impactsof the oil industry in West Siberia is focussing on the Nizhnevartovsk region. It alsoseeks to provide an overview of the location, extent and degree of oil pollution in WestSiberia. The Profile includes an environmental and social baseline of the oil sector inthe region, an analysis of the potential key environmental and social issues, followedby an assessment of impacts. Mitigation and management measures are proposed forthe sector, resulting in five project identification sheets.
Project ActivitiesThe following activities were conducted as part of the project. The range, scope,objectives and limitations of these activities necessarily limited the profile:

Division International Projects IWACO B.V.
West Siberia Oil Industry
Final Report | June, 2001
56116
- A literature review was performed and during interviews many documents wereobtained from different organisations. Furthermore literature was obtained fromInternet.
- A remote sensing component supported the limited number of field surveys byproviding an assessment of satellite data to provide large scale, objectivemeasurements, inventories and observation of the project area. Landsat TM7satellite images on a 180 x 180 km scale taken on 19 July 2000 were used. Thesewere interpreted in conjunction with data collected during the field surveys and,after verification in the project area, resulted in an ‘Oil spill map’.
- One and half months of field observations and sampling took place during theperiod of August and September 2000. This program was executed to supplementinformation gathered through literature research, interviews and field observations.The fieldwork team concentrated on the oil fields and surrounding rivers andvillages. Areas of interest were prioritised based on interpretations of the remotesensing images and literature review. This information was used to identifylocations for fieldwork visits. Two types of field observations were used,helicopter and ground observations. The one hour helicopter flight over theSamotlor oil field provided an initial impression and an overview of the oil sectorimpacts on the environment. Field surveys were carried out in the Samotlor oilfield and surrounding areas. Remote sensing image interpretations were verifiedand ground truthed. An overview of exact spill locations (registered with a GlobalPositioning System), sizes and treatment methods was conducted. The focus of thefield observations was on areas where risks to human health and the environmentwere expected, including:
• Inhabited areas;• Drinking water sources;• Flare locations;• Rivers draining the Samotlor oil field.
IWACO staff took all together fifty-five drinking water, soil and sediment andsurface water samples during the field surveys. Local fisherman collected fishsamples from two locations. Greenpeace staff collected surface water andvegetation samples. The sample points were logged on the remote sensing images.
- Chemical analyses of water, sediment and soil samples taken in the field werepreserved and transported to the IWACO Sterlab and ISO 9001 certifiedenvironmental laboratory in Rotterdam, The Netherlands, where analyses tookplace. Fish samples were analysed by the TNO-MEP Laboratory in Apeldoorn,The Netherlands. Chemical analyses of the Greenpeace surface water andvegetation samples were performed by the Bashkir Republic Ecological ResearchCenter in the Russian Federation. The samples were analysed for one or more ofthe following parameters:
• Mineral oil;• Polycyclic aromatic hydrocarbons;• Volatile aromatic hydrocarbons;• Heavy metals.
- Interviews constitutes an important source of information about the environmentaland social impacts of the oil sector activities in the study area. Interviews alsoassisted in collecting data and verifying information, and helped to meetGreenpeace’s short-term project goal of showing Russian authorities and thepublic that Greenpeace wants to actively assist finding solutions.
Division International Projects IWACO B.V.
West Siberia Oil Industry
Final Report | June, 2001
56116
A number of interviews were conducted in Nizhnevartovsk, Tyumen and Moscow,some together with Greenpeace staff, with representatives from the followinggroups:
• Local and national environmental authorities;• Universities and research institutes;• Russian oil companies operating in Western Siberia;• Local population and non-governmental organisations;• Environmental media;• International financing institutions;• Reporting took place in the Netherlands and Russia and comprised all
activities performed as part of the project. The Draft Final Report wasdistributed among interviewees for verification and comments, which wereincorporated into the final version of the report. The report provides anindependent assessment of the environmental and social impacts of the oilindustry in West Siberia for Greenpeace.
A major problem for the project was that the accuracy and reliability of data could notalways be optimal due to the following factors:
- Restrictions to access (part of the Russian officials were not willing to verifyinformation or discuss the matter in depth, or at all);
- The team did not have full or official access to the oilfields;- The requirement for translation of many documents;- The tendency for official data only to be available on a amalgamated regional or
sector level, with no detailing on background of the data;- Conflicting data.
Unfortunately, the results of the sampling program also cannot be used to statisticallysubstantiate the assessment of impacts. Due to the scope of the project, the availabletime frame and budget limitations, the aim of the sampling program was limited toproviding additional data only regarding critical environmental impacts and locations.
FindingsThe following sections summarise the main findings of the Environmental and SocialProfile.
The West Siberian EnvironmentWest Siberia covers a huge geographical area with rivers and lakes being thepredominant features. The Nizhnevartovsk region covers an area of about 11,785 km2.The region is largely covered by taiga and tundra forest, and is a unique and fragilewilderness with a harsh sub-arctic, including areas of permafrost, and continentalclimate. The area has largely low nutrient peat based soils supporting fragile bogs andforest ecosystems, high groundwater levels with waterlogged soils possessing longdegradation and biological recovery times. The ecosystems support populations ofbears, wolves, foxes and a number of herbivorous animals. The many water bodiessupport a number of fish species, many of which are commercially important, andendangered species, including the beaver and sturgeon. The region is largely inhabitedonly in a number of urban, industrial areas, which have grown enormously over the last40 years due to immigration. The region has, compared with the Russian average,particularly low health rates and high rates of a number of diseases, often related toenvironmental quality.
Division International Projects IWACO B.V.
West Siberia Oil Industry
Final Report | June, 2001
56116
Indigenous peoples of West Siberia include the Khants, Mansis and Nenets, whosenumbers have been declining, particularly in relation to the high levels of migration ofRussians from other areas into their traditional homelands. Their traditional extendedfamily based, hunting, semi-nomadic lifestyle has disintegrated since the 1950s.
The West Siberian Oil IndustryExploitation of West Siberian oil resources has occurred on a massive, world importantscale and has been a major source of revenue for the Russian Federation for over fortyyears. The Russian Federation is one of the world’s top five energy producers, beingthe second to third world largest exporter of petroleum. In 1998 82,770,000 tonnes wasexported in total. From 1993 to 1998, Western Europe imported between 55% and 78%of Russia’s total exported oil, with Germany, Switzerland, the UK, Italy and Spainbeing the major importers. It is not transparent who the importing companies exactlyare, although all or many of the major international oil companies are probablyimporters. Total Fina Elf is reported as purchasing 18 to 20 million tons annually fromRussia, with Tymen Oil Company stating that 70% of its export is sold to Total FinaElf. Within Russia, West Siberia is the most highly developed and oldest oil and gasregion, producing about 78% of all Russian oil. The Nizhnevartovsk Region containssome of the oldest fields, the Samotlor field being 40 years old. The fields areexploited by mainly Russian, recently privatised companies and a number of jointventures with international companies. The top six privately owned oil companiestoday are LUKoil, Surneftegaz, Yukos, Sidanko, Tatneft and Tyumen Oil Company(TNK), who together account for about 60% of Russia’s yearly oil production of 265million tons (1998).
Private companies, mainly Russian owned, with some joint ventures with internationalconcerns, have taken over oil production from the Russian government during the lastdecade. All aspects of the exploitation and production process currently occur in WestSiberia. Investment and development of the sector is closely correlated with crude oilprices. Privatisation of the oil sector has transferred responsibility for past and currentenvironmental and social impacts of the sector from the government to Russian andforeign oil companies exploiting the fields. Governmental authorities however remainresponsible for monitoring and enforcement of environmental legislation anddeveloping strategies for the energy sector.
International Financing InstitutesThe major IFIs active in the Russian energy and environment sector have not identifiedor named the West Siberian oil sector as a priority in their current or future strategiesor policy plans except TACIS, although the EBRD is now reconsidering reallocation offunds. Most IFIs allocate financing on the basis of where they and their Russiancounterpart authority set the highest priority and expect a positive financial or technicalreturn on investment. The historical and current environmental and social managementand impacts of the oil sector do not appear to be a priority for the government, thecurrent operating oil companies and most donor agencies. IFI financing ofenvironmental projects in the sector is not anticipated as a major source of investment,although bilateral and country funds may be, depending on individual policies. Privatesector financing by both national and international companies currently active orwishing to invest in the area appears to be the major potential source of funding forenvironmental projects, although this appears to depends on oil prices strongly.

Division International Projects IWACO B.V.
West Siberia Oil Industry
Final Report | June, 2001
56116
Causes of impactsThe activities of the oil industry in West Siberia have caused a wide variety of impacts.The most significant activities that cause multiple environmental and social impactsare:
- Pipeline and equipment breaks, spills and accidents;- Inadequate emergency planning and equipment;- Normal operational practices with inadequate environmental mitigation and
management measures;- Operational errors and negligence by oil company personnel;- Low company and personnel environmental management and organisation,
awareness and education of environmental impacts of operations, particularlyspills;
- Lack of environmental management systems within oil companies;- Inadequate remediation measures for spills to soil and water;- Lack or under-investment in equipment and use of unsuitable or outdated
equipment;- Incomplete policy regarding native peoples, access and rights to traditional lands
on oil fields.
Environmental and Social AssessmentThis part summarises the evaluation of the impacts per environmental and social issue.Spills, due to their multi-media impact, were considered separately.
- Between at least 700,000 to 840,000 hectares of polluted soil in West Siberia andaround 2% of land in the oil fields in the Nizhnevartovsk Region are polluted byoil, with 6500 hectare of contaminated soils confirmed in the NizhnevartovskRegion. This is a much larger area than indicated by official government and oilcompany statistics. Soil pollution has been caused largely by oil pipeline and wellspills, but also by oily muds, drilling and production waste, chemical wastedisposal and leaking storage places; saline production water; operationaldischarges and leakage and oil production site drainage.
- Unquantifiable shallow and deep groundwater and aquifer pollution inNizhnevartovsk Region, particularly the older oil fields such as Samotlor, with oilconcentrations around 0.1 mg/l in groundwater layers up to 200 m deep. Causesinclude oil spills, leaks from oil and chemical waste storage; operationaldischarges and water re-injection and leaks from abandoned old wells.
- Surface water pollution in West Siberia, particularly in water bodies around oilfields, and especially older fields in the Nizhnevartovsk Region. The mainpollutants are oil products, reaching between 5 to 50 times the Russian PDK norm,also salt minerals including chlorides and production chemicals. The causes are oilspills and accidents, releases of drilling wastes, leaks from waste disposal areas,flares and transport emissions into surface water. Surface water hydrology has alsobeen unquantifiably changed due to dams, dikes and roads constructed as part ofoil field infrastructure;
- Negative, unquantified impacts on air quality caused by emissions of PolycyclicAromatic Hydrocarbons (PAH), hydrocarbons, particulate (soot) and greenhousegases particularly from flaring and venting of associated gases, oil spills and oilywaste burning, and fugitive emissions from oil spills, vents and productionfacilities.

Division International Projects IWACO B.V.
West Siberia Oil Industry
Final Report | June, 2001
56116
- Negative impact on the quality of drinking water in the Nizhnevartovsk Region.97% of drinking water extracted from the River Vakh over a five-year period waspolluted with oil exceeding the PDK norm. Whilst treated surface and groundwater presents a low risk to human health, the large number of water supplystations and numerous, unofficial, private wells providing untreated drinking waterpresents a considerable, unquantified health hazard.
- Negative impact on the aquatic biological environment. Over 50% of fished riversin the region is contaminated with oil products, resulting in reduced health,breeding ability, changed spawning behaviour and possibly linked to declining fishcatches. Causes include pipeline and product spills and accidents, releases ofdrilling wastes, leaks from waste disposal areas, flares and transport emissions intosurface water.
- Possible unquantified impact of radioactive contamination of the widerenvironment resulting from radionuclide contaminated oils (both naturally andunnaturally occurring) extracted from certain areas of West Siberia.
- Negative, unquantified impacts on terrestrial flora and fauna, resulting in changedterrestrial habitats such as decreased or increased water levels, limitations ofaccess, flora damage and loss, disturbance and possible contamination of fauna,particularly water birds. The causes include oil spills, noise from oil productionfacilities, vehicles and construction works, vehicle impacts of oil facilitiesconstruction and maintenance works, flares, fires and roads, pipelines, wellplatforms, dams and dikes related to oil facilities.
The Nizhnevartovsk Region of West Siberia has changed greatly during the last40 years, largely as a result of the development of the oil fields. The Region hasindustrialised and has seen a huge increase in migration as well as large changes inland use with the development of cities, oil fields and designation of nature reserves.Environmental legislation has developed on a national and regional level to protectresources, along with monitoring and enforcement mechanisms and authorities. Thesocio-economic environment has also been directly and significantly affected by theactivities of the oil sector. The impacts are however largely unquantifiable, but include:
- Negative and positive impacts on the socio-economic conditions in theNizhnevartovsk Region, resulting in increased access to employment within oilsector and related services; increased and changed access to social services; denserinfrastructure and transport links in the region
- Negative and positive impacts on demography in the form of a huge increase inmigration into the region, an increase in urbanisation and industrial activities;increased exposure to cultural and racial differences and increased conflictsbetween migrants and ethnic minorities.
- Negative impact on health caused by pollution, urbanisation and industrialisationof the region, partly due to the oil sector as the major industry in the area. There isa potential, suspected relationship between the `poor environment` inNizhnevartovsk and a higher than Russian average level of certain oncological,cardiological and endocrinological diseases and shorter life expectancies.
- Negative and positive impacts on Khanty, Mansis and Nenets indigenous peoplestraditional culture and socio-economic systems, resulting urbanisation of thetraditional hunting areas partly caused by activities of the oil industry, the oilsector presenting alternative cultural values and economic opportunities, changesin land-use due to oil activities and facilities, restriction of access to oil companylands preventing access to traditional lands and infringing on traditional land use,compensation paid for damage and land use, pollution of natural resources used fortraditional subsistence lifestyle (i.e. hunting, fishing and farming).

Division International Projects IWACO B.V.
West Siberia Oil Industry
Final Report | June, 2001
56116
The activities of the oil sector have consequently resulted in significant directenvironmental impacts and a number of direct and indirect socio-economic impacts inthe Nizhnevartovsk region. It can be concluded, with caution, that particularlyenvironmental impacts to soil, surface water, groundwater, and terrestrial biology havesimilar impacts in a wider area of in West Siberia, resulting in widespread butunquantified oil and chemical polluted soils, groundwater and surface water thatamong others, contaminates drinking water, inducing human health risks and affectsfish. Oil spills have caused some of the most significant, widespread negative impactsto the environment in West Siberia and affected all environmental media. Both pastand new spills continue to have a major impact the present environment. The industryhas also had widespread indirect effects on local ecosystems and native cultures. Thesector’s most notable positive impacts have been socio-economic, includingemployment and infrastructure development in urban areas in the main oil fields.
The findings of impacts in the Nizhnevartovsk region, the Khanty Mansiysk Districtand the Tyumen Oblast, indicate that extrapolation of the main findings to the whole ofWestern Siberia seems justified. It is likely that other oil fields have experiencedsimilar impacts of a similar or lesser significance, as there are strong indications thatenvironmental and social impacts significantly increase with the age of the oil fields.However, local environmental conditions (particularly permafrost and hydrology) andsocio-economic circumstances (for instance the age of the oilfield), will causedifferences in the specific impacts and magnitude of the impacts. In general however,one can safely assume that similar impacts occur in other oil and gas exploration andproduction regions of Western Siberia.
Measures`General solutions` for mitigation of environmental and social impacts due to the oilsector in West Siberia are proposed in this Profile. Solutions are presented in terms ofenvironmental management measures. These are feasible and effective measures thatmay reduce significant, adverse environmental and social impacts to acceptable levels.
Besides measures which are already “ongoing activities” measures named and manyothers, which are not covered within this study take possibly decades to implement.Before implementing, questions will rise like: Why cleaning such an area? Where tostart ? And who will pay? Stakeholders in Western Siberia (or within a smaller entity)should develop a shared vision in the first place. This vision may serve as starting pointor reference for all stakeholders and for all future development plans. In such a sharedvision adequate weight could be given to all stakeholder interests. Ideally, the visionbecomes a guiding principle for major planning and development decisions in thecoming decades. However, this requires that stakeholders will be committed to thevision, which is best obtained by their active participation in the process of formulatingthe vision. Within this vision as a framework, concrete measures will get its own place.The above does not imply just to stop already ongoing processes and environmentalmeasures since those two are closely related and will support each other. The alreadyongoing processes and environmental measures, like development of rehabilitationtechniques and re-use of associated gas should be encouraged.

Division International Projects IWACO B.V.
West Siberia Oil Industry
Final Report | June, 2001
56116
This report provides an independent and a fair assessment of the environmental andsocial impacts of the oil industry in West Siberia. As far as known by the consultantthis is a first attempt to bring together information of the oil industry andenvironmental and social baseline data on a rather basic level. Impacts in the regionrelated to the oil industry could be substantiated. A further mapping of the oil spillswill complete the picture for the whole of Siberia. With a complete picture of the(potential) oil spills in Siberia, combined with the environmental and socialsensitivities, priorities can be set for further activities. For possible furtherinvestigations it is advised to involve local authorities and representatives of the oilindustry to a further extent to come to a more in-depth insight. Much attention shouldbe paid to institutional development and awareness raising since the information seemsonly fragmentary available and scattered over different organisations. Therefore, itseems right now not very worth while to invest in extensive sampling campaigns/broad inventarisations without a proper framework for further activities.
Division International Projects IWACO B.V.
West Siberia Oil Industry
Final Report | June, 2001
Contents
56116
Summary 1
1 Introduction 1
1.1 General 11.2 Background of the project 11.3 Aim and scope of the environmental & social profile 11.4 Approach 2
2 Activities performed 3
2.1 Remote sensing 32.2 Fieldwork and chemical analyses 42.3 Interviews 52.4 Literature and desk study 62.5 Reliability of data 6
3 Description of environment 7
3.1 Introduction 73.2 Physical environment 73.2.1 Geography 7
3.2.2 Climate 7
3.2.3 Geology 8
3.2.4 Hydrology 8
3.2.5 Soils 9
3.2.6 Radioactivity 9
3.3 Biological environment 103.3.1 Fresh water environment 10
3.3.2 Terrestrial environment 10
3.4 Socio-economic and cultural environment 123.4.1 Regulation and Legislation 12
3.4.2 Demography 15
3.4.3 Health 16
3.4.4 Socio-Cultural Environment 17
4 Oil industry in West Siberia 18
4.1 General 184.2 Russian companies active in West Siberia 204.3 International oil companies in West Siberia 244.4 Donor agency activities in West Siberia 244.5 Summary 28
5 Potential environmental and social impacts 29
5.1 The oil exploration and production process 295.2 Interactions between the oil industry and the environment305.3 Environmental sensitivities 325.3.1 Physical environment 32

Division International Projects IWACO B.V.
West Siberia Oil Industry
Final Report | June, 2001
56116
5.3.2 Socio-economic & cultural environment 34
5.3.3 Identification of key issues 35
6 Physical & social environmental assessment 38
6.1 Introduction 386.2 Physical environment impacts 386.2.1 Oil spills 38
6.2.2 Remote sensing 45
6.2.3 Air quality impacts 46
6.2.4 Soil quality impacts 50
6.2.5 Water quality impacts 54
6.2.6 Impacts of radioactivity 63
6.3 Assessment of biological environment 646.3.1 Impacts on aquatic environment 64
6.3.2 Impacts on terrestrial environment 67
6.4 Socio-economic and cultural impacts 696.4.1 Demographic impacts 69
6.4.2 Health impacts 69
6.4.3 Socio-economic impacts 70
6.4.4 Socio-cultural impacts 71
6.5 Extrapolation 73
7 Environmental management measures 74
7.1 Introduction 747.2 Measures 757.2.1 Preventive measures 75
7.2.2 Mitigation measures 75
7.2.3 Soil and groundwater remediation 75
7.3 Possibilities for funding environmental measures 77
8 Conclusions 78
8.1 Introduction 788.2 Findings 788.3 Measures 818.4 Concerning the Project 82

Division International Projects IWACO B.V.
West Siberia Oil Industry
Final Report | June, 2001
56116
List of Abbreviations
EBRD European Bank for Reconstruction & Development
EIA Environmental Impact Assessment
EIB European Bank for Investment
EU European Union
GDP Gross domestic product
GEF Global Environmental Facility
IFC International Financing Corporation
IFIs International Financing Institutions
NGO Non-Governmental Organisation
PCF Prototype Carbon Fund
SCEP State Committee for Environmental Protection
TNK Tyumen Oil Company
NREC Nizhnevartovsk Regional Environmental Committee
KMREC Khanty Mansiysk Regional Environmental Committee
RS Remote sensing
List of Figures
1 Location of project area
2 Samotlor oilfield
3 Landcover map of Nizhnevartovsk Region
4 Oil contaminated sites at Samotlor oilfield in Nizhnevartovsk Region
List of Appendices
1. Interviews
2. References
3. Report on remote sensing
4. Field visits
5. List with samples and coordinates
6. Chemical analyses IWACO
7. Photos
8. Nature reserves in West Siberia
9. Report on fish analysis
10. Analyses Greenpeace
11. Dutch standards
12. Project sheets
Division International Projects IWACO B.V.
West Siberia Oil Industry
Final Report | June, 2001
56116
1
1 Introduction
1.1 General
This draft report is submitted in response to the request by Greenpeace on 11 April2000 to support Greenpeace’s Scientific Field Trips to West Siberia in the summer of2000 as part of their campaign concerning the oil industry in West Siberia.IWACO B.V. Consultants for water and environment, The Netherlands was requestedto provide independent scientific data to support the Greenpeace campaign. Due to theavailable time and money it was decided to focus on the Nizhnevartovsk Region (seefigure 1, as enclosed in ‘Figures’). This region was chosen because:
- the oil industry has been active in this region for over 40 years and therefore an in-depth picture of its effects is available;
- the Samotlor oilfield, as one of the ‘well known’ older oilfields is situated in theNizhnevartovsk Region;
- good accessibility of this region;- many oil companies and authorities are based in Nizhnevartovsk.
Due to the historic and still expanding oil sector activities in the NizhnevartovskRegion, this region can be seen as representative for the oil industry in WesternSiberia. The physical and social environment will of course differ from region toregion (permafrost, hydrogeology, cultural traditions etc.) and with that, impacts on thephysical and social environment. Nevertheless an extrapolation to the whole ofWestern Siberia is relevant provided these conditions and stipulations are borne inmind.
1.2 Background of the project
Greenpeace’s aim of their campaign is to positively influence Russian energy policyand Russian and international oil companies working in Western Siberia. InternationalFinancing Institutes (IFIs) are also targeted as they can influence Russian policy to acertain extent by the conditions connected to financial aid for the oil sector. It isunderstood that Greenpeace will use the IWACO environmental profile as part of theirRussian oil sector campaign. In the long term, Greenpeace aims to endorse IFI fundingfor oil pollution remediation, uplifting the existing infrastructure (improving andemphatic no expansion) and investment in energy efficiency and renewable energy inRussia. Short terms goals of the Greenpeace project include: convincing Russianauthorities and public that Greenpeace wants to be involved in a positive manner tohelp to find a solution for the negative effects of oil production. This includesawareness raising in Europe of the status of the oil industry in Russia in order toinfluence the decision-makers at IFI and to induce them to restart important mitigationloans.
1.3 Aim and scope of the environmental & social profile
The West Siberia Oil Industry Environmental & Social Profile aims to provide animpression of the location, extent and degree of oil pollution in West Siberia. Thisproject focuses on the Nizhnevartovsk Region in West Siberia. The results (with thenecessary stipulations) will be extrapolated to the whole of Western Siberia. Thisproject provide also insight into the environmental and social impacts caused by the oilsector. For the latter a global environmental baseline will be drawn based mainly onliterature. Mitigation and management measures are described for the different impactsand causes of impacts. IWACO published the results in a final report.

Division International Projects IWACO B.V.
West Siberia Oil Industry
Final Report | June, 2001
56116
2
Consultants’ activities and the subsequent preparation of the final report have beencarried out in full independence.
Greenpeace believes the statements and data in this report to be accurate. However, theviews and findings in this report are those of the authors and do not necessarily reflectthe views of Greenpeace.
1.4 Approach
To compile the Environmental Profile a phased approach is used. Scheme 1 gives anoverview of the project phases and activities. In the first phase, two information linescan be distinguished; information concerning the oil industry (1a) and environmentaland social baseline data (1b). A literature review was used to gather relevantinformation on the environment and social situation and the oil industry in WestSiberia. Oil sector activities have an impact on the environment and are thereforeconstitute environmental hazards. These hazards are identified in (2a). Simultaneously,environmental and social baseline information generated a sensitivity analysis (2b).After consultation with the client regarding issues of priority and based on theexperience of the consultant in the oil industry, key environmental and social issues aredetermined (3). This phase consisted of a desk-study and was carried out in TheNetherlands. For the key environmental issues (4) data were gathered through literaturereview, interviews, remote sensing and fieldwork. Next to this an assessment ofimpacts took place (5). This phase was executed in Russia as well as in TheNetherlands. Finally, a description of environmental measures (6) was conducted. Theinformation gathered and results have been made suitable for publication in the thirdphase. The study will be made public by a report and a press conference (7).
1.5 Structure of the report
The report presents information collected as a result of literature reviews and field tripsby the project team to Moscow and West Siberia in August, September andOctober 2000. In Chapter 2, activities performed as part of the project are detailed.Chapter 3 covers the baseline environmental and social conditions and in Chapter 4information on oil industry sector is presented. Chapter 5 describes the analyses ofpotential environmental and social impacts and the identification of key issues. Anassessment of impacts is made in Chapter 6. Chapter 7 presents environmentalmanagement measures and recommendations for the oil sector in West Siberia. Somebrief descriptions of projects suitable for implementation in the short to medium termare presented in chapter 8.
Division International Projects IWACO B.V.
West Siberia Oil Industry
Final Report | June, 2001
56116
3
2 Activities performed
As part of the Environmental Profile, a number of activities were performed. The workconsisted of a literature review and desk study, remote sensing analysis combined withground truthing in West Siberia, and fieldwork, including field observations andsampling in West Siberia and chemical analysis of samples in the Netherlands. Thefollowing section describes the activities, the objectives, and limitations of theactivities.
2.1 Remote sensing
IntroductionThe aim of the remote sensing component of the project is to provide insight into theextent and location of oil pollution in West-Siberia. West Siberia is a vast area, andonly a limited number of field trips can be carried out in order to obtain such anoverview. Remote sensing is potentially an ideal alternative for such a large-scaleassessment, provided oil pollution can be distinguished on the satellite images.
BackgroundRemote sensing is a method to obtain information of the earth's surface, through theanalysis of data obtained by a sensor present on for example satellites or aeroplanesthat are not in contact with the surface. By means of this technique objectivemeasurements are recorded at potentially large scales. This scale of observation isclosely linked with resolution or accuracy of the measurement. Remote sensing haslarge advantages when compared to alternative fieldwork. It is objective, repetitive ofcharacter, gives continuous cover and is low cost per km2.
Remote sensing is an ideal tool for large-scale field investigations and inventories ofland use change, such as caused by pollution. Furthermore, in order to chooseappropriate locations for detailed field studies an assessment of different satelliteimages and/or aerial photographs is very useful. Remote sensing can also be employedto extrapolate the point data, collected during detailed field observations, to a completelarge-scale coverage. Lastly, the technique can be used to map change detection. Bycomparing satellite images from different dates it is possible to map changes in landuse.
Approach and analysesFor the current application it was decided that the most suitable RS image was aLandsat TM7 image. On the one hand such an image has a large spatial coverage(180*180 km) and on the other hand the resolution or accuracy is acceptable for thecurrent application (30 m). A recent Landsat 7 image (19 July 2000) was purchased ofthe study area. For the analyses and interpretation the Centre for Geo-Information ofAlterra, Wageningen was subcontracted. Alterra is very experienced with land useclassifications and have state of the art soft- and hardware for image analyses available.The final interpretation was carried out as a combined effort of Alterra, GreenpeaceRussia and IWACO. Appendix 3 gives their report on the processing and interpretationof the image.
The first interpretation was carried out based on a visual interpretation and the datacollected during the first field trip. This resulted in a preliminary map of areas affectedby oil spills and leakages. A differentiation was made between recent and relatively oldoil spills. This is an interesting factor as the oil industry has declared that the spillsoriginate from the eighties and no serious spills have occurred since then.

Division International Projects IWACO B.V.
West Siberia Oil Industry
Final Report | June, 2001
56116
4
It was also attempted to run an automatic classification, based on the reflection of oil.As the reflections of water and oil are very similar, except for the near infraredwavelength where there is some difference, the output contained a lot of incorrectlyclassified pixels. This resulted in a rejection of the output.
As the effects of oil on vegetation in the area are very apparent (see photo on leftpage), an alternative is to make a classification based on vegetation affected by oil.Also, these areas are spectrally unique, providing a better source for classification, thanpure oil. To collect further data of this oil affected areas, an additional field trip wascarried out. This resulted in a data set of 33 points, with a description of the sites itselfand the direct surroundings. Also photographs were taken for later reference.
Based on five training sites (affected areas), a classification was carried out assigningall pixels with similar reflectance as the training sites to a specific class. Adifferentiation was made between recent and old contaminated areas. After evaluationof the results it turned out that the location of the spills could be identified, althoughthe extent of each location was difficult to establish with high accuracy. This is causedby the pixels at the fringes of the contaminated areas that consist of both affected andun-affected vegetation. In order to include these pixels to the classification, the outerfringes of the affected area were verified visually and hence included.
2.2 Fieldwork and chemical analyses
IntroductionFieldwork consisted of field observations and sampling. The sampling and chemicalanalysis program was executed in order to support information gathered throughliterature research, interviews and field observations.
The fieldwork concentrated on the oil fields and surrounding rivers and villages. Withthe interpretations of remote sensing images and literature review a first prioritisationof areas of interest has been made. This information was used to decide were fieldvisits were organised. It is emphasised that in the used sampling strategy, a verylimited amount of samples were taken from the obvious oil-spills itself. All observedoil spills were indicated on the remote sensing images.
It must be stated that the results of the program can not be used to substantiate theconclusions by statistical means. Due to the design of this project and the relatedavailable time and budget samples have been taken sparse and only at those placeswhere observations needed additional data or at places which are critical concerningenvironmental impacts. The latter can be surface water used for drinking water,drinking water wells, etc.
Field observationsTwo types of field observations can be distinguished in this project, as there areobservations from a helicopter and observations from the ground. The former consistedof a one-hour flight over the Samotlor oil field (see figure 2 as enclosed in ‘Figures’).This helicopter flight was carried out to get a first impression and an overview of theeffects caused by oil industry on the environment. Field visits were carried out in theSamotlor oil field and the surroundings (appendix 4 gives an overview of the fieldvisits). In the Samotlor oil field several spills were visited and an overview was gainedof the size and amount of spills and the way they were treated (or not treated).

Division International Projects IWACO B.V.
West Siberia Oil Industry
Final Report | June, 2001
56116
5
In the surroundings the focus was on these areas where risks for human beings and theenvironment could be expected, as there are: areas with datsja’s, sources for drinkingwater (rivers and wells), area’s where flares are located, rivers which drain theSamotlor oil field, etc.
Samples and chemical analysesDuring the field visits several surface water, drinking water, soil and sediment sampleswere taken by IWACO staff. Furthermore, at two point’s fish samples were collectedfrom local fisherman. Greenpeace staff collected samples of surface water andvegetation. The exact position of each sample taking point was registrated with a GPSinstrument. In appendix 5 an overview of the sample points is presented together withthe co-ordinates. The sample points are also shown on the remote sensing images. Oil-spills are also registrated with the GPS and sometimes pictures were taken todemonstrate the situation in the field (see appendix 7).
Samples are preserved, kept in cooling boxes and taken to The Netherlands by IWACOconsultants. The samples are analysed by the Environmental Laboratory of IWACO.The laboratory of TNO-MEP in Apeldoorn carried out analyses of fish. Chemicalanalyses on the samples taken by Greenpeace staff are performed by the BashkirRepublic Ecological Research Center. One or more of the following parameters whereconducted on the samples: mineral oil, polycyclic aromatic hydrocarbons, volatilearomatic hydrocarbons and heavy metals. The analysing method for mineral oil usedby IWACO includes a clean-up as part of pre-treatment. This means that organiccompounds like humic substances are removed. This method prohibits interferencewith the organic component to be analysed for. Most analysing methods used in Russiadon’t use this clean-up, so interference is possible and happens especially in soils andwater rich in organic matter. The above described differences in analysis method couldcause discrepancies in results between different laboratories.
2.3 Interviews
Interviews form an important source of information about environmental, andparticularly social impacts of the oil sector activities in the study areas. Interviews withrepresentatives from the following organisations have not only assisted in collectingand verifying information of the impacts and extent of oil pollution, but have helped tomeet the short term project goal of showing Russian authorities and public thatGreenpeace wants to actively assist finding a solution. This communication wastherefore vital to the success of the project. Interviews are important communicationchannels for gaining the support of the authorities and public and stimulating theirpositive co-operation with the project. Interviews were conducted with Greenpeacestaff and were organised with representatives from the following groups:
- Local and national environmental authorities;- Universities and research institutes;- Russian oil companies operating in Western Siberia;- Local population.
Interviews were conducted in the following areas:
- Nizhnevartovsk;- Tyumen;- Moscow.
A list of interviews is presented in Appendix 1.
Division International Projects IWACO B.V.
West Siberia Oil Industry
Final Report | June, 2001
56116
6
2.4 Literature and desk study
A literature review was performed and during interviews many documents wereobtained from the different organisations. Furthermore literature was obtained fromInternet. A list of literature obtained is included in Appendix 2.
2.5 Reliability of data
It should be noted that the accuracy and reliability of data can not always beguaranteed due to:
- restrictions to access (many Russian officials were not willing to discuss the matterin depth, or at all);
- the team did not have full or official access to the oilfields;- the requirement for translation of many documents;- the tendency for official data only to be available on a amalgamated regional or
sector level, with no detailing on background of the data;- conflicting data.
Division International Projects IWACO B.V.
West Siberia Oil Industry
Final Report | June, 2001
56116
7
3 Description of environment
3.1 Introduction
This section describes the current baseline; that is the physical, biological and socio-economic conditions in West Siberia. The environmental and social components arenot treated exhaustively due to the aim and scope of this project. However, the baselineprovided is sufficient within the framework of this project to describe the differentimpacts of the oil industry.
3.2 Physical environment
3.2.1 Geography
Western Siberia is an enormous region that includes the major mountain systems of theAltai, Kuznetskii Alatau and Salair; steppe and forest-steppe massifs, a wide zone ofthe western-Siberian taiga, and the forest-tundra and tundra in Yamal and Gydanpeninsulas, and also smaller Arctic islands. Western Siberia includes the Republic ofGorny Altai, the Yamalo-Nenetskii and Khanty-Mansiysk Okrug (also known asKhanti Mansiski or Khanty Mansiysk), the Altai Territory, the Kemerovo, Novosibirsk,Omsk, Tomsk, and Tyumen regions. The main natural axis of the region is the ObRiver, with its main tributary of Irtysh. The riverheads of the Ob are the rivers of Biyaand Katun, which rise in the Altai Mountains. The sources of Irtysh and its bigtributary Tobol lie beyond Russia. The most important tributary of the upper reaches ofthe Ob River is the Tom River, which rises in the Kuznetskii Alatau Mountains. TheKet, Tym, Vasyugan, Yugan and others take their origin in the watershed swamps ofthe Western-Siberian Lowlands, which accounts for vast spaces between the Irtysh, Oband Yenisei rivers. In the north of the Region, another two big northern rivers, i.e., Purand Taz, flow into the Ob Mouth. There are around 25 thousand lakes in the Khanty-Mansiysk region surrounded by forest and rivers such as the Ob and Irtysh (Source:www.zapovedniks.ru/frames/book/western…/western_siberia%20text.ht. ).
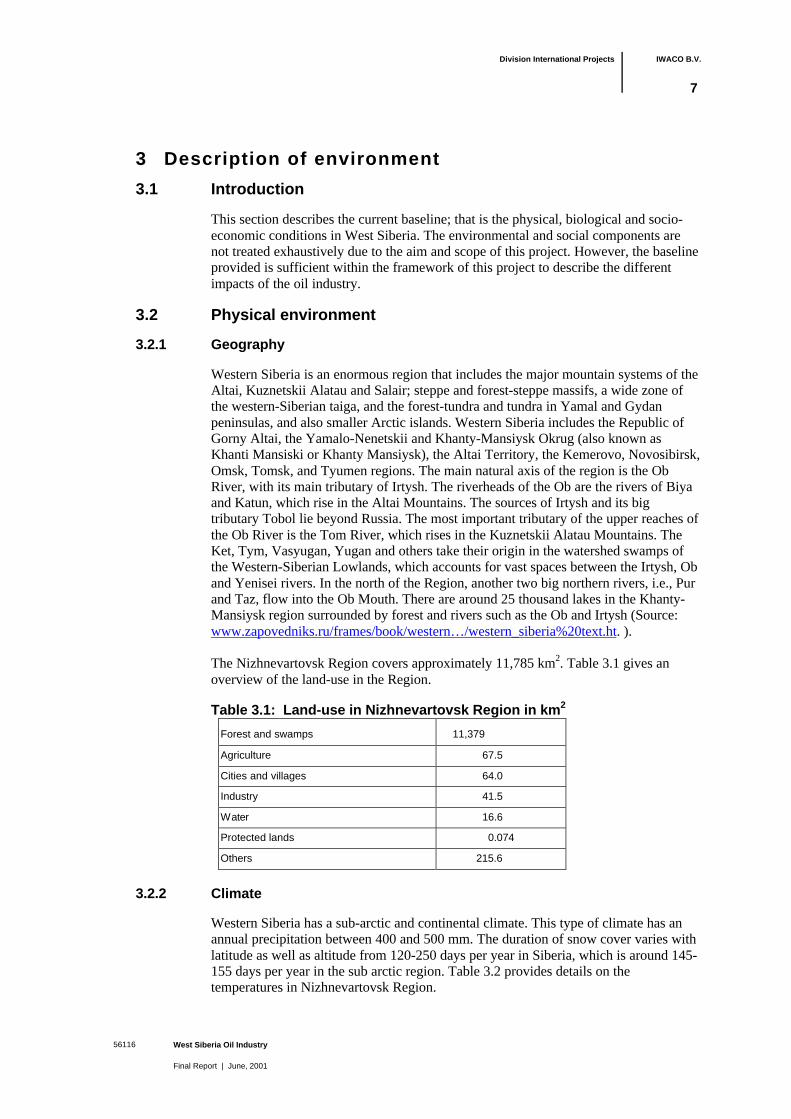
The Nizhnevartovsk Region covers approximately 11,785 km2. Table 3.1 gives anoverview of the land-use in the Region.
Table 3.1: Land-use in Nizhnevartovsk Region in km2
Forest and swamps 11,379
Agriculture 67.5
Cities and villages 64.0
Industry 41.5
Water 16.6
Protected lands 0.074
Others 215.6
3.2.2 Climate
Western Siberia has a sub-arctic and continental climate. This type of climate has anannual precipitation between 400 and 500 mm. The duration of snow cover varies withlatitude as well as altitude from 120-250 days per year in Siberia, which is around 145-155 days per year in the sub arctic region. Table 3.2 provides details on thetemperatures in Nizhnevartovsk Region.
Division International Projects IWACO B.V.
West Siberia Oil Industry
Final Report | June, 2001
56116
8
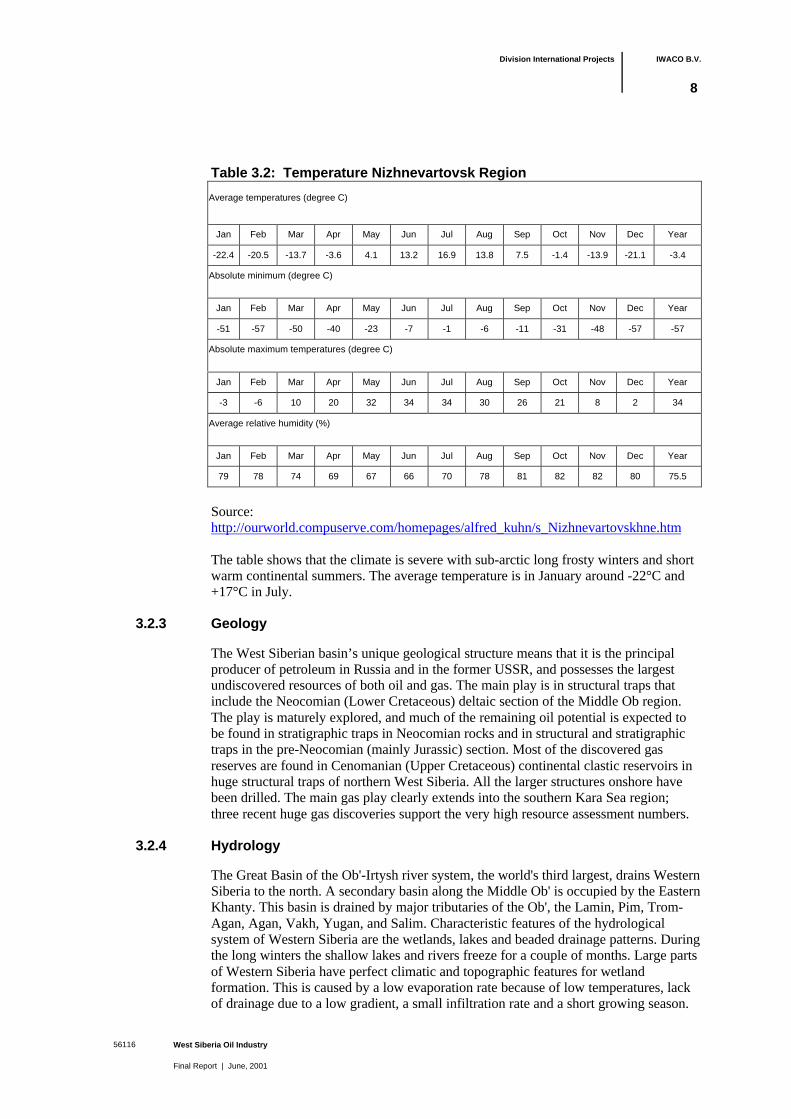
Table 3.2: Temperature Nizhnevartovsk Region
Average temperatures (degree C)
Jan Feb Mar Apr May Jun Jul Aug Sep Oct Nov Dec Year
-22.4 -20.5 -13.7 -3.6 4.1 13.2 16.9 13.8 7.5 -1.4 -13.9 -21.1 -3.4
Absolute minimum (degree C)
Jan Feb Mar Apr May Jun Jul Aug Sep Oct Nov Dec Year
-51 -57 -50 -40 -23 -7 -1 -6 -11 -31 -48 -57 -57
Absolute maximum temperatures (degree C)
Jan Feb Mar Apr May Jun Jul Aug Sep Oct Nov Dec Year
-3 -6 10 20 32 34 34 30 26 21 8 2 34
Average relative humidity (%)
Jan Feb Mar Apr May Jun Jul Aug Sep Oct Nov Dec Year
79 78 74 69 67 66 70 78 81 82 82 80 75.5
Source:http://ourworld.compuserve.com/homepages/alfred_kuhn/s_Nizhnevartovskhne.htm
The table shows that the climate is severe with sub-arctic long frosty winters and shortwarm continental summers. The average temperature is in January around -22°C and+17°C in July.
3.2.3 Geology
The West Siberian basin’s unique geological structure means that it is the principalproducer of petroleum in Russia and in the former USSR, and possesses the largestundiscovered resources of both oil and gas. The main play is in structural traps thatinclude the Neocomian (Lower Cretaceous) deltaic section of the Middle Ob region.The play is maturely explored, and much of the remaining oil potential is expected tobe found in stratigraphic traps in Neocomian rocks and in structural and stratigraphictraps in the pre-Neocomian (mainly Jurassic) section. Most of the discovered gasreserves are found in Cenomanian (Upper Cretaceous) continental clastic reservoirs inhuge structural traps of northern West Siberia. All the larger structures onshore havebeen drilled. The main gas play clearly extends into the southern Kara Sea region;three recent huge gas discoveries support the very high resource assessment numbers.
3.2.4 Hydrology
The Great Basin of the Ob'-Irtysh river system, the world's third largest, drains WesternSiberia to the north. A secondary basin along the Middle Ob' is occupied by the EasternKhanty. This basin is drained by major tributaries of the Ob', the Lamin, Pim, Trom-Agan, Agan, Vakh, Yugan, and Salim. Characteristic features of the hydrologicalsystem of Western Siberia are the wetlands, lakes and beaded drainage patterns. Duringthe long winters the shallow lakes and rivers freeze for a couple of months. Large partsof Western Siberia have perfect climatic and topographic features for wetlandformation. This is caused by a low evaporation rate because of low temperatures, lackof drainage due to a low gradient, a small infiltration rate and a short growing season.

Division International Projects IWACO B.V.
West Siberia Oil Industry
Final Report | June, 2001
56116
9
Hydrology is also affected by permafrost, resulting in a complex pattern of drainageand vegetation. Natural thermokarst occurs as subsidence due to melting ground ice.`Patterned ground` is a product of frost action, with unsorted high centre and lowcentre polygons being the most common features. Other hydrological features includethaw lakes, thermokarst pits, ground ice lenses and pingos. Tyumen and Surgut lie inareas prone to flooding and thermal activities but with no active permafrost,Nefteugansk and Nizhnevartovsk in areas of partial permafrost with some ice cover(Interview: Institute of Ecology).
The Regional Environmental Committee of Nizhnevartovsk report that more than 2000rivers and streams are located in the Nizhnevartovsk Region with a total length of4000 km. There are 2,5 thousand lakes on the territory of the Region. Torm-Emtor isthe biggest lake. Other big lakes like Samotlor, Kimil-Emtor and Beloe are situated inthe Samotlor oil field. The surface water of the Region contains high quantity ofnaturally occurring iron, manganese and ammonium.
3.2.5 Soils
Temperature and permafrost largely determine soil depth and type in the project area.Soils are typically shallow, low in temperature and deficient in nutrients. WesternSiberia is the largest peat region of the world, with the dominant soil in the Taiga beingpodzols, mixed with sandy soils on ridges, commonly formed from glacial moraine.Areas of boreal forest with high moisture levels are the most suitable for the formationof peat. The limited decomposition cycle results in a build-up of organic material overtime. In addition, the combination of low temperatures and frequently waterloggedconditions reduces microbial activities in the soil, thus slowing the rate of decay ofvegetation. Consequently there is a large accumulation of energy and nutrients in deadorganic matter and a scarcity of freely available nutrients’ (IUCN, 1993). Other soiltypes found in West Siberia are classified as a `loess-like loam` in southern WestSiberia, `light clay` in Tyumen region and `light clay premier` in the Surgut area(Interview: Moscow State University).
3.2.6 Radioactivity
According to the Nizhnevartovsk Regional Environmental Committee radioactivity inthe Nizhnevartovsk Region complies in general with the Russian standards. The naturalbackground level of gamma radiation is between 4 and 8µ/hour and the norm is 33µ/hour. The Federal Monitoring Service of Radiation Safety reports that gammabackground levels are even and low for the whole region; 8-13 µR/h. (0,7-1,1mSv/y) Amaximal level of 17 µR/h (1,5mSv/y) was recorded in Nizhnevartovsk in 1993. Theconcentration of natural radionuclides in the soil, water and vegetation ofNizhnevartovsk, Megion and other cities of the region, and in places with definiteradioactive contamination, is reported in general to not exceed the norms. However, insome areas soil radioactivity with created/non-natural radionuclides, mainly with St90
and Cs137 has been reported.
First research in the field of environmental radiology in Nizhnevartovsk Region startedin 1993 at the initiative of the Ecological Committee, financed by NizhnevartovskRegional Independent Ecology Fund. In 1993 the presence of radionuclides in thenatural environment of the region was studied to assess contamination levels. At thesame time gamma tests were carried out (ground and aviation gamma tests) in the citiesand the territories around the cities and oilfields. In 1992, a radioactivity control labopened in Nizhnevartovsk, also financed by the Nizhnevartovsk Ecology Fund.
Division International Projects IWACO B.V.
West Siberia Oil Industry
Final Report | June, 2001
56116
10
The laboratory records natural gamma background daily in the city and 11 othersettlements of the region, and carries out a number of food, water, wells, equipmentand company inspections, also checks the oil sector for radioactivity
The Federal Monitoring Service of Radiation Safety reports that since 1978 nounderground A-bomb tests were performed in Nizhnevartovsk Region and there havebeen no accidents or radioactive leakages recorded and registered.
3.3 Biological environment
3.3.1 Fresh water environment
The Middle Ob River Basin ecosystem is characterised by wetlands consisting ofriverine floodplains with Spaghnum raised bogs. Peat mosses and cotton grasses arewidespread. The quality of the Ob, one of the main Russian rivers, was characterised in1996 and 1997 in terms of ‘a considerable level of water contamination`, from ‘slightlypolluted’ to `dirty` (Russian State Committee for Environmental Protection 1997,1998).
3.3.2 Terrestrial environment
FloraThe terrestrial environmental consists of sub-arctic, taiga, boreal forest and bog at anelevation of between 25 and 100 meters above sea level. The taiga occupies theRussian and West Siberian plains. A distinction is made between the Western Taigaand Eastern Taiga (beyond the Yenisey River). In the Western part dense forest ofspruce and fir occurs in moister areas, alternated with pine, shrubs and grasses. TheTaiga is the world largest timber reserve. There are large stands of birch, alder, andwillow forests along the rivers and streams. In the poorly drained areas, swamp and(Spaghnum) peat bog exist, flanked by islands and strips of pine forest. The projectarea is characterised by the latter.
The main taiga forest species are the Siberian spruce and Siberian pine, with Siberiantrue moss, lichen and sphagnum forests, with pine lichen and cowberry forests. Thereare about 360 plant species, including 45 trees and shrubs. Fir-spruce and fir-spruce-Siberian pine true moss, lichen and sphagnum forests prevail. The under story isformed by Tartar dogwood, bird cherry, guelder rose, honeysuckle; the herb-shrublayer is formed by cowberry, blackberry, blueberry, ledum, crowberry. Swamps withthick peat mosses are widespread in watersheds. The pine forests and moors have athick cover of developed reindeer moss, which serve important habitats of game birdsand reindeer. Sandy soils and ridges tend to supporting forests, comprised of theSiberian pine and spruce. A mixture of larch, fir, birch and Siberian pine can be foundalternated with thickets of alder and willow. Tatar dogwood, bird cherry, guelder rose,honeysuckle, and duschekia fruticosa form the under-storey. Cowberry, whortleberry,andromeda polyfolia, field and wood horsetail, blackberry, blueberry, ledum andcrowberry commonly form the herb-shrub layer. Wood sorrel and maylily can befound.
FaunaCommon fauna in the middle taiga include: wild reindeer, moose, brown bear, lynx,sable, red fox, wolf, European hare, squirrel, chipmunk, wolverine, sable and ermine.European Beaver colonies are present and are a protected species.

Division International Projects IWACO B.V.
West Siberia Oil Industry
Final Report | June, 2001
56116
11
Characteristic birds include the capercaille, black grouse, willow grouse, hazel grouse,white tailed eagle, nutcracker and Siberian jay. The Northern part of the area includesimportant migratory routes for species such as the Siberian crane and red-breastedgoose. Other species include Berwicks swan, Whoopers swan, Common eider, Kingeider, Stellers eider, Long tailed duck and the Northern fulmar. Sea birds found in thenorthern areas include the Glaucous gull, Black legged kittiwake, Ivory gull, Little aukand Brunnichs guillemot.
In water bodies over twenty fish species have been identified, including BelugaSturgeon, Carp (carass), Atlantic Salmon, Inconnu, Whitefish, Smelt, Pike, Burbot,Perch, Arctic flounder, Sosva herring, Elets, Siga, Nalim and Grayling. The SiberianSturgeon is, due to over-exploitation, diminishing in the project area, and in 1998 listedin the Russian Red Book as a rare species. According to the Regional EnvironmentalCommittee of Nizhnevartovsk, there are twenty species of fish in NizhnevartovskRegion, classified into seven families and six groups/subfamilies. The mainpopulations are of Siberian Sturgeon, Nelma, Muksun, Pike and Carp. The Muksun,migrates between the Ob in the Tomsk region and Irtish River.
The water bodies of the Khanty Mansiysk District serve as transit passages for certainkinds of fish on their way to the places of multiplication (Sturgeon, Siga, Nalim).
Endangered speciesRare animal species are listed in the Russian Federation `Red Book`. West Siberiacontains in between 8 to 13 listed species (Fesach, 1994), which includes beavers and,since 1998, the Siberian Sturgeon.
Species of commercial interestA number of commercially important species are found in West Siberia, these includeReindeer (for meat and hides), Fox, Wolverine and Sable (for fur). Fish species includeMuksun, Nalim, Siga, Beluga, Carp (carass), Atlantic Salmon, Whitefish, Pike, Burbot,Perch and Arctic flounder. The Regional Ecological Committee of Khanty Mansiyskreported in 1998 that 33% of fish caught in internal water bodies of the RussianFederation were caught in the Ob-Irtish basin. For the last 5 years the average catch offish in the water bodies of the District has been 3,7 thousand tons. Catches of Sturgeonhave been decreasing; between 1955-1958, 194 to 223 tons of Sturgeon were caught,since 1995 turgeon catches have not exceeded 6 tons a year. The lowest catch, 1.5 tons,was recorded in 1995.
Protected areas and nature reservesThere are a number of protected areas, parks and reserves in West Siberia (seeAppendix 8). The areas Yugansky Zapovednik and the proposed Yuganski KhantyBiosphere Reserve are located just south of Nizhnevartovsk.
Division International Projects IWACO B.V.
West Siberia Oil Industry
Final Report | June, 2001
56116
12
3.4 Socio-economic and cultural environment
3.4.1 Regulation and Legislation
National legislation concerned with the effect of oil activities on the environmental iscontained in the following acts:
- (State Regulation) Law on Conservation/Use of Natural Resources andEnvironment 19.12.1991This is the main law on Environment Protection and sets out the basic principlesand rights for environmental protection, including which activities should notcause harm to the environment, inadmissible activities, assistance in environmentalemergencies, the different levels of state responsibilities for the environment. Itcovers the principle of `polluter pays`, such that oil companies have to pay – viatariffs- for environmental damage caused in the past and present. The currentprivatised oil companies are also legally responsible for former activities in thegeographical area of Khanty Mansiysk (Interview: Ministry of Fuel and Energy)
- Federal Law 78-FZ On State Regulation of Social and Economic Development ofthe Northern Part of the Russian Federation 1996Clause 12 of the Law, effective from July 19,1996 regulates questions ofenvironment protection from the point of view of creation of specially protectednatural territories and ethno-ecological areas in the North.
- #168 Provision of the government of RF On Licensing of Economic ActivityRelated to Environment Protection, Feb 26,1996
- Regulations on Carrying Out State Ecological Monitoring by Officials of theMinistry of Environment Protection and Natural Resources of the RF and itsTerritorial Bodies
- Law on Atmosphere Conservation 1982There is a list of Maximal Air Concentrations (MACs) of pollutants in atmosphericair of built-up areas approved by the USSR Health Ministry No 3086-84, 1984.This list quotes short-term (20min) and 24-hour maximal concentration of airpollutants. It is understood that this list presents emissions in urban (built-up) areasrather than emissions of industrial plants. The Russian air quality limits aresignificant lower than those set by the World Health Organisation and theAmerican Conference of Government Industrial Hygienists. It should also be notedthat the Russian air quality standards are stringent.
- Law on Ecological Expertise 1995This `EIA` law sets the procedure for identification of the compliance of theplanning activities with the environmental requirements, i.e. standards and norms,etc., in order to prevent any possible negative impact on the environment, humanhealth and habitats. I was effective from Nov 15, 1995
The ecological expertise according to the Law is based on the principles ofsustainable environmental and economic development and adequate environmentalpolicy. The basis of environmental policy is the procedure of environmentalimpact assessment (so-called OVOS in Russian). The EIA or OVOS has thestandard procedures and can cost up to 3 per cent of the total project budget.
Division International Projects IWACO B.V.
West Siberia Oil Industry
Final Report | June, 2001
56116
13
Furthermore, the procedure, subjects, functions and responsibilities related to theecological expertise are clearly defined in the law about ecological expertise. Thetime frame for the ecological expertise depends on many factors but should notexceed 6 months. In some cases due to the complexity of the proposed project thetime frame of the ecological expertise was at least one year.
Other relevant legislation includes:
- Law on wastes from production and consumption 1998- Forest Code 1997- Law on Application of Atomic Energy 1995- Law on Wastes from Production and Consumption 1998
In 1996, Russian government passed additional acts and sublaws, related, directly orindirectly, to the economic activity in the sphere of economic protection andmonitoring. Some other aspects of environment are regulated also by Water and Landcodes. Current proposals for new legislation include:
- Ministerial Order for preventing and working with liquid wastes(to be proposed inSeptember). This order requires companies to implement a structure or system forhandling and preventing pollution from oil wastes and emergency/contingencyplans and services to deal with major spills. This in a prevention team, whosefinancing would be shared between all oil companies (Interview: Ministry of Fueland Energy).
- Environmental Impact Assessment- Early notification and exchange of information- Mutual consultations- Precautionary principle
Local regulations in the project area include:
- Law on Rational Use of Natural Resources passed in Khanty-MansiyskAutonomous Okrug
- Provision of the Governor About Plan of Activities of Khanty-MansiyskAutonomous Okrug Administration in the Sphere of Environment Protection # 157effective from 04.05.96
- Provision of the Governor of Khanty-Mansiysk Autonomous Okrug About LandExploitation Procedures # 105 effective from 21.03.96
- Provision of the Governor of Khanty-Mansiysk Autonomous Okrug AboutSuspending and Prohibiting the Operation of Enterprises and OrganisationsViolating Environment Laws
- Provision of the Governor of Khanty-Mansiysk Autonomous Okrug AboutEcological Education of Population
The Nizhnevartovsk Regional Ecology Committee carries out on the territory ofNizhnevartovsk Region the monitoring of compliance of enterprises with federal andlocal laws on behalf of Federal Ecological Committee and the Territorial Committeefor Ecology of Khanty and Mansiysk Autonomous Okrug. Its activity can be assessedas satisfactory (KMREC). In 1996 850 acts were made in North Region to fineenterprises for violating environmental laws. 54 cases of contamination of environmentwere taken to Prosecutor’s office for further investigation.

Division International Projects IWACO B.V.
West Siberia Oil Industry
Final Report | June, 2001
56116
14
EnforcementEnvironmental monitoring and enforcement are primarily the responsibility of the oilcompanies and local government. Companies are required to maintain a set format withspecific reporting requirements and produce an annual report for their localadministration. A copy is sent to the Ministry of Fuel and Energy, who complies acontribution towards the Annual State Environmental Report, with a description andamalgamated data and accident reports. Other monitoring data is obtained from formsfilled in for the Federal Statistics and State Statistics department. Many laws to protectthe environment in Russia do not work due to different reasons, i.e. lack ofenforcement, weak institutions, red tape, slow pace of economic reforms, etc.
The status of enforcement of environmental laws is currently unclear due to areorganisation of the major institutional actors in the environmental field in Russia. InMay 2000 a decree announced by Vladimir Putin announced that the State Committeefor Ecology (SECP, also known as the State Committee for Environmental Protection)and the Forest Service were to be brought under the Ministry of Natural Resources.The decree has provoked strong reactions. The SCEP was responsible for monitoring,enforcement and environmental protection. The Ministry of Natural Resources isresponsible for exploitation of natural resources such as oil and forestry. Criticisms ofthe reorganisation focus on the capacity of a one organisation to both protect andexploit natural resources. For example, 67 Russian and international organisationscriticised the World Bank’s loans to Russia and the uncertain impact of the status of amonitoring, enforcement and protection body for the environment, in the light of thenow `legally questionable` status of the SCEP.( www.paceenv.org )( www.unfoundation.org/unwire/archives )
There are expectations in the Russian environmental journalists and NGO communitiesthat the dissolution of the SCEP will make it easier for both Russian and internationaloil companies to exploit the oil in West Siberia without regard to environmental andsocial consequences. The example of Sakhalin in Russia’s Far East was quoted as abad example of where the Russian and international companies were able to `getround` legislation. It was predicted that this would be made easier in the future withoutan SCEP organisation acting as watchdog and safeguard for environmental interests(Interview: Russian Environmental Movement). There are often long timescales andlarge costs of `prescriptive` environmental impact assessments and complying withregulatory requirements. Up to 13 separate, different permits from different authoritiesmust be required for new oil field developments, taking up to 8% of the total projectbudget (Interviews: Wintershall, Russian Environmental Movement ). Anenvironmental fee is payable to the local Oblast authorities to recompense forenvironmental damage caused by a project. This is partially a fixed amount andpartially negotiated with individual companies. To compensate for indirect and socialbenefits. Both the local Oblast authorities and the national government have a say in oilfield developments, particularly where international companies are concerned.Sometimes the jurisdiction and powers between central and local government, andsubsequently receipt of the environmental fee, is not clear. This can cause projectdelays and costs. For oil field developments this meant that environmental interest areoften seen as hurdles to project development instead of necessary measures.

Division International Projects IWACO B.V.
West Siberia Oil Industry
Final Report | June, 2001
56116
15
3.4.2 Demography
The Tyumen Oblast Committee for Protection of Environment and Natural Resourcesstated in their report: “The ecological situation, the use of natural resources and natureprotection of the Tyumen Oblast, 1994” that the death rate is taking over birth rate withthe lowest population growth of only 0.8 on thousand inhabitants. The increase indeath rate of children continues, in some regions with 40 on 1000 new born.
The Regional Ecological Committee of Khanty Mansiysk Report of 1998 and StateStatistical Committee report that the population of the Khanty Mansiysk District as of01.01.99 was 1369.5 thousand., 12 thousand more than in 1997. A noticeable increaseof population occurred in the cities of Langepas 2.3 thousand , Surgut & Hanti-Mansiisk 1.3 thousand people and Nizhnevartovsk 0.1 thousand.
These cities are some of the main centres of oil and industrial activity, and haveexperienced considerable growth since the oil boom in the 1960s, particularly with aninflux of immigrants from other regions in Russia into the area. The influx of migrantsinto the area totalled 300,000 in 1989. Nizhnevartovsk for example, is a young city; 25years old, its demography being strongly linked to the development of the Samotloroilfield. It grew from 17.000 in 1970 into 300.000 in 1999( http://www.suri.ee/eup/ob.html ).
The District has the second highest natural population growth in Russia. According tothe State Statistical Committee the natural growth of the population for the year of1998 reached 21%.
Table 3.3: Population characteristics of Khanty Mansiysk District
City Birth
‘97
Death
’97
Birth
‘98
Death
‘98
Nat Growth
‘97
Nat Growth
‘98
Nizhnevartovsk 10.0 5.1 10.5 5.3 5.0 5.7
Nefteugansk 10.6 6.3 11.0 5.3 4.3 5.7
Langepas 12.2 2.9 13.6 3.2 9.3 10.4
District 10.9 6.3 11.4 6.0 4.6 5.4
According to the Nizhnevartovsk Regional Environmental Committee The birth rate inNizhnevartovsk City in 1998 was 10,9 on 1000 inhabitants and the death rate was 5,2.Data of previous years are given below in Table 3.4.
Table 3.4: Dynamics in Demographic Situation in Nizhnevartovsk, 1990 to 1996
Indicators Unit of Measure 1990 1991 1992 1993 1994 1995 1996
Population Abs. 259,900 247,874 243,472 242,363 240,593 239,151 238,323
Born Abs.
Abs. /1000
3,982
16.0
3,404
13.8
2,623
10.7
2,403
9.8
2,647
11.0
2,443
10.2
2,515
10.0
Deceased Abs.
Abs . /1000
884
3.5
900
3.6
1,240
5.1
1,707
7.0
1,709
7.1
1,702
7.1
1,505
6.3
Deceased before and
at the age of 1
Abs
Abs. / 1000 born
85
21.3
74
22.0
86
32.7
61
25.4
39
14.7
51
20.8
27
10.3
Natural growth 13.5 10.2 5.6 2.8 3.9 3.1 3.7
Division International Projects IWACO B.V.
West Siberia Oil Industry
Final Report | June, 2001
56116
16
3.4.3 Health
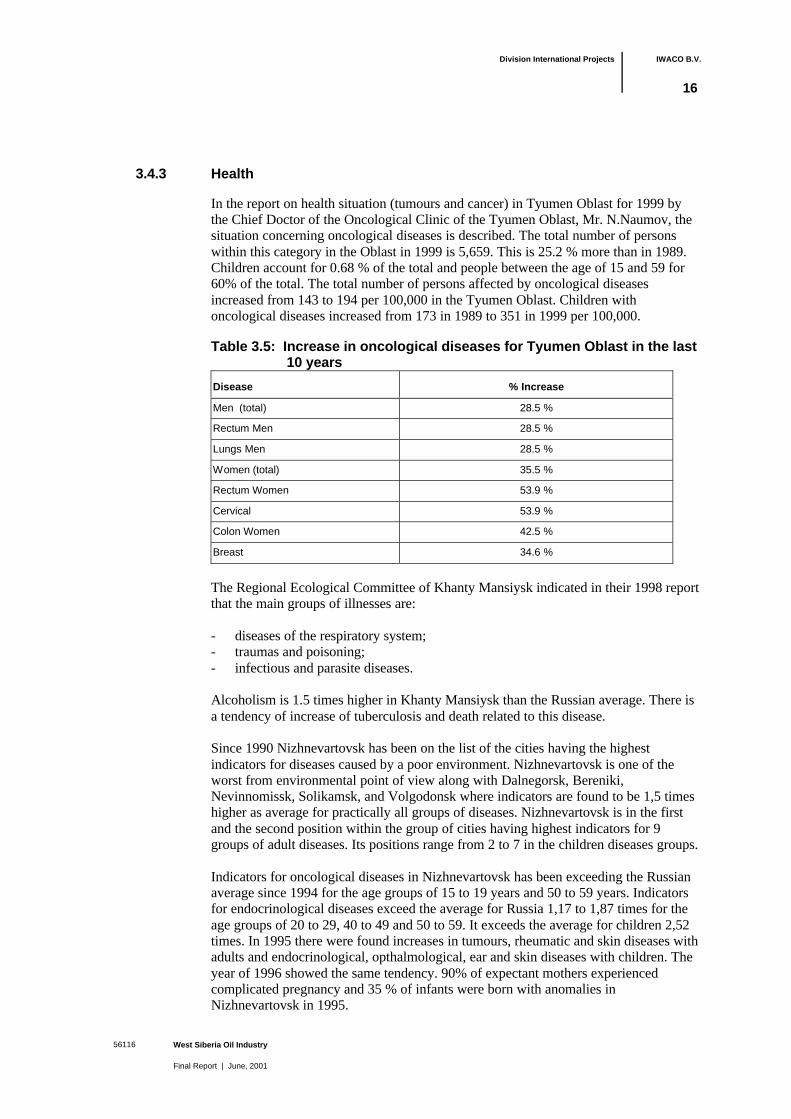
In the report on health situation (tumours and cancer) in Tyumen Oblast for 1999 bythe Chief Doctor of the Oncological Clinic of the Tyumen Oblast, Mr. N.Naumov, thesituation concerning oncological diseases is described. The total number of personswithin this category in the Oblast in 1999 is 5,659. This is 25.2 % more than in 1989.Children account for 0.68 % of the total and people between the age of 15 and 59 for60% of the total. The total number of persons affected by oncological diseasesincreased from 143 to 194 per 100,000 in the Tyumen Oblast. Children withoncological diseases increased from 173 in 1989 to 351 in 1999 per 100,000.
Table 3.5: Increase in oncological diseases for Tyumen Oblast in the last 10 years
Disease % Increase
Men (total) 28.5 %
Rectum Men 28.5 %
Lungs Men 28.5 %
Women (total) 35.5 %
Rectum Women 53.9 %
Cervical 53.9 %
Colon Women 42.5 %
Breast 34.6 %
The Regional Ecological Committee of Khanty Mansiysk indicated in their 1998 reportthat the main groups of illnesses are:
- diseases of the respiratory system;- traumas and poisoning;- infectious and parasite diseases.
Alcoholism is 1.5 times higher in Khanty Mansiysk than the Russian average. There isa tendency of increase of tuberculosis and death related to this disease.
Since 1990 Nizhnevartovsk has been on the list of the cities having the highestindicators for diseases caused by a poor environment. Nizhnevartovsk is one of theworst from environmental point of view along with Dalnegorsk, Bereniki,Nevinnomissk, Solikamsk, and Volgodonsk where indicators are found to be 1,5 timeshigher as average for practically all groups of diseases. Nizhnevartovsk is in the firstand the second position within the group of cities having highest indicators for 9groups of adult diseases. Its positions range from 2 to 7 in the children diseases groups.
Indicators for oncological diseases in Nizhnevartovsk has been exceeding the Russianaverage since 1994 for the age groups of 15 to 19 years and 50 to 59 years. Indicatorsfor endocrinological diseases exceed the average for Russia 1,17 to 1,87 times for theage groups of 20 to 29, 40 to 49 and 50 to 59. It exceeds the average for children 2,52times. In 1995 there were found increases in tumours, rheumatic and skin diseases withadults and endocrinological, opthalmological, ear and skin diseases with children. Theyear of 1996 showed the same tendency. 90% of expectant mothers experiencedcomplicated pregnancy and 35 % of infants were born with anomalies inNizhnevartovsk in 1995.
Division International Projects IWACO B.V.
West Siberia Oil Industry
Final Report | June, 2001
56116
17
Data from “AGIS – Environment and Health” show that illnesses related to ecologicalproblems in the city Nizhnevartovsk in the period 1991-1996 are between 1.3 and 3.6times higher than average for Russia. In the city Nizhnevartovsk the total of illnesses in1998 has increased significantly compared to 1991. The worsening of the ecologicalsituation in combination with the prevailing climatic conditions lead to an importantworsening of the population its health, especially that of children. In 1991 there were351 cases of cancer on a total population of 248,734 while in 1993, there were 892cases out of a population of 243,604.
According to the State Service Sreda –Zdorovie (Environment-Health) the situation inNizhnevartovsk health standards are critically low; since 1990 the city ofNizhnevartovsk has been among the group of cities with highest indicators of diseasesamong children and adult population in Russia. The indicator for oncological diseases(tumours of different etymology) is 2 to 3 times higher than anywhere else in Russia,within the age group of 15 to 49. Cardiological diseases exceed the average indicatorfor Russia 9 times, while endocrinological diseases exceed the average indicator 2 to 5times.
3.4.4 Socio-Cultural Environment
Indigenous peopleThe indigenous people of Western Siberia largely depend on natural resources inparticular plants and animals. There are three main groups of native people living inthe project area, the Khants (also known as the Eastern Khanty), Mansis (also knownas Volguls) and the Nenets. Their traditional livelihood was conducted over a large,dispersed area along the Ob River and its tributaries in a semi nomadic way.Subsistence consists mainly of reindeer herding, hunting and fishing. The Khants andMansis culture is based on extensive clan systems, a native religion, language and atraditional way of life in widely separated extended family settlements on traditionalhunting territories. The hunting territories vary in size depending on the size of familymembers usually they are between 400 and 600 hundred square kilometre. The familysize varies between six to forty individuals. Their culture was born in and isspecifically adapted to the forest and swamp ecosystem of Western Siberia middletaiga. The families follow a seasonal round between their main summer place near theriver and a hinterland winter location in between these two locations there are severalcamps. The route differs depending on the availability of food and fur resources; themost important fur-bearing animals being sable, fox and mink. The turnover from thesale is used to buy basic products like ammunition, spare parts of snowmobiles andother needed supplies. The major food supplies during wintertime are moose and fish.
Since the 1950s, the traditional lifestyle for a number of indigenous peoples has begunto disintegrate and change. Many now do not practice the traditional nomadic lifestyleand live in urban areas. The Khants and Mansis have become insignificant minoritiesin their own historical settlement areas: The percentage of Khants decreased from 9.2%in 1959 to 1.8% in 1989. The percentage Mansis decreased from 6.2% in 1938 to 0.6%in 1989.
During the last decade they have become entitled to claim ownership of theirtraditional lands and rights to the traditional subsistence practices that they are used to.This has contributed to the development of a fairly active environmental protection andindigenous rights movements.

Division International Projects IWACO B.V.
West Siberia Oil Industry
Final Report | June, 2001
56116
18
4 Oil industry in West Siberia
This section presents an overview of the historical and current oil activities andfacilities in West Siberia.
4.1 General
The Russian Federation is one of the top five world’s largest energy producers andresponsible for 7% of the worlds total energy consumption. It is variably second orthird world largest exporter of petroleum. Within Russia, West Siberia is the mosthighly developed oil and gas region (Fesach 1994), with significant unexploredstructures in the northern and eastern Siberian territories. About 78% of oil producedby the Russian Federation comes from Siberia. The main oil producing fields withinWest Siberia lie in the Tyumen and Khanty Mansiysk Autonomous Okrugs (Districts).Together with gas, oil accounts for 30% of hard currency earnings for Russia.
In the mid 1950s oil was first discovered in the basin of the middle Ob River. Greatchanges took place in the northern districts, where in the 1960s, world-important oiland gas fields were discovered. Through the forest and swamps, railroads wereconstructed, new cities appeared as Surgut, Nizhnevartovsk, Nadym and Urengoi. Bythe 1980s, the Samotlor field, near Nizhnevartovsk, was one of the main oil producingfields. By 2000, 62,000 oil wells have been drilled and around 64,000 kilometre ofpipelines has been built in the Khanty-Mansiysk Autonomous Region. 112 oil fieldshave been now in exploitation in the last 10 to 20 years, 38 for more than 20 years and7 for more than 30 years. 166.7 million tons of oil was produced in 1998. From 1990 to1998 the decrease in production reached 45.5 %.
During the development of the oil fields and operation up till the 1990s, notechnological schemes or consideration was made for the environmental impacts of theoil activities. This has lead to much of the extremely poor environmental performanceof the current industry. Today, when the requirements for environmental performanceare clearly defined, environmental safe technological systems of oil production andtransportation are still not accepted. The task of the reconstruction of the existingpipelines and the oil production equipment and increasing the safety of operationalequipment proved to be impossible. According to some assessments, the level ofphysical depreciation of oil production equipment is 50-70 %, depreciation of pipelinesexceeds 30 % (Interview: Regional Ecological Committee of Khanty Mansiysk).
The privatisation of the oil sector by the government in the early 1990s created themajor oil companies of today, headed by politically important executives from oil,banking and business circles. In 1992 Yeltsin signed a decree creating the first oilcompanies today: LUKoil, Surneftegaz and Yukos, the new breed of so-called`oligarchs`. The top six privately owned oil companies today are LUKoil, Surneftegaz,Yukos, Sidanko, Tatneft and Tyumen Oil Company (TNK), who together account forabout 60% of Russia’s yearly oil production of 265 million tons (1998). Theprivatisation decree did not modify the pre-existing soviet organisational model; thelarge oil companies being created through the merger of regional operating units andrefineries into cluster companies, often set up around the trading arm of the producingunits. Though a formal holding units with shareholding systems were created,organisationally the various operating components remained largely under the controlof an autonomous and often fiercely independent management. This unique form of`confederate` corporate structure has made the re-organisation of the industry and itsrationalisation into western style vertically integrated companies a highly complex,

Division International Projects IWACO B.V.
West Siberia Oil Industry
Final Report | June, 2001
56116
19
and up to date, not very successful process (EBRD, 1999). The changes in shareownership since 1992 have not always been transparent, leading to a lack of clarityabout exact ownership. This has left the real powers of the state, the actual owners ofcompanies not easily identifiable, and the functions and state powers (legally securedin statutes and in nominal capital of the companies) also not clear. The state is howeverrepresented in all oil companies, with majority shareholdings. The Russian oil industryhas been described as “not an open and transparent business and there is nothing to bedone about it, but it is murky everywhere” (Source: Steven Dashevsky, analyst, AtonInvestment Company, Moscow Times June 20, 2000). Many of the oil companies havemultiple joint ventures, subsidiaries and joint stock companies, the exception being themore structurally simple Surgutneftegaz. Companies such as LUKoil are now trying tosmooth over internal contradictions and are now beginning a process of strengtheningintercorporate links, consolidating entrusted enterprises and concentrating profits withthe main holding company. This should be intensified by the `Decree on Urgentmeasures on the improvement of oil companies activity` which sums up theprivatisation process and adds to the 1992 # 1403 decree (Kryukov, 2000). The role ofWestern oil companies in all this is also rather obscure.
As long as oil prices remained high, the holding companies and operating units couldgenerate revenues to keep both sides in balance. However, with the oil price slump inthe mid 1990s and the Russian economic crisis in 1998, oil prices were at an all timelow. In 1998 prices on oil dropped by 20 % in the internal oil market. This forced oiland gas companies to decrease their costs (costs of construction, reconstruction ofpipelines, rehabilitation of pipelines, etc). The crisis and stalled implementation of taxreforms and production sharing agreements affected oil production outputs, with crudeoil and petroleum product output declining sharply since 1998. This was also due to adecline in drilling, lack of necessary capital investment to maintain capital stock.Recent economic problems include mismatching domestic supply and demand ofrefined petroleum products, declining production in major fields, and increasing marketcompetition between oil companies and problems attracting sufficient foreigninvestments. This has affected the rehabilitation, privatisation and upgrading of themajority of the Siberian oil fields. Along with continuing inflation and the economicstagnation during that period, exchange rate of rouble to hard currencies lowering -these circumstances aggravated sharply financial-economic state of oil companies.However cost cutting programs have been considered by the Director Councils ofNizhnevartovskneftegaz, Yuganskneftegaz, Surgutneftegaz and many have departedfrom their earlier declared as paramount goals of "keeping the body of workers" andhave come to the decision on unprecedented, by Russian standards, jobs reduction by20-30%. Rationalisation attempts did not eliminate but have only slowed downfinancial difficulties. Last year, oil enterprises suffered 55% of all losses in the fuel andenergy sector. Until 2000 one of the most persistent problems in the sector has been alack of investment, which badly needs modernisation in order to bring it’s mostlySoviet-era infrastructure up to speed and Western standards. With a few exceptions,most companies have been busy maximising current profits at the expense of their ownfutures and reinvestments (source Moscow Times, June 20 2000) – this has also hadenvironmental and social consequences. Since 2000 the rouble and US dollar oil priceshave remained stable and been rising, and improvements and investments inenvironmental management are now anticipated.
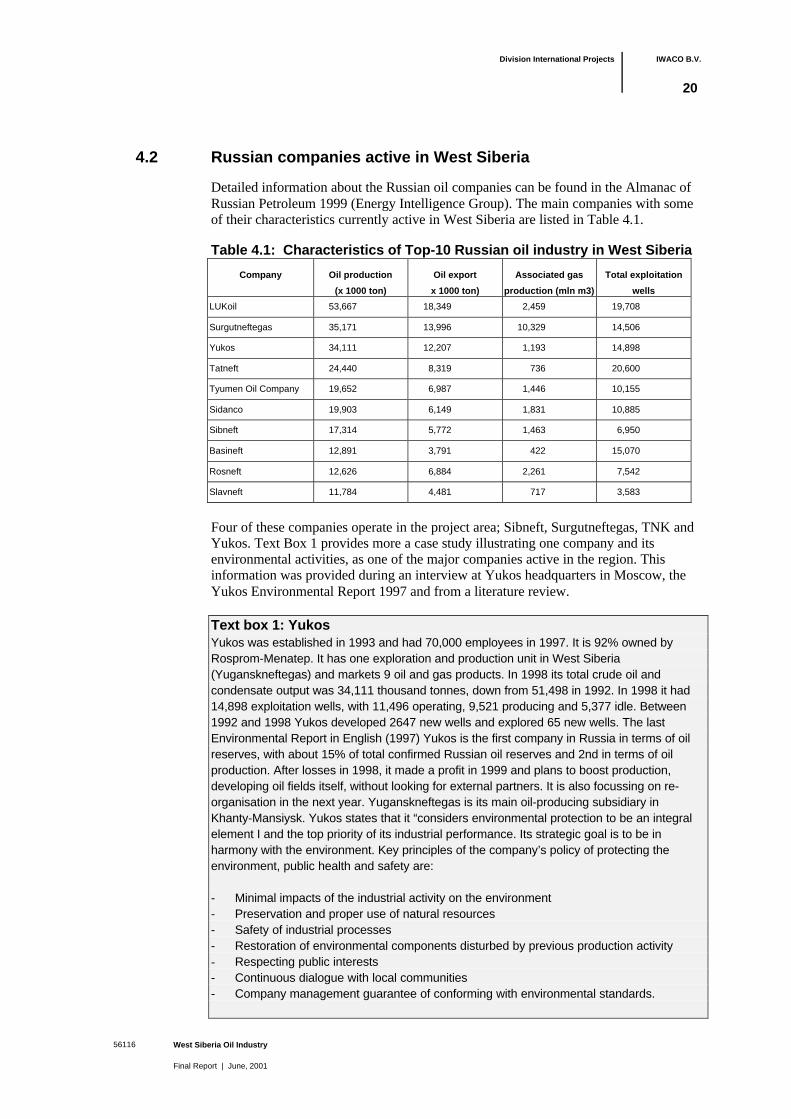
Division International Projects IWACO B.V.
West Siberia Oil Industry
Final Report | June, 2001
56116
20
4.2 Russian companies active in West Siberia
Detailed information about the Russian oil companies can be found in the Almanac ofRussian Petroleum 1999 (Energy Intelligence Group). The main companies with someof their characteristics currently active in West Siberia are listed in Table 4.1.
Table 4.1: Characteristics of Top-10 Russian oil industry in West Siberia
Company Oil production
(x 1000 ton)
Oil export
x 1000 ton)
Associated gas
production (mln m3)
Total exploitation
wells
LUKoil 53,667 18,349 2,459 19,708
Surgutneftegas 35,171 13,996 10,329 14,506
Yukos 34,111 12,207 1,193 14,898
Tatneft 24,440 8,319 736 20,600
Tyumen Oil Company 19,652 6,987 1,446 10,155
Sidanco 19,903 6,149 1,831 10,885
Sibneft 17,314 5,772 1,463 6,950
Basineft 12,891 3,791 422 15,070
Rosneft 12,626 6,884 2,261 7,542
Slavneft 11,784 4,481 717 3,583
Four of these companies operate in the project area; Sibneft, Surgutneftegas, TNK andYukos. Text Box 1 provides more a case study illustrating one company and itsenvironmental activities, as one of the major companies active in the region. Thisinformation was provided during an interview at Yukos headquarters in Moscow, theYukos Environmental Report 1997 and from a literature review.
Text box 1: YukosYukos was established in 1993 and had 70,000 employees in 1997. It is 92% owned byRosprom-Menatep. It has one exploration and production unit in West Siberia(Yuganskneftegas) and markets 9 oil and gas products. In 1998 its total crude oil andcondensate output was 34,111 thousand tonnes, down from 51,498 in 1992. In 1998 it had14,898 exploitation wells, with 11,496 operating, 9,521 producing and 5,377 idle. Between1992 and 1998 Yukos developed 2647 new wells and explored 65 new wells. The lastEnvironmental Report in English (1997) Yukos is the first company in Russia in terms of oilreserves, with about 15% of total confirmed Russian oil reserves and 2nd in terms of oilproduction. After losses in 1998, it made a profit in 1999 and plans to boost production,developing oil fields itself, without looking for external partners. It is also focussing on re-organisation in the next year. Yuganskneftegas is its main oil-producing subsidiary inKhanty-Mansiysk. Yukos states that it “considers environmental protection to be an integralelement I and the top priority of its industrial performance. Its strategic goal is to be inharmony with the environment. Key principles of the company’s policy of protecting theenvironment, public health and safety are:
- Minimal impacts of the industrial activity on the environment- Preservation and proper use of natural resources- Safety of industrial processes- Restoration of environmental components disturbed by previous production activity- Respecting public interests- Continuous dialogue with local communities- Company management guarantee of conforming with environmental standards.

Division International Projects IWACO B.V.
West Siberia Oil Industry
Final Report | June, 2001
56116
21
The company reported that they are committed to resolving environmental problems andaim to become at least leaders of the Russian oil sector in environmental protection,although sometimes working with Russian authorities is difficult; the large number ofauthorities they have to deal with, between 30 and 40 people in the region concerningcontrol, licensing, audit and enforcement. The main environmental problems are thesensitive environment in West Siberia, water pollution and the need for preventivemeasures. They hired consultants Arthur D Little in 1998 to develop an environmentalprotection strategy for the company. Annual meetings are held with local and top managers ,to which government agencies are invited for an open discussion about environmentalissues. Round tables are also organised by operating companies, for example, a recentmeeting in Samara, invited local public and environmental agencies, and was intended sothat the company could react to criticism and advice about environmental and social issues.All company operating units also mandatory publishes an environmental report. Yukoscurrent conducts annual environmental audits and is investigating ISO 140001 certificationand has held 2 recent seminars in Moscow and Siberia to discuss the system and raiseawareness.
Total company production was 36,02 millions of tonnes in 1995, and 35,39 in 1997.Yukosestimate they have spent about $ 30 million in 2000 to tackle environmental problems, thisincludes:
- $11million purchase of 2 process units for drilling waste cuttings from the Americancompany Oil Tools, plus training;
- $3 million ecological monitoring laboratory installed at Nefteugansk;- R 62 million oil sweeping booms purchased from the Finnish company Lamore for
swampy areas pollution containment;- replanting traditional grasslands and purchase of 2 soil cutting/propelling for 12 million
roubles for soil rehabilitation in Samara.
Pollution discharges to air by the company fell from 402,02 thousand tonnes in 1995 to342,14 in 1997. The ration of air pollutants to oil production fell from 6.45 n 1995 to 5.18 in1997. Atmospheric emissions depend largely on the efficiency of associated gas utilisation;76.3% of gas was utilised in West Siberia in 1997. Measures include gas collection systems,gas compressor systems and recovery of gases. Water protection measures depend onwater supply and wastewater. Production water use fell from 1.44m3 per ton of produced oilin 1995 to 1.36 in 1997. Contaminated water discharged into water bodies fell from 2,04m3per ton of produced oil in 1995 to 0,22 in 1997. Producing sites include water meters,process to reuse process water and reducing fresh water pumping. Oil spills are dealt withby Yukos engineering subsidiaries using oil clean up equipment, shallow wells and drainagesystems and groundwater treatment systems. To prevent pipeline oil spills, `pipe-within-a-pipe` designs are used and a programme of rebuilding underwater crossings was inoperation in 1997. Soil protection measures include anticorrosion coating for pipelines;produced by the Yukos plant to replace about 700km of pipes a year. Oil spills areremediated using oil-gathering assemblies; biological peat based reclamation and treatmentof drilling wastes.
Environmental priorities for Yukos are:
- rehabilitation of polluted areas (pore-Yukos);- work over and rehabilitation of pipelines;- establishing environmental services departments in all daughter companies
(Yugansneftegas, Tomnskneft and Samara);- establishing ecological insurance against future risks.
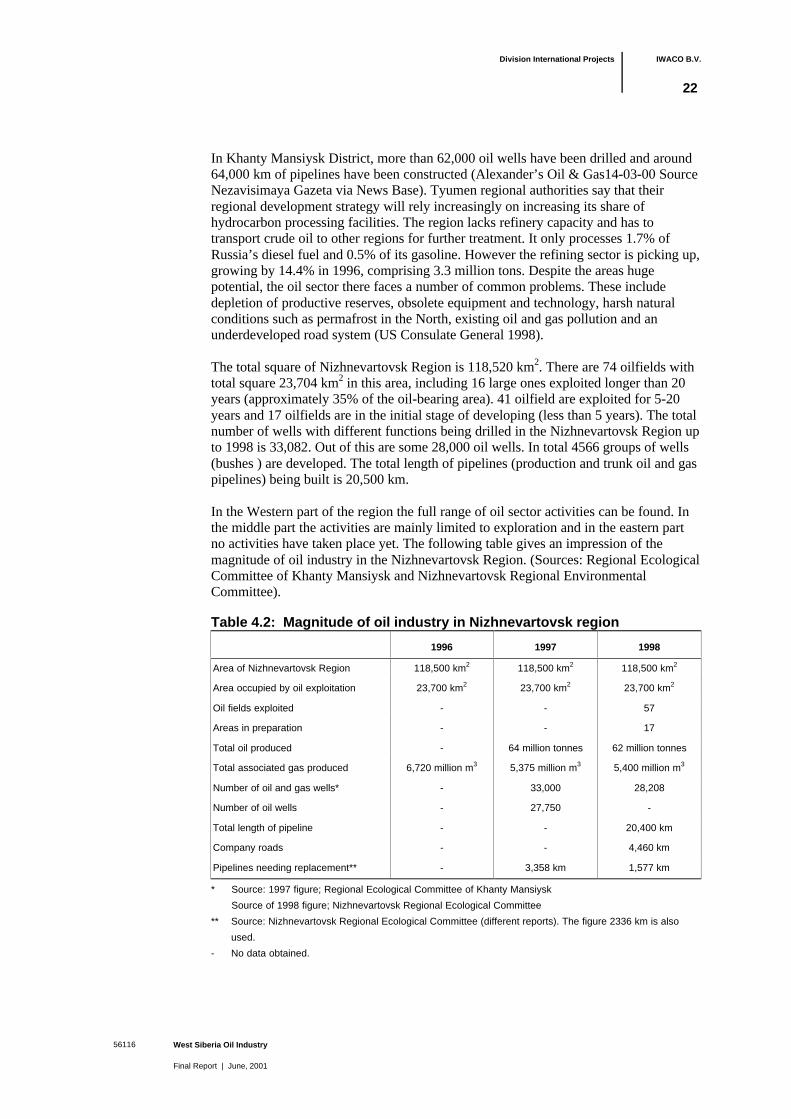
Division International Projects IWACO B.V.
West Siberia Oil Industry
Final Report | June, 2001
56116
22
In Khanty Mansiysk District, more than 62,000 oil wells have been drilled and around64,000 km of pipelines have been constructed (Alexander’s Oil & Gas14-03-00 SourceNezavisimaya Gazeta via News Base). Tyumen regional authorities say that theirregional development strategy will rely increasingly on increasing its share ofhydrocarbon processing facilities. The region lacks refinery capacity and has totransport crude oil to other regions for further treatment. It only processes 1.7% ofRussia’s diesel fuel and 0.5% of its gasoline. However the refining sector is picking up,growing by 14.4% in 1996, comprising 3.3 million tons. Despite the areas hugepotential, the oil sector there faces a number of common problems. These includedepletion of productive reserves, obsolete equipment and technology, harsh naturalconditions such as permafrost in the North, existing oil and gas pollution and anunderdeveloped road system (US Consulate General 1998).
The total square of Nizhnevartovsk Region is 118,520 km2. There are 74 oilfields withtotal square 23,704 km2 in this area, including 16 large ones exploited longer than 20years (approximately 35% of the oil-bearing area). 41 oilfield are exploited for 5-20years and 17 oilfields are in the initial stage of developing (less than 5 years). The totalnumber of wells with different functions being drilled in the Nizhnevartovsk Region upto 1998 is 33,082. Out of this are some 28,000 oil wells. In total 4566 groups of wells(bushes ) are developed. The total length of pipelines (production and trunk oil and gaspipelines) being built is 20,500 km.
In the Western part of the region the full range of oil sector activities can be found. Inthe middle part the activities are mainly limited to exploration and in the eastern partno activities have taken place yet. The following table gives an impression of themagnitude of oil industry in the Nizhnevartovsk Region. (Sources: Regional EcologicalCommittee of Khanty Mansiysk and Nizhnevartovsk Regional EnvironmentalCommittee).
Table 4.2: Magnitude of oil industry in Nizhnevartovsk region
1996 1997 1998
Area of Nizhnevartovsk Region 118,500 km2 118,500 km2 118,500 km2
Area occupied by oil exploitation 23,700 km2 23,700 km2 23,700 km2
Oil fields exploited - - 57
Areas in preparation - - 17
Total oil produced - 64 million tonnes 62 million tonnes
Total associated gas produced 6,720 million m3 5,375 million m3 5,400 million m3
Number of oil and gas wells* - 33,000 28,208
Number of oil wells - 27,750 -
Total length of pipeline - - 20,400 km
Company roads - - 4,460 km
Pipelines needing replacement** - 3,358 km 1,577 km
* Source: 1997 figure; Regional Ecological Committee of Khanty Mansiysk
Source of 1998 figure; Nizhnevartovsk Regional Ecological Committee
** Source: Nizhnevartovsk Regional Ecological Committee (different reports). The figure 2336 km is also
used.
- No data obtained.
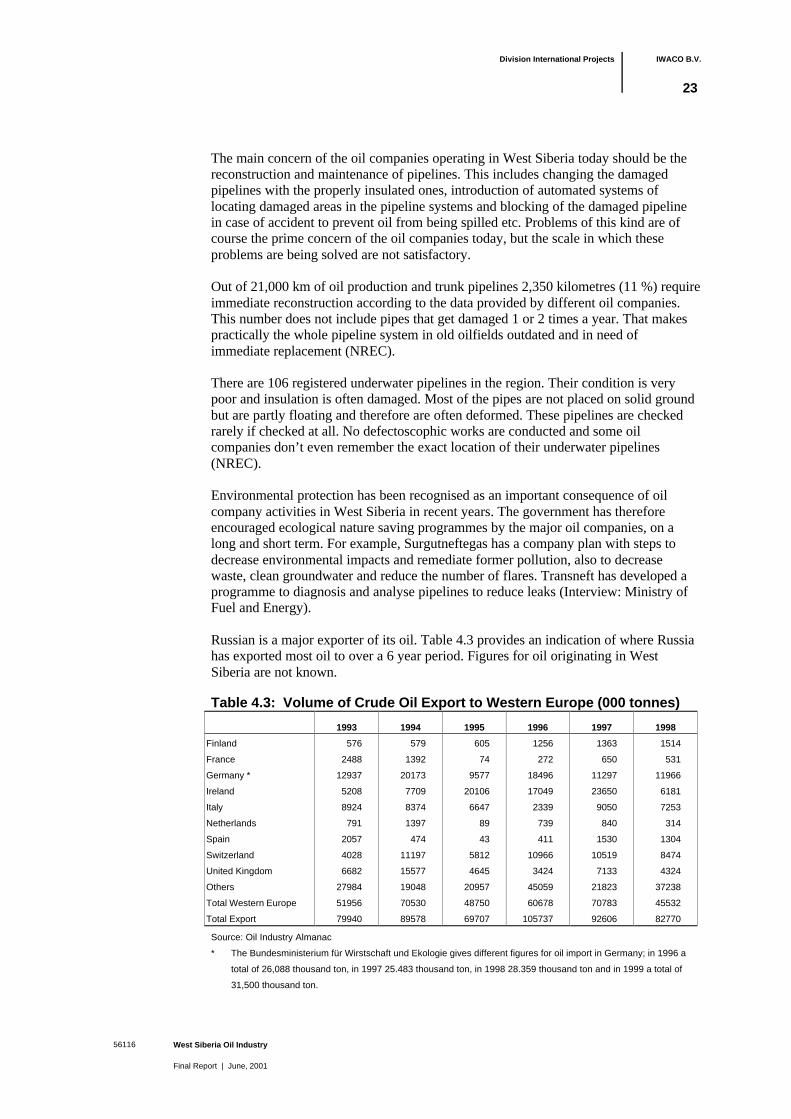
Division International Projects IWACO B.V.
West Siberia Oil Industry
Final Report | June, 2001
56116
23
The main concern of the oil companies operating in West Siberia today should be thereconstruction and maintenance of pipelines. This includes changing the damagedpipelines with the properly insulated ones, introduction of automated systems oflocating damaged areas in the pipeline systems and blocking of the damaged pipelinein case of accident to prevent oil from being spilled etc. Problems of this kind are ofcourse the prime concern of the oil companies today, but the scale in which theseproblems are being solved are not satisfactory.
Out of 21,000 km of oil production and trunk pipelines 2,350 kilometres (11 %) requireimmediate reconstruction according to the data provided by different oil companies.This number does not include pipes that get damaged 1 or 2 times a year. That makespractically the whole pipeline system in old oilfields outdated and in need ofimmediate replacement (NREC).
There are 106 registered underwater pipelines in the region. Their condition is verypoor and insulation is often damaged. Most of the pipes are not placed on solid groundbut are partly floating and therefore are often deformed. These pipelines are checkedrarely if checked at all. No defectoscophic works are conducted and some oilcompanies don’t even remember the exact location of their underwater pipelines(NREC).
Environmental protection has been recognised as an important consequence of oilcompany activities in West Siberia in recent years. The government has thereforeencouraged ecological nature saving programmes by the major oil companies, on along and short term. For example, Surgutneftegas has a company plan with steps todecrease environmental impacts and remediate former pollution, also to decreasewaste, clean groundwater and reduce the number of flares. Transneft has developed aprogramme to diagnosis and analyse pipelines to reduce leaks (Interview: Ministry ofFuel and Energy).
Russian is a major exporter of its oil. Table 4.3 provides an indication of where Russiahas exported most oil to over a 6 year period. Figures for oil originating in WestSiberia are not known.
Table 4.3: Volume of Crude Oil Export to Western Europe (000 tonnes)
1993 1994 1995 1996 1997 1998
Finland 576 579 605 1256 1363 1514
France 2488 1392 74 272 650 531
Germany * 12937 20173 9577 18496 11297 11966
Ireland 5208 7709 20106 17049 23650 6181
Italy 8924 8374 6647 2339 9050 7253
Netherlands 791 1397 89 739 840 314
Spain 2057 474 43 411 1530 1304
Switzerland 4028 11197 5812 10966 10519 8474
United Kingdom 6682 15577 4645 3424 7133 4324
Others 27984 19048 20957 45059 21823 37238
Total Western Europe 51956 70530 48750 60678 70783 45532
Total Export 79940 89578 69707 105737 92606 82770
Source: Oil Industry Almanac
* The Bundesministerium für Wirstschaft und Ekologie gives different figures for oil import in Germany; in 1996 a
total of 26,088 thousand ton, in 1997 25.483 thousand ton, in 1998 28.359 thousand ton and in 1999 a total of
31,500 thousand ton.

Division International Projects IWACO B.V.
West Siberia Oil Industry
Final Report | June, 2001
56116
24
4.3 International oil companies in West Siberia
A number of international business interests are also active in exploration andproduction in West Siberia. Some operate independently, although many operate asjoint ventures with Russian firms. It is difficult to get accurate information about whois active where. The following companies are known to be active in the area:
- BP; 10 % of Sidanco;- Agip International BV (Eni) Severo Pokachevskoye field;- Evidhon (Russian partner Royal Dutch Shell), Slaym field;- Mobil, Nizhnevartovsk drilling analysis;- Bashneft (Republic of Bashkorostan) in the Khazarsky concession, Khanty
Mansiysk;- Goliol, (Teton Petroleum company), Eguryakhskiy territory, near Samotlor;- Geolibent (Purneftegas, Purneftegasgeolicam Benton Oil & Gas Company US),
North Gubkinskoye & Prisklonovoye fields (EBRD loan 1996);- CanBaikal Resources Inc. (Canadian Oil & Gas company), Kulun Poll block.
(Sources: Company web pages, Alexander’s Oil & Gas, Oil Online, BisNis, EBRD, Eni)
Import of (Russian) oil is not a very transparent market. It is concluded in ‘gas en olieuit Siberie’ (Contrast Advies) that all the ‘majors’ like Shell, BP, Esso, Total Fina Elfare probably involved. The Moscow Times (August 4, 2000) reported that Total FinaElf buys 18 to 20 million tons annually form Russia. A Tyumen Oil Company officialsaid that Tyumen Oil Company sells 70% of its export to Total Fina Elf (MoscowTimes). It is inevitable that foreign oil related industries will be involved in Russia’soil industry as well. An example of such involvement is given below, the source isLloyds Energy Day (April 7 and September 12, 2000). The New York Branch of theCommerzbank, guaranteed by the US Export-Import Bank, approved a $500 millionloan for the Tyumen Oil Company. The financial package for TNK supports the sale ofUS made oil and gas equipment and other services to rehabilitate part of the Samotloroilfield and to upgrade the TNK owned Ryazan refinery. Halliburton, Bloomfield andABB Lummus Global are involved.
4.4 Donor agency activities in West Siberia
A number of IFIs and donor agencies have been active in investing in Russia’s oilsector, historically particularly in West Siberia. The rationale behind theseinterventions is that oil revenues constitute an essential economic commodity, are animportant foreign exchange revenue and contribute significantly to Russia’s GDP. Thepotential benefits of exploiting this wealth offer great economic potential, howeverthey need to be balanced against the difficult legacies of state involvement, lack ofmodern technical and legal infrastructure and the economic, social and environmentalrisks.
The World Bank’s strategy for involvement in the energy-environment sector in Russiais based on its overall goal of assistance in Russia to alleviate poverty and to increasehuman well being through building institutional capacity for sustained economicreform and growth, removing of distorted incentives and creating a favourable climatefor private investments. The 1999 Country Assistance Strategy and Energy &Environment Review emphasise that air pollution in urban areas and strengthening ofthe institutional framework for enforcement of existing laws and regulations and goodenvironmental practice are Bank priorities. To implement these goals, Bank assistancemay focus on reducing energy intensity, fuel switching from coal, clean coal options,

Division International Projects IWACO B.V.
West Siberia Oil Industry
Final Report | June, 2001
56116
25
improved fuel oil quality and vehicle abatement measures. The Bank has chosen tofocus on the Rostov region for these areas. The other proposed initiative that focuseson the oil sector include a reduction of associated gas flaring. The Bank aims toimplement its objectives by working in close co-operation with EU member states, andpossibly with TACIS, Global Environment Facility (GEF), the Prototype Carbon Fund(PCF) and or the IFC, mainly through technical assistance. For example for greenhousegas reduction instruments and gaps in data required in developing mitigation strategiessuch as air quality monitoring, public health, emission and fuel inventories. The WestSiberian oil sector is not included in the proposed future Bank initiatives, particularlyas Bank policy excludes investment in private companies (this is the mission of theIFC). Also, as the Bank works in a sector or subject at the invitation of the hostcountry, and it has not received an expression of interest from the Russian governmentfor assistance in the oil sector (Interview: World Bank). New lending from the WorldBank to Russia is also heavily dependent on the implementation of Russian Federalgovernmental structural reforms (Moscow Times, 2 August 2000).
Past World Bank projects have focussed on the West Siberian oil sector, although notin this project area. For example, the Bank contributed to the first `Russian OilRehabilitation Project` in 1993 and contributed $500 million to the financing plan forUS$ 890million required for the `Russia Second Oil Rehabilitation Project` of 1994.The second project included a specific environmental component that includedenvironmental management training, higher spill response capacity, implementingenvironmental management and a pilot cleanup programme. Yuganskneftegas was oneof the three Russian oil company recipients of a project aimed at strengthening theRussian Federations ability to increase oil production and exports, transferinternational technology and managerial practice, and support policy reform in the oilsector. This is a Category A environmental assessment project. Due to the 1998financial crisis, the project was not fully completed, and the environmental componentwas re-initiated by the Bank in early 1999, despite the loan being completed.Yuganskneftegas was one of the major achievers in implementing the environmentalcomponents compared to the other companies in the project, although it suffered fromunderstaffing and lack of authority.
Many lessons relevant to the situation in the project area can be learnt from the WorldBank/EBRD jointly funded Emergency Oil Spill Recovery and Mitigation project,dealing with the Kharyage-Usinsk pipeline leaks in the Komi Republic. The projectindicated that there is only now the beginnings of environmental awareness in Russiaabout oil pollution. It produced trained representatives from six oil companies assistedin developing the legal framework concerning spills and oil contingency plans.Problems that the project highlighted were the lack of enforcement capacity of localand state environmental protection agencies and lack of financing for enforcement.Also, as oil is the driving force of many West Siberian urban economies, `comprise` isoften the byword of enforcement. Enforcement fines are also of such a low level thatthey do not act as deterrents. The lack of clear divisions in environmentalresponsibilities between the SCEP and local government was also highlighted ascreating enforcement problems, such as `double fines` (Interview: World Bank).
The EBRD Natural Resources Operations Policy in Russia 1999 indicates the rationalebehind the EBRD’s investments, its portfolios and project pipeline. The EBRDpromotes the transition to a democratic market economy. The EBRD’s portfolio has todate concentrated on the upstream central Siberia oil production region. It totalcommitment to the natural resources sector in Russia at the end of 1998 was 551million US$, down from 636 million US$ in 1997. About 636 million US$ were toupstream oil projects.

Division International Projects IWACO B.V.
West Siberia Oil Industry
Final Report | June, 2001
56116
26
The first projects were in the upstream oil sector (in Western Siberia, the newChernogorskoye oil field, north of Nizhnevartovsk, 1993 and Purneftegaz oil fieldsrehabilitation, 1993, Vasyugan oil field service equipment, 1994, Geoilbent loan forthe development of the North Gubkinskoye and Prisklonovoye fields, 1996,Chernogorneft drilling programme- including environmental investments,Nizhnevartovsk 1997) and involved green field developments and rehabilitation, oftenwith the participation of major international oil companies. All of these projects hadeither full environmental assessments of environmental investigations, publicparticipation and consultation elements. Certain projects were also undertaken toaddress specific Bank objectives, such as the Komi Oil spill project. The Bank believesthat its presence and contribution since its first project in 1993 have been a catalyst fordirect foreign investments and improvements in the sector, drawing on its expertise andinternational business standards and experience. It oil production projects are thoughtto have had a significant positive economic and environmental impact.
Its preference for the future is to:
- decrease sector concentration risks and increase the transition impact of Banklending is to move into other regions (north and East Siberia), such as Sakhalin);
- encourage investment in downstream sectors, encourage projects by verticallyintegrated oil companies;
- emphasise active restructuring to improve competitiveness and enforcement of thehighest standards of business conduct;
- undertake a Strategic Environmental Assessment in those areas where multiple orcumulative impacts are unknown. West Siberia is not named as one of these areas.
Environmental considerations are explicitly named in the EBRD’s policy. Projects in`new frontier areas` will require elaborated EIAs, new projects require information ontheir greenhouse gas implications and possibilities for reductions, and emphasis is to begiven to the environmental impacts of oil and gas pipelines. Projects must demonstratereplicable behaviour as environmental `models` and the environmental issuesassociated with economic transition, operational objectives and public consultationmust be addressed.
The EBRD states that given the magnitude of funds needed by the sector and limitedcommercial bank interest, co-operation with other IFIs is key to meeting the sectordemands. Closer collaboration with the IFC sector teams and EIB is important, as iscollaboration with the EU. The EBRD’s future lending and `project pipeline` has beenredefined and structured according to the issues identified above. Over the next 3 yearsit is expected to invest 18billion USD in the Russian and former Soviet union naturalresources sector, with about 90 million US$ in each project. Upstream projects willaccount for 25/30% of the total, the combined share of transportation/downstreamprojects will rise to 50/55%. The Bank expects to continue to invest about 65% of itscommitments in Russia, and also in `regional` projects involving several countries.The EBRD’s upstream priorities in Russia are large and medium-sized oil productionprojects. Rehabilitation projects are undertaken where the increase in productionefficiency is financially viable, taking into account the costs of long-termenvironmental remediation and safety upgrades. The EBRD is monitoring a number ofexisting projects in West Siberia, and is actively looking at other opportunities in theregion. The EBRD Natural Resources Strategy focuses on large-scale oil & gasprojects in frontier areas of Russia; however, this position is evolving and staff arecurrently investigating the potential of rehabilitation projects in West Siberia and theRussian Far East”.
Division International Projects IWACO B.V.
West Siberia Oil Industry
Final Report | June, 2001
56116
27
While the EBRD’s commitment to investing in Russia and the natural resources sectorremains (Lemierre, 2000), it is clear that the project area in West Siberia is notspecified as a priority area for future EBRD investment. Oil field rehabilitation andremediation, except perhaps for emergency or crisis funding, is also not a priority forinvestment
The International Finance Corporation (IFC), a member of the World Bank Group,fosters economic growth in the developing world by financing private sectorinvestments, without government guarantees, investing in own resources and makingloans. IFC mobilises funds in the international capital markets and also advisesbusinesses and governments on investments related matters and provides technicalassistance. IFC advisory work in Russia is focused on land privatisation and farmreorganisation. The priority for the next phase of IFC assistance will be the transfer ofexpertise in implementing and managing privatisation’s to Russian institutions. IFCemphasises its role as an equity investor in Russia as an additional tool for the IFC tomaintain a strong voice in developing and executing restructuring plans. Noinvestments were made in the energy sector up to now.
Following the break-up of the Soviet Union in late 1991, IFC initiated its privatisationand capital markets efforts in Russia. IFC’s assistance has been successful, both in theprivatisation of individual enterprises and in the creation of model schemes that havewide demonstration effect. In 1977 IFC facilitate a corporate reorganisation in theenergy sector (Support for Restructuring the Russian Power Sector). Other projects inthe energy sector are not executed.
Tacis is one of the instruments of the EU for its relationship with Russia. ThePartnership and Cooperation Agreement (PCA) is the institutional framework for therelation between Russia and the EU. The main characteristics of the PCA are: trade,political dialogue, economic cooperation and institutions. Environment management isa topic within the institutional projects financed by Tacis. Examples are projects forregional and municipal authorities for implementing measures concerning surfacewater quality improvement. Also demonstration projects are executed for energyefficiency, product quality improvement and reduction of waste. The Tacis activitiesfocus on certain regions like Moscow-region, St. Petersburg-region, Tyumen-regionand Samare-region, Oeral, West Siberia, South-West Russia, Kaliningrad, North-WestRussia and Lake Baikal. The Tacis Technical Offices, which were opened since April1997 serves to decentralise Tacis in Russia. Most recent projects on oil related mattersare:
- New Oil Field Development, Tyumen (completed in 1998);- Baltic Oil Pipeline Study (completed in July 2000);- Oil Industry Environmental Code of Practice (to end in December 2000).
One project to start in 2001 (short listing just completed) in Northern Russia is called“Regulation of Energy Resource Development and Environmental Protection in theTiman Pechora Region”. The Timan Pechora Region consists of the NenetsAutonomous Okrug and the Komi Republic. The project aims at providing support toFederal and Regional authorities in implementing a development programme based onlocal socio-economic needs, on the rational use of natural resources and on respect ofthe environment. The overall aim of this project will be to improve the environmentalsituation in the Timan Pechora oil and gas province by means of more efficientadministrative methods of control by the Russian Federal and regional authorities.
Division International Projects IWACO B.V.
West Siberia Oil Industry
Final Report | June, 2001
56116
28
Another project planned to start in 2001 (tendering is being carried out) is“Environmental Monitoring in Russia”. The project includes parts of West Siberia.This project is to consider environmental monitoring as an information tool fordecision-makers and as a measurement tool to assess environmental changes. Since theSCEP of the Russian Federation for Environmental Protection is the formal beneficiaryof this project the time of implementation is not yet clear.
In a meeting between the Royal Netherlands Embassy and IWACO the idea oflaunching a environmental project in West Siberia under Matra (Dutch Fund) has beendiscussed. The Royal Netherlands Embassy intend to support the idea for a project to(among others) contribute to organisational strengthening and environmentalawareness.
4.5 Summary
The major donor agencies and IFIs active in the Russian energy and environmentsector have not identified or named the West Siberian oil sector as a priority in theircurrent or future strategies and policy plans except TACIS. Most agencies and IFIsallocate funds on the basis of where they and their counterpart (the Russian Federation)set highest priority and expect a positive (financial or technical) return on investment.The historical and current environmental impacts and environmental management ofthe Western Siberian oil sector does not appear to be a priority for most donors andtherefore they can not be seen as a major potential source of financing. Bilateral andcountry funds may however be a potential source of financing. This again depends onthe policies of bilateral donors and individual countries. Private sector financing mayprovide some financing opportunities, particularly for individual oil companies. Pastprojects in the area do provide a breadth of experience and indicate the lessons thathave and can be learnt (such as the Komi oil spill project), from donor activities in theoil sector and in West Siberia.

Division International Projects IWACO B.V.
West Siberia Oil Industry
Final Report | June, 2001
56116
29
5 Potential environmental and social impacts
This section provides a description of the assessment of potential environmental andsocial hazards of the oil sector in West Siberia and the environmental and socialsensitivities in West Siberia, from which the key issues for the Environmental andSocial Profile were determined. This exercise refined the scope of the project anddefined the focus of the field surveys and interviews conducted in Russia.
First the general oil exploration and production process is described, extrapolated fromthe data in Section 4, and then its interactions with the environment analysed. Thisresults in an assessment of potential hazards. The environmental and socialsensitivities, as determined from Section 3; the description of the environment, havethen been analysed. The key environmental and social issues were then identified.
5.1 The oil exploration and production process
In order to appreciate the potential impacts of oil exploration and production on theenvironment it is essential to understand the activities involved. In table 5.1 theoperations and facilities connected with oil exploration and production aresummarised.
The process of oil exploration and production begins with desk studies to identify areaswith favourable geological conditions. This is usually followed by aerial surveys, toreveal favourable features which, if positive, result in seismic surveys. Particularly inlarge expanses of wilderness such as in much of West Siberia, these are vitalexploration operations. Seismic surveys provide detailed information on geology. Priorto surveying data points and sensor locations are established. Line preparation caninvolve removal of vegetation, up to several square kilometres in total. Vehicles orhelicopters will be used for transport purposes. If needed, roads will be constructed.Where necessary, due to local hydrological conditions, these may be built on dikes orridges. In case of exploration drilling, to verify the presence or absence of ahydrocarbon reservoir and quantify the reserves, a pad is constructed for drillingequipment and support services. An average pad occupies between 5000 and20,000 m2. A drilling unit normally consists of a derrick, drilling mud handlingequipment, power generators, cementing equipment and fuel and water tanks.Furthermore the camp will provides workforce accommodation and facilities, storageplace, etc. Drilling operations last (depending of geological conditions) normally oneto two months. If drilling is successful, initial well tests are conducted to establish flowrates and formation pressure. These tests may generate oil, gas and formation water.After drilling and initial testing, the rig is normally dismantled and moved to the nextsite. If exploratory drilling has discovered commercial quantities of oil, a wellheadvalve assembly may be installed. In case the drilling has a negative result, the site isabandoned. Rock formations will be sealed to prevent short-circuiting of fluids.
If the appraisal is positive, development and production will take place to produce theoil (and often-associated gas) from the reservoir, through formation pressure, artificiallift and possibly advanced recovery techniques, until economically feasible reservesare depleted. A larger reservoir will need additional drilling than the initial exploratorydrilling wells. The type and size of the installations needed depends on the nature ofthe reservoir, the volume and nature of produced fluids and the export option selected.Production needs (additional) roads, pipelines, storage facilities, etc. Disposal of wasteis done by flares (associated gas), drainage systems (production water, domestic wastewater, etc), waste pits (solid waste) and incinerators (combustible waste).

Division International Projects IWACO B.V.
West Siberia Oil Industry
Final Report | June, 2001
56116
30
At the end of a reservoirs economic lifetime, and/or at each stage in the explorationprocess, abandonment and decommissioning and rehabilitation may occur. Thisincludes demolition and removal of buildings and equipment, plugging of wells and,where required by law or good practice, restoration or rehabilitation of the site to itsoriginal or agreed after-use.
Table 5.1: Summary of exploration and production activities
Operations Facilities Activities
Exploration & survey
facilities
Desk geological study, aerial survey, seismic
survey, Exploration surveying, seismic blasting
sites, tests sites & exploratory drilling and wells,
boreholes, access roads and drilling units and
vehicles
Exploration
Disposal facilities Drilling waste storage & disposal sites
Process facilities Pipelines, wellheads, flowlines, separation &
treatment facilities, oil storage, accommodation,
infrastructure, pumps, glycol unit, drill rigs, storage
pits, processing units, storage tanks,
Disposal facilities Flares, drainage systems, waste pits, incinerators
Development and
Production
Infrastructure facilities Roads, air fields, cables, settlements & support
facilities, control & booster stations, compression
stations
Abandonment,
Decommissioning and
Reclamation
Redundant oil wells, plugged wells, demolition of
installations, recultivation
5.2 Interactions between the oil industry and the environment
The oil industry information provided in Chapter 4 forms the basis for an identificationof the interactions between the oil industry and the environment and the resultinghazards. These hazards have been identified and assessed based on the streams ofinputs and outputs for each operation/activity as described in Table 7 above. A hazardis defined as the presence of dangerous materials and conditions at a site, where theseare present above the `normal` (i.e. natural baseline environment) threshold level.Figure 3 (next page) shows the different streams, which can be distinguished for the oilindustry in West Siberia.

Division International Projects IWACO B.V.
West Siberia Oil Industry
Final Report | June, 2001
56116
31
Figure 3: Hazards from interactions between oil industry and environment
Resources are those streams that are needed to create the oil exploration andproduction process. Products are those streams that have a clear commercial value.Discharges are by-products (with no commercial value) which are disposed off or areseen as waste materials. The intensity of oil activities can produce a variety of effects,which vary in time and distance from the source i.e. the oil well, the drilling rig or therefinery. Effects may sometimes be far removed from the source, for examplecontamination of watercourses or changes in land-use caused by access roads.
Box 2: Polluting discharges
An example of a potentially polluting discharge is the disposal of drilling fluids and drillingmuds. These contain toxic agents, anti-corrosion fluids and oils, and are commonly disposedof in waste pits, dumps or storage areas close to drilling rigs. Many storage places arelocated in water protection areas. Often storage areas are used to dispose of waste oil,waste chemicals, materials used to repair wells, etc. Many storage areas built in the pasthave not been hydroisolated, allowing ground and rain water to percolate through the waste.Research conducted by Tyumen State University’s Ecological Faculty proved that chemicalagents migrate from storage places into groundwater. Products of partial decomposition,which are present in storage places, are sometimes much more toxic and carcinogenic thanthe oil and waste itself.
operations
land take
product & discharges(outputs)radiation
heatliquid wastesolid waste
resources (inputs)water
chemicalsenergy
materialslabour
noisevibration
light
gaseousemissions
aqueouseffluent
incidentialdischarges

Division International Projects IWACO B.V.
West Siberia Oil Industry
Final Report | June, 2001
56116
32
5.3 Environmental sensitivities
The environmental and social baseline data described in Chapter 3 provides the basisfor an analysis of the sensitive characteristics of the environment. Environmental andsocial sensitivity has been determined with reference to World Bank Guidelines onNatural Habitats (OP/BP/GP 4.04), (OP4.11) Safeguarding cultural property, Waterresources management (OP 4.09) and (OD 4.20) indigenous peoples and the E&PForum Guidelines on Environmental Protection in Arctic and Sub-arctic areas (IUCN1993). The sensitive aspects of the West Siberian environment to oil sector activitieshave been summarised under the headings physical environment and socio-economicenvironment.
5.3.1 Physical environment
The main sensitivities in the physical environment include soil, air, water (hydrology),flora and fauna.
Impacts on air qualityImpacts on air are caused by:
- flaring, venting and purging gases, including soot;- combustion processes (engines);- fire protection systems;- road traffic in summer, causing dust dispersal;- hydrocarbon fuelled equipment;- fugitive gas losses (from production, spills, etc.).
Gas emissions may include carbon dioxide, carbon monoxide, methane, volatileorganic carbons, nitrogen oxides, sulphur dioxide, hydrogen sulphide and halons.Temperature inversion may result in high local levels of air pollution. The relativelyclean air in the project area, particularly the remote, unorganised areas will be affecteddue to air discharges by, helicopters and machines. Emissions from flares and fugitiveemissions contributes towards acid rain, greenhouse gases (and global warming) and inurban areas to local air pollution.
Impacts on soil qualityImpacts on soil in West Siberia depend largely on soil type and on the amount of ice inthe soil. Permafrost soils have a low resistance to degradation and are vulnerable tochanges in temperature and compression. Especially the removal of the insulation peatlayer leads to negative impacts. However, permafrost does not occur in the study areaexcept from scattered patches in the Northern part. The most significant potentialeffects on soil in the project area include:
- compaction;- excavation;- changes in drainage pattern and pooling;- contamination from operational discharges, leakages, site drainage and spills.
The changes to soil conditions can cause impacts on the capacity of the habitat tosupport fauna and flora and land use by people. Disturbance of the isolated active layer(in areas with permafrost) can lead to erosion problems and flooding. Heavy machinesthat pass on the roads cause serious damage to these isolated active layers. In areaswithout permafrost compaction can lead to disturbance in drainage.

Division International Projects IWACO B.V.
West Siberia Oil Industry
Final Report | June, 2001
56116
33
Impacts on water qualityImpacts on surface and groundwater may arise from excavation and infill, which cancause alterations to existing watercourses and drainage patterns. Wetter, ponddominated or higher, drier landscapes can be introduced, which can subsequently leadto changes is vegetation, wildlife and land use by people. Damming of watercoursescan disrupt water movement and may effect spawning areas of fish. Clearing ofvegetation may cause changes to drainage patterns and water supplies. Regular oilproduction activities can lead to the release of contamination into surface andgroundwater. Typical regular waste streams are:
- production water;- drilling and well treatment fluids;- process, wash and drainage water;- sewage and domestic wastes.
Ground- and surface water is also subject to contamination due to oil and chemicalspills from pipelines, wells and production facilities, production discharges, wastestorage depots, leakage and site drainage. The quality of water in the project area isgenerally high, unless already polluted by oil sector activities. The ecology and waterquality of spaghnum swamps and peat bogs can be altered by disruption of theirdrainage, which happens due to road and pipeline constructions. Due to the low watertemperatures the self-cleaning capacity of surface water is relative low. Wheregroundwater forms the main source of drinking water, there is a danger ofcontaminated drinking water.
Impacts on faunaHabitat, food supplies, breeding areas and migration routes of animals may be affectedby changes in vegetation, soil, water and noise. Major potential effects on animalsinclude:
- Direct habitat loss or habitat modification;- Displacement or blockage of access to habitats.
Habitat loss results from direct land take by the oil industry. Displacement of wildlifeoccurs when animals avoid a site because of its changed nature, for instance due toextraneous light or noise. Wildlife can also be disturbed by employees (hunting,feeding). Blockage of habitats can occur due to roads and pipelines. The impacts onanimals can have subsequently influence on the livelihood of indigenous peoples.Several seabirds and waterfowl are very vulnerable to oil spills or disturbance, since itcan for instance effect their build-up of fat reserves. Noise (flares, traffic) at migrationroutes can disturb reindeer in their breeding season which can cause increased calfmortality. Fish health and breeding can be damaged as a result of oil polluted waters.The effects on biodiversity include:
- the status, distribution and vulnerability of individual species;- the dynamics of ecosystems that support threatened or endangered species;- the rate of extinction occurring and likely to occur;- regional differences in extinction rates;- minimum sustainable gene pools and population size.
Impacts on floraThe peat layer and flora can be seriously damaged by compaction by vehicles andequipment. Damage to vegetation can take decades to recover, due to the slow rate ofplant growth in these sub-arctic regions.
Division International Projects IWACO B.V.
West Siberia Oil Industry
Final Report | June, 2001
56116
34
The different constructions for infrastructure cause damage to vegetation and soil,directly of via drainage effect. Furthermore, flora will be affected by contaminationfrom operational discharges, leakages, site drainage and spills.
5.3.2 Socio-economic & cultural environment
The main socio-economic impacts include social, cultural, health, noise and visualimpacts.
Social impactsImpacts caused by the oil industry are especially important to indigenous people in thearea since oil industry causes social, economic and cultural impacts on their traditionalway of live. Social impacts may include changes in:
- economic activity and employment;- land-use patterns such as agriculture, fishing, logging, hunting and trapping;- population levels and the subsequent pressure on land-use;- socio-economic systems (employment, income differentials, rent, etc.);- socio-cultural systems (social structure, organisational, cultural practices and
beliefs;- availability of, and access to goods and services (housing, medical, educational).
Social effects may be adverse of beneficial, depending on the community in the areaand the type of oil industry activities. Beneficial effects might be employment andmedical services, while adverse effects often occurs in social and organisationalstructures.
Cultural impactsSince the indigenous peoples strongly depend on the use of renewable resources, theirtraditional patterns of resources use will be affected due to land take by the oil industryand deprivation of natural resources.
Visual impactsVisual impacts can be caused by:
- poor siting and design of facilities, encroachment of the environment;- clearing of vegetation (direct or indirect by waterlogging);- flaring and floodlighting.
Noise impactsNoise impacts are caused by:
- traffic;- drilling and production operations;- flaring.
Noise will have direct influence on humans and wildlife. The latter can be affected forinstance through disturbance of migratory bird roosting and nesting areas, which inturn affect hunting opportunities.

Division International Projects IWACO B.V.
West Siberia Oil Industry
Final Report | June, 2001
56116
35
Health impactsHuman health can be affected by air pollution resulting from oil production andparticularly refining activities, from the consumption of hydrocarbon polluted (groundand surface) drinking water and polluted food (e.g. vegetables, fish, game), by contactwith hydrocarbon polluted soil and food grown in this soil.
5.3.3 Identification of key issues
The environmental and social data and the information on the oil industry wereanalysed concurrently to provide a preliminary assessment of the ‘key issues’ for bothinformation streams. Key issues are those issues which are of priority for the researchproject and of interest for further study (see table 5.2). The list of preliminary keyissues was discussed at meetings with Greenpeace in order to focus the project on themost relevant for the purpose of the campaign. Factors that influenced the choice ofkey issues included:
- extent of possible impacts on the environment. These effects may be local (e.g.solid waste), regional (e.g. discharge of effluent to rivers), continental or global(global warming);
- access to information. Due to the present situation in Russia it is difficult toacquire up-to-date and accurate information on many topics;
- available project budget and time.
Table 5.2: Summary of potential environmental & social impacts of oil industry in West Siberia
Environmental
Issue
Oil industry activity Potential impact Significance of
Impact
PHYSICAL
Air Emissions, flares and venting of
CO2, H2S, SO2, NOX, acid gases,
associated and combustion gases
etc, also fugitive leaks and
evaporation of exposed oil and
processing by-products
Air pollution (especially from CO2,
H2S, SO2, NOX, particulate) leading
to global warming, acid rain and
snow, health impacts to local
population and fauna and flora)
Moderate, short term
and transient to
Significant, long term
Oil burning (as clean-up after spills) Air pollution and fires As above
Energy production combustion
emissions
Air pollution, addition to greenhouse
effect
As above
Chemical discharges Acid rain and snow, sulphur and
nitrogen, benzene and metal air
pollution and ground level deposition
As above
Support facilities/equipment (e.g.
transformers, pumps), transport
Atmospheric emissions from engines Low; short term and
transient
Noise Operations Noise disturbance to local
populations and wildlife
Low?
Visual Facilities, wells, pumps, pipelines,
clearance
Visual impact to local people Low; permanent
Soil and
Groundwater
Liquid production waste
(production water, drainage water,
treatment plants wastewater,
sanitary waters)
Soil and groundwater (including
drinking water) hydrocarbon and
chemical contamination
Significant, transient

Division International Projects IWACO B.V.
West Siberia Oil Industry
Final Report | June, 2001
56116
36
Environmental
Issue
Oil industry activity Potential impact Significance of
Impact
Solid waste disposal (oil settling
pits {production wastes and spent
drilling fluids}, waste pits, sludge,
chemical wastes, landfills)
Soil and groundwater (including
drinking water) hydrocarbon and
chemical contamination
Significant, long term
Well leakage Soil and groundwater (including
drinking water) hydrocarbon and
cross contamination
Significant, long term
Pipeline breaks, leaks (mechanical,
ice damage, corrosion etc), spills,
sabotage
Oil spills resulting in soil and
groundwater (including drinking
water) hydrocarbon contamination
Significant, exceptional
Compaction, excavation Change in drainage rate, habitat loss Long term moderate
Surface Water (rivers
and marshes)
Waste disposal (waste pits, sludge,
chemical wastes, storage)
Seepage or direct flow – surface
water hydrocarbon and chemical
contamination
Significant, long term
Liquid production waste (drilling
muds, production water, drainage
water, treatment plants
wastewater, sanitary waters)
Soil and groundwater hydrocarbon,
salinity and chemical contamination
Significant, transient
Site operations Water supply and availability issues
at the production sites
Moderate
(Raised) access roads (e.g. dams)
and damming of waterways
Changes to local hydrology and
surface water patterns
Significant, long term
Storage tanks, Pipeline break, leak
and oil spill
Hydrocarbon pollution Significant, exceptional
BIOLOGICAL/
ECOLOGICAL
Aquatic Operations activities, tanks, valve
and pipeline spills and leaks (due
to human error or accidents)
Hydrocarbon effects and mortality to
aquatic ecology
Significant, long term,
exceptional
Access roads Barriers/dangers to wildlife (e.g.
migration)
Moderate, transient
Operations Tanks, valve and
pipeline spills and leaks (due to
human error or accidents)
Hydrocarbon effects and mortality to
terrestrial ecology
Significant, long term,
exceptional
Removal of flora along right of way
for pipeline maintenance and
security
Vegetation clearance, effect on fauna Moderate
Terrestrial
Pipeline break or leak and oil spill Explosion and fire damage to
surrounding vegetation, pollution of
terrestrial flora (feeding grounds) and
mortality of fauna
Significant, long term,
exceptional
Natural resources Landtake Wildlife disturbance, loss of
endangered species, habitat loss and
modification. Displacement or
blockage or access to habitats, loss
of biodiversity
Long term, moderate
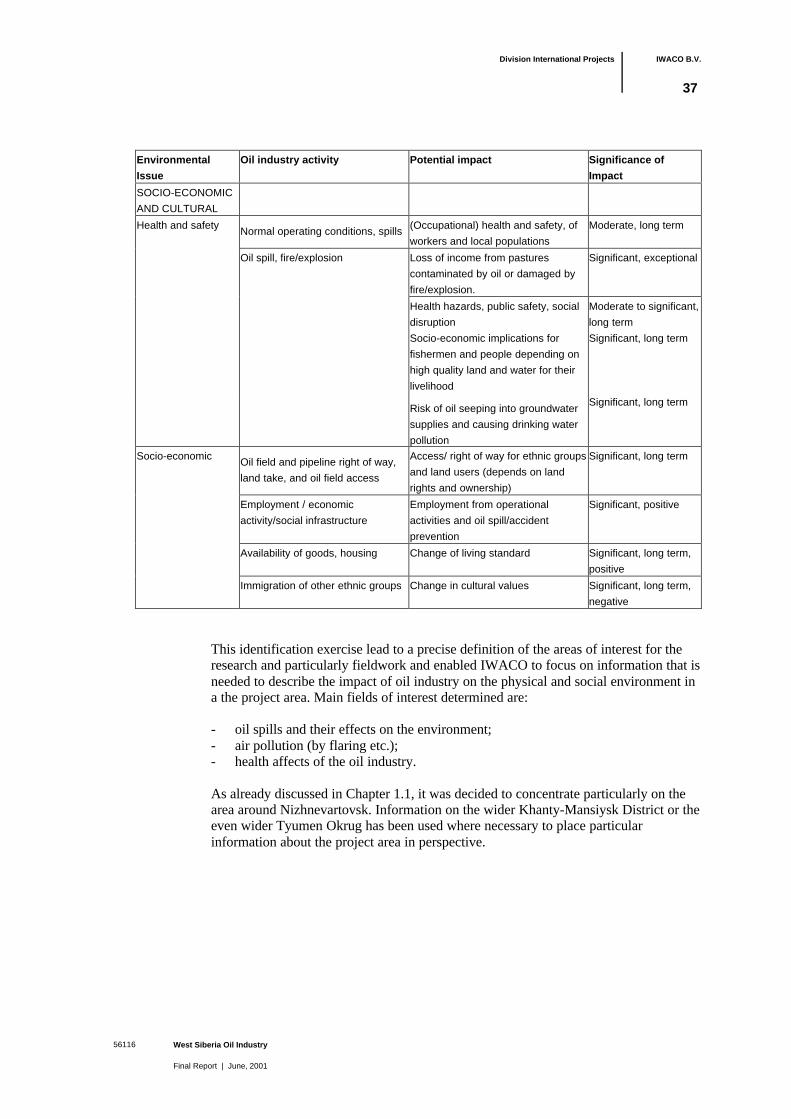
Division International Projects IWACO B.V.
West Siberia Oil Industry
Final Report | June, 2001
56116
37
Environmental
Issue
Oil industry activity Potential impact Significance of
Impact
SOCIO-ECONOMIC
AND CULTURAL
Normal operating conditions, spills (Occupational) health and safety, of
workers and local populations
Moderate, long term
Loss of income from pastures
contaminated by oil or damaged by
fire/explosion.
Significant, exceptional
Health hazards, public safety, social
disruption
Moderate to significant,
long term
Socio-economic implications for
fishermen and people depending on
high quality land and water for their
livelihood
Significant, long term
Health and safety
Oil spill, fire/explosion
Risk of oil seeping into groundwater
supplies and causing drinking water
pollution
Significant, long term
Oil field and pipeline right of way,
land take, and oil field access
Access/ right of way for ethnic groups
and land users (depends on land
rights and ownership)
Significant, long term
Employment / economic
activity/social infrastructure
Employment from operational
activities and oil spill/accident
prevention
Significant, positive
Availability of goods, housing Change of living standard Significant, long term,
positive
Socio-economic
Immigration of other ethnic groups Change in cultural values Significant, long term,
negative
This identification exercise lead to a precise definition of the areas of interest for theresearch and particularly fieldwork and enabled IWACO to focus on information that isneeded to describe the impact of oil industry on the physical and social environment ina the project area. Main fields of interest determined are:
- oil spills and their effects on the environment;- air pollution (by flaring etc.);- health affects of the oil industry.
As already discussed in Chapter 1.1, it was decided to concentrate particularly on thearea around Nizhnevartovsk. Information on the wider Khanty-Mansiysk District or theeven wider Tyumen Okrug has been used where necessary to place particularinformation about the project area in perspective.

Division International Projects IWACO B.V.
West Siberia Oil Industry
Final Report | June, 2001
56116
38
6 Physical & social environmental assessment
6.1 Introduction
It is a matter of common knowledge that the environment in West Siberia is seriouslyaffected by the oil industry. However, accurate data on the effects on the environmentis difficult to obtain. This section assess the effect initially of oil spills, which impactupon all components of the physical environment: air, water, soil, terrestrial andaquatic flora and fauna, and on the socio-economic environment. The impacts of the oilsector on the physical, biological and social environment are then consideredseparately.
Data on impacts, where available, have been presented according to their level ofaggregation in the following format:
6.2 Physical environment impacts
6.2.1 Oil spills
Oil spills are the most obvious phenomena affecting the environment, therefore oilspills are dealt with separately in this section. Accurate data on the number andmagnitude of oil spills in the region in the last decade is extremely difficult to obtain.This partly relates to the unreliability of data and a lack of monitoring and reporting. Awide range of figures can be found relating to the number of spills and quantity of oilspilled. However, to get an impression about the magnitude of the problem, severaldocuments are quoted in the next section with respect to spills and their causes.
According Dobrinsky and Plotnikov (Ekologia), global experience with oil exploitationshows that about 2% of the total oil quantity produced is spilled into the environment.Polluting surface water, groundwater and soil and finally leads to transformation of theflora and fauna. They calculate that the average oil spill loses about 2 tonnes of oil andcovers about 1000 m2 of the surrounding environment. The amount of oil on thesurface decreases with about 40 to 50% in the first few months after the spill. After twoyears the amount of oil is reduced with about 70% but than the degradation of oil slowsdown.
RUSSIAN STATE
WEST SIBERIA
TYUMEN OKRUG
Khanty-ManskiDistrict
NishnevartovskRegion
- Russian State- West Siberia- Tyumen Okrug- Khanty-Mansiysk District- Nizhnevartovsk Region
Division International Projects IWACO B.V.
West Siberia Oil Industry
Final Report | June, 2001
56116
39
On a Russian Federation level, it is estimated that between 10 to 20 million tons of oiland oil products are lost per year (Rossiyskaja Gazetea, 2000). The World Bank reportsthat Russia’s over 350,000 km pipelines are prone to leaks and other accidents due tointensive corrosion. Between 30-80% of these pipelines lie in sensitive environments(taiga, wetlands, forests, inhabited areas etc). These are often poorly constructed, oflow quality and poorly maintained, with trunk pipeline systems often notcorresponding to modern, international requirements. There are no Russian stateregulations for safety of trunk pipeline systems. The law on trunk pipelines wassupposed to be passed in 1997, but has not been completed. The decreasing financingof maintenance and construction of such pipelines has created a critical situation.Research to introduce new technologies and new equipment are not funded either. Thesevere weather circumstances in Western Siberia exacerbate these technical factors,resulting in pipeline breaks, leaks and accidents. The causes and impacts of the mostwidely publicised spill from a pipeline in Russia, the `Usink accident` in the KomiRepublic in 1994 are well known worldwide and applicable to West Siberia.
In West Siberia there are about 100 thousand kilometres of pipeline in operation, ofwhich 30% is over 30 years old. The rate of change of pipelines is less than 2% a year.As a result 35-40,000 accidents a year happen in this region with oil being dischargedinto the surrounding territories, including water bodies. Many accidents are notreported and therefore are not recorded. Besides pipelines, non-productive oil wellsalso cause spills. To day circa 3,500 oil wells wait to be sealed up, with little or nofunds to carry out this work. Of all districts in the Russian Federation, oil spills, theirpast environmental liability and their future prevention are seen as one of the biggestenvironmental problems in West Siberia, particularly in the Tyumen and KhantyMansiysk Oblasts (Interviews Ministry of Fuel and Energy, World Bank). In WesternSiberia, the Regional Ecological Committee reports 1,000 spills annually(www.pacenev.org).
As a whole the number of accidents in mainline pipelines rose from 62 in 1996 to 78 in1997. Due to linked corrosion, a reduction in the number of over hauls, the absence ofdiagnostics of the technical state of the pipelines, poorly planned technological fortransportation routes, incorrect pipeline pressure and inadequately qualified personnel(State Committee for Environmental Protection 1998). As a result of these accidents,2650 tons of oil and 1438 tons of petroleum products were spilled in Russia in 1997.Every year around 50 thousand accidents take place on pipelines in Russia. The mainreasons for this is the progressing obsolescence of pipelines in general together withold technologies of maintenance and diagnostics of pipelines. For instance,anticorrosion monitoring is lacking. On the territory of oil fields natural landscapesunderwent drastic transformation. Spills of oil and production liquids as well asmigration of polluting substances into the hydrographic network are the main factors ofdegradation of the oil production territories. Ecological monitoring of the areas whereoil is produced finds numerous violations of technology of operating the oil fields;deviations from environmentally approved projects, unsatisfactorily implementedrecultivation works etc.
The Tyumen Oblast Committee for Protection of Environment and Natural Resourcesstated in 1994 that despite the continuing decline in oil production the number ofaccidents occurred in 1994 increased. This is due to lesser investments, including intoenvironmental measures, and the low quality of materials and equipment used. TyumenOblast maintains its premier position as the most dangerous area in Russia due to oilexploitation and transport.
Division International Projects IWACO B.V.
West Siberia Oil Industry
Final Report | June, 2001
56116
40
In the Russian Forestry Service Report 1998 it is also stated that Tyumen Oblast is theworld leader in oil associated accidents – the yearly quantity of oil spilled have reached50-70 thousand tons and for the year of 1996 the total territory polluted with oil wasestimated as 50 thousand hectares. The number of accidents increased from 150 – 250in the 80's to 2300-3200 in the 90's yearly.
In Khanty Mansiysk District around 30% of the 64,000 km of pipeline are eroded andseveral million tonnes of unutilised waste have accumulated from oil companies. Oilleaks in Khanty Mansiysk are believed to amount to about 2 million tonnes per year.(Alexander’s Oil & Gas14-03000 Source Nezavisimaya Gazeta via News Base). TheRegional Ecological Committee of Khanty Mansiysk reported only about 10,000 ton ofspilled oil in 1998. Their report of 1998 stated that the technological aspects of the oilproduction today operate in such a manner that one way or the other, oil escapes intothe environment in large quantities during the production process and affects theenvironment. The report also stated that according to some experts the yearly loss andsubsequent penetration into the environment is estimated as 1.5-2 million tons.
The state policy concerning utilisation of oil in Khanty Mansiysk District in the 60’s to80’s, was to produce as much oil as possible with least possible investments. Theequipment and technologies, which were used for oil production, were notenvironmental friendly. Almost no financing went to technological improvement ofpipelines’ corrosion resistance. No attempts were taken to remove oil spills orrehabilitate lands until the beginning of the 90s. All this lead to the current situation ofenvironmental disaster in the region. One of the todays tasks of the RegionalEcological Committee is to identify new and old oil spills, some of which date backseveral years, in order to make plans about recultivation of lands. Almost all oilcompanies have oil spills on their territories, which they have not reported and whichhave yet to be assessed. At the demand of the Ecological Committee, oil companiesorganise departments responsible for dealing with the effects of oil spills and otherenvironment-related accidents.
Almost all the oil produced in Khanty Mansiysk District is transported through thetransportation trunk pipelines. The length of these main pipelines equals 19,000 km.The network of production pipelines exceeds 60,000 km. According to experts’assessment 4 million tons of oil is present in the soil and water of the whole District.Equipment is getting out of order because most of it is working years past theirdepreciation period. Most operational equipment should immediately be replaced.Environmental disaster has also been caused by wrong technological projects ofproduction, collection and transportation of oil, deviation from original projects whenimplementing them, low work discipline and in most cases use of unqualifiedpersonnel.
Table 6.1 shows the number of accidents with the recorded amount of spillages and thepolluted area in the Khanty Mansiysk District (Regional Ecological Committee ofKhanty Mansiysk).

Division International Projects IWACO B.V.
West Siberia Oil Industry
Final Report | June, 2001
56116
41
Table 6.1: Spillage in Khanty Mansiysk District in 1998 (RECKM)
Company Oil production
(mln tons)
Number of
Accidents
Spillages in
tons of oil
(rounded)
Polluted area (ha)
OAO Surgutneftegaz 35 29 37.6 35
OAO Juganskneftegaz 26 571 661 41
ODAO Nizhnevartovsk - 47 368 2.2
DOAO Belozerneft - 76 564 0.5
ODAO Priobneft - 87 68.8 1.9
ODAO Samotlorneft - 15 2 0.23
TPP Langepasneftegaz - 24 23.0 0.79
OAO Varieganneftegaz 2.7 12 1.7 0.19
OOO SP Belie Nochi 0.44 - - -
OAO Varieganneft 1.6 7 3484 2.2
Slavneft MNG - 91 52.3 7.2
NK Jugraneft - 1 17.6 1.3
NGDP Ermakovskoe - 1 6.8 0.95
NGDU Strezhevoineft - 275 68.2 1.4
SP Varieganneft 2.8 5 8.0 5.9
OAO Kondpetroleum 2.5 261 4301 56
TPP Kogalimneftegaz - 3 0.12 0.03
TPP Uraineftegaz - 29 114 24
UUMN - 1 17.0 0.06
OAO Sibnefteprovod - 1 32.0 0.48
OAO Sibtransgaz - 1 ? ?
Others ? ? ? ?
Total 1,633 9,827 181
The Regional Ecological Committee of Khanty Mansiysk reported that in the KhantyMansiysk oilfields 1,537 accidents occurred in 1998 due to old equipment and the poorcondition of technical means of production. In 1998 the total length of the pipeline inneed of repair reached 1,577 kilometres. The contaminated area added up to 181 ha,which is 85 ha more than in 1997. In 1998 there were 381 less accidents than in 1997.The biggest number of accidents in the Khanti Manski District; 3137, was recorded in1995. From that year the number of accidents started to decrease slowly. The decline inspills is partly due to the fact that oil companies have started to change the mostdeteriorated pipes, but in many cases it is also due to companies withholdinginformation about new oil spills in order to avoid economic sanctions fromgovernment. In 28 cases information about the spills was withheld. 40 companies paidfines for not obeying the state regulations.
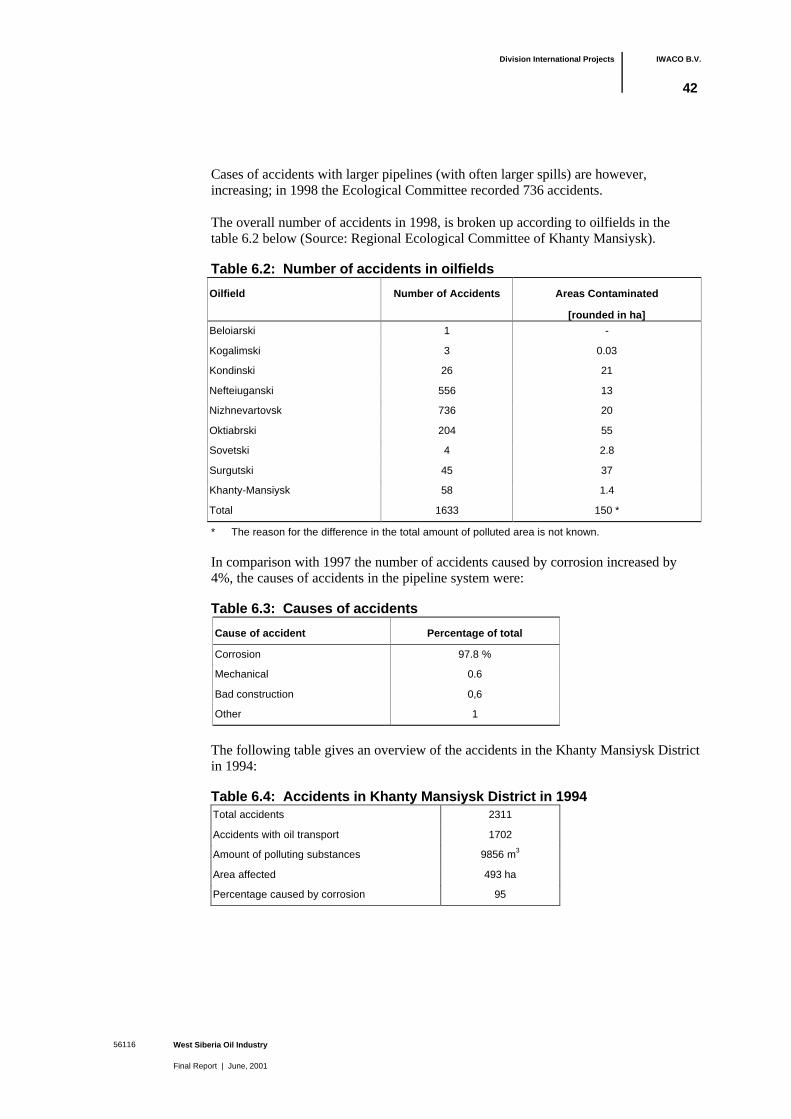
Division International Projects IWACO B.V.
West Siberia Oil Industry
Final Report | June, 2001
56116
42
Cases of accidents with larger pipelines (with often larger spills) are however,increasing; in 1998 the Ecological Committee recorded 736 accidents.
The overall number of accidents in 1998, is broken up according to oilfields in thetable 6.2 below (Source: Regional Ecological Committee of Khanty Mansiysk).
Table 6.2: Number of accidents in oilfields
Oilfield Number of Accidents Areas Contaminated
[rounded in ha]Beloiarski 1 -
Kogalimski 3 0.03
Kondinski 26 21
Nefteiuganski 556 13
Nizhnevartovsk 736 20
Oktiabrski 204 55
Sovetski 4 2.8
Surgutski 45 37
Khanty-Mansiysk 58 1.4
Total 1633 150 *
* The reason for the difference in the total amount of polluted area is not known.
In comparison with 1997 the number of accidents caused by corrosion increased by4%, the causes of accidents in the pipeline system were:
Table 6.3: Causes of accidents
Cause of accident Percentage of total
Corrosion 97.8 %
Mechanical 0.6
Bad construction 0,6
Other 1
The following table gives an overview of the accidents in the Khanty Mansiysk Districtin 1994:
Table 6.4: Accidents in Khanty Mansiysk District in 1994Total accidents 2311
Accidents with oil transport 1702
Amount of polluting substances 9856 m3
Area affected 493 ha
Percentage caused by corrosion 95
Division International Projects IWACO B.V.
West Siberia Oil Industry
Final Report | June, 2001
56116
43
Most accidents happened in the Nizhnevartovsk Region (1210), Nefteugansk Region(528) and Okyabr Region (228).
The Ecology Committee Inspection System has investigated about 60 % of allaccidents occurring in recent years, including all major accidents. 96,3 % of theaccidents occurred due to corrosion of pipelines. The reason of corrosion is thatdesigners still use materials for pipelines approved 30 years ago based on oil,groundwater and associated gas corrosion activity data of those days. The coefficientof corrosion activity of groundwater was taken as 0,3 mm/year, but in practice thepipes corrode much faster – the real corrosion coefficient being 3-4 or even17 mm/year. This leads to accidents and practical depreciation of pipelines after only2-3 years of exploitation. Recommended means of corrosion prevention like corrosioninhibitors proved to be of little effect.
The Nizhnevartovsk Regional Environmental Committee stated that the oil industryhas an enormous impact on the environment because of the extensive way of exploitingwith cheap and old technology. In 1998 the oil companies used 52,000 ha forexploitation (oilfields and other areas like facilities, pipelines, etc.). In theNizhnevartovsk Region a total of 736 accidents with pipelines at 15 companies tookplace. This includes 18 accidents that were not mentioned to the Committee. As resultof these accidents, 4,745 tonnes of polluting substances came into the environment andcovered a surface of 20 ha. 726 of the accidents were caused by corrosion, 3 bytechnical faults, 3 mechanical accidents, and 4 by other causes. In 1996, 1587 accidentswith negative ecological effects were recorded in the Nizhnevartovsk Region. 1543 ofthese accidents were caused by poor condition of production pipelines.
Box 3: Spills in the Samotlor oil field
The Samotlor oil field provides as an example of an oil field that has been developed forseveral decades now. On this territory only 1,1 % of lands are leased out for a long termperiod and 4,6 % for a short term period. Nevertheless, 22,3 % of the whole territory ofSamotlor oil field is polluted today. In total 3,136 ha of land has been contaminated with oilin Nizhnevartovsk Region up to now. Of which 1,437 ha are located in Samotlor oil field.These figures are according to the Nizhnevartovsk Regional Ecological Committee far lowerthat in reality. Deciphering of air photos of Samotlor oil field of the years1994 and 1995proved that as a result of migration of contamination instead of 1437 ha (as reported by oilcompanies), 33,300 ha of land are contaminated by 10 times more than backgroundcontamination. The real level of contamination has yet to be identified. According toNIPINEFT Oil Research Institute prognosis (Interview: NIPINEFT), if no measures are takennow to reconstruct Samotlor Oil Field pipeline system by the year of 2010, 13,000 spillage ayear will take place. Often it is easier and more profitable to underreport spills and pay finesthan to meet Ecological Committee standards. In Samotlor oil field for example, only 33 haneed to be recultivated (cleaned up) according official figures. However, more than 3,000 haof land is polluted from oil spills (NREC).
On company level, the following is reported:
Chernogorneft is mentioned in the report of 1998 of NREC as one of the firstcompanies to introduce high corrosion resistance pipelines. It will of course take manyyears to replace completely all pipeline system, but this process should start today.Companies have enough financial means to proceed with the project.

Division International Projects IWACO B.V.
West Siberia Oil Industry
Final Report | June, 2001
56116
44
Slavneft and Megiongas companies have experience of using plastic pipelines, whichare absolutely resistant to corrosion. This considerably decreased the number ofaccidents. Sobol JV (Russian –Belgian) has experience using fibreglass pipelines. Theyhave not had any accidents since introducing such pipelines into practice.
Yugansneftegaz reported 571 accidents in 1998, 546 of which were caused bycorrosion of pipelines. Out of the 660 tons of oil spilled, only 200 has been removed. Aterritory of 15 ha was covered with oil. The biggest accidents in 1998 were recorded inMamontovsky and Aliokhinski oil fields as a result of which respectively 87 and 500tons of oil were spilled. In the latter case, 17 tons of oil ended up in the river.
Different oil companies dedicated different scopes of work to the solution of problemsconcerning pipeline failure/accidents. Langepasneftegas for example, carries outchecking of its pipeline system regularly and has an automated diagnostic system forbad/damaged areas. This company also uses pipelines that are insulated properly, thisincreased the durability of certain areas of the pipeline system.
Some companies have pipelines operating for more than 10-15 years without check andnaturally this negligence leads to numerous accidents. Liquidation of consequences ofaccidents is problematic for many companies because of absence of specialiseddivisions/departments within the structure of such companies. The lack of relevantequipment adds to these difficulties. As a result of accidents oil companies experienceeconomic losses and unexpected expenses. Due to direct loss of oil, expenses onliquidation of oil spills and recultivation of lands, reconstruction of pipelines etc.
The Ministry of Fuel and Energy is encouraging companies to develop their ownservices to prevent spills as well as emergency teams to deal with spillages. Forexample, Surgutneftegas has an emergency team and has recently brought Westernspill remediation equipment and set up an educational centre to train staff (Interview:Ministry of Fuel and Energy).
Sometimes oil spills occur due to negligence of oil company staff. A high-pressurepipeline (820 mm) spill, occurred due to improper co-ordination between different oilcompanies using this pipeline (going from North Variegansky Oilfield to SamotlorLPDS). The mis-coordination lead to the situation that oil was spouting from the pipefor several weeks, resulting in the spill of 3500 tons of oil on 2,2 ha. In 1998 only 6major accidents were recorded in the region with 1000 tons of oil spilled. The accidenton a high-pressure pipeline in Agan oil field in 1995 caused release of 520 tons of oilinto the Maly Egan River. Similar accident in Vatinski oil field resulted in thecontamination of 27 ha of land with 1127 tons of oil.
In case of a big accident the oil company and the Ecological Committee are responsiblefor quick clean-up. For small accidents there are no rules. Many companies hide dataon accidents, which partly explains decreases in accidents in company reports.Covering up the information about accidents and spilled oil is common and leads to asituation where the quantity and impact of oil spills on the environment can not beassessed objectively. The reasons for non disclosure are often that oil companies areunwilling to pay fines for polluted territories and try as much as possible to cover upthe facts of pollution and they clean up the territories using unauthorised methods likeburning the oil, burying oil under turf and soil, etc. Advanced methods (such asbioremediation) are used extremely rarely due to their expense (NREC). The NRECstated in their report that the figures quoted are in reality much higher. Quantities ofspilled oil are identified by ‘expert assessment commissions’.
Division International Projects IWACO B.V.
West Siberia Oil Industry
Final Report | June, 2001
56116
45
These commissions are formed with representatives from oil companies, which ofcourse can influence the reporting process. The activities of most oil companies aretherefore still being carried out with serious violations of environmental requirements.The current situation is dictated by the circumstance that it is easier and moreprofitable to pay fines than to keep up with the requirements dictated by the EcologicalCommittee.
6.2.2 Remote sensing
The output maps (see appendix 3) shows the areas contaminated with oil with anreliability of >98% and an accuracy of new spills with 80% and old spill with anaccuracy of 40%. This means that 98% of all the areas classified as contaminated areindeed contaminated. However, especially the older oil spills might not all berecognised. This is not surprising as many of these areas show some vegetationrecovery. The degree of contamination could therefor be more widespread than shown;i.e. the map shows the most optimistic scenario. The analyses is based on 33 fieldobservations, consisting of contaminated and non-contaminated areas. The outerfringes of the contaminated areas could not be well established using an automaticclassification. The outer fringes identified were further based on a visualinterpretation.The total area contaminated in the area of study is 6500 ha.
The contamination is spread throughout the area and seems to be the result of manyspills. This is an indication for the seriousness of the situation. Based on the extent ofcontamination it seems that many oil pipes could be in deplorable condition. Althougha figure cannot be given it seems that many spills are recent and do not originate fromthe eighties as often been told by the oil companies.
Despite the large amount of spillages that already have been detected, someimprovements can be made in this part of the investigation. A winter Landsat TM7image could be used to map the pipelines. Difference in reflectance and temperaturewill be very significant. By doing this the possible spill sites will become clear.Furthermore , an Iconos image with a spacial resolution of 1 m in the panchromaticchannel and 5 m in the multi-spectral channels could give a more detailed mapping ofthe spills. The total figure for the extent of spillage will probably not be different fromthe analyses of the Landsat images, but for specific spills the information will be moredetailed. To map the age of spills, a more detailed field campaign would be desirable.To assess the damage to the ecosystem and the possibilities for rehabilitation a moreecological oriented investigation could be necessary.
Evaluation of oil spill impactsThe main sources of oil spills in West Siberia are:
- pipeline (and equipment) breaks and accidents;- corrosiontechnical errors;- oil company negligence (personnel);- low company and personnel environmental management, awareness and education
of environmental impacts of spills;- lack and under investment in equipment and equipment replacement;- inadequate emergency planning and equipment.
Oil spills are a major source of significant pollution. Data on the quantity and extent ofspills is unreliable and analysis requires estimation from a variety of data.
Division International Projects IWACO B.V.
West Siberia Oil Industry
Final Report | June, 2001
56116
46
An increasing trend in the extent and quantity of oil spills can be seen. This increase inthe number of spills is exacerbated by increased production. Whichever statistics aretaken, the scale of the problem is enormous and the impacts can be seen to beexacerbated by the climatic, hydrological and biological environment in the projectarea. Many of the impacts are both past and present and have accumulated with theincreasing development of the oilfields in the project area.
Interpretation of remote sensing images result obvious in higher numbers of hapolluted than numbers reported by the oil companies.
All environmental media are impacted as a result of oil spills, with soil, groundwaterand surface water throughout the entire project area being the most significantlyimpacted physical receptors. Social impacts include health consequences foremployees involved in clean–up operations and general public health impacts resultingfrom polluted drinking water and air.
6.2.3 Air quality impacts
In principal gaseous emissions from oil and gas include carbon dioxide, carbonmonoxide, methane, volatile organic carbons, nitrogen oxides and halons. Emissions ofsulphur dioxide and hydrogen sulphide can occur and will depend on natural gas anddiesel usage. In some cases, flaring and combustion can lead to odour production.According to Dobrinsky and Plotnikov (Ekologia) special attention should be paid tothe polycyclic aromatic hydrocarbons (PAH) emissions as some are carcinogenic andpersistent and have a long breakdown time. When spills of oil are burned, combustionproducts like PAH, SO2 and soot usually are spread in a northerly direction by wind.
Air pollution in the region of West Siberia is serious; according to the State Committeefor Environmental Protection, sulphur and nitrogen compounds, benzene and metaldischarged into the air exceeds Russian standards. Gross emissions of `harmfulsubstances` caused by the oil refining sector were reduced by 3.6% in 1997 acrossRussia. Air pollution in excess of maximal permissible concentrations of toxicsubstances in industrial areas, despite the `inadequate urbanisation` of West Siberia ingeneral, has been caused in part by emissions from petrochemical enterprises (StateCommittee for Environmental Protection 1997).
According to the Ministry of Fuel and Energy, one of the most contaminating factors isassociated gas flaring. The rate of gas utilisation varies from 52% to 95% depending onan oil field. Gas utilisation is very low in cases when population or other users arelocated too far from the oilfield and transportation becomes economically not effective.In other cases it is necessary to build a GUP (Gas Utilisation Plant) to safely utilisegas.
In the project area, there is currently a goal of an 80% reduction of flared gases. Acurrent programme in the Ministry of Fuel and Energy covers all energy and oilcompanies, regarding energy efficiency. The Ministry currently oversees severalprojects in the Surgut area, which aim to decrease the burning of associated gases.Particularly for flares where the economical gas content is low, which are far fromurban centres or areas to reuse the energy, there are several projects at sites toinvestigate gas utilisation and reinjection. In new fields in regions such as Harkaki(Tattanuw field), gas flaring is prohibited and increased utilisation is enforced. A majorproblem faced by the ministry and companies is financing of these projects.
Division International Projects IWACO B.V.
West Siberia Oil Industry
Final Report | June, 2001
56116
47
Many of which seek foreign investment and technologies (e.g. Surgutneftuganskt seeksa World Bank grant, the tender of which is still open and Japanese grants connectedwith Kyoto protocol obligations are being sought) (Interview: Ministry of Fuel andEnergy).
In the Russian Forestry Service Report on the situation in the West Siberia Forestry,1998 it is stated that flares contaminate 3-4 times more than the territory allocateddirectly by the oil industry. This is due to heat radiation, pollution of the atmosphereand discharge of products of partial combustion.
The Tyumen Oblast Committee for Protection of Environment and Natural Resourcesstated in their 1994 report that in 1993 in the Tyumen Oblast flares burned 4.6 billionm3 production gas. This brings the total of flared gas since the beginning of the oilproduction on 180 billion m3. In 1994 the oil industry discharged 951 thousand tonnespollution into the air. In 1994 stationary sources have discharged 8.6% less into the aircompared to 1993, which is mainly due to production decline (see table 6.5). Only1.2% reduction is achieved by environmental measurements.
Table 6.5: Flared gas in Tyumen Oblast
Region Thousand tonnes Difference with 1993
Khanty-Mansiysk 1150.0 -200.2 (14.8%)
Yamalo-Nenets 560.4 + 24.3 (4.5%)
Southern zone 95.5 + 6.7 (7.5%)
(Source: Tyumen Oblast Committee for Protection of Environment and Natural Resources.)
Reduction of air pollution in the Khanty Mansiysk Region is mainly due to thedecreasing oil production. The increase of air pollution in the other two regions ismainly due to the more strict control and reporting by state authorities.
Air pollution is most serious in the regions of Surgut, Nizhnevartovsk, Nefteugansk,Oktyabr, Beloyarsk, Purovsk and Nadymsk, mostly caused by oil industry. Besidesregular flaring about 29.8 thousand tonnes of air pollution was caused by accidents,including 23.8 thousand tonnes by burning of spills. Companies that caused most airpollution were: Yuganskneft, Mamontovneft and Pravdinskneft.
The Regional Ecological Committee of Khanty Mansiysk has indicated in their reportof 1998 the following information. 2841 enterprises – as sources of contamination- areregistered in the Ecological Committee of this District. A total of 1922 thousand tonsof contaminating substances were discharged into the atmosphere in the year 1998. Ofwhich 673 tons accounts for the transport sector (37%). CO accounts for 581 thousandton, hydrocarbonates for 50 tons, nitrogen oxides for 39 thousand tons. A completepicture could not be drawn from the available sources.
Four cases of accidental discharge of polluting substances with a total amount of 1,038tons were registered in 1998. Of this amount CH4 accounted for 98 % (sourceRECKM). The most serious accident with gas took place at the company “Sibgastrans”in the region of Belozernogo GPZ were it is connected to the pipeline GPZ-Parabel-Kuzbass; 1,300,000 m3 (1,021 tonnes) of gas polluted the air (source NERC).
According to the Nizhnevartovsk Regional Environmental Committee the quantity ofnitrogen dioxide exceeded the allowed norm 2 times while carbon monoxide exceededthe norm 1,1 times and hydrocarbonates 2,4 times the norm in 1995.

Division International Projects IWACO B.V.
West Siberia Oil Industry
Final Report | June, 2001
56116
48
In 1996 the total amount of substances discharged causing air pollution, added up to1,179 million tons. In fact this figure should be much higher because of the use ofunsatisfactory methodology and normative documents to measure and registerpollution. Moreover, in some cases it is impossible to technically measure and registeroutput of substances caused by accidents. For example, hydrocarbons, evaporatingfrom the oil spills and containing highly toxic and carcinogenic components (likebenzeen), are not measured and recorded. Also, it is impossible to measure theunsanctioned output of gas as a result of technological misuse of Vacuum CompressorStations. Out of 200 enterprises in the region 181 accounted for the discharge ofsubstances into the atmosphere in 1996. In comparison to the year of 1993 the overallquantity of discharges into atmosphere has decreased which is caused by the decreaseof production in the industrial sector. The 1998 Nizhnevartovsk report states that totalair pollution in the Region (including transport) was 1,220 thousand tonnes (see table6.6).
Table 6.6: Air pollution in the Nizhnevartovsk Region
Tonnes x 1000 of air pollution
1996 1997 1998
Total air pollution 1,179 - 1,220
Air pollution through
transport
-* - 905
Air pollution oil
companies(59,010
stationary sources)
- - 315
Of which hard
particles
- - 10
Of which gas - - 304
Flares (134) 129 104 176
(source: Nizhnevartovsk Regional Environmental Committee)
*- no figures obtained
There are 134 flares in the region which burned 1,493 mln cubic meters of associatedgas out of 5,253 mln cubic meters produced in 1998.

Division International Projects IWACO B.V.
West Siberia Oil Industry
Final Report | June, 2001
56116
49
Air emissions by oil companies in Nizhnevartovsk are summarised in table 6.7.
Table 6.7: Discharge of substances by oil companies into atmosphere of Nizhnevartovsk Region
Thousands of tonnes
1993 1996 1997 1998
Total 265.7 129 - -
Solids 7.7 -* - 43
liquid/gas 257.9 - - 1090
sulphur dioxide 3.6 3.6 2.3 7.8
Carbohydrates 122.3 20 146 474
carbon monoxide 124.9 99 143 506
Nitrogen oxides 7.1 1.4 6.3 74
Soot - 5.9 - -
(source: Nizhnevartovsk Regional Environmental Committee and Khanty Mansiysk Regional
Environmental Committee)
*- no figures obtained
IWACO specialists observed air pollution particularly around the several flares in theNizhnevartovsk Region. Several flares produced black coloured smoke. Flares are notonly located outside residential areas. A fieldtrip was made to a pit-flare located in themiddle of an area with datsja’s. Interviews made clear that in wintertime the snow nearthe flare is blackened with soot. The snow is not used anymore for preparing drinkingwater. Last year a datsja was burned down due to a shooting-flame from the flare.Other datsjas close to the flare are protected from the heat by iron plates. Visualinspection of the pit made clear that waste had been burned in the pit; cinders andburned oil drums were at the bottom. The burning of waste in the pit will causeadditional emissions. Soil samples were taken from the adjacent kitchen-gardens. Thesoil samples are analyses for polycyclic aromatic hydrocarbons (PAH). Noconcentrations of PAH are detected. No air samples were taken for analysis.
Evaluation of air quality impactsThe primary sources of emissions to air from the oil sector in West Siberia are:
- flaring and venting of associated gases;- burning of oil spills and oily waste;- fugitive emissions from oil spills, vents, production facilities.- combustion emissions from energy production
From the obtained information it can be concluded that a high amount of dischargedcontaminating substances causing air pollution were (and still are) releasedcontinuously. In 1998 more than 1200 thousands tonnes of substances were dischargedto air in the Nizhnevartovsk Region. One of the most contaminating sources is theburning and flaring of associated gas. The oil industry is the second (next totransportation) most air polluting industry in the region (300 thousands tonnes),particularly emitting toxic compounds such as Polycyclic Aromatic Hydrocarbons(PAH), hydrocarbons, particulates and gases like SO2, NO, etc. Emissions like CO2
and methane also contribute to the greenhouse effect. Air pollution/emissions is mostserious in the regions of Surgut, Nizhnevartovsk, Nefteugansk, Oktyabr, Beloyarsk,Purovsk and Nadymsk..

Division International Projects IWACO B.V.
West Siberia Oil Industry
Final Report | June, 2001
56116
50
In the last 5 years the situation has been slowly improving due to increased associatedgas utilisation. However, emissions are strongly linked to production levels and cangive a misleading impression of increased industry performance in decreasingemissions. Financial problems are the cause of low utilisation of new technologies andend of pipe projects to really improve the situation.
6.2.4 Soil quality impacts
Pollution of lands with oil and oil products is recognised as a major problem in WestSiberia. The main causes of soil pollution are oil settling (disposal) pits and brokenpipelines (State Committee for Environmental Protection 1997). This leads to arecommendation by the SCEP that federal legal acts, supported by normative andmethodological documents, are required to manage the zones under impact of the oilenterprises and determine the status of lands. Present and former hydrocarbon pollutionof soil and groundwater is also seen as one of the biggest environmental problems inTyumen and Khanty Mansiysk District by the Ministry of Fuel and Energy,Environment Department (Interview: Ministry of Fuel and Energy).
Dobrinsky and Plotnikov (Ecologica) estimate that lands polluted by oil increase everyyear by about 10,000 hectares. The amount of oil on the soil surface decreases by about40 to 50% in the first few months after the spill. After two years the amount of oil isreduced by about 70%, by than oil degradation slows down. When an oil spill occurs,especially marsh vegetation dies. In peat soils, oil penetrates to about 15 cm, in sandysoils, oil penetrates to about 1 meter.
In the Russian Forestry Service Report on the situation in the West Siberia Forestry,1998 it is stated that of the 8 to 24 thousand hectares of lands allocated to oilcompanies annually for exploitation purposes, only 79% was given as concessions. Oilcompanies are granted a land concession by the State on which to operate. Officially aconcession has to be returned in its original status to the State. However, returnedconcessions are usually heavily polluted, so when the concession period is passed, thecosts for restoring land are passed to the state. As a result, oil companies usually takeconcessions for more years than originally agreed. There is no regulation ororganisation concerning the recovery of oil polluted lands between the State and theuser, the oil company. Dobrinsky and Plotnikov recommend that guidelines are neededto prevent oil spillage, to develop instructions what to do when oil is spilled, anddevelop juridical sanctions when instructions are not followed. Over the last 30 years,the Forestry Report estimates that 400 thousand hectares of land were allocated to theoil industry. The total land affected today by the impact of oil companies is estimatedas 700 thousand hectares. The Forestry Report also recommends that recultivationshould not only take place for land polluted by oil, but also when it is contaminated bychemicals and mineralised water (chloride).
The Regional Ecological Committee of Khanty Mansiysk indicated in their report of1998 that in some cases oil companies are required to carry out «simplified»recultivation. This implies covering the polluted area with soil or sand. According toDobrinsky and Plotnikov (Ekologia), with this type of recultivation, the biologicalrecovery of these areas is very slow and after nine years often no more than 20% isrecovered. In such areas the amount of the toxic 3,4 benzo(a)pyrene is very high andcan be 500 times above the norm of 13 µg/kg. A way to speed up recovery of thesesites is the use of turf. They report this has been performed once in 1985 at a site ofSurgutneftegaz. Dobrinsky and Plotnikov also report that peat has a positive effect onoil spills; absorbing carcinogenic elements and fastens the biodegradation of the oil dueto its rich micro-flora.

Division International Projects IWACO B.V.
West Siberia Oil Industry
Final Report | June, 2001
56116
51
The peat in Western Siberia contains in average about 1% of bacteria that break downoil, compared to sand with only 0,1%. This means that recultivation with a sand-peatmixture is more effective than with sand alone.
The Tyumen Oblast Committee for Protection of Environment and Natural Resourcesstated in their 1994 report that in the Khanty-Mansiysk region on the first ofJanuary 1994 more than 142 thousand hectares were given into concession to oilcompanies. When concession lands are returned to the state often recultivation hasbeen done very insufficiently or not at all and usually lands are returned too late. In theperiod till 1994 the oil production had polluted an area of 30 thousand hectares offorest, 25 thousand hectares was flooded, about 24 thousand hectares were polluted bygas and chemicals through the air and just as much forest were covered with spills ofdrill chemicals and saline production water. The total area of recultivated land in theOblast in 1994 was 9.4 thousand hectares, mostly realised by Surgutneftegaz andGazprom.
The Regional Ecological Committee of Khanti Manski stated in their report that in theDistrict 561 ha of land and 74 oil mud storage places were recultivated in 1998.Storage places where oil products and various chemical agents are dumped make thepossible chemical composition of waste and the period of recultivation of storage placeunpredictable. 30-40% of the territories around groups of wells is polluted with oil andfrom 3 to 10 % is flooded with water.
In the Khanty Mansiysk region the amount of drilling waste had grown to 5.8 milliontonnes till 1994 (Khanty Mansiysk Ecological Committee)
According to the Nizhnevartovsk Regional Environmental Committee, oil remainingafter an oil spill slowly and constantly pollutes soil and groundwater. This endangersthe drinking water supply in many living areas. The area of oil pollution in soil andgroundwater is sometimes much bigger than the size of the original spill. Within thefirst ten years of exploitation of each oil well, between 6 till 14 hectares are polluted. Inthe next years this amount reduces to between 2 and 3,5 hectares.
Most of the existing technologies for reducing negative effects of oil spills andpreventive measures are practised on a small scale practise in the NizhnevartovskRegion. Experience has been gained with “least cost most-effect solutions”. In 1997about 100 hectares and 74 oil sludge storage places were recultivated. In 1998, 3100hectares of oil spills were added to the area already covered with spills of which 560were recultivated in the same year. In the Nizhnevartovsk Region, six companiesspecialise in recultivation work, with the “Green Company” executing most of therecultivations. It has developed several types of milling techniques that go as deep as15 to 30 centimetres. A special mixture with micro bacteria obtained from local soilsand different species of plants are seeded. Some oil companies have recultivated theirlands themselves. For example, Chernogorneft recultivated 203 hectares of their land(Environmental Annual Report 1998, Chernogorneft).
All recultivation works are carried out under the strict monitoring of the EcologicalCommittee and using technologies approved by the State Environmental Expertise.The Committee monitors the process of making recultivation works more effective.Land recultivation is entrusted only to organisations or enterprises that hold relevantlicenses.
Information received from the Nature Development Institute shows the followingresults of oil content in soils and oil spill areas in the Nizhnevartovsk Region.

Division International Projects IWACO B.V.
West Siberia Oil Industry
Final Report | June, 2001
56116
52
The state-accredited laboratories executed chemical analyses of soils by infraredspectrometry and luminescent chromatography standard methods. These methods areadopted as the standard for Russian oil industry. The results of analyses are given intable 6.8. Calculated values include not only oil, but also a part of the naturalhydrocarbons, which are usually present in soil.
Table 6.8: The average concentrations of oil in soils in Nizhnevartovsk Region
Parameters Oilfield period of exploitation
>20 years 5-20 years < 5 years∗
The number of investigated oilfields 6 7 12
The total area of the investigated oilfields (km2) 1,785 1,624 2,516
The number of samples (chemical analyses) 161 125 249
Maximum oil content (mg/kg) 19,700 9,649 5,062
Minimum oil content (mg/kg) 0.3 6 0.002
Standard deviation (σ) 1993 1340 509
Average oil content (mg/kg) 636 567 200
∗ Including undeveloped oilfields
Official data of enterprises were used by the Nature Development Institute to evaluateoil spill areas. Besides that, more than 800 km2 area was investigated with aerialphotography and topographic survey. A conclusion of the interpretation of aerialphotos from oil fields in the south part of the Yamalo-Nenets District (part of theTyumen Oblast) is that about 7% of the territory is polluted. Measured oil spill areasappeared substantially larger than official data given by the enterprises (see table 6.9).The quantity of spilled oil usually is in limits from 2 and 39 kg per m2, its arithmeticmean is 15-22 kg/m2. For example in 18 sites of Yuganskneftegas company an averageof 170 ton of residual oil products were found per ha. In 11 of these sites the amountfluctuated between 103 and 409 tons of oil per ha (Dobrinsky and Plotnikov inEkologia).
Table 6.9: Oil spill area in the Nizhnevartovsk Region
Parameters Oilfield period of exploitation
>20 years 5-20 years
The number of the investigated oilfields 7 7
The total area of the investigated oilfields (km2) 3006 2360
Oil spilled areas according to data of enterprises (km2) 17,6 1,4
Oil spilled areas according to the NDI estimation (km2) 56,8 2,6
Pollution density (%) 1,9 0,1
Since the beginning of oil production activities in Nizhnevartovsk Region, 7000storage places have been built according to the Nizhnevartovsk RegionalEnvironmental Committee. For more than 5000 of them, the only protective measure isthat they are covered with sand, with no protection layer to prevent oil from flowinginto the soil and groundwater or from flooding (i.e. during spring melts or if locatednear surface waters). Containing oil, chemicals and drilling by-products, these storageplaces are a permanent source of pollution. Soil tested within 10-20 meters from 10years old storage places sometimes contains more chemical agents then the storageitself. At present 1552 storage places await recultivation. They contain 340,000 tons ofdrilling by-products (NERC).

Division International Projects IWACO B.V.
West Siberia Oil Industry
Final Report | June, 2001
56116
53
During the IWACO fieldtrips spill sites with soil pollution in the Samotlor Oilfieldwere visited. Also flares were inspected to provide an impression of soil contaminationaround flares. The sites were selected on the basis of satellite images and informationobtained from interviews. Most of the sites were visually inspected since it is notwithin the scope of this project to characterise the soil contamination in detail. Theobservations are predominantly used to further interpret the satellite images in order tocome to an understanding of the magnitude of the environmental impact. At the flares,soil samples were taken to be analysed for oil and Polycyclic Aromatic Hydrocarbons(PAH). One area is situated in a complex of cottages near Megion (West ofNizhnevartovsk). Here the soil of a kitchen garden was sampled. The second area issituated East from Radoesjnie. The following can be concluded from the analysisresults:
- in the soil sample from the kitchen garden near the flare in the Megion area, nomineral oil and almost no PAH was detected;
- In the soil sample near the flare East from Radoesjnie, no mineral oil and no PAHwas detected.
Soil contamination at the recent spill sites was visibly obvious. The depth of the soilcontamination could not be established. Since at most places sandy soils wereobserved, it is believed that the oil will easily penetrates into the soil. As groundwateris shallow in the project area, contamination of groundwater will occur easily. Atplaces with significant and older oil spills groundwater contamination is seen as highlylikely.
A summary of the analyses results of samples taken in the Nizhnevartovsk region ispresented in table 6.10 (left page). In appendix 6 the certificates of the analyses resultsare attached. In appendix 5 a list with samples and their relating co-ordinates arepresented.
Evaluation soil quality impactsThe most significant sources of impacts from the oil sector activities on soil in WestSiberia are oil and chemical contamination from:
- pipeline and well spills and accidents;- oily (muds, drilling and production waste) and chemical waste disposal and storage
places;- saline production water;- operational discharges and leakage;- production site drainage.
Of all environmental problems related to oil production, soil is one of the mostimpacted environmental media in West Siberia. It is officially estimated by the RussianForestry Service and Nature Development Institute that at least 700,000 hectares ofland in West Siberia is polluted, although the actual extent of contaminated land isprobably higher by about 20%. The Nature Development Institute estimates thataround 2% of land in the oil fields in the Nizhnevartovsk Region is polluted by oilspills in oil fields with more than 20 years of exploitation. Oil company data reportsthat only 0.6% is polluted. Oil fields exploited for between 5-20 years are estimated bythe Nature Development Institute having 0.1% polluted soils; oil companies reportingfigures half of this.
Division International Projects IWACO B.V.
West Siberia Oil Industry
Final Report | June, 2001
56116
54
Data and observations indicate that oil polluted soil has a long degradation andbiological recovery time in West Siberian soils and, depending on soil type, istherefore particularly prone to seeping into groundwater. In groundwater contaminationcan easily spread to a much larger extent than on the soil surface.
The recultivation of contaminated soil is extremely limited in comparison to the area ofcontaminated land, despite co-ordination and monitoring by local EcologicalCommittees. If recultivation figures from Tyumen are extrapolated to the rest of WestSiberia, an estimated 66% of all polluted lands remains polluted and is not remediated.The term `recultivation` does not always imply remediation; oil contaminated soilsmay simply be covered by soil or sand (as in Khanty Mansiysk) which means that evenland reported by companies as recultivated remains a significant, albeit, disguised,pollution risk and statistic. The interpretation of the remote-sensing images support theabove.
6.2.5 Water quality impacts
GroundwaterThe majority of the project area consists of an area of high groundwater levels (close toground surface level). Coupled with the marshy, waterlogged soil conditions, thiscreates and environment where oil spills on the ground can quickly disperse. Inpermafrost areas, oil contamination can not permeate deeper than the permanentlyfrozen layer. However, in non-permafrost areas, where deeper groundwater layers arein one way or the other hydraulically connected with the top groundwater layers,pollution contained in surface water and upper groundwater layers could graduallypermeate into all groundwater layers. Horizontal flow is somewhat restricted by theshallow inclines towards sea level and the major rivers (Interview: Institute ofEcology).
In the State Report on Environmental situation in the Russian Federation 1998, fromthe Russian State Environmental Committee it is mentioned that one of the mainconcerns for groundwater contamination are the thousands of ‘ownerless’ oil wells.Out of 7500 such wells in Russia 3587 are located in Tyumen Oblast. Every year only16 to 18 old wells are abandoned in an environmentally responsible manner.
Groundwater from the Mesozoicum layer is used as technical water, to keep pressureon the oil reservoir. There are 1207 water injection wells in the whole KhantyMansiysk District. This figure may not be correct because of insufficient studies oftechnical characteristics of wells. Many of the water injection wells get damaged at thedepth of 400 - 600 meters at which clay layers are softened due to the water injection.Oil companies do not want to abandon such wells because it is costly to drill new ones.Each defected well is a potential threat to the environment because of leakage of oiland other substances into the adjacent groundwaters (NREC). No known studies havebeen carried out to assess the condition of wells or the threat they may be carrying. Inorder to monitor the groundwater quality, 30 services are spread over the TyumenOblast, checking at least 520 wells.
In 1985, the Russian Society for Nature Protection noted that all major oil companiesexisting at the time allowed drilling wastes to separate in artificial bunded lakes.Although this practice has since largely been stopped, it has left residual groundwaterand surface water pollution.

Division International Projects IWACO B.V.
West Siberia Oil Industry
Final Report | June, 2001
56116
55
According to the Nizhnevartovsk Regional Environmental Committee, Nizhnevartovskgroundwater is used for household water and for drinking water. Characteristics forgroundwater in the Nizhnevartovsk region include a high amount of iron andmanganese (mainly derived from the marshy soils) and in some locations, a highamount of phenols and oil products. Phenols, whilst naturally occurring, are alsosuspected to occur in such high quantities due to the degradation of hydrocarbonproducts in groundwater. Practically all groundwater does not comply with Russiandrinking water standards (GOST 2874-82) for visual parameters (suspended solids andcolour), iron, manganese and sometimes on organic substances such as ammonia,phenol, and also regarding oil products.
In Samotlor oil field deep groundwater is already polluted; the Nature DevelopmentInstitute report that oil concentrations of around 0.1 mg/l have been measured indifferent groundwater layers up to 200 m deep.
No field samples or analyses were made of groundwater in the project area.
Evaluation groundwater quality impactThe main sources of impacts from oil sector activities on groundwater in West Siberiaare the same as for soil and surface water:
- oil spills;- oil and chemical waste storage;- operational discharges;- production site discharges;- and water re-injection and leaks from abandoned old wells.
As the majority of the project area consists of an area of high groundwater levels andmarshy soil conditions, oil on the ground can easily disperse in and permeated fromshallow into deeper groundwater and aquifers. Shallow and deep groundwater andaquifer pollution occurs in Nizhnevartovsk Region including the Samotlar field. Oilconcentrations around 0.1 mg/l in groundwater layers up to 200 m deep are recorded.This provides reasonable grounds to extrapolate that groundwater pollution is commonin other areas of West Siberia as well, particularly in areas of long-term oil sectoractivities (with permafrost areas being the exception). A secondary impact of thispollution is the impact on drinking water sourced from groundwater.
It is notices that groundwater is not really of an environmental concern compared tosoil and surface water. For instance, oil companies have to report on surface water andsoil but not on groundwater.
If spills and water (re-)injection wells are not treated correct it is inevitable thatgroundwater get contaminated seriously. On the long run this will create a tremendousnegative environmental impact, since the spills and wells will be a continuous sourceof pollution.
Surface waterSurface waters from the project area drain into the Great Basin of the Ob'-Irtysh riversystem to the north. Whilst the Eastern Khanty occupies the Middle Ob' river basin,impacts of the oil sector on surface water therefore eventually impact this whole riverbasin drainage system in Northern Western Siberia.
Division International Projects IWACO B.V.
West Siberia Oil Industry
Final Report | June, 2001
56116
56
In 1985 a conference was organised by 15 institutes and universities on environmentalissues in West Siberia. The already mentioned practice of allowing drilling wastes toseparate in artificial bunded lakes, which were often flooded by the spring thaw, causessignificant pollution of watercourses and rivers in the area. Although this practice hassince largely been stopped, it has left residual surface water pollution. Other sources ofwater pollution are reportedly caused by accidents during the process of oil productionand transportation, waste mud and well drilling cutting storage facilities, operationaldischarges, leakage and site drainage. The Russian Society for Nature Protection reportthat “The average petroleum hydrocarbon of water in the Ob, lower Vasyugan andTom Rivers was 0.38 mg/l in 1992, more than 7 times the maximum permissible levelfor the protection of fisheries. Near Nefteugansk the average concentration in 1992 was0.72 mg/l or 16 times the permissible concentration. Much higher peak levels ofhydrocarbons have been reported in the Yugan River up to 7.5 mg/l. The annualconcentration of phenol in rivers in the region is 0.012 mg/l to 0.020 mg/l or 12 to 20times the maximum permissible concentration. The maximum level of phenol nearSurgut in 1992 was 0.07 mg/l or 70 times the permissible concentration”. The Russiannorm (known as the PDK/MAC) for oil products in surface water intended for fisheryis 0,05 mg/l, and 0,03 mg/l for surface water intended for domestic use.
The alteration of drainage patterns due to topographical changes (e.g. dikes forpipelines and road building) also appears to affect the region (the creation of a wetterpond dominated landscape). Roads to production platforms are built straight throughmarshes and lakes for several miles cutting through one of the largest lakes in theregion. Pipes in dams prohibit water exchange between the different parts of the lakes.Because the diameter was too small the exchange of water between the different partsstopped and the result was the death of fish due to a lack of oxygen.
The Tyumen Oblast Committee for Protection of Environment and Natural Resourcesstated in their report: “The ecological situation, the use of natural resources and natureprotection of the Tyumen Oblast, 1994” that the oil industry is with 40-45% the mostimportant water consumer of the Oblast. In the area of oil exploitation the amount of167 wastewater purification installations are located, including 131 biologicalpurification installations. Wastewater from 54 of these installations (less than 33%)complies with the Russian norm.
Compared to 1993 Tyumen Oblast received an increasing level of pollution by riversfrom its surrounding Oblasts: Kurgan, Sverdlovsk, Chelyabin and Tomsk. Oil productsare among the contaminants measured in Ob, Ishim, Tobol and Tura rivers. In amajority of the rivers in the Tyumen Oblast water pollution continues to be high withan average level of oil products of almost 50 times Russian surface water standards(PDK). For example, in 1990 the River Irtysh contained oil products between 28-35times above PDK, although in 1994 the quality of river water improved, with theaverage concentration of oil products decreased between 11-12 times (PDK) comparedto 1993. Recent figures could not be obtained.
The Regional Ecological Committee of Khanty Mansiysk state that in their report of1998 that bogs, marshes, lakes and other water bodies comprise 40 to 70 % of theterritory of the whole District. There are 34 hydrological monitoring points on 17 riversof the District, 16 points responsible for chemical analysis. Whilst concentrations ofiron in the waters of the District are 7 to 20 times higher than PDK, because of naturalconditions, all surface waters also reported as polluted with hydrocarbons of industrialorigin. Pollution with phenol (1997) in winter equals 0.5 times PDK and in summer itgoes up to 7 to 19 times PDK. In some places (the city of Khanty Mansiysk) it hasreached 15-23 times PDK.

Division International Projects IWACO B.V.
West Siberia Oil Industry
Final Report | June, 2001
56116
57
According to the RECKH the content of oil products in surface water lies between 0.5– 5 times PDK. Their regular checks indicate no tendency towards a decrease in theconcentration of oil products.
Table 6.11: Oil products in rivers, 1998
River Location Date Concentration mg/l Times PDK
Irtish Khanty Mansiysk 08.04.98 4.9 100
Ob Neftejugansk 03.09.98 3.06 61
Vah Vahovsk 01.11.98 8.01 160
Konda Vikatnoe 06.05.98 3.19 64
(Source: Regional Ecological Committee of Khanty Mansiysk)
Table 6.12: Pollution Surface Water Summer 1998 (mg/l)
River Location Oil Phenol NH4
Irtish Khanty Mansiysk0.39 0.008 1.29
Ob Neftejugansk0.68 0.004 0.52
North Sosva Sosva4.98 0.002 0.44
(Source: Regional Ecological Committee of Khanty Mansiysk)
Table 6.13: Pollution Surface Water Winter 1998 (mg/l)
River Location Oil Phenol NH4
Irtish Khanty-Mansiysk 0.34 0.001 0.98
Ob Neftejugansk 1.7 0.004 0.60
Ob Nizhnevartovsk 0.18 0.004 0.69
(Source: Regional Ecological Committee of Khanty Mansiysk)
According to expert estimations of the Nizhnevartovsk Regional EcologicalCommittee, 53 % of oil, contaminating the water bodies in the region, comes from theaccidents in the pipeline systems, 35 % from the oil in the mud storage places, 9 %from oil in waste waters, 2.5 % from flares and 0,5 % from river fleet and transportoperations at the fuel ports. This investigation was conducted without taking intoconsideration air transportation and wash-off from relief. Seen in the light of the above(impacts on soil), the latter will have a serious contribution. A considerable source ofsurface water pollution are the patches of land, sometimes several hundreds hectares,polluted with oil caused by accidents with pipelines (production or trunk) or by groupsof oil production wells (bushes). Production wells are usually located in a quadrangleearth bank the size of around 1 ha. The embankment around it, which is usually 1-2meters high, should keep the spilled oil from penetrating into the environment. Almostevery embankment is damaged and during the spring floods, the river water carries theoil away. Damages of trunk pipelines cause the largest oil spills. The analysis ofmonitoring results show that the wash-off of oil from those patches is most intensiveduring the spring floods when the run-off is formed at all geomorphologic levels.Summer run-off will only occur on surfaces with high angled slopes or highgroundwater levels. The highest concentration of oil in the river waters is foundespecially during spring and fall flooding.

Division International Projects IWACO B.V.
West Siberia Oil Industry
Final Report | June, 2001
56116
58
According to Sibribniiproekt Fish Resources Research Institute 50 % of the riverswhere fish are caught have oil products present in the sediment. The concentration ofoil ranges from 25 to 60 mg per kg dry sediment for 50 % of all sediment and from 5 to25 mg per kg dry sediment for 29-37 % of all sediment. In some parts of the VatinskyEgan, Ust Egan and Jukh Egan rivers the concentration of oil is 89 mg per kg drysediment. The concentration of oil in different locations along the course of the Obvaries from 2,5 to 7 mg per kg dry sediment. In the lower parts of the Ob it reaches 21to 36 mg per kg. In the Ob Bay the concentrations reaches 23 to 54 mg per kg.
The Regional Environmental Committee of Nizhnevartovsk report that theapproximately 40000 km of surface waters in the Region contains high quantity of(naturally occurring) iron, manganese and ammonium, as well as oil products. Waterquality is monitored with samples from 221 points with seventeen substances areregularly measured: pH, clearness, biological oxygen demand, permanganate oxygen,suspended solids, oil products, phenols, amnionactive surfactants, chloride, nitrite,sulphate-, phosphate-, carbonate, ammonium, iron and copper. Minor rivers andsprings on the territory of oilfields are reported to contain high quantity of chlorides,which come from highly mineralised production waters. As oil products in pipelinescomprise 50 to 95% salt water (up to 45 g/l NACl), saline contamination of surfacewater also occurs due to pipeline spills, particularly during high water spring floods,when some small rivers contain saline thousand times above natural levels.
According to the State Ecological Control Office in Nizhnevartovsk, the content of oilproducts in waters of the Ob and the Vakh for 1996 fluctuated between 1,7 to 2,3 timesthe norm, ammonium between 1,7 - 2,2 times the norm and iron between 13,7 to 28,8times the allowed norm.
The Nature Development Institute reports that in the Nizhnevartovsk district (all watersexcept the River Ob, with seasonal variations) the natural hydrocarbon content between1994 and 2000 was 0,08-0,12 mg/l. They indicate that this is the product of decay ofnatural organic substances. The concentration of hydrocarbons in river Ob increases1,5-2,5 times near the big cities. The analyses for the Nature Development Institutewere executed by certificate laboratories by infra-red spectrometry and luminescentchromatography standard methods. A summary of surveys in different oilfields is givenin Table 6.14. Calculated values include not only oil, but also a part of the naturalhydrocarbons (see above).
Table 6.14: Average concentrations of oil in surface water
Parameters Oilfield period of exploitation
>20 years 5 - 20 years < 5 years∗
The number of the investigated oilfields 6 13 11
The total area of investigated oilfields (km2) 1748 1894 2387
The number of samples (chemical analyses) 157 308 140
Maximum oil content (mg/kg) 9,5 5,14 0,68
Minimum oil content (mg/kg) 0,007 0,004 0,01
Standard deviation (σ) 1,454 0,581 0,104
Arithmetic mean 0,533 0,206 0,119
∗ Including undeveloped oilfields

Division International Projects IWACO B.V.
West Siberia Oil Industry
Final Report | June, 2001
56116
59
In 1998 an amount of 207 accidents took place in the Samotlor oil field. The result wasan extremely high content of oil products in the surface waters; 86 times PDK. Otheroilfields’ average indicator for the content of oil products in surface water varies from1 to 5.6 times PDK. One more indicator that proves the extremely poor condition of theenvironment is the content of chlorides in surface water. The average concentrationequals 1.7 times PDK (3.3 times PDK as a maximum).
The Vatinsky River provides an example of the condition of rivers passing through oilfields. The Vatinsky River passes through Samotlor and Vatinsky oilfield. There arethousands of oil wells, oil mud storage places and oil spills located within the basin ofthe river. The river itself, as well as its many tributaries is criss-crossed withproduction pipelines. The river is constantly polluted with oil products, drillingsolution and by-products. Investigation of the chemical composition of the VatinskyRiver, which has been conducted during the last several years by SIBRIBPROEKT,shows the increase of contamination. The content of chloride in water is 2, 34 and 20times PDK in respectively the upper, central and lower parts of the river. Thecontamination of the river with organic and biogenic substances can be assessed as‘moderate’ (Source: Regional Ecological Committee of Khanty Mansiysk).
Table 6.15: Content of oil in the surface waters of other oilfields
Oil Field Times PDK
Variegan 0.08-1.8
West Mogutlor 0.8 (average)
Severo-Orehovsky 2.8 – 4
Megion 2.6 (average)
(Source: Regional Ecological Committee of Khanty Mansiysk)
The Nizhnevartovsk Regional Environmental Committee controls the quality of waterin all water bodies, including minor rivers and streams. In 1998 the average monthlyconcentration of oil products in the Ob and Vakh River were fluctuating within 0.55 -1.98 times PDK. In 1997 the contamination level with oil products in the riversfluctuated between 0,46 and 1,42 times PDK. However, recent data show that PDK foroil content in the rivers is decreasing and approaching the norm. All data on the qualityof surface water is kept in an environmental database of the Ecological Committee.
The results of fieldwork and analysis performed by IWACO in the NizhnevartovskRegion are presented in Appendix 6, with Appendix 5 listing samples and their relatingco-ordinates. Table 6.16 gives a summary of the analyses results. Sampling sites werechosen based on sensitivity criteria (i.e. rivers, drinking water and surface water nearvillages and oil spill sites). Water samples and corresponding sediment samples weretaken. From the observations and analyses, the following can be concluded:
Rivers- samples of river water and sediment of the rivers Ob, Agan (near Varyegan) and
Kirtipiakh (north-west from Samotlor) show analyses results for mineral oil and/orPAH below reporting limit;
- a sample from sediment of the Amputi river (near Varyegan) shows a resultexceeding the Dutch target value for mineral oil (water sample is below reportinglimit1);
1 A reporting limit means the sum of detection limits of the components

Division International Projects IWACO B.V.
West Siberia Oil Industry
Final Report | June, 2001
56116
60
- a sample from sediment of river Rjazanskiy, shows a result of 2500 mg/kgdm formineral oil (exceeding Dutch intervention value2);
- Vatinsicy River is visited north of Megion. Along the river, heavy oil and tar wasobserved on high levels along this river (high water line in spring). Samples ofsediment of River Vatinsicy show results of sediments of 1,300 and 17,000mg/kgdm for mineral oil (exceeding Dutch intervention value). A water sampleshows a result for PAH of 6.8 ug/l;
- near a branch from river Vakh (west from Nizhnevartovsk) an oil pumping stationis situated. Nearby this pumping station contaminations around a small lake, a drylake and a small pool were seen, all were sampled. Sediment of the small- and drylake shows respectively 53,000 and 47,000 mg/kgdm for mineral oil (exceedingDutch intervention value). A sediment sample of the small pool shows 120mg/kgdm for mineral oil (exceeding the Dutch target value). The sediment of theriver branch itself shows 75 mg/kgdm for mineral oil (exceeding the Dutch targetvalue), water of River Vakh shows a result below reporting limit;
- near lake Symtoetor east from Radoesjnie, a small river was sampled. Resultsshow here for mineral oil an concentration of 890 mg/kgdm (exceeding Dutchhalfway value);
- analyses of metals only show high concentration for Iron and Manganese in waterand sediment.
Samotlor oil field- High concentrations for mineral oil were found in sediment samples of spill site
’93 (16,000 and 29,000 mg/kgdm, exceeding Dutch intervention value), sedimentfrom north Samotlor (180 mg/kgdm, exceeding Dutch target value3) and sedimentfrom small lake (600 mg/kgdm, exceeding Dutch halfway value);
- sediment samples near a flare show analyses results for mineral oil of14,000 mg/kgdm at 30 meters and 22,000 mg/kgdm at 100 meters. Results of PAHare not exceeding the target values.
Radoesjnie oil field- High concentrations were found in sediment samples of a spill site near lake
Symtoetor near Radoesjnie for mineral oil (58,000 mg/kgdm, exceeding Dutchintervention value)and PAH (33 mg/kgdm, exceeding Dutch halfway value).
Evaluation of surface water quality impactsThe main sources of surface water quality impacts from the oil sector in West Siberiaare:
- spills and accidents;- run-off from spill sites, particularly during spring thaws and floods;- drilling wastes and mud storage (particularly unbunded and damaged stores);- dams, dikes and roads related to oil facilities;- untreated waste water emissions to surface waters;- flares and transport emissions.
The quality of surface is particularly contaminated by hydrocarbon products, saline andchlorides (contained in production waters and pipelines) and chemicals used inproduction.
2 Intervention value is explained in Appendix 11
3 Target value is explained in Appendix 11
Division International Projects IWACO B.V.
West Siberia Oil Industry
Final Report | June, 2001
56116
61
Given the highly dispersible nature of hydrocarbon and chemical pollution in all typesof surface water (both in water and in sediments), the impacts of oil sector on water inWest Siberia are estimated to be extremely significant and extensive, more so than theimpact of the oil sector on any other environmental media. For example in TyumenOkrug, surface water bodies are estimated to comprise 40 to 70% of the landcover, thislevel of cover is estimated to be relevant similar for Western Siberia in general.
Various reports indicate that surface waters in West Siberia, particularly located closeto the main centres of activity, such as Nizhnevartovsk, and older oilfields such asSamotlar, are polluted with oil products from between 5 to 50 times the Russian PDKnorm. A clear correlation can be seen between the length of exploitation of oilfieldsand the average concentration of oil products in surface water. It is debatable if surfacewater pollution is decreasing, as appears to be the case in some areas, such as the riverOb and Vakh near Nizhnevartovsk and as supported by sampling. Other continuousmonitoring data (providing a fuller overview of water quality, including seasonalvariations) indicate continuing high pollution levels, such as in Samotlar and theVatinsky River. Since a full set of primary data on surface water monitoring duringrecent years was not available, no clear picture could be obtained. However, thepresence of sediments in which Dutch and Russian oil content norms are exceededindicate that these surface waters have been and are being polluted in the long termwith at least hydrocarbon products. The seasonal variations, due to run-off differencesin surface water quality in West Siberia also affect the measurement of concentrationsof oil products.
The oil sector is also one of the most important users of surface water, in Tyumen theyare the main consumer. This has significant impacts for the reuse of polluted water andcontinuing pollution.
A particularly significant secondary impact is where oil polluted surface water is thesource of drinking water (such as in Nizhnevartovsk City).
Drinking waterGroundwater is the main source of drinking water in the Nizhnevartovsk Region (apartfrom Nizhnevartovsk City, which utilises surface water). Most water is abstracted fromthe 658 artesian and 92 senomanic wells in the area. 10 % are reserve wells, about thesame percentage are not currently operating. The Regional Ecology Committee gaveout 48 licences in accordance with Water Codex. As a result only 310 artesian and 77senomanic wells got official registration. Water for drinking water requires treatmentbefore being used. Many companies have their own facilities to clean the water fordrinking, mainly of iron. Small settlements do not have water-treatment stations andwater is not treated at all. Almost all wells use water abstracted from the alluvial andlake-alluvial Paleogen fourth-layer. Many private, individuals wells do not complywith sanitary safety zones. From an inspected group of 2354 wells, 54% had nosanitary safety zone, 6% needed renovation and 25% had to be abandoned. Theuncontrolled drilling of new private, groundwater wells is commonplace andcontinuing.
The Drinking Water Company of Nizhnevartovsk City uses surface water from theVakh River as a source for drinking water. The water intake from the Water Companyis situated 25 kilometres North-East of the city. The water is used for industrialpurposes and for consumption. 90 % of Nizhnevartovsk population has access to thecentralised water distribution system, using 280 litres of water per person (the norm is400 litres pp). Two water treatment stations clean the water (chlorinisation, coagulationand filtering). Groundwater is not used for Nizhnevartovsk because of high amounts of
Division International Projects IWACO B.V.
West Siberia Oil Industry
Final Report | June, 2001
56116
62
iron and manganese. The drinking water company analyses intake water and treatedwater once a month. Results for oil products of the intake water as analysed by thedrinking water company are presented in the following table. (PDK= 0.03 mg/l).
Table 6.16: Oil products (mg/l) in intake water from river Vakh from 1995-2000
year Month
1 2 3 4 5 6 7 8 9 10 11 12
1995 0.13 0.11 0.21 0.04 0.02 0.02 0.05 < 0.3 0.15 0.13 0.56
1996 0.16 0.19 0.12 0.14 0.12 0.07 0.11 0.24 0.05 0.06 0.11 <
1997 0.05 < < 0.12 0.21 0.09 0.13 0.16 0.14 0.06 0.17 0.11
1998 0.15 0.4 0.14 0.1 0.07 < 0.05 0.05 0.13 0.23 0.07 0.04
1999 < 0.06 < 0.1 0.19 0.11 0.07 0.06 0.08 0.05 0.12 <
2000 0.07 < 0.05 0.06 0.08 0.06 0.07
Source: Drinking Water Company of Nizhnevartovsk
Analysis of this table indicates that only for 2 months in 5 years the oil product contentof river water in the Vakh was under the PDK norm. The Nizhnevartovsk Centre forSanitary and Epidemiological Monitoring included information about drinking water intheir State report on Sanitary and Epidemiological Situation in the City and the Regionof Nizhnevartovsk for the year of 1996. Table 6.17 gives an overview.
Table 6.17: Oil products (mg/l) in drinking water in Nizhnevartovsk
year Month
1 2 3 4 5 6 7 8 9 10 11 12
1996 0.0 6 0.0 9 0.04 0.04 0.02 0.02 0.05 0.03 0.02 0.04 0.03 0.03
Source: Drinking Water Company of Nizhnevartovsk
The results of fieldwork and analysis performed by IWACO in the NizhnevartovskRegion are presented in Appendix6, with Appendix 5 listing samples and their relatingco-ordinates. Sampling sites were chosen based on sensitivity criteria (i.e. rivers,drinking water and surface water near villages and oil spill sites). Water samples andcorresponding sediment samples were taken. From the observations and analyses, thefollowing can be concluded (see also table 6.16A and 6.16B):
- drinking water from Radoesjnie (from groundwater) shows results for mineral oiland PAH below reporting limit;
- drinking water from a well at Protoka Mega shows results for mineral oil and PAHbelow reporting limit;
- rainwater used for drinking water Mega shows results for mineral oil and PAHbelow reporting limit;
- water at intake water company Nizhnevartovsk and water after treatment (drinkingwater) show results for mineral oil and PAH below reporting limit;
- analyses of metals only show high concentrations for Iron and Manganese in waterand sediment.
An evaluation of the sampling indicates that after treatment, river water conforms tothe Russian norms.
Division International Projects IWACO B.V.
West Siberia Oil Industry
Final Report | June, 2001
56116
63
It must be stated that this limited sampling does not give a thorough insight in thequality of drinking water resources. For instance, as mentioned in the former section,contamination of surface water can differ strongly throughout the year(s).
Evaluation drinking water quality impactsThe main sources of drinking water quality impacts form the oil sector in West Siberiaare pollution of drinking water sources. As both groundwater and surface water areused as sources of drinking water, any negative impact upon the quality of these watershas a direct impact upon the quality of drinking water. Whilst water quality tends to below in the region due to naturally occurring iron, manganese and organic substances,oil pollution is a serious problem in West Siberia, particularly for urban and industrialcentres, as demonstrated by the situation in Nizhnevartovsk.
In Nizhnevartovsk City 97% of drinking water intakes from the River Vakh over a fiveyear period were polluted with oil (over the PDK norm). This water is however treated,and providing it is treated to standards, presents a low risk to human health. This isequally relevant for drinking water obtained from groundwater, as long as it is treated.However, many water supply stations do not have the capacity or facilities to treat allgroundwater; this presents a considerable, but un-quantified impact on human health.Significant hazards exists concerning the numerous reported unofficial, private wells,where over 85% do not conform to standards, and oil content is expected to exceed theRussian norm for drinking water.
A serious threat for the quality of drinking water in future will be the numerousuntreated oilspills and storages.
6.2.6 Impacts of radioactivity
The Regional Ecological Committee of Khanty Mansiysk has indicated in their reportof 1998 that the main source of the radioactive contamination of the Khanty MansiyskDistrict is the transboundary carriage of radionuclids, the main sources being:
- effects of 132 air, water, underwater and underground A-bomb tests in theSemipalatinsk and Novaya Zemlia Regions (since 1957). Particularly during theatmospheric tests, radionuclids, especially Cs137, C14 and St90 either fell out inNorthern Russia or dispersed into the District (RECKM);
- Beloiarskaya Nuclear Power Plant on the Pishma River in the Irtish River Basin;- 5 underground A-bomb testing from 1975-1985; 3 were intended for seismic
probing and 2 for intensification of oil recovery.
The Nizhnevartovsk Regional Environmental Committee reports that theNizhnevartovsk region complies in general with the Russian standards; exploited oilhas a level in between 4 and 30 µR/hour (0.4 and 2.6 mSv/y). Some exceptions canhowever reach up to 100 µR/hour (8.7 mSv/y). The Ministry of Fuel and Energyconfirms that in some traded oil and water nearby oil industry a far too high level of“toria-232” and “radium-226”can be found. The level of alfa and beta radioactivity isbesides a few exceptions within norms.
In 1996 the Institute of Geophysics of Russian Engineering Academy discovered aseries of gamma - anomalies directly related to oil industry: in several oilfields thereare natural radioactive salt residues and drilled rock containing Ra 226, Th 232 and K 40
with gamma radiation from 60 to 5600 µR/h (5.3 to 490 mSv/y) in the well pumps andcompressors.
Division International Projects IWACO B.V.
West Siberia Oil Industry
Final Report | June, 2001
56116
64
These anomalies required further research and tight radioactivity control in the oilindustry in order to objectively assess the level of pollution of oil products and by-products and introduce methods of radioactive safety.
Evaluation of impacts of radioactivityThe general radioactivity in the Khanty Mansiysk and Nizhnevartovsk Regioncomplies with Russian standards. However, in some areas oil is radioactivitycontaminated, the sources being either naturally high radioactive levels, and/or fall outfrom A-bomb tests, performed as part of oil exploration and intensification activities.The exploited oil in these areas is generally below Russian standards, although someexceptions have reached to significant high levels of up to 100 µR/hour (8.7 mSv/y).Internationally used dose limits are those of the International Commission onRadiological protection (ICRP). The occupational effective dose should not exceed20 mSv/y. It is not known how this oil has been treated or handled. There is asignificant risk therefore, that releases of radioactive oil into the environment (i.e. aspill or leak) could contaminate wider areas with radioactivity, possibly affecting theenvironmental and human health. The doses received by members of the public shouldnot exceed 1 mSv/y (ICRP).
6.3 Assessment of biological environment
Twenty five years of intensive energy resource exploitation has caused great damage tothe biological environment in Russia, particularly in West Siberia, contaminating vastareas of soils, water basins, and negatively impacting the quality of flora and fauna atproduction sites. The Samotlar field is now classified an `ecological disaster zone`(World Bank 2000).
According to Dobsinsky and Plotnikov, the ecosystem along the river Ob is at thelimits of its capacity for self recovery. They report that the oil industry hassignificantly impacted the biological environment. Among others through pollution,tree felling, road building (changed surface water flows created water logging andimpacted animal and fish migration routes) and disturbance of natural animal habitats.The reproduction of animals such as waterfowl and fish is reported to have decreased.In general from the early 1980s animal reproduction decreased by 20% compared tothe late 1950s. In the Nizhnevartovsk Region the decrease was 35%, in Kondinsk 22%and in Berezovsk 18%., despite large areas of the Ob River basin being covered bynature reservation status, with corresponding levels of prohibitions of activities(Interview: Ekologia).
6.3.1 Impacts on aquatic environment
The Tyumen Oblast accounts for 65-70 % of Siga fish catches in Russia. During thelast decade the quantity of fish legally caught in rivers took a downward trend; in 199414 thousand tons was caught, in 1998 the catch was 12 thousand tons. This is attributedto a decrease in economic activities, negative environmental impacts and illegalfishing.
The Regional Ecological Committee of Khanty Mansiysk reported in 1998 that 33% offish caught in internal water bodies of the Russian Federation were caught in the Ob-Irtish basin. This statistic reinforces the ecological and commercial importance of theregion for aquatic fauna. Fish catches have declined by 6 times compared to the pre oiland gas development period (1951-1960) (see Tables 6.18 and 6.19).

Division International Projects IWACO B.V.
West Siberia Oil Industry
Final Report | June, 2001
56116
65
Declining fish catches, particularly of sturgeon have been linked to both over-exploitation, the impacts of water pollution and changes to aquatic ecosystems,resulting from urbanisation and industrial emissions in the District, particularly the oilsector. The main concern is the area of Middle Ob where there is the most intenseproduction of oil and gas, and therefore aquatic pollution. It is reported that 40 % of thenatural fish breeding grounds and 90% of wintering pits have been reduced, also thatfish spawning grounds have changed. The commercially valuable Muksun changed itsspawning grounds from the tributaries of the Ob in Tomsk region to the Irtish Riverbetween 1992 and 1998, resulting according to the Sibribniiproekt Fish ResourcesResearch Institute in a decreased catch of 30 tons per year.
The Regional Environmental Committee of Nizhnevartovsk also reports a decrease infish catches. The lower catches are due partly to higher costs of selling andtransporting fresh fish. The Fish Inspection Department of Nizhnevartovsk stated thatdue to economic reasons fish catches have decreased over the last 10 years by a factorof 10. The Regional Ecological Committee of Khanty Mansiysk stated that decliningcatches are also due to pollution, as fishing is concentrated in the more urban areasaffected by industrial activities, particularly oil production and spills. In 1997 anamount of 9,812 cases of intensive oil spills were recorded in fish protection zones.
Table 6.18: Catch of Sturgeon, Pike and Muksum in 1998
Fish Catch ‘98 in tons Allowed catch in tons
Sturgeon 0.6 2
Pike 343.4 1300
Muksun 204.0 280
(Source: Regional Environmental Committee of Nizhnevartovsk)
Table 6.19: Maximal Catch of Fish
FishYear
Catch in tons
Pike 1960 7,110
Muksun Beginning of seventies 303-506
Nelma 1936 610
(Source: Regional Environmental Committee of Nizhnevartovsk)
Declining fish catches are a strong indicator of declining fish populations and anindicator of the overall health of aquatic ecosystems. Oil pollution of surface watersand sediments over the PDK norms (as described in previous section 6.2.3) changesaquatic habitats and worsens conditions for reproduction. According to SibribniiproektFish Resources Research Institute the impact on both fish inhabiting polluted watersand migrating fish passing through to their spawning places, is that oil productaccumulate in fish tissues, including reproductive organs and eggs. This affects theembryo and results in the mutation of fish. Oil pollution also affects the ability of fishto migrate.
The Regional Environmental Committee of Khanty Mansiysk investigated the contentof mineral oil in 16 commercially exploited fish species. The content of mineral oilwas checked in muscles, livers and eggs of fish. The result of the tests shows figureswith a high variance. For example the content of mineral oil in Siga muscles rangesfrom 0.1 to 29.9 mg/kg, in liver from 1.9 to 61.7 .

Division International Projects IWACO B.V.
West Siberia Oil Industry
Final Report | June, 2001
56116
66
The reason why these variances in the content of oil products occur is the differentlevel of contamination in different parts of the rivers, different composition of oilproducts and also particularities of accumulation and assimilation processes of oilproducts in different types of biomass. Table 6.20 shows the figures as reported.
Table 6.20: Mineral oil in fish organs
Fish Groups Year Range Muscle (mg/kg) liver (mg/kg)
Pikes 1993/98 5.46 + 2.304 12.57 + 1.92
Carps 1989-93 8.69 + 1.390 24.84 + 4.460
Nalim 1993-98 3.16 + 1.000 3.28 +1.338
(Source: Regional Environmental Committee of Khanty Mansiysk)
The most informative indicator, which identifies oil pollution, is the content of mineraloil in fish liver. As mineral oils accumulate in lipids, the highest quantity is found inorgans with a high lipid content (liver, fat tissues). For example the Elets, contains 17to 45 mg/kg of oil products in muscles, 60 to 212 in internal organs and 207 to 259 ineggs/caviar.
Table 6.21 shows that average content of mineral oil in fish of the Central Ob basin ishigher than for fish in the lower Ob Basin. The main reason given is the increasedcontamination of this part of the river due to its location near the main oil fields.
Table 6.21: Average content of mineral oil in fish of the Ob basin
Central Ob Downstream Ob
Muscles 8.0 mg/kg Muscles 7.6 mg/kg
Liver 22.6 mg/kg Liver 15.1 mg/kg
(Source: Regional Environmental Committee of Khanty Mansiysk)
Table 6.22 shows an increase in fish catches in Khanty Mansiysk , in contrast withother data obtained.
Table 6.22: Fish catches in Khanty Mansiysk
Year 1995 1996 1997 1998
Amount (tons) 97 113.6 150.0 163.3
(Source: Regional Environmental Committee of Khanty Mansiysk)
For this study two fish samples are analysed for poly-aromatic hydrocarbons (16 EPA),mineral oil (C10-C40) and metals, As, Cd, Cr, Cu, Hg, Ni, Pb, Zn, Fe and Mn. Theresults for the determination of PAH (expressed in µg/kg ww) in the fish samples aregiven in Appendix 9, table 1. The results are already corrected for the recovery of theinternal standards. The PAH content ranges from less than 0.1 µg/kg up to 21 µg/kg(naphthalene in sample 362-02). The most abundant PAH found in the samples arenaphthalene, phenanthrene, fluoranthene and chrysene. Benzo(a)pyrene, the PAH oftenfound in regulations, was not detected. There is only a limited amount of informationabout background levels of PAH in fish. The Dutch Governmental Institute forEnvironmental Hygiene (RIVM) gives a range of 0.09 µg/kg for anthracene up to0.91 µg/kg for phenanthrene (Basisdocument PAK, RIVM, 1989).

Division International Projects IWACO B.V.
West Siberia Oil Industry
Final Report | June, 2001
56116
67
Another report by Netherlands Organisation for Applied Scientific Research(TNO) gives values of 45, 50 and 60 µg/kg ww. for respectively fluoranthene,phenanthrene/anthracene and naphthalene in fish livers of herring and other fishspecies from the North Sea (PAH in the North Sea. An inventory, TNO, 1992). ThePAH content found in this study is in the range of these background levels.
The results of the determination of mineral oil are given in table 2 (Appendix 9),expressed in mg/kg ww. In both samples individual alkanes as well as anunresolved hump in the baseline in the range of C10-C40 were detected. Data onbackground levels of mineral oil in fish and standards are not available sincemineral oil consists of different components. A very rough figure (rule of thumb) isthe limit of 40 to 160 mg/kg ww at which fish could show effects of the pollution.Finally, the results of the metals are given in table 3 of Appendix 9, expressed inmg/kg ww. Iron and zinc seem to be the most prominent of the metals determinedin the fish samples. In Dutch law (Warenwet) only standards are available forCadmium, Lead and Mercury. Those standards are not exceeded. Iron and Zinc arenon toxic substances and therefore, in general terms, they will not cause healthproblems.
Evaluation of aquatic environment impactsThe main sources of impacts on the aquatic environment from the oil sector in WestSiberia are those activities, which affect surface water:
- pipeline and product spills and accidents (particularly during spring thaws andfloods);
- drilling wastes and mud storage (particularly unbunded and damaged stores);- dams, dikes and roads related to oil facilities;- untreated waste water emissions to surface waters;- flares emissions to aquatic receptors;- transport emissions to aquatic receptors.
Literature shows that the quality of surface water is particularly affected byhydrocarbon products and chlorides (contained in production waters and pipelines).Data relating to polluted surface waters has particularly focussed upon the impacts onfish. Over 50% of rivers where fish are caught appear to be contaminated with oilproducts according to the Sibtibniiproekt fish Resources Research Institute. Besidesfish, also benthos fauna is negatively affected by the oil. This affects the health,breeding ability and spawning behaviour of fish. There appears to be a positivecorrelation between fish contamination with oil products and declining fish catches,and pollution caused in the main oil production and exploitation areas in the TyumenOblast, Khanty Mansiysk district and Nizhnevartovsk. It can therefore be expected thatfish in other oil production and exploitation areas in West Siberia are similarlyimpacted.
6.3.2 Impacts on terrestrial environment
According to the Regional Environmental Committee of Nizhnevartovsk theconstruction of roads and facilities for oil production (pipelines, well-drillings etc.)result in an changes in the terrestrial habitat, resulting in both marshland creation andmarshland drying, as well as erosion and deflation or mechanical damage of lands.This in turn results in the degradation of vegetation or changes in structural populationsof plants. This reduces the productivity of the territories natural feeding values foranimals.
Division International Projects IWACO B.V.
West Siberia Oil Industry
Final Report | June, 2001
56116
68
With that, it causes population changes in fauna, not only on the territory of oilfields,but also on adjacent territories. Noise also affects animals. Presence of man in remoteareas results in illegal hunting and fires, which have negative effects on populations ofanimals and their quantity. Oil specifically pollutes soil, which results in contaminationof groundwater, vegetation and animals. An important factor in all this is thetemperature regime. Among others this causes slow growth rates of vegetation andlimited biological activity. This makes the habitat particular slow to recover fromdamage. Extracting large quantities of oil, gas and water under certain conditions canresult in settling of the surface.
FaunaChanges in vegetation, soil, water and noise can effect the animal population. Thesechanges can cause direct habitat loss and modification, shifting in migration routes,loss of breeding areas and even loss of populations, etc.
Direct habitat loss and disturbance and modification occur in site-specific areas forexample oil spill sites, road and drilling well platform construction. The roads are oftenconstructed on dikes, causing artificial slopes in the area, which change fauna habitats.This can also increase flooding and changes the natural drainage patterns and wild lifemigratory routes and tracks, such as migrating birds. Access to habitats is blocked dueto road construction and pipelines. The noise at the construction areas and close to theplatforms has an impact on animal tracks and leads to depopulation of these areas,more over in combination with increased human populations and hunting, particularlyof fur-bearing animals such as the fox and the wolverine. Oil contaminated fish affectsterrestrial fish eating predators (such as bears and foxes). Vegetation is degraded andcontaminated by soot and oil from flares and spillages, which will impacts the health ofherbivores.
FloraAny destruction of vegetation caused by oil activities in the taiga has a big impact onit. In general the footprint or track of a vehicle in the flora in this region takes 10-15years to recover (Interview: Institute of Ecology). The effect of construction works,vehicles, roads etc. obviously has an even heavier impact on the vegetation. Loss ofvegetation effects the nutrient cycle due to a decrease of the organic litter layer and itaccelerates the rate of soil loss through erosion. The short growing season and a lowannual production of nutrients are due to a slow recovery. (Un)controlled fires causeimportant damage to the flora.
Evaluation of terrestrial environment impactsThe main sources of impacts on the terrestrial environment from the oil sector in WestSiberia are:
- spills;- noise from oil production facilities, vehicles and construction works;- vehicle impacts of oil facilities construction and maintenance works;- flares;- fires;- roads, pipelines, well platforms, dams and dikes related to oil facilities.
The impacts on terrestrial flora and fauna are un-quantified and limited to observationsand informal reports. The sources listed above result in changing in terrestrial habitatssuch as decreased or increased water levels, limitations of access, flora damage andloss, and disturbance of fauna. Flares and fires will cause pollution by particles (soot)and chemicals (SO2, etc.). Fires also influence the vegetation directly by burning.
Division International Projects IWACO B.V.
West Siberia Oil Industry
Final Report | June, 2001
56116
69
6.4 Socio-economic and cultural impacts
6.4.1 Demographic impacts
Large increases in population in Khanty Mansiysk and Nizhnevartovsk have occurredsince the 1960s. Population increases can be largely attributed to the employmentopportunities and indirect economic activities of the oil sector.
Demographic changes have resulted from migration into the area, in turn resulting inthe traditional natives of the area becoming even smaller ethnic minority groups than inthe 1950s.
Traditional, dispersed settlements and small urban centres have also changed, with anincreased percentage of the population, particularly of indigenous peoples, living incities.
6.4.2 Health impacts
Health impacts are seen as one of the main impacts of the Russian energy sector by theWorld Bank. The most significant aspect being urban air pollution and its negativeimpact on health. The impact of the energy sector waste waters on the general qualityof Russian drinking water can not be assessed because of a lack of relevantepidemiological data (World Bank 2000).
The Tyumen Regional Oncological Centre reports that it has been conducting researchon environmental effects of oil pollution and relation with diseases. The Centrereceives statistical information from other hospitals within the Tyumen Region forabout 20 years, when health effects thought to be related to the oil industry were firstnoticed. There is no real budget for research on diseases available, particularly not inthe last 10 years. According to Doctor Nicolai Raycov the radioactivity of oil (Radon)has increased because of several nuclear activities within the region during Soviettimes. Doctor Raycov draws the following conclusions:
- in general oncological diseases have increased in the Tyumen Oblast over the last20 years by 150%;
- cancer in testicles has increased by 300% in the last 20 years;- the number of oncological diseases of people in the age of 25-69 years has
increased from 30 to 60% of the total in the last 20 years;- oncological diseases in children up to 25 years have increased by 100% in the last
20 years;- rectum cancer has increased by 80 % in the last 5 years;- in Nizhnevartovsk, Surgut, Nishnirovgorod and Langepas Regions, oncological
diseases are 30-40% higher than in surrounding regions;- in the towns of Nizhnevartovsk, Radoesjnie, Megion, Langepas and Gagalin,
oncological diseases have increased in the last 5 years by almost 100%.- the higher incidence of testicle and rectal cancer in Russia, compared to lung
cancer being the most common cancer worldwide, was reportedly due to theradioactive contamination of food and drinking water.

Division International Projects IWACO B.V.
West Siberia Oil Industry
Final Report | June, 2001
56116
70
The Tyumen Oblast Committee for Protection of Environment and Natural Resourcesstated in their report: “The ecological situation, the use of natural resources and natureprotection of the Tyumen Oblast, 1994” that the sanitary-epidemiological situation inthe Tyumen Oblast is far from desirable, with about two hundred thousand peoplework under conditions that are destructive or dangerous to their health.
The general health of the population in the Nizhnevartovsk Region worsened in 1994.This is due to a number of reasons including decreasing environmental quality;particular water and air, and radioactivity. According to the State Service Sreda-Zdorovie (Environment-Health) the situation is seen as critical. The diseasesexperienced by the inhabitants of Nizhnevartovsk are indicators for poor environmentalstandards. Data from “AGIS – Environment and Health” also show that illnessesrelated to ecological problems in the city of Nizhnevartovsk in the period 1991-1996are between 1.3 and 3.6 times higher than average for Russia. Although in recent yearsthe absolute figures for pollution decreased, the cases of environment related diseaseshave increased. For example, the NERC reports that insufficient canalisation andpurification of the city waste water and non-compliance of drinking water with Russiandrinking water standards (GOST 2874-82), particularly for iron, manganese andammonia and bacterial quality.
Evaluation of health impactsData obtained on health are very incoherent and amalgamated. Therefore, a trueevaluation could not take place. Nevertheless, it is obvious that significant oilcontamination could lead to health impacts, for instance through contaminated drinkingwater.
6.4.3 Socio-economic impacts
With the introduction of the oil industry in the 50s and 60s the traditional economy ofthe indigenous peoples in Western Siberia changed considerably. Changes include adecrease in traditional subsistence activities such as fishing, hunting, trapping, etc. Dueto the increased population levels the pressure on the natural resources increased.Migrants have been attracted to the area, based largely on new industrial activities(particularly the oil sector) since the 1960s. This has resulted in socio-economicsystems and services built up to service the industrial and oil sector activities.Differences between the `traditional` socio-economic systems and the new are basedon income differentials, inflation, taxation, rent, etc. The availability of, and access to,goods and services improved, although this is largely based on financial capacity. Thebreak-up of the Soviet Union in the early 90s had a severe socio-economic impact onthe oil based economy of Western Siberia, with much of the local economy collapsing.The transition to a market orientated economy started slowly and has caused a declinein living standards, employment and social values. This has only recently started tochange with increased oil revenues.
Evaluation of socio-economic impactsThe socio-economic impact of the oil sector on West Siberia has been significant.Since the oil boom in the 1960s, the economic base of the area, and associated socialand economic services, have developed enormously and are the economic base for anumber of urban centres in West Siberia, Nizhnevartovsk being an example. This haslead to the increased availability of, and access to, goods and services compared to thesituation prior to oil sector activities in the area. In particular, the oil sector hascontributed towards a change in the traditional subsistence economy of the nativeKhanty, Mansis and Nenets peoples. There is very little data that directly links theimpacts of the oil industry in West Siberia to the poor health of local inhabitants.
Division International Projects IWACO B.V.
West Siberia Oil Industry
Final Report | June, 2001
56116
71
However, reports from Tyumen, Khanty Mansiysk and particularly Nizhnevartovskindicate links between poor environmental quality - particularly air and water quality,radioactivity and industrial pollution. These indicate that there may be a correlationbetween impact of industrial activities in the area (the oil sector being the mostprominent) and a higher than Russian average incidence of cancers, cardiologicaldiseases and endocrinological diseases.
6.4.4 Socio-cultural impacts
Oil and gas exploration and production since the 1950s have appeared to have hadconsiderable social, economical and cultural impacts on particularly the indigenousgroups in the region. The culture of these small groups is fragile and in its nature ratherunable to resist the expansion of the technological civilisation. The expansion of oiland gas industry has been one of the catalysts for changes in the traditional lifestyle forthese people. Changes in the economic situation of the indigenous people have severalcauses. The first was that in the beginning of the oil boom oil companies financed ashift to extensive mechanical technologies for example snowmobiles on which theynow depend. Second, the collapse of the state economic structures including thesubsidised markets for furs. The third, the pressure on natural resources from pollutionand from families sharing land with displaced family members makes surviving evenmore difficult.
Since the oil fields in Khanty Mansiysk province have been operating from the mid1950s, there had also been a significant increase in the non-native populationimmigrating into the area traditionally inhabited by indigenous people. The proportionof Khanty and Mansis people in the province has decreased from 13% and 6.2%respectively in 1939 to 1.8% and 0.6% in 1989. “In the 1960s the natives were forcedagainst their will from their scattered settlements into large villages, which meantchange from nomadic life-style into to a resident one”http://www.suri.ee/eup/khants.html. The Khants became a minority in their historicalsettlements, in 1959 they where 9.2% and in 1989 just 1.8%. The Mansis become aneven smaller group, in 1938 they where 6.2% and in 1989 0.6%. The influx of migrantsinto the area has reportedly led to cultural and racial conflicts, particularly culturedifferences as the majority of industrial migrants settled only temporarily and theyhave little desire to understand the way of life of the indigenous people.
The Socio-cultural systems (social structure, organisation and beliefs) are verydifferent between the “locals” and the people who in-migrated because of the oil andgas boom. This boom contributed to a shifting in the way of life of the indigenouspeople.
Due to land-use and land concessions granted to oil companies, large areas of landsused and inhabited by indigenous peoples have been demarcated and fenced. This hasresulted in ‘voluntary’ self-removal and relocation from traditional hunting and familyareas to the industrialised centres due to pollution and encroaching industrialisation. Insome cases, people have been forced into large villages from scattered and nomadicsettlements. Families who used to live outside in tents with reindeer herding andfishing found themselves in an area where oil companies concessions determine landboundaries. Traditional land-use patterns have changed as oil company constructedroads and platforms on the marshlands, limit access to some traditional hunting landsand have cut and divided some traditional family territories. Oil pollution and limitedaccess to reindeer pastures due to oil field demarcation has reportedly severely affectedthe traditional herding and availability of reindeer grasslands. Oil pollution oftraditional fishing lakes and rivers has also reportedly affected fishing.

Division International Projects IWACO B.V.
West Siberia Oil Industry
Final Report | June, 2001
56116
72
Raised roads have trapped water causing flooding and ruining forests, a traditionalhunting area. Hunting has also been affected by the removal of vegetation and groundpreparation for seismic lines and pipes and floodlighting and flares and noise caused byflares, helicopters and other vehicle movements, exploration activities, drillingoperations and production operations. The noise also effects the wildlife for exampleduring the breeding season. Cleanup fires caused by oil companies and petroleum-soaked debris has contributed to air pollution and acid rain. Siting and design ofexploration sites, roads and production facilities cause a negative visual impact.
Oil companies are obliged to compensate local people and affected groups for damageand land-use, subject to agreement with the local government administration. TheMinistry of Fuel and Energy acknowledges that the compensation issue is difficult. It isaffected by interest of indigenous peoples for a changing way of life and their choicefor a traditional or modern lifestyle, the alternatives available and the activities andcompensation offered by oil companies. Many of which are conflicting but bothattractive. An international conference was held in April 2000 concerning oilexploitation and refining and indigenous people, assisted by Canadian consultants, thataddressed a number of these issues. (Interview: Ministry of Fuel and Energy).
The indigenous people believe that the land and the ancestry have sacred powers. Theoccupation of land by oil companies causes problems because on areas that are sacredfor the indigenous people constructions are build. The importance of these sacredplaces for the local people are neglected and most of the time not known by the oilcompanies.
The lack of education and differences in culture has made integration in the newsystem difficult. The availability of and access to goods and services (housing,medical, educational) is reportedly different for indigenous peoples, as discriminationand inadequate communication means that indigenous people can not get proper jobs.The children of the indigenous people therefore spend the greater part of the year inboarding school. They are separated from their family and culture. The understandingfor their culture, knowledge of their mother tongue and way of life gets more difficult.The indigenous people who are loosing their identity become social outcast unable toadapt to the industrial mode of living. The feelings of alienation have contributed toincreased alcoholism and suicide rates in the indigenous populations
To develop a stronger force of local people many organisations, such as indigenousgroups and environmental organisations, help to deal with the consequences ofdevelopment. The alleged `dubious and unfair practices` and violations against RussianFederal law concerning natives permission for land use permits and lack of legalsafeguards for native land rights have lead to the setting up of indigenous peoplesrights groups and development of local development/management plans, conservationstrategies and multinational treaties and agreements. In the Khanty-Mansiysk Districtthe decree of giving communal land to aborigines for term less use was adopted in1992. “According to the law the oil industry must not be expended to the territorypossessed by the indigenous inhabitants without the owner’s permission.”(http://www.suri.ee/eup/ob.html). Although the decree exists, opportunities have beenfound to avoid it. Companies have bribed people with alcohol, food and other gifts.The intellectuals of the Khants, Mansis and Nenets have founded the association ‘SaveYugra’. To support indigenous reindeer herders to unite their resistance against oilexploitation and voice their demands for a compensation for the losses they hadsuffered. Except change in laws and the set up of organisations, nature reserves wereformed. This to protect reserves of the indigenous people.

Division International Projects IWACO B.V.
West Siberia Oil Industry
Final Report | June, 2001
56116
73
(References: http://www.suri.ee/eup/ob.html, http://www.koeln-online.de.nenets.html,http://www/nmsu.edu/`english/hc/eastkhanty.html, Widget A. 1997)
Evaluation of socio-cultural impactsThe socio-cultural impact of the oil sector on West Siberia has been significant. Sincethe oil boom in the 1960s, the sector has resulted in a huge migration into the area.
The oil sector has contributed towards a change in the traditional cultural values andlivelihood of the ethnic native Khanty, Mansis and Nenets peoples of the area. Thefollowing oil sector activities have contributed to socio-cultural changes of thesepeoples:
- changes in land-use due to oil sector activities and facilities (e.g. siting ofpipelines, waste pits, facilities, flares etc.);
- restriction of access to oil company lands;- access to employment within oil sector and related services;- increase in urbanisation and industrial activities;- increased and changed access to social services.
The impacts of the activities listed above include:
- changes in access to traditional lands and land use;- pollution of natural resources used for subsistence;- changes in economic activities (i.e. hunting, fishing and farming);- compensation for damage and landuse;- cultural and racial differences and conflicts (between migrants and ethnic
minorities).
It should be noted that the extent to which the oil sector has resulted in changes andother autonomous factors also impacted the socio-cultural environmental is notquantifiable.
6.5 Extrapolation
Looking at the findings of Nizhnevartovsk Region in relation to the bigger KhantyMansiysk District and the even bigger Tyumen Oblast, extrapolation of the mainfindings to the whole of Western Siberia seems justified. However, conditions ofclimate (permafrost) and for instance the age of the oilfield will cause differences inthe specific environmental impacts and magnitude of the impacts. In general, it can beconcluded that the same impacts will occur in other oil and gas exploration regions inWestern Siberia as well. This holds specifically true for the older oil and gas regions.

Division International Projects IWACO B.V.
West Siberia Oil Industry
Final Report | June, 2001
56116
74
7 Environmental management measures
7.1 Introduction
`General solutions` for mitigation of environmental and social impacts due to the oilsector in West Siberia are proposed in this chapter. Solutions are presented in terms ofenvironmental management measures. These are feasible and effective measures thatmay reduce significant, adverse environmental and social impacts to acceptable levels.Besides measures which are already “ongoing activities” measures named below andmany others, which are not covered within this study take possibly decades toimplement. Before implementing, questions will rise like: Why cleaning such an area?Where to start ? And who will pay? Stakeholders in Western Siberia (or within asmaller entity) should develop a shared vision in the first place. This vision may serveas starting point or reference for all stakeholders and for all future development plans.In such a shared vision adequate weight could be given to all stakeholder interests. Thevision could cover, but should not be limited to:
- environmental quality;- urban infrastructure (water supply, sewerage, etc.);- activities of the oil industry;- waste management;- ecological quality;- employment;- institutional strength;- enforcement and effectiveness of environmental regulations;- dissemination of relevant information.
Ideally, the vision becomes a guiding principle for major planning and developmentdecisions in the coming decades. However, this requires that stakeholders arecommitted to the vision, which is best obtained by their active participation in theprocess of formulating the vision. Within this vision as a framework, concretemeasures will get their own place.
The above does not imply just to stop already ongoing processes and environmentalmeasures since those two are closely related and will support each other.
The already ongoing processes and environmental measures, like development ofrehabilitation techniques and re-use of associated gas should be encouraged.
In general two main types of measures are distinguished: preventive and mitigationmeasures. Preventive measures are meant to control the hazard at the source.Mitigation measures are end-of-pipe measures that control the effects in theenvironment and do not tackle the hazard itself. The enumeration in section 7.2 givesan indication of possible measures applicable to the project area. The list is notexhaustively and measures are not described in detail since this is beyond the scope ofthis project. The list is more or less limited to the measures related to the circumstancesobserved in the study area.

Division International Projects IWACO B.V.
West Siberia Oil Industry
Final Report | June, 2001
56116
75
7.2 Measures
7.2.1 Preventive measures
For socio-economic impact:
- avoidance or awareness of existing land and resource use patterns and rights ofaccess (alternative routes of pipe-lines, minimisation of land take for facilities,positioning of flares, avoidance of flooding, construction of buffer zones fornational parks);
- control access to and exploitation of the local resource base;- control immigration and local migration (adequate housing and settlement policy);- initiate actions to assist local people with the consequences of development
(education, health programmes).
For environmental impacts:
- avoidance of spills (above ground pipelines, alternatives for activities leading tocleaner production, containment measures to control hazards, (additional)treatment of discharges, alternative disposal processes, better transport system);
- avoidance of impact on drainage patterns by introducing proper designedinfrastructure;
- avoidance of emissions to air by proper design and correct engineering, considergas re-injection;
- avoidance of waste streams, proper waste handling.
Organisational aspects:
- establish environmental departments in all oil companies;- introduction of an Environmental Management System to promote long term
sustainable development in the oil sector and promote adherence to transparent,demonstrable standards (Contingency Planning and Emergency ResponseManagement, Detailed Incident Assessment, Waste Management Plan);
- adequate training of personnel.
7.2.2 Mitigation measures
- Remediation of contaminated soils and water;- set up indigenous peoples reserves for remaining people- based on traditional
boundaries & activities;- rights for natives/indigenous peoples should be set;- all companies in area should compensate local population for land used;- strengthen role/enforcement by local authorities, especially fines;- set up ecological insurance fund – paid into by all oil companies.
7.2.3 Soil and groundwater remediation
It can be concluded from the study that oil spillages and improper waste handling arethe main cause of negative impacts on the environment; soil, groundwater and surfacewater contamination. Therefore, the focus in this section will be on oil spillages andoily waste with the related mitigation measures. This section can be seen as anapproach to come to one of the measures which should be taken. It does not necessarilyimplies a prioritisation of possible measures but it sure is a necessary step.

Division International Projects IWACO B.V.
West Siberia Oil Industry
Final Report | June, 2001
56116
76
Since the amount of spill sites and oily waste storages is massive it is obvious that notall those sites can be dealt with, within a few years. There will not only be a timeconstrain but also a constrain of means (money and manpower). Therefore, a realisticapproach has to be developed to cope with the situation. The approach generallyaccepted is to set priorities based on environmental risks associated with thecontaminations. Experiences of various mitigation programmes in Western Europeshow that it is also not cost effective to start a mitigation programme without firsthaving done a solid, reliable prioritisation of the different polluted sites and theirrelated risk aspects. The approach should be simple and transparent for optimumeffectiveness.
Central to the approach is the aim to take away the environmental risks related to thecontamination. Whilst this is in fact the central backbone of the approach, there is agreat deal of flexibility in mitigation measures. This is necessary as the approach needto be adapted to and refined with issues specific for the different oil fields/areas. Thestarting point of this so called ‘risk based’ approach are the risks related to thepollution, rather than the pollution itself. If there are risks, mitigation measures has tobe carried out. In fact, such measures will be nothing more than the elimination of theenvironmental risks. By using this approach, remediation starts at those places where itis needed most (high priority considering environmental risks). Another aspect infavour of this approach is that remediations will be carried out effective and thereforewill be efficient.
Three types of investigations prior to the actual mitigation measures can bedistinguished within this approach. As there are: historical investigation, indicativeenvironmental investigation and the supplementary investigation. Those types ofinvestigation are designed around the central concept of risk-elimination. A historicalinvestigation should among others present site information, (underground)infrastructure, information about the direct surroundings, local stratigraphy andhydrogeology. The product should be a qualitative evaluation of the source(s),exposure pathways and receptors. Those three will describe of how sources couldcontribute to increased levels of risks in potentially exposed receptors. For instance theoil from spills or storages affecting the quality of drinking water and therefore poserisks upon human beings. When the historical investigations are completed within an‘organisational body’ (for instance an oil company or region), the different cases canbe classified and ranked according to their potential environmental risk. Criteria forclassifying/ranking can be the age of the oilfield, the age of the well, the nearness of adrinking water well, the recorded accidents etc. The highest ranked cases will be mosturgent for further investigation, the so called indicative environmental investigation.
The purpose of this indicative investigation is to verify the results of the historicalinvestigation and get an impression of the possible contamination on the site. The exacttype of indicative investigation has to be developed in close cooperation with thecompetent authorities. Although the extent of contamination on the sites is probablynot exactly known at the end of this investigation, another ranking based on potentialrisks will take place. By describing the case, a consistent process for evaluating anddocumentating human health and environmental threats is obtained. The assessment ofqualitative risks for both human being and the environment will form the risk score.For further evaluation the focus will be on pathways which are ‘complete’ for theparticular site. This means that there is a source of sufficient strength, a pathway formigration of the contaminants of concern from source to receptor and an exposurepoint for the receptor. The relevant data will be screened against ‘risk based screeninglevels’ which have to be developed if not existent. The exceedance of the criteria alongan exposure pathway towards a receptor implies a defined potential impact of a source.
Division International Projects IWACO B.V.
West Siberia Oil Industry
Final Report | June, 2001
56116
77
By now the known pollution will be prioritised on the basis of more exact data. Furtherto this investigation a remediation investigation will be performed prior to establish theexact measures to be taken.
7.3 Possibilities for funding environmental measures
Environmental management is primarily a matter for the oil industry itself. Nowadays,it becomes more and more common practice to incorporate environmental managementmeasures in the day to day business. Since the current situation in Russia gives reasonsfor serious concern, (more) international involvement should be considered. Below.some possible projects are listed based on the findings of the study. A projectdescription is given in Appendix 12 as well as an indication of the costs and possibleInternational Financing Institutes. However, investments (financial and know how) byWestern oil companies could be a possibility as well.
• Vision for sustainable development of Nizhnevartovsk Region• Recovery of oil products from oil storages in Nizhnevartovsk Region• Nizhnevartovsk Region Environmental Awareness Programme• Nizhnevartovsk Region Environmental Medical Research Programme• Decommissioning of abandoned oil wells in Nizhnevartovsk Region

Division International Projects IWACO B.V.
West Siberia Oil Industry
Final Report | June, 2001
56116
78
8 Conclusions
8.1 Introduction
IWACO BV Consultants for Water and Environment was commissioned to undertake aproject for the Dutch, German and Russian Greenpeace offices in 2000, to assess theenvironmental and social impacts of the oil industry in West Siberia. The project wascommissioned by Greenpeace to support their scientific field trips to West Siberia inthe summer of 2000 as part of a campaign targeted at the Russian oil industry.IWACO were requested to provide independent scientific data to support theGreenpeace campaign. The project that aims to provide an impression of theenvironmental and social impacts of the oil industry in West Siberia, focussing on theNizhnevartovsk region. It also seeks to provide an overview of the location, extent anddegree of oil pollution in West Siberia. The Profile includes an environmental andsocial baseline of the oil sector in the region, an analysis of the potential keyenvironmental and social issues, of which an assessment of impacts was made.Mitigation and management measures were proposed for the sector.
The project focussed on the Nizhnevartovsk region in West Siberia for the followingreasons:
- The oil industry has been active in this region for over 40 years;- The well-documented Samotlor oilfield is located within the region;- Good accessibility;- Presence of several major oil companies and authorities.
The Nizhnevartovsk region is representative of the oil industry in Western Siberia,allowing the environmental and social impacts of the oil sector in this area to beextrapolated, with care and subject to stipulations, to other areas with oil industries inWestern Siberia.
The following activities were conducted as part of the project:
- Literature review and desk study;- Remote sensing analysis;- Fieldwork and sampling;- Fact finding missions and interviews;- Chemical analysis of samples- Reporting.
8.2 Findings
The Russian Federation is one of the world’s top five energy producers, being thesecond to third world largest exporter of petroleum. In 1998 82,770,000 tonnes wasexported in total. From 1993 to 1998, Western Europe imported between 55% and 78%of Russia’s total exported oil, with Germany, Switzerland, the UK, Italy and Spainbeing the major importers. It is not transparent exactly who the importing companiesare, although all the major international oil companies are probably importers. TotalFina Elf is reported as purchasing 18 to 20 million tons annually from Russia, withTymuen Oil Company stating that 70% of its export is sold to Total Fina Elf. WithinRussia, West Siberia is the most highly developed and oldest oil and gas region,producing about 78% of all Russian oil. The Nizhnevartovsk Region contains some ofthe oldest fields, the Samotlar field being 40 years old.
Division International Projects IWACO B.V.
West Siberia Oil Industry
Final Report | June, 2001
56116
79
The fields are exploited by mainly Russian, recently privatised companies and anumber of joint ventures with international companies. The top six privately owned oilcompanies today are LUKoil, Surneftegaz, Yukos, Sidanko, Tatneft and Tyumen OilCompany (TNK), who together account for about 60% of Russia’s yearly oilproduction of 265 million tons (1998).
The major IFIs active in the Russian energy and environment sector have not identifiedor named the West Siberian oil sector as a priority in their current or future strategiesor policy plans except TACIS, although the EBRD is now reconsidering reallocation offunds. Most IFIs allocate financing on the basis of where they and their Russiancounterpart authority set the highest priority and expect a positive financial or technicalreturn on investment. The historical and current environmental and social managementand impacts of the oil sector do not appear to be a priority for the government, thecurrent operating oil companies and most donor agencies. IFI financing ofenvironmental projects in the sector is not anticipated as a major source of investment,although bilateral and country funds may be, depending on individual polices. Privatesector financing by both national and international companies currently active orwishing to invest in the area appears to be the major potential source of funding forenvironmental projects, although this seems strongly dependent on oil prices.
The Nizhnevartovsk Region of West Siberia is characterised by sensitiveenvironmental conditions. Particularly the sub-arctic and continental climaticconditions, high groundwater levels with waterlogged soils possessing longdegradation and biological recovery times, numerous surface water bodies and fragiletaiga forests and peat bogs. This environment has been directly and significantlyimpacted by the activities of the oil sector in the region. The impacts, in order ofestimated significance include:
- between at least 700,000 to 840,000 hectares of polluted soil in West Siberia andaround 2% of land in the oil fields in the Nizhnevartovsk Region are polluted byoil, with 6500 hectare of contaminated soils confirmed in the NizhnevartovskRegion. This is a much larger area than indicated by official government and oilcompany statistics. Soil pollution has been caused largely by oil pipeline and wellspills, but also by oily muds, drilling and production waste, chemical wastedisposal and leaking storage places; saline production water; operationaldischarges and leakage and oil production site drainage.
- Unquantifiable shallow and deep groundwater and aquifer pollution inNizhnevartovsk Region, particularly the older oil fields such as Samotlor, with oilconcentrations around 0.1 mg/l in groundwater layers up to 200 m deep. Causesinclude oil spills, leaks from oil and chemical waste storage; operationaldischarges and water re-injection and leaks from abandoned old wells.
- Surface water pollution in West Siberia generally, particularly in water bodiesaround oil fields, and especially older fields in the Nizhnevartovsk Region. Themain pollutants are oil products, reaching between 5 to 50 times the Russian PDKnorm, also saline, chlorides and production chemicals. The causes are oil spills andaccidents, releases of drilling wastes, leaks from waste disposal areas, flares andtransport emissions into surface water. Surface water hydrology has also beenunquantifiably changed due to dams, dikes and roads constructed as part of oilfield infrastructure.
- Negative, unquantified impacts on air quality caused by emissions of PolycyclicAromatic Hydrocarbons (PAH), hydrocarbons, particulate and greenhouse gasesparticularly from flaring and venting of associated gases, oil spills and oily wasteburning, and fugitive emissions from oil spills, vents and production facilities.

Division International Projects IWACO B.V.
West Siberia Oil Industry
Final Report | June, 2001
56116
80
- Negative impact on the quality of drinking water in the Nizhnevartovsk Region.97% of drinking water extracted from the River Vakh over a five-year period werepolluted with oil over the PDK norm. Whilst treated surface and ground waterpresents a low risk to human health, the large number of water supply stations andnumerous, unofficial, private wells providing untreated drinking water presents aconsiderable, unquantified health hazard.
- Negative impact on the aquatic biological environment. Over 50% of fished riversin the region are contaminated with oil products, resulting in reduced health,breeding ability, changed spawning behaviour and possibly linked to declining fishcatches. Causes include pipeline and product spills and accidents, releases ofdrilling wastes, leaks from waste disposal areas, flares and transport emissions intosurface water.
- Possible unquantified impact of radioactive contamination of the widerenvironment resulting from radionuclide contaminated oils (both naturally andunnaturally occurring) extracted from certain areas of West Siberia.
- Negative, unquantified impacts on terrestrial flora and fauna, resulting in changedterrestrial habitats such as decreased or increased water levels, limitations ofaccess, flora damage and loss, disturbance and possible contamination of fauna,particularly water birds. The causes include oil spills; noise from oil productionfacilities, vehicles and construction works; vehicle impacts of oil facilitiesconstruction and maintenance works; flares; fires and roads, pipelines, wellplatforms, dams and dikes related to oil facilities.
The Nizhnevartovsk Region of West Siberia has changed greatly in the last 40 years,largely as a result of the development of the oil fields. The Region has industrialisedgreatly, seen a huge increase in migration, large changes in land use with thedevelopment of cities, oil fields and designation of nature reserves. Environmentallegislation has developed on a national and regional level to protect resources, alongwith monitoring and enforcement mechanisms and authorities. The socio-economicenvironment has also been directly and significantly impacted by the activities of theoil sector. The impacts are however largely unquantifiable, but include:
- negative and positive impacts on the socio-economic conditions in theNizhnevartovsk Region, resulting in increased access to employment within oilsector and related services; increased and changed access to social services; denserinfrastructure and transport links in the region.
- Negative and positive impacts on demography in the form of a huge increase inmigration into the region, an increase in urbanisation and industrial activities;increased exposure to cultural and racial differences and increased conflictsbetween migrants and ethnic minorities.
- Negative impact on health caused by pollution, urbanisation and industrialisationof the region, due in part by the oil sector as the major industry in the area. Thereis a potential, suspected correlation between the `poor environment` inNizhnevartovsk and a higher than Russian average level of certain oncological,cardiological and endocrinological diseases and shorter life expectancies.
- Negative and positive impacts on Khanty, Mansis and Nenets indigenous peoplestraditional culture and socio-economic systems, resulting urbanisation of thetraditional hunting areas caused in part by activities of the oil industry, the oilsector presenting alternative cultural values and economic opportunities, changesin land-use due to oil activities and facilities, restriction of access to oil companylands preventing access to traditional lands and infringing on traditional land use,compensation paid for damage and land use, pollution of natural resources used fortraditional subsistence lifestyle (i.e. hunting, fishing and farming).
Division International Projects IWACO B.V.
West Siberia Oil Industry
Final Report | June, 2001
56116
81
The activities of the oil sector have therefore resulted in significant directenvironmental impacts and a number of direct and indirect socio-economic impacts inthe Nizhnevartovsk region. It can be concluded, with caution, that particularlyenvironmental impacts to surface water, groundwater, and terrestrial biology have beenimpacted a wider area of West Siberia. The impacts in the Nizhnevartovsk Region canalso be extrapolated to other oil producing areas in West Siberia. It is likely that otheroilfields have experienced similar impacts of a similar or lesser significance, as thereare strong indications that environmental, particularly pollution impacts and socialimpacts increase in significance in direct correlation with the age of the oilfields.
The activities of the oil industry in West Siberia have caused a wide variety of impacts.The most significant operations that cause multiple negative environmental and socialimpacts are:
- Pipeline and equipment breaks, spills and accidents;- Inadequate emergency planning and equipment;- Normal operational practices with inadequate environmental mitigation and
management measures;- Operational errors and negligence by oil company personnel;- Low company and personnel environmental management and organisation,
awareness and education of environmental impacts of operations, particularlyspills;
- Lack of environmental management systems within oil companies;- Inadequate remediation measures for spills to soil and water;- Lack or under-investment in equipment and use of unsuitable or outdated
equipment;- Incomplete policy regarding native peoples, access and rights to traditional lands
on oilfields.
As these operations have caused major environmental and social impacts and continueto pose hazards. These activities are therefore recommended as priorities formanagement measures or projects to mitigate or reduce significant, adverseenvironmental and social impacts to acceptable levels and as preventive measures.
8.3 Measures
`General solutions` for mitigation of environmental and social impacts due to the oilsector in West Siberia are proposed in this Profile. Solutions are presented in terms ofenvironmental management measures. These are feasible and effective measures thatmay reduce significant, adverse environmental and social impacts to acceptable levels.Besides measures which are already “ongoing activities”, measures named and manyothers which are not covered within this study, take possibly decades to implement.Before implementing, questions will rise like: Why cleaning such an area? Where tostart? And who will pay? Stakeholders in Western Siberia (or within a smaller entity)should develop a shared vision in the first place. This vision may serve as starting pointor reference for all stakeholders and for all future development plans. In such a sharedvision adequate weight could be given to all stakeholder interests. The vision couldcover, but should not be limited to:

Division International Projects IWACO B.V.
West Siberia Oil Industry
Final Report | June, 2001
56116
82
- environmental quality- urban infrastructure (water supply, sewerage, etc.);- activities of the oil industry;- waste management;- ecological quality;- employment;- institutional strength;- enforcement and effectiveness of environmental regulations;- dissemination of relevant information.
Ideally, the vision becomes a guiding principle for major planning and developmentdecisions in the coming decades. However, this requires that stakeholders arecommitted to the vision, which is best obtained by their active participation in theprocess of formulating the vision. Within this vision as a framework, concretemeasures will get its own place.
The above does not imply just to stop already ongoing processes and environmentalmeasures since those two are closely related and will support each other. On thecontrary, e.g. development of rehabilitation techniques and re-use of associated gasshould be encouraged. In general two main types of measures are distinguished:preventive and mitigation measures. Preventive measures are meant to control thehazard at the source. Mitigation measures are end-of-pipe measures that control theeffects in the environment and do not tackle the hazard itself. See for examples ofpossible projects Appendix 12.
8.4 Concerning the Project
The range, scope, objectives and limitations of the mentioned activities necessarilylimited the Environmental and Social Profile. A major problem for the project was thatthe accuracy and reliability of data can not always be optimal due to the followingfactors:
- restrictions to access (part of the Russian officials were not willing to verifyinformation or discuss the matter in depth, or at all);
- the team did not have full or official access to the oilfields;- the requirement for translation of many documents;- the tendency for official data only to be available on an amalgamated regional or
sector level, with no detailing on background of the data;- conflicting data.
Due to the scope of the project, the available time frame and budget limitations, theaim of the sampling program was limited to providing additional data only regardingcritical environmental impacts and locations. No attempt has been is made to fullycover the area with sample points. Therefore sampling and analyses results onlyobtained a preliminary insight in the situation concerning soil and (ground)waterpollution. Therefor the results of the sampling program cannot be used to statisticallysubstantiate the assessment of impacts. In this respect also the lack of monitoring datafrom the oil industry itself and the competent authorities can be regarded as a majoromission. Since most of the literature available deals with data on a an algamatedregional or sector level, with no detailing on background of the data, a study of thebasic data will certainly give a more complete picture of the situation.

Division International Projects IWACO B.V.
West Siberia Oil Industry
Final Report | June, 2001
56116
83
Furthermore, this study clearly shows that remote sensing is an ideal tool for large-scale field investigations and inventories of land use change, such as caused by oilpollution. In order to select appropriate locations for detailed field studies anassessment of different satellite images and/or aerial photographs is very useful.Remote sensing can also be applied to extrapolate point data, collected during detailedfield observations, to an applied large-scale coverage.
In spite of the above, this report provides an independent and a fair assessment of theenvironmental and social impacts of the oil industry in West Siberia. As far as knownby the consultant this is a first attempt to bring together information of the oil industryand environmental and social baseline data on a rather basic level. A further mappingof oil spills may complete the picture for the whole of West Siberia. It is advised to usein this context also satellite images taken during wintertime. The latter will also givemore insight in the position of pipelines (and other possible sources). With a completepicture of the (potential) oil spills in Siberia, combined with the environmental andsocial sensitivities, priorities can be set for future activities.
For possible further investigations it is advised to involve local authorities andrepresentatives of the oil industry to a further extent to come to a more in-depth insight.It became clear that much attention should be paid to institutional development sincethe information seems only fragmentary available and scattered over differentorganisations and measures are not adequate implemented. Therefore, it seems rightnow not very worth while to invest in extensive sampling campaigns/ broadinventarisations without a proper institutional framework for further activities.

Division International Projects IWACO B.V.
West Siberia Oil Industry
Final Report | June, 2001
56116
Appendix 1Interviews

Division International Projects IWACO B.V.
West Siberia Oil Industry
Final Report | June, 2001
56116
Appendix 1 1
Interviews were made in Russia between 31 July and 1 September 2000. This list ofincludes meetings, telephone interviews and email correspondence.
Russian oil companiesYukos Oil, MoscowHead of Environmental Protection & Safety Department, Mr Konvissar GrigoryPetrovitch
Chernogorneft, NizhnevartovskHead of the Ecology Department, Mrs. Ludmila Belova
Russian Ministries/AdministrationsMinistry of Fuel & Energy, Ecological DepartmentAlexander A. Popov, ChiefEleanor A. Ruet, Deputy Chief
City Administration of NizhnevartovskYiriy Timoshkov, Head
Ecological Department of the City Administration of NizhnevartovskVictor Valuisky, Head
Regional Committee of Ecology of NizhnevartovskAndre Chemakin, Deputy HeadAlexander Zinuk, Head of Accident Prevention Department
Nizhnevartovsk Federal Forestry ServiceMichael Poliakov, Head
Fish Inspection Department Nizhnevartovsk (Federal Service)Fjodor Ovechkin, Ichtologist
Ecology Department of Regional Administration of NizhnevartovskAnatoly Zauzilkov, Chief Specialist
Oblast Ecology Committee, TyumenVladimir Giljov, Director
European-Russian Oil and Gas Centre ERIPDominique Bertault
International financing agenciesWorld Bank MoscowRalil Kajaste, Environmental SpecialistAlexander Pozin, Energy Specialist
EBRD LondonLiz Smith, Sr. Environmental Advisor
EBRD MoscowAlexander L. Kurtynin, Associate Banker Natural Resources Department
TACIS EU Delegation (Moscow)George Eliopoulos, Second Secretary Energy, Transport and Telecommunications

Division International Projects IWACO B.V.
West Siberia Oil Industry
Final Report | June, 2001
56116
Appendix 1 2
EmbassiesDutch Embassy MoscowJoep van der Laar, Counsellor Economic and Commercial SectionNeline Koornneef, First Secretary Economic and Commercial Section
Ex- State Committee for the EnvironmentNefediev Nickolay Konstantinovich, DirectorEugene WystorobetsMicheal Kreidlin, Protected Areas Department
Universities and Research InstitutesInstitute of Environmental Geoscience, MoscowDr Alexi Ragozin, Deputy Director of Sciences
Institute of Ecology, Moscow (All-Russian Research Institute for EnvironmentalProtection)Dr Andrey Peshkov, Director
Moscow State UniversityValerii Sergheev, Professor Geological Environment
Institute of Global Climate & Environment, MoscowSergey Gromov, Head of Scientific Sector
Institute of Hydrometeorology, MoscowMr. Khudolev, Head of DepartmentNature Development institute, NizhnevartovskAlexander G. KhurshudovEvgeniy L. Shor
Nizhnevartovsk Research and Design Institute for Oil Industry (NIPIneft)Natalia N. Andreeva
Russian Academy of Natural Science/Committee for Natural Resources &EnvironmentKonstatin I.Lopatin
Institute of Cryosphere, TyumenAndrej Judenko, scientist
Institute of Fish Resources, TyumenAlexander I. Litvinenko, DirectorVladimir Krokhalevsky, Deputy head for research
Tyumen State University of EcologyVictor Radjansky. Head of laboratory of ecological monitoring and research
Tyumen State University of Oil and GasVladislav D. Shantarin
Water Supply Company Vodokanal, NizhnevartovskWadezhda Olgovskaya, Head Waterstation
Division International Projects IWACO B.V.
West Siberia Oil Industry
Final Report | June, 2001
56116
Appendix 1 3
Environmental mediaRosecopress AssociationMark Borozin, President
NGOsGreenpeace NetherlandsMartijn Lodewykx, Oil and Gas CampaignerMarjan Minnesma, Campaign DirectorGreenpeace RussiaAlexi Kisselev, Toxic Campaign CoordinatorSerguei Mikhailov, Remote Sensing Specialist
Russian Environmental Movement (The Green) & Environmental UnionMark Borozin, Chairman
Health InstitutesSanitary and Epidemical Research Centre, NizhnevartovskLarissa Boyko, Deputy Chief Doctor
Tyumen Region’s Oncological centreNicolay Raycov, Manager of Surgery department
Oil industry contractors & suppliersWintershallAart Kijk in de Vegt, Manager Health Safety &Environment

Division International Projects IWACO B.V.
West Siberia Oil Industry
Final Report | June, 2001
56116
Appendix 2References
Division International Projects IWACO B.V.
West Siberia Oil Industry
Final Report | June, 2001
56116
Appendix 2 1
References
Almanac of Russian Petroleum, Energy Intelligence Group, 1999
Alexanders Oil & Gas, West Siberia reports
Chief doctor of the Oncological Clinic of the Tyumen Oblast N.Naumov, Report onhealth situation (tumors and cancer) in Tyumen Oblast for 1999
Contrast Advies, Gas en Olie uit Siberië, 2000
Deyanov, A., US Consulate General, Yekaterinaburg, Oil refining sector in the Uralsand Western Siberia, 1998
Dobrinsky, L.N. and Plotnikov, V.V., Ekologia, concerning the period 1993-1995 forthe Regional Committee of Khanty Mansiysk Okrug, 1997
EBRD, Natural Resources Operations Policy, 1999
Feshach, M. ed., Environmental & Health Atlas of Russia, Moscow 1994
Greenpeace, Greenpeace Magazine 22e 2000-3, August 2000
IUCN & E&P Forum, Oil & gas exploration and production in Arctic and sub-arcticonshore regions, Guidelines for Environmental Protection, 1993
Kryukov, V., `Industry Profile Siberian based oil companies`, Institute of Economics &Engineering, Novosibrisk, July 2000
Lemierre J, `New EBRD president bullish on region`, page 6, Moscow Times,August 5 2000
Moscow Times 'News/Environment', August 4, 2000
Moscow Times `Oil sector`, August 5 2000
Moscow Times, `World Bank to visit` page 11, August 2 2000N. Krupinin, Chairman of Nizhnevartovsk Regional Environmental Committee, Effectof Oil and Gas Industry on the Environmental Situation in the City and the Region ofNizhnevartovsknevartovsk
Nizhnevartovsk Center for Sanitary and Epidemiological Monitoring, State report onSanitary and Epidemiological Situation in the City and the Region of Nizhnevartovskfor the year of 1996.
Nizhnevartovsk interregional committee for environmental protectionNizhnevartovsk, 1999
Regional Ecological Committee of Khanty-Mansiysk, Report on assessment ofenvironmental and natural resources, 1998
Regional Environmental Committee Nizhnevartovsk, Situation of the Environment andNatural Resources in the Nizhnevartovsk Region, 1998
Division International Projects IWACO B.V.
West Siberia Oil Industry
Final Report | June, 2001
56116
Appendix 2 2
Regional Environmental Committee Nizhnevartovsk, Report on Assessment ofEnvironmental Situation in Nizhnevartovsk Region, 1996Russian State Environmental Committee, State report on Environmental situation inthe Russian Federation, 1998
State Committee for Environmental Protection, Federal Report 1996
State Committee for Environmental Protection, Federal Report 1997
State committee of environmental protection of the Russian Federation, 1999
Tyumen Oblast Committee for protection of environment and natural resources, Theecological situation, the use of natural resources and nature protection of the TyumenOblast, 1994
Tyumen State University, Russian Forestry Service Report on situation in the WestSiberia Forestry, 1998
US Consulate General, Oil sector XXX 1998
Widget A., Black Snow: Oil and the Eastern Khanty, New Mexico Heritage Centre,August 1997
World Bank, Draft Sector Report Russian Federation Energy & Environment Review,June 2000
Yukos, Environmental Report, 1997
Internet sourceshttp://ourworld.compuserve.com/homepages/alfred_kuhn/s_Nizhnevartovskhne.htmhttp://www.koeln.de/infoe/nenets.htmlhttp://www.moles.org/projectunderground/motherlode/drilling/russia.htmlhttp://www.nmsu.edu/~english/eastkhanty.htmlhttp://www.nmsu.edu/~english/hc/impactoil.htmlhttp://www.pacenv.org/oildev.htmlhttp://www.suri.ee/eup/khants.htmlhttp://www.suri.ee/eup/mansis.htmlhttp://www.zapovedniks.ru/frames/book/western…/western_siberia%20text.htmlwww.ebrd.com/english/oipera/pressrel/www.kingston.ac.uk/~ad_s702/case2.htmwww.koeln-online.de.nenets.htmlhttp://www/nmsu.edu/`english/hc/eastkhanty.htmlwww.oilonline.com/newshttp://binis.doc.govwww.suri.ee/eup/ob.htmlwww.zapovedniks.ru/frames/book/westren…/westernsiberia%20text.ht
Division International Projects IWACO B.V.
West Siberia Oil Industry
Final Report | June, 2001
56116
Appendix 3Report on remote sensing

Division International Projects IWACO B.V.
West Siberia Oil Industry
Final Report | June, 2001
56116
Appendix 3 1
Creation of the oil spill map
Materials
For this study two Landsat thematic mapper 7 images were available recorded in July1999 and July 2000. Both images were geometrically corrected using the Landsat on-board calibration parameters. The accuracy of this method for geometric correction isregarded to be in the order of 100 meters. Field observations of oil polluted areas weremade, at these areas the type of pollution, vegetation cover, relative age of thepollution and size of the polluted area were noted. The location of the pollution wasrecorded using GPS measurements. A total of 33 field locations were visited and thecharacteristics were noted.
Methods
An oil spill map was created by Greenpeace Russia using the 1999 Landsat image byvisual interpreted of the image. Although visual interpretation can yield good results, itis also difficult to quantify the results in terms of objectivity, accuracy and reliability.Therefore a new map was created based on the 2000 image using a combination ofautomatic classification and visual interpretation. The following steps were carried out:
1. Selection of training samples. Based on the field observation five location werechosen in order to be used as training samples for the automatic classification.These were field observation: 23, 25, 16, 29 and 21, which contained both recentand old oil contamination sites.
2. A parallelepiped classification was carried out first, because this type ofclassification only selects pixels that are spectrally identical to the training sites.This procedure allowed us to gain insight in the spatial patterns of the oilcontamination and the quality of the visual interpretation. The conclusion was thatthe visual interpretation was of good quality but probably yielded anoverestimation of the total polluted area. A number of areas that were selected inthe visual interpretation were not confirmed by the image classification.
3. A drawback of a parallelepiped classification is that the classification resultsgenerally yield a speckled pattern due to the fact that the algorithm does not selectpixels that are spectrally similar but do not fall within the spectral limits of thetraining samples. A maximum likelihood classification was therefore carried outusing the same training samples that were used for the parallelepipedclassification. Besides a classification result also a distance image was generatedwhich gives the Euclidean distance of each pixel to the class signature to which itwas assigned.
4. A thresholding was then applied to the classification results on the basis of thedistance image. All pixels that were classified to a certain class but that werespectrally too far away from the class signature were eliminated from theclassification. The thresholding value was set empirically by comparing the resultsfor different threshold values with the visual interpretation of the image. Inpractice, a threshold value of 20 was found to be appropriate.
5. Because image classification results usually yield a lot of isolated pixels a clumpand sieve algorithm was applied which eliminated all clumps smaller that 5 pixels.This operation cleaned the classification result considerably leaving onlycontiguous zones of oil pollution.
6. The classification result was then crossed with the visual interpretation and onlythe pixels were selected that were both classified as oil spill in the classificationresult and in the visual interpretation. The final classification was then polished
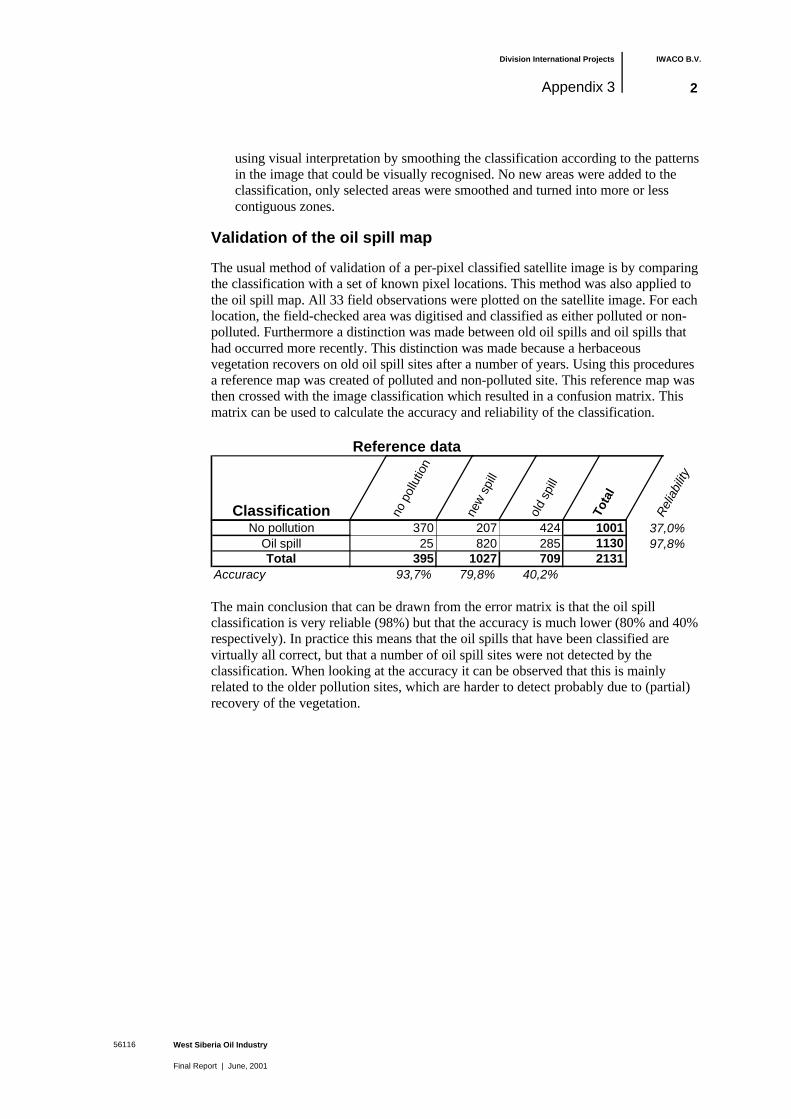
Division International Projects IWACO B.V.
West Siberia Oil Industry
Final Report | June, 2001
56116
Appendix 3 2
using visual interpretation by smoothing the classification according to the patternsin the image that could be visually recognised. No new areas were added to theclassification, only selected areas were smoothed and turned into more or lesscontiguous zones.
Validation of the oil spill map
The usual method of validation of a per-pixel classified satellite image is by comparingthe classification with a set of known pixel locations. This method was also applied tothe oil spill map. All 33 field observations were plotted on the satellite image. For eachlocation, the field-checked area was digitised and classified as either polluted or non-polluted. Furthermore a distinction was made between old oil spills and oil spills thathad occurred more recently. This distinction was made because a herbaceousvegetation recovers on old oil spill sites after a number of years. Using this proceduresa reference map was created of polluted and non-polluted site. This reference map wasthen crossed with the image classification which resulted in a confusion matrix. Thismatrix can be used to calculate the accuracy and reliability of the classification.
Reference data
Classification no p
ollu
tion
new
spi
ll
old
spill
Tota
l
Rel
iabi
lity
No pollution 370 207 424 1001 37,0%Oil spill 25 820 285 1130 97,8%Total 395 1027 709 2131
Accuracy 93,7% 79,8% 40,2%
The main conclusion that can be drawn from the error matrix is that the oil spillclassification is very reliable (98%) but that the accuracy is much lower (80% and 40%respectively). In practice this means that the oil spills that have been classified arevirtually all correct, but that a number of oil spill sites were not detected by theclassification. When looking at the accuracy it can be observed that this is mainlyrelated to the older pollution sites, which are harder to detect probably due to (partial)recovery of the vegetation.

Division International Projects IWACO B.V.
West Siberia Oil Industry
Final Report | June, 2001
56116
Appendix 3 3
Description of field observations
Observation Site description
001 Site crossed with pipelines, with thin oil film around the pipelines. No evidence of
large scale contamination
002 Recent oil spill along the road, 50-100 meter wide
003 Large recent oil spill
004 Old oil spill, 70% of the site is covered with vegetation including pine forest (5-10
years old)
005 Oil spill along the road 50-80 meter wide, 700-1000 meter long.
006 No contamination
007 Old oil spill, traces of oil and a tar covered surface remain
008 Old oil spill, thin oil film on the surface
009 Recent oil spill
010 Old oil spill
011 No contamination
012 Recent oil spill of size 600x400 meter
013 Shore line is for 50% covered with oil or an oil crust
014 20-70 meter wide oil film along the road
015 Old oil spill, site fully covered with a tar surface
016 Old oil spills on both side of the road
017 Large recent oil spill between the two roads
018 Severe contamination over 200x500 meter,oil crust on soil, oil film on water. Site is
crossed by pipelines.
019 Lake shore covered with a tar crust
020 No contamination
021 Old oil spill
022 Old oil spill with evidence of cleanup attempts
023 Large oil spill: 300m wide, 700 m long
024 Recent oil spill 50x100 meter
025 Large oil spill, evidence of both old and recent oil spills
026 Forest clean, slight contamination along pipelines
027 Oil spill, evidence of both old and recent oil spills and cleanup attempts
028 Large old oil spill
029 Oil film along the road and on water, oil in bottom sediments
030 No contamination
031 No contamination
032 No contamination
033 No contamination

Division International Projects IWACO B.V.
West Siberia Oil Industry
Final Report | June, 2001
56116
Appendix 3 4

Division International Projects IWACO B.V.
West Siberia Oil Industry
Final Report | June, 2001
56116
Appendix 4Field visits
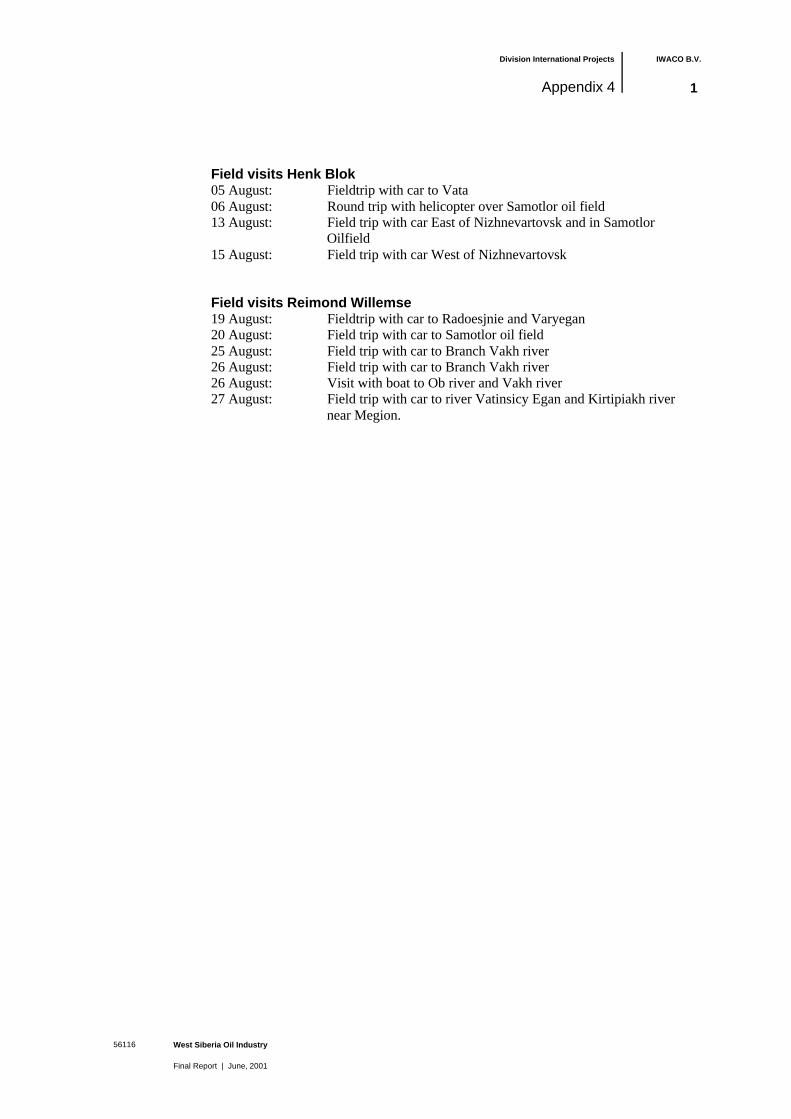
Division International Projects IWACO B.V.
West Siberia Oil Industry
Final Report | June, 2001
56116
Appendix 4 1
Field visits Henk Blok05 August: Fieldtrip with car to Vata06 August: Round trip with helicopter over Samotlor oil field13 August: Field trip with car East of Nizhnevartovsk and in Samotlor
Oilfield15 August: Field trip with car West of Nizhnevartovsk
Field visits Reimond Willemse19 August: Fieldtrip with car to Radoesjnie and Varyegan20 August: Field trip with car to Samotlor oil field25 August: Field trip with car to Branch Vakh river26 August: Field trip with car to Branch Vakh river26 August: Visit with boat to Ob river and Vakh river27 August: Field trip with car to river Vatinsicy Egan and Kirtipiakh river
near Megion.

Division International Projects IWACO B.V.
West Siberia Oil Industry
Final Report | June, 2001
56116
Appendix 5List with samples and coordinates
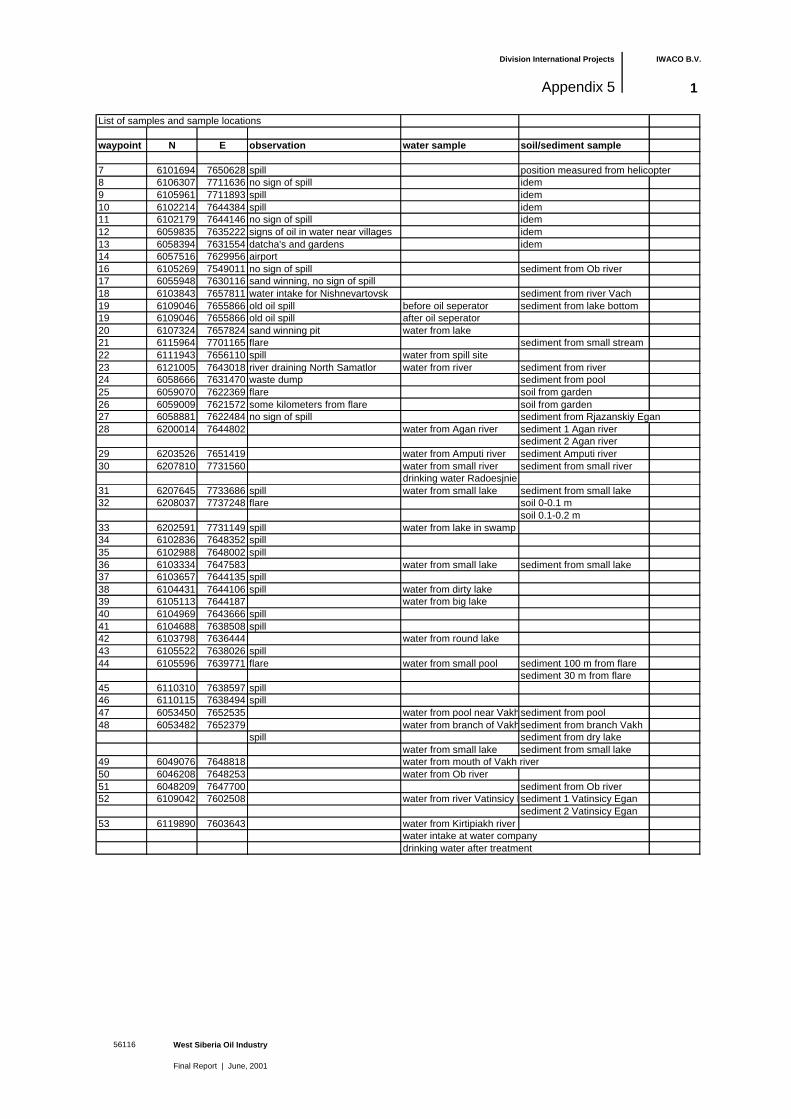
Division International Projects IWACO B.V.
West Siberia Oil Industry
Final Report | June, 2001
56116
Appendix 5 1
List of samples and sample locations
waypoint N E observation water sample soil/sediment sample
7 6101694 7650628 spill position measured from helicopter8 6106307 7711636 no sign of spill idem9 6105961 7711893 spill idem10 6102214 7644384 spill idem11 6102179 7644146 no sign of spill idem12 6059835 7635222 signs of oil in water near villages idem13 6058394 7631554 datcha's and gardens idem14 6057516 7629956 airport16 6105269 7549011 no sign of spill sediment from Ob river 17 6055948 7630116 sand winning, no sign of spill18 6103843 7657811 water intake for Nishnevartovsk sediment from river Vach19 6109046 7655866 old oil spill before oil seperator sediment from lake bottom19 6109046 7655866 old oil spill after oil seperator20 6107324 7657824 sand winning pit water from lake21 6115964 7701165 flare sediment from small stream22 6111943 7656110 spill water from spill site23 6121005 7643018 river draining North Samatlor water from river sediment from river24 6058666 7631470 waste dump sediment from pool25 6059070 7622369 flare soil from garden26 6059009 7621572 some kilometers from flare soil from garden27 6058881 7622484 no sign of spill sediment from Rjazanskiy Egan28 6200014 7644802 water from Agan river sediment 1 Agan river
sediment 2 Agan river29 6203526 7651419 water from Amputi river sediment Amputi river30 6207810 7731560 water from small river sediment from small river
drinking water Radoesjnie31 6207645 7733686 spill water from small lake sediment from small lake32 6208037 7737248 flare soil 0-0.1 m
soil 0.1-0.2 m33 6202591 7731149 spill water from lake in swamp34 6102836 7648352 spill35 6102988 7648002 spill36 6103334 7647583 water from small lake sediment from small lake37 6103657 7644135 spill38 6104431 7644106 spill water from dirty lake39 6105113 7644187 water from big lake40 6104969 7643666 spill41 6104688 7638508 spill42 6103798 7636444 water from round lake43 6105522 7638026 spill44 6105596 7639771 flare water from small pool sediment 100 m from flare
sediment 30 m from flare45 6110310 7638597 spill46 6110115 7638494 spill47 6053450 7652535 water from pool near Vakh riversediment from pool48 6053482 7652379 water from branch of Vakhsediment from branch Vakh
spill sediment from dry lakewater from small lake sediment from small lake
49 6049076 7648818 water from mouth of Vakh river50 6046208 7648253 water from Ob river51 6048209 7647700 sediment from Ob river52 6109042 7602508 water from river Vatinsicy Egansediment 1 Vatinsicy Egan
sediment 2 Vatinsicy Egan53 6119890 7603643 water from Kirtipiakh river
water intake at water companydrinking water after treatment

Division International Projects IWACO B.V.
West Siberia Oil Industry
Final Report | June, 2001
56116
Appendix 6Chemical analyses IWACO

Division International Projects IWACO B.V.
West Siberia Oil Industry
Final Report | June, 2001
56116
Appendix 6 1

Division International Projects IWACO B.V.
West Siberia Oil Industry
Final Report | June, 2001
56116
Appendix 7Photographs

Division International Projects IWACO B.V.
West Siberia Oil Industry
Final Report | June, 2001
56116
Appendix 7 1
IWACO / Willemse
IWACO / Willemse
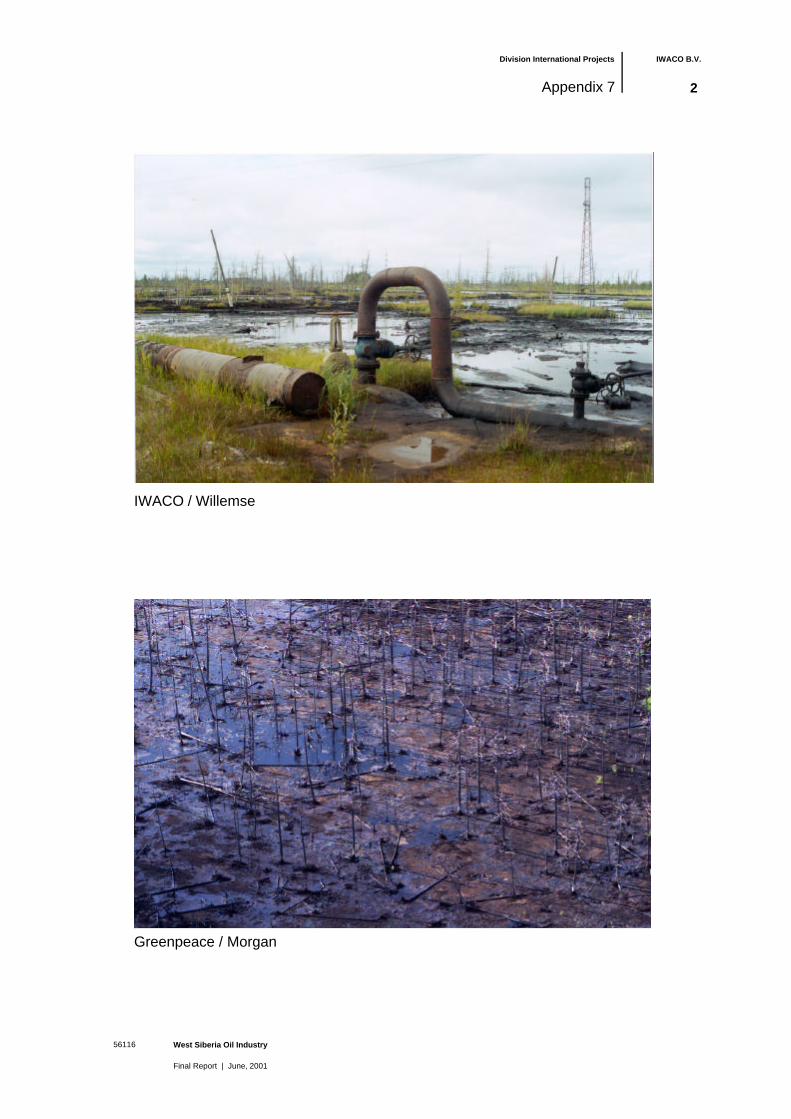
Division International Projects IWACO B.V.
West Siberia Oil Industry
Final Report | June, 2001
56116
Appendix 7 2
IWACO / Willemse
Greenpeace / Morgan

Division International Projects IWACO B.V.
West Siberia Oil Industry
Final Report | June, 2001
56116
Appendix 7 3
IWACO / Willemse
Greenpeace / Oleferenko

Division International Projects IWACO B.V.
West Siberia Oil Industry
Final Report | June, 2001
56116
Appendix 7 4

Division International Projects IWACO B.V.
West Siberia Oil Industry
Final Report | June, 2001
56116
Appendix 8Nature reserves in West Siberia

Division International Projects IWACO B.V.
West Siberia Oil Industry
Final Report | June, 2001
56116
Appendix 8 1
Altaisky Zapovednik, within North-Eastern and Central Altai was established in1932. It was closed in 1951-57 and in 1961-67 and has been existing in its present-dayboundaries since 1981. Its area is 881.2 thousand ha, including 28.8 thousand ha ofwetlands and Lake Teletskoye water area. It is located on the north-eastern and easternshore of Lake Teletskoye, occupies the basins of the Chulymash River and its righttributaries (Shavla, Chulcha, etc.) and the rivers flowing into Lake Teletskoye ( Kyga,Koksha, etc.). It comprises Chulymashskoye Upland, the south-facing slope of theKorbu Mountain Range, southwestern slope on Shapshalsky Range. The elevationranges from 429 m to 3300 m above the sea level. The highest elevations are asfollows: 3507 m (Shapshalsky Range on the Zapovednik boundary) and 3111 m abovethe sea level (Mount. Kurkurabazhi). There are numerous waterfalls and high-mountainlakes. Until 1976 only the Altai Reserve existed in the entire Western Siberia. In 1917it was planned to reserve a plot of the Barabinskaya forest-steppe in the lake Chanyregion. It has not been done so far. In addition to the Shorskii National Park in theKemerovo Region, there are local nature parks of the municipal level (e.g., KondinskieOzera Nature Park in the Soviet district of the Khanty-Mansiiskii Okrug, and alsoseveral big republican sanctuaries (zakazniks) (Verkhne-Kondinskii, Elizarovskii,Kirzinskii, Stepnoi and a number of others). Of great value in the region are suchnatural features as band coniferous forests in the Kulunda Steppe, Novosibirsk Regionand Altai Territory. Some peculiar large lakes in the southern Tyumen Regionrenowned not only for waterfowl but also rare avian species listed in the Red DataBook, tundra landscapes of Yamal and other regions of the Far North.
Malaya Sosva Zapovednik, in Khanty-Mansiysk Autonomous Okrug wasestablished in 1976, partly on the territory of the ex-Kondo-Sosvensky Zapovednik. Itsarea is 225.6 thousand ha. Located on the upland plain in the basin of the MalayaSosva River. The territory includes a floodplain with above-floodplain terraces. TheZapovednik protects the nature complexes of middle taiga of Western Siberia. Since1977 the Verkhnekondinsky Nature Zakaznik (Federal) has been affiliated with theZapovednik. The Zakaznik was established in an area of 241.6 thousand ha in 1971.Verkhne-Tazovsky Zapovednik, in Yamalo-Nenetsky Autonomous Okrug wasestablished in 1986. Its area is 631.3 thousand ha. It is located on VerkhnetazovskayaUpland, in the watershed of river Taz tributaries Pokolka and Ratta. The highestelevations are 160-170 m above the sea level.
Kuznetsky Alatau Zapovednik, in Tisulsky and Novokuznetsky districts of theKemerovo Region was established in 1989. Its area is 412.9 thousand ha. Located inthe middle part of mountain massif Kuznetsky Alatau, encompassing the ranges Tydyn(mountain Bolshaya Tserkovnaya 1449 m above the sea level, the Chemodan Mountain1357 m above the sea level), massifs of the Krestovaya Mountain (1549 m above thesea level) and the Kanym Mountain (1871 m above the sea level) with sources of thegreatest tributaries of Ob rivers Tom and Chulym. The nature complexes characteristicof the transition zone between Western and Eastern Siberia are widespread. Well-defined are the altitude zones from steppe and forest-steppe to taiga, alpine meadowsand high-mountain tundra. Forests cover 253.6 thousand ha; meadows, 15.2 thousandha; water bodies, 1.6 thousand ha.
Shorsky National Park, in the Tashtagolsky District of Kemerovskaya Region. ThePark was founded in 1989. Its area is 418.2 thousand ha. It comprises the basins of therivers Mrassu and Kondom on the south of the Salairo-Kuznetsk mountain country. Onthe west it is bordered by the outer spurs of the Altai, and on the east by Abakanmountain ridge. The relief is middle-mountain, with a maximum altitude of 1555 mabove sea level (on Kubez mountain).
Division International Projects IWACO B.V.
West Siberia Oil Industry
Final Report | June, 2001
56116
Appendix 8 2
Katunsky Zapovednik is in the south of Gorny Altai Republic. The Zapovednik wasestablished in 1991. Its area is 150.1 thousand ha. It is located in Southern Altai in theupper reaches of the Katun River. The topography features are middle mountains andhigh mountains with absolute elevations of up to 4000 m above the sea level.
Gydansky Zapovednik in Tazovsky District of Yamalo-Nenetsky AutonomousOkrug, on Yavay, Mamont, Oleny peninsulas and on the islands of Karskoye SeaOleny, Shokalsky, Proklyatye, Pestsovye, Rovny, was established in 1996. Its area is878.2 thousand ha, of them 71.8 thousand ha are water areas. The topography isformed by paludal valleys, with numerous rivers, brooks and lakes. In the plant covercommunities of Arctic subzones of tundra are presented.
Malaya Sosova Zapovednik, in Khanty Mansiysk Okrug was established in 1976 withan area of 225.6 ha. It is located on a upland plan in the basin of the Malaya SosovaRiver and includes the flood plain and flood plain terraces. It protects the ecologicalzone of the West Siberian middle taiga/. Woodland covers 80% of the territory, bogsaccount for 14%. It contains about 360 plant species, including a number of rarespecies. Fauna includes the native European beaver, mammals and birds including therare osprey, peregrine falcon and Siberian crane.
Yugansky Zapovednik, in the south of Khanty-Mansiysk Autonomous Okrug wasestablished in 1982. Its area is 648.7 thousand ha. Located in the basin of the UganRiver, left tributary of the river Ob and the two arms the Bolshoi and Mala YuganRivers. The topography is typically plain, rising 80-100 m above the sea level. Itconsists of plains, rising to 100m above sea level. It is covered by middle taiga forestand bogs. Rare flora includes two Cypripedium species and the Calypso bulbosa. Rarebirds include the osprey, white tailed eagle, golden eagle and black stork. The beavercolonies are protected. 10 valuable fish species have their spawning grounds in thereserve. The Yuganski Khanty Biosphere Reserve was proposed in 1996 underprotected area status of the Okrug (OOPTTP) and international UNESCO designationas a biosphere reserve. It proposes an additional 2.3 million hectares around theYuganski Nature Reserve, in a tripartite zonation based on both the nature preserve andindigenous people status.
(sources www.zapovedniks.ruwww.zapovedniks.ru/frames/book/western…/western_siberia%20text.html

Division International Projects IWACO B.V.
West Siberia Oil Industry
Final Report | June, 2001
56116
Appendix 9Report on fish analyses

Division International Projects IWACO B.V.
West Siberia Oil Industry
Final Report | June, 2001
56116
Appendix 9 1

Division International Projects IWACO B.V.
West Siberia Oil Industry
Final Report | June, 2001
56116
Appendix 10Analyses Greenpeace

Division International Projects IWACO B.V.
West Siberia Oil Industry
Final Report | June, 2001
56116
Appendix 10 1
Division International Projects IWACO B.V.
West Siberia Oil Industry
Final Report | June, 2001
56116
Appendix 11Dutch standards
Division International Projects IWACO B.V.
West Siberia Oil Industry
Final Report | June, 2001
56116
Appendix 11 1
Target values, intervention values and (T+I)/2 values
Foreword
The following is derived from a circulair on soil quality standards from the DutchMinistery of Housing, Spacial Planning and Environment.
In this circular, dated 9 May 1994, the Dutch Minister of Housing, Spatial Planningand the Environment informs the Local Authorities in the Netherlands about the newsoil quality standards, the intervention and the target values. This includes that since1994, the Authorities in the Netherlands have to use these new values instead of the oldABC-values.
In the eighties, the Dutch policy on contaminated land made use of the ABC-values. In1994 the ABC-values have been replaced by target values and intervention values.Target values indicate the soil quality required for sustainability. They can becompared with the old A-values. Intervention values for soil remediation indicate thequality at which soil is considered to be seriously contaminated. They can be comparedwith the old C-values. The old B-values have been replaced by the criterion:
1/2(intervention value + target value) = (T + I)/2 = Half way value
Intervention and target values for soil1. IntroductionPolicy on contaminated land makes use of two parameters, i.e. intervention values andtarget values. Intervention values indicate the quality for which the functionality of thesoil for human, animal and plant life are, or are threatened with being, seriouslyimpaired. Target values indicate the soil quality required for sustainability or,expressed in terms of remedial policy, the soil quality required for the full restorationon the soil's functionality for human, animal and plant life. These intervention andtarget values are presented here.
2. Intervention valuesThe intervention values for soil remediation (Parliamentary Paper II 1993/94, 22 727,no. 5) indicate the quality at which soil is considered to be seriously contaminated.
The intervention values are based on a detailed study by the RIVM (National Institutefor Public Health and Environmental Protection; reports 725201001 to 725201008inclusive) into the human toxicological and ecotoxicological effects of soilcontaminants. The human toxicological effects are quantified in terms of thoseconcentrations in the soil which result in the so-called maximum permissible risk levelfor human beings exceeded. For non-carcinogenic substances, this corresponds to theTDI (tolerable daily intake). For these purposes it is assumed that all exposurepathways apply.
The intervention values for groundwater are not based on a separate risk assessment inregard to the contaminants present in the groundwater, but are derived from the valuesfor soil/sediment.
The intervention values are related to spatial parameters. These values are regarded ashaving been exceeded, and the soil as therefore being seriously contaminated, if themean soil/sediment concentration of at least one substance in at least 25 m3 of 'soil-
Division International Projects IWACO B.V.
West Siberia Oil Industry
Final Report | June, 2001
56116
Appendix 11 2
volume' (i.e. approximately 7 x 7 0.5 m), or groundwater concentration in at least100 m3 of 'soil volume', exceeds the intervention value.
The protocols for the preliminary and further site investigations describe the manner inwhich compliance with the standards is to be tested. The protocols prescribe samplingbased on a 7 x 7 m rectungular grid. In order to determine, whether the interventionvalues are exceeded in a 25 m3 section, sampling can be carried out at the four cornersto a depth of 0.5 m. If a different sampling procedure is used from that prescribed bythe protocols, the person concerned must himself/herself ensure and adequatelydemonstrate that the 25 m3 criteria is met.
The intervention values are related to the content of organic matter and clay in the soil.These relationships are set out in the form of so-called soil type correction factors.
The intervention values for soil remediation are presented in table 1. The correction forsoil type is dealt with in the notes to the table.
3. Target valuesThe policy statement on the memorandum 'Environmental quality objectives for soiland water' ('MILBOWA' - Parliamentary Paper II 1991l92, 2l 990 and 21 250, no. 3)presented quantitative target values for soil and water for a large number ofcontaminants. The policy statement announced the replacement of the reference valuesand A-values in the Leidraad Bodembescherming (Soil Protection Guidelines) by thetarget values. The target values therefore indicate the soil quality levels ultimatelyaimed for.
In compiling the target values, environmental constraints applied in other policy areaswere drawn upon, such as standards for drinking water and surface waters, standardsand draft standards from the Commodities Act, and policy objectives previouslyformulated for nitrate and phosphate. Values for heavy metals, arsenic and fluoridewere derived from the analysis of field data from relatively pollution-free rural areasand aquatic sediments regarded as uncontaminated. The target values for soil weretuned to the target values for surface waters where this proved scientifically possible.
Table 1 contains the list of target values re1evant for the remediation policy ofcontaminated soil and groundwater. The manner in which the target values arecorrected to allow for differences in soil types are described in the notes to the table.
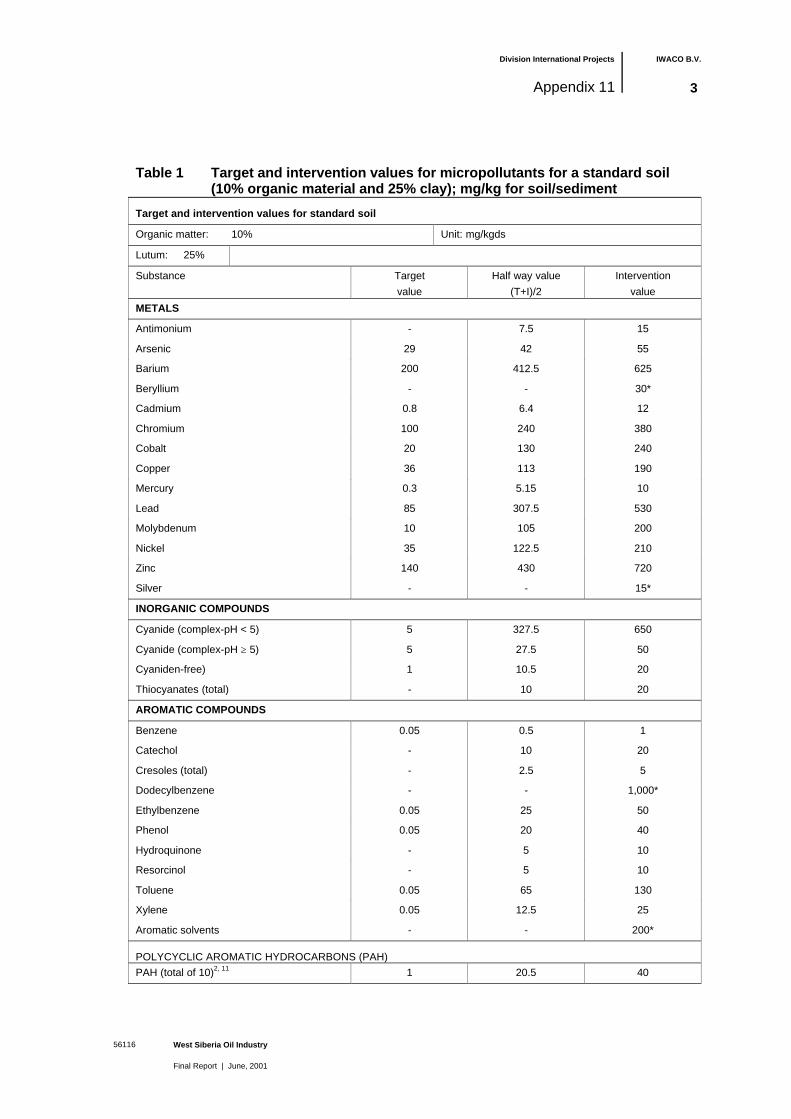
Division International Projects IWACO B.V.
West Siberia Oil Industry
Final Report | June, 2001
56116
Appendix 11 3
Table 1 Target and intervention values for micropollutants for a standard soil(10% organic material and 25% clay); mg/kg for soil/sediment
Target and intervention values for standard soil
Organic matter: 10% Unit: mg/kgds
Lutum: 25%
Substance Target
value
Half way value
(T+I)/2
Intervention
value
METALS
Antimonium - 7.5 15
Arsenic 29 42 55
Barium 200 412.5 625
Beryllium - - 30*
Cadmium 0.8 6.4 12
Chromium 100 240 380
Cobalt 20 130 240
Copper 36 113 190
Mercury 0.3 5.15 10
Lead 85 307.5 530
Molybdenum 10 105 200
Nickel 35 122.5 210
Zinc 140 430 720
Silver - - 15*
INORGANIC COMPOUNDS
Cyanide (complex-pH < 5) 5 327.5 650
Cyanide (complex-pH ≥ 5) 5 27.5 50
Cyaniden-free) 1 10.5 20
Thiocyanates (total) - 10 20
AROMATIC COMPOUNDS
Benzene 0.05 0.5 1
Catechol - 10 20
Cresoles (total) - 2.5 5
Dodecylbenzene - - 1,000*
Ethylbenzene 0.05 25 50
Phenol 0.05 20 40
Hydroquinone - 5 10
Resorcinol - 5 10
Toluene 0.05 65 130
Xylene 0.05 12.5 25
Aromatic solvents - - 200*
POLYCYCLIC AROMATIC HYDROCARBONS (PAH)
PAH (total of 10)2, 11 1 20.5 40
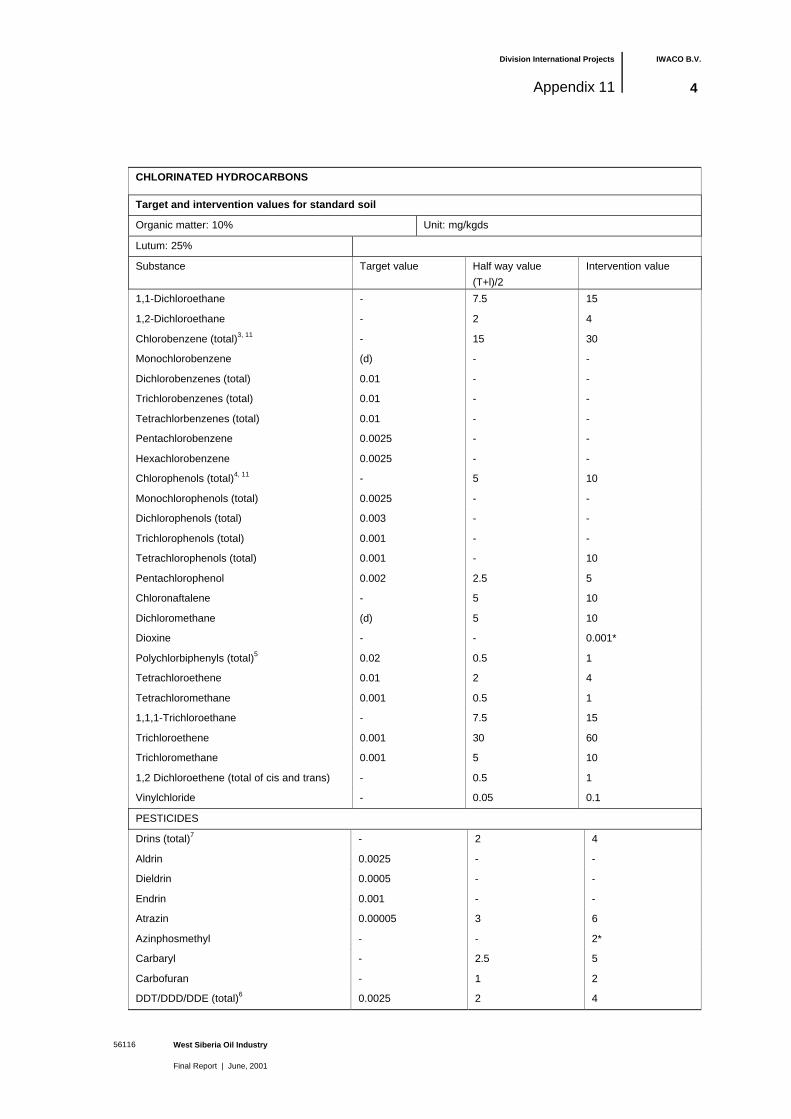
Division International Projects IWACO B.V.
West Siberia Oil Industry
Final Report | June, 2001
56116
Appendix 11 4
CHLORINATED HYDROCARBONS
Target and intervention values for standard soil
Organic matter: 10% Unit: mg/kgds
Lutum: 25%
Substance Target value Half way value
(T+l)/2
Intervention value
1,1-Dichloroethane - 7.5 15
1,2-Dichloroethane - 2 4
Chlorobenzene (total)3, 11 - 15 30
Monochlorobenzene (d) - -
Dichlorobenzenes (total) 0.01 - -
Trichlorobenzenes (total) 0.01 - -
Tetrachlorbenzenes (total) 0.01 - -
Pentachlorobenzene 0.0025 - -
Hexachlorobenzene 0.0025 - -
Chlorophenols (total)4, 11 - 5 10
Monochlorophenols (total) 0.0025 - -
Dichlorophenols (total) 0.003 - -
Trichlorophenols (total) 0.001 - -
Tetrachlorophenols (total) 0.001 - 10
Pentachlorophenol 0.002 2.5 5
Chloronaftalene - 5 10
Dichloromethane (d) 5 10
Dioxine - - 0.001*
Polychlorbiphenyls (total)5 0.02 0.5 1
Tetrachloroethene 0.01 2 4
Tetrachloromethane 0.001 0.5 1
1,1,1-Trichloroethane - 7.5 15
Trichloroethene 0.001 30 60
Trichloromethane 0.001 5 10
1,2 Dichloroethene (total of cis and trans) - 0.5 1
Vinylchloride - 0.05 0.1
PESTICIDES
Drins (total)7 - 2 4
Aldrin 0.0025 - -
Dieldrin 0.0005 - -
Endrin 0.001 - -
Atrazin 0.00005 3 6
Azinphosmethyl - - 2*
Carbaryl - 2.5 5
Carbofuran - 1 2
DDT/DDD/DDE (total)6 0.0025 2 4
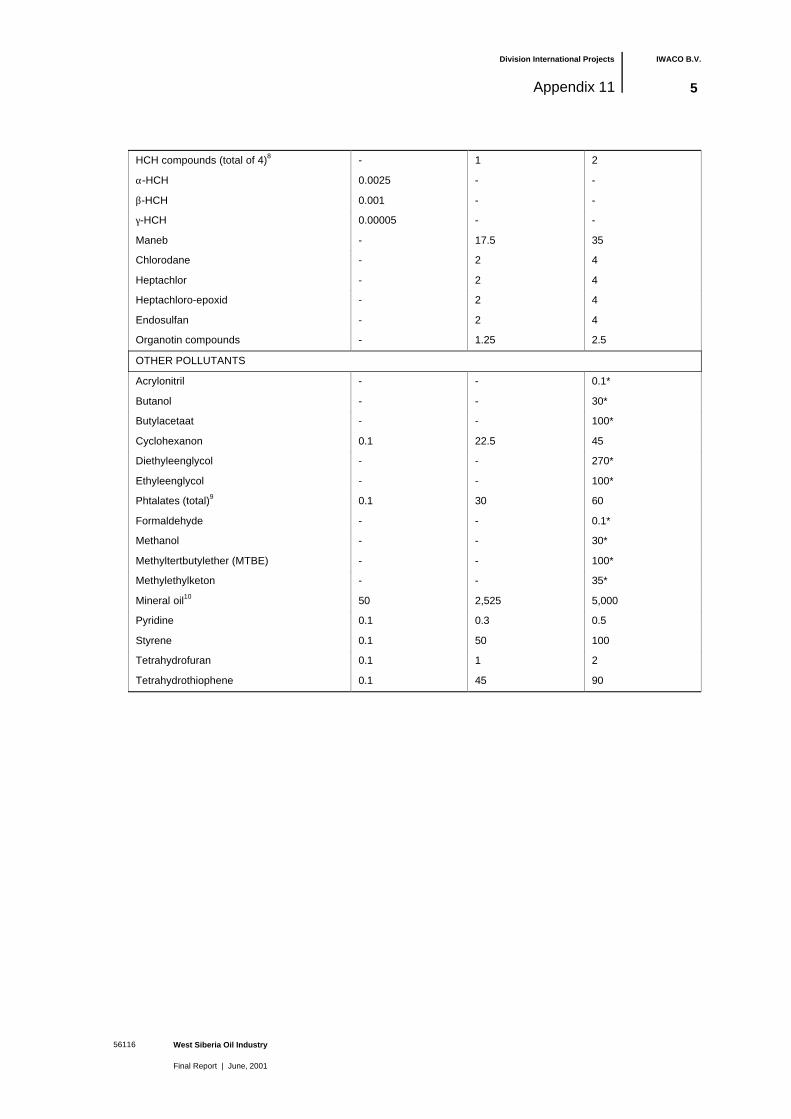
Division International Projects IWACO B.V.
West Siberia Oil Industry
Final Report | June, 2001
56116
Appendix 11 5
HCH compounds (total of 4)8 - 1 2
α-HCH 0.0025 - -
β-HCH 0.001 - -
γ-HCH 0.00005 - -
Maneb - 17.5 35
Chlorodane - 2 4
Heptachlor - 2 4
Heptachloro-epoxid - 2 4
Endosulfan - 2 4
Organotin compounds - 1.25 2.5
OTHER POLLUTANTS
Acrylonitril - - 0.1*
Butanol - - 30*
Butylacetaat - - 100*
Cyclohexanon 0.1 22.5 45
Diethyleenglycol - - 270*
Ethyleenglycol - - 100*
Phtalates (total)9 0.1 30 60
Formaldehyde - - 0.1*
Methanol - - 30*
Methyltertbutylether (MTBE) - - 100*
Methylethylketon - - 35*
Mineral oil10 50 2,525 5,000
Pyridine 0.1 0.3 0.5
Styrene 0.1 50 100
Tetrahydrofuran 0.1 1 2
Tetrahydrothiophene 0.1 45 90
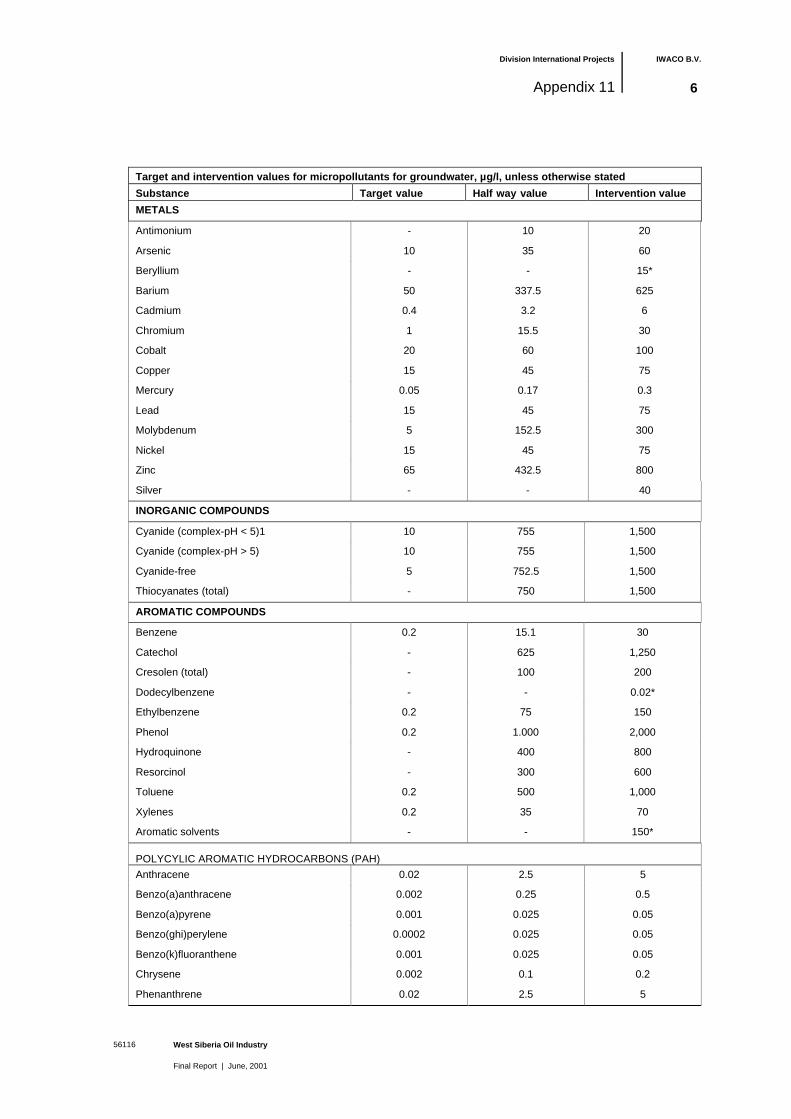
Division International Projects IWACO B.V.
West Siberia Oil Industry
Final Report | June, 2001
56116
Appendix 11 6
Target and intervention values for micropollutants for groundwater, µg/l, unless otherwise stated
Substance Target value Half way value Intervention value
METALS
Antimonium - 10 20
Arsenic 10 35 60
Beryllium - - 15*
Barium 50 337.5 625
Cadmium 0.4 3.2 6
Chromium 1 15.5 30
Cobalt 20 60 100
Copper 15 45 75
Mercury 0.05 0.17 0.3
Lead 15 45 75
Molybdenum 5 152.5 300
Nickel 15 45 75
Zinc 65 432.5 800
Silver - - 40
INORGANIC COMPOUNDS
Cyanide (complex-pH < 5)1 10 755 1,500
Cyanide (complex-pH > 5) 10 755 1,500
Cyanide-free 5 752.5 1,500
Thiocyanates (total) - 750 1,500
AROMATIC COMPOUNDS
Benzene 0.2 15.1 30
Catechol - 625 1,250
Cresolen (total) - 100 200
Dodecylbenzene - - 0.02*
Ethylbenzene 0.2 75 150
Phenol 0.2 1.000 2,000
Hydroquinone - 400 800
Resorcinol - 300 600
Toluene 0.2 500 1,000
Xylenes 0.2 35 70
Aromatic solvents - - 150*
POLYCYLIC AROMATIC HYDROCARBONS (PAH)
Anthracene 0.02 2.5 5
Benzo(a)anthracene 0.002 0.25 0.5
Benzo(a)pyrene 0.001 0.025 0.05
Benzo(ghi)perylene 0.0002 0.025 0.05
Benzo(k)fluoranthene 0.001 0.025 0.05
Chrysene 0.002 0.1 0.2
Phenanthrene 0.02 2.5 5
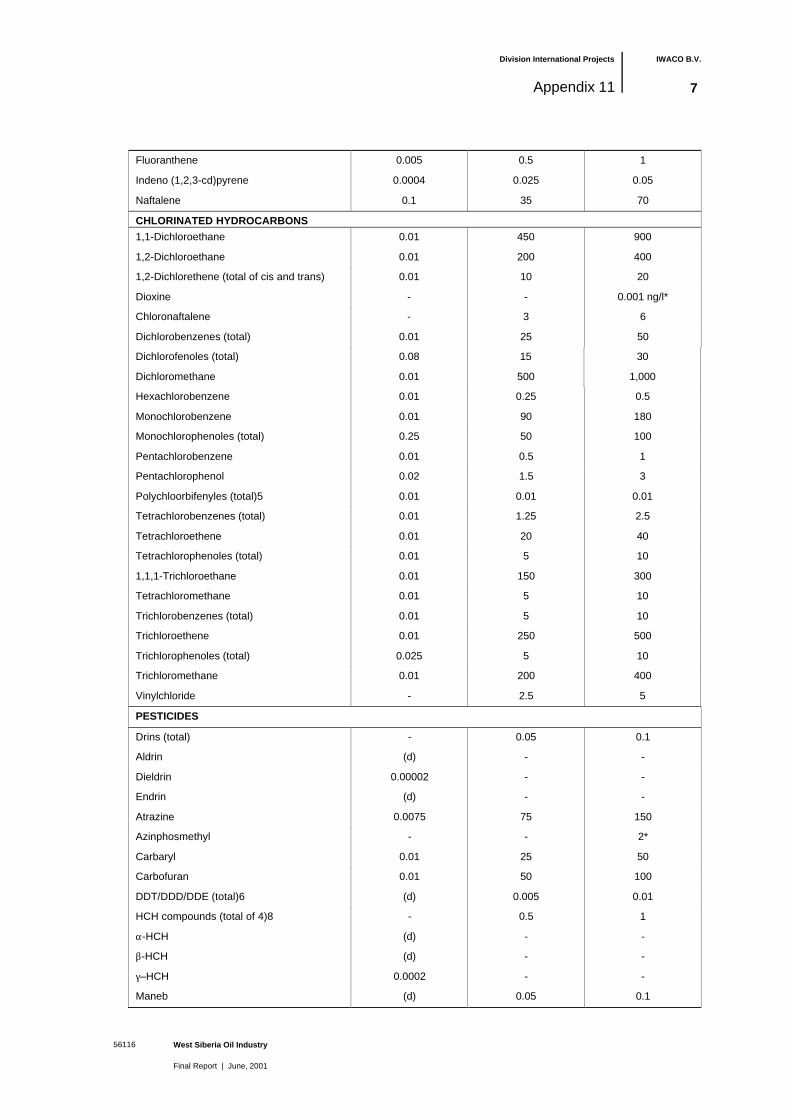
Division International Projects IWACO B.V.
West Siberia Oil Industry
Final Report | June, 2001
56116
Appendix 11 7
Fluoranthene 0.005 0.5 1
Indeno (1,2,3-cd)pyrene 0.0004 0.025 0.05
Naftalene 0.1 35 70
CHLORINATED HYDROCARBONS
1,1-Dichloroethane 0.01 450 900
1,2-Dichloroethane 0.01 200 400
1,2-Dichlorethene (total of cis and trans) 0.01 10 20
Dioxine - - 0.001 ng/l*
Chloronaftalene - 3 6
Dichlorobenzenes (total) 0.01 25 50
Dichlorofenoles (total) 0.08 15 30
Dichloromethane 0.01 500 1,000
Hexachlorobenzene 0.01 0.25 0.5
Monochlorobenzene 0.01 90 180
Monochlorophenoles (total) 0.25 50 100
Pentachlorobenzene 0.01 0.5 1
Pentachlorophenol 0.02 1.5 3
Polychloorbifenyles (total)5 0.01 0.01 0.01
Tetrachlorobenzenes (total) 0.01 1.25 2.5
Tetrachloroethene 0.01 20 40
Tetrachlorophenoles (total) 0.01 5 10
1,1,1-Trichloroethane 0.01 150 300
Tetrachloromethane 0.01 5 10
Trichlorobenzenes (total) 0.01 5 10
Trichloroethene 0.01 250 500
Trichlorophenoles (total) 0.025 5 10
Trichloromethane 0.01 200 400
Vinylchloride - 2.5 5
PESTICIDES
Drins (total) - 0.05 0.1
Aldrin (d) - -
Dieldrin 0.00002 - -
Endrin (d) - -
Atrazine 0.0075 75 150
Azinphosmethyl - - 2*
Carbaryl 0.01 25 50
Carbofuran 0.01 50 100
DDT/DDD/DDE (total)6 (d) 0.005 0.01
HCH compounds (total of 4)8 - 0.5 1
α-HCH (d) - -
β-HCH (d) - -
γ–HCH 0.0002 - -
Maneb (d) 0.05 0.1

Division International Projects IWACO B.V.
West Siberia Oil Industry
Final Report | June, 2001
56116
Appendix 11 8
Chlorodane - 0.1 0.2
Heptachlor - 0.15 0.3
Heptachloro-epoxid - 1.5 3
Endosulfan - 2.5 5
Organotin compounds - 0.35 0.7
OTHER POLLUTANTS
Acrylonitril - - 5*
Butanol - - 5,600*
Butylacetate - - 4,100*
Cyclohexanon 0.5 7,500 15,000
Diethyleenglycol - - 13,000*
Ethyleenglycol - - 5,500*
Phtalaten (total)9 0.5 2.75 5
Formaldehyde - - 50*
Methanol - - 24,000*
Methylethylketon - - 6,000*
Methyltertbutylether (MTBE) - - 9,200*
Mineral oil 50 325 600
Pyridine 0.5 15 30
Styrine 0.5 150 300
Tetrahydrofuran 0.5 150 300
Tetrahydrothiophene 0.5 2,500 5,000
Notes to table 1:1. Indicative level for serious contamination
Acidity: pH (0.01 M CaC12). In order to determine whether pH is greater than orequal to 5, or less than 5, the 90 percentile of the measured values is taken.
2. PAH (total of 10) here means the total of anthracene, benzo(a)anthracene,benzo(k)fluoroanthene, benzo(a)pyrene, chrysene, phenantrene, fluoroanthene,indeno(1,2,3-cd)pyrene, naphthalene and benzo(ghi)perylene.
3. Chlorobenzenes (total) here means the total of all chlorobenzenes (mono-, di-, tri-,tetra-, penta- and hexachlorobenzene).
4. Clorophenols (total) here means the total of all chlorophenols (mnono-, di-, tri-,tetra- and pentachlorophenol).
5. In the case of the intervention value, 'polychlorobiphenyls (total)' means the totalof PCBs 28, 52, 101, 118, 138, 153 and 180. For the target value it refers to thetotal exluding PCB 118.
6. DDT/DDD/DDE' above means the total of DDT, DDD and DDE.7. Drins' above means the total of aldrin, dieldrin and endrin.8. HCH compounds' above means the total of α-HCH, β-HCH, γ-HCH and δ-HCH.9. Phthalates (total)' above means the total of al phthalates.10. Mineral oil' above means the sum of all the alkanes, both straight-chain and
branched-chain. Where the contamination is due to mixtures (e.g. gasoline ordomestic heating oil), then not only the alkane content but also the content ofaromatic and/or polycyclic aromatic hydrocarbons must be determined. Thisaggregate parameter has been adopted for practical reasons. Further toxicologicaland chemical disaggregation is under study.

Division International Projects IWACO B.V.
West Siberia Oil Industry
Final Report | June, 2001
56116
Appendix 11 9
11. The values for total polycyclic aromatic hydrocarbons, total chlorophenols andtotal chlorobenzenes in soil/sediments apply to the total concentration of thecompounds belonging to the relevant category. If the contamination is due to onlyone compound of a category, the value used is the intervention value for thatcompound, where there are two or more compounds the value for the total of thesecompounds applies, etc.
For soil/sediment, effects are directly additive (i.e. 1 mg of substance A has the sameeffect as 1 mg of substance B) and can be checked/compared against an aggregatestandard by summing the concentrations of the substances involved. For furtherinformation about the this additivity see, for example, the Technical Committee forSoil Protection (1989)4. In the case of groundwater, effects are indirect, and areexpressed as a fraction of the individual intervention values before being summed (i.e.0.5 of the intervention value of substance A has the same effect as 0.5 of theintervention value of substance B). This means that an addition formula must be usedto determine whether an intervention value is exceeded. The intervention value for acategory of substances is exceeded if:
Σ conc.i > 1, Iiwhere: Conci = measured concentration of substance i in the
category concernedIi = intervention value for substance i.
'Trigger function' of EOXNo intervention value has been set for EOC1 or EOX. This is because the use of such aparameter has no value in toxicological terms. Estimation of the EOX content thereforeserves no purpose in deciding whether a case of serious soil contamination hasoccurred. An EQX test can, on the other hand, provide a so-called trigger function. Itcan be used to indicate whether intervention values for individual halogen compoundsmay be being exceeded.
Correction for soil typeInorganic compoundsThe intervention values for heavy metals (including arsenic) in soil/sediment depend,like the target values, on the clay content and or the organic material content. Inassessing the quality of the soil at a given location the values for a standard soil areconverted to values applying to the actual soil concerned on the basis of the measuredorganic material (measured by percentage weight 1ost by volatilisation, on the total dryweight of the soil) and clay content (the percentage by weight of the total dry materialcomprising mineral particle matter with a diameter less than 2 µm in diameter). On thisbasis, relevant mean values are determined for the clay and organic material content.The converted values can then be compared with the measured concentrations ofmetals in the soil.
4 Technical Committee for Doil Protection (1989). ‘Advies beoordeling an bodemverontreiniging met polycyclische
aromaten’ (Advice regarding the assessment of soil contaminated with polysyclic aromatics). TCB A89/03

Division International Projects IWACO B.V.
West Siberia Oil Industry
Final Report | June, 2001
56116
Appendix 11 10
The following soil type correction formula can be used for this calculation:
10*25*
.%*%**
CBA
stoforgClutumBAIstIb
++++
=
where:
Ib = intervention valueIst = intervention value%lutum = measured percentage clay in the soil being evaluated%org. mat. = measured percentage organic matter in the soil being evaluatedA, B and C = constants which depend on the substance (see table 2)
In order to apply the soil type correction to target values, the intervention values in theformula (Ib and Ist) are replaced by target values.
Table 2. Substance-dependent constants for metals
Substance A B C
Antimonium 1 0 0
Arsenic 15 0.4 0.4
Barium1 30 5 0
Beryllium 8 0.9 0
Cadmium 0,4 0.007 0.021
Chromium 50 2 0
Cobalt1 2 0.28 0
Copper 15 0.6 0.6
Mercury 0,2 0.0034 0.0017
Lead 50 1 1
Molybdenum2 1 0 0
Nickel 10 1 0
Silver 1 0 0
Zinc 50 3 1.5
Notes to tabel 2:
1. The constants for barium and cobalt are taken from the report'Achtergrondgehalten van negen sporen-metalen in oppervlaktewater, grondwateren grond van Nederland’ (Background concentrations of nine trace metals insurface waters, groundwater and soil in the Netherlands); J.H.M. de Bruijn andC.A.J. Denneman (1992). Soil protection publication series l992/1.
2. No soil type correction is applied for molybdenum.
If measuring problems are caused by low organic matter or clay content, values of 2%can be assumed for both organic matter and clay. As measuring methods improve thiswill no longer be necessary.

Division International Projects IWACO B.V.
West Siberia Oil Industry
Final Report | June, 2001
56116
Appendix 11 11
In the case of the other inorganic compounds, the intervention values are not related tosoil characteristics. This means that the same intervention values and target values willapply for al soils.
Organic compoundsThe intervention and target values for organic compounds are related to the content oforganic matter in the soil. In evaluating the quality of a given soil, the values for astandard soil are divided by 10 and multiplied by the measured content of organicmaterial. The values converted in this manner can be compared with the measuredcontent of organic compounds.
As a formula:
10
.%*
matorgIstIb =
where:
Ib = intervention value applying for the soil being evaluated (mg/kg)Ist = intervention value for the standard soil (mg/kg)%org.mat. = measured percentage organic matter in the soil. Where the organicmatter measured is more than 30% or less than 2%, values of 30%and 2% respectively are used.
In order to apply the soil type correction to target values, the intervention values informula (2) (Ib and Ist) are replaced by target values.
GroundwaterThe intervention and target values for both organic and inorganic compounds ingroundwater are independent of soil type.
Use of soil type correctionIntervention and target values are corrected for type of soil by taking account of thecontent of organic material and clay in the soil being investigated. Using the soil typecorrection formulae given, the appropriate intervention and target values can becalculated for any soil type.
In the everyday world it is often the case that many soil samples containing manydifferent contaminants require evaluation. It may be simpler to adjust the measuredconcentrations to values appropriate for a standard soil (rather than adjusting theintervention and target values to allow for the properties of the soil being evaluated).The correction formulae can readily be modified in this way. The result of theassessment remains the same.

Division International Projects IWACO B.V.
West Siberia Oil Industry
Final Report | June, 2001
56116
Figures

Division International Projects IWACO B.V.
West Siberia Oil Industry
Final Report | June, 2001
56116
Appendix 12Project sheets
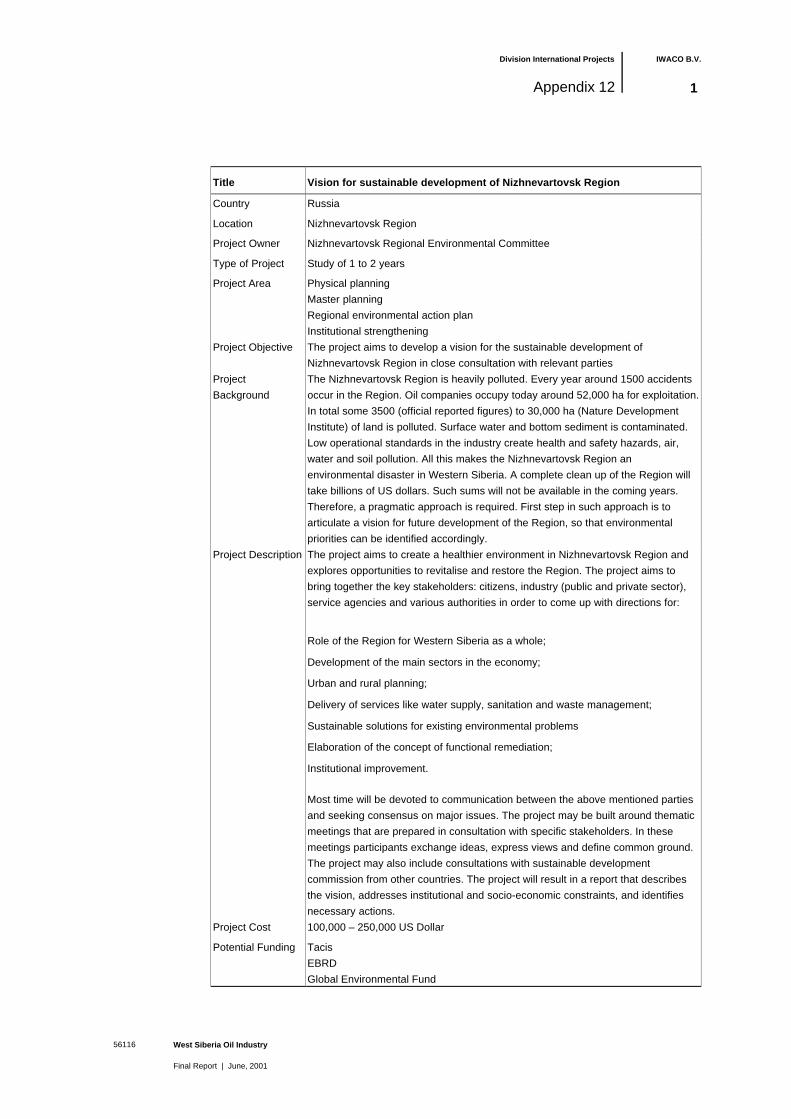
Division International Projects IWACO B.V.
West Siberia Oil Industry
Final Report | June, 2001
56116
Appendix 12 1
Title Vision for sustainable development of Nizhnevartovsk Region
Country Russia
Location Nizhnevartovsk Region
Project Owner Nizhnevartovsk Regional Environmental Committee
Type of Project Study of 1 to 2 years
Project Area Physical planning
Master planning
Regional environmental action plan
Institutional strengthening
Project Objective The project aims to develop a vision for the sustainable development of
Nizhnevartovsk Region in close consultation with relevant parties
Project
Background
The Nizhnevartovsk Region is heavily polluted. Every year around 1500 accidents
occur in the Region. Oil companies occupy today around 52,000 ha for exploitation.
In total some 3500 (official reported figures) to 30,000 ha (Nature Development
Institute) of land is polluted. Surface water and bottom sediment is contaminated.
Low operational standards in the industry create health and safety hazards, air,
water and soil pollution. All this makes the Nizhnevartovsk Region an
environmental disaster in Western Siberia. A complete clean up of the Region will
take billions of US dollars. Such sums will not be available in the coming years.
Therefore, a pragmatic approach is required. First step in such approach is to
articulate a vision for future development of the Region, so that environmental
priorities can be identified accordingly.
Project Description The project aims to create a healthier environment in Nizhnevartovsk Region and
explores opportunities to revitalise and restore the Region. The project aims to
bring together the key stakeholders: citizens, industry (public and private sector),
service agencies and various authorities in order to come up with directions for:
Role of the Region for Western Siberia as a whole;
Development of the main sectors in the economy;
Urban and rural planning;
Delivery of services like water supply, sanitation and waste management;
Sustainable solutions for existing environmental problems
Elaboration of the concept of functional remediation;
Institutional improvement.
Most time will be devoted to communication between the above mentioned parties
and seeking consensus on major issues. The project may be built around thematic
meetings that are prepared in consultation with specific stakeholders. In these
meetings participants exchange ideas, express views and define common ground.
The project may also include consultations with sustainable development
commission from other countries. The project will result in a report that describes
the vision, addresses institutional and socio-economic constraints, and identifies
necessary actions.
Project Cost 100,000 – 250,000 US Dollar
Potential Funding Tacis
EBRD
Global Environmental Fund

Division International Projects IWACO B.V.
West Siberia Oil Industry
Final Report | June, 2001
56116
Appendix 12 2
Title Recovery of oil products from oil storages in Nizhnevartovsk Region
Country Russia
Location Nizhnevartovsk Region
Project Owner Oil Companies, Nizhnevartovsk Regional Environmental Committee
Type of Project Investment with research survey component
Project Area Oil spill/pollution prevention
Solid and hazardous waste management
Project Objective Reduced loss of oil products and chemicals from storages into the environment of
Nizhnevartovsk Region
Project
Background
Since the beginning of oil production activities in Nizhnevartovsk Region some 7000
storages have been built. For more than 5000 of them, the only protective measure is
that they are covered with sand. They do not have protection layers to prevent
polluting substances from flowing into the soil and ground water. Containing oil,
chemicals and drilling by-products, these storage places are a permanent source of
pollution. Wastes have accumulated during many decades and continue to be
generated at present. It contains substantial amounts of oil products, which means
that valuable product is lost.
Project
Description
The proposed activity is a feasibility study on the issue including an inventory of the
various types and quantities of oil waste and an evaluation of (alternative) treatment
techniques. Preferred technologies will be identified, conceptual designs for facilities
and (alternative) institutional arrangements for operation will be evaluated. The study
will conclude on the financially feasible of the different alternatives. However the
conclusion heavily depends on the market price for the recovered oil products.
The investment part could include:
Detailed design of a treatment facility
Procurement of equipment and installation
Training of operators
operation and maintenance
environmentally sound disposal of residuesProject Cost Project cost may range between 1.5 and 3 million USD, depending on design
decisions.
Potential
Funding
Tacis
Oil companies
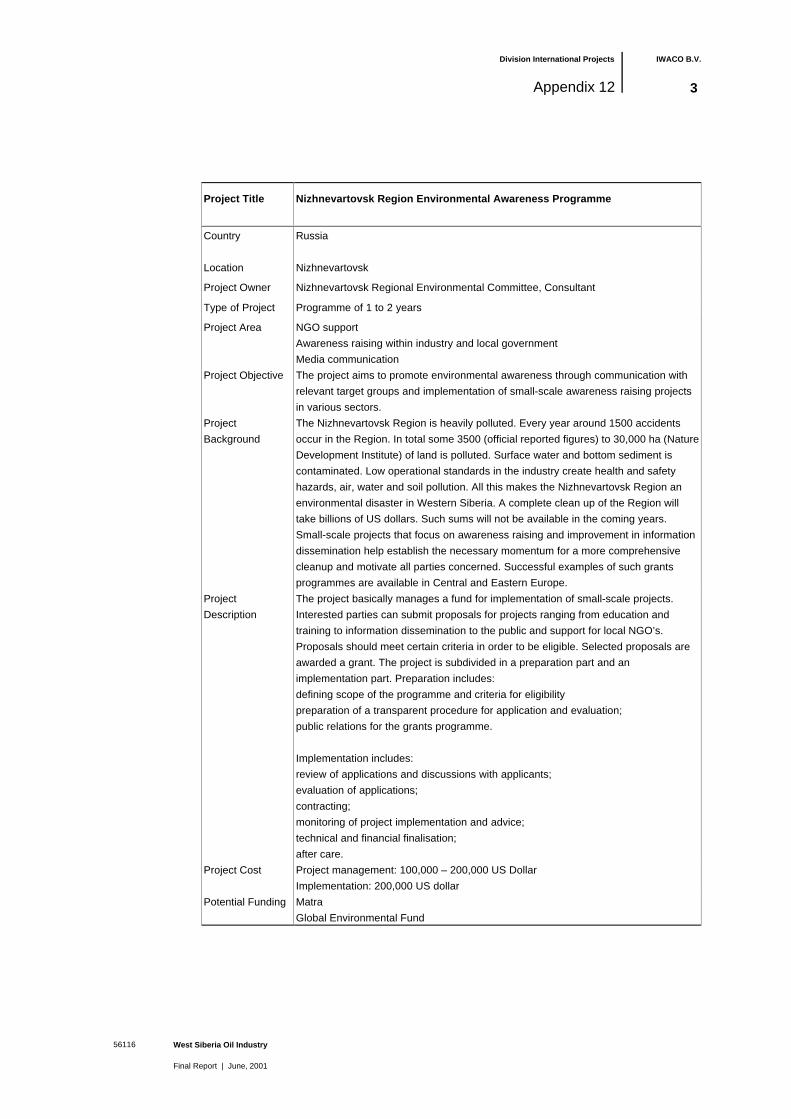
Division International Projects IWACO B.V.
West Siberia Oil Industry
Final Report | June, 2001
56116
Appendix 12 3
Project Title Nizhnevartovsk Region Environmental Awareness Programme
Country Russia
Location Nizhnevartovsk
Project Owner Nizhnevartovsk Regional Environmental Committee, Consultant
Type of Project Programme of 1 to 2 years
Project Area NGO support
Awareness raising within industry and local government
Media communication
Project Objective The project aims to promote environmental awareness through communication with
relevant target groups and implementation of small-scale awareness raising projects
in various sectors.
Project
Background
The Nizhnevartovsk Region is heavily polluted. Every year around 1500 accidents
occur in the Region. In total some 3500 (official reported figures) to 30,000 ha (Nature
Development Institute) of land is polluted. Surface water and bottom sediment is
contaminated. Low operational standards in the industry create health and safety
hazards, air, water and soil pollution. All this makes the Nizhnevartovsk Region an
environmental disaster in Western Siberia. A complete clean up of the Region will
take billions of US dollars. Such sums will not be available in the coming years.
Small-scale projects that focus on awareness raising and improvement in information
dissemination help establish the necessary momentum for a more comprehensive
cleanup and motivate all parties concerned. Successful examples of such grants
programmes are available in Central and Eastern Europe.
Project
Description
The project basically manages a fund for implementation of small-scale projects.
Interested parties can submit proposals for projects ranging from education and
training to information dissemination to the public and support for local NGO’s.
Proposals should meet certain criteria in order to be eligible. Selected proposals are
awarded a grant. The project is subdivided in a preparation part and an
implementation part. Preparation includes:
defining scope of the programme and criteria for eligibility
preparation of a transparent procedure for application and evaluation;
public relations for the grants programme.
Implementation includes:
review of applications and discussions with applicants;
evaluation of applications;
contracting;
monitoring of project implementation and advice;
technical and financial finalisation;
after care.
Project Cost Project management: 100,000 – 200,000 US Dollar
Implementation: 200,000 US dollar
Potential Funding Matra
Global Environmental Fund

Division International Projects IWACO B.V.
West Siberia Oil Industry
Final Report | June, 2001
56116
Appendix 12 4
Title Nizhnevartovsk Region Environmental Medical Research Programme
Country Russia
Location Nizhnevartovsk Region
Project Owner Nizhnevartovsk Regional Environmental Committee, Health Authorities (State Service
Sreda-Zdorovie) & Clinics in Tyumen & Khanty Manski Oblast
Type of Project Research
Project Area Environmental oil pollution and health
Project Objective Scientific analysis to identify links between oil pollution and health in Nizhnevartovsk
Region. The overall aim is to identify the major health hazards from oil pollution to
enable future health planning and prevention.
Project
Background
Nizhnevartovsk has one of the highest rates among Russian cities of diseases caused
by a poor environment. Oncological diseases are 2 to 3 times higher than anywhere
else in Russia, within the 15 to 49 age group and cardiological diseases exceed the
Russian average by 9 times, while endocrinological diseases exceed the average
indicator 2 to 5 times. The indirect impacts of oil pollution are suspected by medical
professionals in the region to also contribute to higher rates of child mortality, shorter
life expectancies and child abnormalities and deaths. However the extent to which oil
pollution has resulted in these higher than average poor health statistics has not been
quantified.
Project
Description
The proposed project is a research project which aims to investigate suspected
correlation’s between oil pollution as a contributing causal factor to the above average
incidence of major diseases linked to a poor environmental situation in the Region.
The research will build on the current work of the State Service and Oncological
Clinics in the region. Its results will assist health officials in healthcare planning. The
project will publicise and disseminate its results with the aim of alerting environmental
authorities and the public as to the highest risks to human health from oil pollution and
the oil sector. Its dissemination will also be directed at assisting decision-making
regarding where remediation and mitigation efforts should be directed in order to
decrease these statistics to more acceptable levels. Two kind of projects could be
distinguished: with a local orientation; investigating health hazards and health effects
from the oil industry (including occupational health) and more regional orientated
investigations; taking into account the overall conditions of life in remote area’s.
Project Cost Project cost may range between 100,000 and 500,000 USD
Potential Funding State Health Service
Global Environment Fund
Oil companies
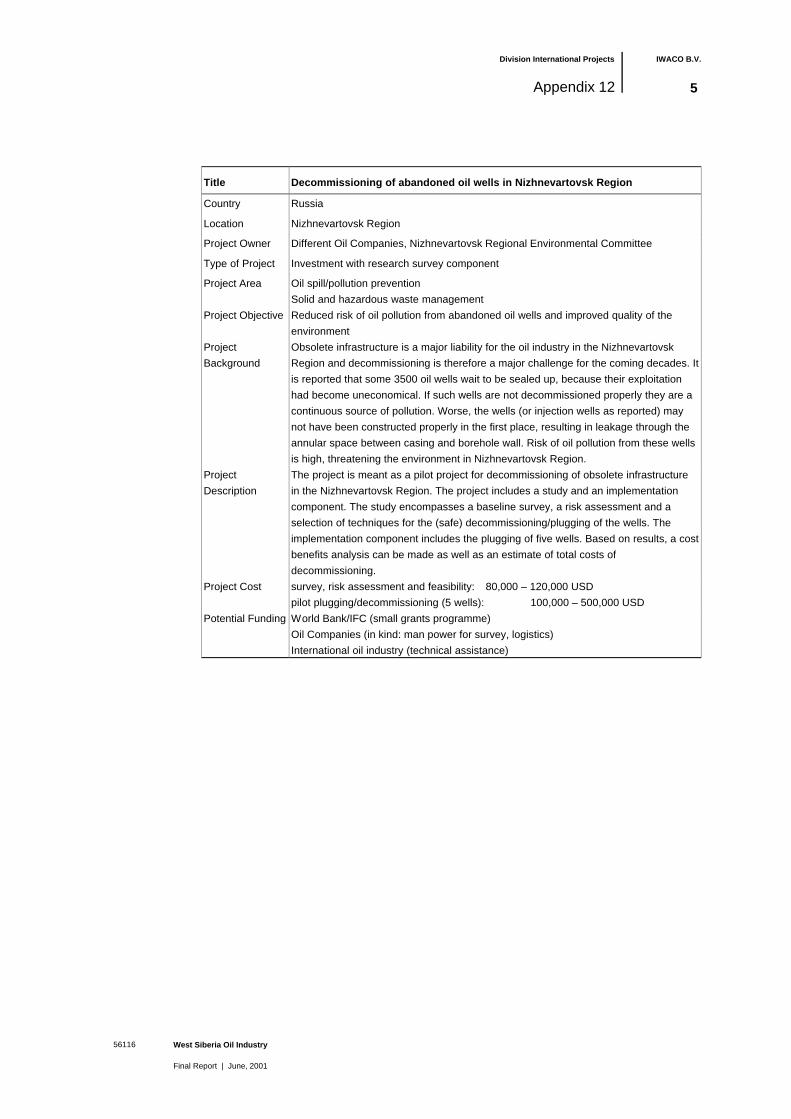
Division International Projects IWACO B.V.
West Siberia Oil Industry
Final Report | June, 2001
56116
Appendix 12 5
Title Decommissioning of abandoned oil wells in Nizhnevartovsk Region
Country Russia
Location Nizhnevartovsk Region
Project Owner Different Oil Companies, Nizhnevartovsk Regional Environmental Committee
Type of Project Investment with research survey component
Project Area Oil spill/pollution prevention
Solid and hazardous waste management
Project Objective Reduced risk of oil pollution from abandoned oil wells and improved quality of the
environment
Project
Background
Obsolete infrastructure is a major liability for the oil industry in the Nizhnevartovsk
Region and decommissioning is therefore a major challenge for the coming decades. It
is reported that some 3500 oil wells wait to be sealed up, because their exploitation
had become uneconomical. If such wells are not decommissioned properly they are a
continuous source of pollution. Worse, the wells (or injection wells as reported) may
not have been constructed properly in the first place, resulting in leakage through the
annular space between casing and borehole wall. Risk of oil pollution from these wells
is high, threatening the environment in Nizhnevartovsk Region.
Project
Description
The project is meant as a pilot project for decommissioning of obsolete infrastructure
in the Nizhnevartovsk Region. The project includes a study and an implementation
component. The study encompasses a baseline survey, a risk assessment and a
selection of techniques for the (safe) decommissioning/plugging of the wells. The
implementation component includes the plugging of five wells. Based on results, a cost
benefits analysis can be made as well as an estimate of total costs of
decommissioning.
Project Cost survey, risk assessment and feasibility: 80,000 – 120,000 USD
pilot plugging/decommissioning (5 wells): 100,000 – 500,000 USD
Potential Funding World Bank/IFC (small grants programme)
Oil Companies (in kind: man power for survey, logistics)
International oil industry (technical assistance)