Embed Size (px)
Citation preview
Welfare Effects of Market Friendly Land Reforms in Uganda
Alex Tatwangire and Stein T. Holden
Department of Economics and Resource Management, Norwegian University of Life Sciences
ABSTRACT. This article estimates the poverty reducing impact of the recent land reforms and
land transfers in the different land tenure systems of Uganda. Using balanced panel data for
309 households in 2001, 2003, and 2005, models that control for unobserved household
heterogeneity and endogeneity of land acquisition and disposition are employed to measure
the poverty-reduction effect of land on household expenditure per adult equivalent.
Significant poverty reduction effects of increased land access in form of owned, operated and
market-accessed land were found. The poverty reduction effect for land accessed through the
market was significantly larger than the poverty reduction effect of land accessed through
inheritance. (JEL Q24, Q15, and O12)
Key words: Land transfers, land policy reforms, unobserved heterogeneity, poverty impacts.
The authors are, respectively PhD student and professor, Department of Economics and Resource Management at the Norwegian University of Life Sciences (UMB). The authors thank International Food Policy Research Institute (IFPRI Kampala office), the Foundation for Advanced Studies on International Development (FASID), and Makerere University, Faculty of Agriculture, for allowing us to use their rich datasets on: “Project on Policies for Improved Land Management” and “Poverty, Environment, and Agricultural Technologies (REPEAT)”.
*Corresponding author. Tel.: +4764965065; Fax: +476496 5701; P.O. Box 5003, 1432 Ås, Norway, E-mail address: [email protected] 1Tel. +4764965699; Fax: +476496 5701; P.O.Box 5033, 1432 Ås, Norway E-mail address: [email protected]
2
Welfare Effects of Market Friendly Land Reforms in Uganda
I. INTRODUCTION
Historical circumstances and colonial policies in Uganda are well known to have created land
tenure insecurity and other unintended consequences, including establishment of the
overlapping land ownership rights, conflicts on land, poor land management, and skewed land
distribution (Rugadya 1999; Coldham 2000; Deininger 2003; Deininger 2005; Green 2006;
Deininger & Ayalew 2007; Ahene 2009). Customary land is estimated to comprise at least 75
percent of land in Uganda (Busingye 2002) and was for a long time not legally recognized
(Bosworth 2003; Hunt 2004). It was administered based on traditional institutional
arrangements that discouraged the functioning of land rental and sales markets, while
focusing on preserving the cultural identity of different lineage groups.
The search for a solution to challenges in the land sector has lead to several land law reforms
in the history of Uganda. For example, the 1995 Uganda constitution emphasizes protection
of the land rights of the poor, and the 1998 Land Act redefines and provides full protection of
private land rights, including those of the underprivileged groups, women and children, and
aims at transforming the traditional land rights into a modern land tenure system that can cope
with increasing population pressure and the need to ensure land tenure security, broad based
land access through better functioning land markets, more sustainable land management, land
use efficiency, and economic growth (Bosworth 2003). While stronger land tenure security
can enhance land access, investment on land, and land use productivity (Deininger & Ayalew
2007), it can also reduce poverty among others, by securing land access for the poor who have
limited access to other sources of livelihood (Deininger 2003; Deininger 2005; Finan et al.
2005). This paper uses household panel data from 2001, 2003 and 2005 to assess the poverty
3
impact of the recent Ugandan land reforms that aimed to strengthen land access through
markets and to enhance tenure security.
Land reforms play an important role in stimulating labour supply in farm and off-farm
activities and land transfers across users at a low cost (Deininger 2005). They can also reduce
the power traps created by the minority powerful land-rich elites at the expense of the
majority land-poor households, who also tend to be vulnerable to shocks and more likely to
lose their land through distress sales (Deininger 2005; Holden 2009). Conversely, better
functioning land markets encourage land transfers from less able to more skilled households,
and particularly land rental markets provide affordable means through which the land-poor
can gain access to more land to promote productivity and welfare (Binswanger & Rosenzweig
1986; Deininger & Feder 1998; de Janvry et al. 2001; Nkonya et al. 2005; Deininger &
Mpuga 2008; Holden et al. 2008b). However, this is balanced against the likely negative
effects of land sales markets that are often associated with high land prices, which may foster
land concentration in the hands of the few rich and inefficient owners (Otsuka 2007; Holden
et al. 2008a).
And while land rental and sales markets are reported to be increasing and widespread in all
regions of Uganda, evidence showed that the land sales market did not lead to a more unequal
land distribution during the 1990s (Deininger & Mpuga 2008), and provided the poor with
opportunities to generate starting capital for other investments. Specifically, the paper aims at
(i) identifying differences in the distribution of land transfers and ownership across
households in different income levels and tenure systems (regions) in Uganda, and (ii) to
provide empirical evidence on poverty impacts of land access through the market and non-
market avenues in rural Uganda, and (iii) discuss the need for new policy interventions given
4
the new demand for land by international investors (see Deininger et al. 2011) that can
potentially threaten the land rights of the poor and therefore long term poverty reduction.
2. A HISTORICAL PERSPECTIVE OF LAND POLICY REFORMS IN UGANDA
This section presents the evolution of land tenure systems and land policy reforms that have
been adopted in Uganda since 1900 to resolve historical land tenure problems. In the pre-
colonial Uganda, communities and individual households in various kingdoms and tribes
possessed larger chunks of land. Kings, local chiefs, and clan heads were the custodians of
land on behalf of their subjects and members of the lineage groups.
The Colonial Period (1900-1962)
Land legislation in Uganda started in 1900 with the signing of the “1900 Buganda
Agreement” between the British Government and the Kingdom of Buganda, under which
mailo land tenure was created in Buganda region and parts of Bunyoro. Out of the estimated
19,600 square miles of total land in Buganda, 8,958 square miles of “mailo” land were given
to the Kabaka (king) of Buganda Kingdom, his top chiefs and notables to own it in perpetuity.
The royal family of Buganda was granted 958 square miles of land as private mailo1, while
his 1000 top chiefs and notables shared a total of 8000 square miles, with each getting 8
square miles of land on average (West 1972 ; Brett 1973). The rest2 (9000 square miles) of
uncultivated land was allocated to the protectorate as Crown land, to be administered by the
colonial government. All the small land occupants that had traditionally occupied these lands
were declared tenants, were consequently unable to secure independent land rights, and were
required to pay rent “Busulu” to their landlords who possessed the certificate of land title.
1 The Kabaka (King) of Buganda kingdom was given 350 square miles of private mailo land. 2 This land was later surveyed and found to be less than previously estimated, and the size of Crown land reduced to 8,307 square miles (West 1972; Green 2006).
5
Although, this helped to stimulate surplus production from small farms and wage labor
supply, the position of tenants was vulnerable and land tenure insecurity remained a serious
concern of policy makers.
Under the 1900 Buganda Agreement, the colonial government created Freehold Land Tenure
in the Western part (Ankole, Toro, and Kigezi), parts of Buganda in the Central region, and
Bugisu in the Eastern part of Uganda, following agreements between numerous kingdoms and
the British Government. Holders of freehold land included church missionaries and academic
institutions, owned this type of land for unlimited time, and would seek land titles from the
Crown or the Uganda Land Commission.
Leasehold Land Tenure was established in 1900 to allow holders of mailo and freehold land,
including the Crown (ULC) to grant land ownership under a contract to another person for a
specified period of time and on certain conditions such as the payment of rent. The holders of
land under lease were also entitled to a certificate of lease Title.
In 1900, Customary Land Tenure included land that was held and regulated under the
traditional systems as defined by customs, the geopolitical location and lineage groups. It still
includes: (i) communal customary tenure that is predominant in Northern and Eastern parts of
Uganda and (ii) individual/family /clan customary tenure that exist in Central, Western, parts
of the North and South Western Uganda (Busingye 2002). Occupants of customary land3
3 The term “Kibanja” represents occupants (Bibanja holders) on land under customary tenure. Under the 1998 Land Act, the statutory Bibanja holders are guaranteed protection against any eviction without compensation, and can also purchase the stake of the registered land owner to become a mailo or freehold land title holder. .
6
could be on freehold, mailo, leasehold or public4 land. Customary rules imposed different
restrictions on the right to sell or mortgage this type of land. Approval of clan chiefs, elders,
community, lineage and family membership is mandatory regarding any land transaction, and
this keeps land resources within communities.
The Crown Land Ordinance of 1903 declared holders of all the land held under customary
system, but outside the mailo area, to be tenants at the will of the Crown. The continued land
ownership of customary land was regarded as unlawful and at the request of the state, holders
of this type of land would easily be evicted. The Busulu (annual dues) and Envujo (levy per
acre) Law of 1928 defined the rights of original occupants of customary land, who were being
exploited by their land owners as a result of high economic gains from cotton production. The
law put a limit on the rent tenants were to pay their land owners, and provided some
protection against evictions without compensation for the land and improvements made on it.
This however failed to resolve the challenges of the overlapping land rights. Tenure insecurity
on land continued to hamper investments and land market activity on tenanted land
(Deininger & Ayalew 2007).
From Independence (1962) to 1986
The 1969 Public Land Act provided the customary tenants with more protection against
evictions. Later, the 1975 Land Reform Decree declared all land in Uganda to be public land
and to be administered by the Uganda Land Commission. The decree abolished mailo and
freehold land tenure and converted land held under these two systems into government leases
for a period of 99 years. Customary tenancy on mailo land was also converted into customary
tenure on public land with a limited tenure security. Restrictions were imposed on acquisition
4 Public land included land that was not owned both in freehold or mailo tenure and out of which, public leasehold and freeholds would be granted by the ULC.
7
and disposition of customary land. Holders of customary land were prohibited from engaging
in any land transfer, including land transfers into leasehold, without the consent of ULC. They
would be compensated, in case their occupation was to be terminated. According to Deininger
(2003), the attempt to nationalize land created unintended consequences such as land
grabbing, unlawful evictions, and resource dissipation, which reduced the level of investments
on land, land transactions, access to credit, and incidence of conflicts on land
Under the Museveni’s Government (1986 to Present)
The recent land reforms started with the promulgation of the 1995 Uganda constitution, which
repealed the 1975 land reform decree that was seen to be controversial and declared all land in
Uganda to belong to the citizens. The constitution reinstated customary, mailo, freehold, and
leasehold land tenure systems that were in place during the colonial government, and has
provisions that aim at strengthening land rights on customary land, especially rights of the
underprivileged groups of women and children. The parliament enacted the 1998 Land Act
that seeks to define and entrench full land ownership, rights, and tenure security to all
Ugandans, including those on customary land, to increase land use efficiency and economic
growth (Bosworth 2003). The Land Act sets out procedures under which holders of customary
land can apply and acquire certificates of customary land ownership, using the decentralized
institutions of land administration that include: Parish Land Committees, office of the Land
Recorder at the Sub-county level, District Land Boards, and Land Courts (Tribunals) that also
work with the High Court to resolve land disputes.
8
The 1998 Land Act also enables lawful and bona fide occupants5 of mailo, freehold, and
public land (land that is mainly in urban areas and owned by the government) to apply and
acquire certificates of occupancy on condition that they continue paying the land owner the
annual nominal ground rent, but there was limited consensus on this provision, due to the
resistance from landholders (Coldham 2000). The Land Act also makes provision on how the
holders of customary land certificates, together with land lease-holders can apply and convert
their certificates to freehold tenure using the office of Registrar of Titles. Individual freehold
land tenure was adopted as a long term system of land ownership, given its aptness in
providing land holders with the most complete rights and minimal restrictions on all modes of
land transfers and access.
Under the 1998 Land Act, holders of freehold land have the freedom to use their land for any
lawful purposes, including lease, sale, mortgage, and bequeath. Holders of leasehold are free
to use the land in any lawful way such as sub-leasing, during the lease period of 49 or 99
years. In the customary land system, the rights of land ownership, usufruct, and bequest are
considered to be secure, while the transfer of rights is primarily through inheritance. The
holders of mailo land on the other hand, still face the challenge of utilizing their land resource
effectively without evicting and compensating the lawful and bona fide occupants that have
statutory protection against such evictions, as long as they continue paying rent of Ug.sh1,000
(US$ 0.6) per year. The Act further provides for the establishment of a land fund, to be used
in resettling people that become landless as a result of government actions and natural
disasters, but its implementation has been slow (Rugadya et al. 2008), probably due to due to
5 A lawful occupant refers to customary tenants and any other person that had peacefully entered the land (mail, freehold or public land) with the consent of the owner, while the bona
fide occupant includes households that had been in unfavorable possession of the land, including those that were resettled on government land, at least, 12 years before the 1995 Uganda Constitution came into force (Coldham 2000).
9
the lack of resources and other administrative challenges. A comprehensive Land Sector
Strategic Plan (LSSP) and new National Land policy were put in place between 2004 and
2010 to further improve land access through the market and the efficiency of the land
administration, by modernizing the infrastructure, the processing of land information6 and
permitting system.
These recent land law reforms were expected to increase tenure security, reduce inequality in
land holding, increase land access through better functioning land rental and sales markets,
and to enhance agricultural productivity and welfare. The implementation of the new law still
faces the challenges of limited social legitimacy, opposing cultural interests, and institutional
design limitations (Hunt 2004; Rugadya et al. 2004). The land amendment law was passed in
2009 to resolve cultural dissent and ethnic demands, especially in Buganda region (Green
2006), to improve the implementation of the land law, and to stop the evictions of tenants
from the registered land, except upon the order of eviction from courts of law.
III. THEORETICAL FRAMEWORK
Land is one of the most important assets of rural households in Uganda and a primary basis
for their livelihoods. The high transaction costs of labor supervision tend to reduce
productivity on large farms, which rely more on hired labour than is the case on small and
owner operated farms that are very productive (Deininger 2003). On the other hand, small
farms face significant credit and rationing constraints than is the case on large farms and this
explains higher productivity on large farms in areas with developed credit markets. To the
6 Inadequate information about the land regulations and inefficient delivery of services provided by the land sector in Uganda may discourage land transactions, and make land transfers risky and prone to opportunistic tendencies that further increase the transaction costs of engaging in land market activity (Ahene 2009).
10
extent therefore that land reforms become effective in improving tenure security and access to
additional land through better functioning land markets, land-poor households can easily
move up the agricultural ladder to land ownership, access to credit, and higher productivity.
We assume that households maximize their utility subject to a set of constraints where access
to land from different sources is part of this constraint set. Households will attempt to get
access to additional land when the benefits of doing so are expected to be higher than the
costs. It is mainly through the market that households can adjust their farm size in the short
run, while access to land through inheritance can be influenced to a small extent. And while
the size of inherited land of individual households changes less frequently, household size and
composition changes over time such that the amount of inherited land per adult equivalent
also changes over time. Cash and liquidity constraints may prevent households from
accessing additional land through the market and their labor endowment limits their ability to
utilize the land.
We assume that households that are able to access land through the market have additional
non-land resources and are therefore more able to improve their welfare through such land
access. Based on this we test the following hypotheses: (i) There is a positive correlation
between household welfare and access to land through inheritance and through the market, (ii)
After controlling for observable and unobservable factors that may explain land access,
additional access to land enhances household welfare, (iii) Access to additional land through
the market enhances household welfare more than access to additional land through
inheritance.
11
III. DATA AND WELFARE INDICATORS
This study utilizes a three-period household panel data set collected in 2001, 2003, and 2005
by two research projects. The first survey was conducted in 2001 by the International Food
Policy Research Institute (IFPRI), and covered two thirds of Uganda including Southwest,
Central, and Eastern and some areas in Northern Uganda. A stratified sampling procedure was
employed based on a classification of Uganda’s territory according to the agricultural
potential, market access and population density. A total of 450 households in 107
communities were interviewed in 2001. The subsequent two surveys were conducted in 2003
and 2005 as part of the Research on Poverty, Environment, and Agricultural Technologies
(REPEAT) project, conducted by the Foundation for Advanced Studies on International
Development (FASID).
In these surveys, 3 districts that were part of the earlier IFPRI study areas were dropped due
to insecurity in the North and Northeastern parts of Uganda. Instead 94 out of 107
communities that were previously covered by the IFPRI survey in 2001 were selected. Only
333 households, out of the 450 households in the baseline survey of 2001 were included in the
2003 REPEAT survey due to the change in the sampling frame in 2003. In addition, out of the
333 sample of households, 20 households dropped out for various reasons in the 2005 survey,
while 4 more households with outliers and conflicting values of land access were also
dropped from data analysis. This study is therefore based on balanced panel data of 309
households. Data analysis was conducted on 927 observations from 26 districts that include;
Mubende, Luwero, Nakasongola, Masaka, Mukono, Kayunga, Rakai, and Mpigi in the central
region, Sironko, Tororo, Bugiri, Iganga, Mayuge, Jinja, Kamuli, Pallisa, Mbale, Busia, and
Kumi in the Eastern region and Mbarara, Kabale, Kisoro, Kabarole, Kasese, Bushenyi, and
12
Rukungiri in the western region of Uganda. We expect attrition bias to be too small to affect
our results.
We computed income per adult-equivalent and expenditure per adult-equivalent as measures
of household poverty levels. Household income in a year was computed from the summation
of value of home crop production net of the cost of inputs, value of home produced livestock
that were consumed, cash income from sale of livestock and livestock products net of
livestock production costs, and cash income from seasonal and monthly off-farm activities.
Distinctively, household total consumption expenditure was constructed from cash
expenditure for consumption and value of consumption of home produced goods. Both
measures of household poverty levels were adjusted to 2005 prices. Problems with the
household income data especially in the initial period of 2001 compelled us to use the more
reliable consumption expenditure data for the estimation of marginal returns to land access.
Land access includes land endowments in acres that farm households own or operate in their
production process. Land owned can be accessed mainly through the modes of inheritance (or
in form of gifts) and purchases. Land that farm households operate may include land that is
accessed through inheritance and market modes of land access including purchases, renting-in
and borrowing. Land acquired through the market is a limited dependent variable (LDV)
while land owned and lands operated are continuous variables.
IV. DESCRIPTIVE STATISTICS
Tables 1 and 2 provide descriptive statistics for key variables on land access and poverty
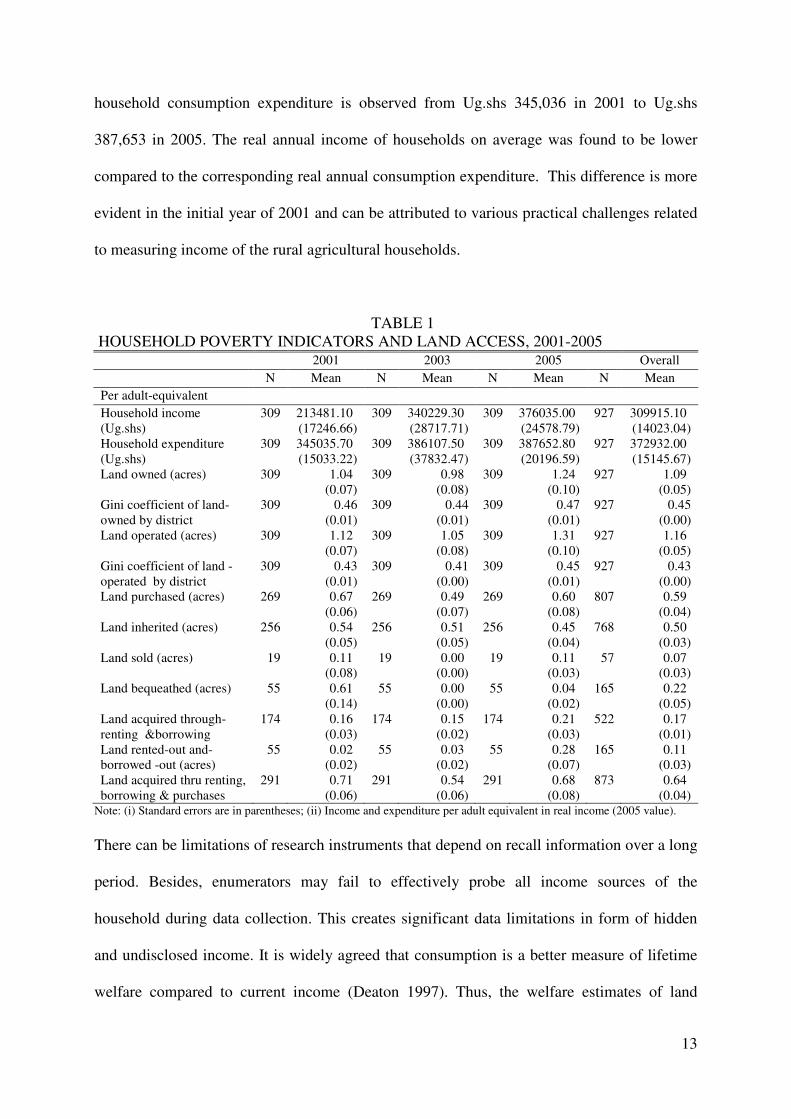
indicators across rural households. In particular, Table 1 shows a significant growth in
household income between 2001 and 2005. During the same period, a trivial growth in
13
household consumption expenditure is observed from Ug.shs 345,036 in 2001 to Ug.shs
387,653 in 2005. The real annual income of households on average was found to be lower
compared to the corresponding real annual consumption expenditure. This difference is more
evident in the initial year of 2001 and can be attributed to various practical challenges related
to measuring income of the rural agricultural households.
TABLE 1 HOUSEHOLD POVERTY INDICATORS AND LAND ACCESS, 2001-2005 2001 2003 2005 Overall N Mean N Mean N Mean N Mean Per adult-equivalent Household income (Ug.shs)
309 213481.10 (17246.66)
309 340229.30 (28717.71)
309 376035.00 (24578.79)
927 309915.10 (14023.04)
Household expenditure (Ug.shs)
309 345035.70 (15033.22)
309 386107.50 (37832.47)
309 387652.80 (20196.59)
927 372932.00 (15145.67)
Land owned (acres) 309 1.04 (0.07)
309 0.98 (0.08)
309 1.24 (0.10)
927 1.09 (0.05)
Gini coefficient of land- owned by district
309 0.46 (0.01)
309 0.44 (0.01)
309 0.47 (0.01)
927 0.45 (0.00)
Land operated (acres) 309 1.12 (0.07)
309 1.05 (0.08)
309 1.31 (0.10)
927 1.16 (0.05)
Gini coefficient of land - operated by district
309 0.43 (0.01)
309 0.41 (0.00)
309 0.45 (0.01)
927 0.43 (0.00)
Land purchased (acres) 269 0.67 (0.06)
269 0.49 (0.07)
269 0.60 (0.08)
807 0.59 (0.04)
Land inherited (acres) 256 0.54 (0.05)
256 0.51 (0.05)
256 0.45 (0.04)
768 0.50 (0.03)
Land sold (acres) 19 0.11 (0.08)
19 0.00 (0.00)
19 0.11 (0.03)
57 0.07 (0.03)
Land bequeathed (acres) 55 0.61 (0.14)
55 0.00 (0.00)
55 0.04 (0.02)
165 0.22 (0.05)
Land acquired through- renting &borrowing
174 0.16 (0.03)
174 0.15 (0.02)
174 0.21 (0.03)
522 0.17 (0.01)
Land rented-out and- borrowed -out (acres)
55 0.02 (0.02)
55 0.03 (0.02)
55 0.28 (0.07)
165 0.11 (0.03)
Land acquired thru renting, borrowing & purchases
291 0.71 (0.06)
291 0.54 (0.06)
291 0.68 (0.08)
873 0.64 (0.04)
Note: (i) Standard errors are in parentheses; (ii) Income and expenditure per adult equivalent in real income (2005 value).
There can be limitations of research instruments that depend on recall information over a long
period. Besides, enumerators may fail to effectively probe all income sources of the
household during data collection. This creates significant data limitations in form of hidden
and undisclosed income. It is widely agreed that consumption is a better measure of lifetime
welfare compared to current income (Deaton 1997). Thus, the welfare estimates of land
14
access in this study rely on the more plausible consumption expenditure per adult-equivalent
as the measure of household welfare.
In the case of land asset, households gained access to more land through the market, on
average 0.64 acres per adult-equivalent, compared to 0.50 acres of land per adult-equivalent
that was accessed through inheritance. Inequality in land distribution is illustrated by the gini
coefficients for land owned and land operated per adult-equivalent between 2001 and 2005.
There is a lower average gini coefficient of 0.43 on land operated per adult-equivalent
compared to a gini of 0.45 for land owned in the period 2001-2005. This suggests that land
access through the market might be helpful in promoting more equitable land access for
agricultural production in rural areas of Uganda. In addition, we see a large increase in land
rented-out and borrowed-out per adult-equivalent from 0.03 acres in 2003 to 0.28 acres in
2005. The increase in land rented-out and borrowed-out can be explained by the significant
rise in the number of households that participated in the supply side of the land market from 5
in 2001 to 48 in 2005. The average size of land per adult-equivalent acquired through renting
and borrowing (acres) is noted to have increased from 0.16 in 2001 to 0.21 in 2005.
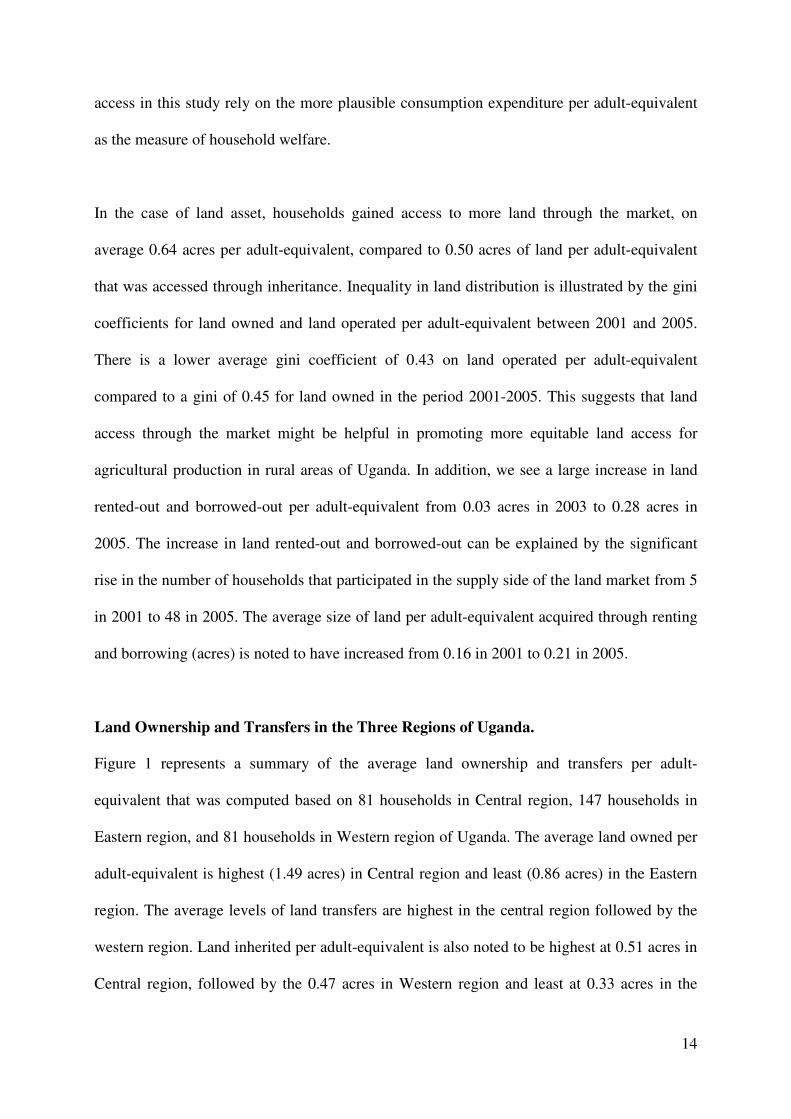
Land Ownership and Transfers in the Three Regions of Uganda.
Figure 1 represents a summary of the average land ownership and transfers per adult-
equivalent that was computed based on 81 households in Central region, 147 households in
Eastern region, and 81 households in Western region of Uganda. The average land owned per
adult-equivalent is highest (1.49 acres) in Central region and least (0.86 acres) in the Eastern
region. The average levels of land transfers are highest in the central region followed by the
western region. Land inherited per adult-equivalent is also noted to be highest at 0.51 acres in
Central region, followed by the 0.47 acres in Western region and least at 0.33 acres in the
15
Eastern region. Similarly, land per adult-equivalent that is accessed through the market
including borrowing is indicated to be 0.67 acres in the central region, 0.66 acres in Western
region, and 0.54 acres in the Eastern region. And while more land per adult-equivalent (1.56
acres) is indicated to be operated in the central region than is the case (1.17 and 0.94) in other
regions, the average land per adult-equivalent that is accessed through the market appears not
to be very much different across all the three regions of the country.
Figure 1. Per Adult-equivalent (AE) Land Ownership and Transfers (in acres) in the Three Regions of Uganda
1,49
0,51
1,56
0,67
0,86
0,33
0,94
0,54
1,09
0,47
1,17
0,66
0
0,2
0,4
0,6
0,8
1
1,2
1,4
1,6
1,8
La
nd
ow
ne
d p
er
AE
(a
cre
s)
Lan
d in
he
rite
d p
er
AE (
ac
res)
La
nd
op
era
ted
pe
r A
E (
acre
s)
La
nd
ac
qu
ire
d t
hro
ug
h t
he
ma
rke
t p
er
AE
(ac
res)
La
nd
ow
ne
d p
er
AE
(a
cre
s)
Lan
d in
he
rite
d p
er
AE (
ac
res)
La
nd
op
era
ted
pe
r A
E (
acre
s)
La
nd
ac
qu
ire
d t
hro
ug
h t
he
ma
rke
t p
er
AE
(ac
res)
La
nd
ow
ne
d p
er
AE
(a
cre
s)
Lan
d in
he
rite
d p
er
AE (
ac
res)
La
nd
op
era
ted
pe
r A
E (
acre
s)
La
nd
ac
qu
ire
d t
hro
ug
h t
he
ma
rke
t p
er
AE
(ac
res)
Central region (N=243) Eastern region (N=441) Western region (N=243)
16
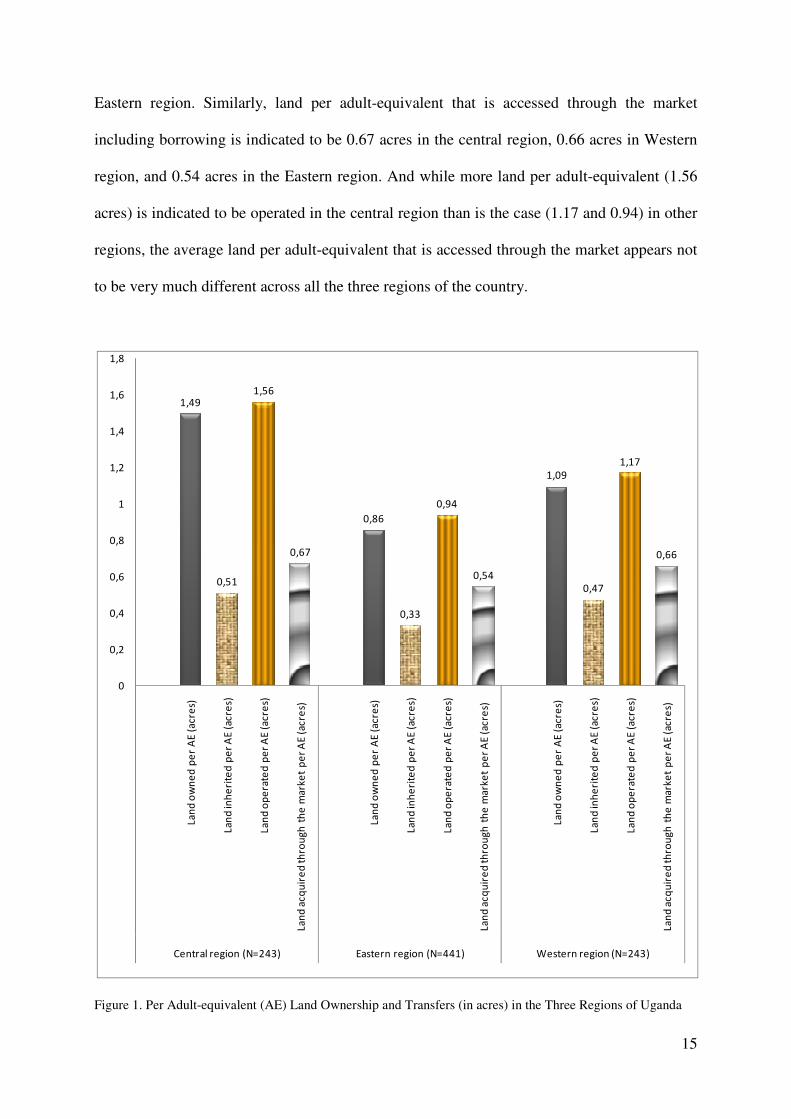
First-Order Stochastic Dominance Analysis
The first-order stochastic dominance analysis (FOSDA) that is density functions (CDFs) was
conducted to assess the statistical differences in the distribution of land endowment across
households with varying levels of welfare. Graphically, the curve for the CDF of a dominated
quartile will be to the left of the CDF for the dominating alternative quartile. This implies that
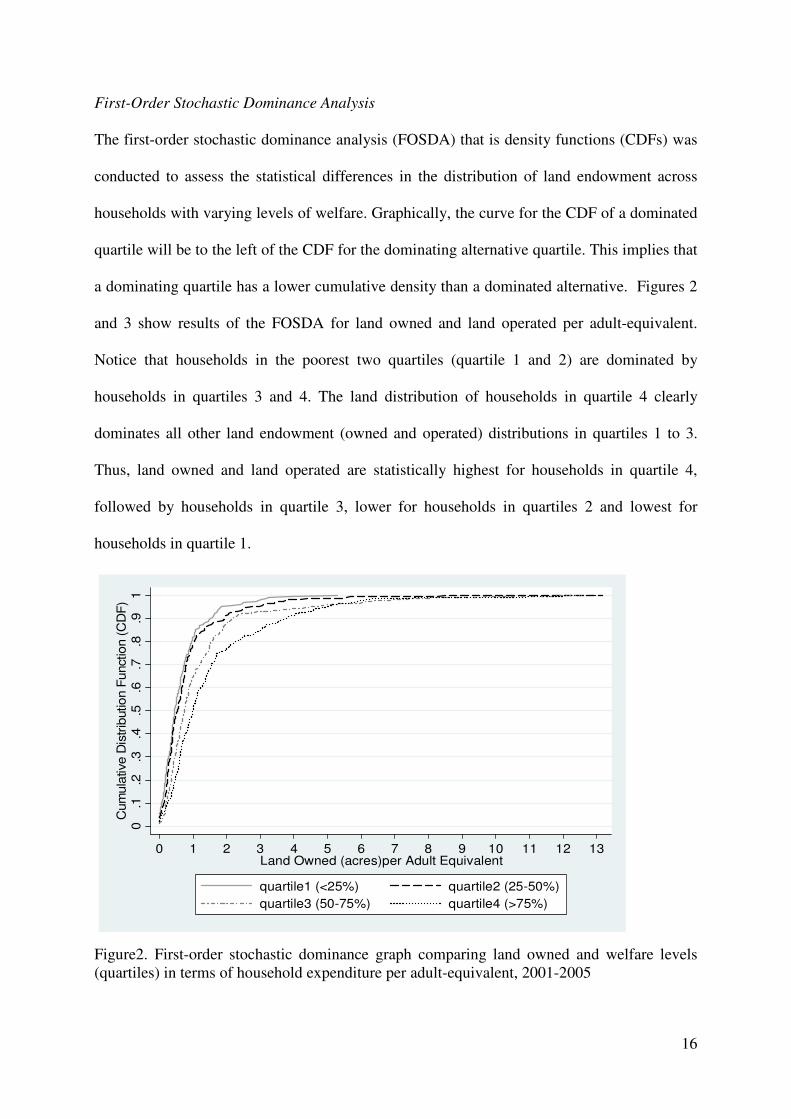
a dominating quartile has a lower cumulative density than a dominated alternative. Figures 2
and 3 show results of the FOSDA for land owned and land operated per adult-equivalent.
Notice that households in the poorest two quartiles (quartile 1 and 2) are dominated by
households in quartiles 3 and 4. The land distribution of households in quartile 4 clearly
dominates all other land endowment (owned and operated) distributions in quartiles 1 to 3.
Thus, land owned and land operated are statistically highest for households in quartile 4,
followed by households in quartile 3, lower for households in quartiles 2 and lowest for
households in quartile 1.
Figure2. First-order stochastic dominance graph comparing land owned and welfare levels (quartiles) in terms of household expenditure per adult-equivalent, 2001-2005
0.1
.2.3
.4.5
.6.7
.8.9
1C
um
ula
tive D
istr
ibution F
unction (C
DF
)
0 1 2 3 4 5 6 7 8 9 10 11 12 13Land Owned (acres)per Adult Equivalent
quartile1 (<25%) quartile2 (25-50%)
quartile3 (50-75%) quartile4 (>75%)
17
Figure 3. First-order stochastic dominance graph comparing land operated and welfare levels (quartiles) in terms of household expenditure per adult-equivalent, 2001-2005
VI. ECONOMETRIC MODEL ESTIMATION
Land access that includes a) land owned, b) land operated, and c) land acquired through the
market, all are expected to be endogenous. This was confirmed by the findings of the post-
estimation tests for endogeneity that is based on the Durbin (score) and the Wu-Hausman tests
summarized in Table 3. Linear functional forms for the estimated poverty impact model were
adopted following the test results of various diagnostic fits in the form of scatter plots and
nonparametric ‘lowess’ and ‘local linear’ regressions. The plots (not included in the text)
found the relationship between household expenditure and each of the land access variables to
be largely linear.
There can be methodological challenges related to generating unbiased estimates of welfare
effects of land and other endowments due to their endogeneity and the fact that they may be
correlated with unobservable household, farm and community characteristics. A standard
0.1
.2.3
.4.5
.6.7
.8.9
1C
um
ula
tive D
istr
ibution F
unction
(C
DF
)
0 1 2 3 4 5 6 7 8 9 10 11 12 13Land Operated (acres) per Adult-Equivalent
quartile1 (<25%) quartile2 (25-50%)
quartile3 (50-75%) quartile4 (>75%)
18
instrumental variable (IV) method that employs a linear combination of five instruments was
used as the preferred estimation method, while a residual component (RC) approach based on
Holden et al (2009) was estimated as a robustness check of the key results. The standard IV
two-stage least squares (2SLS) method employed a linear combination of five instruments for
each of the endogenous land access variables. They include: (i) the proportion of households
in the smallest village (LC1) that can afford at least 2 meals a day, (ii) land in acres that both
head and spouse brought in at the start of the household, (iii) the value (Ug.shs) of other in-
kind (non-land and non-cash) assets that the head and spouse brought in at the start of the
household, (iv) a dummy variable for the high agricultural potential (high rainfall) of the
village, (v) age of household head, and age of household head squared.
There can be a positive correlation between food security and access to land, especially
among the rural households. Farm households can increase their agricultural food production
and welfare overtime, if the land-poor (or near landless) but efficient households are able to
access land from the land-rich households. The proportion of households in the smallest local
government (LC1) that can afford at least 2 meals a day can therefore, be a reliable instrument
for land access at the village level.
We also contend that households with more access to land in the current period may have also
enjoyed relatively more land endowments at the start of their households. Current land
endowments and the possibility of the increased land accumulation over time may largely be
correlated with initial land and non-land assets that the head and the spouse brought in at the
start of the household. Still, land scarcity is likely to be more pronounced in areas with a
reliable rainfall pattern, due to high population pressure. The agricultural potential of an area
can be an effective signal of the level and the underlying dynamics of land access across rural
farm households in any given agricultural period. Undoubtedly, the age of the head tends to
19
correspond highly with different stages of the life-cycle that are specific to different levels of
food requirements and demand for different productive assets in the household. We expect
age of the household head to be a suitable instrument for land access over time.
VII. RESULTS AND DISCUSSION
Results of the first-stage IV (2SLS) model estimation of different modes of land access are
presented in Table 3, while results of the second-stage IV estimation are summarized in Table
4. Land owned that also includes a mixture of land that is inherited and purchased is specified
in model 1, operated land in model 2, market acquired land including borrowing in models 3,
while land that is accessed through the market without borrowing is specified in model 4.
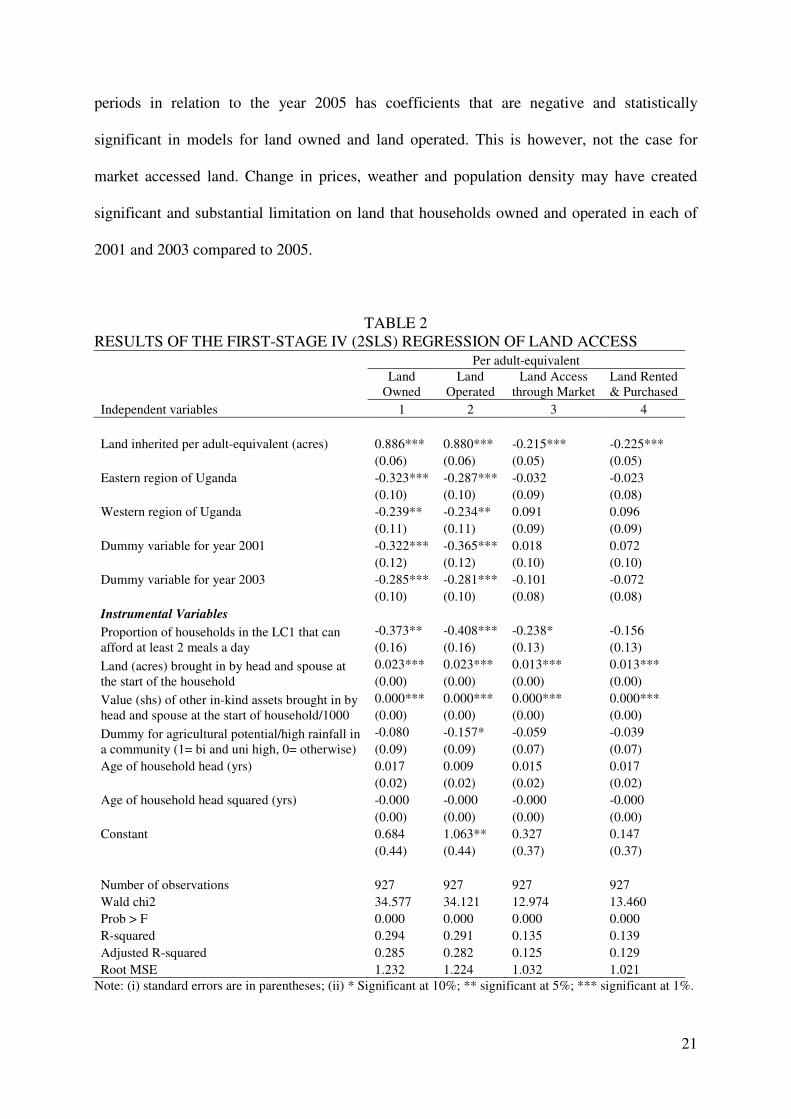
First-stage results of all the model specifications in Table 2 indicate adjusted R-squared
values that are between 13% and 29%. This implies a reasonable overall fit and considerable
variation in land access that is explained by the exogenous and instrumental variables.
Different tests of the instrumentation are summarized in the lower section of Table 3. The first
test is based on the null hypothesis that instruments are weak. The F-statistics for the joint
significance of instruments in each of the models (Table 3) are found to range between 15.9
and 18.8, with a p-value of 0.0000. These F-values are higher than 10 and satisfies the widely
agreed rule of thumb for instruments that are considered not to be weak. This is further
confirmed by the minimum eigenvalue statistics that are also greater than 10. However, these
two statistics are seen to be considerably lower than the critical value of 29.18 of the 2SLS
estimator (when a distortion of a 5% is tolerated in the Wald test) that includes a 10 percent at
most of the true size of estimates. In this case, we do not reject the null hypothesis that the
joint effect of the instruments is weak.
20
The test of endogeneity of land access variables based on these instruments (Table 3) show
relatively high values (3.99-8.45) of the Durbin (score) chi2 statistic and (3.97-8.46) of the
Wu-Hausman F statistic that are all significant at 1-5 % level. These results imply a strong
rejection that all the land access variables are exogenous. We therefore, conclude that land
owned, land operated, and market accessed land are all endogenous.
The test of over-identification restrictions is based on the post estimation Sargan chi2 statistic
that ranges from 6.66-8.39 and the Basmann chi2 statistics of 6.62-8.35. These two statistics
have p-values that are clearly insignificant, which implies that the validity of the 5
overidentifying restrictions in each model specification could not be rejected. These five
instruments are therefore found to be strong and relevant to predict the endogenous land
access variables. They are correlated with the endogenous land access variables but
uncorrelated with the independent variables and the error term in the outcome equation.
Perhaps, the basic objection to this IV approach is that the instruments could potentially be
correlated with the outcome (household welfare) variable in the second-stage.
Results in Table 2 indicate that the effect of a 1 acre increase in land inherited on different
modes of land access is statistically significant at 1 percent level. The economic importance
of an increase in land inherited is however larger and positive on each of the land owned and
land operated (models 1 and 2), but also negative and smaller in magnitude on each of market
accessed land in model 3 and 4. Regional effects are also noted to have an important effect on
land access. Households in each of the Eastern and Western regions of Uganda appear to own
and operate less land per adult-equivalent compared to their counterparts in the Central
region. When it comes to market accessed land in models 3 and 4, the effect of regional
differences is found to be trivial and statistically insignificant. The effect of dummy year
21
periods in relation to the year 2005 has coefficients that are negative and statistically
significant in models for land owned and land operated. This is however, not the case for
market accessed land. Change in prices, weather and population density may have created
significant and substantial limitation on land that households owned and operated in each of
2001 and 2003 compared to 2005.
TABLE 2 RESULTS OF THE FIRST-STAGE IV (2SLS) REGRESSION OF LAND ACCESS
Independent variables
Per adult-equivalent Land
Owned Land
Operated Land Access
through Market Land Rented & Purchased
1 2 3 4 Land inherited per adult-equivalent (acres) 0.886*** 0.880*** -0.215*** -0.225*** (0.06) (0.06) (0.05) (0.05) Eastern region of Uganda -0.323*** -0.287*** -0.032 -0.023 (0.10) (0.10) (0.09) (0.08) Western region of Uganda -0.239** -0.234** 0.091 0.096 (0.11) (0.11) (0.09) (0.09) Dummy variable for year 2001 -0.322*** -0.365*** 0.018 0.072 (0.12) (0.12) (0.10) (0.10) Dummy variable for year 2003 -0.285*** -0.281*** -0.101 -0.072 (0.10) (0.10) (0.08) (0.08) Instrumental Variables Proportion of households in the LC1 that can afford at least 2 meals a day
-0.373** -0.408*** -0.238* -0.156 (0.16) (0.16) (0.13) (0.13)
Land (acres) brought in by head and spouse at the start of the household
0.023*** 0.023*** 0.013*** 0.013*** (0.00) (0.00) (0.00) (0.00)
Value (shs) of other in-kind assets brought in by head and spouse at the start of household/1000
0.000*** 0.000*** 0.000*** 0.000*** (0.00) (0.00) (0.00) (0.00)
Dummy for agricultural potential/high rainfall in a community (1= bi and uni high, 0= otherwise)
-0.080 -0.157* -0.059 -0.039 (0.09) (0.09) (0.07) (0.07)
Age of household head (yrs) 0.017 0.009 0.015 0.017 (0.02) (0.02) (0.02) (0.02) Age of household head squared (yrs) -0.000 -0.000 -0.000 -0.000 (0.00) (0.00) (0.00) (0.00) Constant 0.684 1.063** 0.327 0.147 (0.44) (0.44) (0.37) (0.37) Number of observations 927 927 927 927 Wald chi2 34.577 34.121 12.974 13.460 Prob > F 0.000 0.000 0.000 0.000 R-squared 0.294 0.291 0.135 0.139 Adjusted R-squared 0.285 0.282 0.125 0.129 Root MSE 1.232 1.224 1.032 1.021
Note: (i) standard errors are in parentheses; (ii) * Significant at 10%; ** significant at 5%; *** significant at 1%.
22
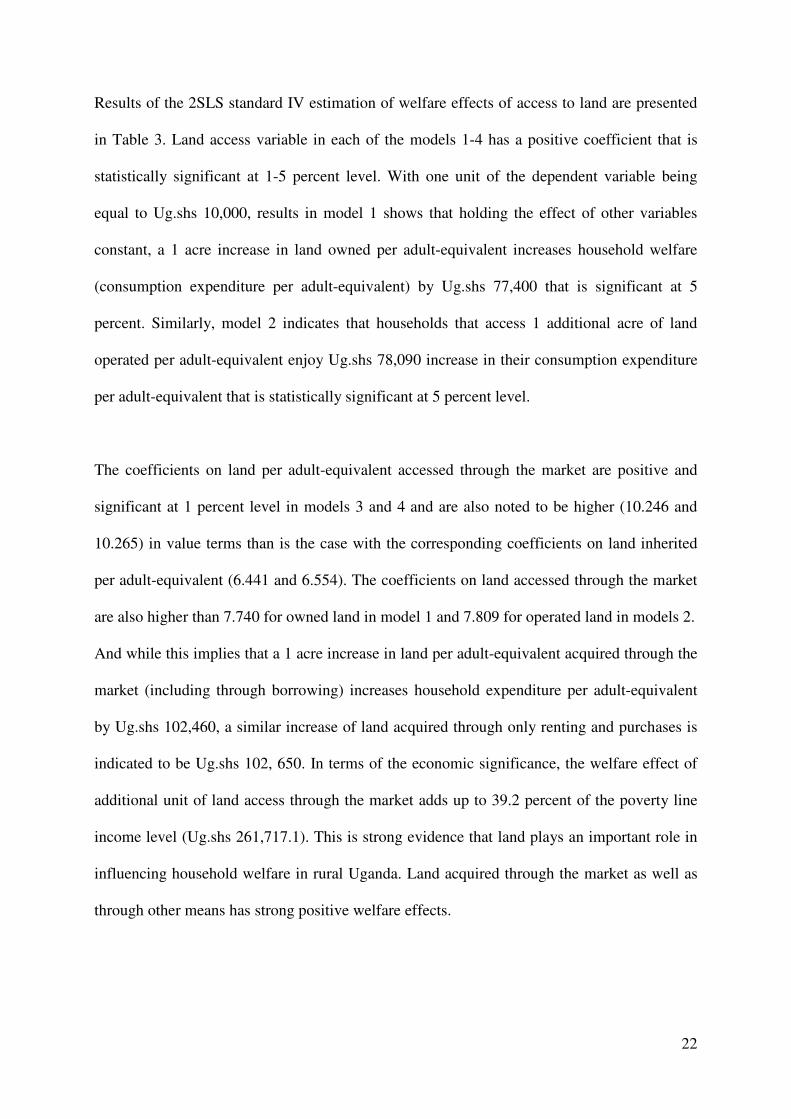
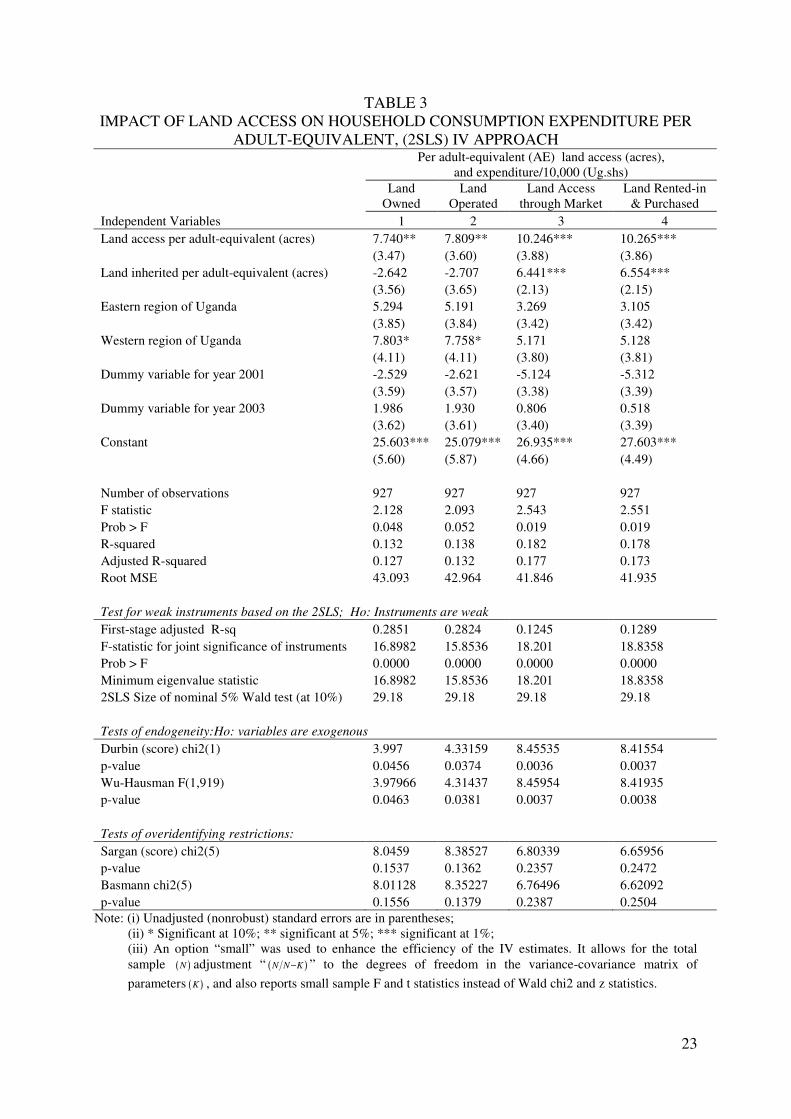
Results of the 2SLS standard IV estimation of welfare effects of access to land are presented
in Table 3. Land access variable in each of the models 1-4 has a positive coefficient that is
statistically significant at 1-5 percent level. With one unit of the dependent variable being
equal to Ug.shs 10,000, results in model 1 shows that holding the effect of other variables
constant, a 1 acre increase in land owned per adult-equivalent increases household welfare
(consumption expenditure per adult-equivalent) by Ug.shs 77,400 that is significant at 5
percent. Similarly, model 2 indicates that households that access 1 additional acre of land
operated per adult-equivalent enjoy Ug.shs 78,090 increase in their consumption expenditure
per adult-equivalent that is statistically significant at 5 percent level.
The coefficients on land per adult-equivalent accessed through the market are positive and
significant at 1 percent level in models 3 and 4 and are also noted to be higher (10.246 and
10.265) in value terms than is the case with the corresponding coefficients on land inherited
per adult-equivalent (6.441 and 6.554). The coefficients on land accessed through the market
are also higher than 7.740 for owned land in model 1 and 7.809 for operated land in models 2.
And while this implies that a 1 acre increase in land per adult-equivalent acquired through the
market (including through borrowing) increases household expenditure per adult-equivalent
by Ug.shs 102,460, a similar increase of land acquired through only renting and purchases is
indicated to be Ug.shs 102, 650. In terms of the economic significance, the welfare effect of
additional unit of land access through the market adds up to 39.2 percent of the poverty line
income level (Ug.shs 261,717.1). This is strong evidence that land plays an important role in
influencing household welfare in rural Uganda. Land acquired through the market as well as
through other means has strong positive welfare effects.
23
TABLE 3 IMPACT OF LAND ACCESS ON HOUSEHOLD CONSUMPTION EXPENDITURE PER
ADULT-EQUIVALENT, (2SLS) IV APPROACH
Independent Variables
Per adult-equivalent (AE) land access (acres), and expenditure/10,000 (Ug.shs)
Land Owned
Land Operated
Land Access through Market
Land Rented-in & Purchased
1 2 3 4 Land access per adult-equivalent (acres) 7.740** 7.809** 10.246*** 10.265*** (3.47) (3.60) (3.88) (3.86) Land inherited per adult-equivalent (acres) -2.642 -2.707 6.441*** 6.554*** (3.56) (3.65) (2.13) (2.15) Eastern region of Uganda 5.294 5.191 3.269 3.105 (3.85) (3.84) (3.42) (3.42) Western region of Uganda 7.803* 7.758* 5.171 5.128 (4.11) (4.11) (3.80) (3.81) Dummy variable for year 2001 -2.529 -2.621 -5.124 -5.312 (3.59) (3.57) (3.38) (3.39) Dummy variable for year 2003 1.986 1.930 0.806 0.518 (3.62) (3.61) (3.40) (3.39) Constant 25.603*** 25.079*** 26.935*** 27.603*** (5.60) (5.87) (4.66) (4.49) Number of observations 927 927 927 927 F statistic 2.128 2.093 2.543 2.551 Prob > F 0.048 0.052 0.019 0.019 R-squared 0.132 0.138 0.182 0.178 Adjusted R-squared 0.127 0.132 0.177 0.173 Root MSE 43.093 42.964 41.846 41.935 Test for weak instruments based on the 2SLS; Ho: Instruments are weak
First-stage adjusted R-sq 0.2851 0.2824 0.1245 0.1289 F-statistic for joint significance of instruments 16.8982 15.8536 18.201 18.8358 Prob > F 0.0000 0.0000 0.0000 0.0000 Minimum eigenvalue statistic 16.8982 15.8536 18.201 18.8358 2SLS Size of nominal 5% Wald test (at 10%) 29.18 29.18 29.18 29.18 Tests of endogeneity:Ho: variables are exogenous
Durbin (score) chi2(1) 3.997 4.33159 8.45535 8.41554 p-value 0.0456 0.0374 0.0036 0.0037 Wu-Hausman F(1,919) 3.97966 4.31437 8.45954 8.41935 p-value 0.0463 0.0381 0.0037 0.0038 Tests of overidentifying restrictions:
Sargan (score) chi2(5) 8.0459 8.38527 6.80339 6.65956 p-value 0.1537 0.1362 0.2357 0.2472 Basmann chi2(5) 8.01128 8.35227 6.76496 6.62092 p-value 0.1556 0.1379 0.2387 0.2504
Note: (i) Unadjusted (nonrobust) standard errors are in parentheses; (ii) * Significant at 10%; ** significant at 5%; *** significant at 1%; (iii) An option “small” was used to enhance the efficiency of the IV estimates. It allows for the total sample ( )N adjustment “ ( )N N K− ” to the degrees of freedom in the variance-covariance matrix of
parameters ( )K , and also reports small sample F and t statistics instead of Wald chi2 and z statistics.
24
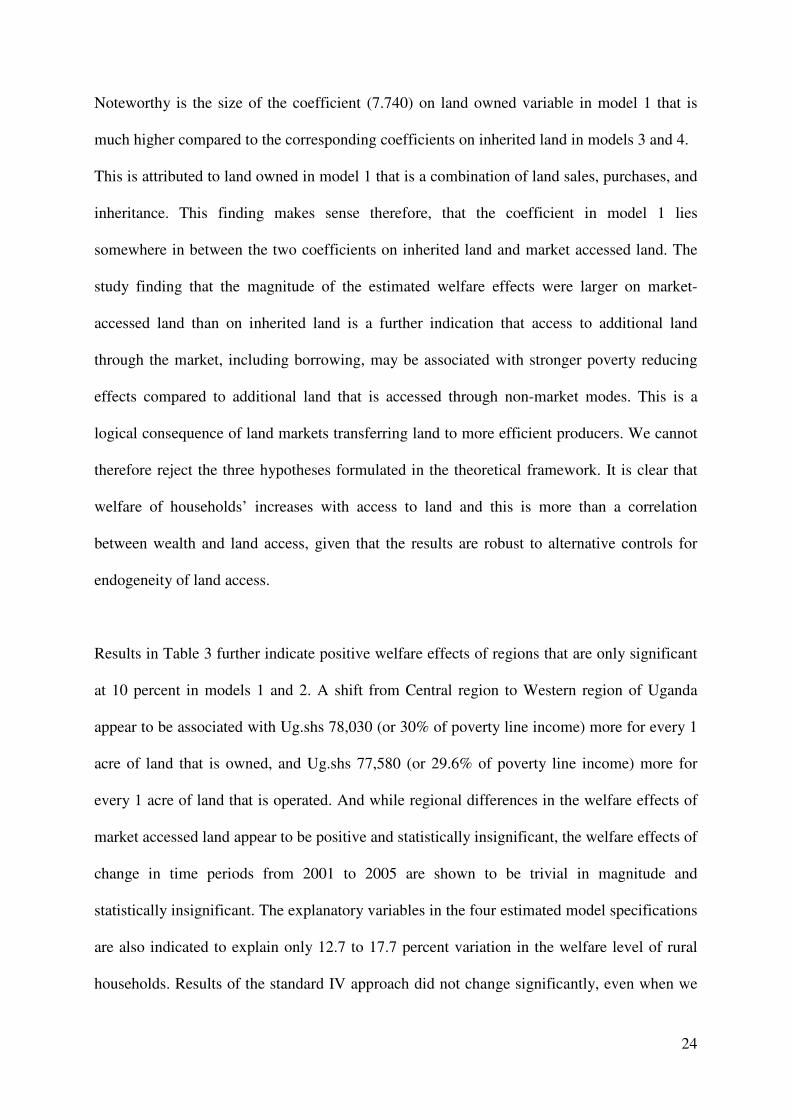
Noteworthy is the size of the coefficient (7.740) on land owned variable in model 1 that is
much higher compared to the corresponding coefficients on inherited land in models 3 and 4.
This is attributed to land owned in model 1 that is a combination of land sales, purchases, and
inheritance. This finding makes sense therefore, that the coefficient in model 1 lies
somewhere in between the two coefficients on inherited land and market accessed land. The
study finding that the magnitude of the estimated welfare effects were larger on market-
accessed land than on inherited land is a further indication that access to additional land
through the market, including borrowing, may be associated with stronger poverty reducing
effects compared to additional land that is accessed through non-market modes. This is a
logical consequence of land markets transferring land to more efficient producers. We cannot
therefore reject the three hypotheses formulated in the theoretical framework. It is clear that
welfare of households’ increases with access to land and this is more than a correlation
between wealth and land access, given that the results are robust to alternative controls for
endogeneity of land access.
Results in Table 3 further indicate positive welfare effects of regions that are only significant
at 10 percent in models 1 and 2. A shift from Central region to Western region of Uganda
appear to be associated with Ug.shs 78,030 (or 30% of poverty line income) more for every 1
acre of land that is owned, and Ug.shs 77,580 (or 29.6% of poverty line income) more for
every 1 acre of land that is operated. And while regional differences in the welfare effects of
market accessed land appear to be positive and statistically insignificant, the welfare effects of
change in time periods from 2001 to 2005 are shown to be trivial in magnitude and
statistically insignificant. The explanatory variables in the four estimated model specifications
are also indicated to explain only 12.7 to 17.7 percent variation in the welfare level of rural
households. Results of the standard IV approach did not change significantly, even when we
25
employed the G2SLS panel random-effects7 and limited-information maximum likelihood
(LIML) estimation to estimate the poverty impact equation of land access.
Further robustness checks
Further sensitivity analysis of the major findings of the standard IV approach was
implemented using the residual component (RC) model based on Holden et al (2009; 2011).
Each of the endogenous land access variables is first regressed on exogenous variables using
panel models that are able to clean out the unobservable and observable time-invariant
household, farm and village characteristics that may cause endogeneity bias. Specifically, a
linear panel fixed-effects model is fitted for the land owned; land operated, and market
accessed land in the first-stage. Alternatively, the dynamic panel random-effects (RE) Tobit
model (Wooldridge 2005) is also estimated for market accessed land, in order to control for
its embedded limited dependent (LDV) characteristics. Unlike household fixed-effects, the
Tobit model is able to produce conditional expectation functions (CEFs) that respect LDV
boundaries of the key variable of interest, and fitted values that are positive (Angrist &
Pischke 2009).
The RC approach is easy to compute and can generate robust estimates of the poverty impact
equation of the endogenous land access variables under the assumption of strict exogeneity of
the residuals. It utilizes the residual component asset variable (=Productive Asset - Predicted
Asset) to test the impact of the variation in asset endowment on household consumption
expenditure, after the fixed household specific confounders have been cleaned out using a
fixed-effects type of data transformation. The RC method is therefore able to control for
7 Results of the G2SLS panel random-effects estimation and that of limited-information maximum likelihood (LIML) estimation of the poverty impact equation of land access are available and can be obtained from the authors upon request.
26
biases due the spurious correlations with omitted time-invariant variables. It is particularly
useful when there are no strong and valid instruments to predict the endogenous variable of
interest, and also when the data set constitutes short panels that can further limit the effects of
omitted time-varying heterogeneity. The RC approach does not rely on the strength and
validity of the instruments, which is the Achilles heel of the IV approach. It instead requires
relevant regressors that are strictly exogenous and limited presence of the time-varying
unobserved heterogeneity that is correlated with the residual component and the outcome
variable.
Results of the first-stage and second-stage estimation of the RC method are not reported in the
text due to limited space, but can be accessed from the authors upon request. However, they
indicate consistent parameters and are line with the key findings of the IV (2SLS) approach in
Table 3. They however, show relatively larger marginal effects of each of the land access
variables (13.084 for land owned, 14.200 for land operated, 20.838 - 21.013 for market
accessed land) compared to the corresponding estimates of IV model estimation. The
significantly larger RC coefficients (20.838 - 21.013) on market acquired land in relation to
corresponding coefficients (2.924 - 5.652) on inherited land is a further confirmation of our
earlier IV findings that land access through the market including borrowing, generates
stronger poverty reduction effects compared to additional land through inheritances.
VIII. CONCLUSION
This paper has estimated the welfare impacts of land access through inheritance, a
combination of inheritance and other methods of acquisition, and through the market and
borrowing in rural Uganda. The uncovered evidence indicates that land scarcity is increasing,
and this has made land access an important poverty and welfare indicator in Uganda where
27
more than 90% of the poor live in rural areas. Our analysis shows that land, whether accessed
through the market or non-market ways plays an important role in enhancing household
welfare. Households with more of either owned land, operated land, or market-accessed land
were shown to gain a significant welfare-improving effect of this better land access after we
have controlled for endogeneity in land access.
The other significant finding was that better land access through the market has a stronger
welfare-improving effect than better land access through inheritance. This is likely to be the
case because land markets to a larger extent transfer land to more efficient producers.
However, it is not clear whether the existing land law and policies in Uganda will continue to
suffice in ensuring pro-poor land transfers. The increase in the new demand for land by
foreign investors can potentially threaten the land rights of the poor and long-term poverty
reduction, and new reforms may be needed to effectively protect the national interests and
livelihoods. While our analysis demonstrated that land markets enhanced efficiency as well as
poverty reduction in the mid 2000s the land markets may have different impacts in the new
situation with more actors on the demand side.
References Ahene, A. R. (2009). Measures to improve equal access to land resources and related
benefits in Uganda Proceedings: Land Governance in Support of the MDGs: Responding to New Challenges, FIG-World Bank Conference, Washington D.C, USA, 9-10, March 2009: International Federation of Surveyors, FIG and the World Bank. 1-13 pp.
Angrist, J. D. & Pischke, J.-S. (2009). Mostly Harmless Econometrics: An Empiricist's
Companion: Princeton University Press. Binswanger, P. H. & Rosenzweig, M. (1986). Behavioural and Material Determinants of
Production Relations in Agriculture. Journal of Development Studies, 22: 503-539. Bosworth, J. (2003). Integrating land issues into the broader development agenda: Uganda.
Land Reform, Land Settlement, and Cooperatives- Special Edition, 11: 233-248. Brett, E. A. (1973). Colonialism and underdevelopment in East Africa: The politics of
economic change, 1919-1939. London: Heinemann Available at: http://www.getcited.org/pub/101453454.
28
Busingye, H. (2002). Customary Land Tenure Reform in Uganda; Lessons for South Africa. International symposium on communal tenure reform, Land reform in Africa: lessons for South Africa, Johannesburg, 12th- 13th august 2002, pp. 1-12: Uganda Land Alliance.
Coldham, S. (2000). Land Reform and Customary Rights: The Case of Uganda. Journal of
African Law, 44: 65-77. de Janvry, A., Platteau, J.-P., Gordillo, G. & Sadoulet, E. (2001). Access to land and Land
Policy Reforms. In de Janvry. Alain, G. G., Platteau. Jean-Philippe, Sadoulet Elizabeth (ed.) Access to Land, Rural Poverty and Public Action Oxford: Oxford University Press.
Deaton, A. (1997). The Analysis of Household Surveys: a Microeconometric Approach to
Development Policy: Published for the World Bank, The Johns Hopkins University Press, Baltimore and London.
Deininger, K. & Feder, G. (1998). Land Institutions and Land Markets Policy Research
Working Paper 2 014, prepared as background for the forthcoming Handbook on
Agricultural Economics. : 1-44. Deininger, K. (2003). Land Policies for Growth and Poverty Reduction. A World Bank Policy
Research Report, 26384: A copublication of the World Bank and Oxford University Press. 1-239 pp.
Deininger, K. (2005). Land Policy Reforms. In Coudouel, A. & Paternostro, S. (eds) vol. Volume One Analyzing the Distributional Impact of reforms. A practitioner's guide to
trade, monetary and exchange rate policy, utility provision, agricultural markets, land
policy, and education, pp. 213-259. Washington.D.C: The World Bank. Deininger, K. & Ayalew, A. D. (2007). Do Overlapping Land Rights Reduce Agricultural
Investment? Evidence from Uganda. The World Bank Development Research Group and the Sustainable Rural and Urban Development Team, Policy Research Working Paper 4310. pp. 1-26.
Deininger, K. & Mpuga, P. (2008). Land Markets in Uganda: What is Their Impact and Who Benefits? . In Holden, T. S., Otsuka, K. & Place, M. F. (eds) The emergence of land
markets in Africa: Impacts on poverty, Equity and Efficiency., pp. 131-155. Washington, DC: Resources for the Future.
Finan, F., Sadoulet, E. & de Janvry, A. (2005). Measuring the poverty reduction potential of land in rural Mexico. Journal of Development Economics, 77 (1): 27-51.
Green, D. E. (2006). Ethnicity and the Politics of Land Tenure Reform in Central Uganda. Commonwealth and Comparative Politics, 44: 370-388.
Holden, S., Otsuka, K. & Place, M. F. (2008a). Land Markets and Development in Africa. In Holden, T. S., Otsuka, K. & Place, M. F. (eds) The Emergency of Land Markets in
Africa, pp. 3-54. Washington, DC: Resources for the Future. Holden, S., Otsuka, K. & Place, M. F. (2008b). Land markets and poverty in perspective. In
Holden, T. S., Otsuka, K. & Place, M. F. (eds) The emergence of land markets in
Africa: Assessing the Impacts on poverty, Equity and Efficiency, pp. 273- 312. Washington, DC: Resources for the Future.
Holden, S., Deininger, K. & Ghebru, H. (2011). Tenure Insecurity, Gender, Low-cost Land Certification and Land Rental Market Participation in Ethiopia. Journal of
Development Studies, 47: 31-47. Holden, T. S. (2009). Power Traps or Poverty Traps? Institutions, Markets, and
Environmental and Livelihood Restoration. Paper presented at the NFU Conference, 23-24. November 2009, University of Agder, Kristiansand, pp. 1-22.
29
Holden, T. S., Deininger, K. & Ghebru, H. (2009). Impacts of Low-Cost Land Certification on Investment and Productivity. American Journal of Agricultural Economics, 91: 359-373.
Hunt, D. (2004). Unintended Consequences of Land Rights Reform: The Case of the 1998 Uganda Land Act. Development Policy Review, 22 (2): 173-191.
Nkonya, E., Pender, J., Kaizzi, C., Kato, E. & Mugarura, S. (2005). Policy Options for
Increasing Crop Productivity and Reducing Soil Nutrient Depletion and Poverty in
Uganda. Environment and Production Technology Division Discussion Paper No. 134. Washington, D.C: International Food Policy Research Institute (IFPRI) and, Uganda National Agricultural Research Organization (NARO).
Otsuka, K. (2007). Efficiency and Equity Effects of Land Markets. In Evenson, R. & Pingali, P. (eds) vol. Volume 3 Handbook of Agricultural Economics, pp. 2671-2703: Elsevier.
Rugadya, A. M., Nsamba-Gayiiya, E. & Kamusiime, H. (2008). Analysis of post conflict land policy and land administration: A survey of IDP return and resettlement issues and lesson: Acholi and lango regions. Northern Uganda land study: For the World Bank, to input into Northern Uganda Peace, Recovery and Development Plan (PRDP) and the draft national land policy. 1-80 pp.
Rugadya, M. (1999). Land Reform:The Ugandan Experience,. Land Use and Villagisation Workshop, Hotel De Mille Collines, Kigali, 20-21 September 1999,, pp. 1-12: Uganda Land Alliance.
Rugadya, M., Obaikol, E. & Kamusiime, H. (2004). Gender and the Land Reform Process in
Uganda: Assessing Gains and Losses for Women in Uganda. Associates for development: Land Research Series No. 2. pp. 1-21.
West, H. W. (1972 ). Land policy in Buganda. Cambridge Eng: University Press Wooldridge, J. M. (2005). Simple solutions to the initial conditions problem in dynamic,
nonlinear panel data models with unobserved heterogeneity. Journal of Applied
Econometrics, 20 (1): 39-54.