Embed Size (px)
Citation preview
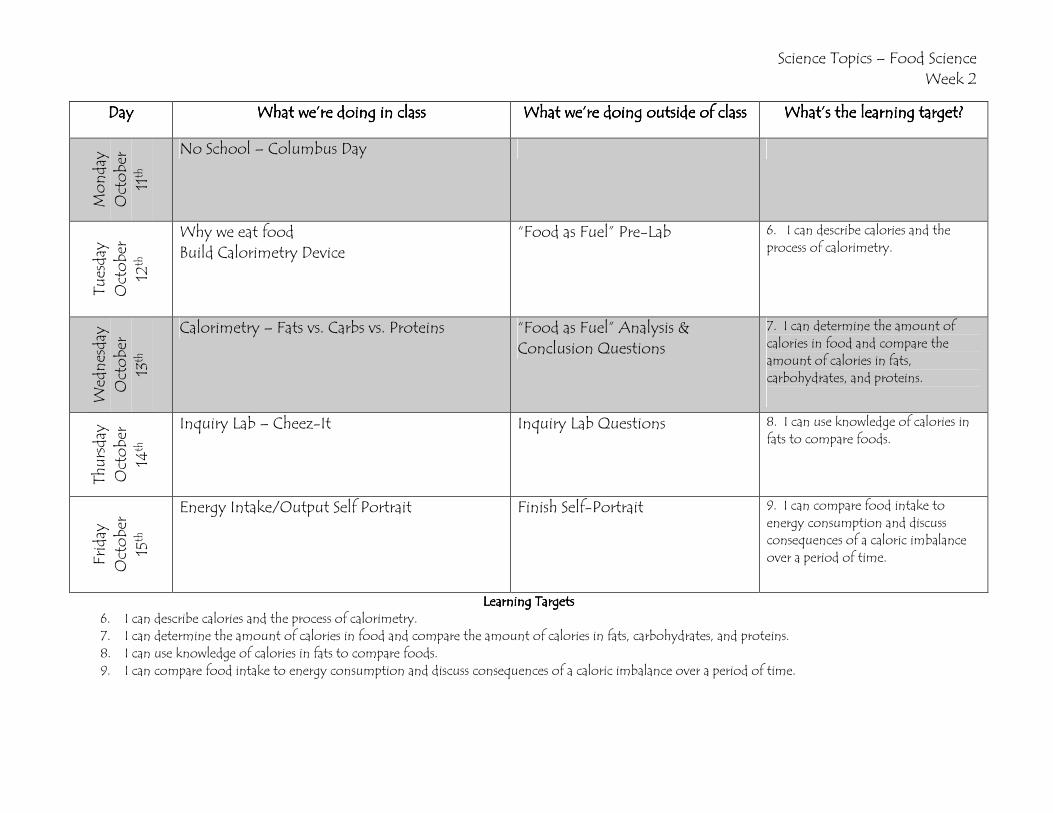
Science Topics – Food Science Week 2
DayDayDayDay What we’re doing in classWhat we’re doing in classWhat we’re doing in classWhat we’re doing in class What we’re doing outside of classWhat we’re doing outside of classWhat we’re doing outside of classWhat we’re doing outside of class What’s the learning target?What’s the learning target?What’s the learning target?What’s the learning target? Mon
day
Octob
er
11th
No School – Columbus Day
Tuesday
Octob
er
12th
Why we eat food Build Calorimetry Device
“Food as Fuel” Pre-Lab 6. I can describe calories and the process of calorimetry.
Wednesday
Octob
er
13th
Calorimetry – Fats vs. Carbs vs. Proteins “Food as Fuel” Analysis & Conclusion Questions
7. I can determine the amount of calories in food and compare the amount of calories in fats, carbohydrates, and proteins.
Thursday
Octob
er
14th
Inquiry Lab – Cheez-It Inquiry Lab Questions 8. I can use knowledge of calories in fats to compare foods.
Friday
Octob
er
15th
Energy Intake/Output Self Portrait Finish Self-Portrait 9. I can compare food intake to energy consumption and discuss consequences of a caloric imbalance over a period of time.
Learning TargetsLearning TargetsLearning TargetsLearning Targets 6. I can describe calories and the process of calorimetry. 7. I can determine the amount of calories in food and compare the amount of calories in fats, carbohydrates, and proteins. 8. I can use knowledge of calories in fats to compare foods. 9. I can compare food intake to energy consumption and discuss consequences of a caloric imbalance over a period of time.
© P
ears
on E
duca
tion
, In
c.
Investigative Lab 8
Laboratory Manual/Investigative Lab 7 69
Name _______________________________ Class __________________ Date_______________
Food as FuelMeasuring the Chemical Energy Stored in Food
Question How can you measure the calorie content of a peanut?
Lab Overview In this investigation, you will construct and use a sim-ple calorimeter to measure the approximate number of calories in apeanut. You will compare the number of calories in a peanut with thecalorie content of other foods. CAUTION: This investigative labincludes peanuts and other food products as materials. If you are aller-gic to peanuts or any other food products, alert your teacher.
Introduction Have you ever roasted marshmallows and accidentallyset one on fire? You may have been amazed by the size of the flamethat the marshmallow fueled! All food contains stored energy that canbe released when the food is burned. To investigate the chemicalenergy stored in food, you need a calorimeter—an apparatus thatmeasures the calorie content of food samples. Recall that a calorie isdefined as the amount of energy required to raise the temperature of1 g of water by 1°C. (Note that the “calorie” counts listed on food pack-aging labels are given in kilocalories [kcal]. One kilocalorie is equal to1000 calories.) It is also useful to know that different types ofmolecules can store different amounts of energy. While proteins andcarbohydrates contain 4 kcal/g, fats contain 9 kcal/g.
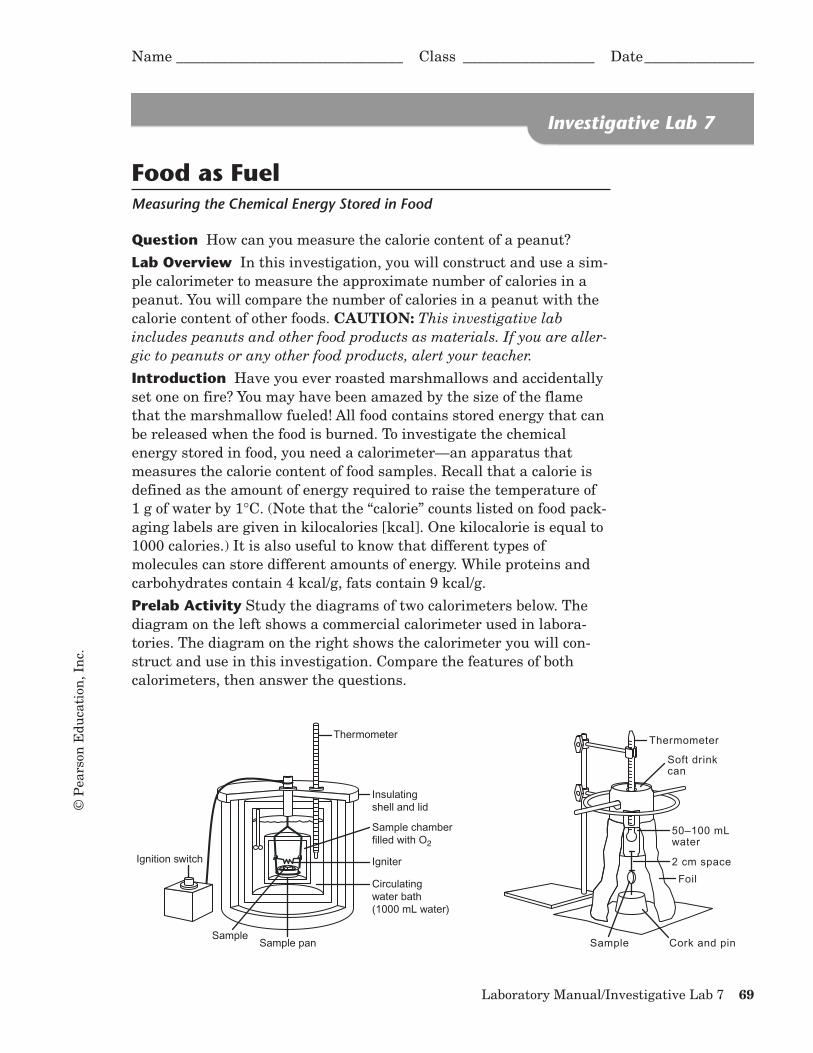
Prelab Activity Study the diagrams of two calorimeters below. Thediagram on the left shows a commercial calorimeter used in labora-tories. The diagram on the right shows the calorimeter you will con-struct and use in this investigation. Compare the features of bothcalorimeters, then answer the questions.
Objective to discoverhow energy storedin chemical com-pounds can bereleased and mea-sured
Inquiry Skills• observing• making measure-
ments• analyzing data• drawing conclu-
sions
Time• 15–20 min for
Prelab Activity• 20–30 min to con-
struct thecalorimeter
• 20–30 min to testfood samples
• 15–20 min forAnalysis and Con-clusions
Investigative Lab 7
Soft drinkcan
Ignition switch
Thermometer
50–100 mLwater
2 cm space
Foil
Cork and pinSample
Thermometer
Insulatingshell and lid
Sample chamberfilled with O2
Circulatingwater bath(1000 mL water)
Igniter
Sample panSample
3680_ch07_pp069-074 05/21/03 2:31 PM Page 69

70 Biology: Exploring Life
Prelab Questions
1. Which part of a calorimeter enables you to make measurements?In what units are the measurements?
2. A food sample burned in the commercial calorimeter raised thetemperature of the water surrounding the sample chamber by4°C. Note that 1 g water � 1 mL water. To calculate the numberof calories in the sample, multiply the amount of water in thechamber by the change in temperature in degrees Celsius (°C).
Temperature change of °C � 1000 mL �
calories � 1000 � kcal
3. Suppose you place a food sample in the chamber of the commer-cial calorimeter. This time, you put only 500 mL of water in thecalorimeter. When you burn the sample, the water temperatureincreases by 2°C. How many kcal were in the food sample?
4. Compare the features of the commercial calorimeter with those ofthe calorimeter you will construct in the lab. What features doboth calorimeters have? How are these shared features differentbetween the two calorimeters?
5. Do you think that the differences between the shared features ofthe two calorimeters could affect the accuracy of the measure-ments you will make in the lab? Explain.
enclosed when it is ignited.
commercial calorimeter since it is not as well insulated and the sample is not completely
Suggested answer: Yes. The water temperature may not change as much as it would in a
the commercial calorimeter, the sample is ignited within the enclosed device.
insulation in the commercial calorimeter is most likely more reliable than aluminum foil. In
and both have a place to burn a sample. Water circulates in the commercial calorimeter. The
Suggested answers: Both calorimeters have a container that holds water, both are insulated,
2ºC � 500 � 1000 calories � 1000 � 1 kcal
44000
4
Thermometer, degrees Celsius
© P
ears
on E
duca
tion
, In
c.
3680_ch07_pp069-074 05/21/03 2:31 PM Page 70
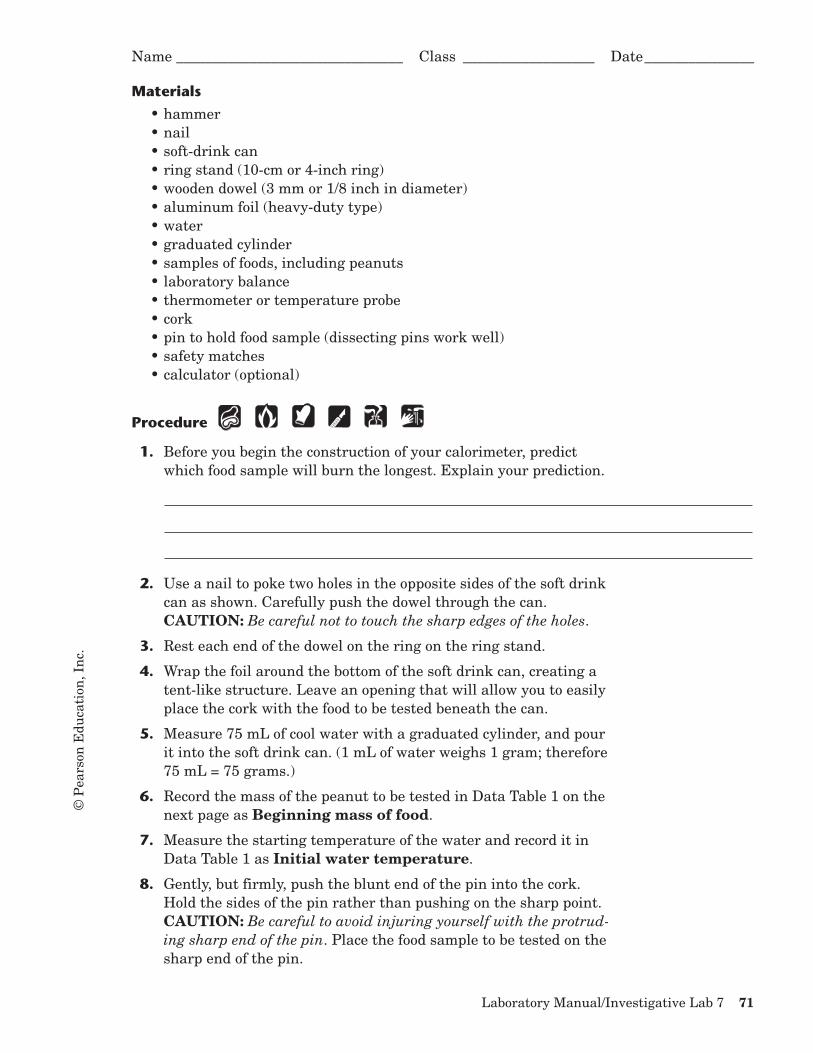
Materials
• hammer• nail• soft-drink can• ring stand (10-cm or 4-inch ring)• wooden dowel (3 mm or 1/8 inch in diameter)• aluminum foil (heavy-duty type) • water• graduated cylinder• samples of foods, including peanuts• laboratory balance• thermometer or temperature probe• cork• pin to hold food sample (dissecting pins work well)• safety matches• calculator (optional)
Procedure
1. Before you begin the construction of your calorimeter, predictwhich food sample will burn the longest. Explain your prediction.
2. Use a nail to poke two holes in the opposite sides of the soft drinkcan as shown. Carefully push the dowel through the can. CAUTION: Be careful not to touch the sharp edges of the holes.
3. Rest each end of the dowel on the ring on the ring stand.
4. Wrap the foil around the bottom of the soft drink can, creating atent-like structure. Leave an opening that will allow you to easilyplace the cork with the food to be tested beneath the can.
5. Measure 75 mL of cool water with a graduated cylinder, and pourit into the soft drink can. (1 mL of water weighs 1 gram; therefore75 mL = 75 grams.)
6. Record the mass of the peanut to be tested in Data Table 1 on thenext page as Beginning mass of food.
7. Measure the starting temperature of the water and record it inData Table 1 as Initial water temperature.
8. Gently, but firmly, push the blunt end of the pin into the cork.Hold the sides of the pin rather than pushing on the sharp point.CAUTION: Be careful to avoid injuring yourself with the protrud-ing sharp end of the pin. Place the food sample to be tested on thesharp end of the pin.
Laboratory Manual/Investigative Lab 7 71
Name _______________________________ Class __________________ Date_______________©
Pea
rson
Edu
cati
on, I
nc.
3680_ch07_pp069-074 7/14/03 2:17 PM Page 71

72 Biology: Exploring Life
9. Place the cork, pin, and food sample under the soft drink can.Make sure there is approximately a 2-cm space between the softdrink can and the food sample by raising or lowering the ring asneeded. CAUTION: Tie back loose hair and make sure your safetygoggles are in place before proceeding.
10. Place the cork with the food sample under the soft drink can, andlight the food sample with a safety match. One person should usea clock or watch to time for how long the sample burns and recordthe time at the bottom of Data Table 1.
11. When the food is burning, determine the highest water tempera-ture reached and record it in Data Table 1 as Highest watertemperature.
12. When the food sample has finished burning, weigh any remainingash. Record your results in Data Table 1 as Final mass of food.
13. Repeat steps 6 through 12 two more times—one for each addi-tional food sample. Remember to use fresh, cool water for eachsample. Record the results in Data Table 1.
14. Use the formulas in Data Table 1 to help you determine the num-ber of kilocalories per gram in each food sample.
© P
ears
on E
duca
tion
, In
c.
Peanut Sample 2 Sample 3
Beginning mass of food sample (g)
Final mass of food sample (g)
Mass of food burned (g)(Beginning mass � final mass)
Beginning water temperature (°C)
Highest water temperature (°C)
Water temperature change (°C)(Highest temperature �beginning temperature)
Mass of water used (1 mL � 1 g)
Total calories (water mass in g �temperature change in °C)
Total kilocalories (calories/1000)
Kilocalories per gram (kcal/g)(total kcal/mass of food burned)
Time sample burned
Data Table 1
Student responses will vary.
3680_ch07_pp069-074 05/21/03 2:31 PM Page 72

Laboratory Manual/Investigative Lab 7 73
Name _______________________________ Class __________________ Date_______________©
Pea
rson
Edu
cati
on, I
nc.
Analysis and Conclusions
1. Compare your results from the three food samples. Suggest whydifferent foods might produce different results.
2. Do your results agree or disagree with the data below? If yourresults disagree, suggest two possible reasons why.
Molecules of fat contain more kcal/g than molecules of protein or carbohydrate.
Different foods will produce different results based on the type of molecules they contain.
Food kcal/g
Peanuts 5.81 kcal/g
3. What happened to the heat that was not “captured” by the water?
4. Which sample burned the longest? Did this agree withyour prediction?
5. Look at your data. Is there any relationship between how long asample burned and its calorie content? Explain.
stored energy to fuel the fire.
Generally the samples with the highest calorie content will burn the longest because there is more
Answers will vary based on student data and predictions.
The heat escaped to the surrounding environment (air).
needle, calculation errors.
calorimeter not well insulated, different brands of peanuts were used, the food fell off the
error: misreading the thermometer, the food was not placed directly under the soft-drink can,
Students may agree with the results or they may cite some of the following as sources of
3680_ch07_pp069-074 05/21/03 2:31 PM Page 73
6. Compare and contrast the burning of food in a calorimeter to theburning of food in your body.
Extension
Obtain and analyze the data collected by the other students in yourclass for each type of food sample tested. Then, write a summarycomparing the class data with the information in Question 2. Suggesta new experiment to test your hypothesis explaining differences in thedata. (NOTE: Be sure to check with your teacher before carrying outany investigations.)
food to thermal energy.
energy from food into useful work, while a calorimeter converts most of the energy in the
Suggested answer: Cells “burn” food at a more gradual rate. Cells convert some of the
74 Biology: Exploring Life
© P
ears
on E
duca
tion
, In
c.
ExtensionStudent summariesshould include a dis-cussion of class dataand possible expla-nations for differ-ences in data amongthe lab groups.
3680_ch07_pp069-074 05/21/03 2:31 PM Page 74

Name________________________________ Science Topics – Food Science
CheezCheezCheezCheez----ItItItIt An Inquiry Lab
FUN FACT: Dave Karpick, then senior brand manager at Keebler Foods Co., is credited with the invention of the Cheez-It in the 1950s.
QuestionQuestionQuestionQuestion Is it possible to determine a regular Cheez-It from a reduced-fat Cheez-It without seeing the boxes? Background:Background:Background:Background: A calorie is a unit of heat energy used to measure the energy content of foods. To be exact, one calorie is the amount of energy it takes to raise the temperature of one kilogram of water by one degree Celsius. Foods rich in carbohydrates and lipids are also rich in calories. In this lab, we will use taste tests and calorimetry tests to distinguish regular Cheez-Its from reduced-fat Cheez-Its. Taste TestTaste TestTaste TestTaste Test
1. Taste one CheezCheezCheezCheez----It AIt AIt AIt A and one CheezCheezCheezCheez----It BIt BIt BIt B. 2. Record your “observations” in the data table below. Does one Cheez-It taste like it has
more fat content than the other?
MAKE SURE TO WRITE DOWN YOUR HYPOTHESIS AT THIS POINT.MAKE SURE TO WRITE DOWN YOUR HYPOTHESIS AT THIS POINT.MAKE SURE TO WRITE DOWN YOUR HYPOTHESIS AT THIS POINT.MAKE SURE TO WRITE DOWN YOUR HYPOTHESIS AT THIS POINT. HypotHypotHypotHypothesishesishesishesis Based on only a taste test, which Cheez-It do you think has more calories in it? CheezCheezCheezCheez----It AIt AIt AIt A or CheezCheezCheezCheez----It BIt BIt BIt B? ________________________________________________________________________ ________________________________________________________________________ ________________________________________________________________________ ProceduresProceduresProceduresProcedures For the calorimetry test, use the same procedures you used to determine the calorie content of the peanut.

Data and ObservationsData and ObservationsData and ObservationsData and Observations CheezCheezCheezCheez----It AIt AIt AIt A
CheezCheezCheezCheez----It BIt BIt BIt B
Taste test:Taste test:Taste test:Taste test:
Beginning mass of food sample (g)Beginning mass of food sample (g)Beginning mass of food sample (g)Beginning mass of food sample (g)
Final mass of food sample (g)Final mass of food sample (g)Final mass of food sample (g)Final mass of food sample (g)
Mass of food burned (g)Mass of food burned (g)Mass of food burned (g)Mass of food burned (g) (Beginning mass – final mass)
Beginning water temperature (°C)Beginning water temperature (°C)Beginning water temperature (°C)Beginning water temperature (°C)
Highest water temperature (°C)Highest water temperature (°C)Highest water temperature (°C)Highest water temperature (°C)
Water temperature change (°C)Water temperature change (°C)Water temperature change (°C)Water temperature change (°C) (Highest temperature – beginning temperature)
Mass of water used Mass of water used Mass of water used Mass of water used (1 mL = 1 g)
Total caloriesTotal caloriesTotal caloriesTotal calories (water mass in g x temperature change in °C)
Total kilocalories Total kilocalories Total kilocalories Total kilocalories (calories/1000)
Kilocalories per gram (kcal/g)Kilocalories per gram (kcal/g)Kilocalories per gram (kcal/g)Kilocalories per gram (kcal/g) (total kcal/mass of food burned)
Time sample burneTime sample burneTime sample burneTime sample burnedddd
Analysis Questions:Analysis Questions:Analysis Questions:Analysis Questions: 1. Which Cheez-It had more calories? 2. Does this result support your hypothesis? 3. Compare the results of your taste test and calorimetry test. Were the results of these tests consistent?
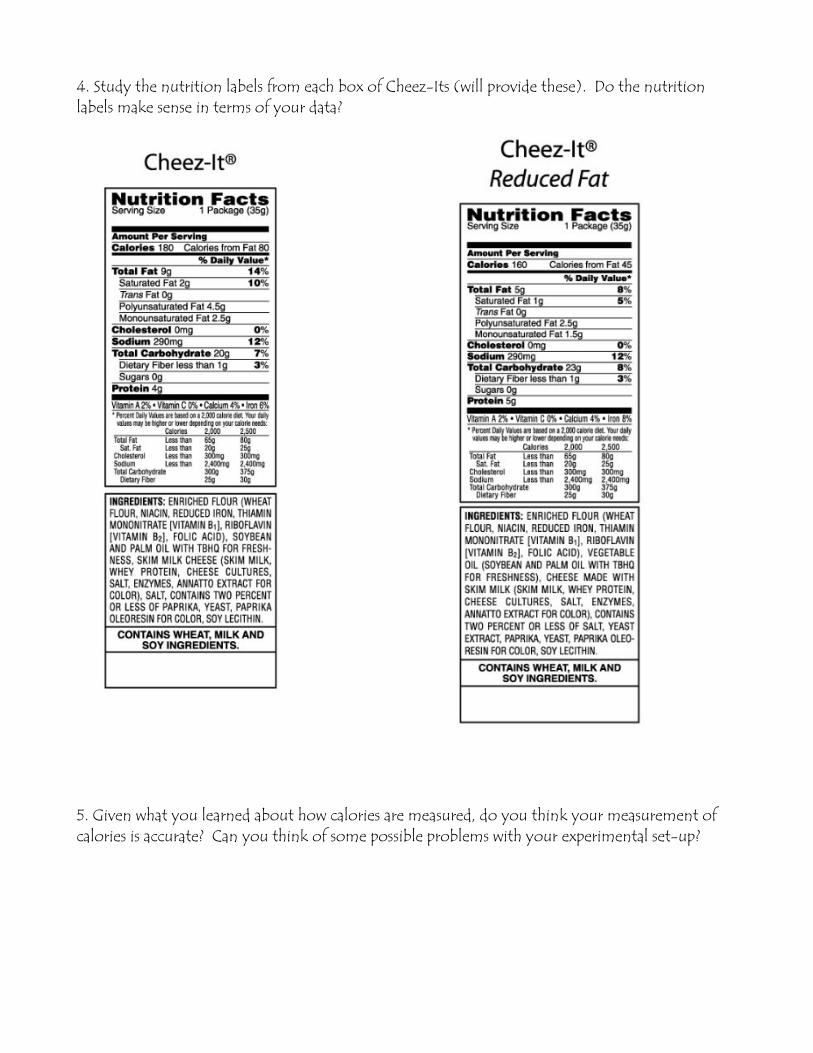
4. Study the nutrition labels from each box of Cheez-Its (will provide these). Do the nutrition labels make sense in terms of your data?
5. Given what you learned about how calories are measured, do you think your measurement of calories is accurate? Can you think of some possible problems with your experimental set-up?
Science Topics – Food Science
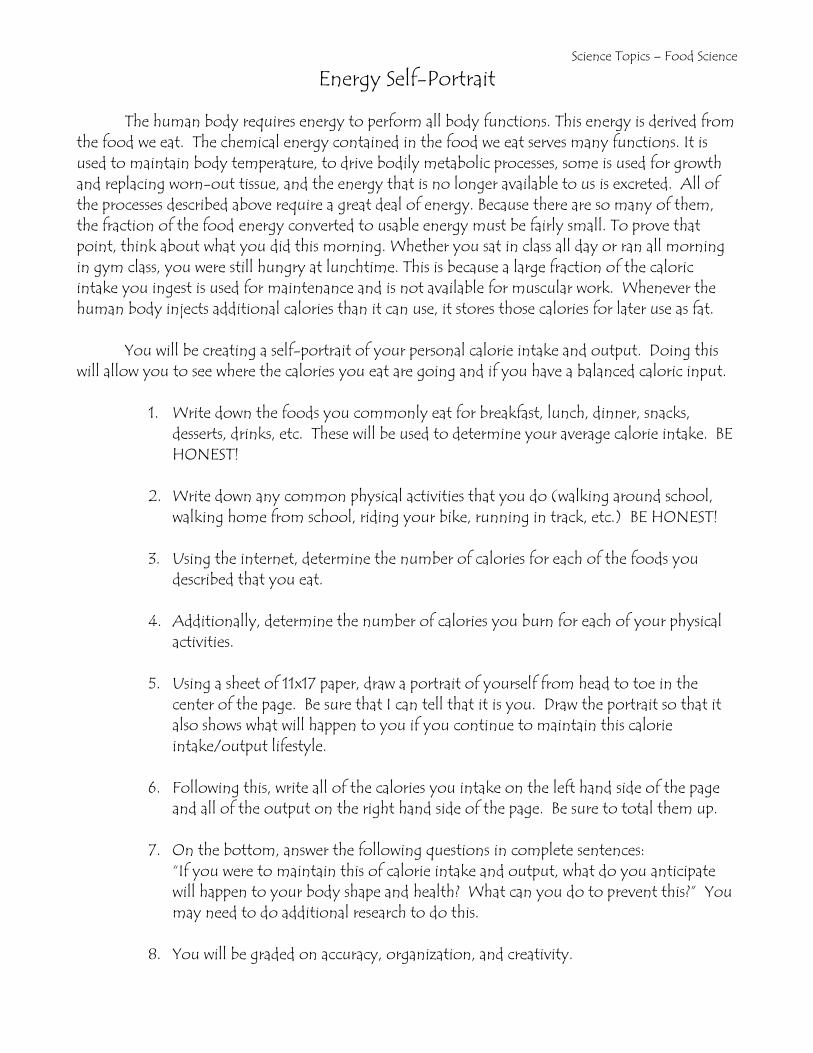
Energy Self-Portrait
The human body requires energy to perform all body functions. This energy is derived from the food we eat. The chemical energy contained in the food we eat serves many functions. It is used to maintain body temperature, to drive bodily metabolic processes, some is used for growth and replacing worn-out tissue, and the energy that is no longer available to us is excreted. All of the processes described above require a great deal of energy. Because there are so many of them, the fraction of the food energy converted to usable energy must be fairly small. To prove that point, think about what you did this morning. Whether you sat in class all day or ran all morning in gym class, you were still hungry at lunchtime. This is because a large fraction of the caloric intake you ingest is used for maintenance and is not available for muscular work. Whenever the human body injects additional calories than it can use, it stores those calories for later use as fat.
You will be creating a self-portrait of your personal calorie intake and output. Doing this
will allow you to see where the calories you eat are going and if you have a balanced caloric input.
1. Write down the foods you commonly eat for breakfast, lunch, dinner, snacks, desserts, drinks, etc. These will be used to determine your average calorie intake. BE HONEST!
2. Write down any common physical activities that you do (walking around school,
walking home from school, riding your bike, running in track, etc.) BE HONEST!
3. Using the internet, determine the number of calories for each of the foods you described that you eat.
4. Additionally, determine the number of calories you burn for each of your physical
activities.
5. Using a sheet of 11x17 paper, draw a portrait of yourself from head to toe in the center of the page. Be sure that I can tell that it is you. Draw the portrait so that it also shows what will happen to you if you continue to maintain this calorie intake/output lifestyle.
6. Following this, write all of the calories you intake on the left hand side of the page
and all of the output on the right hand side of the page. Be sure to total them up.
7. On the bottom, answer the following questions in complete sentences: “If you were to maintain this of calorie intake and output, what do you anticipate will happen to your body shape and health? What can you do to prevent this?” You may need to do additional research to do this.
8. You will be graded on accuracy, organization, and creativity.
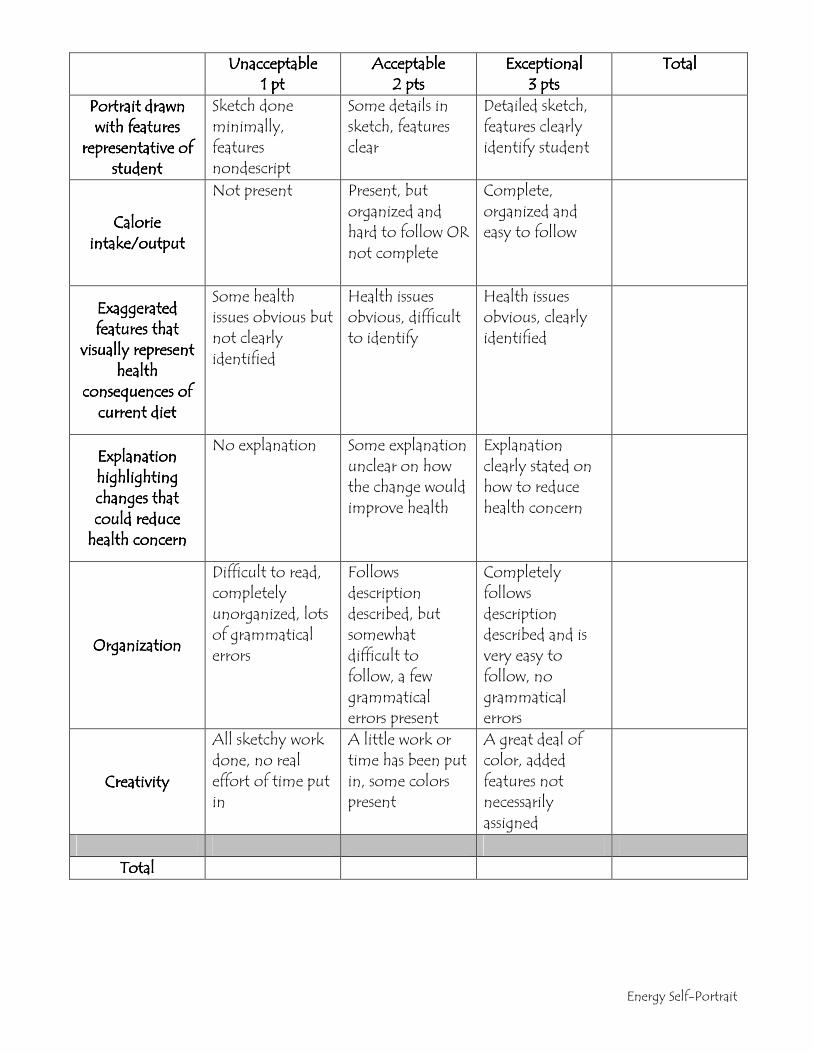
Energy Self-Portrait
UnacceptableUnacceptableUnacceptableUnacceptable 1 pt1 pt1 pt1 pt
AcceptableAcceptableAcceptableAcceptable 2 pts2 pts2 pts2 pts
ExceptionalExceptionalExceptionalExceptional 3 pts3 pts3 pts3 pts
TotalTotalTotalTotal
PortrPortrPortrPortrait drawn ait drawn ait drawn ait drawn with features with features with features with features
representative of representative of representative of representative of studentstudentstudentstudent
Sketch done minimally, features nondescript
Some details in sketch, features clear
Detailed sketch, features clearly identify student
Calorie Calorie Calorie Calorie intake/outputintake/outputintake/outputintake/output
Not present Present, but organized and hard to follow OR not complete
Complete, organized and easy to follow
Exaggerated Exaggerated Exaggerated Exaggerated features that features that features that features that
visually represent visually represent visually represent visually represent health health health health
consequences of consequences of consequences of consequences of current dietcurrent dietcurrent dietcurrent diet
Some health issues obvious but not clearly identified
Health issues obvious, difficult to identify
Health issues obvious, clearly identified
Explanation Explanation Explanation Explanation highlighting highlighting highlighting highlighting changes that changes that changes that changes that could reduce could reduce could reduce could reduce
health concernhealth concernhealth concernhealth concern
No explanation Some explanation unclear on how the change would improve health
Explanation clearly stated on how to reduce health concern
OrganizationOrganizationOrganizationOrganization
Difficult to read, completely unorganized, lots of grammatical errors
Follows description described, but somewhat difficult to follow, a few grammatical errors present
Completely follows description described and is very easy to follow, no grammatical errors
CCCCreativityreativityreativityreativity
All sketchy work done, no real effort of time put in
A little work or time has been put in, some colors present
A great deal of color, added features not necessarily assigned
TotalTotalTotalTotal