Embed Size (px)
Citation preview

Wednesday, November 16
Last Time:– Reading binary phase diagrams – Lever rule– Non-ideal systems & models– Regular solution and miscibility gaps– Eutectic phase diagrams
Reminders:• Online course evaluations
Handouts: Practice problems
Readings:
Today:– Eutectic phase diagrams: a closer look– Some other interesting phase diagrams– Some examples
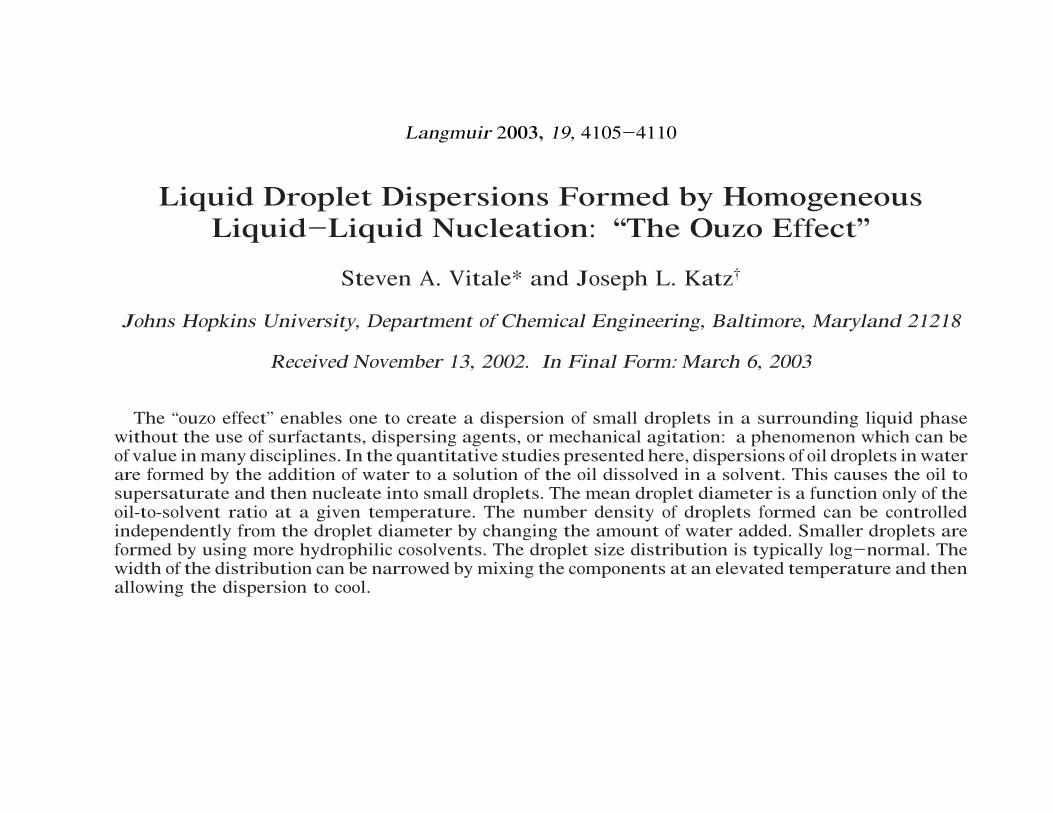
Liquid Droplet Dispersions Formed by HomogeneousLiquid-Liquid Nucleation: “The Ouzo Effect”
Steven A. Vitale* and Joseph L. Katz†
Johns Hopkins University, Department of Chemical Engineering, Baltimore, Maryland 21218
Received November 13, 2002. In Final Form: March 6, 2003
The “ouzo effect” enables one to create a dispersion of small droplets in a surrounding liquid phasewithout the use of surfactants, dispersing agents, or mechanical agitation: a phenomenon which can beof value inmany disciplines. In the quantitative studies presented here, dispersions of oil droplets inwaterare formed by the addition of water to a solution of the oil dissolved in a solvent. This causes the oil tosupersaturate and then nucleate into small droplets. The mean droplet diameter is a function only of theoil-to-solvent ratio at a given temperature. The number density of droplets formed can be controlledindependently from the droplet diameter by changing the amount of water added. Smaller droplets areformed by using more hydrophilic cosolvents. The droplet size distribution is typically log-normal. Thewidth of the distribution can be narrowed by mixing the components at an elevated temperature and thenallowing the dispersion to cool.
1. Introduction
When water is added to ouzo, an alcoholic beveragecommon in Greece and other Mediterranean countries,theanise oil dissolved in the ouzo spontaneouslynucleatesinto many small droplets. These small droplets scatterlight, causing the drink to appearmilky white. This effectis a basic physical phenomenon which occurs in liquidsystems involving threeormore components.Thesimplestcase to study is a ternary liquid system, such as the ouzoexample. When water is added to a dilute binary solutionof a solute whose solubility in water is very small (e.g.,anise oil) in a solvent (e.g., ethanol), most of the solutewill rapidly come out of solution. For certain proportionsof solute, solvent, andwater, a relatively stable dispersionof very small solute droplets is formed.Note that the thirdcomponent need not be water; any substance which ismiscible with the solvent but not the solute will producea two-phase dispersion. The authors have termed thisprocess of creating metastable liquid-liquid dispersions“the ouzo effect”.
There have been numerous previous studies by otherresearchersonthe formationofdropletdispersions, severalofwhichare discussed below.Thephenomenonpresentedhere is distinct fromthose of other publications ondropletdispersions, because the ouzo effect allows one to createrelatively stable droplet dispersions, without the use ofsurfactants, stabilizers, or any form of mechanical agita-tion. The authors will show that the mean droplet size,size distribution, and number density are controllable(over a limited range) by varying the proportions of thethree components, their densities, theirmutual solubility,and the temperature. The trends in droplet size, distribu-tion, and number density are explained qualitatively onthe basis of the fact that the droplets are formed byhomogeneous liquid-liquid nucleation.
2. Background of the Ouzo Effect
Figure 1 is a right triangle, three-component, phasediagram which shows the concentration of a solute on the
abscissaand the concentrationofasolventontheordinate.The concentration of the third component (e.g., water) isfound by difference. On this diagram, one can trace outthe binodal (or miscibility-limit curve) and the spinodal(or stability-limit curve). The binodal on a phase diagramtraces the thermodynamicminima in theGibbs freeenergyofasystemasa functionof temperatureorofmole fraction.The spinodal traces the limit of thermodynamic stability.It is possible for a system to exist for a very long time instates between the spinodal and the binodal, that is, a“state” for which the Gibbs free energy is not minimized,if there are large kinetic barriers to the phase separation.The set of all such nonequilibrium but very long-lived“states” is called “the metastable region”. Superheatedliquidsarea commonexampleof single componentsystemsin this state. If a single-phase multicomponent solutionexisting in themetastable region is sufficiently perturbed,
* To whom correspondence should be addressed. Current affili-ation: Texas Instruments, Dallas, TX 75265. E-mail: [email protected].
† E-mail: [email protected].
Figure 1. Right triangle three-component phase diagram atconstant temperature and pressure. The ouzo effect occurs forsolutionsbrought fromtheone-phase region into themetastableregion between the binodal and spinodal curves.
4105Langmuir 2003, 19, 4105-4110
10.1021/la026842o CCC: $25.00 © 2003 American Chemical SocietyPublished on Web 04/05/2003

Chemical Composition of Vintage Preban Absinthewith Special Reference to Thujone, Fenchone,
Pinocamphone, Methanol, Copper, and AntimonyConcentrations
DIRK W. LACHENMEIER,†,* DAVID NATHAN-MAISTER,‡ THEODORE A. BREAUX,§
EVA-MARIA SOHNIUS,† KERSTIN SCHOEBERL,† AND THOMAS KUBALLA†
Chemisches und Veterinäruntersuchungsamt (CVUA) Karlsruhe, Weissenburger Strasse 3,D-76187 Karlsruhe, Germany, Oxygenee Ltd., 22 Baylis Crescent, Burgess Hill RH15 8UP,
United Kingdom, and Jade Liqueurs, LLC, 3588 Brookfield Road, Birmingham, Alabama 35226
Thirteen samples of authentic absinthe dating from the preban era (i.e., prior to 1915) were analyzedfor parameters that were hypothesized as contributing to the toxicity of the spirit, including naturallyoccurring herbal essences (thujone, pinocamphone, fenchone), methanol, higher alcohols, copper,and antimony. The total thujone content of preban absinthe was found to range between 0.5 and48.3 mg/L, with an average concentration of 25.4 ( 20.3 mg/L and a median concentration of 33.3mg/L. The authors conclude that the thujone concentration of preban absinthe was generallyoverestimated in the past. The analysis of postban (1915–1988) and modern commercial absinthes(2003–2006) showed that the encompassed thujone ranges of all absinthes are quite similar, disprovingthe supposition that a fundamental difference exists between preban and modern absinthesmanufactured according to historical recipes. Analyses of pinocamphone, fenchone, base spirits,copper, and antimony were inconspicuous. All things considered, nothing besides ethanol was foundin the absinthes that was able to explain the syndrome “absinthism”.
KEYWORDS: Absinthe; thujone; fenchone; pinocamphone; Artemisia absinthium L.; wormwood; copper;antimony; higher alcohols
INTRODUCTION
The composition, and in particular the thujone content, ofabsinthe manufactured in the so-called “preban” era (the periodof time that ranges from ca. 1805 until the banning of absinthein France, in 1915) is a matter of debate, a debate that has beenbedeviled by the uncritical repetition of figures derived fromtheoretical calculations from secondary sources, not actualchemical analysis of samples from the era (1–4).
Thujone is a natural essence typically associated withcommon wormwood (Artemisia absinthium L.) and Romanwormwood (Artemisia pontica L.), which are together two ofabsinthe’s most widely used ingredients, besides green anise(Pimpinella anisum L.), hyssop (Hyssopus officinalis L.), lemonbalm (Melissa officinalis L.), and Florence fennel (FoeniculumVulgare Mill.). Thujone (!-thujone in particular) is an epilep-tiform convulsant and is widely regarded as the “active”ingredient in absinthe (5, 6). It is certainly at the root ofabsinthe’s reputation as being more drug than drink. In
evaluating the validity of the extensive 19th and early 20thcentury scientific literature on the deleterious effects of absinthe,and its possible relevance to the public health issues related tomodern absinthe (manufactured after its legalization in theEuropean Union (EU) in 1988), a critical variable is the thujoneconcentration of preban or vintage absinthe. In other words, itremains to be determined if modern absinthes made frompublished 19th century recipes are chemically similar to thoseactually made by the large commercial manufacturers of thepreban era. A thorough review of the extensive peer-reviewedliterature shows, extraordinarily, only one actual test of a prebanabsinthe sample by Hutton (7). Other authors generally useassumed figures based on theoretical calculations or the analysisof samples from the ‘postban’ era (i.e., the decades that followedthe 1915 ban on absinthe production in France). Of particularlyprofound influence was a paper by Strang et al. (8), whichclaimed a figure of 260 mg/L as being representative of thethujone concentration in preban absinthe. Although this figurewas not based, by the author’s own admission, upon actualchemical analyses (and in fact the theoretical basis on which itwas derived is not completely clear), it has been uncriticallyquoted dozens of times since and has become for many authorsthe “conventional wisdom”. Most recently for example, Huisman
* Corresponding author. Tel.: +49-721-926-5434. Fax: +49-721-926-5539. E-mail: [email protected].
† CVUA Karlsruhe.‡ Oxygenee Ltd.§ Jade Liqueurs, LLC.
J. Agric. Food Chem. 2008, 56, 3073–3081 3073
10.1021/jf703568f CCC: $40.75 © 2008 American Chemical SocietyPublished on Web 04/18/2008

T = 600 T = 500 T = 450
T = 350 T = 250 T = 150
Ω= 2000

Ω= 2000

Binary Solid-Liquid Phase Diagram
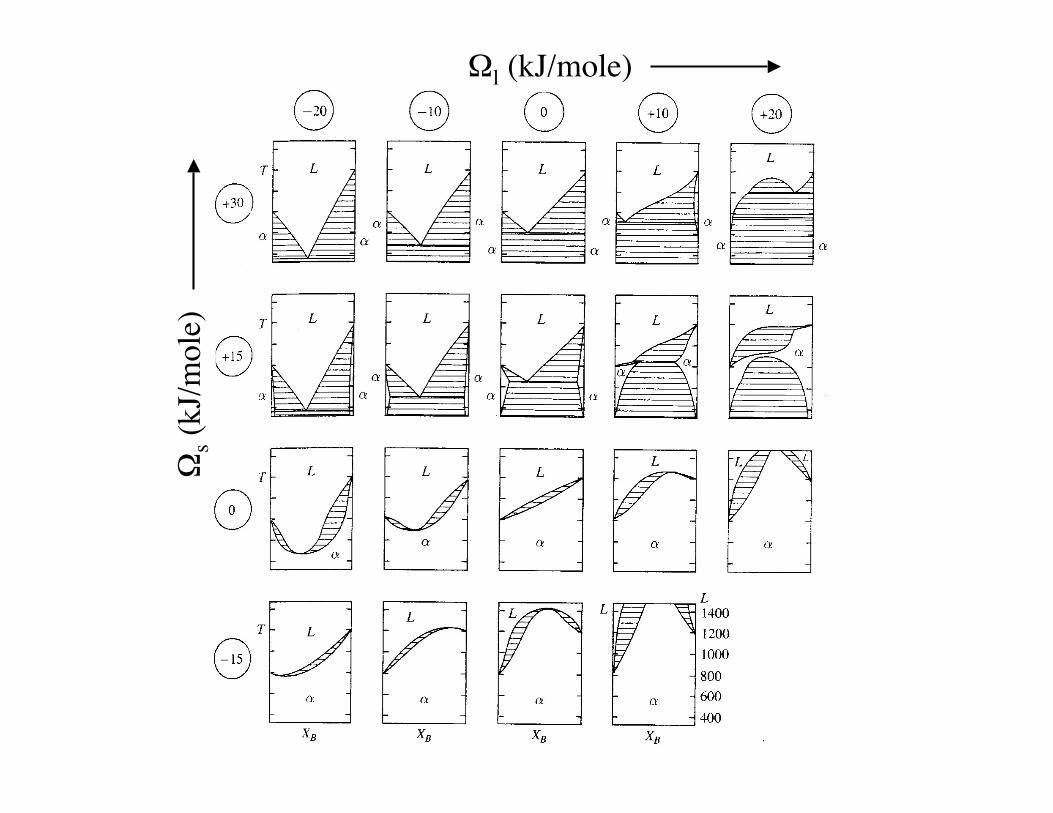
Ωs
(kJ/
mole
)
Ωl (kJ/mole)

=Solid solution
Ag with some Cu
=Solid solution
Cu with some Ag
Binary Eutectic
L → α + βLiquid

Liquid + ice
All liquid
ice + glycol(All Solid)
L + solid glycolP=2
P=1
P=2
P=2 “slush”
“slush”
Ethylene Glycol and Water (Anti-freeze)
Eutectic68 vol% glycol
T = -69°C = -92°FPure water
Pure glycol


Fe-”C”Phase Diagram
Eutectic