Embed Size (px)
Citation preview

ORNL/TM-2014/338
Weatherization Works - Summary of
Findings from the Retrospective Evaluation
of the U.S. Department of Energy’s
Weatherization Assistance Program
Bruce Tonn David Carroll Scott Pigg Michael Blasnik Greg Dalhoff Jacqueline Berger Erin Rose Beth Hawkins Joel Eisenberg Ferit Ucar Ingo Bensch Claire Cowan
September 2014

DOCUMENT AVAILABILITY
Reports produced after January 1, 1996, are generally available free via US Department of Energy (DOE) SciTech Connect. Website http://www.osti.gov/scitech/ Reports produced before January 1, 1996, may be purchased by members of the public from the following source: National Technical Information Service 5285 Port Royal Road Springfield, VA 22161 Telephone 703-605-6000 (1-800-553-6847) TDD 703-487-4639 Fax 703-605-6900 E-mail [email protected] Website http://www.ntis.gov/help/ordermethods.aspx Reports are available to DOE employees, DOE contractors, Energy Technology Data Exchange representatives, and International Nuclear Information System representatives from the following source: Office of Scientific and Technical Information PO Box 62 Oak Ridge, TN 37831 Telephone 865-576-8401 Fax 865-576-5728 E-mail [email protected] Website http://www.osti.gov/contact.html
This report was prepared as an account of work sponsored by an agency of the United States Government. Neither the United States Government nor any agency thereof, nor any of their employees, makes any warranty, express or implied, or assumes any legal liability or responsibility for the accuracy, completeness, or usefulness of any information, apparatus, product, or process disclosed, or represents that its use would not infringe privately owned rights. Reference herein to any specific commercial product, process, or service by trade name, trademark, manufacturer, or otherwise, does not necessarily constitute or imply its endorsement, recommendation, or favoring by the United States Government or any agency thereof. The views and opinions of authors expressed herein do not necessarily state or reflect those of the United States Government or any agency thereof.
ORNL/TM-2014/338
Environmental Sciences Division
WEATHERIZATION WORKS – SUMMARY OF FINDINGS FROM THE
RETROSPECTIVE EVALUATION OF THE U.S. DEPARTMENT OF
ENERGY’S WEATHERIZATION ASSISTANCE PROGRAM
Bruce Tonn, Oak Ridge National Laboratory
David Carroll, APPRISE Inc.
Scott Pigg, Energy Center of Wisconsin
Michael Blasnik, Google
Greg Dalhoff, Dalhoff & Associates
Jacqueline Berger, APPRISE Inc.
Erin Rose, Oak Ridge National Laboratory
Beth Hawkins, Oak Ridge National Laboratory
Joel Eisenberg, Oak Ridge National Laboratory
Ferit Ucar, APPRISE Inc.
Ingo Bensch, Energy Center of Wisconsin
Claire Cowan, Energy Center of Wisconsin
September 2014
Prepared by
OAK RIDGE NATIONAL LABORATORY
Oak Ridge, Tennessee 37831-6283
managed by
UT-BATTELLE, LLC
for the
US DEPARTMENT OF ENERGY
under contract DE-AC05-00OR22725

iii
CONTENTS
Page
LIST OF FIGURES ...................................................................................................................................... v LIST OF TABLES ...................................................................................................................................... vii ACRONYMS AND ABBREVIATIONS .................................................................................................... ix ACKNOWLEDGMENTS ........................................................................................................................... xi EXECUTIVE SUMMARY ....................................................................................................................... xiii 1. INTRODUCTION ................................................................................................................................ 1 2. OVERVIEW OF THE WEATHERIZATION ASSISTANCE PROGRAM ........................................ 3
2.1 PROGRAM CHARACTERIZATION ....................................................................................... 3 2.2 CHARACTERIZATION OF HOMES WEATHERIZED IN PY2008 ...................................... 6 2.3 CHARACTERIZATION OF CLIENTS IN PY2008 ................................................................. 8 2.3 SUMMARY ................................................................................................................................ 9
3. ENERGY SAVINGS, NON-ENERGY BENEFITS AND COST EFFECTIVENESS...................... 11 3.1 ENERGY SAVINGS ................................................................................................................ 11 3.2 NO REBOUND EFFECT ......................................................................................................... 15 3.3 ENERGY COST SAVINGS ..................................................................................................... 16 3.4 NON-ENERGY BENEFITS ..................................................................................................... 18
3.1.1 Environmental Benefits ............................................................................................... 19 3.1.2 Macroeconomic Benefits ............................................................................................. 21 3.1.3 Health and Household-Related Benefits ...................................................................... 22
3.5 COST-EFFECTIVENESS ........................................................................................................ 28 3.5.1 Measure Costs and Energy Savings Only .................................................................... 28 3.5.2 Total Costs and Benefits .............................................................................................. 30
3.6 COST EFFECTIVENESS: COMPARISON OF APPROACHES .............................................. 31 3.7 SUMMARY ................................................................................................................................. 33
4. PROCESS EVALUATION AND FIELD STUDIES ......................................................................... 35 4.1 PROGRAM COMPLEXITY .................................................................................................... 35 4.2 PROGRAM TRAINING........................................................................................................... 37 4.3 PROCESS FIELD STUDY ....................................................................................................... 39 4.4 PERFORMANCE STUDY ....................................................................................................... 41 4.5 INDOOR ENVIRONMENTAL QUALITY ............................................................................. 43
4.5.1 Carbon Monoxide Production by Combustion Appliances ......................................... 44 4.5.2 Indoor Ambient Carbon Monoxide Levels .................................................................. 44 4.5.3 Radon ........................................................................................................................... 45 4.5.4 Formaldehyde .............................................................................................................. 46 4.5.5 Humidity and Moisture ................................................................................................ 46
4.6 PROGRAM SATISFACTION ................................................................................................. 47 4.6.1 Client Satisfaction Survey ............................................................................................ 47 4.6.2 Weatherization Staff Satisfaction................................................................................. 48
4.7 SUMMARY .............................................................................................................................. 49 5. WEATHERIZATION “BEYOND THE NUMBERS” ...................................................................... 51
5.1 LOCAL WEATHERIZATION OPERATIONAL PHILOSOPHIES ....................................... 52 5.2 OTHER OBSERVATIONS ...................................................................................................... 57
6. ISSUES MOVING FORWARD ......................................................................................................... 59 6.1 PROGRAM OPERATIONS ..................................................................................................... 59 6.2 HEALTH & SAFETY .............................................................................................................. 59 6.3 ROLE OF WEATHERIZATION IN THE HOME RETROFIT MARKETPLACE ................ 59

iv
6.4. FOCUS ON THE FUTURE ...................................................................................................... 60 6.5 SUMMARY .............................................................................................................................. 64
7. CONCLUSIONS ................................................................................................................................ 65 REFERENCES ........................................................................................................................................... 67 APPENDIX A. SUMMARY OF RETROSPECTIVE EVALUATION DATA COLLECTION
ACTIVITIES ........................................................................................................................................ 1

v
LIST OF FIGURES
Figure Page
Figure 2.1. Funding Leveraged for Low-Income Weatherization in PY 2008 Given Directly to
Grantees and Subgrantees (millions $) ................................................................................................. 4 Figure 2.2. Leveraging Patterns Among Local Weatherization Agencies (PY 2008) .................................. 5 Figure 2.3. The Weatherization Process ....................................................................................................... 6 Figure 2.4. Climate Zone Designations ........................................................................................................ 7 Figure 2.5. Frequency of Measures Installed in Homes in PY2008 ............................................................. 8 Figure 3.1. Average Percent Energy Savings by Home Type (Single Family, Mobile Home, Small
Multifamily), Climate Zone, and Heating Fuel Type for PY 2008 ..................................................... 13 Figure 3.2. Average Percent Energy Savings by Number of Major Measures Installed by Home and
Heating Fuel Type for PY 2008 .......................................................................................................... 15 Figure 3.3. Framework for Understanding Non-Energy Benefits ............................................................... 19 Figure 3.4. Present Value of Environmental Emissions by House and Emission Type for PY 2008 ......... 21 Figure 3.5. Potential Impacts of Weatherization on Household Disposable Income .................................. 26 Figure 3.6. Cost Effectiveness by Climate Zone, Funding Source and Number of Measures Installed
for PY 2008 (2008 dollars) ................................................................................................................. 29 Figure 4.1. Complexity of the Weatherization Knowledge Base ................................................................ 36 Figure 5.1 Mission Statement on a Lewiston Community Action Partnership Truck ................................ 53 Figure 5.2 The Flooding of the Souris River in Minot, summer 2011. ....................................................... 53 Figure 5.3. COAD Training center ............................................................................................................. 55 Figure 5.4. “Belly burrito” Insulation Roll ................................................................................................. 56 Figure 5.5. Lindsay Park Development ...................................................................................................... 56 Figure 6.1. Social Security Incomes as a Percentage of Family Income .................................................... 62


vii
LIST OF TABLES
Table Page
Table 3.1. Total Estimated Annual Energy Savings by Housing Type PY 2008 ....................................... 12 Table 3.2. Comparison of PY2008 Energy Savings to Historical PY 1989 Energy Savings for
Single Family Homes .............................................................................................................. 13 Table 3.3. Percent Total Energy Savings Natural Gas Heated Homes by Measure.................................... 14 Table 3.4. Average Percent Energy Savings in LMF Buildings in New York City ................................... 15 Table 3.5. Single Family Site-Built Homes-Energy Costs and Cost Savings by Main Heating Fuel ......... 16 (2013 Dollars) ............................................................................................................................................. 16 Table 3.6. Mobile Homes-Energy Costs and Cost Savings by Main Heating Fuel .................................... 17 (2013 Dollars) ............................................................................................................................................. 17 Table 3.7. Percent of Households Experience Energy Bill-Related Affordability Problems ..................... 18 Table 3.8. Summary of WAP Household Heating and Cooling System Findings (% of Homes) .............. 23 Table 3.9. Present Value of Per Unit and WAP Program Health-Related Benefits of Weatherization ...... 27 Table 3.10. Energy Cost Savings, Efficiency Measure Costs, and Cost-Effectiveness by Building
and Fuel Type (2013 Dollars).................................................................................................. 28 Table 3.11. Cost Effectiveness by Fuel Type per Housing Type (2013 dollars) ........................................ 30 Table 3.12. Total Benefits and Costs for WAP PY2008 (2013 Dollars) .................................................... 31 Table 3.13. Total (Program) Benefits and Costs for WAP PY 2008: Comparison of Approaches ............ 32 Table 3.12. Single Family Benefits and Costs for WAP PY 2008: Comparison of Approaches................ 32 Table 4.1. Formal Training Attendance in Last Five Years ........................................................................ 38 Table 4.2. National Professional Certifications Received .......................................................................... 39 Table 4.3. Summary of Findings from the Field Process Study ................................................................. 40 Table 4.4. Diagnostic Procedures Used by Weatherization Auditors ......................................................... 41 Table 4.5. Post-weatherization Inspections Performed by Grantees and Subgrantees in PY2008 ............. 41 Table 4.10. Overall Client Satisfaction with the Weatherization Program ................................................. 48 Table 4.11. Summary of Job Satisfaction Ratings of Very Satisfactory or Satisfactory ............................ 48 49 Table 5.1. Case Studies ............................................................................................................................... 52 Table 6.1. Forecasted Energy Prices in 2011($) per Unit* ......................................................................... 64 Table 6.2. Trends in the Efficiency of Selected Residential Energy End-Use Technologies ..................... 64 Table A.1. Major Data Collection Activities ............................................................................................ A-3 Table A.2. Field Study Data Collection Activities ................................................................................... A-4

ix
ACRONYMS AND ABBREVIATIONS
ARRA American Recovery and Reinvestment Act
ASHRAE American Society of Heating, Refrigerating and Air Conditioning Engineers
BPI Building Performance Institute
CO2 Carbon dioxide
CO Carbon monoxide
DOE Department of Energy
ECM Energy conservation measure
EPA Environmental Protection Agency
F Fahrenheit degrees
HERS Home Energy Rating System
HHD Household
HVAC Heating, ventilation and air conditioning
IEQ Indoor environmental quality
KWH Kilowatt hours
LBNL Lawrence Berkeley National Laboratory
LEED Leadership in Energy & Environmental Design
LIHEAP Low Income Home Energy Assistance Program
LMF Large multifamily building
MH Mobile home
MMBTU Million British Thermal Units
NASCSP National Association of State & Community Service Programs
NG Natural gas
NCAF National Community Action Foundation
NOAA National Oceanic and Atmospheric Administration
NOX Nitrogen oxide
NRC National Research Council
NYC New York City
O2 Oxygen
OMB Office of Management and Budget
ORNL Oak Ridge National Laboratory
OSHA
OWIP
Occupational Safety and Health Administration
Office of Weatherization and Intergovernmental Programs
PIPP Percentage of income payment program
PM Particulate matter
pCi/l Pico-Curies per liter
ppb Parts per billion
ppm Parts per million
PSU Primary sampling unit
PUMA Public Use Microdata Area
PY Program Year
SERC Sustainable Energy Resources for Consumers Program
SF Single family
SIR Savings-to-investment ratio
SMF Small multifamily
SOx Sulfur oxide
T&TA Training and technical assistance
THERM 100,000 British Thermal Units
VOCS Volatile organic compounds

x
WAP Weatherization Assistance Program
WHO World Health Organization

xi
ACKNOWLEDGMENTS
The work presented in this report was funded by the U.S. Department of Energy’s (DOE) Office of
Weatherization and Intergovernmental Programs (OWIP).
Numerous individuals beyond the lengthy list of authors of this summary report contributed to the
retrospective evaluation of DOE’s Weatherization Assistance Program. Others who are listed as co-
authors of the various retrospective evaluation reports include: Brian Conlon, Dan Cautley, Ashleigh
Keene, Karen Loski, Andy Mendyk, Terry Brennan, Paul Francisco, Tim Lenahan, Daya Bill Johnson,
Carolyn Miller, Colleen Driscoll, Chisoo Kim, Lauren Ashcraft, Mark Burton, Inga Treitler, Judith
Gregory, Amanda Rose, and Phillip Schilling. We also thank Nick Sayen for his tireless work in
arranging for radon remediation of homes that participated in the Indoor Environmental Quality study.
Additional thanks are due to:
The Grantees and Subgrantees that filled out the program implementation surveys
The subset of Subgrantees that provided measure installation and utility information
The utility companies that provided the billing histories
The household members that participated in the national occupant survey
The weatherization staff and trainees that participated in our surveys
The survey specialists that patiently worked with all of the above to collect high quality data
The numerous technicians that worked on the in-field IEQ, bulk fuels, ventilation, and
performance study studies
The weatherization experts and social scientists that went into the field to observe weatherization
in action
The local weatherization program staff and residents that contributed their time to the case studies
effort
We would also like to thank the members of a peer review panel for their inputs on this summary study
and on various other retrospective evaluation reports: Paul DeCotis, H. Gil Peach, Ed Vine, John Reed,
Bobbie Tannenbaum, Lori Lewis, and Phil Degens. Along these lines, our appreciation is extended to the
ORNL, DOE and SMS staff that provided comments on draft versions of this and other retrospective
evaluation reports. Lastly, we thank Jenni Craddick and Meg Eady for handling contracting, finances, and
meeting responsibilities and Leslie Lauder, Tracy Clem, Roxanne Raschke and Lana McDonald, for their
help in preparing the retrospective reports for publication.


xiii
EXECUTIVE SUMMARY
In April 2009, the U.S. Department of Energy (DOE) tasked Oak Ridge National Laboratory with
conducting an evaluation of DOE’s low-income Weatherization Assistance Program (WAP). This
directive came at the same time that the American Recovery and Reinvestment Act of 2009 was passed.
The Recovery Act boosted WAP’s funding from approximately $225M per year to $5B over a three year
period. It was decided at that time to evaluate WAP as it was administered both before and during the
Recovery Act period. The former is known as the ‘retrospective’ evaluation of WAP and focuses on
Program Year (PY) 2008. This report summarizes findings from the twenty individual studies that
comprise the retrospective evaluation.1
Through WAP, DOE provides grants to states, territories, and Washington, DC (i.e. Grantees) to fund the
weatherization of low-income homes. The Grantees provide grants to local weatherization agencies (also
known as Subgrantees) to deliver weatherization services. Grantees and Subgrantees also leverage their
DOE funds to acquire additional funds for low-income weatherization. Subgrantees accept applications
for weatherization, confirm households’ income eligibility for the program, conduct energy audits of the
homes, install weatherization measures, and inspect each home post-weatherization. Common
weatherization measures include: air sealing, wall and attic insulation, duct sealing, and furnace repair
and replacement. The program operates across all climate zones in the United States, and weatherizes all
manner of homes, from single family detached units to mobile homes to large multifamily buildings.
The retrospective evaluation concentrated on estimating program impacts (e.g., energy savings) and on
assessing program administration. To accomplish these tasks, the retrospective evaluation collected a
great deal of data, including:
Housing characteristics and weatherization measures installed in ~20,000 single family and
mobile homes
Building characteristics and weatherization measures installed in ~10,000 multifamily building
units and detailed data on over 100 large multifamily buildings weatherized in New York City
Fuel type and basic occupant characteristics for ~20,000 homes
Electricity and natural gas billing histories for ~8,000 weatherized and comparison homes
collected from over 1000 natural gas and electric utilities
Program implementation survey data from 50+ Grantees and ~900 Subgrantees
Demographic, health-related, energy use behavior, and client satisfaction survey data from ~1400
households (treatment plus comparison group homes)
Demographic and career-related survey data from ~600 weatherization auditors, crew leaders,
crew members
Indoor environmental quality data measurements (CO, radon, formaldehyde, humidity and
temperature) pre- and post-weatherization for a national sample of ~500 treatment and control
group homes and radon measurements post-weatherization in ~18 homes that received ventilation
packages meeting ASHRAE 62.2 standards
1 A similar summary report will be prepared for the Recovery Act Period WAP evaluation. All reports will be posted at
http://weatherization.ornl.gov

xiv
Detailed in-field observations of ~450 weatherization audits, measure installation processes, and
final inspections conducted by 19 Subgrantees around the country
In-field assessments of 105 homes weatherized in 2008 that appeared to save much more or much
less energy than expected from modeling analyses
Materials and interview notes to prepare 14 in-depth case studies of high-performing and unique
local weatherization agencies
Training experiences and career path expectations from a survey of over 800 individuals who
received training at DOE weatherization training centers
In PY 2008, the impact component of the retrospective evaluation found that:
Approximately 35 million households were eligible for WAP in PY 2008
WAP funds supported the weatherization of 97,965 units in PY 2008: 59% single family site
built, 18% mobile home, 5% small multifamily, and 18% large multifamily
DOE expenditures on WAP were $236,000,000; including leveraged funding, the total
expenditures on units weatherized were $481,000,000. The total spent by the national
weatherization network in PY 2008 for weatherization was $850,000,000
The average cost to weatherize a unit was $4,695 (the DOE share was 48%)
WAP and leveraged expenditures supported directly and indirectly 8,500 jobs and increased
national economic output by $1.2 billion
The estimated first year program energy savings is 2,270,000 MMBtus.2 This is equivalent to
nearly 400,000 barrels of oil.
Site built homes averaged 29.3 MMBtus of savings in the first year3
Households appeared not to take-back energy savings post-weatherization
Large variations in energy savings are more influenced by changes in occupant behaviors and
changes in primary heating fuel and use of secondary heating sources than by work quality issues
The net present value of the program energy cost savings in 2013 dollars is $420,000,000 and the
net present value per unit weatherized is $4,890, $340,000,000 and $4243 in 2008 dollars.
78% of these savings accrued to households and 22% to rate payers of utilities that have
Percentage of Income Payment Programs
Carbon emissions were reduced by 2,246,000 metric tons4; criteria pollutants by 5,271 short tons
2 This is a conservative estimate as it only includes about one-third of the units weatherized in large multifamily buildings in PY
2008, those in New York City. 3 For comparison purposes, WAP saved an average of 17.6 MMBtus of energy in site built homes in PY 1989. 4 This about the amount of carbon emitted by 600,000 average automobiles in the US.

xv
The net present value of the environmental emissions benefits is $252,000,000; the net present
value per weatherized unit is $2,932; a water savings benefit is $186 per unit for a total benefit of
$14,000,0000
Weatherization effectively deals with CO issues found in homes, and increases formaldehyde in
mobile homes and radon levels in site built homes located in high radon areas of the country
Ventilation installed according to ASHRAE5 62.2 guidelines may reduce radon levels in
weatherized homes
The surveyed households reported that post-weatherization: their homes were less drafty: the
general health of the household members improved; respondents suffered fewer asthma
symptoms; their homes were less infested with pests; there were fewer instances of thermal stress;
and respondents missed fewer days of work
The present value of a limited set household health and home-related non-energy benefits for the
WAP is approximately $1,137,000,000; the present value per single family and mobile home is
$14,148
The process component of the evaluation found that:
There is a richness and diversity in how local weatherization programs are organized and
operated across the country, by crew (in-house vs. contractor), energy audits (computerized vs.
priority lists), context (urban vs. rural impacts job scheduling)
Weatherization is complex, involving over 100 different categories of work and over 800
different actions
The national weatherization network offers a comprehensive set of training opportunities and
certifications
Weatherization work performed in the field is generally well done but there are opportunities to
improve the technical aspects of the work and client energy education
Successful local programs exhibit the characteristics of well-managed non-profit organizations
with respect to mission, commitment, respect, quality, innovation, and resilience
94% of surveyed households were satisfied or very satisfied with the weatherization program
Over 80% of auditors, crew chiefs, and crew members are satisfied or very satisfied with almost
every aspect of their jobs
WAP faces numerous challenges and opportunities moving forward. The main challenges are related to
maintaining and improving work quality, dealing with health and safety issues found in homes, and
meeting the likely growing demand for program services over time. Major opportunities are related to
increasing cooperation and leveraging relationships with the healthy homes and medical communities to
achieve even higher levels of energy savings and non-energy benefits.
5 American Society of Heating, Refrigerating and Air Conditioning Engineers


1
1. INTRODUCTION
This report presents a summary of the results from ORNL’s retrospective evaluation of the U.S.
Department of Energy’s (DOE) Weatherization Assistance Program (WAP). The retrospective evaluation
focused mainly on WAP Program Year (PY) 2008, which covers the period from April 2008 to June
2009. The retrospective evaluation plan was developed during the 2005-2007 time period and the actual
evaluation commenced in August 2009.6 Energy savings, energy cost savings, non-energy benefit
estimates, and program cost effectiveness were all based on data collected (e.g., energy bills) from the PY
2008 time period. Other analyses, such as a national occupant survey, field process study and case study
interviews were conducted during PY’s 2010, 2011, and 2012. These years fall within the Program’s
American Recovery and Reinvestment Act Period (alternatively referred to as the ARRA Period or the
Recovery Act Period). A separate Recovery Act period evaluation is being conducted by ORNL.7 It
should be noted that the previous national evaluation of WAP addressed PY 1989.8
DOE’s Weatherization Assistance Program provides grants to states (Grantees), and states provide grants
to local weatherization agencies (Subgrantees) to weatherize homes occupied by income-eligible
households. The program serves a very diverse client-base residing in a wide array of housing types
located across a range of climate zones. DOE encourages states and local agencies to leverage WAP
funding to secure additional funding for low-income weatherization. Section 2.0 describes WAP
processes and administration in more detail.
The next three sections summarize findings from the impact, process, and case study components of the
evaluation, respectively. Section 3 begins by summarizing energy savings attributable to WAP. Estimated
energy savings are presented by housing type (single family, mobile home, multifamily), fuel type
(natural gas, electricity, bulk fuels9), and climate zone. This section also presents estimated energy cost
savings, non-energy benefits, and program cost-effectiveness. More detailed results and descriptions of
the methodologies used to collect the data and estimate the results are contained in a separate set of
reports, which are cited in footnotes throughout this report and are listed in the References Section 8.
Section 4.1 depicts a program that not only must address diversity with respect to clients, climates, house
types and fuel types but also is quite complex technically. Section 4.2 describes the training provided by
the national WAP network to take-on these complexities. Section 4.3 summarizes the results of a field
process study that observed weatherization work on-site in the field. Section 4.4 presents the results of a
study that revisited homes to assess their energy savings performance. Section 4.5 presents the results of a
national indoor environmental quality study. The last segment of this section of the report presents
descriptive statistics from surveys of clients and weatherization staff about their satisfaction with WAP.
Lastly, Section 5 depicts a program that is quite mission-driven at the local level. The retrospective
evaluation went ‘beyond the numbers’ to conduct a set of case studies with Subgrantees around the
country. This section presents a synthesis of how these agencies approach their missions and describes
how the national weatherization network finds innovative ways to provide services to their clients.
The Program faces many issues and challenges as it moves forward. Three of these are addressed in
Section 6: improving program operations, addressing health and safety issues, and integrating with the
national healthy homes and medical communities. This section ends with a futures view of some of the
6 The retrospective evaluation plan (Ternes et al. 2007) can be found at http://weatherization.ornl.gov 7 The ARRA period evaluation plan (Tonn et al. 2011) can also be found at http://weatherization.ornl.gov. 8 See Brown et al. 1993. 9 “Bulk fuels” refers to fuels delivered to the home, such as fuel oil and propane.

2
challenges and opportunities surrounding low-income weatherization. Appendix A presents a summary of
all of the information collection instruments utilized by this evaluation.

3
2. OVERVIEW OF THE WEATHERIZATION ASSISTANCE PROGRAM
This section presents an overview of the Weatherization Assistance Program. Section 2.1 describes how
the program is implemented in the field. Section 2.2 addresses the eligible population that the program
serves, from their various housing types to their essential demographics.
2.1 PROGRAM CHARACTERIZATION
The U.S. Department of Energy’s (DOE) Weatherization Assistance Program was created by Congress in
1976 under Title IV of the Energy Conservation and Production Act. The purpose and scope of the
Program as currently stated in the Code of Federal Regulations (CFR) 10CRF 440.1 is “to increase the
energy efficiency of dwellings owned or occupied by low-income persons, reduce their total residential
energy expenditures, and improve their health and safety, especially low-income persons who are
particularly vulnerable such as the elderly, persons with disabilities, families with children, high
residential energy users, and households with high energy burden.” (Code of Federal Regulations, 2011)
To be eligible for the program in PY 2008, households had to meet one of two criteria: income at 150% of
the federal poverty rate or income 60% or less of the state medium income.
As indicated in the introduction, DOE provides grants to Grantees (i.e., states, territories, District of
Columbia, a small number of Tribes), and the states provide grants to their Subgrantees (e.g., local
weatherization agencies) to do the actual weatherization work (~900 in PY 2008). A national
weatherization network has evolved over the years. The National Association of State Community
Services Programs (NASCSP) is the professional organization that provides support for the Grantees.
NASCSP maintains the Weatherization Assistance Program Technical Assistance Center, which provides
up-to-date information about WAP, such as formal program notices issued by DOE, as well as training
and technical assistance information.10
The National Community Action Foundation (NCAF) is the
professional home for the traditional weatherization Subgrantees that operate as Community Action
Agencies.11
It is common practice for states and agencies to leverage DOE WAP funds to acquire additional funds for
weatherization from their states, regional utilities, and other sources.12
During PY 2008, DOE’s
investment of approximately $236 million was leveraged to acquire an additional $614 million for low-
income weatherization (See Figure 2.1), $460 million spenton DOE units.13
Of this total, approximately
70% of the funds were spent on energy conservation measure installation, 10% on health and safety
measures, 7% on audits and inspections, 12% on program management, and 1% on training and technical
assistance.14
The magnitudes of leveraged resources and their sources differed across groups of Subgrantees. As
illustrated in Figure 2.2, there are a relatively small number of Subgrantees that receive virtually no
leveraged funds (see the first column). The column at the far right-hand side depicts about an equal
number of Subgrantees that receive most of their funding from non-federal sources, such as states and
10 See http://www.waptac.org 11 See http://www.ncaf.org 12
The results presented in this subsection were drawn from surveys of all Grantees (S1) and Subgrantees (S2) and data collected
about a large sample of homes that were weatherized in PY 2008 (DF2/3). Please see Appendix A for more information on these
information collection instruments, sampling and response rates. 13 To be included in this study, at least $1 of DOE funds needed to be invested in the weatherized home. Homes weatherized with
no DOE funds invested were determined to be beyond the purview of this DOE-funded evaluation. 14 The evaluation team was not able to collect data from states or agencies to allow the estimation of what DOE funds paid for
and what leveraged funds paid for overall or on a job-by-job basis.
4
utilities. The rest of the Subgrantees rely more or less on WAP and Low-Income Home Energy
Assistance Program (LIHEAP) funding.15
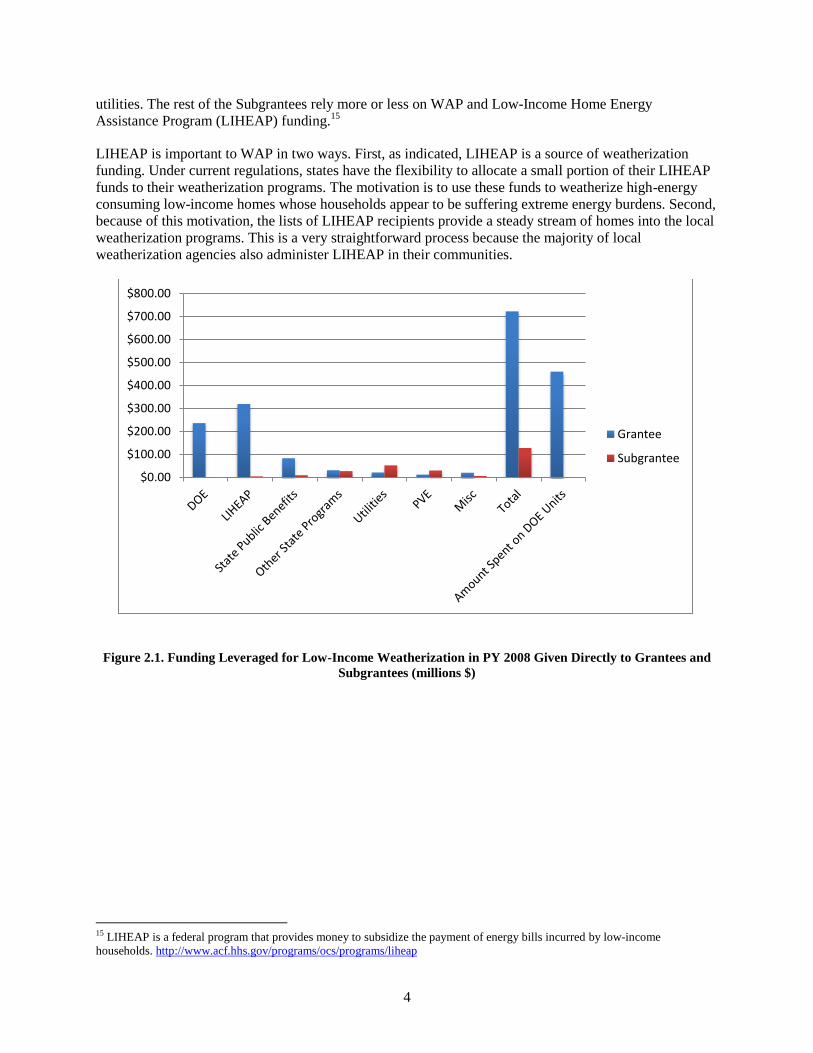
LIHEAP is important to WAP in two ways. First, as indicated, LIHEAP is a source of weatherization
funding. Under current regulations, states have the flexibility to allocate a small portion of their LIHEAP
funds to their weatherization programs. The motivation is to use these funds to weatherize high-energy
consuming low-income homes whose households appear to be suffering extreme energy burdens. Second,
because of this motivation, the lists of LIHEAP recipients provide a steady stream of homes into the local
weatherization programs. This is a very straightforward process because the majority of local
weatherization agencies also administer LIHEAP in their communities.
Figure 2.1. Funding Leveraged for Low-Income Weatherization in PY 2008 Given Directly to Grantees and
Subgrantees (millions $)
15 LIHEAP is a federal program that provides money to subsidize the payment of energy bills incurred by low-income
households. http://www.acf.hhs.gov/programs/ocs/programs/liheap
$0.00
$100.00
$200.00
$300.00
$400.00
$500.00
$600.00
$700.00
$800.00
Grantee
Subgrantee

5
Figure 2.2. Leveraging Patterns Among Local Weatherization Agencies (PY 2008)16
Thus, many households are referred to their local weatherization programs through LIHEAP referrals and
referrals from other community service programs. Word-of-mouth about weatherization is also
exceptionally strong.17
As a result, most local weatherization agencies did not have to market their
programs in PY 2008. In fact, the substantial majority of agencies had waiting lists for weatherization
services that extended many months and in some cases, years into the future.
Prior to weatherization, all homes receive an energy audit to determine what measures should be installed
in each specific home. Energy auditors use DOE approved computerized audits (33%), priority lists
(53%), or both (12%). The priority lists allow Subgrantees to install measures that are known to be
generally cost-effective without having to conduct computerized audits for every home. Auditors employ
a range of diagnostic tests to support their assessments. The most common diagnostic measure is the
blower door test. Essentially, a large fan is attached to an outside door and the home is depressurized. The
test indicates how airtight a home is and can also indicate the sources of major air leaks throughout the
home. Other common diagnostics include carbon monoxide measurements in flues of space and water
heating systems.
16
The results presented in this figure are based on survey responses from 795 out of 900 Subgrantees. Thus, the average
leveraged funds reported may differ slightly from the results presented in Figure 2.1. 17
See Recovery Act Evaluation report Rose et al. (2015b) for a description of word-of-mouth communication in the social
networks of program recipients.
WAP dominatedWAP / LIHEAP
dominatedWAP / LIHEAP
majorityWAP / LIHEAP
minority
Other $s $280,616 $2,258,291 $68,704,958 $152,791,462
LIHEAP $s $8,942 $101,655,449 $73,028,986 $30,378,723
DOE $s $52,445,473 $65,006,409 $82,341,899 $39,855,923
$-
$50
$100
$150
$200
$250
mil
lio
ns
“The two small kids that live in this house
had to sleep in the bedroom with their
parents, but after weatherization, they are
now back in the kids’ room.” St. Johns
Housing Partnership weatherization client.
126
278
250 141

6
In general, each installed measure needs to pass a Savings-to-Investment Ratio (SIR) test, where the
present value of the energy cost savings over the life of the measure (e.g., 20 years) needs to exceed the
present value of its cost (i.e., SIR >= 1.0). Additionally, during PY 2008, states and agencies were
constrained to spend an average of $2966 of DOE funds per weatherized home. Lastly, the local programs
were allowed to invest a small amount of money to deal with health and safety issues found in homes
(typically around 15% of funds invested in a weatherized unit). It is common for agencies to encounter
homes that are in such poor physical condition structurally that weatherization would have virtually no
impact on energy consumption or simply cannot be installed. It is also common to encounter homes
whose conditions pose health and safety risks to agency staff. In the cases where the agency does not have
the resources to help the households with rectifying these types of problems, weatherization is deferred.
The homes can re-enter the weatherization queue once the household has addressed the reason(s) for the
deferral.18
After the audit is complete, the agency implements its weatherization model. There are two dominant
models. In the first, agencies use in-house crews to do the weatherization work. In the other, agencies hire
private-sector contractors. Most agencies that use in-house crews contract out for heating and cooling
system repair and replacement work. Most agencies that use contractors use in-house staff to conduct the
audits. After weatherization work is completed, the agencies are required to inspect all weatherized
homes. To address conflict-of-interest issues, whenever possible inspectors do not inspect homes they had
initially audited.19
It should be noted that state weatherization staff and DOE Project Officers also inspect
a sample of weatherized homes. Figure 2.4 graphically depicts the weatherization process.
Figure 2.3. The Weatherization Process
2.2 CHARACTERIZATION OF HOMES WEATHERIZED IN PY2008
Over the years, WAP has supported the weatherization of over six million homes, with over one million
homes weatherized during the Recovery Act period. In PY 2008, WAP supported the weatherization of
almost 98 thousand units: 59% of these were single family, site built, detached homes (SF), 18% mobile
homes (MH), with the balance being units in small multifamily (SMF) (5%) and large multifamily
buildings (LMF) (18%).
One quarter of the weatherized units are found in very cold climates, and 42% in cold climates. Only 12%
of the units weatherized in PY 2008 fell into the hot dry or hot humid climate zones (see Figure 2.4 for
the climate zone designations used in this research). The dominant fuel for space heating for the
weatherized single family homes was natural gas (60%), followed by bulk fuels (26%) and electricity
(14%). Well over one-half of the homes weatherized were built before 1980. A large majority of the units
weatherized were owner-occupied: e.g., 91% of single family and 92% of mobile homes. Figure 2.5
18 For more on deferrals, see Recovery Act Evaluation report Rose et al. (2015c). 19 This is often difficult to avoid in very small programs.

7
indicates the frequency of measures installed in homes in PY 2008, with air sealing and insulation
measures leading the way.20
Figure 2.4. Climate Zone Designations
20 These and other program characterization statistics can be found in Retrospective Evaluation report Bensch et al. (2014).

8
Figure 2.5. Frequency of Measures Installed in Homes in PY2008
2.3 CHARACTERIZATION OF CLIENTS IN PY2008
Overall, in PY 2008, 35 million households were eligible for the WAP program, or ~30% of all U.S.
households.21
In many ways, the population eligible for WAP is quite different demographically from the
non-low-income population. Specifically, WAP-eligible households are more likely to:
Be elderly
Have a person with a disability present in the home
Have a child <= 5 years of age
Be a single parent household
Be less healthy
Live in mobile homes
As part of the retrospective evaluation, an extensive survey was administered to a nationally
representative, random sample of households that were weatherized in calendar year 201122
. A
demographic analysis of these households indicates that most of the households fall into one of these
three descriptions:
21 See the Retrospective Evaluation Eligible Population report Carroll et al. (2014d) for a complete discussion of the population
eligible for WAP. 22 See Retrospective Evaluation Occupant Survey – Baseline Results report (Carroll et al. 2014a).
0%
10%
20%
30%
40%
50%
60%
70%
80%
90%
100%
9
Household headed by a single female middle-aged parent with health issues who is also likely to
be unemployed (~44% of households fall into this general group)
Single person household headed by an elderly, relatively healthy, retired female (~31%)
Household composed of a young married couple with children with health issues whose head of
household is likely to be employed (~25%)
2.3 SUMMARY
DOE’s Weatherization Assistance Program operates in all 50 states plus the District of Columbia and
several U.S. territories. Weatherization is accomplished by over 900 Subgrantees. WAP provides the
technical framework and training resources to guide low-income weatherization using DOE funds and a
large pool of leveraged funds. The program operates in a range of climate zones and encompasses
numerous housing types and heating fuels. Compared to the average U.S. household, the households that
WAP serves are more likely to be: elderly, have a disabled person, have a young child, be a single parent
household, and be less healthy.

11
3. ENERGY SAVINGS, NON-ENERGY BENEFITS AND COST EFFECTIVENESS
This section of the report describes quantitatively the impacts attributable to WAP. Section 3.1 presents
estimates of energy savings attributable to WAP. Data collected as part of a national assessment of the
impacts of weatherization on indoor environmental quality (IEQ) indicate that households did not
increase their indoor air temperatures post-weatherization, and therefore did not increase their heating
energy consumption post-weatherization (Section. 3.2). As such, they accrued maximum energy-cost
savings (Section 3.3). Environmental, economic, and health-related non-energy benefits attributable to
WAP are presented in Section 3.4. Overall cost-effectiveness estimates of WAP from several perspectives
are presented in Section 3.5.
3.1 ENERGY SAVINGS
A major task of the retrospective evaluation was the estimation of energy savings attributable to WAP.
Three approaches were followed to estimate energy savings. For single-family attached or detached (SF)
units and mobile homes (MH) that were heated using natural gas (NG) or electricity, utility bills were
collected for the period of one-year pre-weatherization through one-year post-weatherization. Bills for
comparison group homes (i.e., homes weatherized in the following PY) were collected for the same time
period. Utility bills were also collected for units located in small multifamily buildings (SMF) that were
individually weatherized (i.e., these units typically had their own heating and hot water systems and not
all units in the building need to have been weatherized). Well established and industry accepted
techniques were used to weather normalize the data and then to estimate energy savings for each home in
the sample.23
To build a sample of these households, 400 of the approximately 900 Subgrantees operating in PY 2008
were randomly selected to participate in this part of the evaluation. Each of the 400 Subgrantees was
asked to provide lists of homes weatherized during PYs 2007, 2008 and PY 2009. One-third of the homes
on each list were randomly selected to be in the sample. For these homes, agencies were asked to provide
utility billing account numbers for the entire sample and information on measures installed in the homes
only for those homes weatherized in PY 2008.24
The project team ended up contacting over 1300 natural
gas and electricity companies for billing histories.
A significant number of homes heat with bulk fuels, such as fuel oil, kerosene and propane. Bills are
typically not available or reliable enough to use to estimate changes in fuel consumption for bulk fuels for
single family and mobile homes. Therefore, the retrospective evaluation implemented a field study to
directly measure fuel oil consumption pre- and post-weatherization (specifically by measuring actual
heating system run times). These results were generalized to the WAP population of homes that heat with
fuel oil.25
Lastly, a special study was conducted to estimate energy savings in weatherized large multifamily
buildings (LMF). The challenge with these buildings is that in some buildings heating and hot water is
supplied centrally and in others individual units have their own heating and hot water systems. With
respect to the former, energy bills are building-level and audits and energy savings are also viewed from
the building-level perspective. In either case, evaluating energy savings in large multifamily buildings can
be expensive and time-consuming. For the retrospective evaluation, it was decided that it was most cost
23 These methods generally fall within the rubric of the Princeton Scorekeeping Method (PRISM).
http://www.marean.mycpanel.princeton.edu/~marean/ 24 It is very time consuming for the agencies to provide the measure installation information, so it was requested for just one
program year. 25 It was assumed that heating system efficiencies for kerosene and propane were equivalent to those of natural gas.

12
and time efficient to focus on collecting building-level energy bills for large multifamily buildings
weatherized in New York City (NYC).26
Table 3.1 presents the total estimated energy savings (heating fuel and electricity source) by housing type
in millions of British thermal units (MMBtus).27
The total savings of just over 2 trillion Btus saved is
equivalent to almost 400 thousand barrels of oil.28
The estimate of 29.3 MMBtus average savings for site
built homes (which includes small multifamily in this table) is consistent with expected energy savings
for this house type.
Table 3.1. Total Estimated Annual Energy Savings by Housing Type PY 2008
Total MMBtus Saved MMBtus Saved / Unit
Site Built (1-4 units)* 1,840,000 29.3
Mobile Homes 284,000 16.0
Large Multifamily (NYC only) 144,000 26.9
Total 2,268,000
* Includes single family and small multifamily
Figure 3.1 presents energy savings estimates by house type, climate zone, and main heating fuel (natural
gas or electricity). Nationally, for the most common housing type (single family), and the most common
heating fuel (natural gas), it is estimated that the average home reduced its natural gas consumption by
17.8% post-weatherization. These same homes reduced their electricity consumption by 7.1%. Nationally,
savings in small multifamily buildings were, on average, comparable to those for SF homes. Energy
savings in mobile home are less than the other two housing types. Percent savings among electrically
heated homes is lower because there are fewer opportunities to improve the efficiency of electric heating
systems either through repair or replacement. The total MMBtus saved by the program is an
underestimate because only approximately one-third of the units weatherized in large multifamily
buildings (those in New York City) were included in this analysis.
26 In this time period, NYC accounted for approximately one-third of all large multifamily building units weatherized in the
United States. 27 More comprehensive energy savings results for each housing type for PYs 2007, 2008 and 2009 and in-depth descriptions of
the sampling and statistical methodologies for the SF, MH, SMF and LMF homes, please see Retrospective Evaluation reports
Blasnik et al. (2014a, 2014b, 2014c and 2014d), respectively. 28 For additional context, the US consumed almost 100 quadrillion of Btus in 2008, with about one-quarter consumed in the
residential sector.

13
Figure 3.1. Average Percent Energy Savings by Home Type (Single Family, Mobile Home, Small
Multifamily), Climate Zone, and Heating Fuel Type for PY 2008
Table 3.2 provides some historical perspectives about these results as compared to results from the PY
1989 evaluation of WAP.29
It is important to note that over time, natural gas consumed by homes in the
program prior to weatherization has dropped considerably from the late 1980s. This is due primarily to
the increasing penetration of higher-efficiency furnaces and water heaters in U.S. homes over time as
older equipment fails and is replaced. On the other hand, electricity use has increased, as computers and
various consumer electronics are finding their ways into all households in the U.S. Despite reduced
opportunities for energy savings in the typical home entering the WAP system, the program has
effectively increased its percent level of energy savings, though has not increased its per unit energy
savings appreciably.
Table 3.2. Comparison of PY2008 Energy Savings to Historical PY 1989 Energy Savings for Single Family
Homes
Heating Fuel
Type
Pre-Wx Fuel
Use: PY 2008
Net Savings:
PY 2008
Net Savings:
PY 2008 %
Pre-Wx Fuel
Use: PY 1989
Net Savings:
PY 1989
Net Savings:
PY 1989 %
Natural Gas 1020 therms 182 17.8% 1340 therms 174 13.0%
Electricity 19994 kWh 1799 kWh 9.0% 14972 kWh 1826 kWh 12.2%
29
Brown, Berry and Kinney 1994.
14
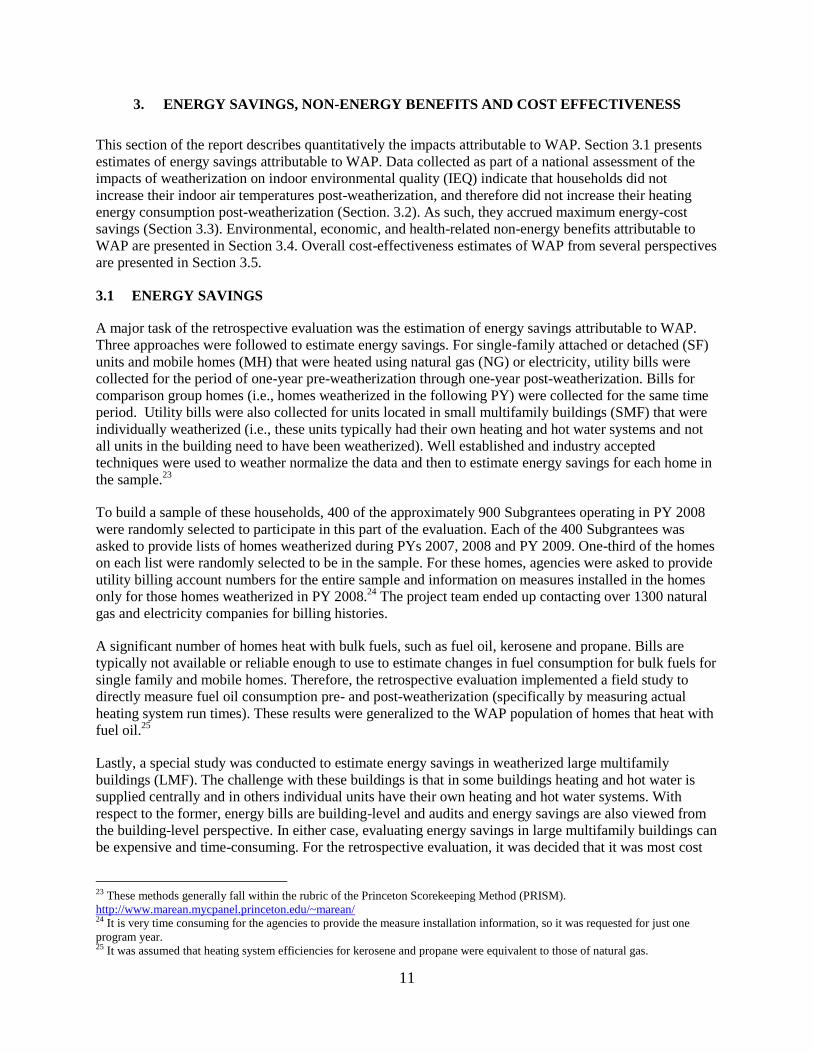
The next table, Table 3.3, provides some insights into the impacts that various measures have on total
energy savings. Derived from regression models, the results indicate the overall percentage of average
natural gas savings in natural gas heated homes that are attributable to the set of the most common
measures installed. For single family homes, air sealing accounts for 28% of the total energy savings,
followed by attic and wall insulation and heater replacement. Air sealing and duct sealing are the most
influential measures installed in mobile homes. The measures most effective at saving energy are also the
most frequently installed measures: air sealing and insulation (see Figure 2.5).30
Table 3.3. Percent Total Energy Savings Natural Gas Heated Homes by Measure
SF MH
Air Sealing 28 45
Duct Sealing 4 20
Heater Replacement 15 15
Floor Insulation 1 12
Attic Insulation 24 9
Setback Thermostat 2 --
Floor Insulation -- --
Ventilation -1 --
Wall Insulation 15 --
Other/unattributed 14 0
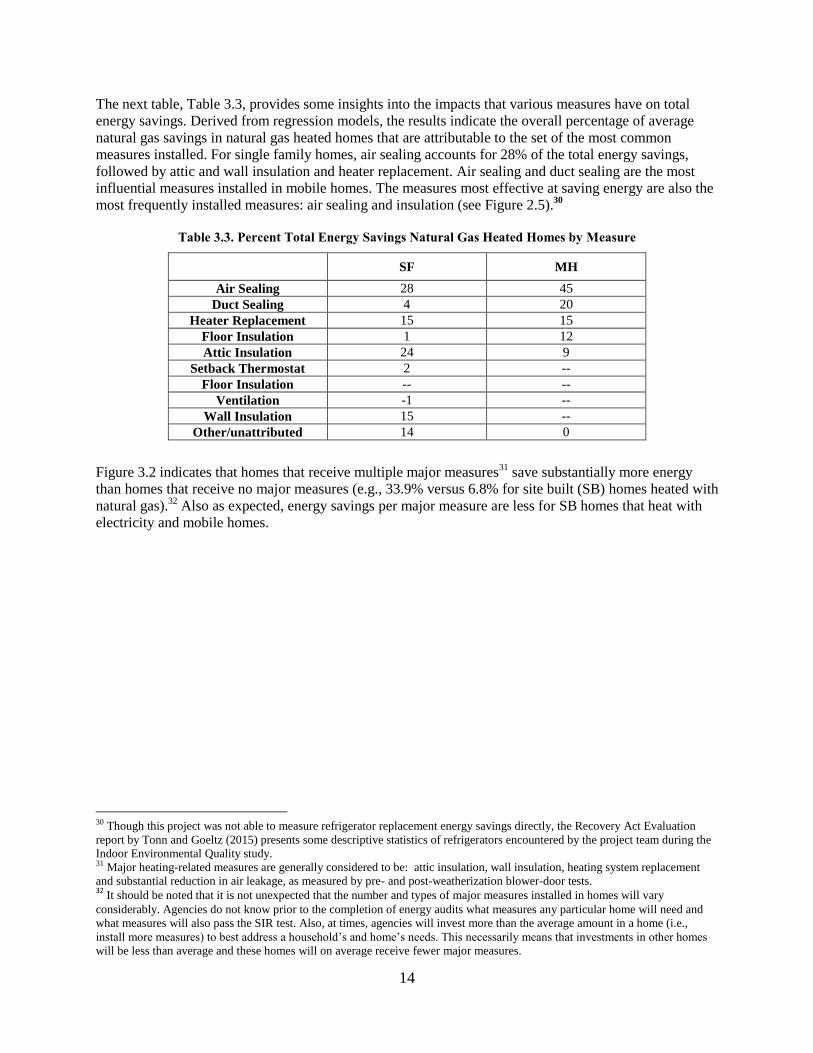
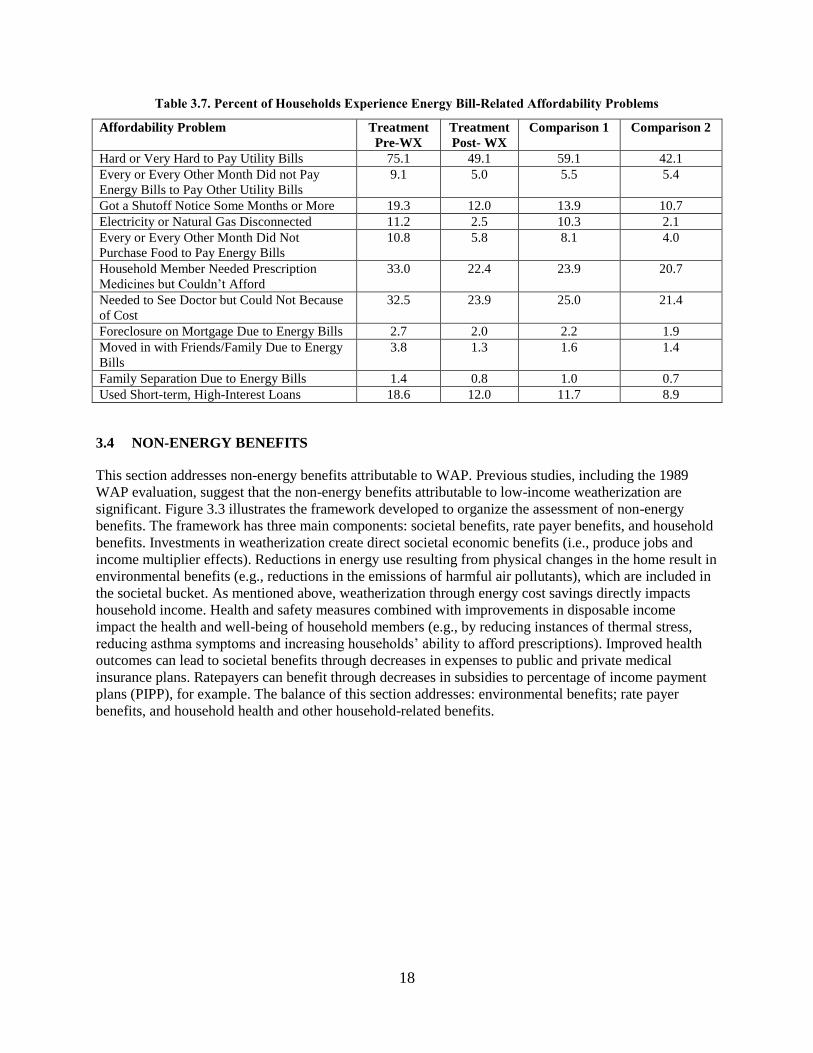
Figure 3.2 indicates that homes that receive multiple major measures31
save substantially more energy
than homes that receive no major measures (e.g., 33.9% versus 6.8% for site built (SB) homes heated with
natural gas).32
Also as expected, energy savings per major measure are less for SB homes that heat with
electricity and mobile homes.
30 Though this project was not able to measure refrigerator replacement energy savings directly, the Recovery Act Evaluation
report by Tonn and Goeltz (2015) presents some descriptive statistics of refrigerators encountered by the project team during the
Indoor Environmental Quality study. 31 Major heating-related measures are generally considered to be: attic insulation, wall insulation, heating system replacement
and substantial reduction in air leakage, as measured by pre- and post-weatherization blower-door tests. 32
It should be noted that it is not unexpected that the number and types of major measures installed in homes will vary
considerably. Agencies do not know prior to the completion of energy audits what measures any particular home will need and
what measures will also pass the SIR test. Also, at times, agencies will invest more than the average amount in a home (i.e.,
install more measures) to best address a household’s and home’s needs. This necessarily means that investments in other homes
will be less than average and these homes will on average receive fewer major measures.
15
Figure 3.2. Average Percent Energy Savings by Number of Major Measures Installed by Home and Heating
Fuel Type for PY 2008
Concluding this subsection, Table 3.4 presents a summary of energy savings in large multifamily (LMF)
buildings weatherized during this period. The results indicate substantial energy savings in NYC
buildings that are centrally heated with natural gas or fuel oil. Heating fuel savings were largely
attributable to central boiler replacements. Electricity savings were largely attributable to light and
refrigerator replacements.
Table 3.4. Average Percent Energy Savings in LMF Buildings in New York City
Heating Fuel Savings Electricity Savings
Natural Gas Heated 12.4 N/A
Fuel Oil Heated 24.0 N/A
Common Areas Electricity N/A 6.7
Unit Level Electricity N/A 23.2
3.2 NO REBOUND EFFECT
A frequent criticism of energy-efficiency programs is that gains made in improving energy efficiency
have the potential to be partially or largely offset by corresponding increases in energy consumption. In
other words, energy consumption could rebound towards the pre-retrofit levels of energy consumption.
This is also referred to as the “take-back” effect.

16
The retrospective evaluation studied this issue through the Indoor Environmental Quality (IEQ) study (see
Section 4.5 for a more detailed description of the study). As part of this study, indoor temperature data for
the study homes were obtained from data loggers that were hung from the central thermostat for about
one month preceding and following weatherization during closed-home conditions. Indoor temperature
was also measured in a set of control homes located in the same local weatherization agency jurisdictions
who agreed to have their weatherization delayed for the duration of the study. The temperature data for
homes monitored during the heating season showed that:
Wintertime indoor temperatures in program homes average 70.3 ± 0.5oF, but range from less than
60F to more than 80F.
The temperature increased post-weatherization in the weatherized homes by 0.14oF and decreased
in the comparison homes by 0.13oF, resulting in an estimated increase of 0.27
oF.
Thus, for this sample of homes and the time period encompassed by the data collection, one can conclude
that there was essentially no rebound effect related to home heating. This means that almost all of the
energy cost savings derivable from weatherization were available to these households to spend on non-
energy related needs. These findings are consistent those from previous research.33
3.3 ENERGY COST SAVINGS
This section presents estimates for energy cost savings attributable to WAP. Tables 3.5 and 3.6 present
energy savings estimates for single family site built and mobile homes, respectively, by heating fuel type.
The annual first year energy cost estimates were calculated based on what households would have paid
for energy one-year post-weatherization had they not been weatherized and multiplying by the average
projected price per unit for each state for 2013. Energy prices by fuel type were based upon state-level
data provided by the U.S. Energy Information Administration. Overall, energy cost savings average
11.9% for site-built homes34
, or about $264 per year. Savings are considerably higher for fuel oil and
propane, which are higher-priced heating fuels per MMBtu. Though annual first year energy costs for
mobile homes are comparable, cost savings from the program are lower.
Table 3.5. Single Family Site-Built Homes-Energy Costs and Cost Savings by Main Heating Fuel
(2013 Dollars)
Heating Fuel
Annual Energy Costs Annual Savings (first year)
Fuel Electric Total$ Fuel Electric Total$ % Savings
Natural Gas $799 $1,102 $1,901 $142 $65 $208 11.5%
Electricity - $1,852 $1,852 - $192 $192 10.3%
Fuel Oil $2,606 $1,156 $3,762 $430 $68 $497 13.2%
Propane $1,968 $1,062 $3,030 $326 $74 $399 13.2%
Other $925 $967 $1,892 $153 $64 $217 11.5%
All Clients $1,027 $1,182 $2,209 $175 $88 $264 11.9%
33
For example, see Levins and Ternes (1994) and Greening, Greene, and Difigilo (2000). 34 To distinguish from mobile homes.

17
Table 3.6. Mobile Homes-Energy Costs and Cost Savings by Main Heating Fuel
(2013 Dollars)
Heating Fuel
Annual Energy Costs Annual Savings (first year)
Fuel Electric Total$ Fuel Electric Total$ % Savings
Natural Gas $632 $952 $1,584 $77 $37 $115 7.2%
Electricity - $2,159 $2,159 - $145 $145 6.7%
Fuel Oil $2,066 $1,321 $3,387 $261 $40 $301 8.9%
Propane $1,728 $1,010 $2,738 $216 $39 $255 9.3%
Other $930 $1,095 $2,025 $115 $30 $145 7.2%
All Clients $844 $1,177 $2,021 $105 $53 $157 7.8%
As mentioned above, to help assess the impacts of weatherization on households, the evaluation
administered a computer-assisted telephone survey to a nationally representative random sample of
weatherized households and a control group. The survey was administered in two phases. In the first
phase, one group of homes surveyed was just about to have their home energy audits (pre-weatherization
treatment group) and a second group had received weatherization one year earlier (comparison 1 group).
The samples sizes for the treatment (pre-weatherization) and comparison homes (one year post-
weatherization) were 665 and 802, respectively.35
The response rate was 70%. The second phase was
administered approximately 18 months later to the same households, which are referred to as post-
weatherization treatment group and comparison 2 group, respectively, yielding 398 responses from the
treatment homes and 430 from the comparison homes.
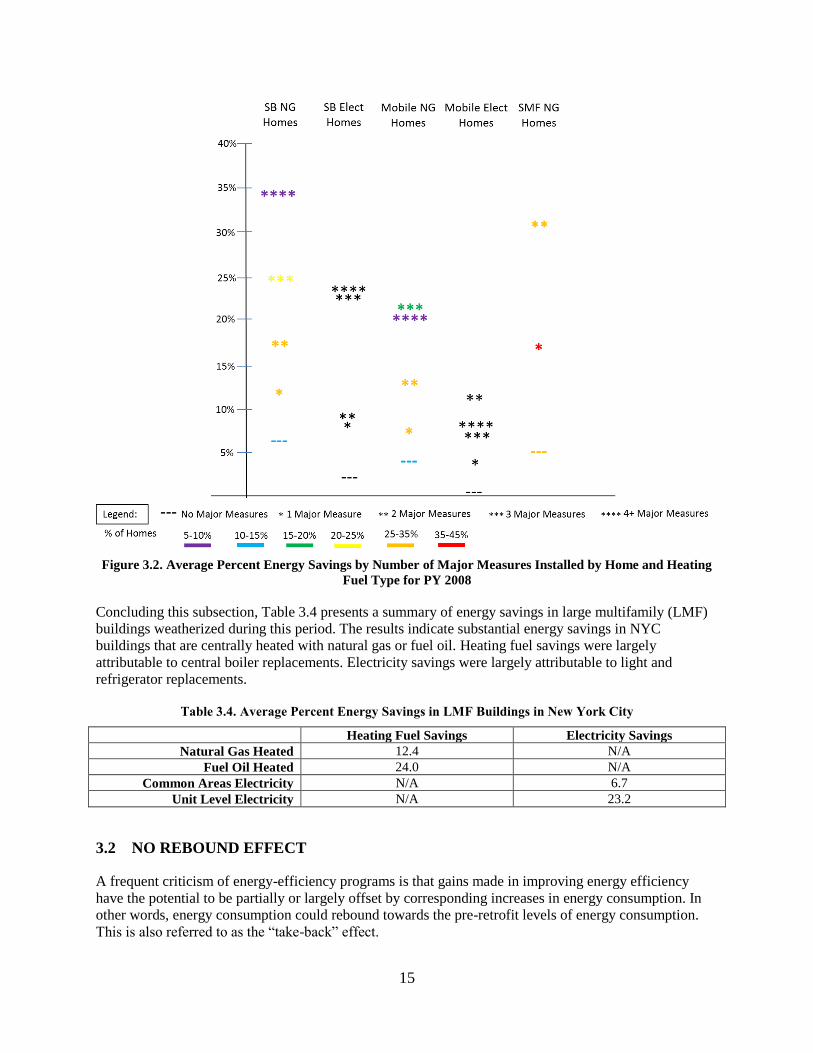
The results from the national occupant survey presented in Table 3.7 supports the contention that
weatherization can reduce the energy burden experienced by low-income homes. Fewer homes found it
hard to pay energy bills one-year post-weatherization, although it should be noted that even after
weatherization, the majority of households still experienced an energy burden. As noted above, because
the rebound effect was negligible, households post-weatherization were likely able to use energy cost
savings to purchase food and prescriptions, reduce the probability of having utility service terminated, and
avoid high-interest loan arrangements, suppositions all supported by the results in Table 3.7.
35 For more information on the national occupant survey, see Retrospective Evaluation report Carroll et al. (2014a).
“I was having a hard time paying utility bills
because the hot water heater and air conditioning
were very old. Now I am able to pay the utility
bills because the bills are much lower than before
I had weatherization and I can be comfortable in
the summer and winters.” St. Johns Housing
Partnership weatherization client
18
Table 3.7. Percent of Households Experience Energy Bill-Related Affordability Problems
Affordability Problem Treatment
Pre-WX
Treatment
Post- WX
Comparison 1 Comparison 2
Hard or Very Hard to Pay Utility Bills 75.1 49.1 59.1 42.1
Every or Every Other Month Did not Pay
Energy Bills to Pay Other Utility Bills
9.1 5.0 5.5 5.4
Got a Shutoff Notice Some Months or More 19.3 12.0 13.9 10.7
Electricity or Natural Gas Disconnected 11.2 2.5 10.3 2.1
Every or Every Other Month Did Not
Purchase Food to Pay Energy Bills
10.8 5.8 8.1 4.0
Household Member Needed Prescription
Medicines but Couldn’t Afford
33.0 22.4 23.9 20.7
Needed to See Doctor but Could Not Because
of Cost
32.5 23.9 25.0 21.4
Foreclosure on Mortgage Due to Energy Bills 2.7 2.0 2.2 1.9
Moved in with Friends/Family Due to Energy
Bills
3.8 1.3 1.6 1.4
Family Separation Due to Energy Bills 1.4 0.8 1.0 0.7
Used Short-term, High-Interest Loans 18.6 12.0 11.7 8.9
3.4 NON-ENERGY BENEFITS
This section addresses non-energy benefits attributable to WAP. Previous studies, including the 1989
WAP evaluation, suggest that the non-energy benefits attributable to low-income weatherization are
significant. Figure 3.3 illustrates the framework developed to organize the assessment of non-energy
benefits. The framework has three main components: societal benefits, rate payer benefits, and household
benefits. Investments in weatherization create direct societal economic benefits (i.e., produce jobs and
income multiplier effects). Reductions in energy use resulting from physical changes in the home result in
environmental benefits (e.g., reductions in the emissions of harmful air pollutants), which are included in
the societal bucket. As mentioned above, weatherization through energy cost savings directly impacts
household income. Health and safety measures combined with improvements in disposable income
impact the health and well-being of household members (e.g., by reducing instances of thermal stress,
reducing asthma symptoms and increasing households’ ability to afford prescriptions). Improved health
outcomes can lead to societal benefits through decreases in expenses to public and private medical
insurance plans. Ratepayers can benefit through decreases in subsidies to percentage of income payment
plans (PIPP), for example. The balance of this section addresses: environmental benefits; rate payer
benefits, and household health and other household-related benefits.

19
Figure 3.3. Framework for Understanding Non-Energy Benefits
3.1.1 Environmental Benefits
One benefit of WAP is that reducing the amount of energy used in clients’ homes reduces the emissions
associated with the production and consumption of energy. Values for emissions reductions are estimated
for: carbon, particulate matter, sulfur dioxide, nitrogen oxide, and volatile organic compounds. The
environmental emissions benefit estimation procedure involves four steps:
1. Energy Usage Reductions (State-Level) – The 2008 program evaluation estimated energy savings
per weatherized unit for each type of energy used in clients’ homes (e.g., natural gas, electricity)
for each building type (i.e., Single Family, Mobile Home, and Multifamily).
2. Quantity of Avoided Emissions (State-Level) – Published data sources were used to estimate the
avoided greenhouse gases, sulfur dioxide, nitrogen oxide and particulate matter emissions
associated with the energy usage reductions for each type of energy. The analysis developed
estimates of the average avoided emissions per housing unit at the state level and the aggregate
avoided emissions per state.
3. Value of Avoided Emissions (State-Level) – The dollar value of avoided greenhouse gas
emissions was computed using guidance from OMB and sulfur dioxides, nitrogen oxides,
particulate matter, and volatile organic compounds was computed using the Air Pollution
Emission and Policy Analysis Model (APEEP) as recommended by the National Research

20
Council (NRC) in their 2010 Report to Congress.36
The analysis developed estimates of the
average emissions benefit per housing unit at the state level and the aggregate emissions benefit
per state.
4. National Averages and Aggregates – Using the state-level data, the analysis developed a weighted
average avoided emissions and benefits per housing unit served by the program and aggregate
avoided emissions and benefits for the overall program. The avoided emissions are expressed as
avoided CO2 equivalents in metric tons, and average short tons of avoided for SOx, NOx, PM,
and VOCs.
One important reason for developing estimates at the state level in Steps 1 and 2 is because environmental
emissions rates for electricity generation vary by region. The valuation procedure done in Step 3 was
done at the state level because the APEEP model estimates damages at the county level based on
pollution sources and population. In addition, this approach furnishes data that can be useful to states for
their own planning purposes. The lifetime CO2 emissions reductions are over 2 million metric tons and
over 5 thousand short tons for criteria pollutants.
Figure 3.4 presents the results of monetizing the present value of environmental emissions benefits per
unit by emissions type and housing type.37
The average value for these benefits ranges from over $15,000
per unit for large multifamily buildings in New York City to almost $2500 for single family homes
nationally to less than $1500 for mobile homes nationally. It can be seen that the highest monetary return
are related to reductions in greenhouse gas and sulfur dioxide emissions and for large multifamily homes
in NYC. The present value of these benefits is $251,000,000.
36 National Research Council, 2010. Hidden Costs of Energy: Unpriced Consequences of Energy Production and Use. The
National Academies Press, Washington, DC. 37 See Retrospective Evaluation Report (Working Paper) Carroll et al. (2014e) for more information on the environmental
emissions benefits study.

21
Figure 3.4. Present Value of Environmental Emissions by House and Emission Type for PY 2008
3.1.2 Macroeconomic Benefits
This section summarizes work to estimate the macroeconomic benefits attributable to WAP.38
It is
straightforward to assert that WAP has direct employment impacts. One can also argue that
weatherization material and equipment purchases made by WAP at the local and state levels likely have
indirect employment impacts. Moreover, the energy cost savings that households experience and are
likely to spend on other goods and services may also induce employment benefits.
38 See Retrospective Evaluation report Burton et al. (2014) for additional details on this study.

22
To estimate the direct, indirect, and induced employment impacts, the retrospective evaluation team used
a sophisticated macroeconomic modeling tool developed by Regional Economic Models, Inc. (REMI).
The REMI model is a computable general equilibrium model, meaning that it is capable of simulating the
multi-sector U.S. economy year-by-year over multiple decades. The model produces outputs in the form
of changes in employment by sector, region, and year as well as changes in gross domestic product by
region and year, reaching equilibrium of demand and supply for each modeled year.
The study team focused on estimating the macroeconomic benefits of WAP for PY 2008, including all
leveraged funding spent in DOE units. The team apportioned WAP expenditures on energy efficiency
measures to over 25 sectors of the U.S. economy, with the resulting impacts touching over 50 sectors.
The findings suggest that:
Directly and indirectly, WAP was responsible for a combined 8,435 jobs;
WAP generated $476 million in incomes;
WAP increased national economic output by $1.22 billion; and
The national economic multiplier is 2.93.
3.1.3 Health and Household-Related Benefits
This section addresses several non-energy benefits accruable to households following weatherization.
Weatherization directly reduces energy costs, improves home comfort, and helps seal the home against
outside harm (e.g., outdoor air pollutants, pests). Weatherization agencies also rectify carbon monoxide
problems found in homes (see Section 4.5), and as opportunities arise and funding allows, address a large
number of health and safety issues, from mold and mildew to infestations.
Comparing the pre-weatherization treatment group to the post-weatherization treatment group and
comparison group 1 columns (Table 3.8), the national occupant survey indicates that more clients report
having operational heating and cooling systems one year post-weatherization than pre-weatherization.
Their homes are less drafty. Their heating solutions make less use of poor quality materials burned, ovens
for heat, and portable heaters, which all have implications for improving indoor air quality, occupant
health, and home safety.

23
Table 3.8. Summary of WAP Household Heating and Cooling System Findings (% of Homes)
Indicator Treatment
Pre-Wx
Treatment
Post-Wx Comparison 1 Comparison 2
Heating System Broken 14.9 6.8 8.5 9.1
Central Cooling System Broken 9.9 5.0 5.5 6.5
Home is Cold or Very Cold in Winter 39.4 15.1 19.7 15.2
Home is Hot or Very Hot in Summer 41.0 24.9 26.6 22.3
Home Drafty Most or All of the Time 29.5 5.8 8.9 4.9
Use Portable Heater (Main) 2.4 NA 1.7 NA
Use Portable Heater (Other) 33.1 NA 26.8 NA
Use Oven for Heat 11.5 6.3 7.3 6.0
Poor Quality Materials Burned 4.6 3.4 1.8 2.1
Consequently, the survey results suggest that one year after weatherization respondents and other
household members experienced a wide range of health and well-being benefits. For example, with
respect to well-being, the survey results indicated that:
respondents experienced less bad days of rest and sleep the previous month
respondents felt healthier and full of energy more days the previous month
household members experienced fewer allergy symptoms, fewer instances of the flu, and fewer
instances of persistent cold symptoms over the
past year
household members suffered fewer headaches
over the past year
respondents with asthma reported being
hospitalized less and visiting the emergency
department less after weatherization
respondents who were asthma sufferers reported
missing fewer days of work the previous 12
months (a decrease from 8.5 days missed to 6.8)
respondents reported fewer incidences where
they paid their utility bill instead of buying food
respondents reported a decrease in worry that household members would not have nutritious food
(in the past 4 weeks)
respondents reported being better able to afford prescriptions
fewer households needed food assistance after weatherization
households used fewer short-term high-interest loans after weatherization
“I don’t have to choose between the gas
bill and my medicine.” Corporation for
Ohio Appalachian Development
weatherization client
“Less dust and mold – less coughing and
congestion than before. Fewer respiratory
problems.” St. Johns Housing Partnership
weatherization client

24
It was reported that household members suffered:
Fewer food poisonings;
Fewer burns from hot water;
Fewer instances of thermal stress from being too cold or too hot; and
Fewer missed days of school in the previous 12 months for the child most absent from school
living in the home (7.6 days versus 6.8).
The homes experienced:
Less intrusion of outdoor noise into their homes;
Less cockroach infestation;
Less rodent infestations;
Less standing water;
Less mold; and
Less mildew or musty smells.
The homes are safer because of:
Reduced exposure to carbon monoxide
– Working CO monitors installed in homes increased from 46% to 76%
Reduced risk of fire-related injuries
– Working smoke detectors installed in homes increased from 88% to 96%
As seen above, the list of potential non-energy benefits of low-income weatherization is quite extensive.
As noted above, weatherization can directly increase household disposable income through decreases in
energy burden. In some homes, measures such as low-flow showerheads are installed, which can reduce
water bills. It is also important to note that weatherization can also positively impact household
disposable income in many other ways. For example, fewer illnesses in the household may allow
employed household members to miss fewer days at work, which provides a direct income benefit
because most low-income jobs do not provide sick leave. These incremental increases in income, along
with reductions in energy costs, may allow households to avoid using costly short-term loans, which can
then save households the cost of the interest on the loan. They also may be better able to afford
prescriptions and food, which have both household and societal benefits. These and additional income
relationships with weatherization are captured in Figure 3.5.
Monetization of the benefits provides a way to combine these benefits with the energy cost savings and
emissions benefits to develop a fuller picture of the total benefits versus costs of WAP. Twelve categories
of health and household-related benefits were monetized as part of this evaluation. Methodologies used

25
to generate the monetary estimates listed in Table 3.10 can be found in Tonn et al. (2014). Here are
several points to be considered with respect to these estimates:
Household benefits are limited to financial benefits accruable directly to the households;
Financial benefits due to improved health, for instance, that benefit health insurance plans are
accrued to society in this framework;
Value of saving lives benefits are consider societal; and
The present values are calculated over a ten-year time frame using the 2013 discount rate
published by the Office of Management and Budget.
Table 3.9 presents the estimates of the monetary value for these twelve non-energy benefits for
households residing in single family and mobile homes.39
These estimates are grouped into three tiers
according to the strength of the methodologies and data underlying the estimates. Tier 1 estimates can be
considered to have the least amount of uncertainty, followed by the Tier 2 and Tier 3 estimates.
The highest benefit accrues from preventing instances of thermal stress from being too cold. This benefit
has a high value because in a few cases, thermal stress can lead to death and preventing a death was
valued at $7.5 million in this analysis. Preventing deaths also weighed heavily in the benefits estimated
for preventing instances of thermal stress from being too hot, CO poisoning, and home fires.
39 Small multifamily and large multifamily homes were not included in these analyses because clients living in these types of
homes were not included as part of the national occupant survey and because weatherization of large multifamily buildings
focuses more on central heating and water heating systems and common areas and less on individual units, which is hypothesized
to have a very different impact on health and household-related non-energy benefits.

26
Figure 3.5. Potential Impacts of Weatherization on Household Disposable Income

27
Table 3.9. Present Value of Per Unit and WAP Program Health-Related Benefits of Weatherization
Societal Household Societal Household Societal Household
Asthma $2,009-
$1,852 $157
Thermal Stress-Cold $3,911 $172 $3,892 $19
Thermal Stress-Heat $870 $85 $855 $15
Food Assistance Reduction $832-
$832
Reduction in Missed Days at
Work $201-
$40 $161
CO poisoning $154 $7 $153 $1
Improvement in Prescription
Adherence $1,929-
$1,929-
Reduction in Use of Short-
Term Loans $71- -
$71
Home Fires $831 $175 $768 $63
Increased Productivity at Work
Due to Improved Sleep $1,813-
$1,813-
Increased Productivity at
Home Due to Improved Sleep $1,329- -
$1,329Reduction in Low-Birth Weight
Babies from Heat-or-Eat
Dilemma $198-
$198-
$7,471 $352 $2,082 $72 $2,779 $1,392
$600,333,094 $28,295,957 $167,310,541 $5,766,863.04 $223,324,724.16 $111,878,910.72
$14,148 -
Tier 1 Tier 2 Tier 3
TotalTotal (Value of
Life Excluded)
$7,823 $2,154
$1,136,883,221 -Total by Tiers (Present Value
WAP Program)$628,629,051 $173,077,404 $335,176,766
$4,171
Total by Tiers (Present Value
Per Unit)

28
The benefits associated with reducing asthma symptoms are also appreciable. This is because it appears
that weatherization can substantially reduce asthma-related hospitalizations and emergency department
visits. Benefits also accrue to improving the use of prescriptions and helping pregnant women avoid the
heat or eat choice, which may lead to low-birth weight babies. It should be noted that the grand total
presented in Table 3.9 is likely to be an underestimate of the monetary value of weatherization to
households and society with respect to health-related issues. The estimate only includes weatherized
single family and mobile homes. Several additional health-related benefits were not monetized, such as
the prevention of trips and falls and the replacement of refrigerators, which may prevent food poisoning.
Additionally, no attempt was made to monetize the subjective benefits of: increased comfort experienced
by households; improved mental and physical health; and less infested households. On the other hand,
there are a number of uncertainties associated with these estimates, which are explained in detail in Tonn
et al. (2014b).
3.5 COST-EFFECTIVENESS
This section addresses the cost effectiveness of WAP. The section begins with cost effectiveness defined
with respect to measure costs and energy cost savings. Savings-to-investment ratio savings are estimated
by house type, fuel type, and climate zone.40
3.5.1 Measure Costs and Energy Savings Only
Table 3.10 presents a summary of energy cost savings, energy efficiency measures costs, benefits, and the
estimated SIR for each building type and for the program overall, by house type. These estimates were
calculated by dividing the present value of estimated energy cost savings over the lifetimes of the
measures by the costs of the installed energy conservation measures (ECMs). Estimated costs savings
were calculated using U.S. Energy Information Administration fuel price forecasts and discount rate
guidance published by the U.S. Office of Management and Budget. 41
The savings-to-investment ratio for
the most-weatherized type of home, single family site-built is 1.72. As shown, SIRs range from 1.03 for
mobile homes to 1.82 for large multifamily units weatherized in New York City.
Table 3.10. Energy Cost Savings, Efficiency Measure Costs, and Cost-Effectiveness by Building and Fuel
Type (2013 Dollars)
Building Type
Energy Cost Savings
(present value of lifetime savings) Costs & Cost-Effectiveness
Fuel Electric Total
Measure
Costs
Net
Benefits
Savings/
Investment
Ratio
Single Family $4,161 $1,176 $5,337 $3,096 $2,240 1.72
Mobile Home $2,107 $946 $3,053 $2,961 $92 1.03
Small Multifamily $3,401 $1,217 $4,618 $2,878 $1,741 1.60
Large Multifamily $5,237 $1,222 $6,460 $3,336 $3,142 1.82
All Types $3,757 $1,134 $4,890 $3,070 $1,820 1.59
40
The energy savings, energy cost savings, and cost effectiveness estimates presented in this subsection are drawn from Blasnik
et al. 2014a, 2014b, 2014c, and 2014d. 41 Energy cost savings and non-energy benefits reported herein were discounted using OMB Circular A-4, Appendix C 2013 real
interest rates on Treasury Notes and Bonds of Specified Maturities. These rates are typically used on cost-effectiveness analyses.

29
Figure 3.6 breaks down SIRs by climate zone, funding source and number of measures installed based on
2008 dollars. These results suggest that the most cost effective investments are made in homes located in
cold climates, followed by homes in very cold climates. Homes weatherized only with DOE funds
achieve higher cost effectiveness than homes weatherized with DOE and other, leveraged funds. Lastly, it
appears that the while installing more measures in homes will certainly save more energy (see Figure 3.2),
adding more measures is not necessarily more cost effective, at least with respect to single family
housing.
Figure 3.6. Cost Effectiveness by Climate Zone, Funding Source and Number of Measures Installed for PY
2008 (2008 dollars)
Table 3.11 presents the SIR by fuel type based on 2013 dollars. As expected, SIRs are much greater for
the expensive delivered bulk fuels – fuel oil and propane – than for homes heated with natural gas or
electricity.

30
Table 3.11. Cost Effectiveness by Fuel Type per Housing Type (2013 dollars)
Building Type
ECM Savings/ Investment Ratio
Natural
Gas
Electricity
Fuel Oil Propane Other National
Single Family 1.39 1.23 2.85 2.50 1.42 1.72
Mobile Home .82 .70 2.36 1.84 1.10 1.03
Small Multifamily 1.34 1.26 4.58 3.15 1.88 1.60
Large Multifamily NYC 1.27 4.64 1.82
3.5.2 Total Costs and Benefits
Table 3.11 presents a summary of the total program benefits and costs for WAP for PY 2008 for all
weatherized units except for large multifamily buildings located outside of New York City.42
The average
cost per unit weatherized is $4,695.43
The average energy cost savings is $4890. Because numerous
households whose homes were weatherized participate in utility administered Percentage of Income
Payment Programs (PIPP) that are subsidized by ratepayers, approximately 22% of the energy cost
savings accrue to ratepayers. The combined present value of the energy and non-energy benefits per unit
is approximately $22,000. 44
Accounting for the units weatherized in PY 2008, the total present value of
the benefits exceeds $1.8 billion. It should be noted that there are uncertainties in all of these estimates.
However, the total estimates are conservative in several manners. First, the health and household-related
benefits do not take into account subjective benefits enjoyed by households with respect to comfort,
improved health and other factors. Second, these non-benefits were not estimated for the large
multifamily component of WAP. Third, the energy savings benefits only account for one-third of the
large multifamily buildings weatherized in PY 2008.
Lastly, numerous other non-energy benefits were not monetized by the evaluation, including potential
health impacts of refrigerator replacement, increased home value resulting from the value of the
weatherization investments, interest payments on late payments of utility bills, reduced forced mobility,
reduced emissions of heavy metals, improvements in national security, and the value of free training
provided to weatherization staff. Ratepayer benefits not addressed include: lower bad debt write-off,
reduced carrying costs on arrearages, fewer notices and customer calls, fewer emergency gas service
calls, reduced transmission and distribution costs, and reduced peak electricity demands.
42 For more information on total program cost effectiveness, see Retrospective Evaluation report Carroll et al. (2014e). 43 This cost estimate encompasses total program funding, DOE and leveraged funds spent on measures, administration, etc. 44 This study assumes there is no free-rider issue. In other words, none of the households whose homes were weatherized would
have undertaken weatherization without WAP. This assumption is justified given that all homes in the program are low-income
and the national occupant survey documents problems these households have in paying everyday bills. It should be noted that
these estimates also do not include spillover benefits, despite the fact that spillover was documented by the Social Network Study
(See Recovery Act report Rose et al. (2015b)).
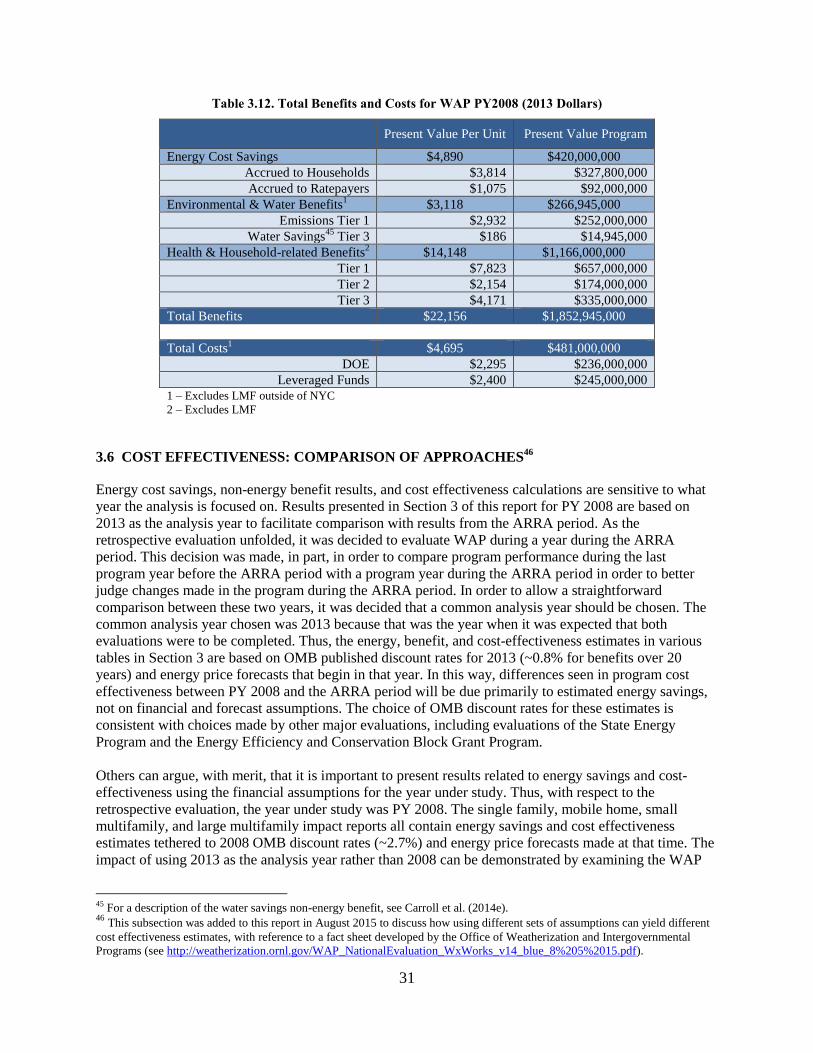
31
Table 3.12. Total Benefits and Costs for WAP PY2008 (2013 Dollars)
Present Value Per Unit Present Value Program
Energy Cost Savings $4,890 $420,000,000
Accrued to Households $3,814 $327,800,000
Accrued to Ratepayers $1,075 $92,000,000
Environmental & Water Benefits1 $3,118 $266,945,000
Emissions Tier 1 $2,932 $252,000,000
Water Savings45
Tier 3 $186 $14,945,000
Health & Household-related Benefits2 $14,148 $1,166,000,000
Tier 1 $7,823 $657,000,000
Tier 2 $2,154 $174,000,000
Tier 3 $4,171 $335,000,000
Total Benefits $22,156 $1,852,945,000
Total Costs1 $4,695 $481,000,000
DOE $2,295 $236,000,000
Leveraged Funds $2,400 $245,000,000
1 – Excludes LMF outside of NYC
2 – Excludes LMF
3.6 COST EFFECTIVENESS: COMPARISON OF APPROACHES46
Energy cost savings, non-energy benefit results, and cost effectiveness calculations are sensitive to what
year the analysis is focused on. Results presented in Section 3 of this report for PY 2008 are based on
2013 as the analysis year to facilitate comparison with results from the ARRA period. As the
retrospective evaluation unfolded, it was decided to evaluate WAP during a year during the ARRA
period. This decision was made, in part, in order to compare program performance during the last
program year before the ARRA period with a program year during the ARRA period in order to better
judge changes made in the program during the ARRA period. In order to allow a straightforward
comparison between these two years, it was decided that a common analysis year should be chosen. The
common analysis year chosen was 2013 because that was the year when it was expected that both
evaluations were to be completed. Thus, the energy, benefit, and cost-effectiveness estimates in various
tables in Section 3 are based on OMB published discount rates for 2013 (~0.8% for benefits over 20
years) and energy price forecasts that begin in that year. In this way, differences seen in program cost
effectiveness between PY 2008 and the ARRA period will be due primarily to estimated energy savings,
not on financial and forecast assumptions. The choice of OMB discount rates for these estimates is
consistent with choices made by other major evaluations, including evaluations of the State Energy
Program and the Energy Efficiency and Conservation Block Grant Program.
Others can argue, with merit, that it is important to present results related to energy savings and cost-
effectiveness using the financial assumptions for the year under study. Thus, with respect to the
retrospective evaluation, the year under study was PY 2008. The single family, mobile home, small
multifamily, and large multifamily impact reports all contain energy savings and cost effectiveness
estimates tethered to 2008 OMB discount rates (~2.7%) and energy price forecasts made at that time. The
impact of using 2013 as the analysis year rather than 2008 can be demonstrated by examining the WAP
45 For a description of the water savings non-energy benefit, see Carroll et al. (2014e). 46
This subsection was added to this report in August 2015 to discuss how using different sets of assumptions can yield different
cost effectiveness estimates, with reference to a fact sheet developed by the Office of Weatherization and Intergovernmental
Programs (see http://weatherization.ornl.gov/WAP_NationalEvaluation_WxWorks_v14_blue_8%205%2015.pdf).
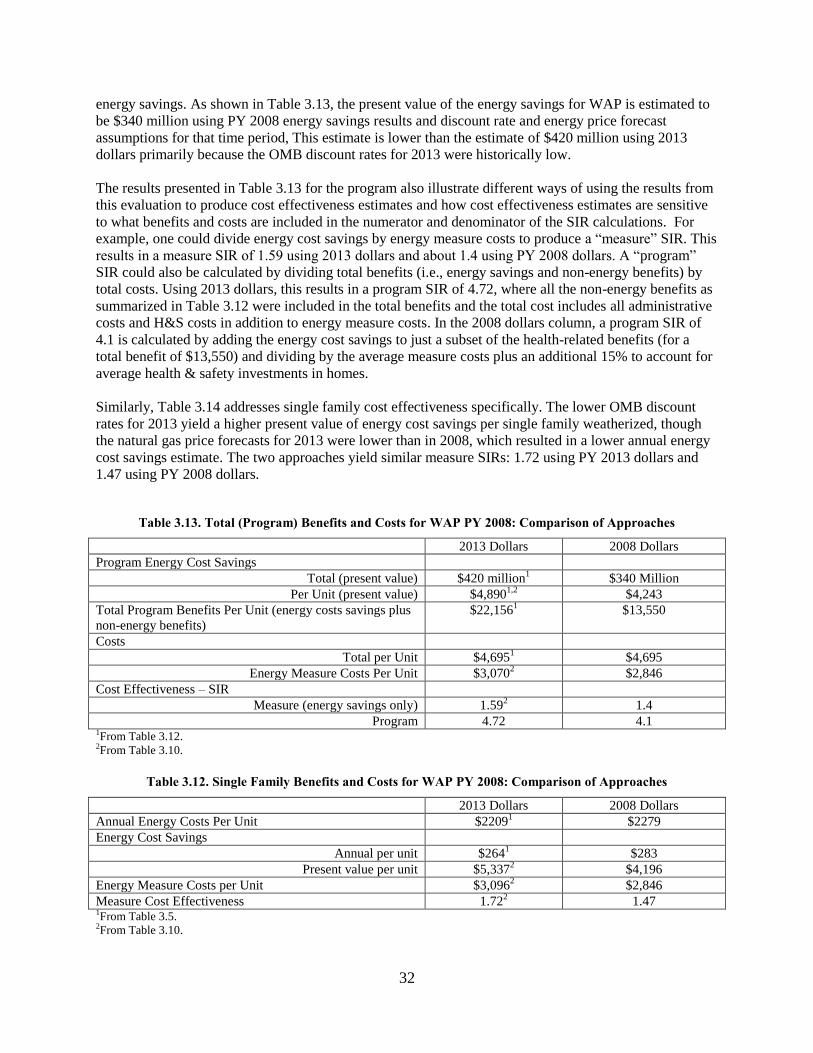
32
energy savings. As shown in Table 3.13, the present value of the energy savings for WAP is estimated to
be $340 million using PY 2008 energy savings results and discount rate and energy price forecast
assumptions for that time period, This estimate is lower than the estimate of $420 million using 2013
dollars primarily because the OMB discount rates for 2013 were historically low.
The results presented in Table 3.13 for the program also illustrate different ways of using the results from
this evaluation to produce cost effectiveness estimates and how cost effectiveness estimates are sensitive
to what benefits and costs are included in the numerator and denominator of the SIR calculations. For
example, one could divide energy cost savings by energy measure costs to produce a “measure” SIR. This
results in a measure SIR of 1.59 using 2013 dollars and about 1.4 using PY 2008 dollars. A “program”
SIR could also be calculated by dividing total benefits (i.e., energy savings and non-energy benefits) by
total costs. Using 2013 dollars, this results in a program SIR of 4.72, where all the non-energy benefits as
summarized in Table 3.12 were included in the total benefits and the total cost includes all administrative
costs and H&S costs in addition to energy measure costs. In the 2008 dollars column, a program SIR of
4.1 is calculated by adding the energy cost savings to just a subset of the health-related benefits (for a
total benefit of $13,550) and dividing by the average measure costs plus an additional 15% to account for
average health & safety investments in homes.
Similarly, Table 3.14 addresses single family cost effectiveness specifically. The lower OMB discount
rates for 2013 yield a higher present value of energy cost savings per single family weatherized, though
the natural gas price forecasts for 2013 were lower than in 2008, which resulted in a lower annual energy
cost savings estimate. The two approaches yield similar measure SIRs: 1.72 using PY 2013 dollars and
1.47 using PY 2008 dollars.
Table 3.13. Total (Program) Benefits and Costs for WAP PY 2008: Comparison of Approaches
2013 Dollars 2008 Dollars
Program Energy Cost Savings
Total (present value) $420 million1 $340 Million
Per Unit (present value) $4,8901,2
$4,243
Total Program Benefits Per Unit (energy costs savings plus
non-energy benefits)
$22,1561 $13,550
Costs
Total per Unit $4,6951 $4,695
Energy Measure Costs Per Unit $3,0702 $2,846
Cost Effectiveness – SIR
Measure (energy savings only) 1.592 1.4
Program 4.72 4.1 1From Table 3.12. 2From Table 3.10.
Table 3.12. Single Family Benefits and Costs for WAP PY 2008: Comparison of Approaches
2013 Dollars 2008 Dollars
Annual Energy Costs Per Unit $22091 $2279
Energy Cost Savings
Annual per unit $2641 $283
Present value per unit $5,3372 $4,196
Energy Measure Costs per Unit $3,0962 $2,846
Measure Cost Effectiveness 1.722 1.47
1From Table 3.5. 2From Table 3.10.

33
3.7 SUMMARY
The results presented in this section demonstrate in numerous ways the effectiveness of the
Weatherization Assistance Program. Specifically,
The magnitude and percent of energy savings are significant
The magnitude of the non-energy benefits – environmental, rate payer, and health and home-
related – is also quite significant
The present value of total program benefits exceeds the total program costs for PY 2008.
These high level results do, however, mask variability and uncertainty in the impacts. For example,
energy savings and ECM SIR results vary considerably by climate zone, fuel type, house type, and
number of major measures installed. The monetary estimates for the twelve categories of health and
home-related benefits also vary widely, based primarily on whether weatherization is thought to prevent
hospitalizations and deaths. There are several areas of uncertainty with respect to the health-benefits that
need to be addressed through future research.


35
4. PROCESS EVALUATION AND FIELD STUDIES
This section describes in more depth how WAP was implemented in the field in PY 2008. Section 4.1
describes the complexity of low-income weatherization. Section 4.2 provides information on the wide
range of training resources available to the national weatherization community. A Field Process Study
was conducted that entailed observations and assessments of weatherization activities implemented by
nineteen local WAP agencies around the country. The results from this study, presented in Section 4.3,
found that weatherization is carried out competently but identifies areas for improvement. Section 4.4
summarizes the results from a study that addressed reasons for variation in energy savings amongst
homes. This followed by a summary of an extensive and comprehensive assessment of the impact of
weatherization on indoor environmental quality. Lastly, it is a testament to the program that its clients and
its workers are very satisfied with their service and jobs, respectively (see Section 4.6).
4.1 PROGRAM COMPLEXITY
Let’s return to Figure 2.3, which graphically illustrates the complexity of the weatherization process. To
elaborate upon this figure, at any point in time, a local weatherization agency has numerous homes in
various stages of the weatherization queue. Households are often referred to the weatherization program
from other agency programs, such as their LIHEAP or other social service programs.47
The program also
generates positive communication amongst recipients and their social networks, which results in
applications being generated by strong word-of-mouth phenomena. After it is determined that a household
is eligible for WAP, the household is placed on the waiting list for an energy audit. The length of time on
the waiting is dependent upon the length of the list, weatherization resources available, and whether the
household falls into a priority category (e.g., elderly) and/or faces an emergency situation (e.g., inoperable
furnace in the dead of winter).
Weatherization auditors need to have a basic understanding of building science, and the technical know-
how to carry out over a dozen different diagnostic procedures. All in all, the auditors’ job can be broken
down into 30 different work categories and over 300 actions (see Figure 4.1). It should also be noted that
audits and the weatherization work need to be appropriate for the specific climate zone, house type and
fuel type, of which there over 60 potential combinations.48
The results of the audit are used to develop a
work order for the weatherization crew. The scope of work is based not only upon the list of cost-
effective measures needed by the home but also must take advantage of leveraged resources available to
the agency for weatherization. In addition, how agencies braid together DOE and leveraged funds is an
art, given that these funding streams often have separate spending rules and reporting requirements. In
some instances, the auditor may determine that weatherization needs to be deferred until the household
can rectify structural and/or health and safety issues associated with their home.
After the audit, the agency addresses the logistics of scheduling the weatherization work, assigning crews,
and equipping trucks to go out into the field. Many agencies also stock and maintain their own
warehouses. Weatherization crew members need to have the capabilities to install a very large range of
weatherization measures, such as: air sealing; attic, wall, duct and floor insulation; mobile home skirting
and belly insulation; installation of new windows and doors, pipe insulation, low-flow shower heads; and
installation of energy-efficient lights and refrigerators. Crew leaders also need to be able to manage the
subcontractors that typically replace and tune up heating and cooling systems and install new water
heaters.
47 Approximately 50% of households that participated in the national occupant survey received LIHEAP the previous year. 48 No agency deals with all 60+ combinations but the national program needs to develop tools and training materials to deal with
all of the combinations.

36
Crews also implement a wide range of health and safety measures, including: installation of smoke alarms
and CO monitors; ventilation measures such as installation and repair of kitchen and bathroom fans; and
repairs to ceilings, walls, foundations, roofs, stairs and plumbing. If the home is built before 1978 and/or
diagnostics reveal that lead is present in the home, crews need to implement Lead Safe Weatherization
practices. Overall, weatherization crews need to master 60 work categories and successfully accomplish
over 450 different actions.
Lastly, inspectors have a lengthy list of actions they must do to properly inspect homes following the
installation of weatherization measures. Inspectors’ responsibilities can be grouped into 12 different work
categories and over 100 actions. If inspectors find issues with the weatherization job, crews are instructed
to fix the problems. States and DOE also conduct random quality assurance (QA) inspections of homes.
Once the home passes inspection, the job is closed. According to DOE regulations, agencies are not
allowed to return to homes. Agencies are only allowed to re-weatherize homes that were weatherized
before 1994.
Finally, it should be mentioned that the program stresses professionalism and respect for the household
members. As observed by the evaluation team in the field, time is taken to explain the weatherization
process at each stage in the process.49
Crews are instructed to protect households’ belongings and to leave
the home as clean as they found it. Many auditors are trained to refer households to other social service
programs because oftentimes the weatherization program is the only local program that has the
opportunity to interact with the clients in their homes. The Process Field Study observed a very high level
of professionalism displayed by auditors, crews, and inspectors.50
Figure 4.1. Complexity of the Weatherization Knowledge Base51
49
On the other hand, as discussed in Section 4.3, true client energy education is not routinely conducted. 50
See retrospective report Berger et al. (2014) 51
Drawn from Retrospective Evaluation report Berger et al. (2014)

37
4.2 PROGRAM TRAINING
To equip staff to handle the aforementioned complexities, the national weatherization network provides a
wide range of training alternatives on a wide variety of topics. A substantial majority of auditors, crew
chiefs and crew members received classroom training at a training center within the five years previous to
the survey (see Table 4.1).52
Weatherization staff also attend state-level and national training conferences
and receive training at their agency. Only a small number of weatherization staff did not receive training
in the time period covered.
Oftentimes, special training is provided by housing type and/or health and safety topics. For example:
84% of auditors, 76% of crew chiefs, and 71% of crew members received infiltration/air sealing
training with respect to single family homes;
62% of auditors, 64% of crew chiefs, and 61% of crew members received insulation training with
respect to mobile homes;
35% of auditors, 21% of crew chiefs, and 22% of crew members received base load measure
training with respect to multifamily buildings; and
87% of auditors, 96% of crew chiefs, and 85% of crew
members received Lead Safe Weatherization training.
A survey of over 800 trainees who attended classes at DOE-
supported weatherization training centers found high satisfaction
with the training offered.53
For example:
97% found the training useful;
95% found the technical quality of the training to be
high; and
95% stated they would recommend the training to others
in the weatherization field.
52
These statistics are derived from a survey of weatherization auditors, crew chiefs and crew members implemented in Spring
2011. See Retrospective Evaluation Weatherization Staff report Carroll et al. (2014c) for complete results of the weatherization
staff survey. 53 For more information on the results of the trainee survey, see Retrospective Evaluation report Hawkins et al. (2014).
“I don’t have to worry about stepping on
heater grate that is hot. I could use the
both/shower without fear of electrocution
from small space heater that I used to warm
my bathroom (that was always a big
concern to me).” Housing Resources of
Western Colorado weatherization client.
Figure 5.4. Grate Directly Over Furnace Flame

38
Table 4.1. Formal Training Attendance in Last Five Years
Which of the following types of formal training have you attended in the last five years?
(Select all that apply)
Auditors Crew Chiefs Crew Members
Classroom Training at a Training Center 86% 78% 70%
Classroom Training at Agency 60% 58% 51%
State’s Weatherization Conference 43% 27% 20%
National Weatherization Training
Conference 42% 31% 23%
Webcast 40% 15% 9%
Regional Weatherization Conference 34% 23% 12%
Affordable Comfort Conference 33% 13% 4%
BPI Certification Training [Volunteered] 5% 3% 2%
Health and Safety 0% 6% 4%
Other 9% 6% 3%
None of These 1% 3% 9%
Table 4.2 indicates that the majority of weatherization staff is trained to conduct Lead-Safe
Weatherization. Building Performance Institute (BPI) certification is higher amongst auditors than crew
chiefs and crew members. It should be noted that BPI, Lead safe work practices and other certification
standards are increasingly required of weatherization staff.

39
Table 4.2. National Professional Certifications Received
What national professional certifications do you have?
(Select all that apply)
Auditors Crew Chiefs Crew Members
Number of Respondents 350 268 264
Lead-Safe Weatherization54
63% 74% 62%
Lead Certified Renovator 59% 72% 50%
BPI Building Analyst 51% 19% 12%
BPI Envelope 18% 9% 5%
BPI Heating 14% 4% 3%
BPI Manufactured Housing 8% 4% 3%
Residential Building Envelope Whole House Air
Leakage Control Crew Chief 6% 10% 3%
HERS 5% 2% <1%
BPI Multifamily 4% 1% 0%
BPI Residential Building Envelope Accessible
Areas Air Leakage Control Installer 3% 5% 3%
Leadership in Energy & Environmental Design 2% 1% 2%
BPI Air Conditioning and Heat Pump 1% 1% 1%
National Association of Home Builders Green
Building 1% <1% 0%
None of These 7% 7% 21%
No Answer <1% <1% 2%
Lastly, it should be noted that the national pool of weatherization staff has a high level of experience.
Over 30% of auditors reported working in low-income weatherization for more than 10 years. Almost as
many auditors and crew chiefs reported working for their current weatherization employer for more than
10 years.55
4.3 PROCESS FIELD STUDY
The retrospective evaluation supported a comprehensive Process Field Study of weatherization services
delivery. In addition to identifying work subcategories and actions encompassed by each, weatherization
technical experts and social scientists were sent into the field to observe audits, measure installation, and
final inspections. On-site observations of 155 audits, 159 measure-installation periods, and 128 final
inspections were conducted at 19 Subgrantees across the country. The experts were trained to observe
work in the field, not to interfere or to provide their own advice.56
The weatherization technical experts
documented when specific work subcategory actions were applicable and if applicable, whether they were
carried out.
54 It should be noted that Lead Safe Weatherization is technically not a national certification; however, within this industry it
appears that weatherization staff perceive that infield training on lead safe weatherization is considered equivalent to a
certification. 55 The weatherization staff survey was conducted during the ARRA period and thus encompassed many individuals new to
weatherization. However, the case study visits to local weatherization agencies revealed that the core staff at many agencies had
three or more decades of experience in low-income weatherization (see Section 5). 56
However, the experts were told to intervene if the health and safety of anyone was at risk.

40
Table 4.3 summarizes the very detailed and comprehensive findings of the Process Field Study.57
The
results are presented by the three main weatherization activities: audits, measure installation, and final
inspections. Technical experts graded work observed on technical quality, professionalism, and client
education. Overall, the technical quality of the work observed was competent. Auditors, weatherization
crews, and inspectors were getting the job done. Auditors and inspectors could make better use of some
diagnostics (see Tables 4.4 and 4.5, respectively)58
. Crews install measures well but frequently miss
opportunities for additional air sealing.
Table 4.3. Summary of Findings from the Field Process Study
Audits Measure Installation Final Inspections
Technical Quality Audits are comprehensive;
blower tests done
regularly; work orders are
generally well done
Use of additional
diagnostics could be
improved
Most installation work
observed was high quality
(e.g., insulation,
ventilation, doors,
windows, air sealing)
Opportunities for
additional air sealing
frequently missed
Final inspections are
comprehensive, generally
based on visual inspection;
blower door test-outs are done
regularly
Use of additional diagnostics
could be improved
Professionalism Auditors treat household
members with respect
Crews treat household
members with respect,
protect household
belongings, and clean up
after themselves
Auditors treat household
members with respect
Client Education Auditors explain the
auditing and
weatherization process
well
Auditors do not often
engage household
members in discussion
about energy, bills, home
conditions
Crews explain their work
well
Crews often do not engage
household members about
why certain measures are
being installed
Inspectors explain their
responsibilities well
Inspectors often do not engage
household members in
discussions about energy use,
health & safety issues,
expected energy savings and
energy cost savings
The field process evaluation team gave high marks for professionalism to auditors, crew, and inspectors
they observed in the field. Staff members generally gave the appearance of being dedicated to their work
and taking pride in it. Crews seemed to work well together and collectively solved problems encountered
in homes.
On the other hand, the assessment found that auditors, crews and inspectors could engage households in
more discussions about energy use, the performance of the home, utility bills, and the expected benefits of
weatherization. It should be noted though that client education was not a DOE reimbursable
expense/measure, so agencies did not have a strong incentive to invest personnel time in this activity.
Also, it should be noted that in discussions with agencies held during the case study visits (see Section 5),
weatherization staff tended to shy away from giving energy savings and energy cost savings predictions
to households because they can vary so much from home to home due to factors outside of the control of
the weatherization agency (see Section 4.4).
57
Please see Retrospective Evaluation report Berger et al. (2014) for more details about the study and results. 58 Results presented in these tables are drawn from surveys of Grantees and Subgrantees.
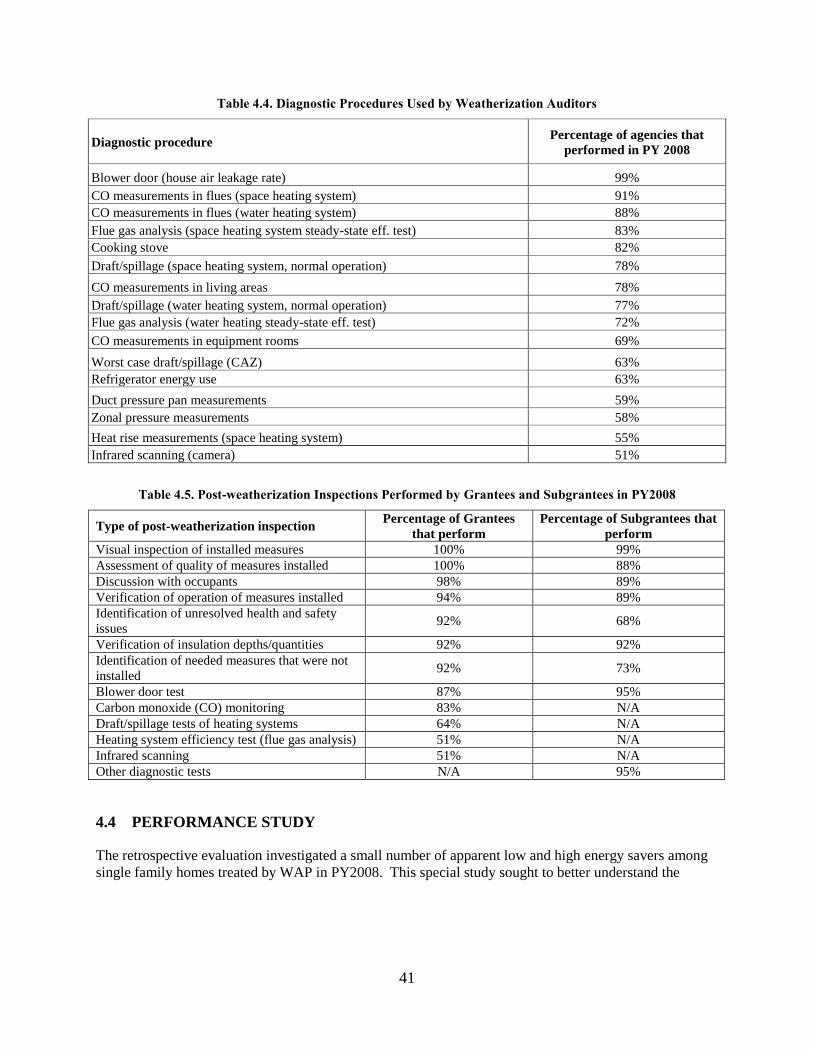
41
Table 4.4. Diagnostic Procedures Used by Weatherization Auditors
Diagnostic procedure Percentage of agencies that
performed in PY 2008
Blower door (house air leakage rate) 99%
CO measurements in flues (space heating system) 91%
CO measurements in flues (water heating system) 88%
Flue gas analysis (space heating system steady-state eff. test) 83%
Cooking stove 82%
Draft/spillage (space heating system, normal operation) 78%
CO measurements in living areas 78%
Draft/spillage (water heating system, normal operation) 77%
Flue gas analysis (water heating steady-state eff. test) 72%
CO measurements in equipment rooms 69%
Worst case draft/spillage (CAZ) 63%
Refrigerator energy use 63%
Duct pressure pan measurements 59%
Zonal pressure measurements 58%
Heat rise measurements (space heating system) 55%
Infrared scanning (camera) 51%
Table 4.5. Post-weatherization Inspections Performed by Grantees and Subgrantees in PY2008
Type of post-weatherization inspection Percentage of Grantees
that perform
Percentage of Subgrantees that
perform
Visual inspection of installed measures 100% 99%
Assessment of quality of measures installed 100% 88%
Discussion with occupants 98% 89%
Verification of operation of measures installed 94% 89%
Identification of unresolved health and safety
issues 92% 68%
Verification of insulation depths/quantities 92% 92%
Identification of needed measures that were not
installed 92% 73%
Blower door test 87% 95%
Carbon monoxide (CO) monitoring 83% N/A
Draft/spillage tests of heating systems 64% N/A
Heating system efficiency test (flue gas analysis) 51% N/A
Infrared scanning 51% N/A
Other diagnostic tests N/A 95%
4.4 PERFORMANCE STUDY
The retrospective evaluation investigated a small number of apparent low and high energy savers among
single family homes treated by WAP in PY2008. This special study sought to better understand the

42
factors leading to unusually high variations in energy savings that derived from analysis of pre- and post-
weatherization utility consumption histories for homes heated with natural gas or electricity.59
To implement the study, a geographically diverse sample of 19 locations in 17 states was selected from
among geographies represented in a much larger sample of homes included in the impact evaluation of
the PY 2008 program. Individual homes within each sampled location were then randomly selected from
among those determined to have unusually low or high apparent savings relative to the major heating-
related measures installed in the home. A total of 105 homes were included in the final sample, of which
71 had lower-than-expected apparent savings and 34 had higher-than-expected savings. The analysis
revealed a rich set of explanatory factors for apparent low or high savings among the study sites, some of
which were household-driven factors unrelated to the program, and some of which were program related.
Household factors
Household change – About one in four study participants experienced a change in household
composition or schedule that could be considered a primary or contributing factor to apparent low
or high energy savings. These occurred with about equal incidence among apparent low- and
high-savers.
Change in use of supplemental heating – About one in three participants changed how they used
supplemental heating sources (mainly electric space heaters). On balance, these households were
somewhat less likely to use supplemental sources following weatherization. Since supplemental
heating offsets the need for primary heat to some degree, decreased use of sources like space
heaters reduces savings for the primary heating fuel (for which utility bills were collected and
analyzed to estimate energy savings) relative to what would be seen if no supplementary fuels
were used.
Change in thermostat settings – About one in ten households reported a change in thermostat-
setting practices following weatherization. These were more likely to involve lower settings
during the heating season than higher settings. There is thus little evidence for “rebound” of
heating energy savings following weatherization.
Idiosyncratic consumption – Some households (particularly in warmer climates) used their
heating system irregularly, such that estimated annual consumption—and savings—was
particularly uncertain. This was identified as an important factor for about one in ten cases with
low apparent savings, but was rarer among apparent high savers.
Program factors
Atypical measure application – About one in three or four apparent low savers had wall or ceiling
insulation treatments that were in fact minor applications involving a limited area. Since the
program typically treats most or all of the wall or ceiling area when these areas are addressed, this
would explain lower-than-expected savings relative to more typical jobs where the treatments
were more extensive. Conversely, about one in seven apparent high savers received ceiling
insulation in spaces with little or no existing insulation: this would explain higher-than-average
savings in these cases, because most homes that receive additional ceiling insulation have some
existing insulation in place.
59 See Retrospective Evaluation report Pigg (2014c) for more information on the performance study. The text in this section was
drawn from the Executive Summary of this report.

43
Issue with existing heating system – A small number of apparent low savers had a heating system
that was non-functional or malfunctioning prior to weatherization. Repair or replacement of this
system as part of the weatherization package meant that usage of the primary heating fuel
increased following weatherization, leading to negative apparent savings. In other cases,
functional heating systems were replaced for health-and-safety reasons with new units that had
about the same efficiency level as the existing unit: savings from these would be expected to be
less than for energy-efficiency replacements, which generally involved high-efficiency,
condensing equipment.
Measure persistence – A small number of apparent low savers experienced premature failure of
an installed measure. For example, in one case, animals largely destroyed belly insulation work
under a mobile home.
Work quality – Issues with the quality of the weatherization work were deemed to be a primary or
contributing factor to apparent low savings in about one in five cases. These mostly had to do
with the quality of insulation work in ceiling spaces and missed cavities for wall insulation.
Additional measures – About half of the apparent high savers received measures such as duct
sealing or foundation insulation that would help explain higher-than-average savings relative to
the more limited set of measures used to establish expected savings for each site. A small number
of apparent low savers had health and safety related measures installed that might plausibly
increase heating energy consumption: in one case, for example, a home with forced-air heat had
a supply register added to a crawlspace, presumably to help deal with moisture issues.
The study also identified missed energy-saving opportunities in addition to explanatory factors for
apparent low or high energy savings. Missed opportunities for wall or ceiling insulation, duct sealing or
air leakage reduction were identified for about half of the apparent low savers and about a quarter of
apparent high savers, suggesting that there is potential for additional savings from the program.
4.5 INDOOR ENVIRONMENTAL QUALITY60
The retrospective evaluation conducted a comprehensive study of the relationships between
weatherization and indoor environmental quality. Seventy-seven local weatherization agencies from 35
states were selected to participate in the study. Each agency provided lists of homes in the weatherization
queue. Homes were randomly selected from these lists to be treatment and control homes. Over 500 were
enrolled in the study. Control group homes were provided a small incentive to delay weatherization until
after the study period.
The homes were monitored under closed-home conditions during winter 2010-2011 for homes in cold
weather states and summer 2011 for a small number of homes in hot climates. The homes were monitored
for: carbon monoxide, radon, formaldehyde, temperature (as mentioned in Section 3.2), and humidity and
moisture. Complete descriptions of the monitoring protocols, devices, and statistical results can be found
in Pigg et al. (2014). What follows is a summary of the results from the IEQ study.
60 The text in this section was drawn from the Executive Summary of Retrospective Evaluation report Pigg et al. (2014a).

44
4.5.1 Carbon Monoxide Production by Combustion Appliances
Study technicians measured carbon monoxide (CO) production by fuel-fired appliances before and after
weatherization. Generally, low incidence rates of actionable CO were found among combustion
appliances in the study (see below). However, given the deadly nature of CO, this does not imply that
current combustion-safety practices are unnecessary, or that changes should be made to the program. A
summary of findings for the three key combustion-safety related appliances in most homes follows:
Heating systems:
o About three quarters of homes have a central, fuel-fired heating system and about 40% of
these are atmospherically vented, which are of the most concern in terms of combustion
safety. Only two of 114 naturally vented systems in the study were found to have
inadequate draft.
o An incidence rate of 9 ± 6% was found of natural-draft systems that produced hazardous
levels of carbon monoxide (>400ppm) prior to weatherization.
Water heaters:
o Testing for the study revealed a 15 ± 4% incidence of fuel-fired natural-draft water
heaters with inadequate draft (per BPI guidelines), suggesting that water heaters represent
a somewhat greater combustion-spillage risk in homes. Following weatherization, none
of the remaining natural-draft water heaters failed a draft test.
o Carbon monoxide production above 400 ppm was found at only about a one in 200
incidence among fuel-fired water heaters in the study.
Ovens and ranges:
o The study data suggest that prior to weatherization roughly 10 to 20% of fuel-fired ovens
(but only about 2% of cooktop burners) in homes produce carbon monoxide above the
800 ppm (air-free) level that is the federal standard for new ranges.
4.5.2 Indoor Ambient Carbon Monoxide Levels
Carbon monoxide data loggers recorded ambient CO levels in a single central location in the study homes
at 1- or 5-minute intervals for approximately one month before and after weatherization. The data show
that:
Ambient CO levels never exceeded 5 ppm for about two-thirds of homes.
About one in ten homes had one or more episodes of CO elevation that peaked at 20 ppm or
higher prior to weatherization (the highest was 90 ppm).
About one in 25 program homes had an indoor CO level that exceeded 5 ppm for 10% of the time
or more, but only about one in one hundred exceeded this threshold regularly.
These proportions remained substantially unchanged following weatherization for both treated and
control homes. A more detailed review of all sites with recorded (persistent or episodic) elevated CO
revealed some cases with likely sources such as an attached garage or operation of a furnace or cookstove.
45
4.5.3 Radon
Study technicians deployed 7-day, activated-charcoal canisters to measure radon levels in foundation
spaces and first-floor living spaces before and after weatherization. These tests were conducted during
the heating season under closed-home conditions. These short-term tests are thus not reflective of
expected annual average radon levels in weatherization homes. Key findings for radon follow:
The study data indicate that the average single-family home in the program has a heating-season
indoor radon level of 1.9 ± 0.1 pCi/L.61
Pre-weatherization radon levels are correlated with pre-weatherization air tightness: tighter
homes tend to have higher radon levels.
The study confirms that elevated radon is relatively rare in mobile homes across the country and
in site-built homes in counties identified by EPA as having low radon potential.
The data from the study suggest that weatherization results in a slight (in absolute terms) increase
in indoor radon levels. Nationally, the study data suggest an average increase of 0.4 ±0.2 pCi/L.62
The impact of weatherization on radon appears to be generally proportional to pre-weatherization
levels: homes with low pre-existing radon levels – which constitute the majority of program
homes – experience only a slight increase in radon levels on average, while homes with pre-
existing elevated radon experience a larger average increase following weatherization. On
average, the radon impact is thus largest among site-built homes in EPA high-radon-potential
counties, and lowest among mobile homes and homes in low-radon potential counties.
Changes in measured air-leakage rates due to air-sealing efforts — which are intended to reduce
air infiltration and yield energy savings were found to be statistically correlated with changes in
radon levels in study homes.
The study provides some evidence that the installation of continuous mechanical ventilation
reduces radon levels in homes.
A follow-up study was conducted to explore the impacts that ventilation might have on indoor radon
levels.63
Specifically, the study sought to assess the impact of exhaust-only ventilation on indoor radon
and humidity in 18 single-family homes in Colorado, Iowa, Minnesota and Ohio that were part of the
national study and had been shown to have moderately elevated radon levels.
For the study, exhaust-only ventilation that was compliant with ASHRAE Standard 62.2-2010,
“Ventilation, and Acceptable Indoor Air Quality in Low-Rise Residential Buildings,” was installed in
each home to provide continuous background ventilation. The impact of the ventilation on radon and
humidity was assessed with an experimental protocol that involved using a timer in each home to disable
the installed ventilation on alternate weeks, thus allowing an examination of the difference in radon and
humidity levels with and without the ventilation operating. Radon levels were monitored continuously on
61
It should be noted that all homes that tested over the EPA threshold level of 4.0 pCi/L received radon remediation if the
households agreed to have their homes remediated. 62 While this study was able to statistically discern an average change in radon levels post-weatherization, it is not possible to
determine with certainty with respect to any specific home baseline radon levels the impact of weatherization on radon levels due
to many sources of uncertainty, including seasonality, weather conditions, and measurement variability. 63 For more information on this ventilation study, see Retrospective Evaluation report Pigg (2014b).

46
the lowest occupied level of the home, and humidity was tracked at the main thermostat. Key results are
as follows:
Radon levels declined or remained about the same for all homes in the study when the ventilation
was operated. On average, the installed ventilation reduced radon levels by 12 ±7%.
No homes experienced any practically-significant increase in radon with operation of the
ventilation—though statistical uncertainty for individual sites does not preclude that possibility.
This suggests that in most cases, the dilution effect of exhaust-only ventilation outweighs any
tendency to increase the radon entry rate by depressurizing foundation spaces.
Six homes showed a larger (and more regular) decline in radon with operation of the ventilation
than the other sites. These included all three sites where the exhaust ventilation was located in a
basement, as well as the single site with slab-on-grade construction.
Sites with higher ventilation flow rates relative to their estimated seasonal natural ventilation rate
also tended to show a larger impact from the ventilation.
4.5.4 Formaldehyde
Formaldehyde levels were measured on the first floor above grade for a sub-sample of 131 homes in the
study using commercial test badges that were exposed for an average of eight days before and after
weatherization. The results indicate the following:
The average program home has a pre-weatherization indoor formaldehyde concentration of 14 ±
1 ppb, which is consistent with formaldehyde levels observed for older homes in other studies.
Most homes tested below 30 ppb prior to weatherization.
Weatherization resulted in a net 1.6 ± 1.1 ppb increase in formaldehyde levels.
Formaldehyde levels (and changes in formaldehyde levels) were correlated with indoor humidity
(and changes in humidity): higher formaldehyde levels were observed in homes with higher
indoor humidity.
Mobile homes may have higher formaldehyde levels than site-built homes, and weatherization
may have a larger impact on these levels, but the available sample precludes solid conclusions.
4.5.5 Humidity and Moisture
The data loggers that recorded indoor temperature also provided data on humidity levels in the study
homes. In addition technicians made a visual inspection for signs of indoor moisture before and after
weatherization. The results for the homes monitored during the heating season follow:
Prior to weatherization, program homes tend to be on the dry side during the heating season:
nearly half (44 ± 5%) have wintertime relative humidity below 30%, but 6 ± 4% have relative
humidity above 50%.
Weatherization was associated with a small but statistically significant (1.1 ± 0.6%) increase in
winter relative humidity.
About 35% of foundations and 40% of above-grade spaces had observed moisture problems.

47
Water stains were the most common observed moisture problem in both foundations and above-
grade spaces.
The follow-on ventilation study discussed above also collected data to study the relationship between
ventilation and indoor humidity. The study found:
On average, relative humidity was reduced by a statistically significant 1.7 ± 1.2% points by the
ventilation. All but one site experienced a decline in relative humidity associated with operation
of the ventilation
No relationship was observed between the ventilation’s impact on relative humidity and general
humidity level in the home
4.6 PROGRAM SATISFACTION
Indicators that WAP is a competently run program are high client satisfaction as well as the satisfaction of
those that are actually delivering the weatherization services – the staff and crew members. These two
groups and their level of satisfaction are addressed in Sections 4.4.1 and 4.4.2, respectively.
4.6.1 Client Satisfaction Survey
Participants in the national occupant survey were surveyed a short time after their homes were
weatherized. Table 4.10 indicates that 94% of the clients were overall very satisfied or satisfied with the
weatherization program. Well over 90% of respondents were very satisfied or satisfied with the work
performed in the home and the final conditions left inside and outside of the home by the weatherization
crews. Satisfaction was less (83%) for the length of time between the client’s request to have their homes
weatherized and when the work was done.64
64
For more information about the client satisfaction survey, see Retrospective Evaluation report Carroll et al. (2014b).
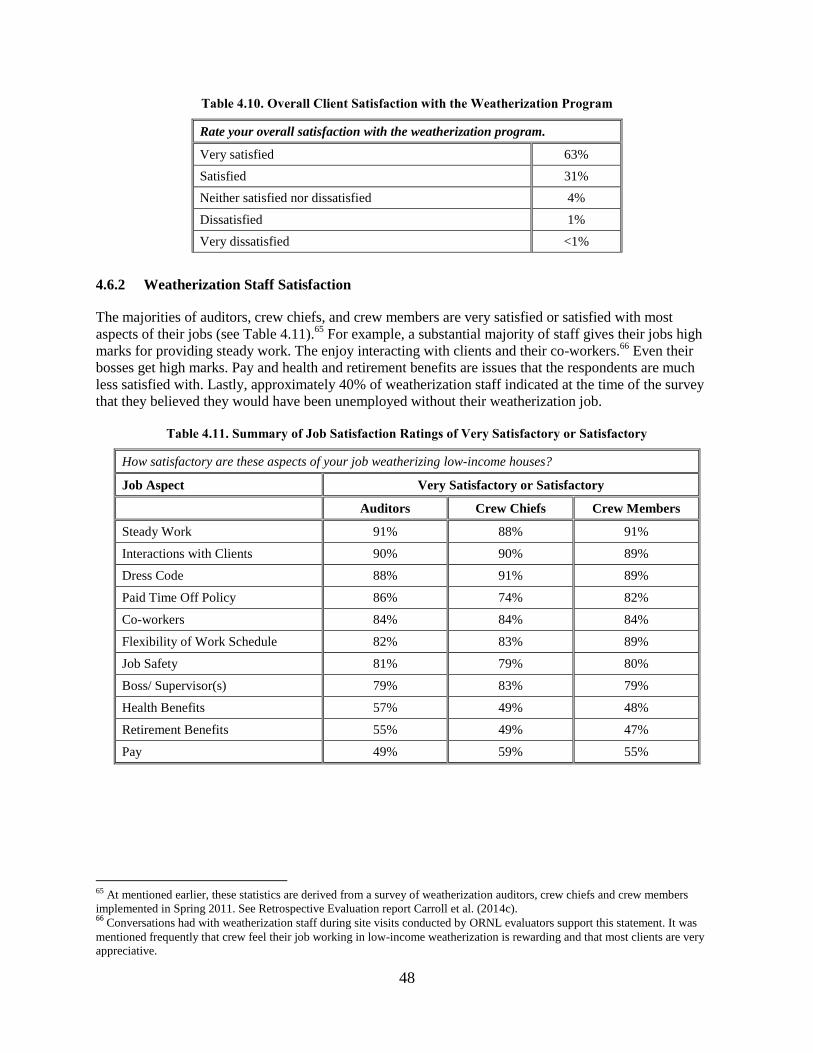
48
Table 4.10. Overall Client Satisfaction with the Weatherization Program
Rate your overall satisfaction with the weatherization program.
Very satisfied 63%
Satisfied 31%
Neither satisfied nor dissatisfied 4%
Dissatisfied 1%
Very dissatisfied <1%
4.6.2 Weatherization Staff Satisfaction
The majorities of auditors, crew chiefs, and crew members are very satisfied or satisfied with most
aspects of their jobs (see Table 4.11).65
For example, a substantial majority of staff gives their jobs high
marks for providing steady work. The enjoy interacting with clients and their co-workers.66
Even their
bosses get high marks. Pay and health and retirement benefits are issues that the respondents are much
less satisfied with. Lastly, approximately 40% of weatherization staff indicated at the time of the survey
that they believed they would have been unemployed without their weatherization job.
Table 4.11. Summary of Job Satisfaction Ratings of Very Satisfactory or Satisfactory
How satisfactory are these aspects of your job weatherizing low-income houses?
Job Aspect Very Satisfactory or Satisfactory
Auditors Crew Chiefs Crew Members
Steady Work 91% 88% 91%
Interactions with Clients 90% 90% 89%
Dress Code 88% 91% 89%
Paid Time Off Policy 86% 74% 82%
Co-workers 84% 84% 84%
Flexibility of Work Schedule 82% 83% 89%
Job Safety 81% 79% 80%
Boss/ Supervisor(s) 79% 83% 79%
Health Benefits 57% 49% 48%
Retirement Benefits 55% 49% 47%
Pay 49% 59% 55%
65 At mentioned earlier, these statistics are derived from a survey of weatherization auditors, crew chiefs and crew members
implemented in Spring 2011. See Retrospective Evaluation report Carroll et al. (2014c). 66
Conversations had with weatherization staff during site visits conducted by ORNL evaluators support this statement. It was
mentioned frequently that crew feel their job working in low-income weatherization is rewarding and that most clients are very
appreciative.

49
4.7 SUMMARY
This section described a program that is technically complex as multiple actions within each phase of
weatherization may need to be taken to achieve the full cost-effective energy savings potential in a home.
The program supports a comprehensive set of training options through training centers and several yearly
national conferences to ensure the program follows the same path towards continuous quality
improvement and innovation.
The national weatherization program is implemented in a diversity of contexts across the country, ranging
from extremely cold climates to extremely hot and dry and humid climates. The program serves clients in
the most urban of areas living in large-multifamily buildings, such as in Manhattan, and in most rural of
areas where local programs spread over service areas that stretch for hundreds of miles, such as in the
Arizona desert. Auditors and weatherization crews work on a wide variety of housing types and vintage
that varies considerably by condition and encounter repair needs and situations requiring clever and
innovative solutions. The results from studies as mentioned in this section show that the work performed
in the field is professionally and technically competent. These studies also note opportunities to improve
the overall quality of the program.
The performance study found that household factors are significant contributors to the wide variations
often seen in energy savings post-weatherization. Weatherization has a differential impact on indoor
environmental quality: CO issues are effectively dealt with whereas air sealing can result in slight
increases in radon and formaldehyde levels. A follow-on study suggests that ventilation installed by the
program can help mitigate the former.
Overall, findings show that clients are quite satisfied with the weatherization services received and
weatherization staff is satisfied with almost all aspects of their careers in low-income weatherization.
“My home has been completed. It was such
a fast and easy process, and I am so
grateful!”
St. Johns Housing Partnership
weatherization client


51
5. WEATHERIZATION “BEYOND THE NUMBERS”
This section summarizes the findings from a set of local weatherization agency case studies. 67
This effort
afforded the research team the opportunity to visit over a dozen local agencies, talk with managers and
crew, tour their facilities, observe representative and notable weatherization jobs, and visit the homes and
talk with clients of their programs. The cases document the day-to-day operations of these agencies and
provide the opportunity for those involved in the program to talk about weatherization outside of the
context of surveys and energy savings metrics. Thus, the case studies go ‘beyond the numbers’ in
describing agency operations, philosophies, challenges faced and met, and prospects for the future. The
main theme that runs through the case studies is that the local weatherization agencies are quite focused in
their mission of helping low-income families through weatherization and other social services.
Agencies were chosen for case study development to exemplify the types of challenges and situations
faced by local weatherization agencies, fundamental differences in management approaches, and
innovative practices. More specifically the set of fourteen agencies chosen for case studies includes:
A range of climates (e.g., cold versus hot-dry)
A range of housing contexts (e.g., rural, urban, large multifamily)
A range of management approaches (e.g., in-house crews vs. contractors)
A range of organizational types (e.g., classic community action agencies versus housing
programs)
Agencies known for high energy savings and effective management
Agencies known for success at leveraging non-DOE funding for weatherization
Agencies known for innovative practices
Several agencies that operate weatherization training centers
The agencies included in the case study project are listed in Table 5.1.68
Two-person research teams
visited the agencies during the period between May 2011 and July 2012. The teams spent approximately
two-days on site, with one day spent conducting interviews discussing the agency’s philosophy, choice of
weatherization model and approach (e.g., in-house crews versus contractor crews), ARRA period ramp-up
and ramp-down69
, operational successes and challenges and agency wish lists and views of the future.
67
See Tonn, Rose and Hawkins (2014a), Weatherization Beyond the Numbers: Case Studies of Fifteen High-Performing
Weatherization Agencies. 68 It should be noted that this list includes a fifteenth entry, Lindsay Park. The research team visited this housing development on
Long Island as part of another task and found its weatherization story so interesting and compelling, that it is mentioned in this
section and fully described in the case study report. 69
The case study task was originally included in the retrospective evaluation. At the time when the evaluation plan was done, in
2006/2007, there were no indications that WAP would significantly change in the near-term, so it was felt that case studies done
a couple of years after the year of focus of the energy savings tasks would not be a methodological issue. As it happened, the
evaluation was delayed, the Recovery Act came into being, and WAP did change during the ARRA period, when these case
studies were conducted. As such, it was felt important to take the opportunity to address the ARRA ramp-up and ramp-down
experiences of our case study agencies in addition to less time-sensitive issues related to agency program philosophies.

52
Table 5.1. Case Studies
Puerto Rico
Housing Resources of Western Colorado – Grand Junction, Colorado
Community Action - Lewiston, Idaho
Salish and Kootenai Housing Authority – Polson, Montana
HELP of Southern Nevada – Las Vegas, Nevada
Community Action Human Resources Agency – Eloy, Arizona
Opportunity Council – Bellingham, Washington
Central Vermont Community Action Council – Barre, Vermont
Corporation for Ohio Appalachian Development – Athens, Ohio
St. Johns Housing Partnership – St. Augustine, Florida
Social Development Commission – Milwaukee, Wisconsin
Association for Energy Affordability – Bronx, New York
Northern Manhattan Improvement Corporation – Manhattan, New York City
Community Action – Minot, North Dakota
Lindsay Park - Long Island City, New York
Section 5.1 summarizes what was learned about local agency program philosophies and approaches to
low-income weatherization. The mission-orientation of the agencies underlies all of these findings.
Section 5.2 presents several additional observations related to program operations.
5.1 LOCAL WEATHERIZATION OPERATIONAL PHILOSOPHIES
The material presented above and found in the case studies themselves depicts a program that is
implemented in many manners at the local level by a very diverse set of local agencies. There is no one
best staffing model (e.g., all in-house crews vs. all contractor crews) for a weatherization agency; it was
found that agencies shape themselves to best operate within their local contexts. In addition, it was found
that various other aspects of agencies’ operational models are quite diverse, for example with respect to
the auditing tools used by an agency (computer vs. general priority lists), the housing stock that it serves
(single-family, mobile home, or large multifamily), and the typical weatherization measures it installs
(wall and ceiling insulation in cold climates like Colorado vs. rooftop solar hot-water heaters in hot and
humid climates like Puerto Rico).
Instead of continuing to describe differences among agencies, the purpose of this subsection is to discuss
the commonalities among the agencies. These commonalities provide the foundation upon which
successful programs flourish regardless of their distinct characteristics. The observations presented below
are motivated and organized around important themes put forth by Peter Drucker in his seminal book,
Managing the Nonprofit Organization: Principles and Practices. Drucker outlines several general
categories in which successful nonprofit organizations excel: mission, commitment, respect, quality,
innovation, and resilience.
Mission – All of the agencies visited as part of the retrospective evaluation have a strong sense of
mission. However, the philosophies underlying those missions vary. For example, the Lewiston, Idaho
agency’s mission is stenciled on its trucks emphasizes a sense of community (See Figure 5.1). Central
Vermont Community Action Council bills itself as promoters of “weatherization, efficiency and
innovation” in that order. Regardless of the mission statements, or even each agency’s understanding of
what the larger view of its work is, the work of weatherization infuses every day’s shared effort.

53
Commitment – Weatherization staff were found to be deeply committed to their jobs, and the agencies
were, in turn, strongly committed to and supportive of their staff members. Clear evidence of this
commitment was seen in the fact that a substantial majority of the core weatherization staff at all of the
agencies have been at their jobs for decades. Despite being able to provide only relatively low wages to
their staffs, agencies work hard to provide such benefits as they can, and a collegial and comfortable
working environment was characteristic of the agencies observed.
The agencies were found to be very committed to their local communities as well. In discussions with the
agencies, their concerns about community economic development, job training, and community stability
were repeatedly expressed. Weatherization agencies often provide individuals with new career paths, give
troubled youth second chances, and give local contractors the training needed to perform home
retrofitting work beyond the immediate low-income weatherization.
In another example, the historic flood faced by the Minot, South Dakota agency in summer 2001 (See
Figure 5.2) challenged it to respond to the community’s needs while staff was also trying to take care of
Figure 5.2 The Flooding of the Souris River
in Minot, summer 2011.
Figure 5.1 Mission Statement on a
Lewiston Community Action
Partnership Truck

54
their own flooded homes and maintain program services. Showing a similar spirit of helping neighbors,
staffs at the Social Development Corporation (SDC), Northern Manhattan Improvement Corporation
(NMIC), Housing Resources of Western Colorado, and St. John’s Housing Partnership (SJHP) regularly
volunteer their time to causes and activities that range far beyond day-to-day weatherization. It is not
uncommon for these weatherization staff members to continue helping clients in their off hours, to
prepare their homes for winter, for example. Personal commitment was found to be a defining
characteristic of the weatherization network.
Respect – The organizational cultures witnessed were infused with respect for the clients served by the
weatherization agencies. Weatherization personnel are acutely cognizant that there are many paths into
poverty and that there are many barriers to rising out of poverty. Many of the homes they work with are in
poor physical condition, and many households struggle to survive from day-to-day. The case study team,
as well as social scientists employed through the Process Field Study, observed weatherization staff
interactions with clients in hundreds of households. Clients and household members were uniformly
treated with respect. For example, auditors are the first personnel to visit a home. None were observed to
be judgmental or condescending; in fact, the team was told repeatedly that those auditors who express
disrespect toward the clients quickly leave the field or are encouraged to leave. The crews were respectful
of household property, as well, cleaning up after the completion of the work. The hundreds of grateful
letters sent to agencies by clients attest to the respectful treatment given them.
It was also clear that agencies respect their staff; this can be seen in how staff is empowered in various
ways; auditors are empowered to develop weatherization job plans that will best meet the needs of
households. They also deal with challenging home construction, and work both within budget constraints
and with the opportunities afforded by leveraged funding. In most cases, the crew chiefs are empowered
to revise job plans in the field when complicated conditions in the homes are revealed. The crew
members, too, are trusted to do their work and empowered to make appropriate decisions. New
crewmembers receive active management and mentoring, but veteran crews and crewmembers, upon
entering a home on the first day of the job, quickly fan out through the house to work on their
assignments without having to be micro-managed.
Quality – The weatherization agencies’ sense of their mission, their commitment to their work and staff,
and the mutual respect given their employers combine to facilitate a culture of high-quality work. A great
deal of pride in the quality of agency employees’ work among the long-term weatherization auditors,
crew chiefs, and crew members was witnessed.
WAP policy requires agencies to inspect all homes following weatherization and for states to inspect a
sample of weatherized homes. It was found that agencies are careful to assign auditing (pre-
“Workers are polite, friendly, very professional, prompt.
Willing to answer any and all questions. Neat and clean. I
feed them lunch everyday – coffee break snack and I did
all cleanup of stuff when they were done to save them a
trip here and time so that they could go on to next job to
help someone else as much as they helped me. Felt like
they were family by the time they left here. They are my
‘EARTH ANGELS!’” Central Vermont Community
Action Council weatherization client

55
weatherization) and inspection (post-weatherization) tasks to different individuals in order to avoid
conflict of interest issues.
A plethora of training opportunities (see Section 4.2), mentoring, and on-the-job training are available to
support high quality work. We visited three organizations with their own state-of-the-art weatherization
training facilities: Opportunity Council in Bellingham, WA, Corporation for Ohio Appalachian
Development (COAD), and Association for Energy Affordability (AEA) in NYC. Figure 5.3 presents
views of COAD’s training center. Each was well-designed, well maintained, and in high demand.
Innovation – Because they are constantly dealing with unforeseen situations as they enter a wide variety
of homes in a wide variety of conditions, agencies need to be both innovative and creative, technically
and organizationally, to deal with these situations. Over the longer term, several agencies have developed
innovative approaches to and techniques for weatherizing homes. For example, a type of perimeter
insulation for mobile home bellies, the “burrito”, was developed by Housing Resources of Western
Training center- various heating systems
Training center- model home
Training center- classroom
Figure 5.3. COAD Training center
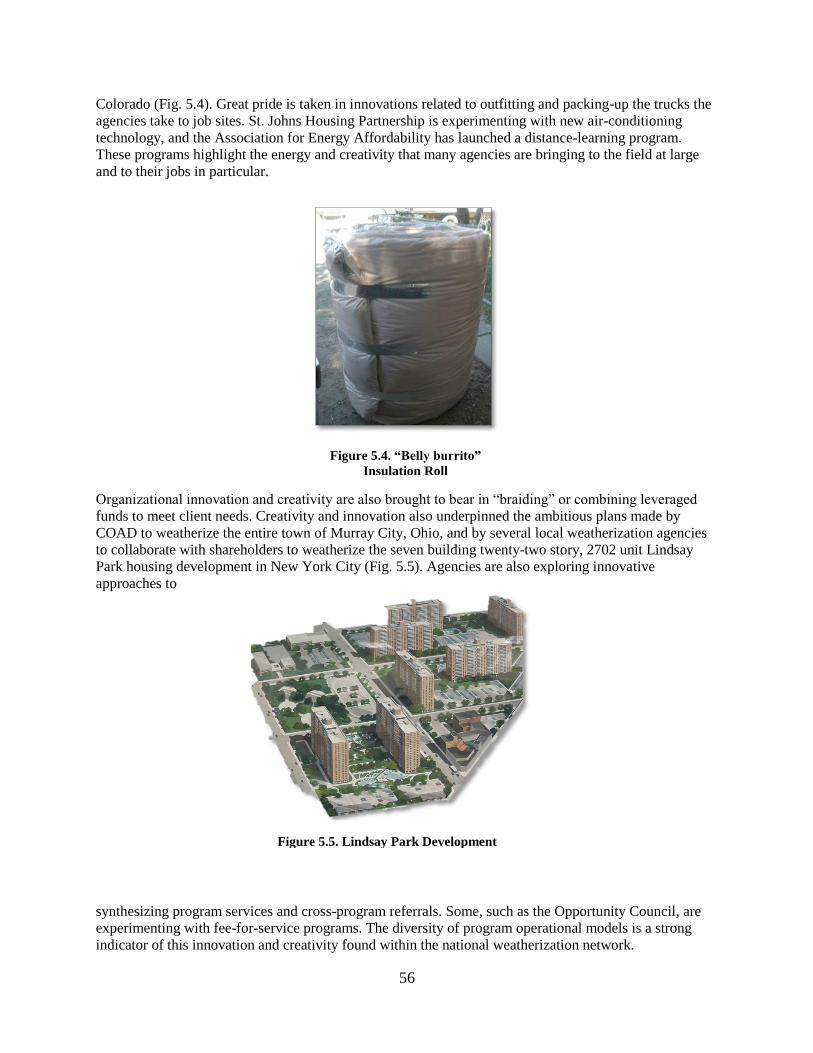
56
Colorado (Fig. 5.4). Great pride is taken in innovations related to outfitting and packing-up the trucks the
agencies take to job sites. St. Johns Housing Partnership is experimenting with new air-conditioning
technology, and the Association for Energy Affordability has launched a distance-learning program.
These programs highlight the energy and creativity that many agencies are bringing to the field at large
and to their jobs in particular.
Organizational innovation and creativity are also brought to bear in “braiding” or combining leveraged
funds to meet client needs. Creativity and innovation also underpinned the ambitious plans made by
COAD to weatherize the entire town of Murray City, Ohio, and by several local weatherization agencies
to collaborate with shareholders to weatherize the seven building twenty-two story, 2702 unit Lindsay
Park housing development in New York City (Fig. 5.5). Agencies are also exploring innovative
approaches to
synthesizing program services and cross-program referrals. Some, such as the Opportunity Council, are
experimenting with fee-for-service programs. The diversity of program operational models is a strong
indicator of this innovation and creativity found within the national weatherization network.
Figure 5.4. “Belly burrito”
Insulation Roll
Figure 5.5. Lindsay Park Development

57
Resilience – The agencies we visited exhibit the characteristic described by Drucker as resilience. That is,
they find ways to survive year after year despite constrained and uncertain budgets, uncertainty about
when funds will be available for expenditure, and often frustrating, confusing, and duplicative regulatory
requirements. Many agencies were founded during the Johnson Administration, during the War on
Poverty, and have been operating weatherization programs since the late 1970s. They have survived
because they have built strong relationships with their key supporters – state weatherization offices, other
state offices, utility companies, other community organizations, and multifamily building owners and
because their management practices have adapted to fit changing circumstances.
The ARRA period’s relatively rapid ramping-up and ramping-down periods tested the weatherization
agencies. The case study team visited several agencies during the ARRA period’s ramp-up and ramp-
down stages. During the ramp-up, agency managers were under an enormous amount of stress to grow
their staffs and meet production numbers. An element of the ARRA legislation, the Davis-Bacon pay-
scale requirements70
, at first delayed production and then produced numerous reporting difficulties.
However, the agencies visited persevered, largely without complaints, despite difficulties and the
increased oversight implemented under ARRA. As ARRA approached its end, many agencies needed to
shrink, not just to pre-ARRA levels, but to even lower levels of staffing because of anticipated cuts in
federal weatherization funding. In response, agencies were forced to lay off staff and crew members; in
fact, many of the individuals interviewed during the case-study visits no longer work at their agencies.
5.2 OTHER OBSERVATIONS
Many local conditions prevent a one-size-fits-all approach for the implementation of weatherization
programs. For example, programs that weatherize relatively few units per year cannot afford full-time,
year round in-house crews. Some local economic situations are more conducive to using contractors than
others. The typical suite of measures installed may also lead a program to choose an in-house model, a
contracting model or a hybrid model.
Another observation is that the national weatherization network does not get the credit it deserves for
dealing with the diversity of conditions it faces in the field. It was mentioned above that the local
programs can adjust to different climates, housing stock, fuel types, and demographics. The network also
can adapt to their particular leveraging opportunities, be they related to healthy homes or weatherizing
entire communities.
Energy education has the potential to be effective as it relates to its impact on energy consumption at a
household level. The best models witnessed included having a separate energy educator who either
accompanied the auditor or visited the home pre-audit. Client agreements also seem to work well (e.g.,
before weatherization measures are installed, the household signs an agreement to improve their energy
uses in specified manners). Auditors and crew members can provide energy education if given the time,
although this time was in short supply during the ARRA period. The intense focus on production limited
the amount of time any agency staff could spend with households.
After witnessing how programs ramped up and then down again during the ARRA period and listening to
their travails during this period of time, one can conclude that more appreciation is due the national
weatherization network for how it dealt with the ARRA funding and Davis-Bacon regulations, which
mandated the levels at which local contractors and local agency staff had to be recompensed.
70
Davis-Bacon is a law passed in the 1930s that requires federal construction projects to pay prevailing wages. These wages are
determined by the Department of Labor (DoL). The Recovery Act required weatherization agencies to pay Davis-Bacon wages
for the first time. It took many months for DoL to determine what those wages would be and imposed significant new paperwork
and accounting requirements on the agencies.

58
Even with the added ARRA funding, the number of homes eligible for weatherization is far greater than
available resources can serve. Many agencies have long waiting lists; many others do not advertise their
programs in an attempt to keep waiting lists manageable. When asked, most estimated that it would take
many decades to serve the number of eligible homes given current funding.
It was observed that increased funding during the ARRA period allowed DOE to pass more money down
to the states and agencies for training and technical assistance (T&TA). This additional money afforded
by a larger program led to more training opportunities and increased quality assurance in the field. The
larger program also allowed DOE to experiment with the installation of renewable energy and energy
efficient measures not currently allowed by standard program rules. The several agencies visited that
received Sustainable Energy Resources for Consumers (SERC) grants had no problems incorporating
these new measures into their programs; most clients reported they were thrilled to be recipients of these
measures.

59
6. ISSUES MOVING FORWARD
The Weatherization Assistance Program has many opportunities and challenges moving forward. This
section addresses some of the more important issues with respect to program operations, health and
safety, the role of weatherization in the national home retrofit marketplace, and dealing with future trends
in demographics, energy prices, and technology.
6.1 PROGRAM OPERATIONS
An important question has arisen concerning the weatherization program: What is its optimal size? Those
within the WAP network are beginning to compare the program pre-ARRA to the program it evolved into
during the ARRA period. For many years, WAP’s annual appropriated funding fluctuated in the $200 -
$250 million dollar range. This amount of funding supported a certain level of training and technical
assistance, and fairly stable set of local weatherization programs of approximately 900 agencies. Most
people familiar with the program believe this level of funding is close to the minimum needed to maintain
a viable national low-income weatherization program that funds enough jobs for the various agencies to
maintain a program and to fund the required training and technical assistance.
Then, ARRA funding considerably increased the size of WAP from PY 2009 thru PY 2012. The ARRA
funding allowed WAP to dramatically increase training and technical assistance (e.g., the number of
weatherization training centers increased from 8 to 34), afford increased in-field quality assurance
inspections, and allowed many agencies to increase weatherization activities to new levels. It can be
argued that economies of scale of the larger program could actually improve in-field work quality (e.g.,
by funding more training centers, increasing quality assurance inspections, allowing Subgrantees to
increase pay and benefits, increasing work proficiency by increasing in-field work experiences) as well as
serve more homes, resulting in synergistically higher energy savings and non-energy benefits (e.g.,
macro-economic impacts, occupant health, reductions in greenhouse gas emissions). One goal of the
Recovery Act evaluation of WAP will be to produce data and information for policy makers to assess the
optimal size question.
6.2 HEALTH & SAFETY
Both health and safety are important issues to WAP and countless others who work in affordable housing
and healthy homes programs. By-and-large, the results presented above strongly suggest that
weatherization services improve health and safety. Still, weatherization is deferred for many homes
because financial resources required to address more than minor health and safety issues are often
minimal or altogether absent. Additionally, DOE funds are not available to address specific health issues
such as asthma in homes. Ways that WAP and its Grantees and Subgrantees can collaborate with health-
based organizations and/or leverage other federal, state-level and even non-governmental funds to more
comprehensively address health and safety issues in homes that WAP touches need to be identified.
6.3 ROLE OF WEATHERIZATION IN THE HOME RETROFIT MARKETPLACE
A theme running through the two subsections immediately above is WAP’s relationships within the larger
housing and health communities. For example, if WAP were able to maintain its full complement of
training centers, then one could imagine that the centers could train workers not only for low-income
weatherization but also for the larger non-low-income home retrofit sector (e.g., through collaborations
with the Home Performance with Energy Star Program). One could even imagine that the WAP programs
themselves could provide internships and mentorships for individuals seeking to work in the larger home

60
retrofit sector.71
Through its training centers and DOE rules and recommendations for home energy
auditing, measure installation, and post-weatherization inspections, WAP could provide national technical
and training leadership with respect to improving home energy efficiency.
6.4. FOCUS ON THE FUTURE
The purpose of this section is to identify major trends in society that could increase or decrease poverty in
the United States generally and the need and demand for low-income weatherization services more
specifically. It is organized around three questions:
1. How might the population eligible for weatherization change over time?
2. How might the number of homes needing weatherization change over time? and
3. How might energy affordability change over time?
The U.S. population is forecast to increase from 320 million to 439 million by 2050. This is a population
increase of almost 40% from today. If poverty rates remain stable, then the pool of WAP eligible homes
would naturally increase from approximately 35 million to 50 million. Given this projected population
increase, one could expect an additional 375,000 additional low-income homes to be eligible for WAP
each year. This increase would be in addition to unmet demand. For example, in PY 2008, for the
reporting agencies (~65%), there were about 380,000 homes on the wait list with an average wait of
approximately 325 days. Therefore, demand was much greater than supply (~97K were weatherized in
PY2008). The Subgrantee respondents indicated it would take on average two or more decades to meet
demand at that level of production.
It should be noted that household size has dropped considerably in the U.S. over the past 100 years, from
4.6 persons per household in 1900, to 3.38 in 1950, to 2.63 in 1990, to 2.59 over the past decade or so. If
the average household size continues to shrink, then the number of homes per capita will continue to
increase, thereby further increasing the pool of households potentially eligible for low-income
weatherization.
Currently, according to WAP rules, only homes weatherized before 1994 are eligible for re-
weatherization. If we operated under the assumption that this cut-off date automatically increases one
year every year, each year a new cohort of past-weatherized homes is added to the larger pool of homes
that could receive weatherization services. Let’s assume that this pool is around 100,000 homes per year.
Again, assuming poverty rates stay stable, the overall increase in homes that may qualify for
weatherization through this channel may increase by this number per year.
Discussions in previous sections suggest that WAP households are, on average, smaller and have more
health issues and disabilities than the U.S. population in general and the typical low-income household.
Demographic trends imply that the pool of the U.S. population fitting the WAP demographic is going to
increase substantially over the next several decades. For example, the population of persons 65 years old
and over is estimated to increase from 40 million in 2010 to over 88 million in 2050 (from 13% to 20% of
the U.S. population). The population 85 years and over is forecast to increase from 5.7 million in 2010 to
19 million in 2050.
The number and percentage of Americans diagnosed with diabetes is expected to increase from 11 million
to 29 million, and from 4% to about 7% of the population, respectively, between the years 2000 and 2050.
71 One ARRA period Weatherization Innovation Pilot Program grantee, YouthBuild International, is testing such a program. This
project will be evaluated as part of the WAP ARRA period evaluation.

61
Rates for various cardiovascular diseases are also expected to increase between 2010 and 2030. For
example, rates for hypertension are expected to increase from 33.9% to 37.3%, coronary artery disease
from 8% to about 9%, heart failure from about 3% to about 4%, and stroke from about 3% to about 4%.
Costs for treating cardiovascular diseases are expected to double by 2030, exceeding $1 trillion.
Unfortunately, these and other trends suggest that the future U.S. population is likely to be much less
healthy, thereby impacting their ability to maintain adequate employment and income. Based on these
trends, one could argue that more than 50 million households could be eligible for WAP in 2050 and the
number of homes that could experience the health benefits found to be attributable to weatherization
could significantly increase.
Elderly households and those with health issues tend to depend on fixed incomes and/or government
benefits to make ends meet. A New York Times article published on February 11, 2012 discussing
government benefits suggests that an increasing number of Americans are dependent on the federal
government for an increasing percentage of their income. Government benefits accounted for 17.6% of
personal income in 2009, with the following breakdown:
Social security – 5.6%
Medicare – 4.1%
Medicaid – 3.1%
Income support (e.g., food stamps, disability payments) – 1.9%
Veterans benefits – 0.4%
Unemployment insurance – 1.1%
For various reasons, many Americans are heavily dependent upon Social Security. “For more than half
(55 %) of elderly beneficiaries, Social Security provides the majority of their cash income. For one-
quarter (26 %), it provides nearly all (more than 90 %) of their income. For 15% of elderly beneficiaries,
Social Security is the sole source of retirement income (See Figure 6.1).”72
Energy costs are only one of
many serious economic issues being confronted by households dependent upon Social Security.
72 See http://www.cbpp.org/cms/index.cfm?fa=view&id=3261 (Accessed February 15, 2012)
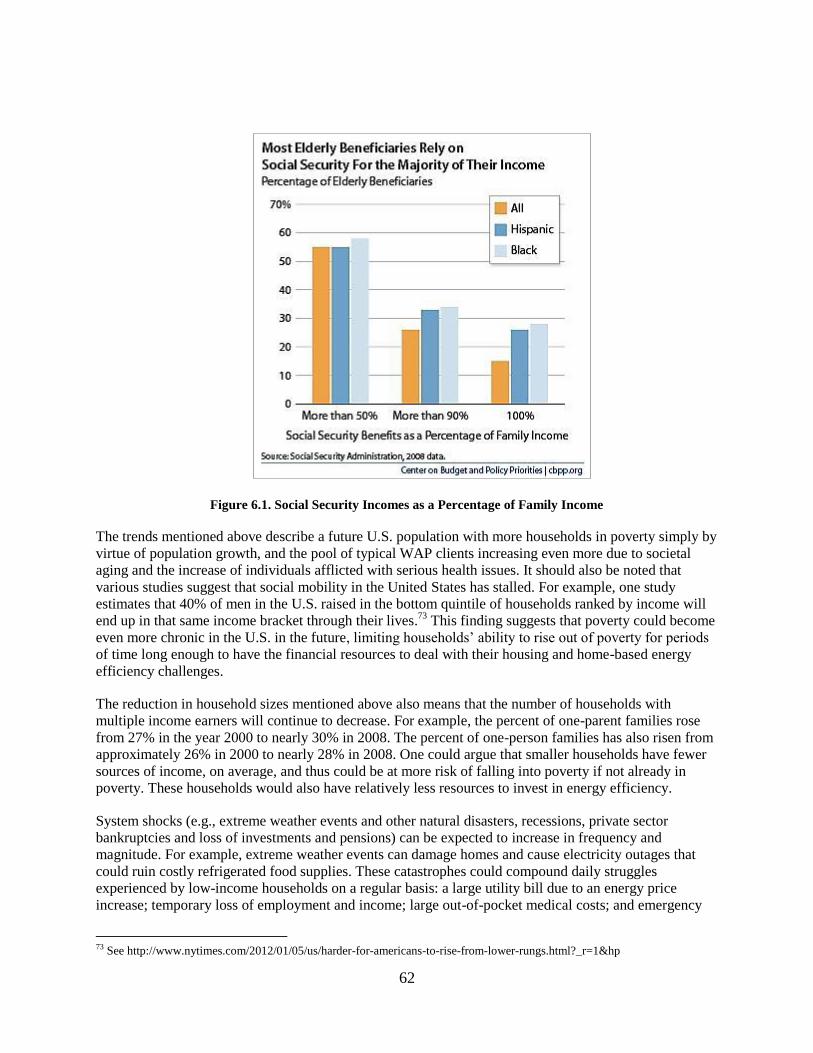
62
Figure 6.1. Social Security Incomes as a Percentage of Family Income
The trends mentioned above describe a future U.S. population with more households in poverty simply by
virtue of population growth, and the pool of typical WAP clients increasing even more due to societal
aging and the increase of individuals afflicted with serious health issues. It should also be noted that
various studies suggest that social mobility in the United States has stalled. For example, one study
estimates that 40% of men in the U.S. raised in the bottom quintile of households ranked by income will
end up in that same income bracket through their lives.73
This finding suggests that poverty could become
even more chronic in the U.S. in the future, limiting households’ ability to rise out of poverty for periods
of time long enough to have the financial resources to deal with their housing and home-based energy
efficiency challenges.
The reduction in household sizes mentioned above also means that the number of households with
multiple income earners will continue to decrease. For example, the percent of one-parent families rose
from 27% in the year 2000 to nearly 30% in 2008. The percent of one-person families has also risen from
approximately 26% in 2000 to nearly 28% in 2008. One could argue that smaller households have fewer
sources of income, on average, and thus could be at more risk of falling into poverty if not already in
poverty. These households would also have relatively less resources to invest in energy efficiency.
System shocks (e.g., extreme weather events and other natural disasters, recessions, private sector
bankruptcies and loss of investments and pensions) can be expected to increase in frequency and
magnitude. For example, extreme weather events can damage homes and cause electricity outages that
could ruin costly refrigerated food supplies. These catastrophes could compound daily struggles
experienced by low-income households on a regular basis: a large utility bill due to an energy price
increase; temporary loss of employment and income; large out-of-pocket medical costs; and emergency
73 See http://www.nytimes.com/2012/01/05/us/harder-for-americans-to-rise-from-lower-rungs.html?_r=1&hp

63
home repairs. These unanticipated events have significant negative impacts on households that are already
in need and can cause additional households to fall into poverty and experience extreme energy burdens.
In addition to shrinking household sizes, globalization can be expected to continue to put pressure on
wages in the United States. For example, the loss of manufacturing jobs, from just over 20 million in
1980 to approximately 13 million in 2008, has effectly reduced the rolls of the middle class in the U.S.
The service jobs that have increased during this period of time tend to be part-time providing lower
incomes and fewer benefits. There are few signs that globalization will alter these trends any time in the
future.
Thus, there are many pressures on the incomes of tens of millions of households in the U.S. What are the
trends with respect to the prices of consumer goods and services? Unfortunately, the Consumer Price
Index is forecast to annually increase approximately 3% between now and 2020, further straining the
resources of households with limited incomes and on fixed budgets.
What about energy prices? It is widely understood that energy prices are volatile and difficult to forecast.
The U.S. Energy Information Administration recently published its 2013 Annual Energy Outlook (See
Table 6.1). The price forecasts are quite sensitive to assumptions. For example, if a carbon tax were
implemented and the price of carbon averaged around $25 per ton from now until 2040, electricity prices
would be significantly higher than in the reference case. Conversely, if new energy demand technologies
are continually adopted reducing energy demand, prices could fall from the base case in the year 2040.
However, from the viewpoint of a low-income household, the real prices of both natural gas and
electricity are forecasted to increase over time. It should also be kept in mind that elderly households
consume more energy per capita than other households because they spend more time in their homes and
tend to be more sensitive to cold conditions, which makes prospective increases in energy prices
particularly problematic.74
One piece of good news is that the energy efficiency of appliances and HVAC systems are expected to
continue to improve. The table below (Table 6.2) was drawn from projections also made by the Energy
Information Administration. The projections were made for nine geographic regions and forecast the
average efficiency of the stock in the field in 2030 compared to the actual efficiencies in 2010. The range
in the table represents the lowest and highest projections across the nine regions. These forecasts suggest
that programs like WAP that fund the acquisition of new, more energy-efficiency technologies can
continue to provide increasing energy cost benefits to low-income households. To take advantage of these
dramatic improvements, one could reduce the time WAP must wait, due to DOE requirements, to revisit
previously weatherized homes.
74 See Tonn, B. and Eisenberg, J. (2007)

64
Table 6.1. Forecasted Energy Prices in 2011($) per Unit*
2012 2026 2040
Nat Gas
($/MMBtu)
Elect.
(Cents/kWh)
Nat Gas
($/MMBtu)
Elect.
(Cents/kWh)
Nat Gas
($/MMBtu)
Elect.
(Cents/kWh)
Reference
Case
2.62 9.4 5.02 9.5 7.83 10.8
Carbon $25 2.62 9.4 6.06 12.4 7.77 13.6
High Oil
Price
2.62 9.4 5.33 9.8 8.96 11.3
Best
Available
Demand
Technology
2.62 9.4 4.15 9.1 7.16 9.9
*See http://eia.doe.gov
Table 6.2. Trends in the Efficiency of Selected Residential Energy End-Use Technologies
2010 2030 Avg. % Change
Single Family
Average Natural Gas Furnace Efficiency
(AFUE)
0.83 – 0.84 0.85 – 0.93 6.4%
Average Cooling Efficiency (COP) 12.3 – 12.5 14.1 – 14.8 16.5%
Average Water Heating Efficiency (EF) 0.54 – 0.63 0.54 – 0.66 2.3%
Average Refrigerator Efficiency (kWh/year) 611.5 – 614.9 534.7 – 541.3 12.3%
Multifamily
Average Natural Gas Furnace Efficiency
(AFUE)
0.83 - 0.84 0.84 – 0.92 5.6%
Average Cooling Efficiency (COP) 12.4 – 13.1 14.1 – 14.3 11.3%
Average Water Heating Efficiency (EF) 0.54 – 0.59 0.54 – 0.66 6.1%
Average Refrigerator Efficiency (kWh/year) 612.0 - 614.9 534.7 – 540.9 12.3%
6.5 SUMMARY
Like any governmental program, WAP has its own issues and challenges to deal with. These issues fall
into the categories of: program operations, health and safety, and interactions with the larger home retrofit
market. Major demographic and economic trends suggest that demand for low-income weatherization will
substantially increase in the future.

65
7. CONCLUSIONS
In PY 2008, DOE’s WAP supported the weatherization of approximately 100,000 homes. Based on the
evaluation of WAP during this time period, one can support the conclusions that the program:
Is Effective
o Natural gas consumption was reduced by almost 18% in the most common type of home
weatherized by WAP – single family heated with natural gas
o Similar energy savings were estimated for other categories of single family homes (e.g.,
heated with fuel oil), units in small multifamily buildings, and centrally heated large
multifamily buildings in NYC
o There is little evidence that energy savings were ‘taken back’ by households through
increased energy use post-weatherization
o Numerous measures suggest that households’ health and well-being increased post-
weatherization
o The program supported 8,500 jobs
o Significant reductions in GHG and other environmental pollutants can be attributable to
the program
o Overall, when considering energy cost savings and measure costs, the program is cost-
effective
Is Competent
o The national weatherization network offered a comprehensive range of training and
technical assistance programs to the weatherization community
o Clients were extremely satisfied with the weatherization services they received
o Weatherization staff were observed to be professional and exceedingly respectful as they
delivered weatherization services
Is Mission-oriented
o Agencies have adopted sound non-profit management principles such as successful
leveraging and partnering to help them achieve their missions
o Numerous agencies go to extraordinary lengths to help their clients
Although the program has proven itself to be effective and competent across many categories, like most
programs, there is always opportunity for growth and improvement. Areas identified for on-going
improvement include:
Increasing energy costs savings to measure cost ratios (i.e., SIRs)

66
Improving the quality of work completed in the field
Increasing the ability to address serious health and safety issues the program encounters upon
engaging clients in the home environment
Improving collaboration with players in the larger home retrofit market
Positioning itself to meet challenges related to increasing demands and opportunities for low-
income weatherization in the future
67
REFERENCES
Retrospective Evaluation Reports
Bensch, I., Keene, A., Cowan, C., and Koski, K. 2014. National Weatherization Assistance Program
Characterization: Describing the Pre-ARRA Program. ORNL/TM-2013/188, Oak Ridge National
Laboratory, Oak Ridge, Tennessee, April.
Berger, J., Lenahan, T., and Carroll, D. 2014. National Weatherization Assistance Program Process Field
Study: Findings from Observations and Interviews at 19 Local Agencies Across the Country. ORNL/TM-
2014/304, Oak Ridge National Laboratory, Oak Ridge, Tennessee, September.
Blasnik, M., Dalhoff, G., Carroll, D., and Ucar, F. 2014a. National Weatherization Assistance Program
Impact Evaluation – Energy Impacts for Mobile Homes. ORNL/TM-2014/84, Oak Ridge National
Laboratory, Oak Ridge, Tennessee, November.
Blasnik, M., Dalhoff, G., Carroll, D., and Ucar, F. 2014b. National Weatherization Assistance Program
Impact Evaluation: Energy Impacts for Small Multifamily Buildings. ORNL/TM-2014/325, Oak Ridge
National Laboratory, Oak Ridge, Tennessee, September.
Blasnik, M., Dalhoff, G., Carroll, D., and Ucar, F. 2014c. National Weatherization Assistance Program
Impact Evaluation: Energy Impacts for Large Multifamily Buildings. ORNL/TM-2014/332, Oak Ridge
National Laboratory, Oak Ridge, Tennessee, September.
Blasnik, M., Dalhoff, G., Pigg, S., Mendyk, A., Carroll, D., and Ucar, F. 2014d. National Weatherization
Assistance Program Impact Evaluation: Energy Impacts for Single Family Homes. ORNL/TM-2015/13,
Oak Ridge National Laboratory, Oak Ridge, Tennessee, September.
Burton, M. et al. 2014. Macro-economic Impacts of the Weatherization Assistance Program for PY 2008.
ORNL/TM-2014/98, Oak Ridge National Laboratory, Oak Ridge, Tennessee, September.
Carroll, D., Berger, J., Miller, C., and Driscoll, C. 2014a. National Weatherization Assistance Program
Impact Evaluation - Baseline Occupant Survey: Assessment of Client Status and Needs. ORNL/TM-
2015/22, Oak Ridge National Laboratory, Oak Ridge, Tennessee, October.
Carroll, D., Berger, J., Miller, C., and Driscoll, C. 2014b. National Weatherization Assistance Program
Impact Evaluation - Client Satisfaction Survey: WAP Service Delivery from the Client’s Perspective.
ORNL/TM-2014/335, Oak Ridge National Laboratory, Oak Ridge, Tennessee, September.
Carroll, D., Berger, J., Miller, C., and Johnson, DB. 2014c. National Weatherization Assistance Program
Impact Evaluation: Weatherization Staff Survey. ORNL/TM-2014/323, Oak Ridge National Laboratory,
Oak Ridge, Tennessee, September.
Carroll, D., Kim, C., and Driscoll, C. 2014d. National Weatherization Assistance Program Impact
Evaluation: Eligible Population Report. ORNL/TM-2014/312, Oak Ridge National Laboratory, Oak
Ridge, Tennessee, September.
Carroll, D. et al. 2014e. Working Paper: National Weatherization Assistance Program Impact Evaluation:
Environmental Emissions. ORNL/TM-2014/411, Oak Ridge National Laboratory, Oak Ridge, Tennessee,
September.
68
Hawkins, B., Rose, E., Tonn, B., and Bensch, I. 2014. Findings from Survey Administered to Trainees of
Weatherization Training Centers. ORNL/TM-2014/306, Oak Ridge National Laboratory, Oak Ridge,
Tennessee, September.
Pigg, S., Cautley, D., Francisco, P. with Hawkins, B., and Brennan, T. 2014a. Weatherization and Indoor
Air Quality: Measured Impacts in Single-Family Homes Under the Weatherization Assistance Program.
ORNL/TM-2014/170, Oak Ridge National Laboratory, Oak Ridge, Tennessee, September.
Pigg, S. 2014b. National Weatherization Assistance Program Impact Evaluation: Impact of Exhaust-Only
Ventilation on Radon and Indoor Air Quality – A Field Investigation. ORNL/TM-2014/367, Oak Ridge
National Laboratory, Oak Ridge, Tennessee, September.
Pigg, S. 2014c. National Weatherization Assistance Program Impact Evaluation: A Field Investigation of
Apparent Low and High Savers. ORNL/TM-2014/308, Oak Ridge National Laboratory, Oak Ridge,
Tennessee, October.
Ternes, M., Schweitzer, M., Tonn, B., Schmoyer, R., and Eisenberg, J. 2007. National Evaluation of the
Department of Energy’s Weatherization Assistance Program (WAP): Program Year 2006 Experimental
Plan. ORNL/CON-498, Oak Ridge National Laboratory, Oak Ridge, TN, February.
Tonn, B., Rose, E., and Hawkins, B. 2014a. Weatherization Beyond the Numbers: Case Studies of Fifteen
High-Performing Weatherization Agencies – Conducted May 2011 Through July 2012. ORNL/TM-
2014/317, Oak Ridge National Laboratory, Oak Ridge, Tennessee, September.
Tonn, B., Rose, E., Hawkins, B., and Conlon, B. 2014b. Health and Household-Related Benefits
Attributable to the Weatherization Assistance Program. ORNL/TM-2014/345, Oak Ridge National
Laboratory, Oak Ridge, Tennessee, September.
Treitler, I., Gregory, J. with Rose, A. and Schilling, P. 2013. Personal Insights and Anecdotes about the
Weatherization Assistance Program. ORNL/TM-2015/21, Oak Ridge National Laboratory, Oak Ridge,
Tennessee, July.
Recovery Act Evaluation Reports
Blasnik, M., Dalhoff, G., Carroll, D., Ucar, F., Bausch, D., and Johnson, D. 2015a. “Evaluation of the
National Weatherization Assistance Program During Program Years 2009-2011 (American Recovery and
Reinvestment Act Period): Energy Impact for Mobile Homes. ORNL/TM-2014/558, Oak Ridge National
Laboratory, Oak Ridge, TN, July.
Blasnik, M., Dalhoff, G., Carroll, D., Ucar, F., and Bausch, D. 2015b. Evaluation of the National
Weatherization Assistance Program During Program Years 2009-2011 (American Recovery and
Reinvestment Act Period): Energy Impacts for Single Family Homes. ORNL/TM-2014/582, Oak Ridge
National Laboratory, Oak Ridge, TN, July.
Carroll, D. and Bausch, D. 2015. Environmental Emissions Nonenergy Benefits Working Paper: ARRA
Period. ORNL/TM-2015/127, Oak Ridge National Laboratory, Oak Ridge, TN, July.
Carroll, D., Dalhoff, G., Johnson, D., Bausch, D., and Blasnik, M. 2015a. Energy Impacts for
Multifamily Buildings: Evaluation of the National Weatherization Assistance Program During Program
69
Years 2009-2011 (American Recovery and Reinvestment Act Period). ORNL/TM-2014/583, Oak Ridge
National Laboratory, Oak Ridge, TN, July.
Conlon, B. and Tonn, B. 2015. Findings from Survey Administered to Weatherization Training Centers.
ORNL/TM-2015/84, Oak Ridge National Laboratory, Oak Ridge, TN, July.
Pigg, S. 2015. National Weatherization Assistance Program Impact Evaluation – A Pilot Monitoring
Study of Cooling System Consumption and Savings under the WAP Program. ORNL/TM-2014/339, Oak
Ridge National Laboratory, Oak Ridge, TN, July.
Rose, E., Hawkins, B., Tonn, B., Paton, D. and Shah, L. 2015a. Exploring the Potential of Weatherization
and Healthy Homes Interventions on Asthma-related Medicaid Claims and Costs in a Small Cohort in
Washington State. ORNL/TM-2015/213, Oak Ridge National Laboratory, Oak Ridge, TN, July.
Rose, E., Hawkins, B., Conlon, B., Treitler, I. 2015b. Assessing the Potential of Social Networks as a
Means for Information Diffusion – the Weatherization Experiences (WE) Project. ORNL/TM-2014/405,
Oak Ridge National Laboratory, Oak Ridge, TN.
Rose, E., Hawkins, B., Ashcraft, L., and Miller, C. 2015c. Exploratory Review of State, Agency and
Client Experiences with Deferred Services Under the Weatherization Assistance Program. ORNL/TM-
2014/364 Oak Ridge National Laboratory, Oak Ridge, TN, July.
Tonn, B. and Goeltz, R. 2015. National Weatherization Assistance Program Evaluation: Assessment of
Refrigerator Energy Use. ORNL/TM-2015/150, Oak Ridge National Laboratory, Oak Ridge, TN, March.
Tonn, B. and Rose, E. 2015. U.S. Territories and Weatherization Assistance Program During the
Recovery Act Period. ORNL/TM-2014/592, Oak Ridge National Laboratory, Oak Ridge, TN, March.
Tonn, B., Rose, E., and Hawkins, B. 2015a. Survey of Recipients of Weatherization Assistance Program
Services: Assessment of Household Budget and Energy Behavior Pre- to Post-Weatherization.
ORNL/TM-2015/64, Oak Ridge National Laboratory, Oak Ridge, TN, March.
Tonn, B., Rose, E., and Hawkins, B. 2015b. National Weatherization Assistance Program
Characterization Describing the Recovery Act Period. ORNL/TM-2015/195, Oak Ridge National
Laboratory, Oak Ridge, TN, March.
Tonn, B., Rose, E., Schmoyer, R., Eisenberg, J., Ternes, M., Schweitzer, M., and Hendrick, T., 2011.
Evaluation of the National Weatherization Assistance Program During Program Years 2009-2011
(American Recovery Act and Reinvestment Period). ORNL/TM-2011/87, Oak Ridge National
Laboratory, Oak Ridge, TN, December.
References Other
Brown, M., Berry, L., Balzer, R., and Faby, E. 1993. National Impacts of the Weatherization Assistance
Program in Single-Family and Small Multifamily Dwellings. ORNL/CON-326, Oak Ridge National
Laboratory, Oak Ridge, Tennessee.
Brown, M., Berry, L., and Kinney, L. 1994. Weatherization Works: Final Report of the National
Weatherization Evaluation. ORNL/CON-395, Oak Ridge National Laboratory, Oak Ridge, TN,
September.

70
Greening, L., Greene, D., and Difigilo, C. 2000. Energy Efficiency and Consumption – The Rebound
Effect – A Survey. Energy Policy, Vol. 28, No. 6-7, 389-401.
Levins, W. and Ternes, M. 1994. Impacts of the Weatherization Assistance Program in Fuel-Oil Heated
Houses. ORNL/CON-327, Oak Ridge National Laboratory, Oak Ridge, TN, October.
Tonn, B. and Eisenberg, J. 2007. “The Aging U.S. Population and Residential Energy Demand,” Energy
Policy, Vol. 35, 743-745.


A-1
APPENDIX A. SUMMARY OF RETROSPECTIVE EVALUATION DATA
COLLECTION ACTIVITIES


A-3
APPENDIX A. SUMMARY OF RETROSPECTIVE EVALUATION DATA COLLECTION
ACTIVITIES
The Retrospective Evaluation of the U.S. Department of Energy’s Weatherization Assistance Program
entailed a large and comprehensive data collection effort. Table A.1 lists the major data collection
activities that were national in scope. Table A.2 lists the data collection activities undertaken by the
numerous field studies. Details about the sample selection methodologies can be found in Ternes et al.
(2007). Details about response rates and other issues related to the administration of the information
collection instruments and methods are contained in the individual reports.
Table A.1. Major Data Collection Activities
Designation Name Description
S1 Grantees Program
Information Survey
All Grantees were asked to complete this web-based
survey about program finances, leveraging, program
procedures and training.
S2 Subgrantees Program
Information Survey
All Subgrantees were asked to complete this web-based
survey about program finances, and leveraging.
S3 Subgrantees Detailed
Program Information
Survey
Four hundred Subgrantees were randomly selected to
complete a detailed, web-based survey about audit
procedures, diagnostics and training. These agencies were
also asked to provide information for DF2, DF3 and DF4
as well as assist with the S4 and S5 surveys.
S4 Occupant Survey A random sample of homes about to be weatherized and
weatherized one year previously were selected for this
phone survey that contained questions on energy
behavior, health and safety, demographics and
satisfaction with weatherization services delivered. These
homes were surveyed again approximately eighteen
months later.
S5 Weatherization Staff
Survey
A random sample of weatherization auditors, crew chiefs,
and crew were selected for this phone survey that
contained questions on their careers in weatherization, job
satisfaction, training, and in-field experiences. The
respondents were surveyed approximately eighteen
months later to track their career paths.
DF2 Housing Unit
Information Data Form
A random sample of single family and mobile homes
weatherized by the four hundred Subgrantees during
PY2008 were selected for the Subgrantees to provide
details about what diagnostic procedures were used, what
measures were installed, and job costs.
DF3 Building Information
Data Form
Subgrantees provided for a random sample of small
multifamily and large multifamily buildings and all the
large multifamily buildings in the special New York City
study information on diagnostic procedures, what
measures were installed, and job costs for the selected
jobs.
DF4 Subgrantee Utility Bills
Data Form
For each home and multifamily building heated with
natural gas or electricity that the Subgrantees provided
DF2 and DF3 data, the Subgrantees were also asked to
provide information utility account information.
DF5 Utility Information
Data Form
For each home and building included in DF4, the correct
utilities were asked to complete this data form to provide
up to 60 months of billing histories.
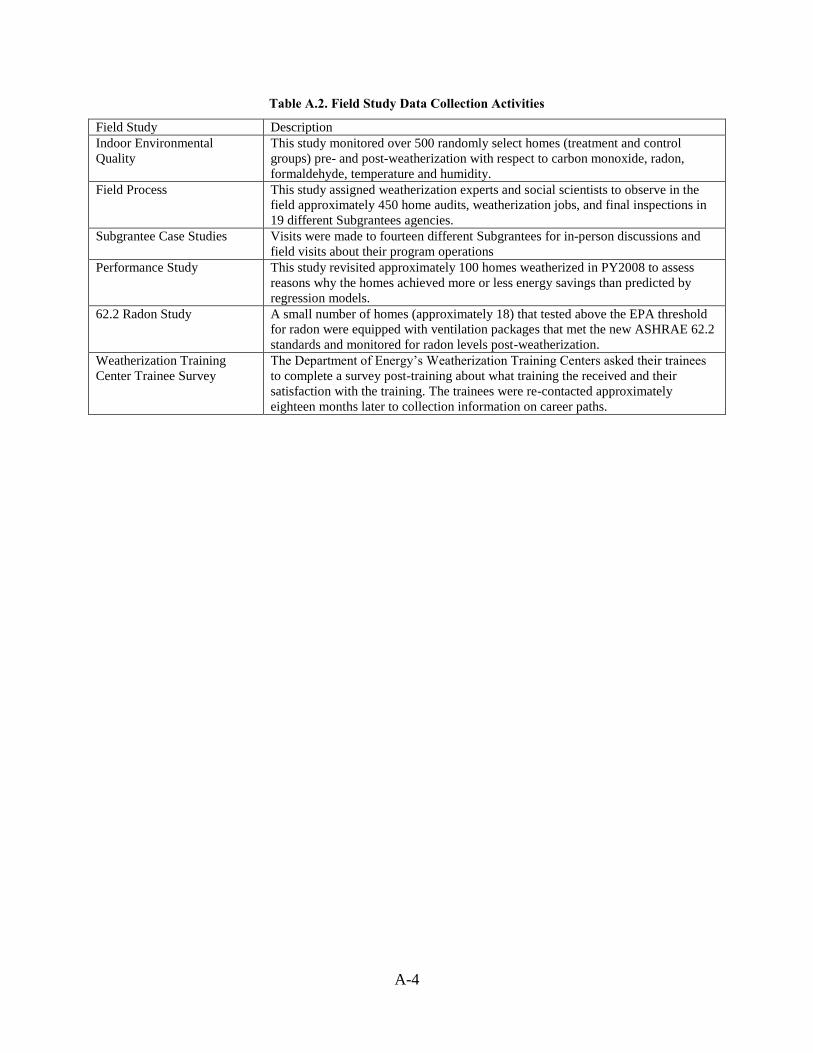
A-4
Table A.2. Field Study Data Collection Activities
Field Study Description
Indoor Environmental
Quality
This study monitored over 500 randomly select homes (treatment and control
groups) pre- and post-weatherization with respect to carbon monoxide, radon,
formaldehyde, temperature and humidity.
Field Process This study assigned weatherization experts and social scientists to observe in the
field approximately 450 home audits, weatherization jobs, and final inspections in
19 different Subgrantees agencies.
Subgrantee Case Studies Visits were made to fourteen different Subgrantees for in-person discussions and
field visits about their program operations
Performance Study This study revisited approximately 100 homes weatherized in PY2008 to assess
reasons why the homes achieved more or less energy savings than predicted by
regression models.
62.2 Radon Study A small number of homes (approximately 18) that tested above the EPA threshold
for radon were equipped with ventilation packages that met the new ASHRAE 62.2
standards and monitored for radon levels post-weatherization.
Weatherization Training
Center Trainee Survey
The Department of Energy’s Weatherization Training Centers asked their trainees
to complete a survey post-training about what training the received and their
satisfaction with the training. The trainees were re-contacted approximately
eighteen months later to collection information on career paths.