Embed Size (px)
Citation preview
hydrology
Article
Water Budget Analysis Considering Surface Water–GroundwaterInteractions in the Exploitation of Seasonally VaryingAgricultural Groundwater
Sun Woo Chang and Il-Moon Chung *
�����������������
Citation: Chang, S.W.; Chung, I.-M.
Water Budget Analysis Considering
Surface Water–Groundwater
Interactions in the Exploitation of
Seasonally Varying Agricultural
Groundwater. Hydrology 2021, 8, 60.
https://doi.org/10.3390/
hydrology8020060
Academic Editor: Okke Batelaan
Received: 21 February 2021
Accepted: 24 March 2021
Published: 2 April 2021
Publisher’s Note: MDPI stays neutral
with regard to jurisdictional claims in
published maps and institutional affil-
iations.
Copyright: © 2021 by the authors.
Licensee MDPI, Basel, Switzerland.
This article is an open access article
distributed under the terms and
conditions of the Creative Commons
Attribution (CC BY) license (https://
creativecommons.org/licenses/by/
4.0/).
Department of Land, Water and Environmental Research, Korea Institute of Civil Engineering and BuildingTechnology, Goyang 10223, Korea; [email protected]* Correspondence: [email protected]; Tel.: +82-31-910-0334
Abstract: In South Korea, groundwater intended for use in greenhouse cultivation is collected fromshallow riverside aquifers as part of agricultural activities during the winter season. This studyquantified the effects of intensive groundwater intake on aquifers during the winter and examinedthe roles of nearby rivers in this process. Observation data were collected for approximately twoyears from six wells and two river-level observation points on the study site. Furthermore, theriver water levels before and after the weir structures were examined in detail, because they aredetermined by artificial structures in the river. The structures have significant impacts on the inflowand outflow from the river to the groundwater reservoirs. As a result, a decline in groundwater levelsowing to groundwater depletion was observed during the water curtain cultivation (WCC) period inthe winter season. In addition, we found that the groundwater level increased owing to groundwaterrecharge due to rainfall and induced recharge by rivers during the spring–summer period after theend of the WCC period. MODFLOW, a three-dimensional difference model, was used to simulate thegroundwater level decreases and increases around the WCC area in Cheongwon-gun. Time-variablerecharge data provided by the soil and water assessment tool model, SWAT for watershed hydrology,was used to determine the amount of groundwater recharge that was input to the groundwater model.The groundwater level time series observations collected from observation wells during the two-yearsimulation period (2012 to 2014) were compared with the simulation values. In addition, to determinethe groundwater depletion of the entire demonstration area and the sustainability of the WCC, thequantitative water budget was analyzed using integrated hydrologic analysis. The result indicatedthat a 2.5 cm groundwater decline occurred on average every year at the study site. Furthermore, ananalysis method that reflects the stratification and boundary conditions of underground aquifers,hydrogeologic properties, hydrological factors, and artificial recharge scenarios was established andsimulated with injection amounts of 20%, 40%, and 60%. This study suggested a proper artificialrecharge method of injecting water by wells using riverside groundwater in the study area.
Keywords: water curtain cultivation; surface–groundwater interaction; MODFLOW; water bud-get analysis
1. Introduction
Water is one of the most important resources on Earth and water used for irriga-tion accounts for a significant portion of the global water demand [1]. For stable foodproduction, water supply methods are being diversified, and water usage is graduallyincreasing. Recently, the rate at which groundwater is consumed for irrigation has been in-creasing rapidly. Moreover, the continuous consumption of water resources has worsenedthe drought condition worldwide [2]. In many countries, excessive use of groundwaterfrom shallow aquifers is perceived as the main cause of reduced available surface wa-ter supply [3]. Consequently, groundwater changes attributed to aquifer depletion havebeen investigated, and various predictions have been made in sites with large extraction
Hydrology 2021, 8, 60. https://doi.org/10.3390/hydrology8020060 https://www.mdpi.com/journal/hydrology
Hydrology 2021, 8, 60 2 of 18
wells [4–6]. Groundwater withdrawal from deep aquifers leads to permanent depletionexcept in cases where the groundwater is recharged by high-intensity rainfall, which occursoccasionally [7]. In contrast, groundwater in shallow aquifers has different characteristics,because it can be renewed by nearby rivers or rainfall. Moreover, continuous large-scaledepletion varies near the river environment owing to groundwater–surface-water inter-action. Thus, shallow aquifers undergo spatiotemporal changes owing to various factors;seasonality is an indispensable element in understanding the underground water resourcesof shallow aquifers. In monsoon or semi-arid climates, rainfall is concentrated during oneperiod in a year. During these periods, aquifers are recharged. Furthermore, anthropogenicactivities, which are the main causes of water depletion, also exhibit seasonality. In manyareas, the abstraction of groundwater may increase during the dry season [8–10]. Twoopposite activities (groundwater recharge and abstraction from shallow aquifers) occur inaccordance with the seasonal cycle. This is observed in large agricultural areas in monsoonclimates. For example, the groundwater level of the Ganges–Brahmaputra–Meghna (GBM)delta in Bangladesh is decreasing at an annual rate of 0.1–0.5 m/year owing to intensiveirrigation. In the Dhaka area, where the degree of groundwater usage is high, the ground-water is decreasing at a maximum speed of 1 m/year [9]. The recharge of shallow aquifersis indispensable for the sustainable groundwater use. However, Perrin [10] found thatthe locally heterogeneous pattern of groundwater depletion intensifies owing to seasonalcharacteristics, and that the imbalance worsens during low-rainfall years. Even in mon-soon areas where precipitation is relatively abundant, the annual pattern of groundwateruse varies considerably depending on the degree of yearly precipitation. For example,Pavelic et al. [8] investigated the upper Bhima River basin in India and reported that lessthan 10% of pumping wells became dry during the off-monsoon season dry if there waslarge precipitation the previous year, whereas 40% of pumping wells became dry if the prioryear had low rainfall. The seasonal precipitation pattern causes short-term reliability issuesrather than long-term groundwater depletion, as they influence food production. It hasbeen found that extreme water shortage caused by extreme droughts in conjunction withclimate changes also causes problems in shallow aquifers [11]. Thus, even rechargeablegroundwater areas are influenced by factors that cause or interfere with recharging (i.e.,adjacent geographic characteristics, climate, relationship with rivers, and use of publicwater). Therefore, a highly precise analysis that considers multiple hydrological and geo-logic parameters, as well as site-specific conditions, is required to determine whether thegroundwater in the study area is a sustainably available resource.
Groundwater resources located along rivers are influenced considerably by hydrome-teorological effects, such as changes in precipitation and natural recharge amounts, use ofsurrounding lands, various river environments, maintenance status of riverside facilities,and agricultural water intake methods. To identify the water circulation state of riversidegroundwater under the complex effects of natural and artificial environments and to pre-pare for water resource depletion and pollution of the water environment, the behavior ofeach hydrological component should be identified. In addition, an unbiased quantitativeevaluation of each hydrological component of the corresponding groundwater systemmust be obtained using raw data collected from the site of interest.
Ruud et al. [12] named the semi-arid basin where intensive groundwater developmentis performed as an “active basin” and pointed out analytical errors caused by unmeasurableor inaccurate data when analyzing the water budget of an active basin. In particular, it maybe difficult to acquire data, because usage data for agricultural groundwater or privatepumping wells do not exist or cannot be obtained due to privacy issues [2]. Given thatthe measurement of groundwater usage in a large basin-scale area increases the economicburden of research, groundwater usage is an unknown factor in many studies [12].
The seasonality of groundwater use and the problem of groundwater usage measure-ments are similar in South Korea to other monsoon and semi-arid climates. In 2015, theagricultural water usage of South Korea was 2.08 billion m3. This accounted for 51% ofthe total groundwater usage [13]. Since 2009, domestic and industrial water usage has not
Hydrology 2021, 8, 60 3 of 18
changed significantly; thus, the use of agricultural water has become a major reason forthe increase in total groundwater usage [14]. Greenhouse cultivation methods for farmingusing groundwater are becoming increasingly popular in South Korea. The demand forfresh vegetables and fruits that are difficult to store for long periods is increasing, as thedemand is high throughout the year and the income level of people is rising. Although thedemand and supply of off-season agricultural products throughout the year is increasing,these products are only being produced by greenhouse cultivations in most areas, becausegrowth conditions, such as the climate, soil, and moisture, are not suitable during the win-ter months (November to February) in South Korea. Moreover, the greenhouse cultivationmethod has attracted considerable attention as a profitable method for farmers, becausestable cultivation can be achieved by avoiding weather disasters and pests. Farmers cangrow fresh vegetables and fruit in a short period and sell them at much higher prices.However, greenhouse cultivation requires much higher artificial energy consumption thanfield cultivation, because special heating or insulation are required to artificially create asuitable environment for the growth of agricultural products.
Recently, tremendous growth has been documented in the area of plastic film-coveredgreenhouse cultivations in most agricultural lands near rivers in South Korea. In particular,the winter facility cultivation method, which uses groundwater to maintain the warmth ofthe greenhouse in winter, has been adopted by many agricultural lands in South Korea.This greenhouse warming method is called water curtain cultivation (WCC). Since thefirst introduction of WCCs in South Korea in 1984, WCCs have been used extensively.Indicatively, in 2006, WCC facilities spanned 10,746 ha [15]. WCC is a cultivation methodwhereby groundwater, which maintains a constant temperature of 15 ◦C even in winter,is extracted and sprayed on the roof of the greenhouse to form a water curtain. The heatemitted from the water maintains the warmth of the greenhouse. WCC technology isadvantageous in that it dramatically reduces the fuel cost, because no fuel is required toheat the facility. The nationwide area under WCC cultivation is growing constantly, owingto its advantages. It is not affected by oil prices, and a stable indoor temperature can bemaintained. For WCC, considerable volumes of groundwater are pumped during thewinter and discharged into rivers through agricultural waterways after use [16]. Most ofthe WCC facilities in South Korea are installed in alluvial areas near a river in anticipationof a sufficient supply of groundwater from the river. However, because WCC facilitiesare concentrated in a large-scale complex near rivers, excessive use of water curtain waterwithin a limited area causes groundwater depletion, thus making it difficult to continuallysupply water for water curtains. Using a large amount of groundwater for 4–5 monthsduring the winter and discharging it to nearby rivers has resulted in riverside groundwaterdepletion. In large WCC complexes that use large amounts of groundwater, disruptions inthe water curtain water supply often occur in January every year.
This study aimed to examine the surface–groundwater interaction near a small streamcalled Musimcheon within the Mihocheon basin, and to quantitatively diagnose the ground-water shortage phenomenon in aquifers. Several studies have been conducted on this water-shed. Chung et al. [17] analyzed the spatiotemporal distribution of groundwater rechargein a watershed based on the application of the combined surface-water–groundwatermodel SWAT–MODFLOW [18] for an area that spanned approximately 1868 km2. Chunget al. [19] proposed a sustainable intake amount along the stream within the Mihocheonbasin based on an analysis of the effect of groundwater pumping. The SWAT–MODFLOWmodel used in these studies was an integrated hydrological analysis model and was capableof calculating the heterogeneous recharge characteristics, simulating the hydrogeologicalcharacteristics and groundwater pumping, and evaluating the interaction between the riverand groundwater. Chung et al. [17] and Chung et al. [19] used a relatively large grid sizeof 300 × 300 m to study the entire watershed area. The present study conducted precisegroundwater level and water budget analyses on a small demonstration area of ~4 km2 inthe southeastern part of the Mihocheon basin in fine grids using MODFLOW. The hydro-logically analyzed spatiotemporal groundwater recharge amount was used as the input
Hydrology 2021, 8, 60 4 of 18
component of the MODFLOW. In South Korea, the status of groundwater developmentand use of nearby rivers are still not adequately understood; groundwater development isnot officially measured and reported in many WCC facilities that are operated by smallfarmers. Hence, the groundwater pumping pattern in the WCC area was identified usingthe correlation between the daily minimum temperature and groundwater usage of theWCC area. Precise groundwater modeling was performed in the demonstration area usingthe three-dimensional (3D) groundwater flow model MODFLOW [20] and the watershedhydrology model soil and water assessment tool (SWAT) [21]. To our knowledge, this isthe first attempt to study the response of the surface water, as well as the shallow aquifer,to the impact of seasonal WCC activity. For this purpose, integrated hydrological analysesusing the MODFLOW and SWAT models were performed to determine the long-termwater budget depletion at the demonstration site based on an expansion of the range of thewater budget analysis.
2. Site Description
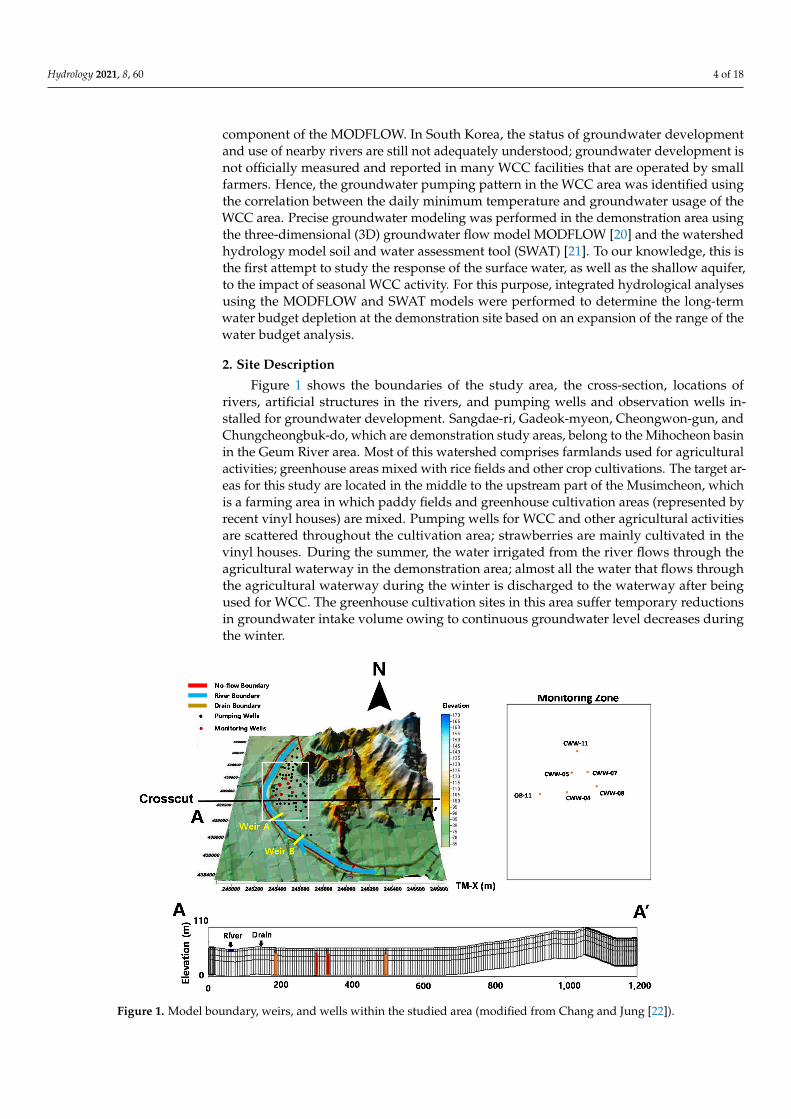
Figure 1 shows the boundaries of the study area, the cross-section, locations ofrivers, artificial structures in the rivers, and pumping wells and observation wells in-stalled for groundwater development. Sangdae-ri, Gadeok-myeon, Cheongwon-gun, andChungcheongbuk-do, which are demonstration study areas, belong to the Mihocheon basinin the Geum River area. Most of this watershed comprises farmlands used for agriculturalactivities; greenhouse areas mixed with rice fields and other crop cultivations. The target ar-eas for this study are located in the middle to the upstream part of the Musimcheon, whichis a farming area in which paddy fields and greenhouse cultivation areas (represented byrecent vinyl houses) are mixed. Pumping wells for WCC and other agricultural activitiesare scattered throughout the cultivation area; strawberries are mainly cultivated in thevinyl houses. During the summer, the water irrigated from the river flows through theagricultural waterway in the demonstration area; almost all the water that flows throughthe agricultural waterway during the winter is discharged to the waterway after beingused for WCC. The greenhouse cultivation sites in this area suffer temporary reductionsin groundwater intake volume owing to continuous groundwater level decreases duringthe winter.
Figure 1. Model boundary, weirs, and wells within the studied area (modified from Chang and Jung [22]).
Hydrology 2021, 8, 60 5 of 18
The geology of Cheongwon-gun is composed of igneous rocks, metasedimentaryrocks, and alluvial layers. When the geological age, rock formation, pore shape, andhydraulic characteristics of groundwater are considered, the hydrogeological unit of thisstudy site corresponds to intrusive igneous rock [14]. Although geological heterogeneityexists, on average, the strata are generally composed of (from the top down) a sedimentarylayer, weathered soil layer, weathered rock, and soft rock layer. The soft rock layer isusually 35 m below the surface [15]. From a geological perspective, there is an alluviallayer deposited by the flooding of the river above the Cheongju granite, which is connectedto the east.
The WCC demonstration area located in the most upstream part of the Musimcheonwatershed is located on riverside land to the east of the stream flow created by the meander-ing stream of the Musimcheon from the northeast. The land near Musimcheon is relativelyflat; the northern area of the study area is a low-mountainous terrain with an altitude of100 m. There is a small reservoir at the most upstream part of the river. Sudden waterdischarge was not observed from the reservoir. Most rivers in South Korea are not pristinerivers, and artificial structures are installed in most of them. Small weirs are also installedat intervals spanning several kilometers along the Musimcheon. Thus, the river waterlevel is relatively constant during most of the year, with the exception of rainy seasons.Reductions in the water flow of the Musimcheon were not observed during the studyperiod, even during intensive groundwater pumping in the winter.
3. Study Method3.1. Acquisition of Field Measurement Data3.1.1. Groundwater Observation Data
According to field survey results, there were 56 motor-activated groundwater pump-ing wells that were active during the WCC period. The observation wells for groundwaterlevel measurements were mainly located in the west and north, wherein many WCC housesexisted among the simulated areas. The black dots in Figure 1 indicate the 56 groundwa-ter pumping wells, and the red dots indicate the observation wells. Observation wellsare located along the Musimcheon embankment in the south–north direction and sevenobservation wells in the WCC area that correspond to the riverside land. In this study,the calibration and validation of the numerical analysis were performed based on dailydata from these observation wells equipped with sensors and data loggers. To measurethe groundwater amount used by WCC, Moon et al. [23] calculated the total amount ofgroundwater taken up for WCC before it was discharged to the Musimcheon from theagricultural waterway in the studied site.
3.1.2. Collection of Surface Water Observation Data
The Musimcheon River in the simulation area has a relatively slow flow rate because ofthe effects of weirs, and its water-level changes are insignificant except during the summerrainy season. To examine the water level changes at the center of the river, the structures ofthe upstream and downstream weirs were identified.
The preliminary modeling results indicated that the water level and conductance ofthe river at the river boundary condition had a significant effect on the inflow and outflowfrom the river to groundwater. When setting the River Boundary as the boundary condition,the Conductance variable was used to estimate stream leakage near the aquifer. The streamleakage was calculated from the conductance multiplied by the difference in the waterlevels between the river and the groundwater in the aquifer. Conductance is expressed as acombination of the vertical hydraulic conductivity of the riverbed material, the length ofthe river, the thickness of the floor, and the width of the river. The conductance also can beinterpreted as the flow resistance between the river and the aquifer. Hence, it was necessaryto examine the weir structures and prepare river water levels and other data related to theriver. Furthermore, because it was found that the model had a large sensitivity to most of
Hydrology 2021, 8, 60 6 of 18
the parts of the upstream river, Musimcheon was investigated to input the river water leveldata at the boundary area in addition to the river water level data at two other locations.
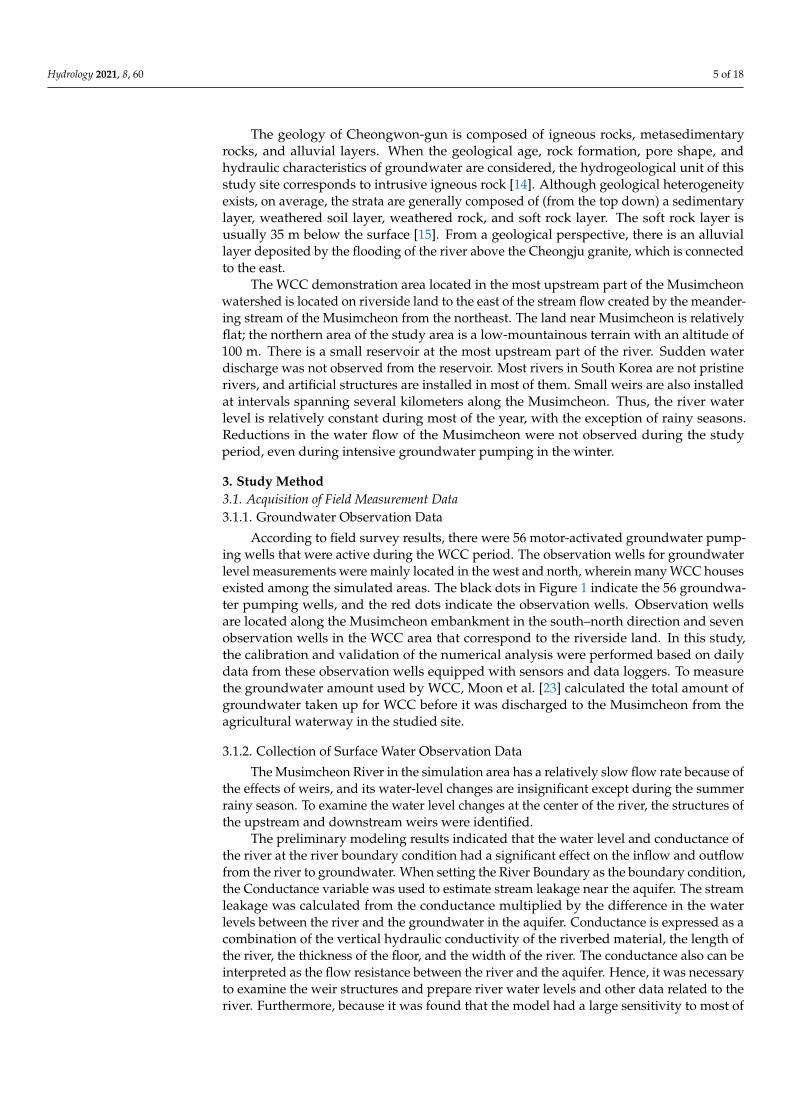
Figure 2 shows the locations of the major weirs. According to the time series data ofthe river water level measurements, upstream and downstream of weir A had an upstreamelevation of 67 m and a downstream elevation of 65 m, which were verified by observations.Moreover, weir A exhibits elevation differences downstream, in addition to the one shownin this figure. The structure of weir B was also measured. Figure 2 shows a full view andconceptual crosscut of the weir.
Figure 2. Photographs of weirs (a) and (b) and their conceptual crosscut schematics.
According to the measurements, the upstream weir maintains an elevation of 67 mand the weir downstream maintains an elevation of 65 m throughout the WCC period.The identification of the structure of weir B upstream of weir A was useful in numericalmodeling. The structure of weir B is vertically higher and larger than that of weir A. As aresult, the river becomes wider upstream of weir B.
3.1.3. Estimation of the Usage Pattern of Groundwater for WCC
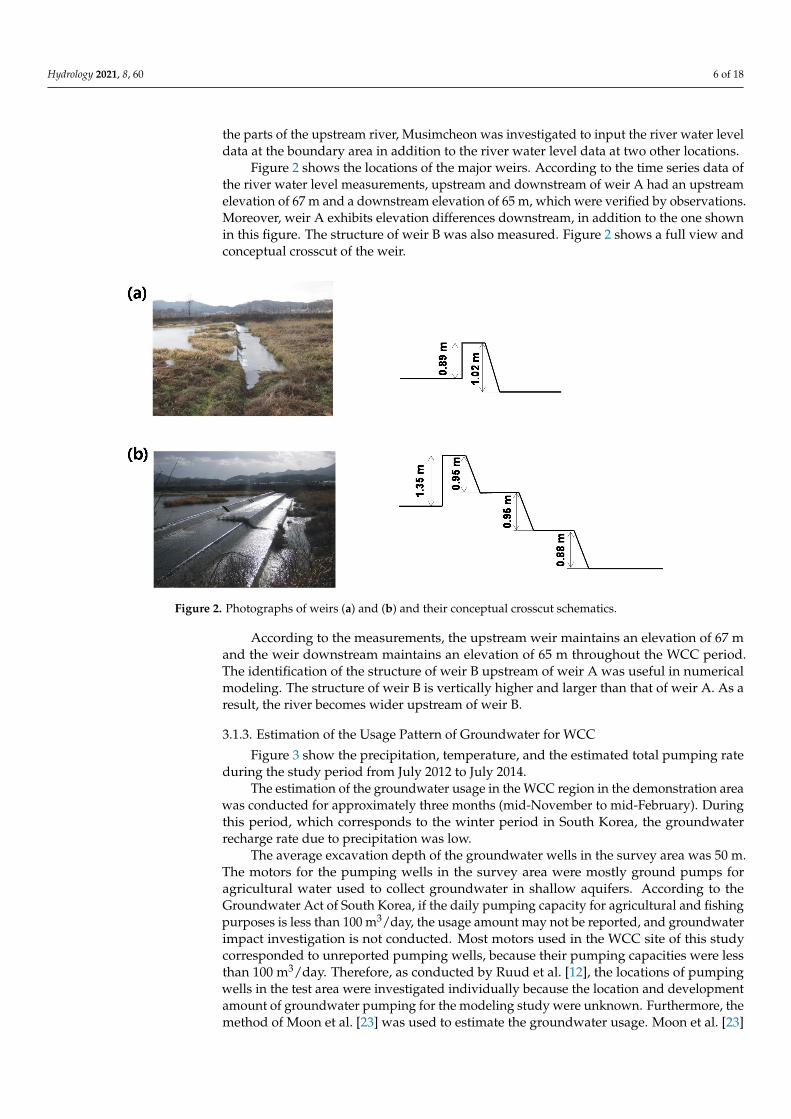
Figure 3 show the precipitation, temperature, and the estimated total pumping rateduring the study period from July 2012 to July 2014.
The estimation of the groundwater usage in the WCC region in the demonstration areawas conducted for approximately three months (mid-November to mid-February). Duringthis period, which corresponds to the winter period in South Korea, the groundwaterrecharge rate due to precipitation was low.
The average excavation depth of the groundwater wells in the survey area was 50 m.The motors for the pumping wells in the survey area were mostly ground pumps foragricultural water used to collect groundwater in shallow aquifers. According to theGroundwater Act of South Korea, if the daily pumping capacity for agricultural and fishingpurposes is less than 100 m3/day, the usage amount may not be reported, and groundwaterimpact investigation is not conducted. Most motors used in the WCC site of this studycorresponded to unreported pumping wells, because their pumping capacities were lessthan 100 m3/day. Therefore, as conducted by Ruud et al. [12], the locations of pumpingwells in the test area were investigated individually because the location and developmentamount of groundwater pumping for the modeling study were unknown. Furthermore, themethod of Moon et al. [23] was used to estimate the groundwater usage. Moon et al. [23]
Hydrology 2021, 8, 60 7 of 18
estimated that the number of days of pumping for WCC was approximately 100, andalso estimated the groundwater usage for WCC during the winters of 2011 and 2012 as53,138 m3 per 1 ha. This estimation was based on an analysis of the motor specificationsof representative pumping wells and the record of the daily lowest temperatures below0 ◦C for 94 days in the WCC area in Cheongwon. By using this method, we assumed adaily average discharge volume of 68 m3/day, with the assumption that the operationtime of the motor and on/off periods were influenced by the daily minimum temperature.In addition, the operation time was determined to be equal to 0.68 d immediately aftersunset until the sunrise of the subsequent day. This time was used as an input for themodel. Furthermore, 68 pumping wells were classified into two groups. In one of thegroups, the motor was operated when the temperature fell below 0 ◦C, and the other groupwas operated when the temperature fell below −5 ◦C. Only the motors of the first groupwere operated between 0 and −5 ◦C. When the WCC operations began in late November,only some motors were operated, because the minimum temperature was not low. Atother times, all the motors installed in the demonstration site were operated, because thedaily minimum temperatures were consistently lower than −5 ◦C. In addition, in earlyMarch, when WCC was terminated, the minimum temperature slowly increased. All of thepumping wells were no longer used when the WCC stopped.
Figure 3. Precipitation, temperature, and the estimated total pumping rate from July 2012 to July 2014.
3.2. Model Description3.2.1. Calculation of Time-Varying Groundwater Recharge Amount using WatershedHydrology Model
This study calculated the groundwater recharge amount of the Cheongwon area dur-ing the model application period using the SWAT model [21] developed by the AgriculturalResearch Service (ARS) of the United States Department of Agriculture. Recently, SWAT-related models for this area have been successfully calibrated. The SWAT–MODFLOW [18],an integrated surface-water–groundwater model was applied to the Mihocheon basin (areaof 1868 km2), which included the area evaluated in this study. The results were calibratedusing six stream gauging stations and ten national groundwater observation wells. In a
Hydrology 2021, 8, 60 8 of 18
follow-up study, Chung et al. [19] calibrated the Mihocheon basin (area of 1602 km2) withSWAT–MODFLOW to examine and ensure the development of a sustainable groundwaterlevel based on simulations of the groundwater development scenario.
The target basin was the Musimcheon watershed in the southeast of the Mihocheonbasin, which had a basin area of 198 km2. Preprocessing was performed using the ESRI’sArcView 3.3 software. The digital elevation map was processed to 100 m grids and dividedinto 34 sub-basins in total, reflecting the terrain elevations. Furthermore, a land use mapwas created with the land cover map of the Ministry of Environment, and a soil distributionmap was created based on the soil data. One hydrologic response unit was determinedbased on the combination of the features of these two maps, and hydrological componentsconsidering land use and land composition were determined accordingly.
The input precipitation, temperature, wind speed, solar radiation, and relative hu-midity were calculated for three years (from 2012) based on meteorological data from theCheongju weather station (Korea Meteorological Administration database). The Cheongjuwatermark data were used for the river runoff as hydrological data. All hydrological datawere collected for 23 years from 1990 to 2015.
In general, the watershed hydrological model was calibrated based on the observedrunoff amount. In this study, the water flow data (five years from 2010 to 2014) of theCheongju gauging station were downloaded from the Water Resources ManagementInformation System (WAMIS, http://www.wamis.go.kr (accessed on 9 March 2021)).
Based on the aforementioned hydrologic component analysis, the evapotranspirationamount of the demonstration site sub-basin, groundwater recharge amount, and ground-water runoff were estimated. Given that the demonstration site of this study was relativelysmall, the spatial distribution of the amount of groundwater recharge in the groundwaterflow model was not considered.
The calculated groundwater recharge amount was expressed in the form of daily datathat could be used to simulate the unsteady groundwater flow. Additionally, the modelvalues were verified based on comparisons with the time series data of the groundwaterfor the same period.
3.2.2. Analysis of Spatiotemporal Distribution of Groundwater Level with a GroundwaterFlow Model
To examine the presence of groundwater in aquifers in the study area and to analyzethe local water circulation mechanism, a distributed 3D groundwater flow model wasconstructed. The modeling area of the analysis basis was set, the values and ranges ofhydrogeological parameters were determined from various data and measurements, andthe boundary conditions were established by inferring the inflow/outflow methods ofvarious water bodies and aquifers. In particular, the physical shape of the aquifer, includingthe area of the aquifer, thicknesses of the aquifer and pressurized layer, locations of surfacewater and rivers, boundary conditions of the aquifer, and hydrologic information, such asthe hydraulic conductivity of the aquifer, the retention coefficient of the aquifer, locationsof permeability and specific storage coefficient of pressurized bed, and the hydrologicconnectivity between aquifer and surface water are required.
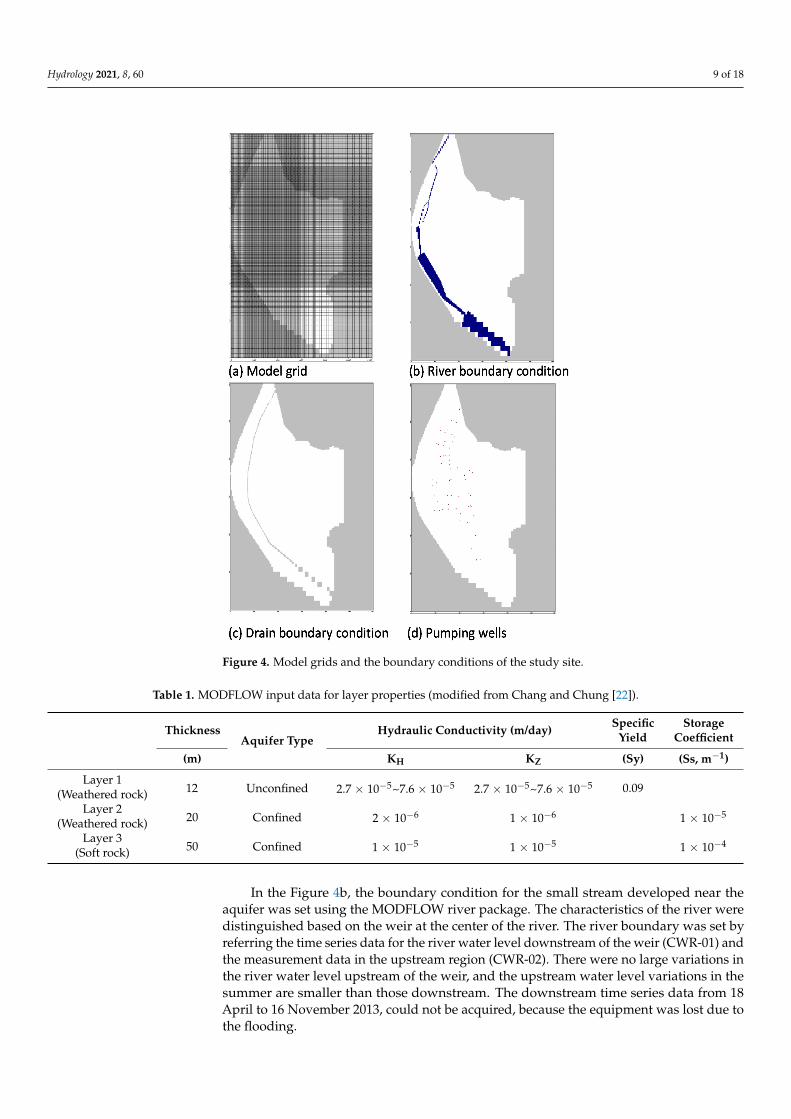
Figure 4 shows the boundary conditions of MODFLOW model. The model area fornumerical analysis was divided into 360 rows and 240 columns made of 5 × 5 m gridsthrough a convergence test for an area of 1200 × 1800 m (see Figure 4a). The model stratum(with an approximate depth of 80 m) was divided into three layers based on the geologicalcharacteristics. The input values of the hydrogeological parameters of each layer are listedin Table 1.
The 2–3 m thick topsoil was included in the unconfined aquifer, which is the firstlayer of the model. The first layer of the model represents weathered soil, and its spatialdistribution was estimated based on a statistical interpolation method in conjunction withthe hydraulic conductivity obtained by the pumping test.
Hydrology 2021, 8, 60 9 of 18
Figure 4. Model grids and the boundary conditions of the study site.
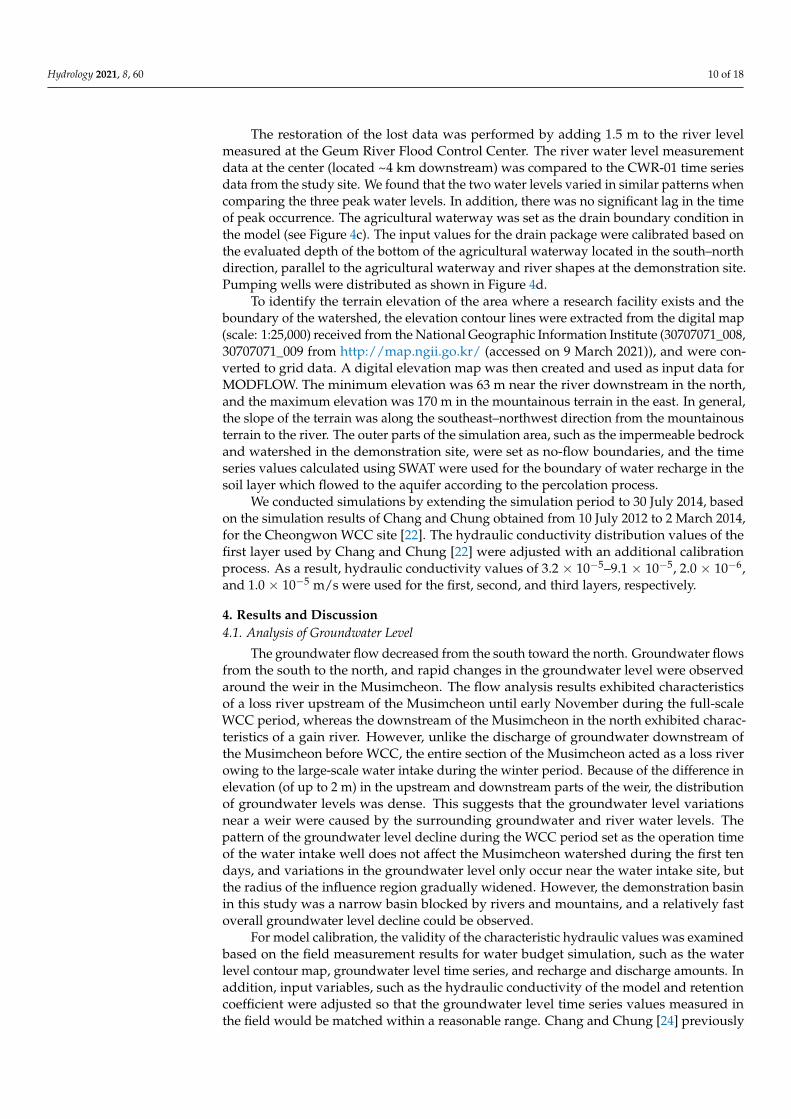
Table 1. MODFLOW input data for layer properties (modified from Chang and Chung [22]).
ThicknessAquifer Type
Hydraulic Conductivity (m/day) SpecificYield
StorageCoefficient
(m) KH KZ (Sy) (Ss, m−1)
Layer 112 Unconfined 2.7 × 10⁻⁵~7.6 × 10⁻⁵ 2.7 × 10⁻⁵~7.6 × 10⁻⁵ 0.09(Weathered rock)
Layer 220 Confined 2 × 10⁻⁶ 1 × 10⁻⁶ 1 × 10⁻⁵
(Weathered rock)Layer 3
50 Confined 1 × 10⁻⁵ 1 × 10⁻⁵ 1 × 10⁻⁴(Soft rock)
In the Figure 4b, the boundary condition for the small stream developed near theaquifer was set using the MODFLOW river package. The characteristics of the river weredistinguished based on the weir at the center of the river. The river boundary was set byreferring the time series data for the river water level downstream of the weir (CWR-01) andthe measurement data in the upstream region (CWR-02). There were no large variations inthe river water level upstream of the weir, and the upstream water level variations in thesummer are smaller than those downstream. The downstream time series data from 18April to 16 November 2013, could not be acquired, because the equipment was lost due tothe flooding.
Hydrology 2021, 8, 60 10 of 18
The restoration of the lost data was performed by adding 1.5 m to the river levelmeasured at the Geum River Flood Control Center. The river water level measurementdata at the center (located ~4 km downstream) was compared to the CWR-01 time seriesdata from the study site. We found that the two water levels varied in similar patterns whencomparing the three peak water levels. In addition, there was no significant lag in the timeof peak occurrence. The agricultural waterway was set as the drain boundary condition inthe model (see Figure 4c). The input values for the drain package were calibrated based onthe evaluated depth of the bottom of the agricultural waterway located in the south–northdirection, parallel to the agricultural waterway and river shapes at the demonstration site.Pumping wells were distributed as shown in Figure 4d.
To identify the terrain elevation of the area where a research facility exists and theboundary of the watershed, the elevation contour lines were extracted from the digital map(scale: 1:25,000) received from the National Geographic Information Institute (30707071_008,30707071_009 from http://map.ngii.go.kr/ (accessed on 9 March 2021)), and were con-verted to grid data. A digital elevation map was then created and used as input data forMODFLOW. The minimum elevation was 63 m near the river downstream in the north,and the maximum elevation was 170 m in the mountainous terrain in the east. In general,the slope of the terrain was along the southeast–northwest direction from the mountainousterrain to the river. The outer parts of the simulation area, such as the impermeable bedrockand watershed in the demonstration site, were set as no-flow boundaries, and the timeseries values calculated using SWAT were used for the boundary of water recharge in thesoil layer which flowed to the aquifer according to the percolation process.
We conducted simulations by extending the simulation period to 30 July 2014, basedon the simulation results of Chang and Chung obtained from 10 July 2012 to 2 March 2014,for the Cheongwon WCC site [22]. The hydraulic conductivity distribution values of thefirst layer used by Chang and Chung [22] were adjusted with an additional calibrationprocess. As a result, hydraulic conductivity values of 3.2 × 10⁻⁵–9.1 × 10⁻⁵, 2.0 × 10⁻⁶,and 1.0 × 10⁻⁵ m/s were used for the first, second, and third layers, respectively.
4. Results and Discussion4.1. Analysis of Groundwater Level
The groundwater flow decreased from the south toward the north. Groundwater flowsfrom the south to the north, and rapid changes in the groundwater level were observedaround the weir in the Musimcheon. The flow analysis results exhibited characteristicsof a loss river upstream of the Musimcheon until early November during the full-scaleWCC period, whereas the downstream of the Musimcheon in the north exhibited charac-teristics of a gain river. However, unlike the discharge of groundwater downstream ofthe Musimcheon before WCC, the entire section of the Musimcheon acted as a loss riverowing to the large-scale water intake during the winter period. Because of the difference inelevation (of up to 2 m) in the upstream and downstream parts of the weir, the distributionof groundwater levels was dense. This suggests that the groundwater level variationsnear a weir were caused by the surrounding groundwater and river water levels. Thepattern of the groundwater level decline during the WCC period set as the operation timeof the water intake well does not affect the Musimcheon watershed during the first tendays, and variations in the groundwater level only occur near the water intake site, butthe radius of the influence region gradually widened. However, the demonstration basinin this study was a narrow basin blocked by rivers and mountains, and a relatively fastoverall groundwater level decline could be observed.
For model calibration, the validity of the characteristic hydraulic values was examinedbased on the field measurement results for water budget simulation, such as the waterlevel contour map, groundwater level time series, and recharge and discharge amounts. Inaddition, input variables, such as the hydraulic conductivity of the model and retentioncoefficient were adjusted so that the groundwater level time series values measured inthe field would be matched within a reasonable range. Chang and Chung [24] previously
Hydrology 2021, 8, 60 11 of 18
showed a graph that compared the data collected from the observation wells on August 3before the onset of the WCC and the simulation results of MODFLOW. A good correlationwith a coefficient of determination (R2) of 0.97 was obtained.
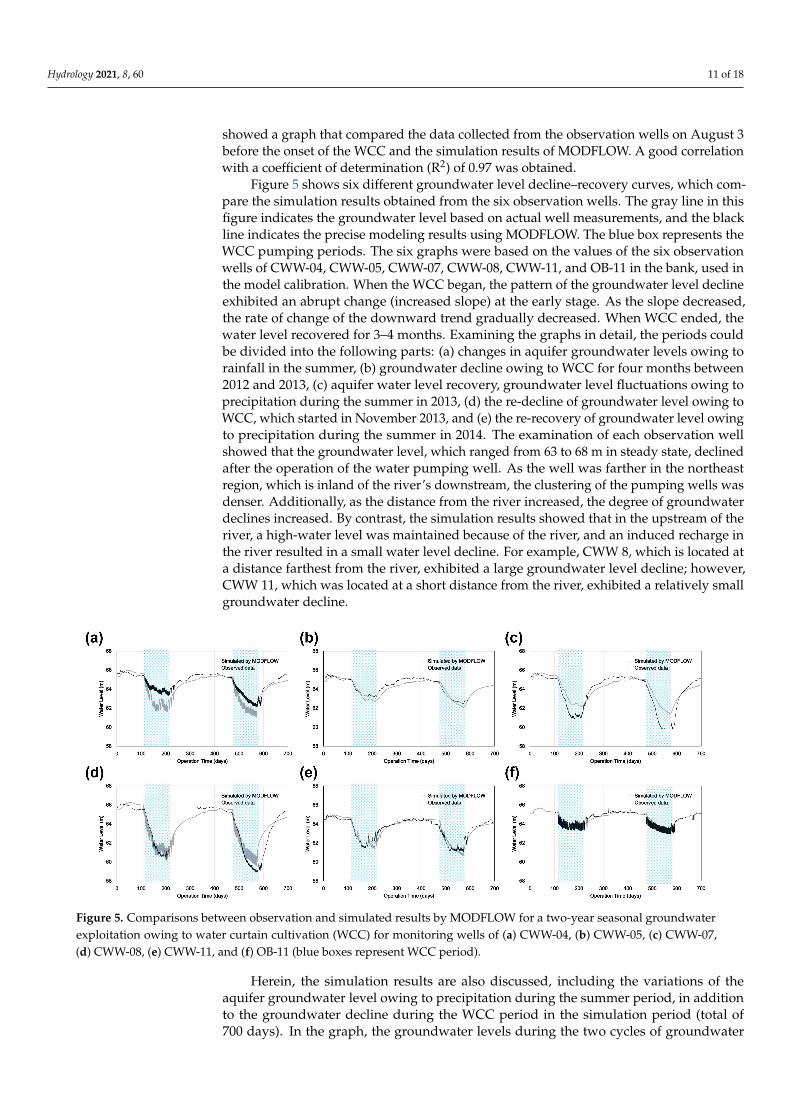
Figure 5 shows six different groundwater level decline–recovery curves, which com-pare the simulation results obtained from the six observation wells. The gray line in thisfigure indicates the groundwater level based on actual well measurements, and the blackline indicates the precise modeling results using MODFLOW. The blue box represents theWCC pumping periods. The six graphs were based on the values of the six observationwells of CWW-04, CWW-05, CWW-07, CWW-08, CWW-11, and OB-11 in the bank, used inthe model calibration. When the WCC began, the pattern of the groundwater level declineexhibited an abrupt change (increased slope) at the early stage. As the slope decreased,the rate of change of the downward trend gradually decreased. When WCC ended, thewater level recovered for 3–4 months. Examining the graphs in detail, the periods couldbe divided into the following parts: (a) changes in aquifer groundwater levels owing torainfall in the summer, (b) groundwater decline owing to WCC for four months between2012 and 2013, (c) aquifer water level recovery, groundwater level fluctuations owing toprecipitation during the summer in 2013, (d) the re-decline of groundwater level owing toWCC, which started in November 2013, and (e) the re-recovery of groundwater level owingto precipitation during the summer in 2014. The examination of each observation wellshowed that the groundwater level, which ranged from 63 to 68 m in steady state, declinedafter the operation of the water pumping well. As the well was farther in the northeastregion, which is inland of the river’s downstream, the clustering of the pumping wells wasdenser. Additionally, as the distance from the river increased, the degree of groundwaterdeclines increased. By contrast, the simulation results showed that in the upstream of theriver, a high-water level was maintained because of the river, and an induced recharge inthe river resulted in a small water level decline. For example, CWW 8, which is located ata distance farthest from the river, exhibited a large groundwater level decline; however,CWW 11, which was located at a short distance from the river, exhibited a relatively smallgroundwater decline.
Figure 5. Comparisons between observation and simulated results by MODFLOW for a two-year seasonal groundwaterexploitation owing to water curtain cultivation (WCC) for monitoring wells of (a) CWW-04, (b) CWW-05, (c) CWW-07,(d) CWW-08, (e) CWW-11, and (f) OB-11 (blue boxes represent WCC period).
Herein, the simulation results are also discussed, including the variations of theaquifer groundwater level owing to precipitation during the summer period, in additionto the groundwater decline during the WCC period in the simulation period (total of700 days). In the graph, the groundwater levels during the two cycles of groundwater
Hydrology 2021, 8, 60 12 of 18
depletion–recovery were observed. In this period, one year in which the following eventsoccurred was recognized as the WCC cycle: (1) aquifer recharge owing to rainfall in thesummer, (2) groundwater depletion owing to WCC, and (3) induced recharge by the riverafter the termination of the WCC. The analysis onset time and the graph of this study alsofollowed this cycle. As shown in the Figure 5, the modeling results indicated that mostof the demonstrations were influenced by sporadically scattered groundwater pumping.When the two cycles of groundwater level decline and the respective recoveries werecompared with the observations, the simulated results were reproduced and were foundto be close the observed values. Notably, even though the winter temperatures were notsignificantly different between the first and second water curtain periods, the groundwaterdeclined more in the second water curtain period.
4.2. Water Budget Analysis
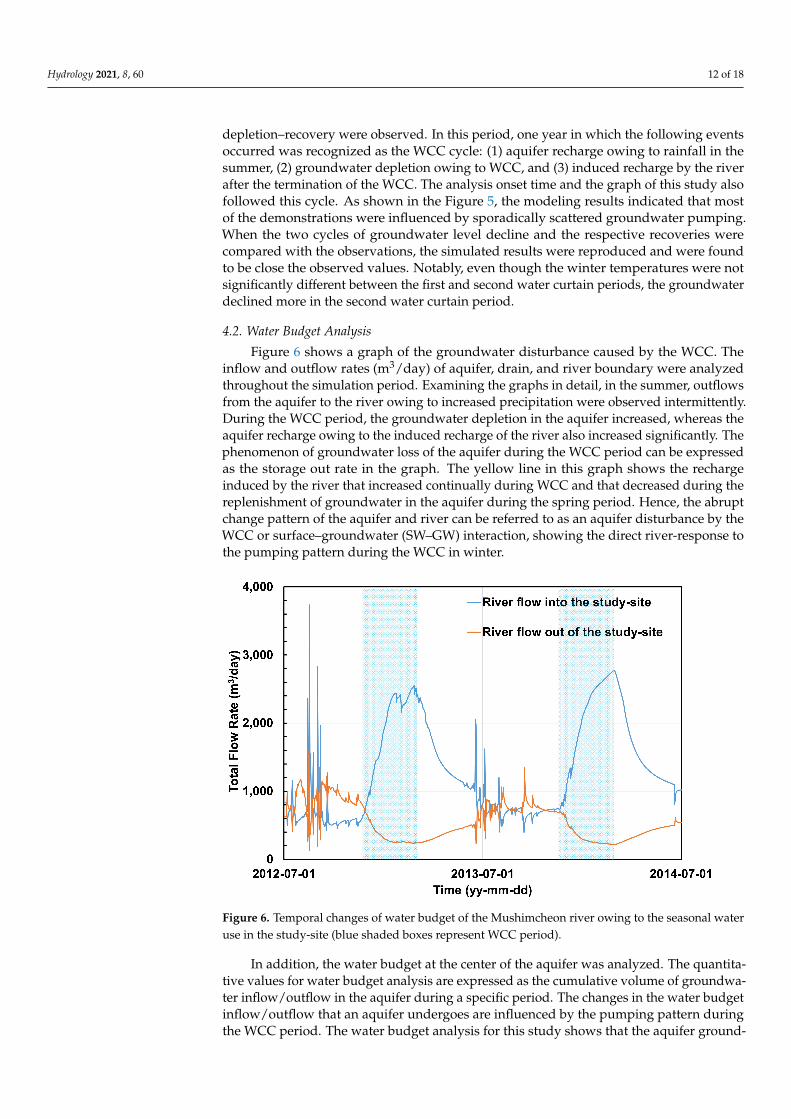
Figure 6 shows a graph of the groundwater disturbance caused by the WCC. Theinflow and outflow rates (m3/day) of aquifer, drain, and river boundary were analyzedthroughout the simulation period. Examining the graphs in detail, in the summer, outflowsfrom the aquifer to the river owing to increased precipitation were observed intermittently.During the WCC period, the groundwater depletion in the aquifer increased, whereas theaquifer recharge owing to the induced recharge of the river also increased significantly. Thephenomenon of groundwater loss of the aquifer during the WCC period can be expressedas the storage out rate in the graph. The yellow line in this graph shows the rechargeinduced by the river that increased continually during WCC and that decreased during thereplenishment of groundwater in the aquifer during the spring period. Hence, the abruptchange pattern of the aquifer and river can be referred to as an aquifer disturbance by theWCC or surface–groundwater (SW–GW) interaction, showing the direct river-response tothe pumping pattern during the WCC in winter.
Figure 6. Temporal changes of water budget of the Mushimcheon river owing to the seasonal wateruse in the study-site (blue shaded boxes represent WCC period).
In addition, the water budget at the center of the aquifer was analyzed. The quantita-tive values for water budget analysis are expressed as the cumulative volume of groundwa-ter inflow/outflow in the aquifer during a specific period. The changes in the water budgetinflow/outflow that an aquifer undergoes are influenced by the pumping pattern duringthe WCC period. The water budget analysis for this study shows that the aquifer ground-
Hydrology 2021, 8, 60 13 of 18
water depleted by pumping was recharged naturally by the recharge induced by riversand rainfall. When analyzing the groundwater storage of the aquifer, which correspondsto the difference between the cumulative outflow and inflow of the aquifer, the recharge ofthe aquifer attributed to the rainfall or induced recharge by the river was expressed as apositive value, whereas the depletion of aquifer was expressed as a negative value. Thesevalues were used in an effort to show the depletion and recovery patterns of the aquifer.
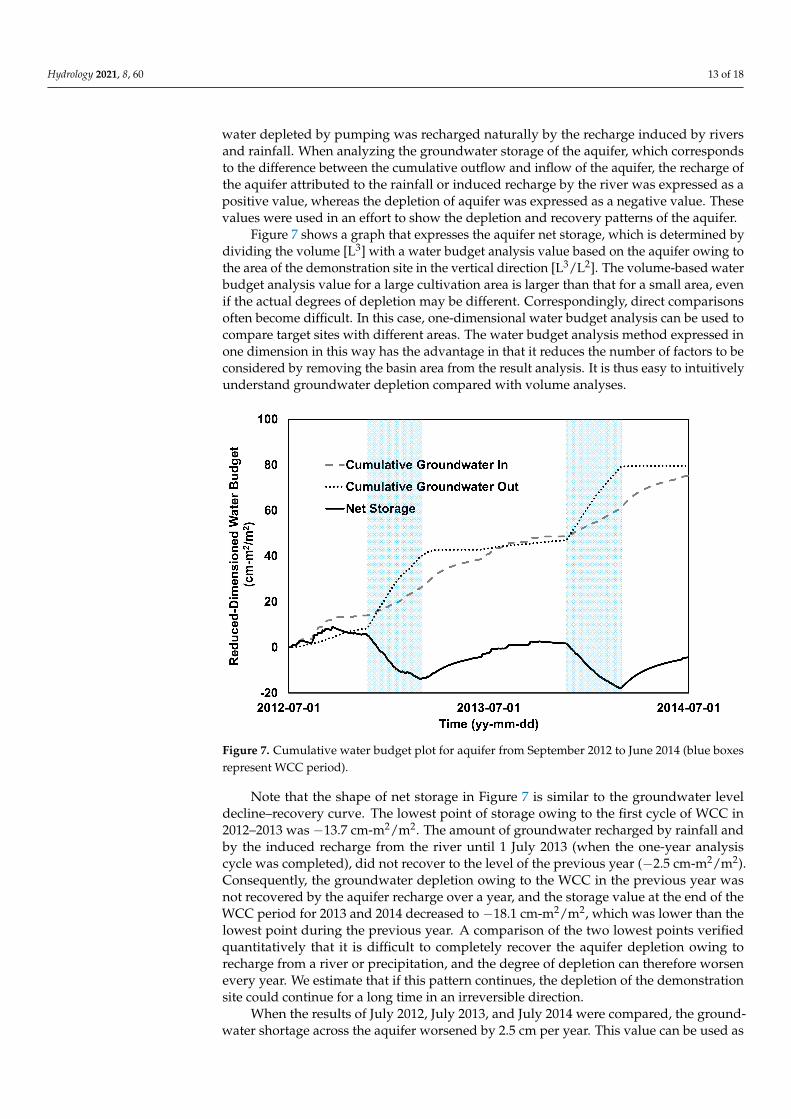
Figure 7 shows a graph that expresses the aquifer net storage, which is determined bydividing the volume [L3] with a water budget analysis value based on the aquifer owing tothe area of the demonstration site in the vertical direction [L3/L2]. The volume-based waterbudget analysis value for a large cultivation area is larger than that for a small area, evenif the actual degrees of depletion may be different. Correspondingly, direct comparisonsoften become difficult. In this case, one-dimensional water budget analysis can be used tocompare target sites with different areas. The water budget analysis method expressed inone dimension in this way has the advantage in that it reduces the number of factors to beconsidered by removing the basin area from the result analysis. It is thus easy to intuitivelyunderstand groundwater depletion compared with volume analyses.
Figure 7. Cumulative water budget plot for aquifer from September 2012 to June 2014 (blue boxesrepresent WCC period).
Note that the shape of net storage in Figure 7 is similar to the groundwater leveldecline–recovery curve. The lowest point of storage owing to the first cycle of WCC in2012–2013 was −13.7 cm-m2/m2. The amount of groundwater recharged by rainfall andby the induced recharge from the river until 1 July 2013 (when the one-year analysiscycle was completed), did not recover to the level of the previous year (−2.5 cm-m2/m2).Consequently, the groundwater depletion owing to the WCC in the previous year wasnot recovered by the aquifer recharge over a year, and the storage value at the end of theWCC period for 2013 and 2014 decreased to −18.1 cm-m2/m2, which was lower than thelowest point during the previous year. A comparison of the two lowest points verifiedquantitatively that it is difficult to completely recover the aquifer depletion owing torecharge from a river or precipitation, and the degree of depletion can therefore worsenevery year. We estimate that if this pattern continues, the depletion of the demonstrationsite could continue for a long time in an irreversible direction.
When the results of July 2012, July 2013, and July 2014 were compared, the ground-water shortage across the aquifer worsened by 2.5 cm per year. This value can be used as
Hydrology 2021, 8, 60 14 of 18
an indicator that conceptually represents groundwater depletion, rather than a factor thatindicates the actual depth of groundwater decline. This is because the actual groundwaterdepletion occurs within several tens of centimeters around the pumping well, and almostno groundwater decline occurs in a place where the pumping well is far and where theriver is nearby.
4.3. Application of Artificial Recharge Scenario
To predict the groundwater level recovery and water budget change caused by artifi-cial recharge, an artificial recharge scenario was established. This scenario was applied tothe model. In this scenario, artificial recharge was performed for the period of 2013–2014,which corresponds to the second WCC period in the study period. The artificial rechargestarted in December 2013 when groundwater pumping was most active and the temper-ature was low. Each pumping well performed pumping every day for 16 h and 30 min(which corresponds to 0.68 days on average). Groundwater re-injection was simulated for7 h and 30 min (which corresponds to 0.32 days), which is the remaining time in each dayif the pumping time is excluded. In addition, artificial recharge was performed for 24 hwhen pumping was not performed owing to high temperatures.
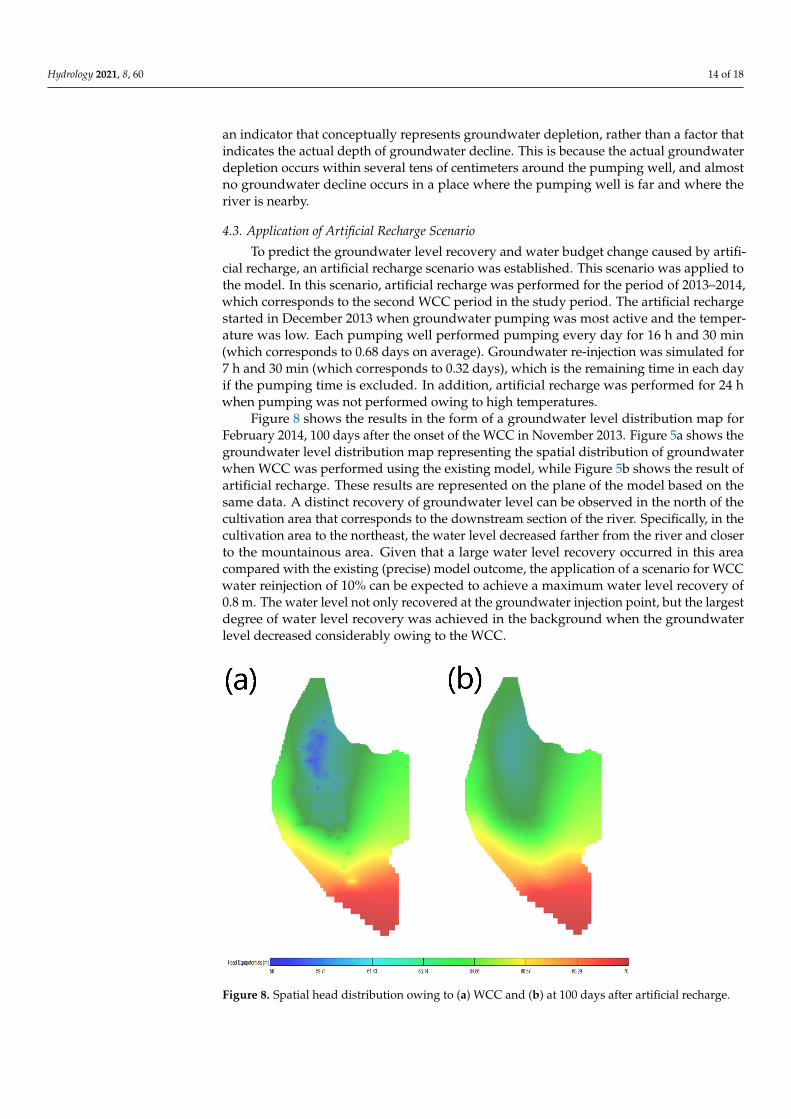
Figure 8 shows the results in the form of a groundwater level distribution map forFebruary 2014, 100 days after the onset of the WCC in November 2013. Figure 5a shows thegroundwater level distribution map representing the spatial distribution of groundwaterwhen WCC was performed using the existing model, while Figure 5b shows the result ofartificial recharge. These results are represented on the plane of the model based on thesame data. A distinct recovery of groundwater level can be observed in the north of thecultivation area that corresponds to the downstream section of the river. Specifically, in thecultivation area to the northeast, the water level decreased farther from the river and closerto the mountainous area. Given that a large water level recovery occurred in this areacompared with the existing (precise) model outcome, the application of a scenario for WCCwater reinjection of 10% can be expected to achieve a maximum water level recovery of0.8 m. The water level not only recovered at the groundwater injection point, but the largestdegree of water level recovery was achieved in the background when the groundwaterlevel decreased considerably owing to the WCC.
Figure 8. Spatial head distribution owing to (a) WCC and (b) at 100 days after artificial recharge.
Hydrology 2021, 8, 60 15 of 18
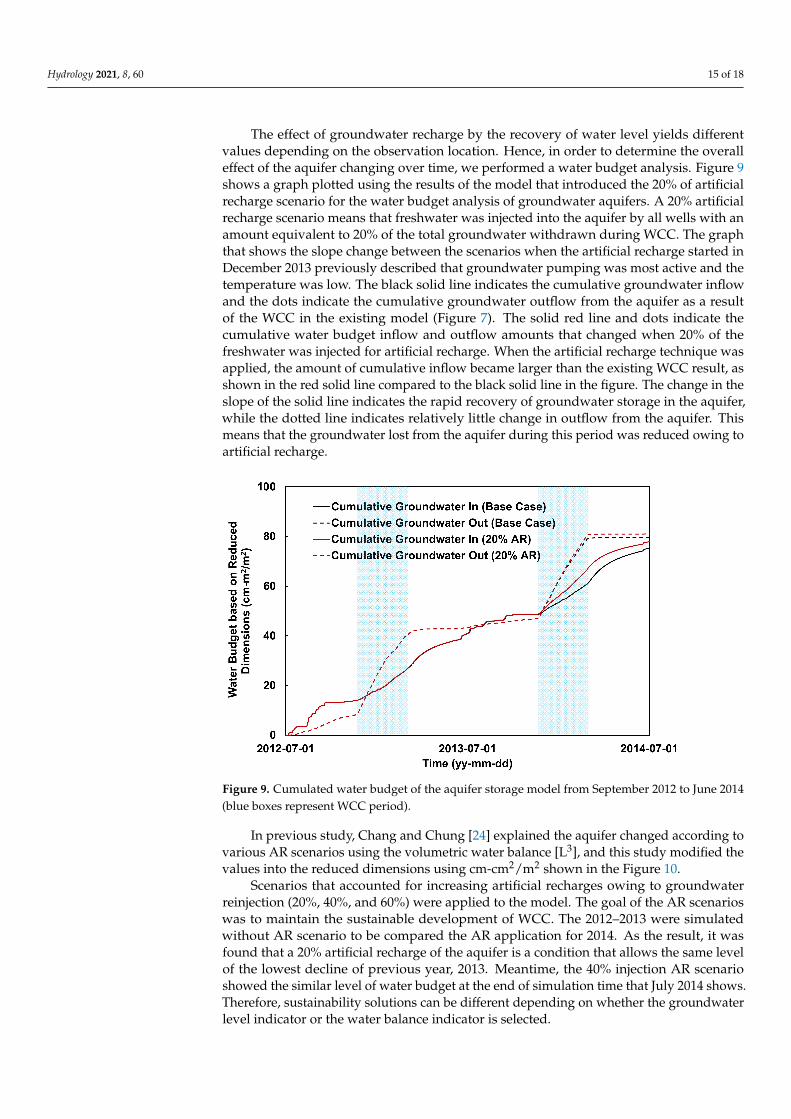
The effect of groundwater recharge by the recovery of water level yields differentvalues depending on the observation location. Hence, in order to determine the overalleffect of the aquifer changing over time, we performed a water budget analysis. Figure 9shows a graph plotted using the results of the model that introduced the 20% of artificialrecharge scenario for the water budget analysis of groundwater aquifers. A 20% artificialrecharge scenario means that freshwater was injected into the aquifer by all wells with anamount equivalent to 20% of the total groundwater withdrawn during WCC. The graphthat shows the slope change between the scenarios when the artificial recharge started inDecember 2013 previously described that groundwater pumping was most active and thetemperature was low. The black solid line indicates the cumulative groundwater inflowand the dots indicate the cumulative groundwater outflow from the aquifer as a resultof the WCC in the existing model (Figure 7). The solid red line and dots indicate thecumulative water budget inflow and outflow amounts that changed when 20% of thefreshwater was injected for artificial recharge. When the artificial recharge technique wasapplied, the amount of cumulative inflow became larger than the existing WCC result, asshown in the red solid line compared to the black solid line in the figure. The change in theslope of the solid line indicates the rapid recovery of groundwater storage in the aquifer,while the dotted line indicates relatively little change in outflow from the aquifer. Thismeans that the groundwater lost from the aquifer during this period was reduced owing toartificial recharge.
Figure 9. Cumulated water budget of the aquifer storage model from September 2012 to June 2014(blue boxes represent WCC period).
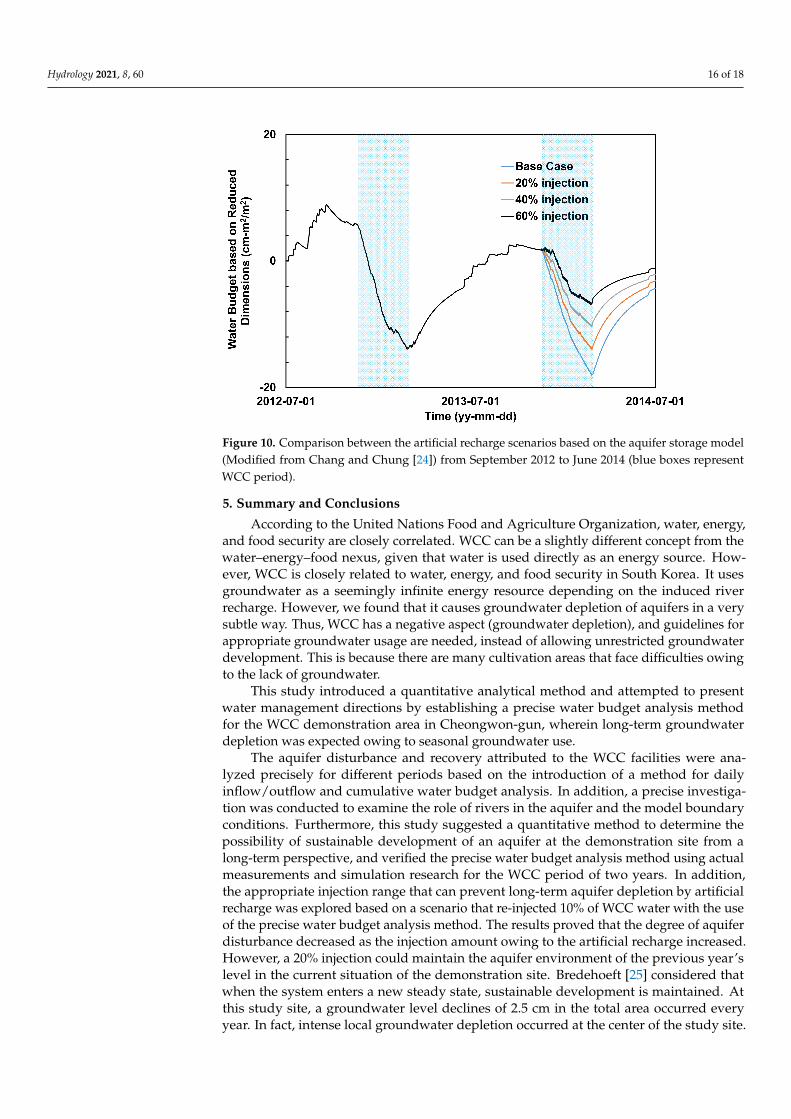
In previous study, Chang and Chung [24] explained the aquifer changed according tovarious AR scenarios using the volumetric water balance [L3], and this study modified thevalues into the reduced dimensions using cm-cm2/m2 shown in the Figure 10.
Scenarios that accounted for increasing artificial recharges owing to groundwaterreinjection (20%, 40%, and 60%) were applied to the model. The goal of the AR scenarioswas to maintain the sustainable development of WCC. The 2012–2013 were simulatedwithout AR scenario to be compared the AR application for 2014. As the result, it wasfound that a 20% artificial recharge of the aquifer is a condition that allows the same levelof the lowest decline of previous year, 2013. Meantime, the 40% injection AR scenarioshowed the similar level of water budget at the end of simulation time that July 2014 shows.Therefore, sustainability solutions can be different depending on whether the groundwaterlevel indicator or the water balance indicator is selected.
Hydrology 2021, 8, 60 16 of 18
Figure 10. Comparison between the artificial recharge scenarios based on the aquifer storage model(Modified from Chang and Chung [24]) from September 2012 to June 2014 (blue boxes representWCC period).
5. Summary and Conclusions
According to the United Nations Food and Agriculture Organization, water, energy,and food security are closely correlated. WCC can be a slightly different concept from thewater–energy–food nexus, given that water is used directly as an energy source. How-ever, WCC is closely related to water, energy, and food security in South Korea. It usesgroundwater as a seemingly infinite energy resource depending on the induced riverrecharge. However, we found that it causes groundwater depletion of aquifers in a verysubtle way. Thus, WCC has a negative aspect (groundwater depletion), and guidelines forappropriate groundwater usage are needed, instead of allowing unrestricted groundwaterdevelopment. This is because there are many cultivation areas that face difficulties owingto the lack of groundwater.
This study introduced a quantitative analytical method and attempted to presentwater management directions by establishing a precise water budget analysis methodfor the WCC demonstration area in Cheongwon-gun, wherein long-term groundwaterdepletion was expected owing to seasonal groundwater use.
The aquifer disturbance and recovery attributed to the WCC facilities were ana-lyzed precisely for different periods based on the introduction of a method for dailyinflow/outflow and cumulative water budget analysis. In addition, a precise investiga-tion was conducted to examine the role of rivers in the aquifer and the model boundaryconditions. Furthermore, this study suggested a quantitative method to determine thepossibility of sustainable development of an aquifer at the demonstration site from along-term perspective, and verified the precise water budget analysis method using actualmeasurements and simulation research for the WCC period of two years. In addition,the appropriate injection range that can prevent long-term aquifer depletion by artificialrecharge was explored based on a scenario that re-injected 10% of WCC water with the useof the precise water budget analysis method. The results proved that the degree of aquiferdisturbance decreased as the injection amount owing to the artificial recharge increased.However, a 20% injection could maintain the aquifer environment of the previous year’slevel in the current situation of the demonstration site. Bredehoeft [25] considered thatwhen the system enters a new steady state, sustainable development is maintained. Atthis study site, a groundwater level declines of 2.5 cm in the total area occurred everyyear. In fact, intense local groundwater depletion occurred at the center of the study site.
Hydrology 2021, 8, 60 17 of 18
If the regulation of some areas was enforced with an appropriate optimization method,instead of 20% artificial recharge of the total usage, sustainable development of the totalarea could be possible if the development amount was reduced to values less than 20% ofthe usage. Based on these arguments, a follow-up study is required. Furthermore, giventhat groundwater recharge by river water is a major recharge method for groundwater, afollow-up study that simulates the effect of the river water temperature on aquifers duringthe winter season should be conducted.
Author Contributions: Conceptualization: S.W.C. and I.-M.C.; methodology: S.W.C.; validation:S.W.C. and I.-M.C.; formal analysis: S.W.C.; investigation: S.W.C.; resources: I.-M.C.; data curation:S.W.C.; writing—original draft preparation: S.W.C.; writing—review and editing: I.-M.C.; project ad-ministration: I.-M.C.; funding acquisition: I.-M.C. All authors have read and agreed to the publishedversion of the manuscript.
Funding: This research was supported by the Development program of Minimizing of ClimateChange Impact Technology through the National Research Foundation of Korea (NRF), funded bythe Korean government. (Ministry of Science and ICT (MSIT)). (No. NRF-2020M3H5A1080735).
Institutional Review Board Statement: Not applicable.
Informed Consent Statement: Not applicable.
Conflicts of Interest: The authors declare no conflict of interest.
References1. Siebert, S.; Burke, J.; Faures, J.M.; Frenken, K.; Hoogeveen, J.; Döll, P.; Portmann, F.T. Groundwater use for irrigation—A global
inventory. Hydrol. Earth Syst. Sci. 2010, 14, 1863–1880. [CrossRef]2. Wada, Y.; Van Beek, L.P.H.; Van Kempen, C.M.; Reckman, J.W.T.M.; Vasak, S.; Bierkens, M.F.P. Global depletion of groundwater
resources. Geophys. Res. Lett. 2010, 37, 37. [CrossRef]3. Winter, T.C.; Harvey, J.W.; Franke, O.L.; Alley, W.M. Ground Water and Surface Water: A single Resource; United States Geological
Survey: Reston, VA, USA, 1998.4. Barlow, P.M.; Leake, S.A. Streamflow Depletion by Wells—Understanding and Managing the Effects of Groundwater Pumping on
Streamflow; U.S. Geological Survey: Reston, VA, USA, 2012; p. 84.5. Kollet, S.J.; Zlotnik, V.A. Stream depletion predictions using pumping test data from a heterogeneous stream–aquifer system (a
case study from the Great Plains, USA). J. Hydrol. 2003, 281, 96–114. [CrossRef]6. Nyholm, T.; Christensen, S.; Rasmussen, K.R. Flow Depletion in a Small Stream Caused by Ground Water Abstraction from Wells.
Ground Water 2002, 40, 425–437. [CrossRef] [PubMed]7. Thomas, B.F.; Behrangi, A.; Famiglietti, J.S. Precipitation Intensity Effects on Groundwater Recharge in the Southwestern United
States. Water 2016, 8, 90. [CrossRef]8. Pavelic, P.; Patankar, U.; Acharya, S.; Jella, K.; Gumma, M.K. Role of groundwater in buffering irrigation production against
climate variability at the basin scale in South-West India. Agric. Water Manag. 2012, 103, 78–87. [CrossRef]9. Shamsudduha, M.; Chandler, R.E.; Taylor, R.G.; Ahmed, K.M. Recent trends in groundwater levels in a highly seasonal
hydrological system: The Ganges-Brahmaputra-Meghna Delta. Hydrol. Earth Syst. Sci. 2009, 13, 2373–2385. [CrossRef]10. Perrin, J.; Ferrant, S.; Massuel, S.; Dewandel, B.; Maréchal, J.; Aulong, S.; Ahmed, S. Assessing water availability in a semi-arid
watershed of southern India using a semi-distributed model. J. Hydrol. 2012, 460–461, 143–155. [CrossRef]11. Ferrant, S.; Caballero, Y.; Perrin, J.; Gascoin, S.; Dewandel, B.; Aulong, S.; Dazin, F.; Ahmed, S.; Maréchal, J.-C. Projected impacts of
climate change on farmers’ extraction of groundwater from crystalline aquifers in South India. Sci. Rep. 2014, 4, 3697. [CrossRef][PubMed]
12. Ruud, N.; Harter, T.; Naugle, A. Estimation of groundwater pumping as closure to the water balance of a semi-arid, irrigatedagricultural basin. J. Hydrol. 2004, 297, 51–73. [CrossRef]
13. MOLIT. 2015 Groundwater Annual Report; 11-1611000-000155-10; MOLIT: Daejeon, Korea, 2015.14. Lee, J.-Y.; Kwon, K.D. Current Status of Groundwater Monitoring Networks in Korea. Water 2016, 8, 168. [CrossRef]15. KIGAM. Groundwater Restoration Technology for Riverside Area; Report on the Advanced Technology for Groundwater Development
and Application in Riversides (Geowater+) in Water Resources Management Program; 11-1613000-001827-01; KIGAM: Daejeon,Korea, 2017; p. 549.
16. Chang, S.; Chung, I.-M. Analysis of Groundwater Variations using the Relationship between Groundwater use and DailyMinimum Temperature in a Water Curtain Cultivation Site. J. Eng. Geol. 2014, 24, 217–225. [CrossRef]
17. Chung, I.-M.; Kim, N.-W.; Lee, J.; Sophocleous, M. Assessing distributed groundwater recharge rate using integrated surfacewater-groundwater modelling: Application to Mihocheon watershed, South Korea. Hydrogeol. J. 2010, 18, 1253–1264. [CrossRef]

Hydrology 2021, 8, 60 18 of 18
18. Kim, N.W.; Chung, I.M.; Won, Y.S.; Arnold, J.G. Development and application of the integrated SWAT–MODFLOW model. J.Hydrol. 2008, 356, 1–16. [CrossRef]
19. Chung, I.-M.; Lee, J.; Kim, N.W.; Na, H.; Chang, S.W.; Kim, Y.; Kim, G.-B. Estimating exploitable amount of groundwaterabstraction using an integrated surface water-groundwater model: Mihocheon watershed, South Korea. Hydrol. Sci. J. 2014,60, 863–872. [CrossRef]
20. Harbaugh, A.; Banta, E.; Hill, M.; McDonald, M. MODFLOW-2000, the U.S. Geological Survey Modular Ground-Water Model UserGuide to Modularization Concepts and the Ground-Water Flow Process; United States Geological Survey: Reston, VA, USA, 2000;Volume Open-File Rep 00-92.
21. Arnold, J.G.; Williams, J.R.; Srinivasan, R.; King, K.W. The Soil and Water Assessment Tool (SWAT) User’s Manual; Texas WaterResources Institue: College Station, TX, USA; Temple, TX, USA, 1996.
22. Chang, S.W.; Chung, I.-M. Analysis of Groudwater Budget in a Water Curtain Cultivation Site. J. Korean Soc. Civ. Eng. 2015,35, 1259–1267. [CrossRef]
23. Moon, S.-H.; Ha, K.; Kim, Y.; Yoon, P. Analysis of Groundwater Use and Discharge in Water Curtain Cultivation Areas: CaseStudy of the Cheongweon and Chungju Areas. J. Eng. Geol. 2012, 22, 387–398. [CrossRef]
24. Chang, S.; Chung, I.-M. Long-term groundwater budget analysis based on integrated hydrological model for water curtaincultivation site: Case study of Cheongweon, Korea. J. Geol. Soc. Korea 2016, 52, 201–210. [CrossRef]
25. Bredehoeft, J.D. The Water Budget Myth Revisited: Why Hydrogeologists Model. Ground Water 2002, 40, 340–345. [CrossRef][PubMed]