Embed Size (px)
DESCRIPTION
Environment Impact Assessment(EIA) Report of Navi Mumbai International Airport
Citation preview
ENVIRONMENTAL IMPACT ASSESSMENT (EIA)STUDY OF NAVI MUMBAI INTERNATIONAL AIRPORT
CITY AND INDUSTRIAL DEVELOPMENT CORPORATION
OF MAHARASHTRA LIMITED
Volume - III
CENTER OF ENVIRONMENT SCIENCE & ENGINEERING,INDIAN INSTITUTE OF TECHNOLOGY, MUMBAI.
June 2010
Chapter - 4 – Description of Environment
June 2010
CENTER OF ENVIRONMENT SCIENCE & ENGINEERING,INDIAN INSTITUTE OF TECHNOLOGY, MUMBAI
ENVIRONMENTAL IMPACT ASSESSMENT STUDY OF
NAVI MUMBAI INTERNATIONAL AIRPORT
NAVI MUMBAI
INTERNATIONAL AIRPORT
NAVI MUMBAI
INTERNATIONAL AIRPORT
CIDCO
Volume - III
Chapter - 4 – Description of Environment
EIA Study of Navi Mumbai International Airport I
CESE, IIT Mumbai CIDCO
C O N T E N T S
VOLUME - I
Executive Summary
VOLUME - II
Chapter 1 : Introduction Page
No.
1.1 : Background 1
1.2 : Project Proponent 3
1.3 : Airport Sector Profile 4
1.3.1 : National Airport System 4
1.3.2 : Western Region Airport System 9
1.3.3 : Mumbai Region Airport System 13
1.4 : Passenger Traffic Trends 14
1.4.1 : Annual Passengers 14
1.4.2 : Peak Period Passengers 18
1.5 : Aircraft Movement (ATM) Trends 20
1.5.1 : Annual Aircraft Movements 20
1.5.2 : Peak Period Aircraft Movements 27
1.6 : Air Cargo Trends 29
1.7 : Conclusions of Air Traffic Analysis 32
1.8 : Policy, Legal and Administrative Framework 32
1.9 : Purpose of Study 32
1.10 : Project Brief 33
1.11 : Terms of Reference 34
1.11.1 : Site analysis 34
1.11.2 : Water 36
1.11.3 : Solid waste 36
1.11.4 : Energy 36
EIA Study of Navi Mumbai International Airport II
CESE, IIT Mumbai CIDCO
1.11.5 : Traffic & transport 37
1.11.6 : CRZ 38
1.11.7 : Noise 39
1.11.8 : EMP, DMP 40
1.11.9 : Additional Terms of Reference 41
1.12 : Scope of work 42
1.12.1 : Study Area 43
1.13 : Scoping 45
1.14 : Structure of the Report 48
Chapter 2 : Analysis of alternative Sites
2.1 : Introduction 1
2.2 : Mahapan in Sindhudurg District 1
2.3 : Rewas-Mandwa 2
2.3.1 : Salient Features 2
2.3.2 : Accessibility 4
2.3.3 : Power, Water & Telecommunication infrastructure 4
2.3.4 : Township Development 4
2.3.5 : Site Constraints 5
2.3.6 : Environment sensitive factors 5
2.4 : Navi Mumbai Site 7
2.4.1 : Salient Features 7
2.4.2 : Site Constraints 9
2.5 : Selection of Alternative Sites 11
2.5.1 : SWOT Analysis 11
2.5.2 : Site Sensitivity Analys 13
2.6 : Conclusion 20
Chapter 3 : Project Description
3.1 : Geographical Setting 1
3.1.1 : Location 1
EIA Study of Navi Mumbai International Airport III
CESE, IIT Mumbai CIDCO
3.1.2 : Navi Mumbai 1
3.1.3 : Regional Setting 3
3.1.4 : Linkages 3
3.1.5 : Transport Systems and Network 4
3.1.6 : Project Accessibility 6
3.1.7 : Project Area 6
3.2 : Project Activities 7
3.3 : Project structure 7
3.4 : Aviation Demand Forecast 8
3.4.1 : Air Traffic Forecast 8
3.4.2 : MMR Air Traffic Forecast 8
3.4.3 : MMR Air Cargo Demand 9
3.4.4 : Navi Mumbai Air Traffic Forecast 10
3.4.5 : Navi Mumbai Air Cargo Forecast 11
3.4.6 : Air Traffic Summary 12
3.5 : Airport Facilities 15
3.5.1 : Runways 16
3.5.2 : Taxiway System 17
3.5.3 : Navigational Aids 18
3.5.4 : Commercial Apron 19
3.5.5 : Long-Term Aircraft Parking 20
3.5.6 : General Aviation 21
3.5.7 : Cargo Apron 21
3.5.8 : Passenger Terminal Building 21
3.5.9 : Air Cargo Building 23
3.6 : Roadway System 23
3.6.1 : Primary Access Road 23
3.6.2 : Terminal Area Access Road 24
3.6.3 : Terminal Frontage Road 24
EIA Study of Navi Mumbai International Airport IV
CESE, IIT Mumbai CIDCO
3.6.4 : Service Roads 24
3.7 : Vehicular and Cargo Parking 25
3.7.1 : Vehicular Parking 25
3.7.2 : Cargo Parking 25
3.8 : Technical Building and Control Tower 25
3.9 : Fuel Farm 25
3.10 : Air Rescue and Fire Fighting 26
3.11 : Catering Facility 26
3.12 : Ground Handling Equipment Maintenance 27
3.13 : Aircraft Maintenance Hangar Facilities 27
3.14 : Airfield Maintenance Area 27
3.15 : Landuse of Aeronautical area 28
3.16 : Water Requirements 30
3.17 : Power Supply 32
3.18 : Sewerage Treatment Plant 35
3.19 : Solid Waste Generation & Disposal 35
3.20 : Development of Non-aeronautical Area 38
3.21 : Project Cost 39
3.22 : Implementation Programme 40
3.23 : Construction Material 41
3.24 : Construction Environment 42
VOLUME - III
Chapter 4 : Description of Environment
4.1 : Introduction 1
4.2 : Environmental Setting 2
4.3 : Hydrometeorology 3
4.4 : Physiography 5
4.5 : Geology 8
4.6 : Drainage 11
EIA Study of Navi Mumbai International Airport V
CESE, IIT Mumbai CIDCO
4.6.1 : Gadhi river 12
4.6.2 : Kalundri River 13
4.6.3 : Kasadi- Taloja river 14
4.6.4 : Ulwe River 15
4.7 : Land Environment 16
4.7.1 : Particle Size Distribution 19
4.7.2 : Electrical conductivity (EC) and SAR (Sodium Adsorption Ratio) 21
4.7.3 : Cation Exchange Capacity (CEC) 23
4.7.4 : Permeability 24
4.7.5 : Porosity 25
4.7.6 : Calcium, Magnesium and Potassium 26
4.7.7 : Total Soil Quality 35
4.7.8 : Sub-Soil Characteristics of Airport Area 36
4.7.9 : Pedological Suvey 36
4.7.10 : Sub-Soil Investigation during TEF Stage 40
4.7.11 : Sub-Soil Investigation During DPR Stage 59
4.8 : Water Environment 71
4.8.1 : Water Quality 71
4.8.2 : Water Quality Index 74
4.8.3 : Water Quality Results 77
4.8.4 : Results of Water Quality Analysis 84
4.9 : Air Environment 120
4.9.1 : Air Quality 120
4.9.2 : Air Quality Index (AQI) 123
4.9.3 : Air Quality Results 124
4.9.4 : Total Air quality 162
4.9.5 : Meteorology 169
4.10 : Noise Environment 234
4.10.1 : Ambient Noise Quality 234
EIA Study of Navi Mumbai International Airport VI
CESE, IIT Mumbai CIDCO
4.10.2 : Equivalent Continuous Sound Levels 237
4.10.3 : Traffic Noise Index 246
4.10.4 : Noise Pollution Index (NPI) 247
4.10.5 : Average Noise Level 249
4.11 : Ecology 259
4.11.1 : Terrestrial Habitats 263
4.11.2 : Avifauna 263
4.11.3 : Habitats Encountered In the Project Area 269
4.11.4 : Streams 274
4.11.5 : Community analysis for Terrestrial Habitats 279
4.12 : Forest 300
4.12.1 : Forest Types 303
4.13 : Aquatic Ecosystem 305
4.13.1 : Phytoplankton 305
4.13.2 : Zooplankton 314
4.13.3 : Benthos 325
4.13.4 : Water Quality Status of Major aquatic Habitat in the Project Area 332
4.14 : Traffic & Transportation Study 338
4.14.1 : Land Side Access 338
4.14.2 : Site accessibility 339
4.14.3 : Rail Linkages 341
4.14.4 : Water Transport 342
4.14.5 : Road Linkages 342
4.14.6 : Mode Share 344
4.14.7 : Road Traffic Forecast 347
4.14.8 : Test Of Adequacy 351
4.14.9 : Intersection Analysis 352
4.14.10 : Assessments of intersection 360
4.14.11 : Intersection Evaluation by V/C Ratio 376
EIA Study of Navi Mumbai International Airport VII
CESE, IIT Mumbai CIDCO
4.15 : Land Status & Settlement 389
4.16 : Demographic Socio-Economic 393
4.16.1 : Socio-demographic profile for urban area 394
4.16.2 : Socio-economic profile of rural area 396
4.17 : Land Use Pattern 399
4.17.1 : Study Area 399
4.17.2 : Project Area 403
4.18 : Places of Ecological, Historical & Cultural Importance 405
4.18.1 : The Elephanta Caves 405
4.18.2 : Karnala Bird Sanctuary 406
4.18.3 : Matheran Eco-sensitive Zone 408
4.19 : Costal Regulation Zone 409
VOLUME-IV
Chapter 5 : Environmental Impacts & Mitigation Measures
5.0 : Background 1
5.1 : Impact Identification, Classification and Prioritization 2
5.1.1 : Impact Identification 2
5.1.2 : Evaluation and Classification of Impacts 13
5.1.3 : Prioritization of Impacts and Identification of Environmental Sectors affected
24
5.2 : Mitigation Measures 29
Chapter 6 : Environmental Management Plan
6.1 : Background 1
6.2 : Scope 1
6.3 : Objectives 2
6.4 : Government Policies 2
6.5 : Key Players for Implementation of EMP 3
6.6 : Environmental Management Cell Structure 3
6.7 : Environmental Management Action Plan 8
6.8 : Environmental Monitoring Plan 33
EIA Study of Navi Mumbai International Airport VIII
CESE, IIT Mumbai CIDCO
6.9 : Financial Plan 44
6.9.1 : EMP budget estimates 44
6.10 : Reporting Strategies 46
6.11 : Responsible organizations for implementation of EMP 47
Chapter 7 : Disaster Management Plan
7.0 : Introduction 1
7.1 : Natural Disasters 1
7.2 : Aircraft Accident Related Disasters 2
7.3 : Terror Attack, Plane Hijack, Sabotage 2
7.4 : Disaster Management Plan 2
7.4.1 : Purpose & Scope 3
7.4.2 : Categorization of Emergencies 4
7.5 : Emergency Procedures 5
7.6 : Role and Responsibility in Handling Emergencies 13
7.7 : Operation and Management Control 15
7.7.1 : Airport Emergency Managing Committee 15
7.7.2 : Airport Emergency Operation/Co-ordination Centre 16
7.8 : Training and Education 23
7.9 : Mock Drills and Exercises 24
7.10 : Updating of Disaster Management Plan 25
VOLUME-V
Chapter 8 : Additional Studies
8.0 : Introduction 1
8.1 : Legal Opinion on Permissibility of Activities in CRZ Area 1
8.2 : Training & Diversion of Rivers Study 22
8.2.1 : Background 22
8.2.2 : Need for Training & Diversion of Rivers 23
8.2.3 : Proposed River Training & Diversion 25
8.3 : Reorientation of runways Study 31
EIA Study of Navi Mumbai International Airport IX
CESE, IIT Mumbai CIDCO
8.3.1 : Background 31
8.3.2 : Runway Orientation 31
8.3.3 : NMIA Runway Orientation 34
8.3.4 : Presence of Mangroves in Airport area 35
8.3.5 : Reducing runway spacing 36
8.3.6 : Reorienting the runways 37
8.4 : Ground Water Study 38
8.5 : Vaghvli Island & Coastal line Study 39
8.5.1 : Methodology 40
8.6 : Mathematical & Physical Model Study 46
8.7 : Mangrove Analysis, Plantation & Management Study 47
8.7.1 : Field Observation 47
8.7.2 : Density and Dispersal 49
8.7.3 : Satellite Remote Sensing Study of mangroves 54
8.7.4 : Mangrove Plantation 64
8.7.5 : Management of Mangrove 65
8.8 : Air Quality & Noise Assessment 77
8.8.1 : Surface Traffic Emission 77
8.8.2 : Aircraft Emission 80
8.8.3 : Noise Quality Assessment 82
8.8.4 : Integrated Noise Model 89
8.9 : Rehabilitation & Re-settlement ( R & R ) Plan 98
8.9.1 : R & R Entitlements 98
8.9.2 : R & R Cost 99
: ANNEXURE-I
: ANNEXURE II
: ANNEXURE III
: ANNEXURE IV
: ANNEXURE V
EIA Study of Navi Mumbai International Airport X
CESE, IIT Mumbai CIDCO
: ANNEXURE VI
: ANNEXURE VII
Chapter 9 : Disclosure of Consultants
9.0 : List of Consultants 1
9.1 : Centre for Environmental Science and Engineering, IIT, Bombay 1
9.2 : M/s.LBG-INECO-RITES Consortium, USA 1
9.3 : Central Water and Power Research Station (CWPRS), Pune 2
9.4 : Hydraulic Advisor 2
9.5 : Review Consultant (DHI) 2
9.6 : Mumbai University 2
9.7 : M/s. Lewis Environment Service Inc., (Lewis) USA 3
9.8 : Gujarat Ecology Commission 3
9.9 : Ground water Survey & Development Agency (GSDA), Govt. of Maharashtra.:
3
9.10 : Legal Consultants 3
9.11 : Maharashtra Maritime Board, Govt. of Maharashtra 4
9.12 : Center of Studies in Resource Engineering (CSRE), IIT Mumbai 4
9.13 : P. N. Shidhore and Company 4
EIA Study of Navi Mumbai International Airport XI
CESE, IIT Mumbai CIDCO
List of Tables
VOLUME-II
Chapter 1
1.1 National Airport System 4
1.2 National Air Passenger data 6
1.3 National Air freight Data 7
1.4 Regional and State Airports Passenger Data 10
1.5 Regional and State Airports Freight Data 11
1.6 Annual Commercial Passengers , CSIA 15
1.7 Breakdown of International Passengers , CSIA 17
1.8 Peak Months for Commercial Passengers , CSIA 20
1.9 Historical Commercial Aircraft Movements , CSIA 21
1.10 Breakdown of Total Aircraft Movements for 2006-2007, CSIA 23
1.11 Current Fleet Mix – Scheduled Weekly Arrivals, CSIA ( January 2008) 25
1.12 Current Fleet Mix – Scheduled Weekly Arrivals, CSIA ( Summer 2004) 25
1.13 Historical Air Cargo& Mail, CSIA 30
1.14 Geographical & Environmental Setting of The Airport Site ( 10 Km Radius)
33
Chapter 2
2.1 SWOT - Navi Mumbai – Rewas Mandwa 11
2.2 Sensitivity Analysis of Rewas Mandwa 13
2.3 Sensitivity Analysis of Navi Mumbai 16
2.4 Comparison of Attribute Score 18
Chapter 3
3.1 MMR Air Traffic Forecast 9
3.2 MMR Air Cargo Traffic Forecast 10
3.3 NMIA Air Traffic Forecast 10
3.4 NMIA Air cargo Traffic 11
3.5 Airport development Phasing – NMIA 11
3.6 NMIA Air Traffic Forecast Summary 12
EIA Study of Navi Mumbai International Airport XII
CESE, IIT Mumbai CIDCO
3.7 Number of Passengers per Development Phasing 13
3.8 Land Use Statement for Aeronautical Area 28
3.9 Phase-wise Water Requirements 30
3.10 Demand & Supply of Water 31
3.11 Phase-wise Power Requirement 33
3.12 Navi Mumbai Demand and Supply of Energy 34
3.13 Land use Statement for Non Aeronautical Area 38
3.14 Basic Cost Estimate of Airport Zone 39
3.15 Quantities of basic Materials ( Approx) 42
VOLUME-III
Chapter 4
4.1 Geographical & Environmental Setting of Study Area 2
4.2 Soil Quality Monitoring Stations In The Project Area 17
4.3 Usda Soil Textural Classification System 20
4.4 Classification Based On Sodium Adsorption Ratio And Electrical Conductivity
22
4.5 Classification of soil based on CEC value 24
4.6 Classification Of Soil Based On Permeability 25
4.7 Values Of Different Soil Quality Parametres At Various Stations Of The Project Area During Post Monsoon Season
27
4.8 Values Of Different Soil Quality Parametres At Various Stations Of The Project Area During Pre Monsoon Season
28
4.9 Values of Different Soil Quality Parameters at Various Stations of The Project Area during Monsoon Season
30
4.10 Texture And Particle Size Distribution Of Soil In The Project Area During Post Monsoon Season
31
4.11 Texture And Particle Size Distribution Of Soil In The Project Area During Pre Monsoon Season
32
4.12 Texture And Particle Size Distribution Of Soil In The Project Area During Monsoon Season
33
4.13 Navi Mumbai Soil Groups 39
4.14 Standard Penetration Test 47
EIA Study of Navi Mumbai International Airport XIII
CESE, IIT Mumbai CIDCO
4.15 Soil Properties (UDS Samples) 48
4.16 Soil Properties (DS Samples) 50
4.17 Rock Sample Test Results 51
4.18 Chemical Analysis 52
4.19 Design Parameters (Summary) 53
4.20 Soil Properties (UDS Samples) 60
4.21 Soil Properties (DS Samples) 61
4.22 Rock Sample Test Results 63
4.23 Marine Water Quality Monitoring Stations in the Project Area 72
4.24 Ground Water Quality Monitoring Stations in the Project Area 73
4.25 Descriptor Categories For Various Nsf-Wqi Values 76
4.26 Results Of Water Quality Analysis Of Gadhi River During Post Monsoon Season
78
4.27 Results Of Water Quality Analysis Of Gadhi River During Pre Monsoon Season
79
4.28 Results Of Water Quality Analysis Of Gadhi River During Monsoon Season
80
4.29 Results Of Water Quality Analysis Of Ulve River during Post Monsoon, Pre-monsoon and Monsoon
81
4.30 Results Of Water Quality Analysis Of Panvel Creek During Post Monsoon, Pre-Monsoon & Monsoon Season
82
4.31 Receiving Sea Water Standards for SW II Category(Commercial Fishing, Contact Recreation, Bathing water)
83
4.32 Nsf Water Quality Index (Wqi) Calculated For Creek Water For Post Monsoon Season
98
4.33 NSF Water Quality Index (Wqi) Calculated For Creek Water For Pre Monsoon Season
99
4.34 NSF Water Quality Index (Wqi) Calculated For Creek Water For Monsoon Season
100
4.35 Results Of Water Quality Analysis Of Ground Water In The Project Area During Post Monsoon Season
102
4.36 Results Of Water Quality Analysis Of Ground Water In The Project Area During Pre Monsoon Season
103
4.37 Values Of Ground Water Quality Parametres During Monsoon Season
104
EIA Study of Navi Mumbai International Airport XIV
CESE, IIT Mumbai CIDCO
4.38 Nsf Water Quality Index (Wqi) Calculated For Ground Water For Post Monsoon Season
116
4.39 Nsf Water Quality Index (Wqi) Calculated For Ground Water For Pre Monsoon Season
117
4.40 Nsf Water Quality Index (Wqi) Calculated For Water For Monsoon Season
118
4.41 Selection of Air Monitoring Stations in the Project Area 121
4.42 (a) Monthwise Measured Values Of Tsp (G/M3) In Air At Various Stations Of The Project Area During The Post Monsoon Season
125
4.42( b) Monthwise Measured Values Of Pm10 (G/M3) In Air At Various Stations Of The Project Area During The Post Monsoon Season
126
4.42 (c) Monthwise Measured Values Of Nox (G/M3) In Air At Various Stations Of The Project Area During The Post Monsoon Season
127
4.42 (d) Monthwise Measured Values Of So2 (G/M3) In Air At Various Stations Of The Project Area During The Post Monsoon Season
128
4.42 (e) Monthwise Measured Values Of Nh3 (G/M3) In Air At Various Stations Of The Project Area During The Post Monsoon Season
129
4.42 (f) Monthwise Measured Values Of Co (Mg/M3) In Air At Various Stations Of The Project Area During The Post Monsoon Season
130
4.42 (g) Monthwise Measured Values Of Hc (G/M3) In Air At Various Stations Of The Project Area During The Post Monsoon Season
131
4.42 (h) Monthwise Measured Values Of Tsp (G/M3) In Air At Various Stations Of The Project Area During The Winter Season
131
4.42 (i) Monthwise Measured Values Of Pm10 (G/M3) In Air At Various Stations Of The Project Area During The Winter Season
133
4.42 ( j) Monthwise Measured Values Of Nox (G/M3) In Air At Various Stations Of The Project Area During The Winter Season
134
4.42 (k) Monthwise Measured Values Of So2 (G/M3) In Air At Various Stations Of The Project Area During The Winter Season
135
4.42 (l) Monthwise Measured Values Of Nh3 (G/M3) In Air At Various Stations Of The Project Area During The Winter Season
136
4.42 (m) Monthwise Measured Values Of Co (G/M3) In Air At Various Stations
137
4.42 (n) Monthwise Measured Values Of Hc (G/M3) In Air At Various Stations
138
4.42 (o) Monthwise Measured Values Of Tsp (G/M3) In Air At Various Stations Of The Project Area During The Pre Monsoon Season
139
EIA Study of Navi Mumbai International Airport XV
CESE, IIT Mumbai CIDCO
4.42 (p) Monthwise Measured Values Of Pm10 (G/M3) In Air At Various Stations Of The Project Area During The Pre Monsoon Season
140
4.42 (q) Monthwise Measured Values Of Nox (G/M3) In Air At Various Stations Of The Project Area During The Pre Monsoon Season
141
4.42 ( r) Monthwise Measured Values Of So2 (G/M3) In Air At Various Stations Of The Project Area During The Pre Monsoon Season
142
4.42 (s) Monthwise Measured Values Of Nh3 (G/M3) In Air At Various Stations Of The Project Area During The Pre Monsoon Season
143
4.42 (t) Monthwise Measured Values Of Co (G/M3) In Air At Various Stations Of The Project Area During The Pre Monsoon Season
144
4.42 (u) Monthwise Measured Values Of Hc (G/M3) In Air At Various Stations Of The Project Area During The Pre Monsoon Season
145
4.42 (v) Monthwise Measured Values Of Tsp (G/M3) In Air At Various Stations Of The Project Area During The Monsoon Season
146
4.42 (w) Monthwise Measured Values Of Pm10 (G/M3) In Air At Various Stations Of The Project Area During The Monsoon Season
147
4.42 (x) Monthwise Measured Values Of Nox (G/M3) In Air At Various Stations Of The Project Area During The Monsoon Season
148
4.42 (y) Monthwise Measured Values Of So2 (G/M3) In Air At Various Stations Of The Project Area During The Monsoon Season
149
4.42 (z)
Monthwise Measured Values Of Nh3 (G/M3) In Air At Various Stations Of The Project Area During The Monsoon Season
150
4.42 (z’) Monthwise Measured Values Of Co (G/M3) In Air At Various Stations Of The Project Area During The Monsoon Season
151
4.42 (z”) Monthwise Measured Values Of Hc (G/M3) In Air At Various Stations Of The Project Area During The Monsoon Season
152
4.43 Average Values Of Different Air Pollutants Concentration At Various Stations Of The Project Area During Post Monsoon Season
153
4.44 Average Values Of Different Air Pollutants Concentration At Various Stations Of The Project Area During Winter Season
154
4.45 Average Values Of Different Air Pollutants Concentration At Various Stations Of The Project Area During Pre Monsoon Season
155
4.46 Average Values Of Different Air Pollutants Concentration At Various Stations Of The Project Area During Monsoon Season
156
4.47 Air Quality Index (Aqi) And Air Quality Status At Various Station Of The Project Area During Post Monsoon Season
163
EIA Study of Navi Mumbai International Airport XVI
CESE, IIT Mumbai CIDCO
4.48 Air Quality Index (AQI) And Air Quality Status At Various Station Of The Project Area During Winter Season
164
4.49 Air Quality Index (Aqi) And Air Quality Status At Various Station Of The Project Area During Pre Monsoon Season
165
4.50 Air Quality Index (Aqi) And Air Quality Status At Various Station Of The Project Area During Monsoon Season
166
4.51 Average Air Quality Index (Aqi) And Overall Air Quality Status At Various Station Of The Project Area During Post Monsoon, Pre Monsoon, Monsoon Season
167
4.52 (a) Meteorological Data Recorded At Panvel For November, 2007 172
4.52 (b) Meteorological Data Recorded At Panvel For December, 2007 174
4.52 (c) Meteorological Data Recorded At Panvel For January, 2008 175
4.52 (d) Meteorological Data Recorded At Panvel For February, 2008 177
4.52 (e) Meteorological Data Recorded At Panvel For March, 2008 178
4.52 (f) Meteorological Data Recorded At Panvel For April, 2008 180
4.52 (g) Meteorological Data Recorded At Panvel For May, 2008 182
4.52 (h) Meteorological Data Recorded At Panvel For June, 2008 184
4.52 (i) Meteorological Data Recorded At Panvel For July, 2008 185
4.52 (j) Meteorological Data Recorded At Panvel For August, 2008 187
4.52 (k) Meteorological Data Recorded At Panvel For September, 2008 188
4.52 (l) Meteorological Data Recorded At Panvel For October, 2008 190
4.53 Summary Of Meteorological Data Recorded At Panvel During Post Monsoon Season
191
4.54 Summary Of Meteorological Data Recorded At Panvel During Winter Season
193
4.55 Summary Of Meteorological Data Recorded At Panvel During Pre Monsoon Season
194
4.56 Grand Summary Of Meteorological Data Recorded At Panvel 196
4.57 Frequency Of Cloud Cover In Oktas Observed In The Project Area During Post Monsoon Season
211
4.58 Frequency Of Cloud Cover In Oktas Observed In The Project Area During Winter Season
211
4.59 Frequency Of Cloud Cover In Oktas Observed In The Project Area 212
EIA Study of Navi Mumbai International Airport XVII
CESE, IIT Mumbai CIDCO
During Pre Monsoon Season
4.60 Frequency Of Cloud Cover In Oktas Observed In The Project Area During Monsoon Season
212
4.61 (a) Type Of Cloud Cover Observed During The Month Of November’ 2007
213
4.61 (b) Type Of Cloud Cover Observed During The Month Of December, 2007
214
4.61 (c) Type Of Cloud Cover Observed During The Month Of January, 2008 216
4.61 (d) Type Of Cloud Cover Observed During The Month Of February, 2008 217
4.61 (e) Type Of Cloud Cover Observed During The Month Of March, 2008 219
4.61 (f) Type Of Cloud Cover Observed During The Month Of April, 2008 220
4.61 (g) Type Of Cloud Cover Observed During The Month Of May, 2008 222
4.61 (h) Type Of Cloud Cover Observed During The Month Of June, 2008 223
4.61(i) Type Of Cloud Cover Observed During The Month Of July, 2008 225
4.61 (j) Type Of Cloud Cover Observed During The Month Of August, 2008 226
4.61 (k) Type Of Cloud Cover Observed During The Month Of September, 2008
228
4.61 (l) Type Of Cloud Cover Observed During The Month Of October, 2008 229
4.62 Visibility Observed Within Study Area During Post Monsoon Season 231
4.63 Visibility Observed Within Study Area During Winter Season 232
4.64 Visibility Observed Within Study Area During Pre Monsoon Season 233
4.65 Visibility Observed Within Study Area During Monsoon Season 234
4.66 Locations of Ambient Noise Quality Monitoring stations in and around the project site
236
4.67 Ambient Noise Quality Standards 237
4.68 (a) Hourly Leq Values At Various Location Of The Project Area During Post Monsoon Season
241
4.68 (b) Hourly Leq Values At Various Location Of The Project AreaDuring Pre Monsoon season
243
4.68 (c) Hourly Leq Values At Various Locations Of The Project Area During Monsoon Season
245
4.69 (a) Area wise Noise Characteristics In The Project Area During Post Monsoon Season (January, 2008)
251
EIA Study of Navi Mumbai International Airport XVIII
CESE, IIT Mumbai CIDCO
4.69 (b) Area wise Noise Characteristics In The Project Area During Pre Monsoon Season (April, 2008)
252
4.69 (c) Area wise Noise Characteristics In The Project Area During Monsoon Season (October, 2008)
253
4.70 Index Ranges 248
4.71 (a) Ambient Noise Level At Various Location Of The Project Area During Post Monsoon Season
255
4.71 (b) Ambient Noise Level At Various Location Of The Project Area During Pre Monsoon Season
256
4.71 (c) Ambient Noise Level At Various Location Of The Project Area During Monsoon Season
257
4.72 Ambient Noise Quality Standards 254
4.73 Monitoring Stations In The Project Area For Ecological Studies 260
4.74 List of Avifauna recorded in the study area 264
4.75 Gastropods, Pelecypods, Butterflies, Reptiles & Mammals Encountered During The Site Visits In Different Seasons
267
4.76 Fish, Amphibians, Prawns & Crabs Encountered During The Site Visits In Different Seasons
268
4.77 (a) Ecological Indices for the Flora of Terrestrial Habitats in Project Area Surveyed During Pre Monsoon Season
283
4.77 (b) Ecological Indices for the Flora of Terrestrial Habitats in Project Area Surveyed During Monsoon Season
288
4.77 (c) Ecological Indices for the Flora of Terrestrial Habitats in Project Area Surveyed During Post Monsoon Season
295
4.78 List of Protected Forests in the Study Area 300
4.79 List of Reserve Forests in the Study Area 303
4.80 (a) Phytoplankton Species Encountered in Marine Water of Gadhi River, Ulwe River and Panvel Creek during Pre-Monsoon Season
306
4.80 (b) Phytoplankton species encountered at all collection stations from Gadhi River, Ulwe River and Panvel Creek in Monsoon Season
307
4.80 (c) Phytoplankton species encountered at all collection stations from Gadhi River, Ulwe River and Panvel Creek in Post Monsoon
308
4.81 (a) Primary Production of Water at Different Stations along Gadhi River, Ulwe River and Panvel Creek in Pre Monsoon Season
311
4.81 (b) Primary Production of Water Collected From Different Stations along Gadhi River, Ulwe River and Panvel Creek in Monsoon Season
312
EIA Study of Navi Mumbai International Airport XIX
CESE, IIT Mumbai CIDCO
4.81 (c) Primary Production of Water Collected From Different Stations along Gadhi River, Ulwe River and Panvel Creek in Post Monsoon Season
313
4.82 (a) Species Composition of Zooplankton from Various Stations in Aquatic Habitats in the Project Area during Pre- Monsoon Season
315
4.82 (b) Zooplankton Species encountered in waters collected from different sites along Gadhi River, Ulwe River And Panvel Creek during monsoon
316
4.82 (c) Species encountered in waters collected from different sites along Gadhi River, Ulwe River And Panvel Creek during Post monsoon
317
4.83 (a ) Ecological Indices Calculated For The Zooplankton at Various Locations Along Gadhi River, Panvel Creek And Ulwe River during Pre Monsoon Season
318
4.83 (b) Ecological Indices for Zooplankton Species at Various Locations Along Gadhi River, Panvel Creek And Ulwe River during Monsoon.
319
4.83 (c) Ecological Indices Calculated For The Zooplankton From Various Locations Along Gadhi River, Panvel Creek And Ulwe River during Post Monsoon.
320
4.84 (a) Dry Organic Weight of the Zooplankton Collected From Various Stations along Gadhi River, Panvel Creek and Ulwe River During Pre Monsoon Season
321
4.84 (b) Dry Organic Weight of the Zooplankton Collected From Various Stations along Gadhi River, Panvel Creek and Ulwe River During Monsoon Season
323
4.84 (c) Dry Organic Weight of the Zooplankton Collected From Various Stations along Gadhi River, Panvel Creek and Ulwe River during Post Monsoon Season
324
4.85 (a ) Benthic Forms Encountered in the Sediments Collected at Various Stations along Gadhi River, Panvel Creek and Ulwe River during Pre Monsoon Season.
326
4.85 (b) Benthic Forms Encountered in the Sediments Collected at Various Stations along Gadhi River, Panvel Creek and Ulwe River during Monsoon Season.
327
4.85 (c ) Benthic Forms Encountered in the Sediments Collected at Various Stations along Gadhi River, Panvel Creek and Ulwe River during Post Monsoon Season.
328
4.86 (a ) Organic Matter Content of Sediments from Various Stations along Gadhi River, Ulwe River and Panvel Creek during Pre Monsoon Season
329
4.86 (b) Organic Matter Content of Sediments from Various Stations along Gadhi River, Ulwe River and Panvel Creek during Monsoon Season
330
EIA Study of Navi Mumbai International Airport XX
CESE, IIT Mumbai CIDCO
4.86 (c) Organic Matter Content of Sediments from Various Stations along Gadhi River, Ulwe River and Panvel Creek during Post Monsoon Season
331
4.87 (a) Results Of Water Quality Analysis Of Gadhi River During Post Monsoon Season
333
4.87 (b) Results Of Water Quality Analysis Of Gadhi River During Pre Monsoon Season
334
4.87 (c) Results Of Water Quality Analysis Of Gadhi River During Monsoon Season
335
4.87 (d) Results Of Water Quality Analysis Of Ulve River During Post Monsoon, Premonsoon And Monsoon
336
4.87 (e) Results Of Water Quality Analysis Of Panvel Creek During Post Monsoon, Pre-Monsoon & Monsoon Season
337
4.88 Direct Connectivity To Catchment Area And The Rest Of The Country 341
4.89 Traffic growth Rates for NH4B,AAMRA MARG,SH54&NH4 347
4.90 PCU Factors of Vehicles 348
4.91 Natural Traffic Forecast 349
4.92 Airport Traffic 350
4.93 Total Traffic 351
4.94 Peak Hour Volume & Capacity 351
4.95 Details of Intersections 353
4.96 Summary of data collected 361
4.97 Traffic volume forecast at Belapur Intersection 362
4.98 Traffic volume forecast at Kalamboli Intersection 363
4.99 Traffic volume forecast at D. Y. Patil Intersection 364
4.100 Traffic volume forecast at Panvel Intersection 365
4.101 Traffic volume forecast at Uran Intersection 366
4.102 Traffic volume forecast at Taloja Intersection 367
4.103 Traffic volume forecast at sanpada Intersection 368
4.104 Parameters Selected For Node Evaluation 370
4.105 Intersection Evaluation for Belapur Intersection 371
4.106 Intersection Evaluation for Kalamboli Intersection 372
EIA Study of Navi Mumbai International Airport XXI
CESE, IIT Mumbai CIDCO
4.107 Intersection Evaluation for D.Y. Patil Intersection 373
4.108 Intersection Evaluation for Panvel Intersection 373
4.109 Intersection Evaluation for Uran-JNPT Intersection 374
4.110 Intersection Evaluation for Taloja Intersection 374
4.111 Intersection Evaluation for Sanpada Intersection 375
4.112 a V/C Ratio for Belapur Intersection of Approach 12 377
4.112 b V/C Ratio for Belapur Intersection of Approach 14 378
4.112 c V/C Ratio for Belapur Intersection of Approach 16 379
4.112 d V/C Ratio for Belapur Intersection of Approach 18 380
4.113 a V/C Ratio for Kalamboli Intersection of Approach 62 381
4.113 b V/C Ratio for Kalamboli Intersection of Approach 64 382
4.113 c V/C Ratio for Kalamboli Intersection of Approach 66 383
4.113 d V/C Ratio for Kalamboli Intersection of Approach 68 384
4.113 e V/C Ratio for Kalamboli Intersection of Approach 69 385
4.114 a V/C Ratio for D Y Patil Intersection of Approach 42 386
4.114 b V/C Ratio for D Y Patil Intersection of Approach 44 387
4.114 c V/C Ratio for D Y Patil Intersection of Approach 46 388
4.115 Status Of Land For The Project 390
4.116 Villages, Settlements Area & Population and Househols within Airport
391
4.117 Landcover Of Study Area 2009 402
4.118 Existing Landcover Of Project Zone 2009 403
VOLUME-IV
Chapter 5
5.1 Phasing of Activities 3
5.2 NMIA Location : Activities & Impact 4
5.3 NMIA Project Design – Activities & Impact 8
5.4 NMIA Construction Phase – Activities & Impacts 10
5.5 NMIA Operation Phase – Activities & Impact 12
5.6 Details of Project Activities Influences 15
EIA Study of Navi Mumbai International Airport XXII
CESE, IIT Mumbai CIDCO
5.7 NMIA Evaluation– Overall significance of Impact 17
5.8 NMIA Location – Impact Matrix 25
5.9 NMIA - Project Design Impact Matrix 26
5.10 NMIA Construction Phase Impact Matrix 27
5.11 NMIA Operation Phase Impact Matrix 29
5.12 Environmental sector – Air 30
5.13 Environmental sector – Biodiversity and Forests 32
5.14 Environmental sector - Ecosystems 33
5.15 Environmental sector – Energy 34
5.16 Environmental sector – Health and Safety 35
5.17 Environmental sector – Land 36
5.18 Environmental sector – Noise 38
5.19 Environmental sector – Socio-cultural 40
5.20 Environmental sector – Waste 41
5.21 Environmental sector – Water and Wastewater 42
Chapter 6
6.1 Environmental Management Action Plan 9
6.2 Environmental monitoring Plan 34
6.3 EMP cost during construction phase 44
6.4 EMP cost during operational phase 45
6.5 Organizations Responsibility 47
6.6 List of equipments needed 48
Chapter 7
7.1 Assignment of Responsibilities 13
7.2 Medical Priorities in Triage Area 21
VOLUME V
Chapter 8
8.1 Mangrove plants within the Project Area 52
8.2 Structural composition 53
EIA Study of Navi Mumbai International Airport XXIII
CESE, IIT Mumbai CIDCO
8.3 Importance value index 54
8.4 Details of Images 55
8.5 a Surface Traffic Air Quality Assessment CO 77
8.5 b Surface Traffic Air Quality Assessment NOX 78
8.5 c Surface Traffic Air Quality Assessment SO2 79
8.5 d Surface Traffic Air Quality Assessment CO 80
8.5 e Surface Traffic Air Quality Assessment NOX 81
8.6 a Projected noise level Sion-Panvel Highway 83
8.6 b Projected noise level-National Highway No.4 B 83
8.6 c Projected noise level-National Highway No.4 84
8.6 d Projected noise level – Amra Marg 84
8.6 e Projected noise level-State Highway 54 85
8.7 Noise level due to Aircraft 87
8.8 Predicted noise levels due to Air traffic 88
8.9 Traffic Mix – 2014 91
8.10 Area between NEF Contour Values 93
EIA Study of Navi Mumbai International Airport XXIV
CESE, IIT Mumbai CIDCO
List of Figures
VOLUME II
Chapter 1
1.1 Map of major Airports in India 5
1.2 Annual Commercial Passengers , CSIA 16
1.3 Comparison of Annual Passenger Growth rates, CSIA & National 18
1.4 Monthly Distribution of Total Passengers in Recent Years, CSIA 19
1.5 Monthly Passengers During 2007-08, CSIA 20
1.6 Annual Commercial Aircraft Movements, CSIA 22
1.7 Annual Other Aircraft Movements, CSIA 24
1.8 Distribution of Total Arriving Aircraft by ICAO Code 26
1.9 Distribution of International and Domestic Arriving Aircraft by ICAO Code
26
1.10 Monthly Commercial ATMs during 2006-07, CSIA 28
1.11 Hourly Distribution of Weekly Scheduled ATMs, January 2008, CSIA 29
1.12 Breakdown of Total Air Cargo in 2007-08, CSIA 31
1.13 Breakdown of International Air Cargo by Commodity, CSIA 31
1.14 Study Area 44
Chapter 2
2.1 Map showing location of Rewas Mandwa & Navi Mumbai airports 2
2.2 Map showing Rewas Mandwa site on Toposheet 3
2.3 Map showing Rewas Mandwa site on Imagery 3
2.4 Map showing Navi Mumbai site on Toposheet 8
2.5 Map showing Navi Mumbai site on Imagery 8
Chapter 3
3.1 Location of Navi Mumbai Airport 2
3.2 Navi Mumbai Airport Zone 3
3.3 NMIA-Transportation Network & Linkages 5
3.4 NMIA Airport Layout Plan – Long Term Phase 4
EIA Study of Navi Mumbai International Airport XXV
CESE, IIT Mumbai CIDCO
3.5 Terminal Area Plan 22
3.6 Landuse plan of Aeronautical area 29
3.7 Map showing Solid Waste Management Site at Chal 37
VOLUME III
Chapter 4
4.1 Study Area 1
4.2 Geomorphology of study area 6
4.3 Ground Slope of study area 7
4.4 Geology & Dykes 8
4.5 Drainage in the study area 12
4.6 Independent Catchment Of Gadhi River Upto Kalundri Junction 13
4.7 Catchment of Kalundri River 14
4.8 Catchment of Kasadi –Taloja river 15
4.9 Catchment of Ulwe River 16
4.10 Location of Soil Monitoring Stations 18
4.11 Textural Triangle Showing The Percentage Of Sand, Silt And Clay 20
4.12 Soil map of Navi Mumbai 37
4.13 Soil Map of Navi Mumbai International Airport 38
4.14 Location of Boreholes 41
4.15 Sub-Soil profile of Airport Site (Longitudinal Sectional Profile ) 57
4.16 Sub-Soil profile of Airport Site (Cross Sectional Profile) 58
4.17 Location of boreholes 64
4.18 Sub-Soil profile of Airport Site (Longitudinal Sectional Profile along South Runway)
65
4.19 Sub-Soil profile of Airport Site (Longitudinal Sectional Profile along North Runway )
66
4.20 Sub-Soil profile of Airport Site (Longitudinal Sectional Profile along centreline of Airport)
68
4.21 Sub-Soil profile of Airport (Longitudinal Sectional Profile along Northen bank of river)
69
4.22 Sub-Soil profile of Airport (Longitudinal Sectional Profile along 70
EIA Study of Navi Mumbai International Airport XXVI
CESE, IIT Mumbai CIDCO
Southern bank of river)
4.23 Location of Stations for Studying Existing Water Quality Status 77
4.24 Locations of Air Monitoring Stations 122
4.25 Location of meteorological station 169
4.26 (a) Hourly Variation Of Average Wind Speed For The Month Of November, 2007 And October 2008
197
4.26 (b) Hourly Variation Of Average Temperature For The Month Of November, 2007 And October 2008
198
4.26 (c) Hourly Variation Of Average Relative Humidity For The Month Of November, 2007 And October 2008
198
4.26 (d) Hourly Variation Of Average Solar Radiation For The Month Of November, 2007 And October 2008
199
4.27 (a) Hourly Variation of Average Wind Speed for the Month of December, 2007, January, 2008 and February, 2008
199
4.27 (b) Hourly Variation of Average Temperature for the Month of December, 2007, January, 2008 and February, 2008
200
4.27 (c) Hourly Variation of Average Relative Humidity Speed for the Month of December, 2007, January, 2008 and February, 2008
200
4.27 (d) Hourly Variation of Average Solar Radiation for the Month of December, 2007,January, 2008 And February, 2008
201
4.28 (a) Hourly Variation of Average Wind Speed for the Month of March, 2008, April, 2008 and May, 2008
201
4.28 (b) Hourly Variation of Average Temperature for the Month of March, 2008, April, 2008 and May, 2008
202
4.28 (c) Hourly Variation of Average Relative Humidity Speed for the Month of March, 2008, April, 2008 and May, 2008
202
4.28 (d) Hourly Variation of Average Solar Radiation for the Month of March, 2008, April, 2008 and May, 2008
203
4.29 (a) Hourly Variation of Average Wind Speed for the Month Of June, 2008, July, 2008, August, 2008 and September, 2008
203
4.29 (b) Hourly Variation of Average Temperature for the Month Of June, 2008, July, 2008, August, 2008 and September, 2008
204
4.29 (c) Hourly Variation Of Average Relative Humidity For The Month Of June, 2008, July, 2008, August, 2008 And September, 2008
204
4.30 (a) Wind Rose For The Month Of November, 2007 205
4.30 (b) Wind Rose For The Month Of December, 2007 205
EIA Study of Navi Mumbai International Airport XXVII
CESE, IIT Mumbai CIDCO
4.30 (c) Wind Rose For The Month Of January, 2008 206
4.30 (d) Wind Rose For The Month Of February, 2008 206
4.30 (e) Wind Rose For The Month Of March, 2008 207
4.30 (f) Wind Rose For The Month Of April, 2008 207
4.30 (g) Wind Rose For The Month Of May, 2008 208
4.30 (h) Wind Rose For The Month Of June, 2008 208
4.30 (i) Wind Rose For The Month Of July, 2008 209
4.30 (j) Wind Rose For The Month Of August, 2008 209
4.30 (k) Wind Rose For The Month Of September, 2008 210
4.30 (l) Wind Rose For The Month Of October, 2008 210
4.31 Location of Noise quality monitoring stations 235
4.32 Locations of Monitoring Stations for Ecological Studies 262
4.33 Forest Map of Study Area 302
4.34 Location and Catchment area of the Proposed airport in Navi Mumbai 340
4.35 Master Plan Of Water Transport System 343
4.36 Land Access Modes Of Navi Mumbai Airport - The Important Linkages
346
4.37 Location of Intersections 353
4.38 Belapur Intersection 354
4.39 Kalamboli Intersection 355
4.40 D.Y.Patil Intersection 356
4.41 Panvel Intersection 357
4.42 Uran Intersection 358
4.43 Taloja Intersection 359
4.44 Sanpada Intersection 360
4.45 Traffic volume forecast at Belapur Intersection 363
4.46 Traffic volume forecast at Kalamboli Intersection 364
4.47 Traffic volume forecast at D. Y. Patil Intersection 365
4.48 Traffic volume forecast at Panvel Intersection 366
4.49 Traffic volume forecast at Uran Intersection 367
EIA Study of Navi Mumbai International Airport XXVIII
CESE, IIT Mumbai CIDCO
4.50 Traffic volume forecast at Taloja Intersection 368
4.51 Traffic volume forecast at Sanpada Intersection 369
4.52 Settlements Falling within Airport Zone 392
4.53 Landcover Of Study Area 2009 – on Imagery 400
4.54 Landcover Of Study Area 2009 401
4.55 Landcover Of Project Area 2009 404
4.56 Approved Map Of Navi Mumbai Costal Zone Management Plan-1 410
4.57 Approved Map Of Navi Mumbai Costal Zone Management Plan-2 411
4.58 Navi Mumbai International Airport on Approved CZMP Of Navi Mumbai
412
4.59 Navi Mumbai International Airport With The Training Of Gadhi And Diversion Of Ulwe Rivers
413
4.60 Proposed minor changes in the CZMP Of Navi Mumbai 414
VOLUME IV
Chapter 5
5.1 Identification and Evaluation and Development of Mitigation Options -Flow Diagram
1
5.2 Project timelines 3
5.3 Project Activities – Influence & Impact Evaluation 14
Chapter 6
6.1 Proposed Environmental Management Cell at NMIA 5
VOLUME V
Chapter 8
8.1 Diversion of Ulwe River & Training of Gadhi River 28
8.2 Cross Sections for Proposed Training of Gadhi River 29
8.3 Cross Sections for Proposed Diversion of Ulwe River 30
8.4 Digitized shape of Vaghvli island & the coastal lines imagery 40
8.5 Digitized shape of Vaghvli island & the coastal lines imagery 1992 41
8.6 Digitized shape of Vaghvli island & the coastal lines imagery 1995 42
8.7 Digitized shape of Vaghvli island & the coastal lines on Iknos imagery 2001
43
EIA Study of Navi Mumbai International Airport XXIX
CESE, IIT Mumbai CIDCO
8.8 Digitized shape of Vaghvli island & the coastal lines on imagery 2006 44
8.9 Digitized shape of Vaghvli island & the coastal lines on imagery 2009 45
Chapter - 4
Description of Environment
Chapter 4 EIA Study of Navi Mumbai International Airport Sheet 1 of 416
CESE, IIT Mumbai CIDCO
Chapter-4
DESCRIPTION OF ENVIRONMENT
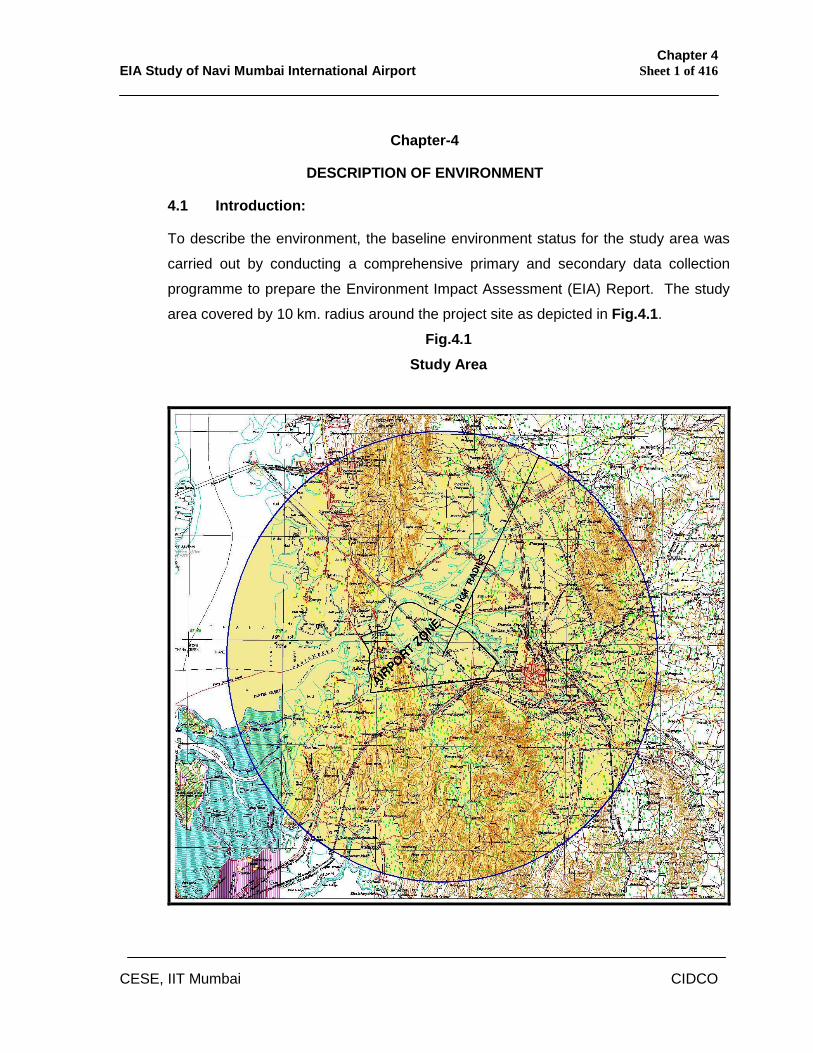
4.1 Introduction:
To describe the environment, the baseline environment status for the study area was
carried out by conducting a comprehensive primary and secondary data collection
programme to prepare the Environment Impact Assessment (EIA) Report. The study
area covered by 10 km. radius around the project site as depicted in Fig.4.1.
Fig.4.1 Study Area
Chapter 4 EIA Study of Navi Mumbai International Airport Sheet 2 of 416
CESE, IIT Mumbai CIDCO
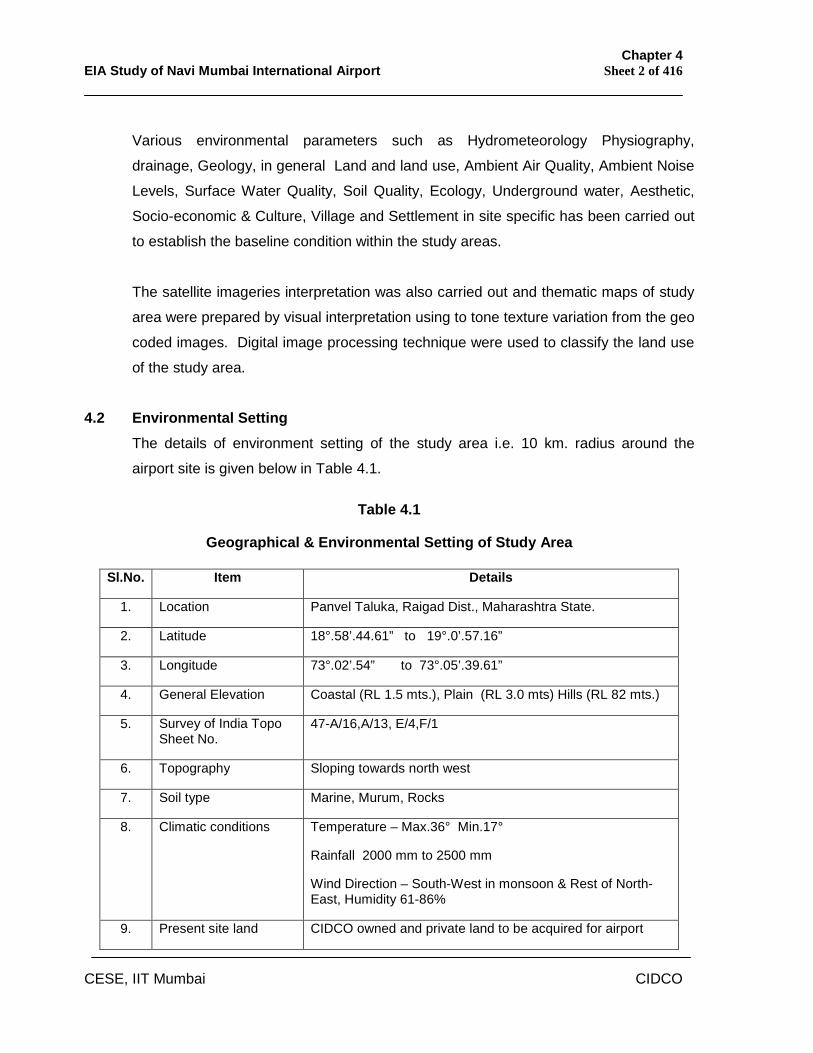
Various environmental parameters such as Hydrometeorology Physiography,
drainage, Geology, in general Land and land use, Ambient Air Quality, Ambient Noise
Levels, Surface Water Quality, Soil Quality, Ecology, Underground water, Aesthetic,
Socio-economic & Culture, Village and Settlement in site specific has been carried out
to establish the baseline condition within the study areas.
The satellite imageries interpretation was also carried out and thematic maps of study
area were prepared by visual interpretation using to tone texture variation from the geo
coded images. Digital image processing technique were used to classify the land use
of the study area.
4.2 Environmental Setting The details of environment setting of the study area i.e. 10 km. radius around the
airport site is given below in Table 4.1.
Table 4.1
Geographical & Environmental Setting of Study Area
Sl.No. Item Details
1. Location Panvel Taluka, Raigad Dist., Maharashtra State.
2. Latitude 18°.58’.44.61” to 19°.0’.57.16”
3. Longitude 73°.02’.54” to 73°.05’.39.61”
4. General Elevation Coastal (RL 1.5 mts.), Plain (RL 3.0 mts) Hills (RL 82 mts.)
5. Survey of India Topo Sheet No.
47-A/16,A/13, E/4,F/1
6. Topography Sloping towards north west
7. Soil type Marine, Murum, Rocks
8. Climatic conditions Temperature – Max.36° Min.17°
Rainfall 2000 mm to 2500 mm
Wind Direction – South-West in monsoon & Rest of North-East, Humidity 61-86%
9. Present site land CIDCO owned and private land to be acquired for airport
Chapter 4 EIA Study of Navi Mumbai International Airport Sheet 3 of 416
CESE, IIT Mumbai CIDCO
Source : CESE., IIT Mumbai.
4.3 Hydrometeorology
The climate of the region is tropical maritime with high relative humidity throughout the
year. The general climatic regime is fairly equitable since seasonal fluctuations of
temperature are not significantly large. The moderating effects of the nearby sea and
the fairly high amount of relative humidity in the atmosphere have restricted the
variability.
The seasonal variation of temperature follows closely the course of the sun. January is
invariably the coldest month and May the warmest. With the onset of monsoon in early
June the temperature decreases and remain more or less steady. Again the
temperature rises in October and falls gradually till January. The maximum day
temperature ranges in between 28˚C to 32˚C while the minimum temperature ranges
in between 17˚C to 27˚ C.
The average relative humidity varies from lowest in the month of December to the
highest of 85% during July. The humidity is relatively higher in the morning hours than
in the evening hours. The daily humidity values do not show any significant or sudden
status development.
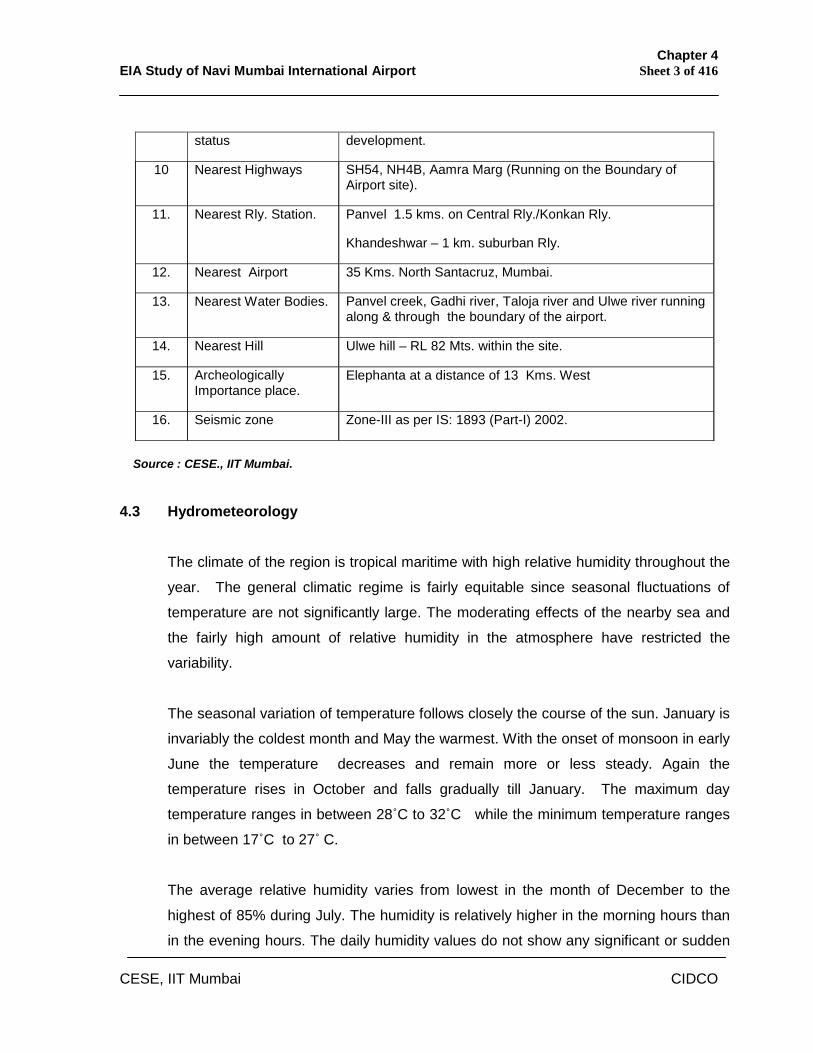
10 Nearest Highways SH54, NH4B, Aamra Marg (Running on the Boundary of Airport site).
11. Nearest Rly. Station. Panvel 1.5 kms. on Central Rly./Konkan Rly.
Khandeshwar – 1 km. suburban Rly.
12. Nearest Airport 35 Kms. North Santacruz, Mumbai.
13. Nearest Water Bodies. Panvel creek, Gadhi river, Taloja river and Ulwe river running along & through the boundary of the airport.
14. Nearest Hill Ulwe hill – RL 82 Mts. within the site.
15. Archeologically Importance place.
Elephanta at a distance of 13 Kms. West
16. Seismic zone Zone-III as per IS: 1893 (Part-I) 2002.

Chapter 4 EIA Study of Navi Mumbai International Airport Sheet 4 of 416
CESE, IIT Mumbai CIDCO
changes. The relatively high humidity has a considerable impact on the atmosphere in
reducing its variability. The relative humidity remains between 44% to 76%
throughout the year.
The monsoon generally sets in around the second week of June and continues till late
September. July and August are the wettest months all over the region. Maximum
rainfall is recorded mostly in the month of July. During winter and the post monsoon
season skies are generally clear. In pre-monsoon season light clouds are observed in
the evenings with clear mornings. During the monsoon both morning and the evening
skies are overcast.
The study area fall in the High Rainfall Zone of Konkan. It receives rainfall between
June to September i.e. monsoon period. Some amount of rainfall is also received
during non-monsoon period. In the study area, rainfall is measured at 3 taluka stations.
i.e. (a) Panvel, (b) Uran & (c) Thane
a) Panvel Hydrometeorological Station : The data is available from 1989 up
to 2009. The IMD normal rainfall is 2741 mm. The 21 year data reveals that for
12 years, the rainfall received is above normal by 0.44 % to 50.89 %. For 9
years the rainfall received is below normal and it ranges from 2.30 % to 33.27%.
b) Uran Hydrometeorological Station : The data is available from 1989 to 2009.
The IMD normal rainfall is 2072 mm. The 21 years data reveals that for 12 years
the rainfall received is above normal by 7.58 % to 70.08 %. For 9 years
the rainfall received is below normal and it ranges from 0.14 % to 56.18 %.
c) Thane Hydrometeorological Station : The data is available from 1989 to 2009.
The IMD normal rainfall is 2446 mm. The 21 years data reveals that in 11
years the rainfall received is above normal by 1.84 % to 63.08 %. For 10
years the rainfall received is below normal and it ranges from 1.02 % to 36.92 %.
Chapter 4 EIA Study of Navi Mumbai International Airport Sheet 5 of 416
CESE, IIT Mumbai CIDCO
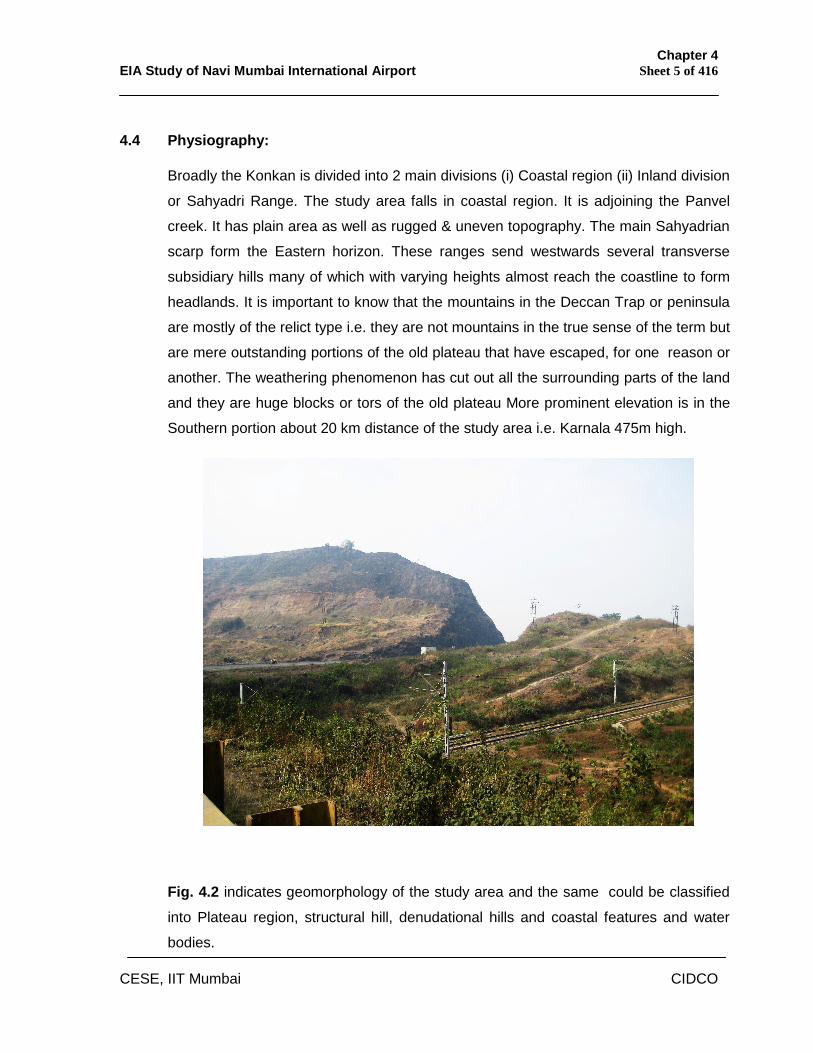
4.4 Physiography:
Broadly the Konkan is divided into 2 main divisions (i) Coastal region (ii) Inland division
or Sahyadri Range. The study area falls in coastal region. It is adjoining the Panvel
creek. It has plain area as well as rugged & uneven topography. The main Sahyadrian
scarp form the Eastern horizon. These ranges send westwards several transverse
subsidiary hills many of which with varying heights almost reach the coastline to form
headlands. It is important to know that the mountains in the Deccan Trap or peninsula
are mostly of the relict type i.e. they are not mountains in the true sense of the term but
are mere outstanding portions of the old plateau that have escaped, for one reason or
another. The weathering phenomenon has cut out all the surrounding parts of the land
and they are huge blocks or tors of the old plateau More prominent elevation is in the
Southern portion about 20 km distance of the study area i.e. Karnala 475m high.
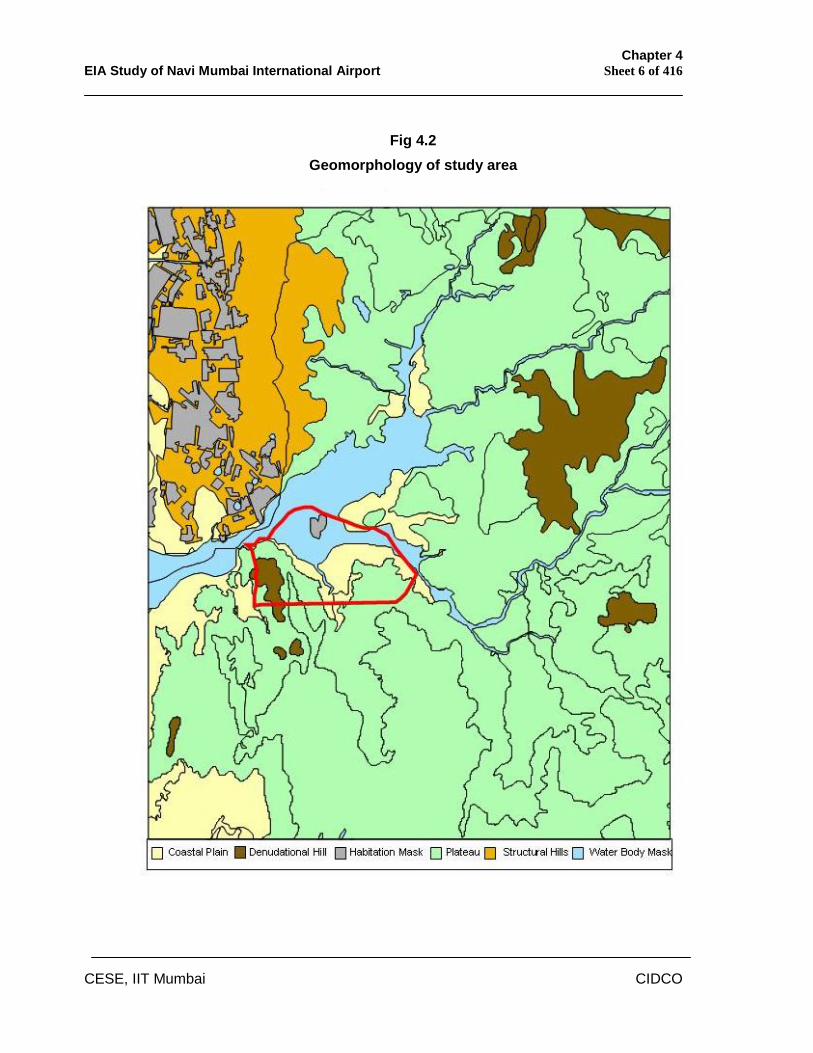
Fig. 4.2 indicates geomorphology of the study area and the same could be classified
into Plateau region, structural hill, denudational hills and coastal features and water
bodies.
Chapter 4 EIA Study of Navi Mumbai International Airport Sheet 6 of 416
CESE, IIT Mumbai CIDCO
Fig 4.2
Geomorphology of study area
Chapter 4 EIA Study of Navi Mumbai International Airport Sheet 7 of 416
CESE, IIT Mumbai CIDCO
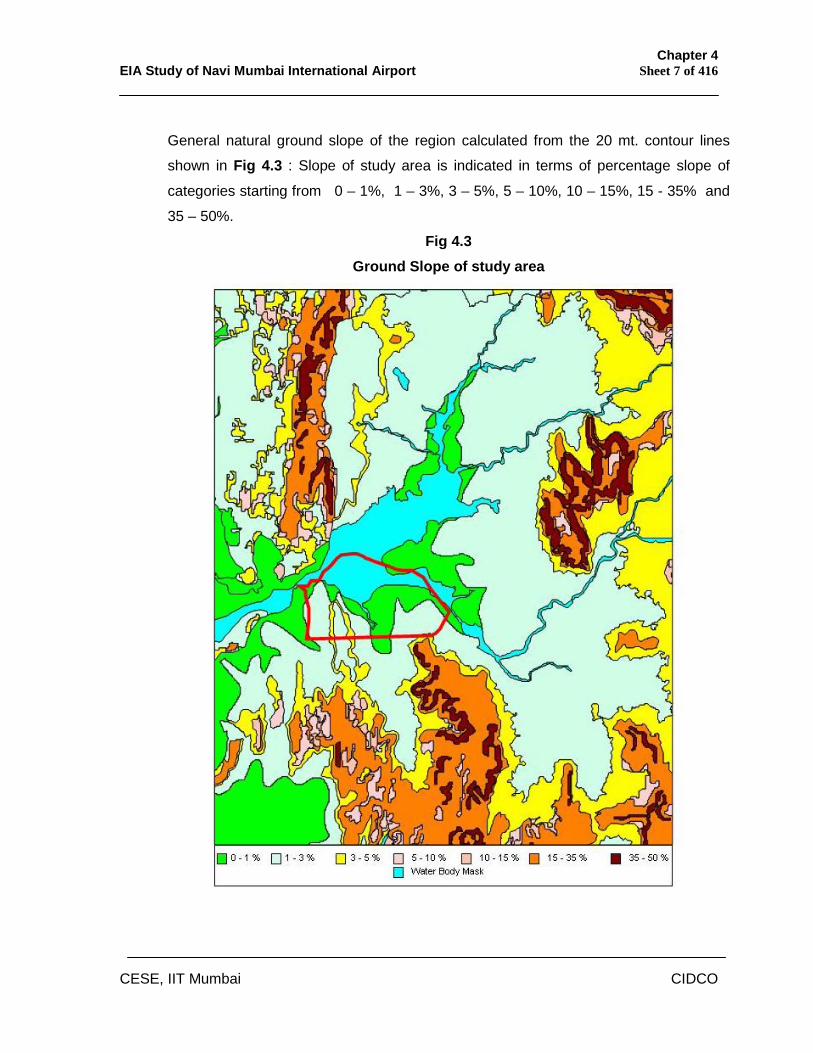
General natural ground slope of the region calculated from the 20 mt. contour lines
shown in Fig 4.3 : Slope of study area is indicated in terms of percentage slope of
categories starting from 0 – 1%, 1 – 3%, 3 – 5%, 5 – 10%, 10 – 15%, 15 - 35% and
35 – 50%.
Fig 4.3
Ground Slope of study area
Chapter 4 EIA Study of Navi Mumbai International Airport Sheet 8 of 416
CESE, IIT Mumbai CIDCO
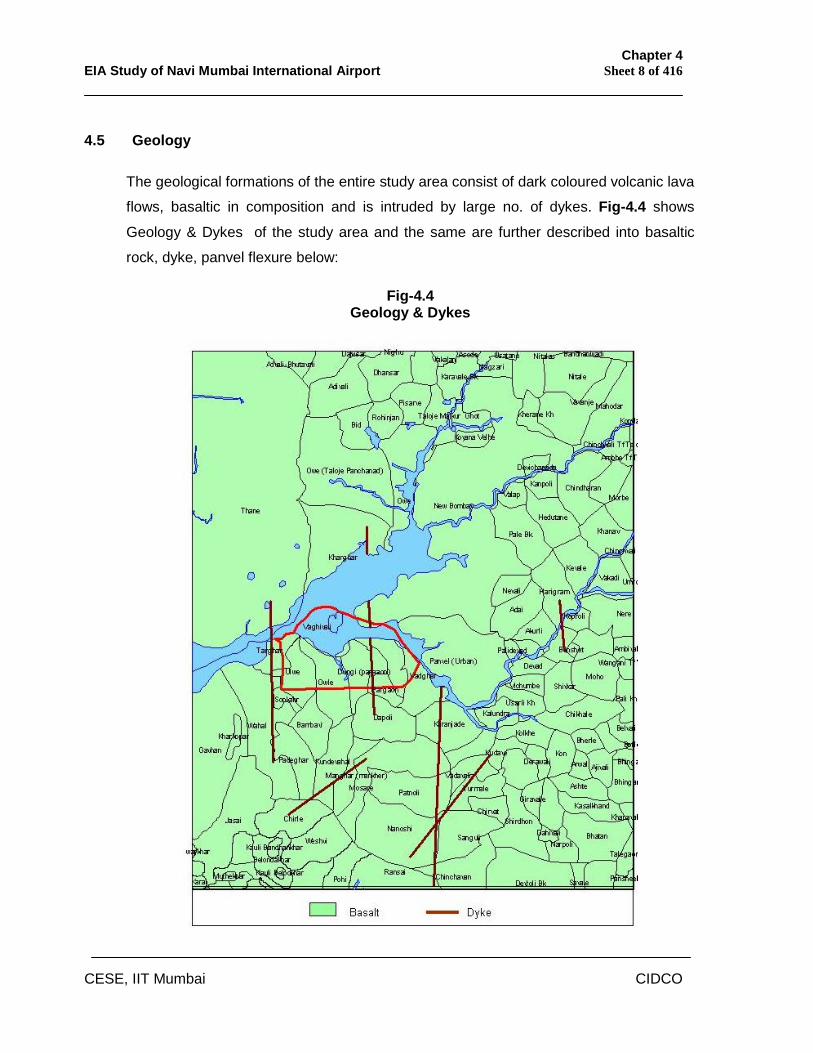
4.5 Geology
The geological formations of the entire study area consist of dark coloured volcanic lava
flows, basaltic in composition and is intruded by large no. of dykes. Fig-4.4 shows
Geology & Dykes of the study area and the same are further described into basaltic
rock, dyke, panvel flexure below:
Fig-4.4 Geology & Dykes
Chapter 4 EIA Study of Navi Mumbai International Airport Sheet 9 of 416
CESE, IIT Mumbai CIDCO
(i) Basaltic rocks: The lava flows were poured out of long and narrow fissures in the
earths crust, during the Upper Cretaceous to Lower Eocene period approximately, 80 to
100 million years ago. These are spread out in the form of horizontal sheets or beds
and constitute the innumerable spurs, hills and hill ranges, bold flat topped ridged, lofty
peaks and plateaus with impressive cliffs. These hill ranges and plateaus form a part of
Western Ghats. In the plains and valleys the lava flow occurs below a thin blanket of
soil of variable thickness. A characteristic feature of these flows is their horizontal
disposition and considerable lateral extent with almost incredible uniformity in their
composition and appearance.
These lava flows are also termed as plateau basalts, because of their dominantly
basaltic composition and the tendency to form flat topped plateau. Since these basaltic
lava flows cover an extensive region in the Deccan and frequently present step like
appearances to the hills and ridges they are commonly termed as “Deccan Traps” - the
word trap in Swedish meaning stairs or steps.
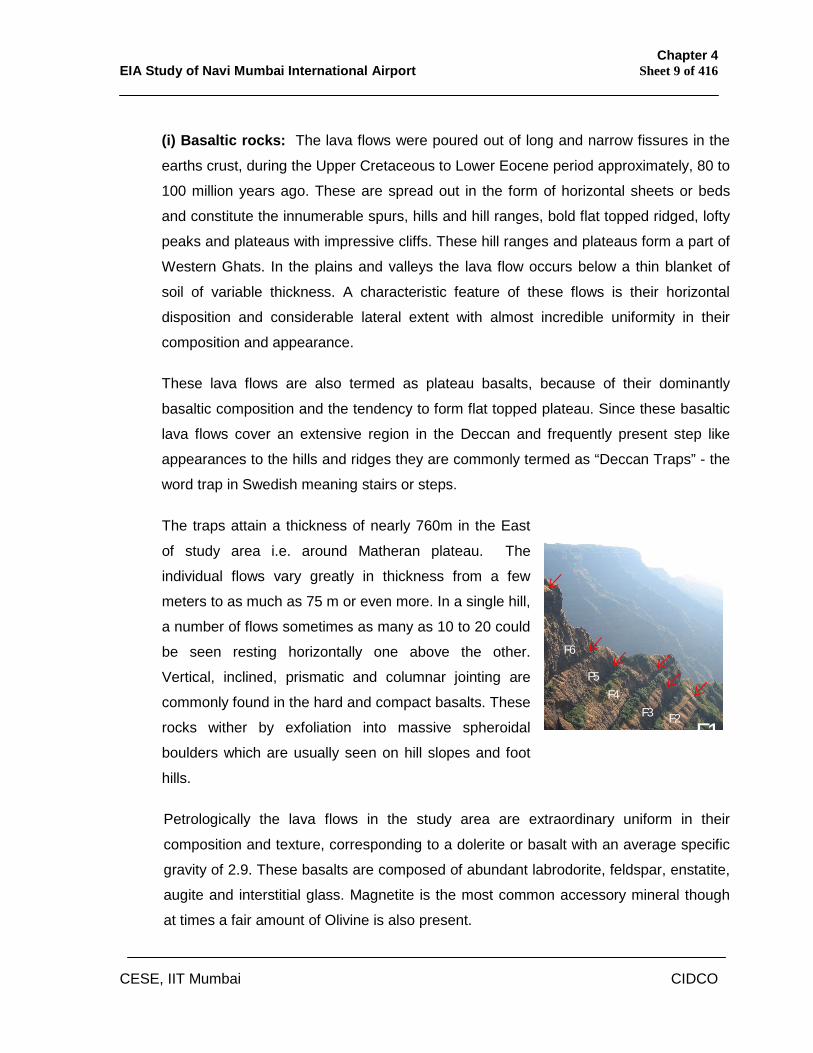
The traps attain a thickness of nearly 760m in the East
of study area i.e. around Matheran plateau. The
individual flows vary greatly in thickness from a few
meters to as much as 75 m or even more. In a single hill,
a number of flows sometimes as many as 10 to 20 could
be seen resting horizontally one above the other.
Vertical, inclined, prismatic and columnar jointing are
commonly found in the hard and compact basalts. These
rocks wither by exfoliation into massive spheroidal
boulders which are usually seen on hill slopes and foot
hills.
Petrologically the lava flows in the study area are extraordinary uniform in their
composition and texture, corresponding to a dolerite or basalt with an average specific
gravity of 2.9. These basalts are composed of abundant labrodorite, feldspar, enstatite,
augite and interstitial glass. Magnetite is the most common accessory mineral though
at times a fair amount of Olivine is also present.
F1 F3
F4
F5
F6
F2
Chapter 4 EIA Study of Navi Mumbai International Airport Sheet 10 of 416
CESE, IIT Mumbai CIDCO
The basalts are usually dark gray and bluish gray in colour and are hard, compact and
tough. The texture is fine to medium grained.
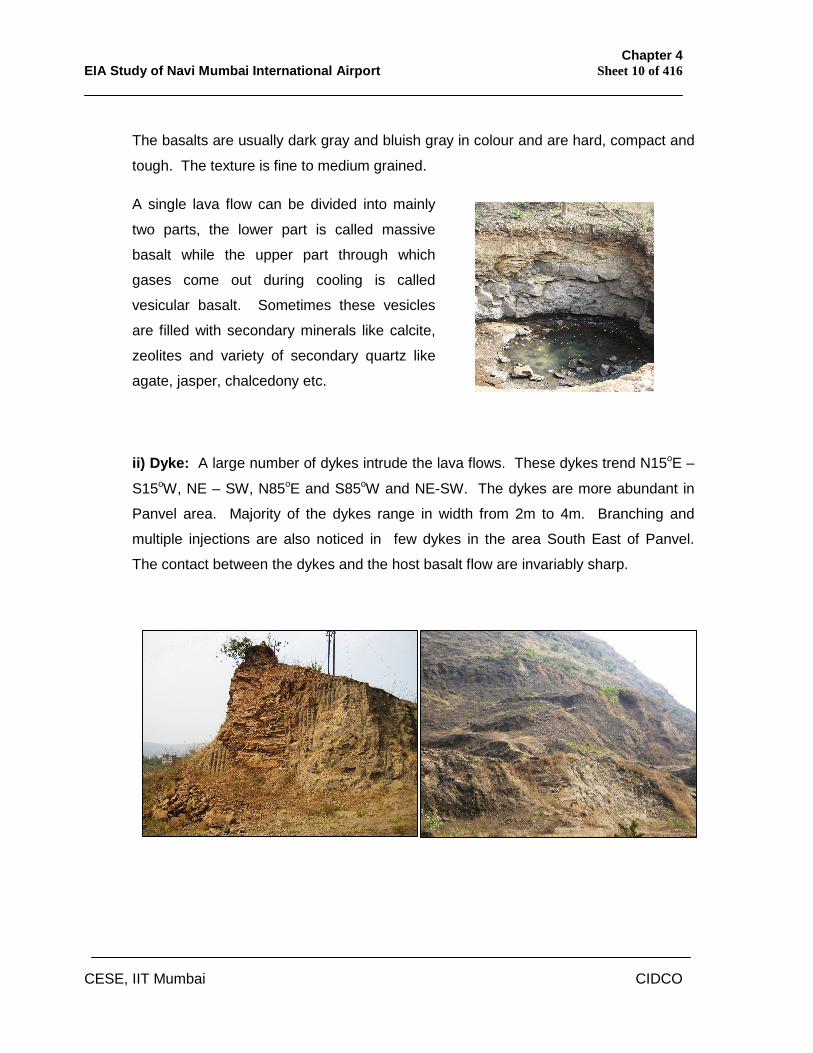
A single lava flow can be divided into mainly
two parts, the lower part is called massive
basalt while the upper part through which
gases come out during cooling is called
vesicular basalt. Sometimes these vesicles
are filled with secondary minerals like calcite,
zeolites and variety of secondary quartz like
agate, jasper, chalcedony etc.
ii) Dyke: A large number of dykes intrude the lava flows. These dykes trend N15oE –
S15oW, NE – SW, N85oE and S85oW and NE-SW. The dykes are more abundant in
Panvel area. Majority of the dykes range in width from 2m to 4m. Branching and
multiple injections are also noticed in few dykes in the area South East of Panvel.
The contact between the dykes and the host basalt flow are invariably sharp.
Chapter 4 EIA Study of Navi Mumbai International Airport Sheet 11 of 416
CESE, IIT Mumbai CIDCO
iii) Panvel Flexure : Panvel Flexure has been noted for more than a century
(Bladford 1867, Wynne 1886). These workers have described the flexure as a simple
monoclinal fold (bending) of the lava flows. Some workers have linked the origin of
the flexure to the west-coast rifting, subsidence and uplift of Western Ghats. The
flexure is north-south and extends from Gujrat to Murud Jangira. Many have doubted
the very nature of this Panvel structure as a flexure. Many theories are put up but
they are still inadequate.
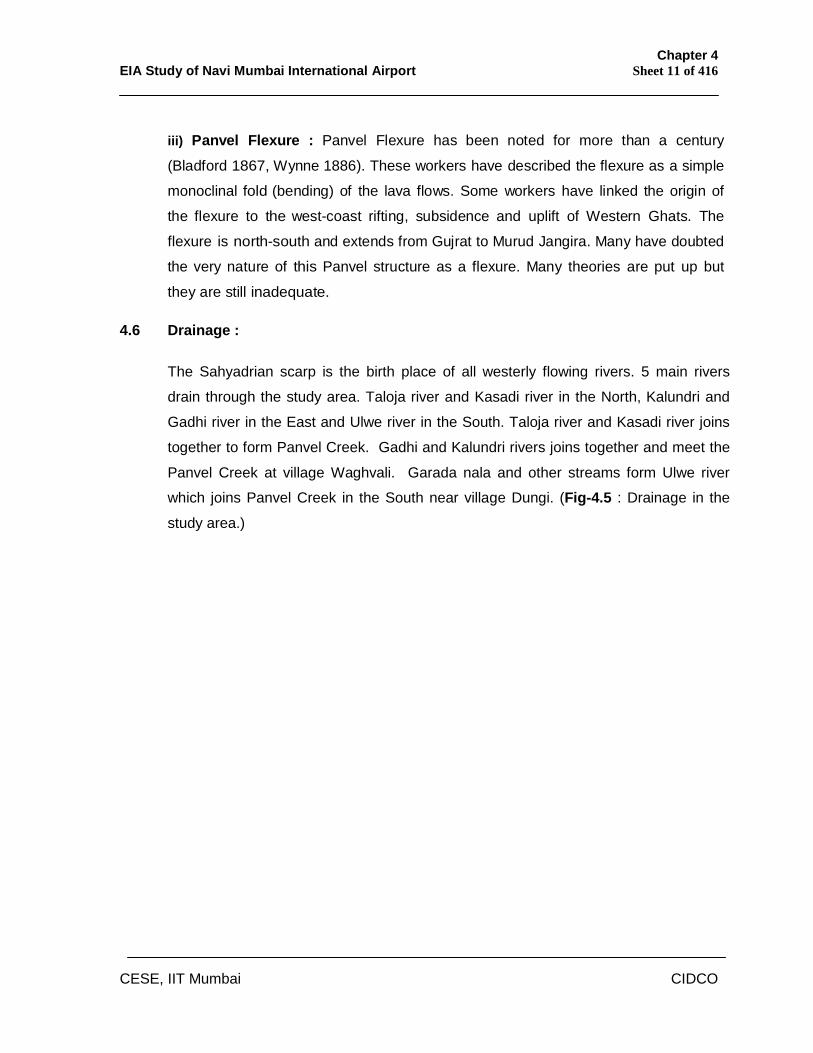
4.6 Drainage :
The Sahyadrian scarp is the birth place of all westerly flowing rivers. 5 main rivers
drain through the study area. Taloja river and Kasadi river in the North, Kalundri and
Gadhi river in the East and Ulwe river in the South. Taloja river and Kasadi river joins
together to form Panvel Creek. Gadhi and Kalundri rivers joins together and meet the
Panvel Creek at village Waghvali. Garada nala and other streams form Ulwe river
which joins Panvel Creek in the South near village Dungi. (Fig-4.5 : Drainage in the
study area.)
Chapter 4 EIA Study of Navi Mumbai International Airport Sheet 12 of 416
CESE, IIT Mumbai CIDCO
Fig-4.5 Drainage in the study area
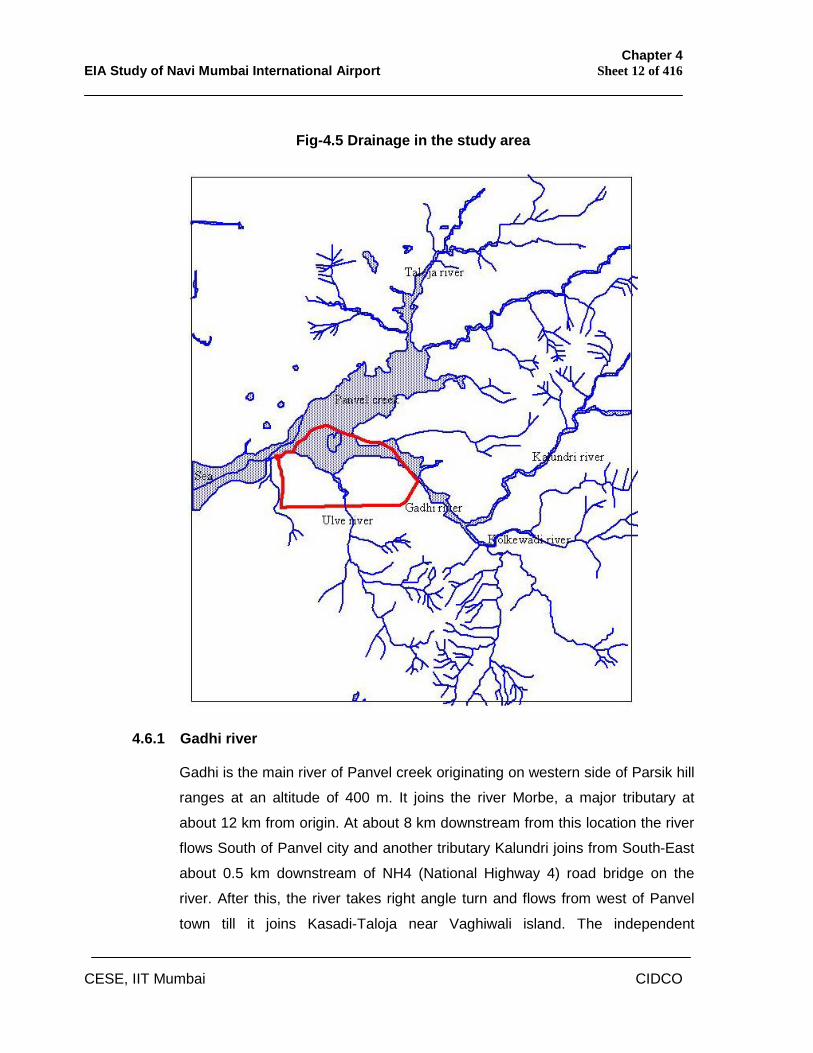
4.6.1 Gadhi river
Gadhi is the main river of Panvel creek originating on western side of Parsik hill
ranges at an altitude of 400 m. It joins the river Morbe, a major tributary at
about 12 km from origin. At about 8 km downstream from this location the river
flows South of Panvel city and another tributary Kalundri joins from South-East
about 0.5 km downstream of NH4 (National Highway 4) road bridge on the
river. After this, the river takes right angle turn and flows from west of Panvel
town till it joins Kasadi-Taloja near Vaghiwali island. The independent
Chapter 4 EIA Study of Navi Mumbai International Airport Sheet 13 of 416
CESE, IIT Mumbai CIDCO
catchment of Gadhi river upto Kalundri junction shown in Fig.4.6 is about 123
sq.km. Between Kalundri confluence and Vaghiwali island, an additional
catchment of about 30 sq.km exists. The Panvel town is situated on the right
bank of Gadhi in the reach between Expressway bridge and NH4B. Tidal effect
reaches some distance upstream of NH4 bridge on Gadhi, Kalundri, Kasadi
and Taloja river.
Fig.4.6 Independent Catchment Of Gadhi River Upto Kalundri Junction
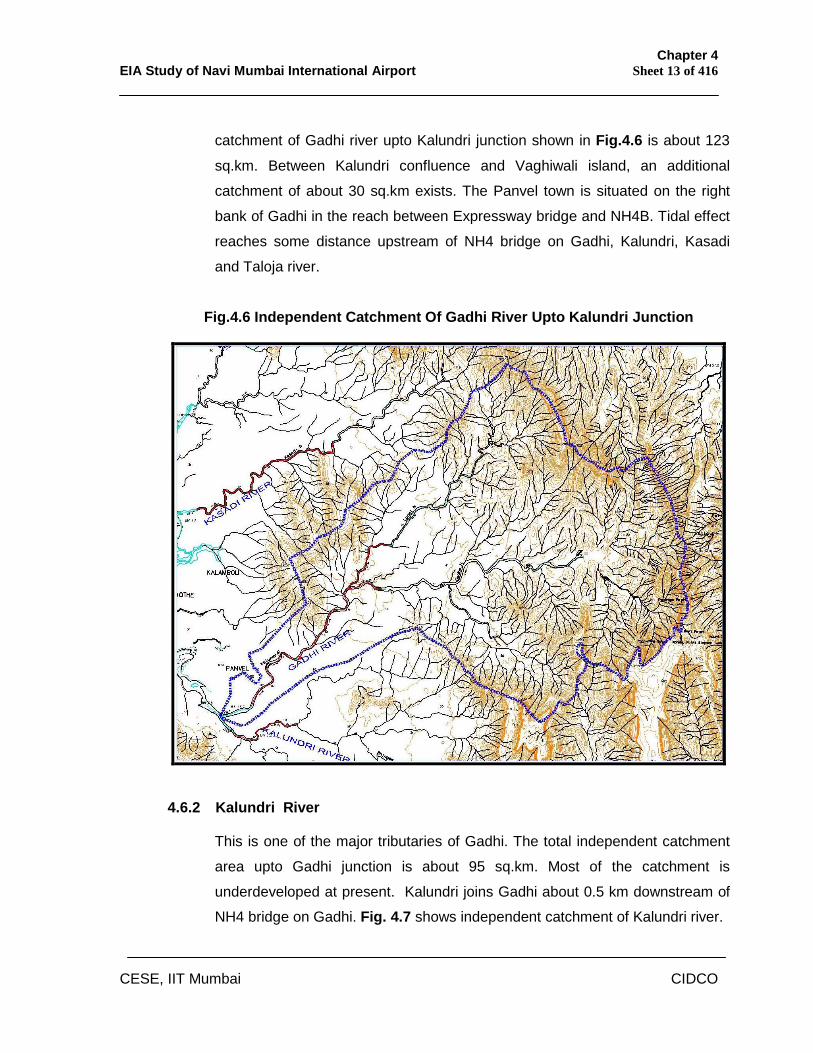
4.6.2 Kalundri River
This is one of the major tributaries of Gadhi. The total independent catchment
area upto Gadhi junction is about 95 sq.km. Most of the catchment is
underdeveloped at present. Kalundri joins Gadhi about 0.5 km downstream of
NH4 bridge on Gadhi. Fig. 4.7 shows independent catchment of Kalundri river.
Chapter 4 EIA Study of Navi Mumbai International Airport Sheet 14 of 416
CESE, IIT Mumbai CIDCO
Fig. 4.7 Catchment of Kalundri River
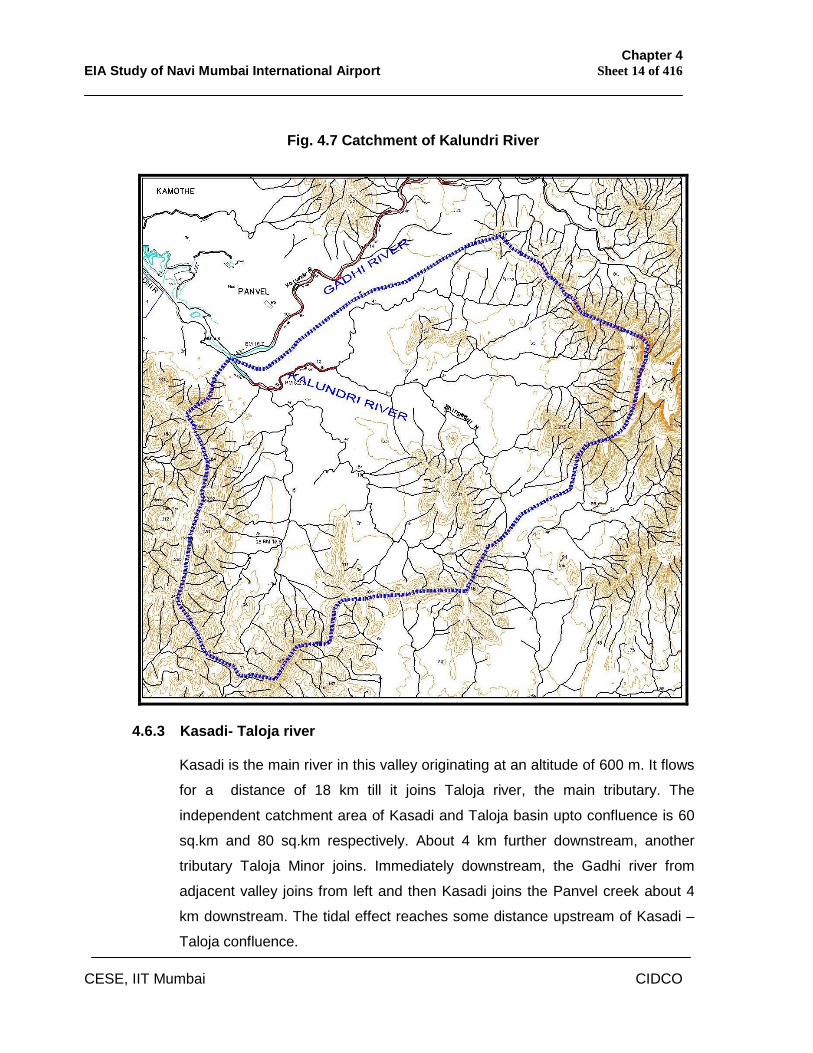
4.6.3 Kasadi- Taloja river
Kasadi is the main river in this valley originating at an altitude of 600 m. It flows
for a distance of 18 km till it joins Taloja river, the main tributary. The
independent catchment area of Kasadi and Taloja basin upto confluence is 60
sq.km and 80 sq.km respectively. About 4 km further downstream, another
tributary Taloja Minor joins. Immediately downstream, the Gadhi river from
adjacent valley joins from left and then Kasadi joins the Panvel creek about 4
km downstream. The tidal effect reaches some distance upstream of Kasadi –
Taloja confluence.
Chapter 4 EIA Study of Navi Mumbai International Airport Sheet 15 of 416
CESE, IIT Mumbai CIDCO
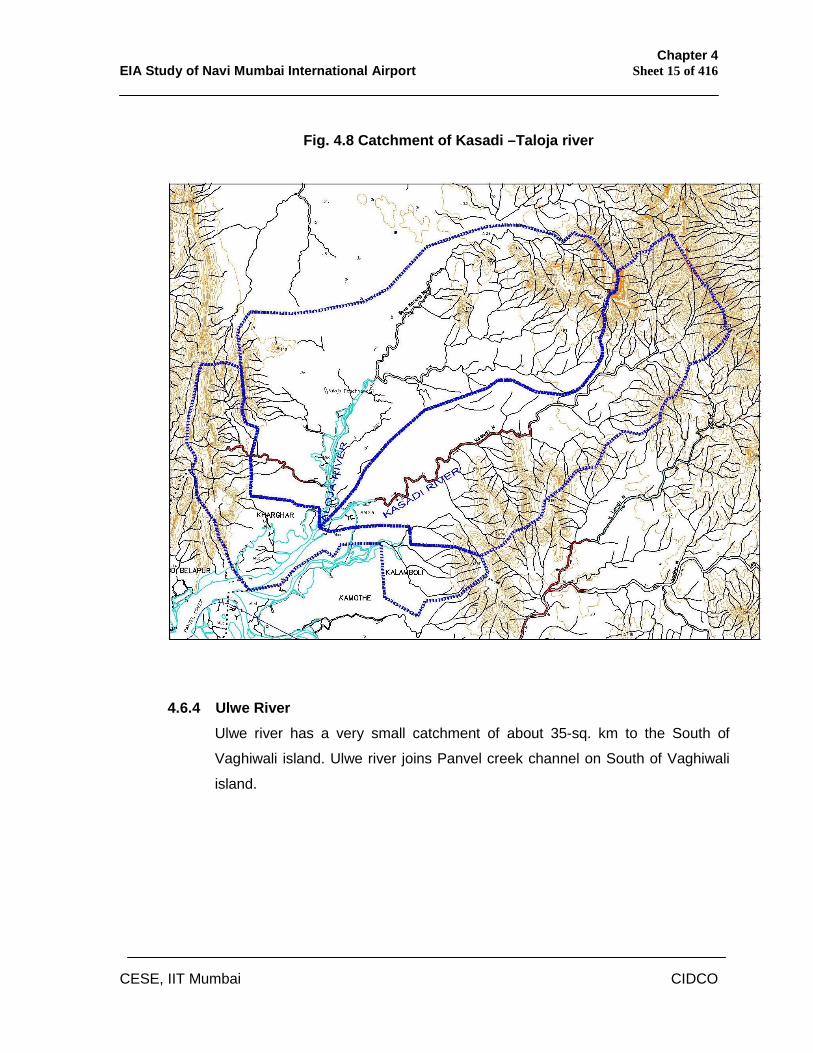
Fig. 4.8 Catchment of Kasadi –Taloja river
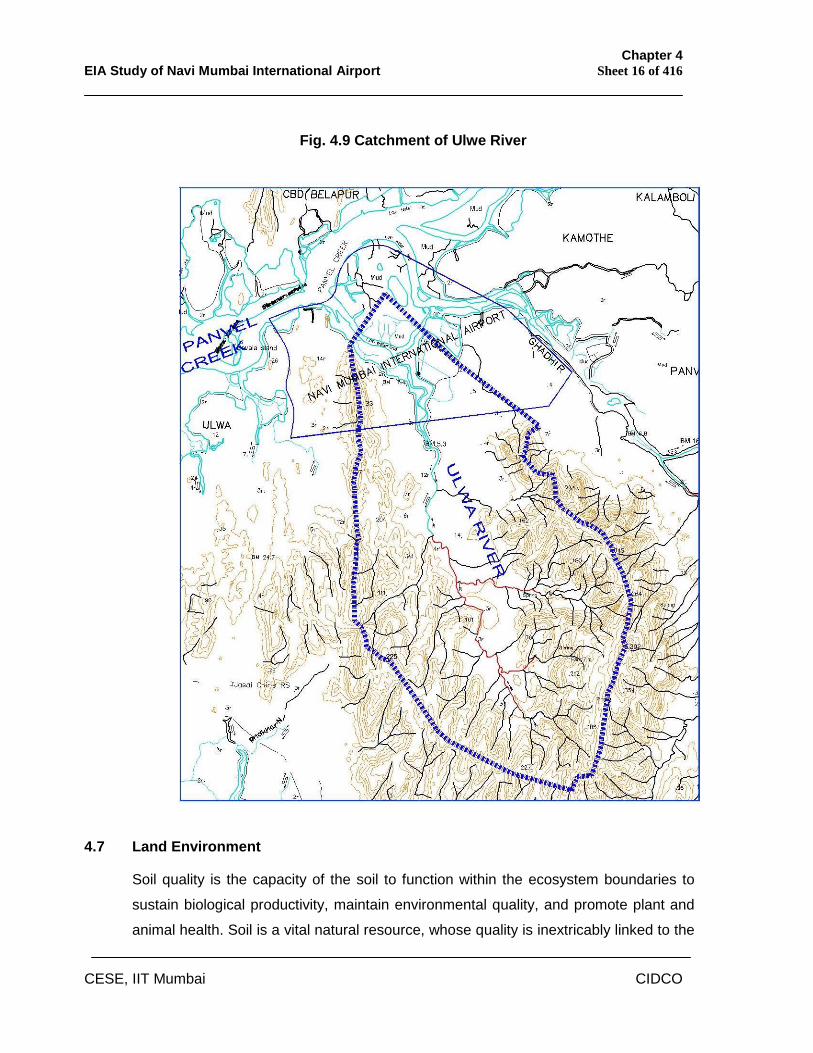
4.6.4 Ulwe River
Ulwe river has a very small catchment of about 35-sq. km to the South of
Vaghiwali island. Ulwe river joins Panvel creek channel on South of Vaghiwali
island.
Chapter 4 EIA Study of Navi Mumbai International Airport Sheet 16 of 416
CESE, IIT Mumbai CIDCO
Fig. 4.9 Catchment of Ulwe River
4.7 Land Environment
Soil quality is the capacity of the soil to function within the ecosystem boundaries to
sustain biological productivity, maintain environmental quality, and promote plant and
animal health. Soil is a vital natural resource, whose quality is inextricably linked to the
Chapter 4 EIA Study of Navi Mumbai International Airport Sheet 17 of 416
CESE, IIT Mumbai CIDCO
human quality of life. Processes that affect the soil resource base impact the quality of
life, either directly by affecting food and fibre production or indirectly by affecting other
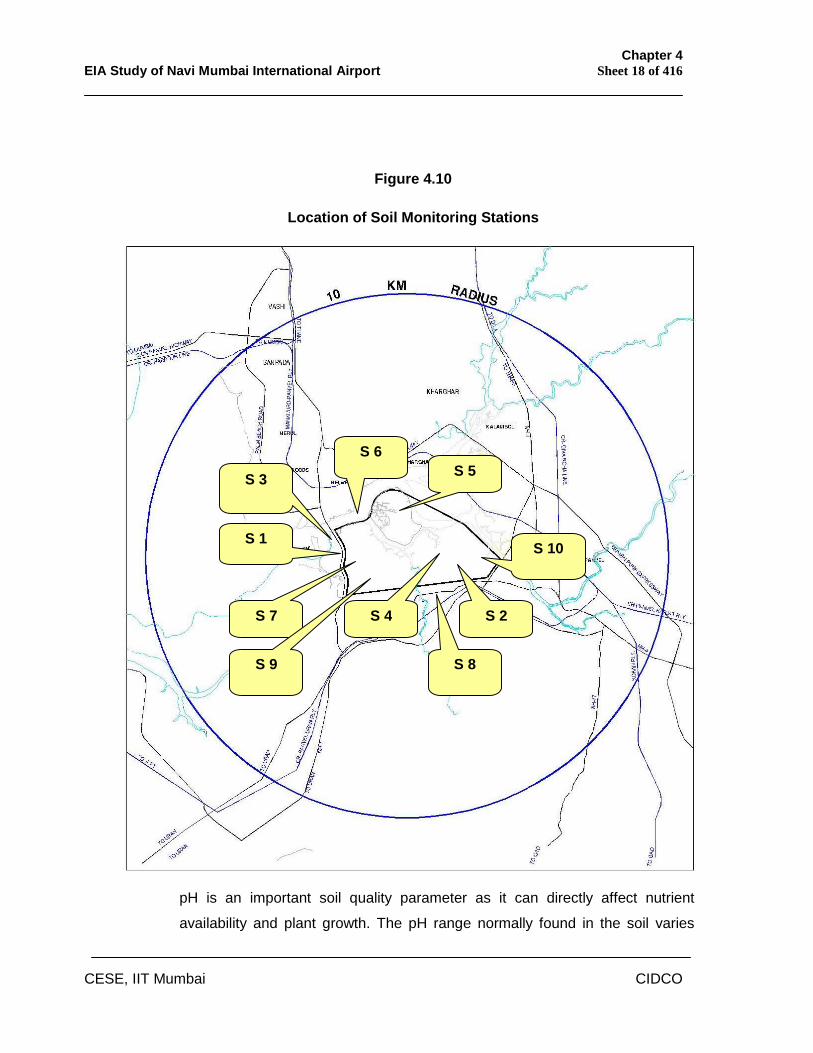
natural resources such as air, water and wildlife. Ten soil quality monitoring stations
were selected in the project area and the location of soil quality monitoring stations is
given in Table 4.2. Locations were selected so as to represent one sample from each
village in the project area. Locations of soil quality monitoring stations are given in
Figure 4.10. TABLE 4.2
SOIL QUALITY MONITORING STATIONS IN THE PROJECT AREA
Station Code Sampling Location
S1 Targhar
S2 Koppar
S3 Kombad bhuge
S4 Koli
S5 Vaghvli
S6 Ganeshpuri
S7 Ulve
S8 Pargaon
S9 Vaghelivada
S10 Chinchpada
The samples collected from all locations were analyzed for parameters viz. pH,
electrical conductivity, cation exchange capacity, texture, sodium, calcium,
magnesium, potassium, sodium adsorption ratio, permeability, water holding capacity
and porosity and the results are given in Table 4.7, 4.8 & 4.9.
Chapter 4 EIA Study of Navi Mumbai International Airport Sheet 18 of 416
CESE, IIT Mumbai CIDCO
Figure 4.10
Location of Soil Monitoring Stations
4.6.1 pH
pH is an important soil quality parameter as it can directly affect nutrient
availability and plant growth. The pH range normally found in the soil varies
S 1
S 8
S 7
S 6 S 5
S 4
S 3
S 2
S 10
S 9
Chapter 4 EIA Study of Navi Mumbai International Airport Sheet 19 of 416
CESE, IIT Mumbai CIDCO
from 3 to 9. Soil pH reflects percent base saturation of the cation exchange
capacity (CEC). Soil pH is strongly related to the presence and relative
concentrations of Sodium and Calcium ions, which affect soil structure, and
thus pH is also related to physical as well as to chemical soil conditions. Most
plants grow well in soils with pH values between 6.0 and 8.0. The pH of soil
samples was in the range 6.8 to 7.4, 6.5 to 7.4, 5.1 to 6.3 during post monsoon,
pre monsoon and monsoon season which indicate neutral soil at all locations.
Neutral soil is suitable for most of the plants. At neutral soil has 100% base
saturation of the CEC.
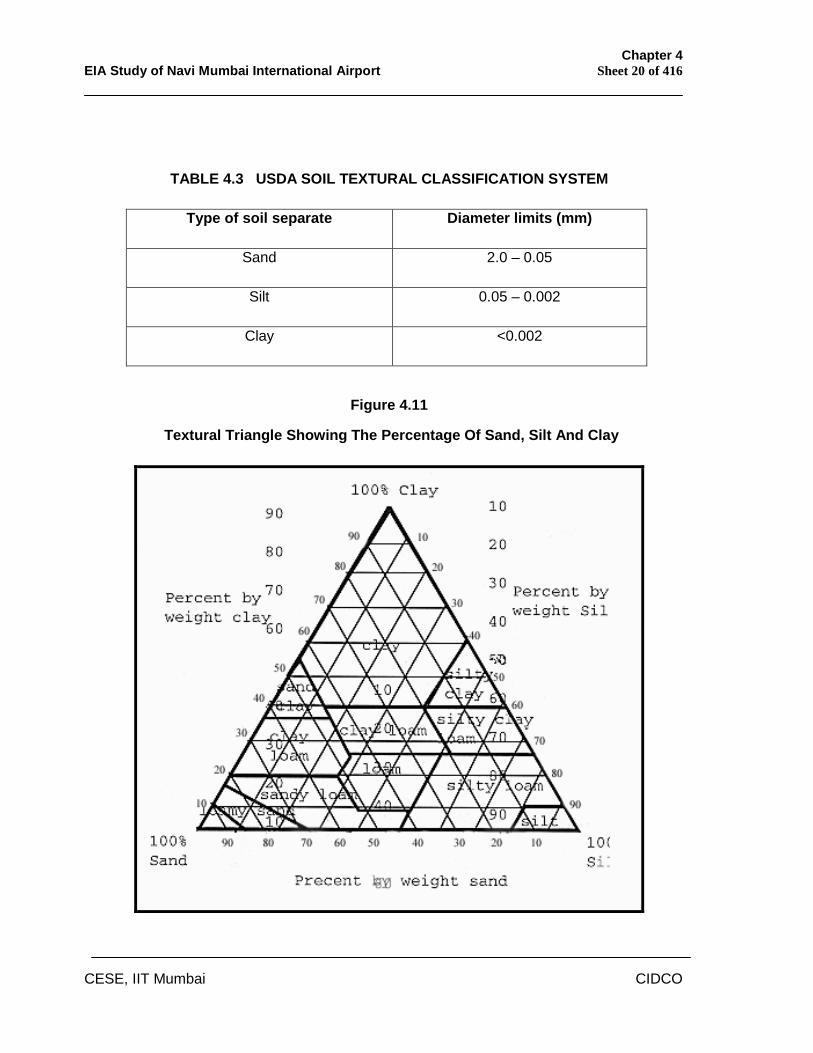
4.7.1 Particle Size Distribution
Soil texture is an intrinsic attribute of the soil and the most often used to
characterize its physical composition. Soil texture is one of the properties of the
mineral soil which determines its usefulness for agriculture purposes. Soil is
mainly composed of three minerals i.e. sand, silt, and clay. According to their
size, these mineral particles are grouped into “separates”. A soil separate is a
group of mineral particles that fit within definite size limits expressed as
diameter in millimeters. Size of the separates used in the USDA (Unites States
Department of Agriculture) system of nomenclature for soil texture is shown in
Table 4.3 and textural triangle showing the percentage of sand, silt and clay is
shown in Figure 4.11.
Chapter 4 EIA Study of Navi Mumbai International Airport Sheet 20 of 416
CESE, IIT Mumbai CIDCO
TABLE 4.3 USDA SOIL TEXTURAL CLASSIFICATION SYSTEM
Type of soil separate Diameter limits (mm)
Sand 2.0 – 0.05
Silt 0.05 – 0.002
Clay <0.002
Figure 4.11
Textural Triangle Showing The Percentage Of Sand, Silt And Clay
Chapter 4 EIA Study of Navi Mumbai International Airport Sheet 21 of 416
CESE, IIT Mumbai CIDCO
Soil samples collected from all stations were analyzed for particle size
distribution and the results are given in Table 4.10 ,4.11, 4.12. The clay, silt
and sand content of the soil in the project area ranges from 3.6-53.6 %, 9.2-55
% and 17.8-79.1 % respectively reflecting a wide range of variations in their
particle size distribution. The texture of all the soil samples was dominated by
“Loam”. Hence, the soil at project area is “loamy soil”. The texture of all the soil
samples in the project area was varied from loam, sandy loam, clay loam,
sandy clay loam, loamy sand, silt loam to clay. A soil dominated by one or two
of the three particle size groups behaves like loam. Loam is soil composed of
sand, silt, and clay in relatively even concentration (about 40-40-20%
concentration respectively). Loamy soil is the moderately fine textured soil and
it holds more moisture as well as fertilizer, organic matter and plant nutrition,
which can be beneficial to plant growth. Loamy soil further classified based on
the different proportions of sand, silt and clay as sandy loam, silty loam, clay
loam, sandy clay loam, silty clay loam, and loam. Loamy soils are more fertile
than sandy soils, loam is not stiff and tenacious like clay soils. Its porosity
allows high moisture retention and air circulation.
4.7.2 Electrical conductivity (EC) and SAR (Sodium Adsorption Ratio)
Electrical conductivity or EC is a measure of the total salinity in the soil. Soil
salinity refers to the concentration of soluble inorganic salts in the soil. Soil
salinity affects plants directly through the reduced osmotic potential of the soil
solution and the toxicity of specific ions such as boron, chloride, and sodium.
High salt concentrations in the soil can cause salt induced drought stress,
which will in turn prevent water and nutrient uptake by roots. High salinity levels
inhibit seed germination and plant growth. Different plants have different salt
tolerance levels. These values are most often given as mS/cm or dS/m. Salinity
is important property since it reflects the extent to which the soil is suitable for
growing crops. Electrical conductivity (EC) of the soils were in the range of 0.65
to 1.49, 0.35 to 1.67, and 0.02 to 0.06 during post monsoon, pre monsoon and
Chapter 4 EIA Study of Navi Mumbai International Airport Sheet 22 of 416
CESE, IIT Mumbai CIDCO
monsoon season. Soil salinity effects are mostly negligible in the range of 0 to
2 mS/cm. Hence soil is well suited for agriculture purpose with respect to EC.
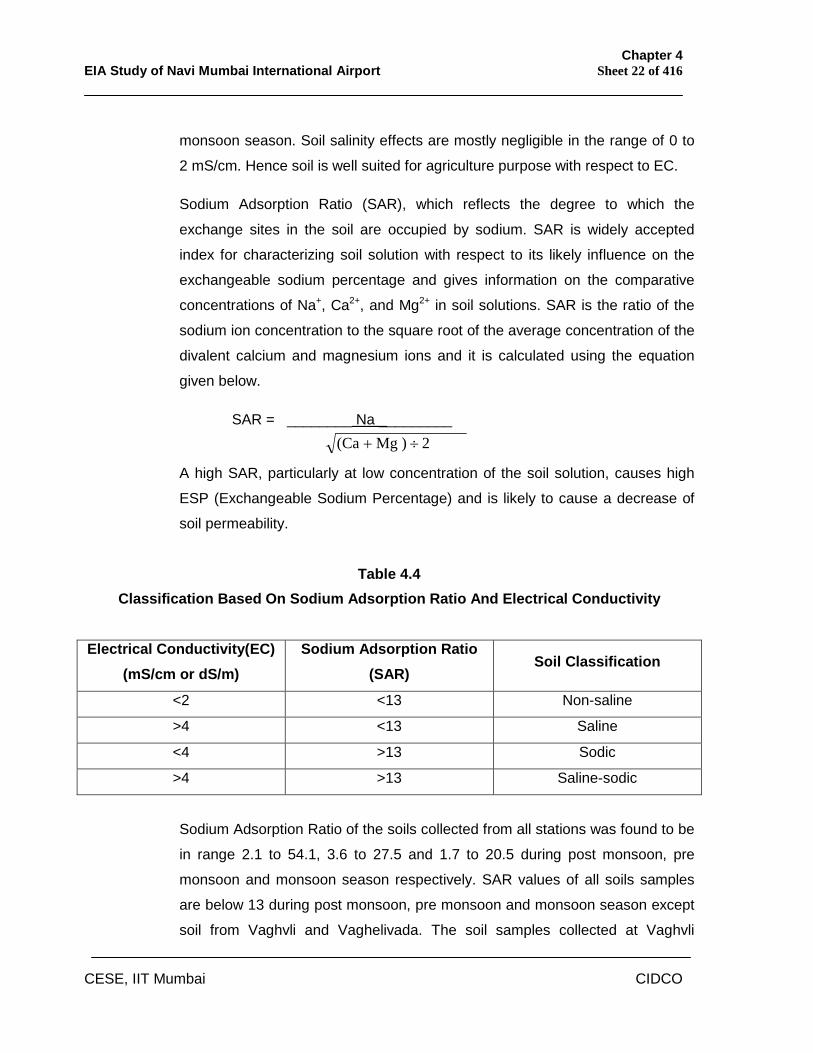
Sodium Adsorption Ratio (SAR), which reflects the degree to which the
exchange sites in the soil are occupied by sodium. SAR is widely accepted
index for characterizing soil solution with respect to its likely influence on the
exchangeable sodium percentage and gives information on the comparative
concentrations of Na+, Ca2+, and Mg2+ in soil solutions. SAR is the ratio of the
sodium ion concentration to the square root of the average concentration of the
divalent calcium and magnesium ions and it is calculated using the equation
given below.
SAR = ________ Na _________ 2 ) Mg (Ca
A high SAR, particularly at low concentration of the soil solution, causes high
ESP (Exchangeable Sodium Percentage) and is likely to cause a decrease of
soil permeability.
Table 4.4 Classification Based On Sodium Adsorption Ratio And Electrical Conductivity
Electrical Conductivity(EC) (mS/cm or dS/m)
Sodium Adsorption Ratio (SAR)
Soil Classification
<2 <13 Non-saline
>4 <13 Saline
<4 >13 Sodic
>4 >13 Saline-sodic
Sodium Adsorption Ratio of the soils collected from all stations was found to be
in range 2.1 to 54.1, 3.6 to 27.5 and 1.7 to 20.5 during post monsoon, pre
monsoon and monsoon season respectively. SAR values of all soils samples
are below 13 during post monsoon, pre monsoon and monsoon season except
soil from Vaghvli and Vaghelivada. The soil samples collected at Vaghvli
Chapter 4 EIA Study of Navi Mumbai International Airport Sheet 23 of 416
CESE, IIT Mumbai CIDCO
showed highest SAR value (54.1). Soil at Vaghvli is sodic soil. Soil at
Vaghelivada was observed to be sodic only during post monsoon season
whereas during pre monsoon and monsoon season it was observed to be non
saline. Sodic soils limit plant growth via poor water infiltration, increased
mechanical resistance to root growth and poor water availability in the soil
profile. Sodic soils are also more prone to erosion, increasing the risk of topsoil
loss and therefore the inevitable decline in soil fertility. Such sodic soil may
require the addition of gypsum (calcium sulfate) or other amendments (such as
elemental sulfur and/or organic matter) at high rates to displace sodium and
improve water infiltration. Electrical conductivity of soils collected from
remaining 8 stations were <2 mS/cm or dS/m and SAR value <13. Hence the
soil at project area is non-saline except soil from Vaghvli and Vaghelivada
which is sodic soil. Hence soil is well suited for agriculture purpose.
4.7.3 Cation Exchange Capacity (CEC)
Soil Cation Exchange Capacity (CEC) is the capacity of a soil for ion exchange
of positively charged cations viz. calcium (Ca2+), magnesium (Mg2+), and
potassium (K+), sodium (Na+) hydrogen (H+), aluminum (Al3+), iron (Fe2+),
manganese (Mn2+), zinc (Zn2+) and copper (Cu2+) between the soil and the soil
solution at a specified pH. CEC is highly dependent upon soil texture and
organic matter content. The primary factor determining CEC is the clay and
organic matter content of the soil which holds positively-charged cations.
Hence, soil with high quantities of clay and organic matter has higher CEC. The
relationship between clay content (% by weight) and CEC can be highly
variable because different clay minerals have very different CEC values. Higher
the CEC value, richer will be the soil with respect to nutrients. The CEC of a
soil is a good indicator of the nutrient holding and buffer capacity of the soil and
it is used as a measure of fertility and nutrient retention capacity. The CEC is
important because it provides a reservoir of nutrients to replenish those
removed from the soil water by plant uptake as well as due to excess rainfall or
irrigation water.
Chapter 4 EIA Study of Navi Mumbai International Airport Sheet 24 of 416
CESE, IIT Mumbai CIDCO
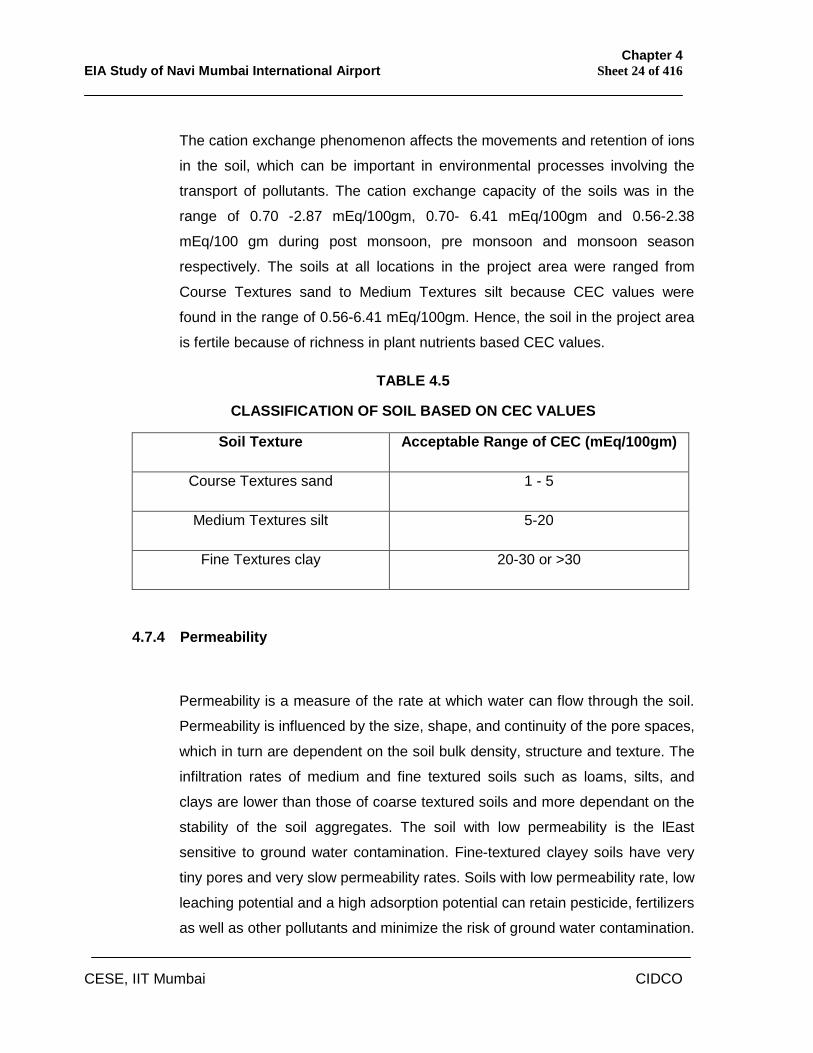
The cation exchange phenomenon affects the movements and retention of ions
in the soil, which can be important in environmental processes involving the
transport of pollutants. The cation exchange capacity of the soils was in the
range of 0.70 -2.87 mEq/100gm, 0.70- 6.41 mEq/100gm and 0.56-2.38
mEq/100 gm during post monsoon, pre monsoon and monsoon season
respectively. The soils at all locations in the project area were ranged from
Course Textures sand to Medium Textures silt because CEC values were
found in the range of 0.56-6.41 mEq/100gm. Hence, the soil in the project area
is fertile because of richness in plant nutrients based CEC values.
TABLE 4.5
CLASSIFICATION OF SOIL BASED ON CEC VALUES
Soil Texture Acceptable Range of CEC (mEq/100gm)
Course Textures sand 1 - 5
Medium Textures silt 5-20
Fine Textures clay 20-30 or >30
4.7.4 Permeability
Permeability is a measure of the rate at which water can flow through the soil.
Permeability is influenced by the size, shape, and continuity of the pore spaces,
which in turn are dependent on the soil bulk density, structure and texture. The
infiltration rates of medium and fine textured soils such as loams, silts, and
clays are lower than those of coarse textured soils and more dependant on the
stability of the soil aggregates. The soil with low permeability is the lEast
sensitive to ground water contamination. Fine-textured clayey soils have very
tiny pores and very slow permeability rates. Soils with low permeability rate, low
leaching potential and a high adsorption potential can retain pesticide, fertilizers
as well as other pollutants and minimize the risk of ground water contamination.
Chapter 4 EIA Study of Navi Mumbai International Airport Sheet 25 of 416
CESE, IIT Mumbai CIDCO
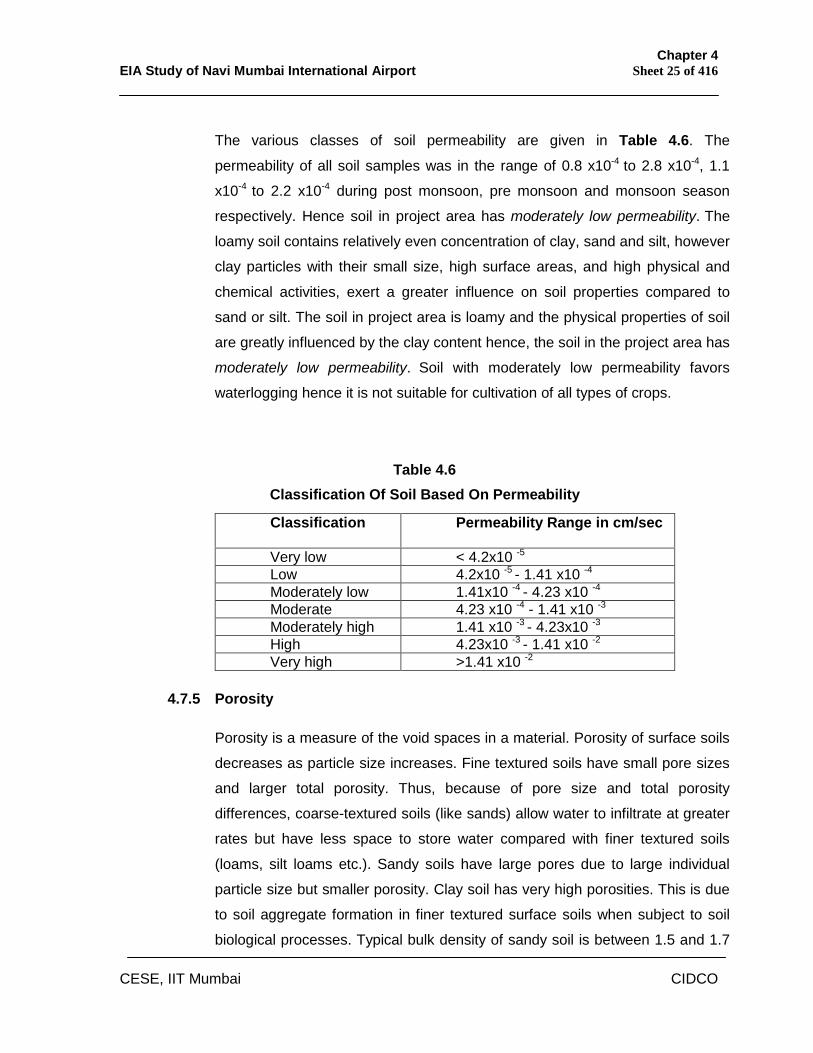
The various classes of soil permeability are given in Table 4.6. The
permeability of all soil samples was in the range of 0.8 x10⁻⁴ to 2.8 x10⁻⁴, 1.1
x10-4 to 2.2 x10⁻⁴ during post monsoon, pre monsoon and monsoon season
respectively. Hence soil in project area has moderately low permeability. The
loamy soil contains relatively even concentration of clay, sand and silt, however
clay particles with their small size, high surface areas, and high physical and
chemical activities, exert a greater influence on soil properties compared to
sand or silt. The soil in project area is loamy and the physical properties of soil
are greatly influenced by the clay content hence, the soil in the project area has
moderately low permeability. Soil with moderately low permeability favors
waterlogging hence it is not suitable for cultivation of all types of crops.
Table 4.6 Classification Of Soil Based On Permeability
4.7.5 Porosity
Porosity is a measure of the void spaces in a material. Porosity of surface soils
decreases as particle size increases. Fine textured soils have small pore sizes
and larger total porosity. Thus, because of pore size and total porosity
differences, coarse-textured soils (like sands) allow water to infiltrate at greater
rates but have less space to store water compared with finer textured soils
(loams, silt loams etc.). Sandy soils have large pores due to large individual
particle size but smaller porosity. Clay soil has very high porosities. This is due
to soil aggregate formation in finer textured surface soils when subject to soil
biological processes. Typical bulk density of sandy soil is between 1.5 and 1.7
Classification Permeability Range in cm/sec
Very low < 4.2x10 -5 Low 4.2x10 -5 - 1.41 x10 -4 Moderately low 1.41x10 -4 - 4.23 x10 -4 Moderate 4.23 x10 -4 - 1.41 x10 -3 Moderately high 1.41 x10 -3 - 4.23x10 -3 High 4.23x10 -3 - 1.41 x10 -2 Very high >1.41 x10 -2
Chapter 4 EIA Study of Navi Mumbai International Airport Sheet 26 of 416
CESE, IIT Mumbai CIDCO
g/cm³and porosity between 43% and 36%. Typical bulk density of clay soil is
between 1.1 and 1.3 g/cm³ and porosity between 58% and 51%. Soil should be
porous for water movement and aeration, and it should also retain water. The
porosity of soil collected from all locations in the project area was found to be in
the range 33% - 54%, 32%-56%, 36%- 54%. The soil in the project area is
loamy soil and the texture of all the soil samples was varied from loam, sandy
loam, clay loam, sandy clay loam, loamy sand, silt loam to clay. The soil in the
project area is loamy soil with fine texture indicated high porosity. Soil with high
porosity are generally more suitable for agriculture, since the high pore space
has a greater potential to store water and roots are able to grow more readily.
Hence, soil in the project area has high porosity and it is suitable for plant
growth.
4.7.6 Calcium, Magnesium and Potassium
Calcium plays a very important role in plant growth and nutrition, as well as in
cell wall deposition. Calcium helps to maintain chemical balance in the soil,
reduces soil salinity, reduces soil compaction, improves water penetration and
favours proliferation of beneficial microbes. Calcium content of soil collected
from all locations of the project area was in the range 87 ppm -257 ppm, 37-
174 ppm, 27.0-110 ppm . Magnesium (Mg) and Potassium (K) are essential
plant minerals. The Mg to K ratio should be greater than 2:1. High K content
frequently results in reduced uptake of Mg by plants which may result in
imbalance of plant nutrient. Magnesium content of soil collected from all
locations of the project area was in the range 21 ppm -145 ppm, 26-90 ppm,
41.2-110 ppm. Potassium is an essential plant nutrient and it also enhances the
ability of the plant to withstand pest attacks. Potassium content of soil collected
from all stations in the project area was in the range 5 ppm - 87 ppm, 9-109
ppm, 6.6-62.3 ppm. The ratio of Mg to K is greater than 2:1 at all soil monitoring
stations during post monsoon and monsoon season except at Vaghvli. During
pre monsoon season the ratio of Mg to K was less than 2:1 at Targhar,
Kombad bhuge, Vaghvli, Ulve, Vaghelivada. Hence, soil at all monitoring
locations is suitable for plant growth with respect to minerals.
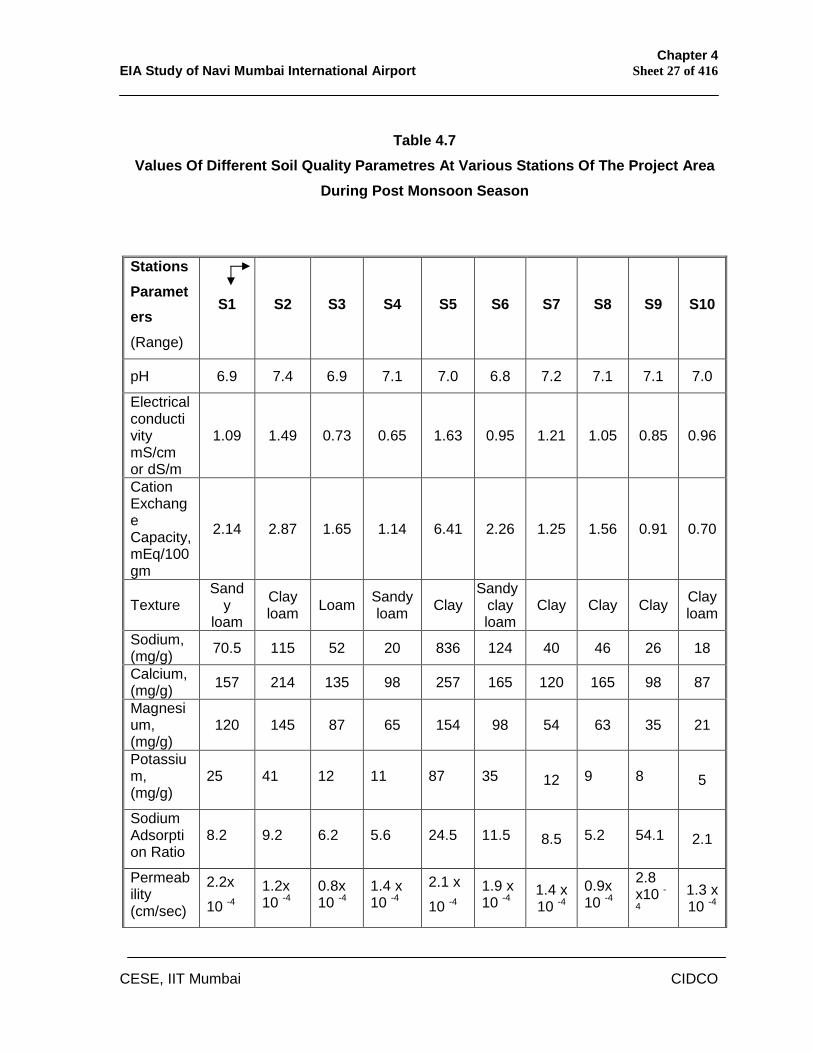
Chapter 4 EIA Study of Navi Mumbai International Airport Sheet 27 of 416
CESE, IIT Mumbai CIDCO
Table 4.7 Values Of Different Soil Quality Parametres At Various Stations Of The Project Area
During Post Monsoon Season
Stations Parameters (Range)
S1 S2 S3 S4 S5 S6 S7 S8 S9 S10
pH 6.9 7.4 6.9 7.1 7.0 6.8 7.2 7.1 7.1 7.0
Electrical conductivity mS/cm or dS/m
1.09 1.49 0.73 0.65 1.63 0.95 1.21 1.05 0.85 0.96
Cation Exchange Capacity, mEq/100gm
2.14 2.87 1.65 1.14 6.41 2.26 1.25 1.56 0.91 0.70
Texture Sand
y loam
Clay loam Loam Sandy
loam Clay Sandy
clay loam
Clay Clay Clay Clay loam
Sodium, (mg/g) 70.5 115 52 20 836 124 40 46 26 18
Calcium, (mg/g) 157 214 135 98 257 165 120 165 98 87
Magnesium, (mg/g)
120 145 87 65 154 98 54 63 35 21
Potassium, (mg/g)
25 41 12 11 87 35 12 9 8 5
Sodium Adsorption Ratio
8.2 9.2 6.2 5.6 24.5 11.5 8.5 5.2 54.1 2.1
Permeability (cm/sec)
2.2x 10 -4
1.2x 10 -4
0.8x 10 -4
1.4 x 10 -4
2.1 x 10 -4
1.9 x 10 -4
1.4 x 10 -4
0.9x 10 -4
2.8 x10 -4
1.3 x 10 -4
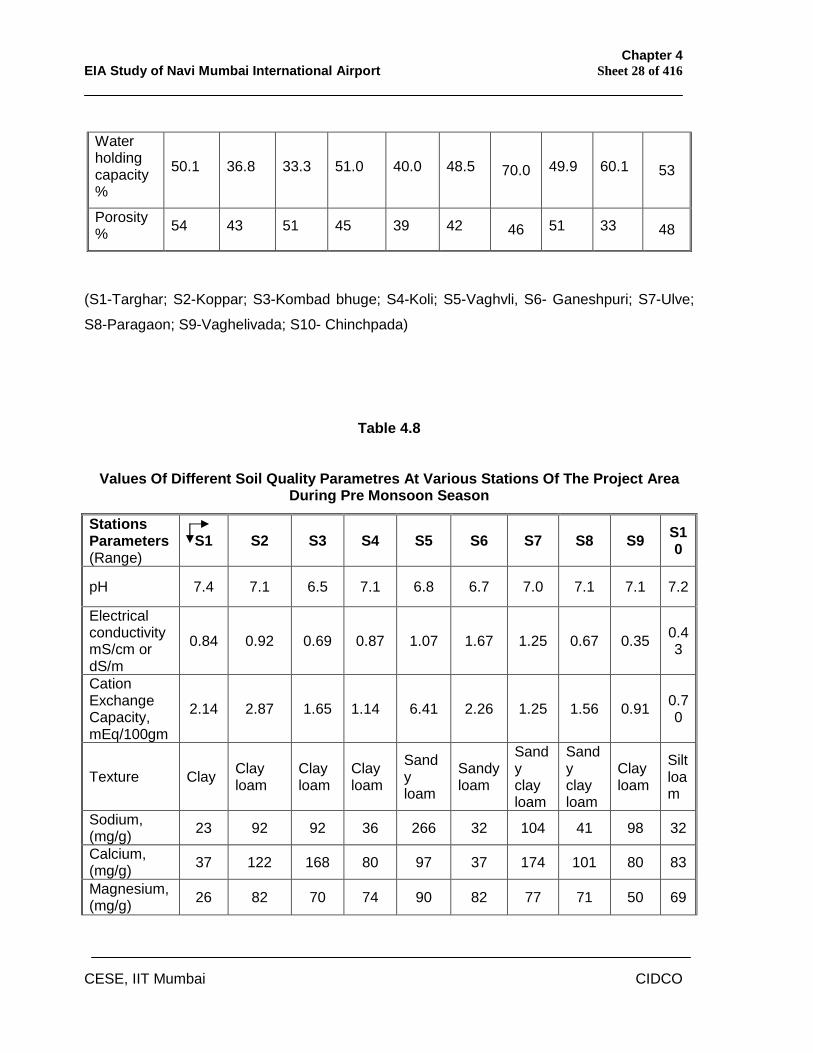
Chapter 4 EIA Study of Navi Mumbai International Airport Sheet 28 of 416
CESE, IIT Mumbai CIDCO
(S1-Targhar; S2-Koppar; S3-Kombad bhuge; S4-Koli; S5-Vaghvli, S6- Ganeshpuri; S7-Ulve;
S8-Paragaon; S9-Vaghelivada; S10- Chinchpada)
Table 4.8
Values Of Different Soil Quality Parametres At Various Stations Of The Project Area During Pre Monsoon Season
Water holding capacity %
50.1 36.8 33.3 51.0 40.0 48.5 70.0 49.9 60.1 53
Porosity % 54 43 51 45 39 42 46 51 33 48
Stations Parameters (Range)
S1 S2 S3 S4 S5 S6 S7 S8 S9 S10
pH 7.4 7.1 6.5 7.1 6.8 6.7 7.0 7.1 7.1 7.2
Electrical conductivity mS/cm or dS/m
0.84 0.92 0.69 0.87 1.07 1.67 1.25 0.67 0.35 0.43
Cation Exchange Capacity, mEq/100gm
2.14 2.87 1.65 1.14 6.41 2.26 1.25 1.56 0.91 0.70
Texture Clay Clay loam
Clay loam
Clay loam
Sandy loam
Sandy loam
Sandy clay loam
Sandy clay loam
Clay loam
Silt loam
Sodium, (mg/g) 23 92 92 36 266 32 104 41 98 32
Calcium, (mg/g) 37 122 168 80 97 37 174 101 80 83
Magnesium, (mg/g) 26 82 70 74 90 82 77 71 50 69
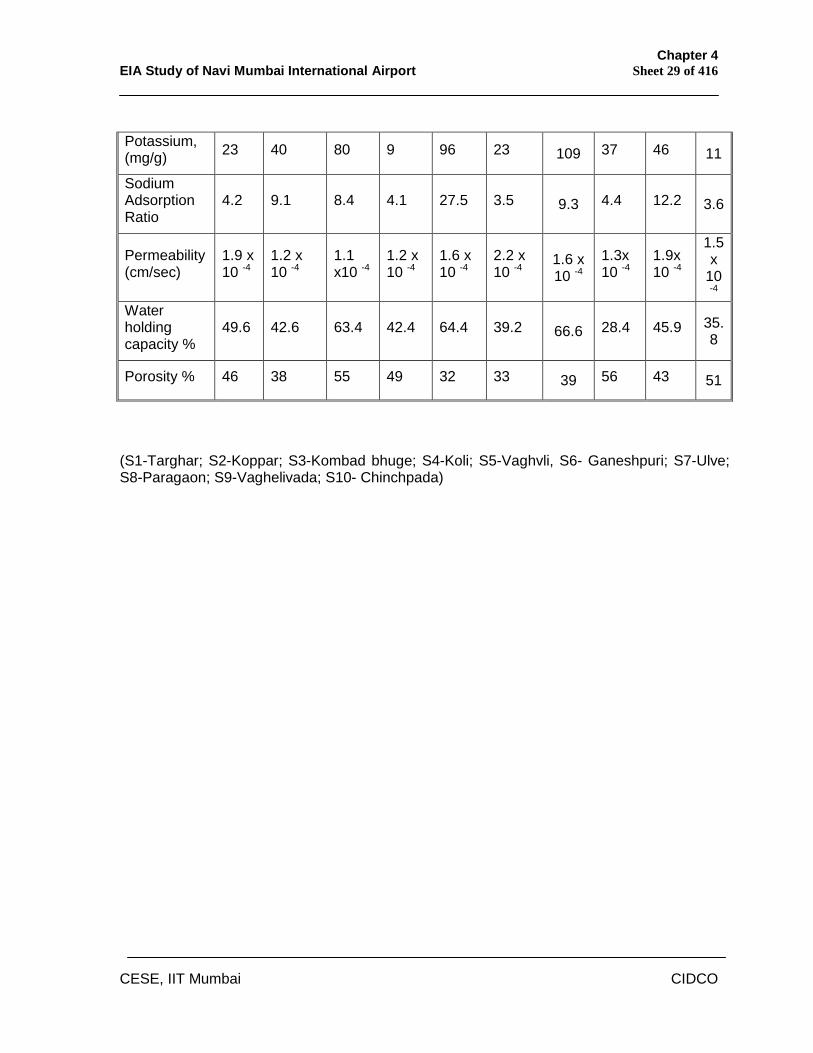
Chapter 4 EIA Study of Navi Mumbai International Airport Sheet 29 of 416
CESE, IIT Mumbai CIDCO
(S1-Targhar; S2-Koppar; S3-Kombad bhuge; S4-Koli; S5-Vaghvli, S6- Ganeshpuri; S7-Ulve; S8-Paragaon; S9-Vaghelivada; S10- Chinchpada)
Potassium, (mg/g) 23 40 80 9 96 23 109 37 46 11
Sodium Adsorption Ratio
4.2 9.1 8.4 4.1 27.5 3.5 9.3 4.4 12.2 3.6
Permeability (cm/sec)
1.9 x 10 -4
1.2 x 10 -4
1.1 x10 -4
1.2 x 10 -4
1.6 x 10 -4
2.2 x 10 -4
1.6 x 10 -4
1.3x 10 -4
1.9x 10 -4
1.5 x
10 -4
Water holding capacity %
49.6 42.6 63.4 42.4 64.4 39.2 66.6 28.4 45.9 35.8
Porosity % 46 38 55 49 32 33 39 56 43 51
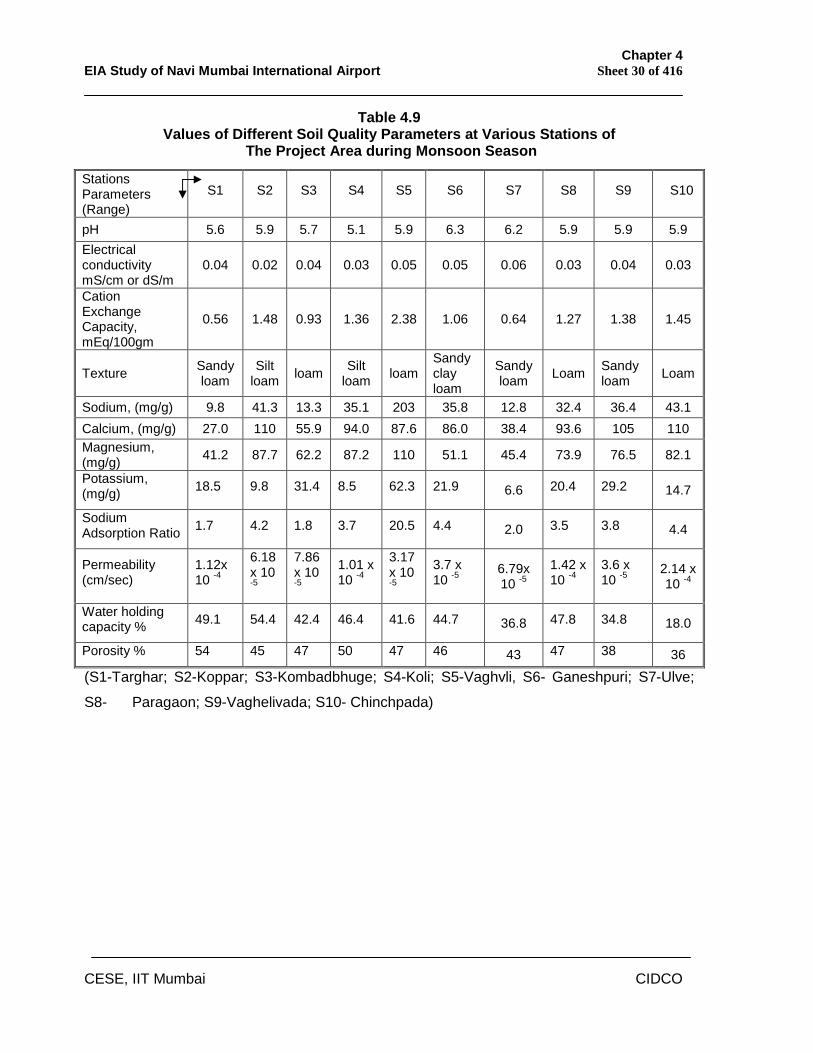
Chapter 4 EIA Study of Navi Mumbai International Airport Sheet 30 of 416
CESE, IIT Mumbai CIDCO
Table 4.9 Values of Different Soil Quality Parameters at Various Stations of
The Project Area during Monsoon Season
(S1-Targhar; S2-Koppar; S3-Kombadbhuge; S4-Koli; S5-Vaghvli, S6- Ganeshpuri; S7-Ulve;
S8- Paragaon; S9-Vaghelivada; S10- Chinchpada)
Stations Parameters (Range)
S1 S2 S3 S4 S5 S6 S7 S8 S9 S10
pH 5.6 5.9 5.7 5.1 5.9 6.3 6.2 5.9 5.9 5.9 Electrical conductivity mS/cm or dS/m
0.04 0.02 0.04 0.03 0.05 0.05 0.06 0.03 0.04 0.03
Cation Exchange Capacity, mEq/100gm
0.56 1.48 0.93 1.36 2.38 1.06 0.64 1.27 1.38 1.45
Texture Sandy loam
Silt loam loam Silt
loam loam Sandy clay loam
Sandy loam Loam Sandy
loam Loam
Sodium, (mg/g) 9.8 41.3 13.3 35.1 203 35.8 12.8 32.4 36.4 43.1 Calcium, (mg/g) 27.0 110 55.9 94.0 87.6 86.0 38.4 93.6 105 110 Magnesium, (mg/g) 41.2 87.7 62.2 87.2 110 51.1 45.4 73.9 76.5 82.1
Potassium, (mg/g) 18.5 9.8 31.4 8.5 62.3 21.9 6.6 20.4 29.2 14.7
Sodium Adsorption Ratio 1.7 4.2 1.8 3.7 20.5 4.4 2.0 3.5 3.8 4.4
Permeability (cm/sec)
1.12x 10 -4
6.18x 10 -5
7.86 x 10 -5
1.01 x 10 -4
3.17 x 10 -5
3.7 x 10 -5
6.79x 10 -5
1.42 x 10 -4
3.6 x 10 -5
2.14 x 10 -4
Water holding capacity % 49.1 54.4 42.4 46.4 41.6 44.7 36.8 47.8 34.8 18.0
Porosity % 54 45 47 50 47 46 43 47 38 36
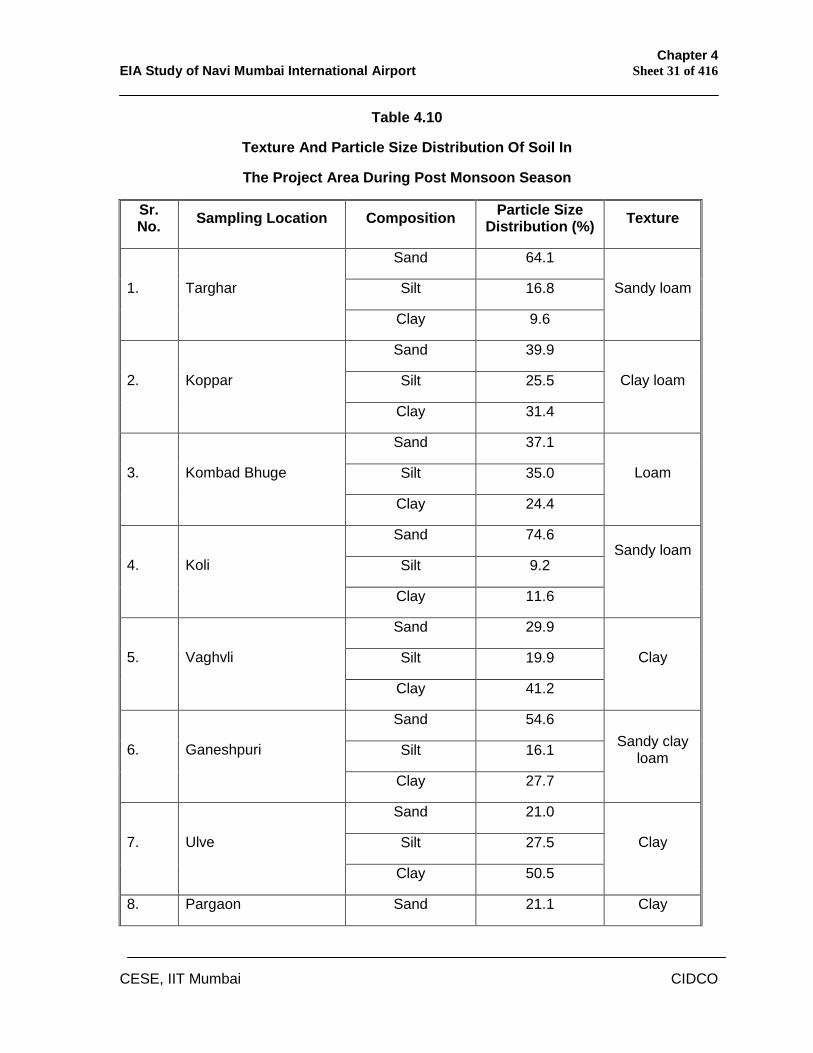
Chapter 4 EIA Study of Navi Mumbai International Airport Sheet 31 of 416
CESE, IIT Mumbai CIDCO
Table 4.10
Texture And Particle Size Distribution Of Soil In
The Project Area During Post Monsoon Season
Sr. No. Sampling Location Composition Particle Size
Distribution (%) Texture
Sand 64.1
Silt 16.8 1. Targhar
Clay 9.6
Sandy loam
Sand 39.9
Silt 25.5 2. Koppar
Clay 31.4
Clay loam
Sand 37.1
Silt 35.0 3. Kombad Bhuge
Clay 24.4
Loam
Sand 74.6
Silt 9.2 4. Koli
Clay 11.6
Sandy loam
Sand 29.9
Silt 19.9 5. Vaghvli
Clay 41.2
Clay
Sand 54.6
Silt 16.1 6. Ganeshpuri
Clay 27.7
Sandy clay loam
Sand 21.0
Silt 27.5 7. Ulve
Clay 50.5
Clay
8. Pargaon Sand 21.1 Clay
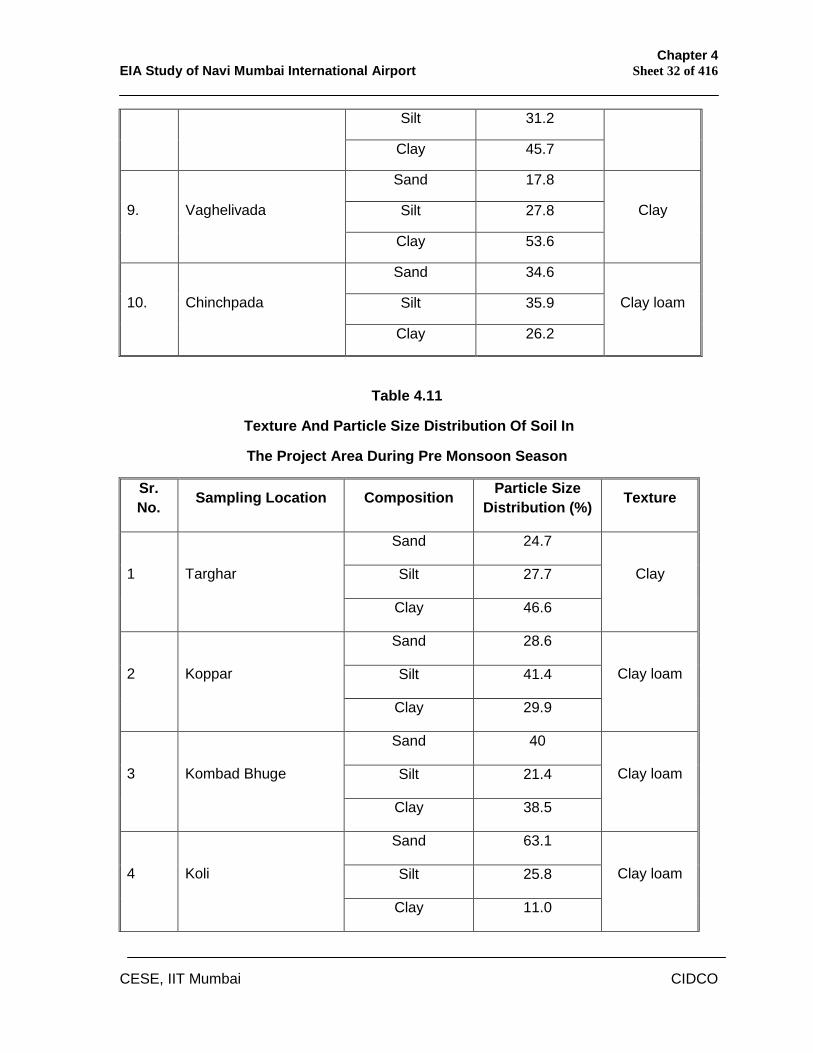
Chapter 4 EIA Study of Navi Mumbai International Airport Sheet 32 of 416
CESE, IIT Mumbai CIDCO
Silt 31.2
Clay 45.7
Sand 17.8
Silt 27.8 9. Vaghelivada
Clay 53.6
Clay
Sand 34.6
Silt 35.9 10. Chinchpada
Clay 26.2
Clay loam
Table 4.11
Texture And Particle Size Distribution Of Soil In
The Project Area During Pre Monsoon Season
Sr. No. Sampling Location Composition Particle Size
Distribution (%) Texture
Sand 24.7
Silt 27.7 1 Targhar
Clay 46.6
Clay
Sand 28.6
Silt 41.4 2 Koppar
Clay 29.9
Clay loam
Sand 40
Silt 21.4 3 Kombad Bhuge
Clay 38.5
Clay loam
Sand 63.1
Silt 25.8 4 Koli
Clay 11.0
Clay loam
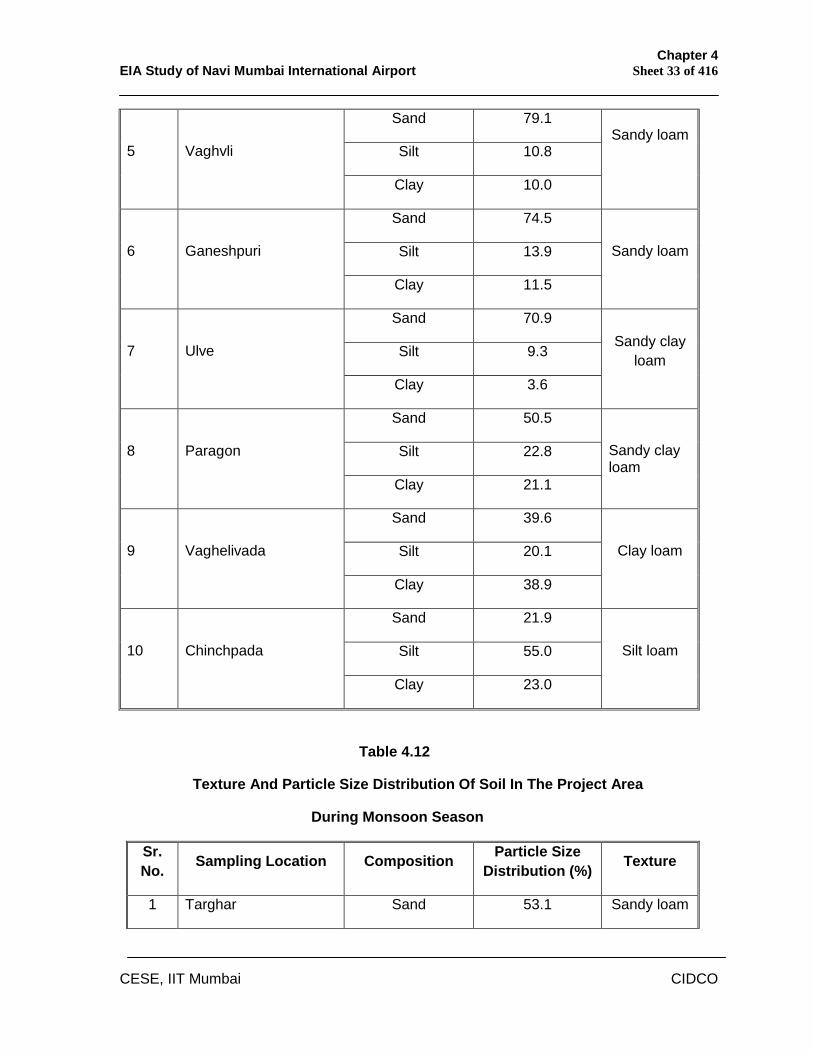
Chapter 4 EIA Study of Navi Mumbai International Airport Sheet 33 of 416
CESE, IIT Mumbai CIDCO
Sand 79.1
Silt 10.8 5 Vaghvli
Clay 10.0
Sandy loam
Sand 74.5
Silt 13.9 6 Ganeshpuri
Clay 11.5
Sandy loam
Sand 70.9
Silt 9.3 7 Ulve
Clay 3.6
Sandy clay loam
Sand 50.5
Silt 22.8 8 Paragon
Clay 21.1
Sandy clay loam
Sand 39.6
Silt 20.1 9 Vaghelivada
Clay 38.9
Clay loam
Sand 21.9
Silt 55.0 10 Chinchpada
Clay 23.0
Silt loam
Table 4.12
Texture And Particle Size Distribution Of Soil In The Project Area
During Monsoon Season
Sr. No. Sampling Location Composition Particle Size
Distribution (%) Texture
1 Targhar Sand 53.1 Sandy loam
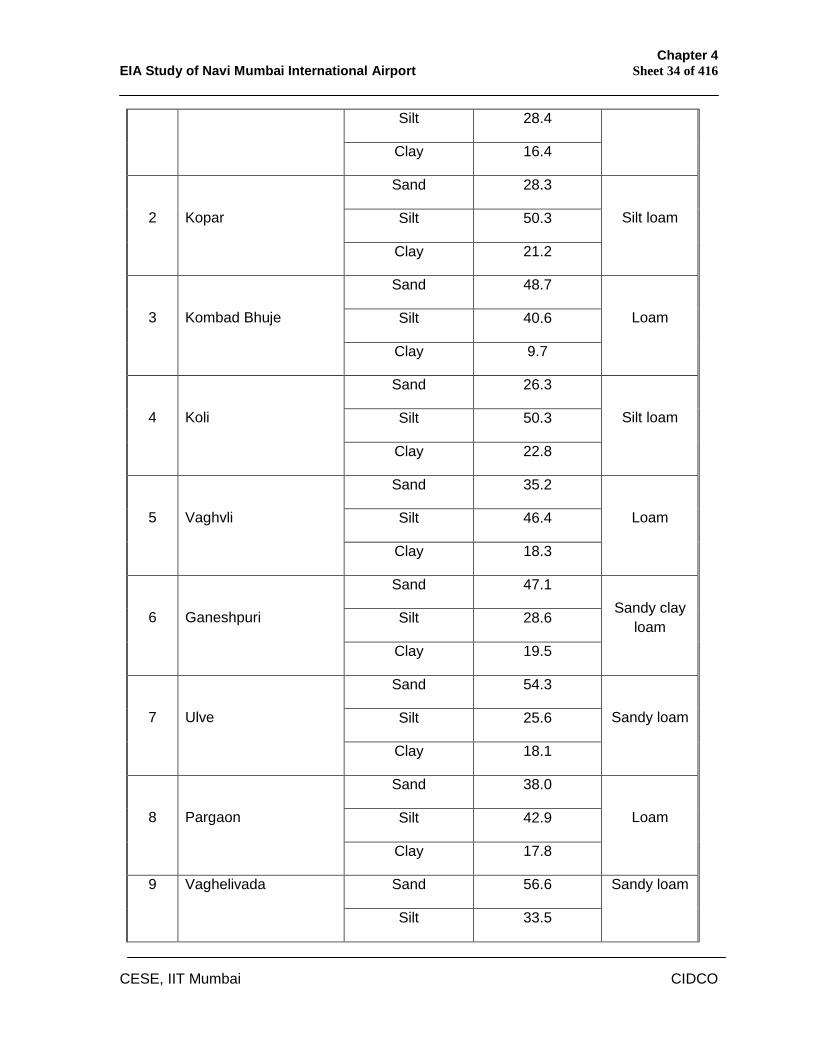
Chapter 4 EIA Study of Navi Mumbai International Airport Sheet 34 of 416
CESE, IIT Mumbai CIDCO
Silt 28.4
Clay 16.4
Sand 28.3
Silt 50.3 2 Kopar
Clay 21.2
Silt loam
Sand 48.7
Silt 40.6 3 Kombad Bhuje
Clay 9.7
Loam
Sand 26.3
Silt 50.3 4 Koli
Clay 22.8
Silt loam
Sand 35.2
Silt 46.4 5 Vaghvli
Clay 18.3
Loam
Sand 47.1
Silt 28.6 6 Ganeshpuri
Clay 19.5
Sandy clay loam
Sand 54.3
Silt 25.6 7 Ulve
Clay 18.1
Sandy loam
Sand 38.0
Silt 42.9 8 Pargaon
Clay 17.8
Loam
Sand 56.6 9 Vaghelivada
Silt 33.5
Sandy loam
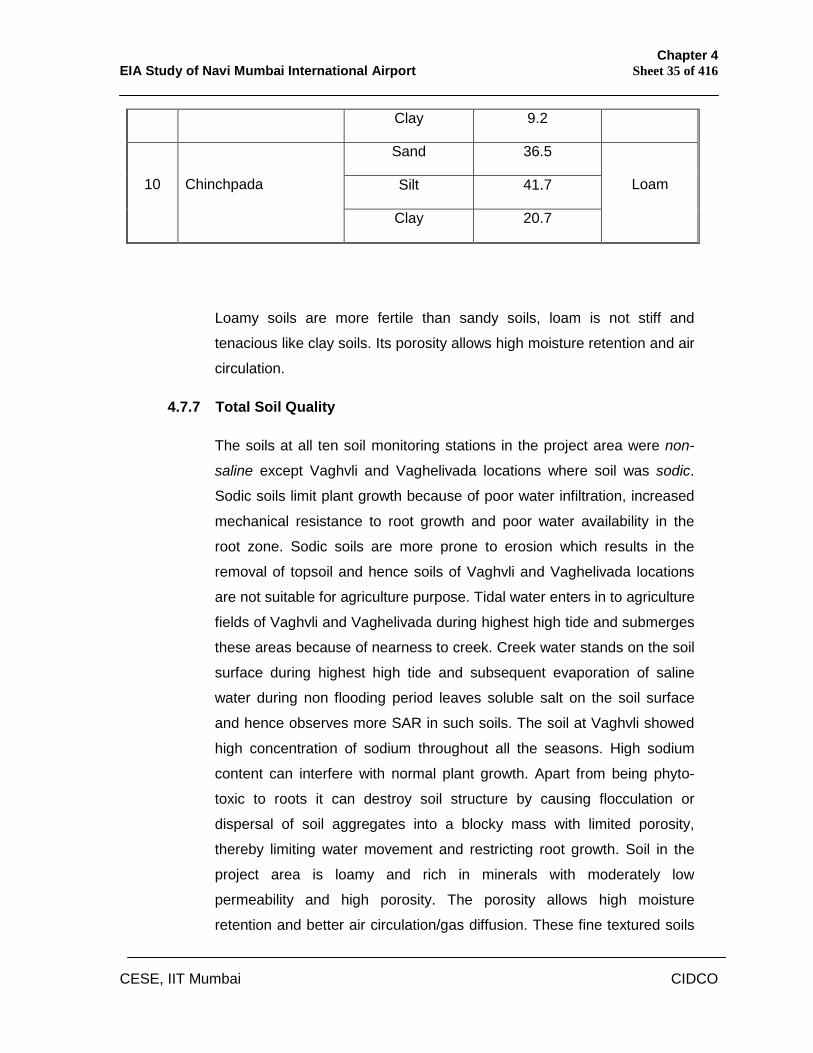
Chapter 4 EIA Study of Navi Mumbai International Airport Sheet 35 of 416
CESE, IIT Mumbai CIDCO
Clay 9.2
Sand 36.5
Silt 41.7 10 Chinchpada
Clay 20.7
Loam
Loamy soils are more fertile than sandy soils, loam is not stiff and
tenacious like clay soils. Its porosity allows high moisture retention and air
circulation.
4.7.7 Total Soil Quality
The soils at all ten soil monitoring stations in the project area were non-
saline except Vaghvli and Vaghelivada locations where soil was sodic.
Sodic soils limit plant growth because of poor water infiltration, increased
mechanical resistance to root growth and poor water availability in the
root zone. Sodic soils are more prone to erosion which results in the
removal of topsoil and hence soils of Vaghvli and Vaghelivada locations
are not suitable for agriculture purpose. Tidal water enters in to agriculture
fields of Vaghvli and Vaghelivada during highest high tide and submerges
these areas because of nearness to creek. Creek water stands on the soil
surface during highest high tide and subsequent evaporation of saline
water during non flooding period leaves soluble salt on the soil surface
and hence observes more SAR in such soils. The soil at Vaghvli showed
high concentration of sodium throughout all the seasons. High sodium
content can interfere with normal plant growth. Apart from being phyto-
toxic to roots it can destroy soil structure by causing flocculation or
dispersal of soil aggregates into a blocky mass with limited porosity,
thereby limiting water movement and restricting root growth. Soil in the
project area is loamy and rich in minerals with moderately low
permeability and high porosity. The porosity allows high moisture
retention and better air circulation/gas diffusion. These fine textured soils
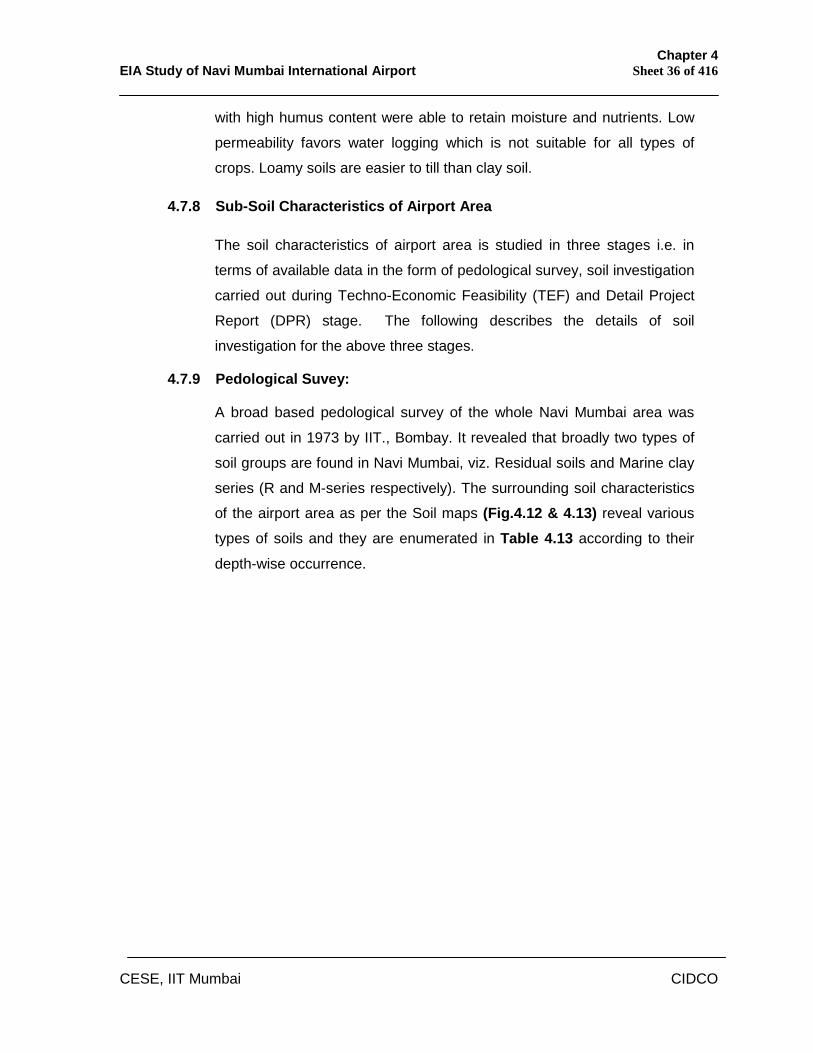
Chapter 4 EIA Study of Navi Mumbai International Airport Sheet 36 of 416
CESE, IIT Mumbai CIDCO
with high humus content were able to retain moisture and nutrients. Low
permeability favors water logging which is not suitable for all types of
crops. Loamy soils are easier to till than clay soil.
4.7.8 Sub-Soil Characteristics of Airport Area
The soil characteristics of airport area is studied in three stages i.e. in
terms of available data in the form of pedological survey, soil investigation
carried out during Techno-Economic Feasibility (TEF) and Detail Project
Report (DPR) stage. The following describes the details of soil
investigation for the above three stages.
4.7.9 Pedological Suvey:
A broad based pedological survey of the whole Navi Mumbai area was
carried out in 1973 by IIT., Bombay. It revealed that broadly two types of
soil groups are found in Navi Mumbai, viz. Residual soils and Marine clay
series (R and M-series respectively). The surrounding soil characteristics
of the airport area as per the Soil maps (Fig.4.12 & 4.13) reveal various
types of soils and they are enumerated in Table 4.13 according to their
depth-wise occurrence.
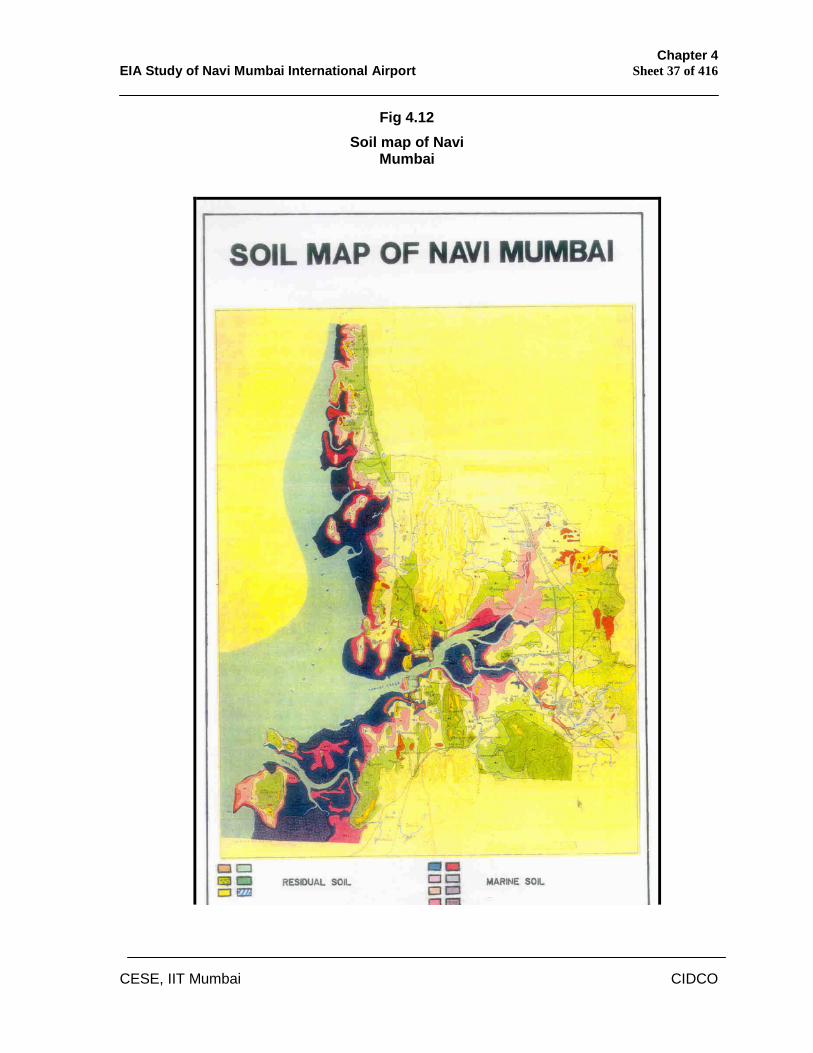
Chapter 4 EIA Study of Navi Mumbai International Airport Sheet 37 of 416
CESE, IIT Mumbai CIDCO
Fig 4.12 Soil map of Navi
Mumbai
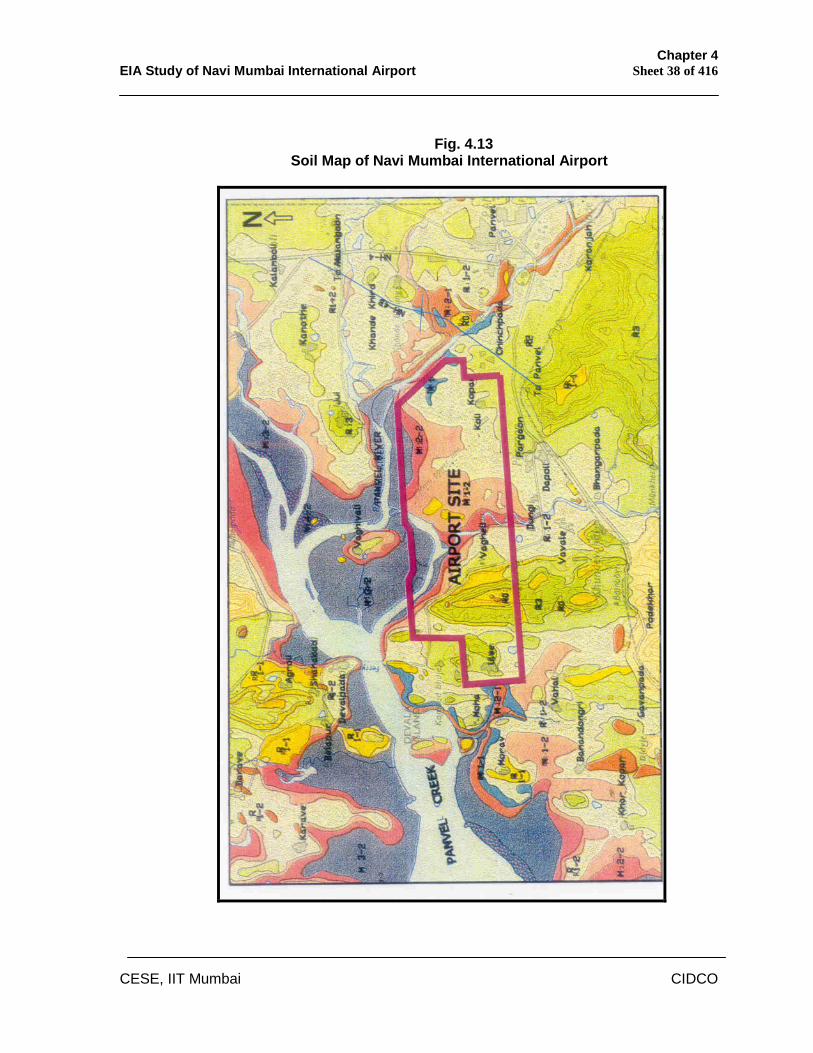
Chapter 4 EIA Study of Navi Mumbai International Airport Sheet 38 of 416
CESE, IIT Mumbai CIDCO
Fig. 4.13 Soil Map of Navi Mumbai International Airport
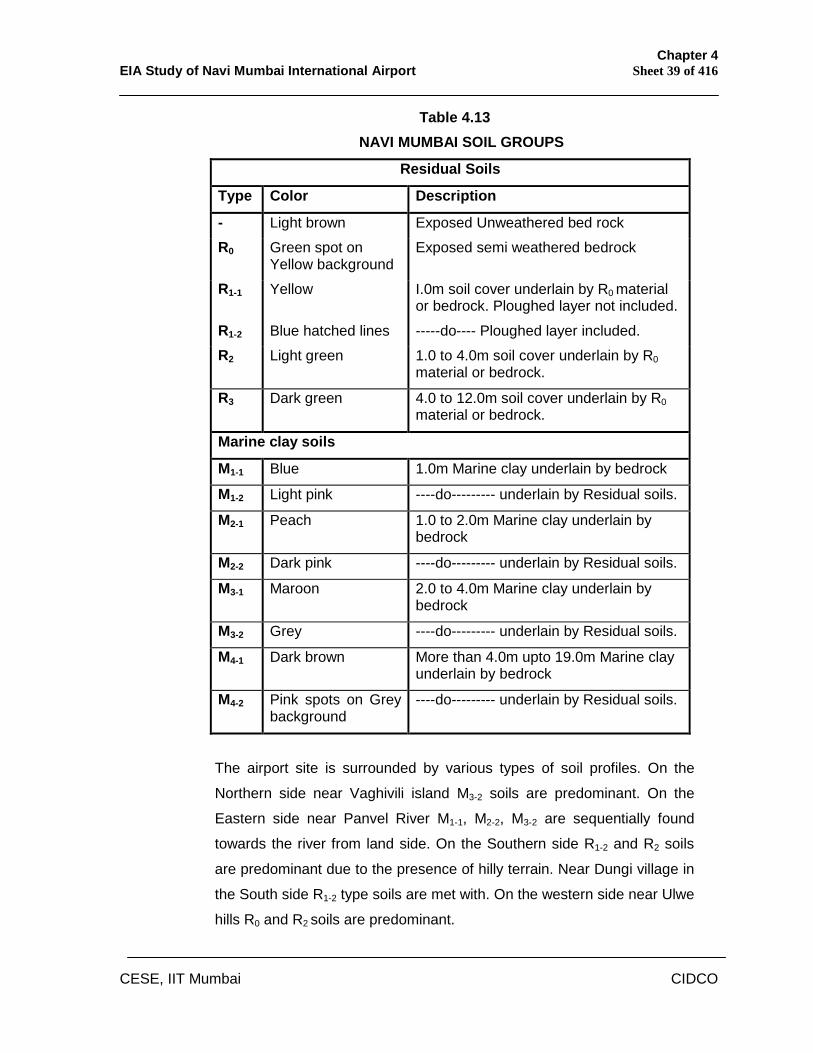
Chapter 4 EIA Study of Navi Mumbai International Airport Sheet 39 of 416
CESE, IIT Mumbai CIDCO
Table 4.13 NAVI MUMBAI SOIL GROUPS
Residual Soils
Type Color Description
- Light brown Exposed Unweathered bed rock
R0 Green spot on Yellow background
Exposed semi weathered bedrock
R1-1 Yellow I.0m soil cover underlain by R0 material or bedrock. Ploughed layer not included.
R1-2 Blue hatched lines -----do---- Ploughed layer included.
R2 Light green 1.0 to 4.0m soil cover underlain by R0 material or bedrock.
R3 Dark green 4.0 to 12.0m soil cover underlain by R0 material or bedrock.
Marine clay soils
M1-1 Blue 1.0m Marine clay underlain by bedrock
M1-2 Light pink ----do--------- underlain by Residual soils.
M2-1 Peach 1.0 to 2.0m Marine clay underlain by bedrock
M2-2 Dark pink ----do--------- underlain by Residual soils.
M3-1 Maroon 2.0 to 4.0m Marine clay underlain by bedrock
M3-2 Grey ----do--------- underlain by Residual soils.
M4-1 Dark brown More than 4.0m upto 19.0m Marine clay underlain by bedrock
M4-2 Pink spots on Grey background
----do--------- underlain by Residual soils.
The airport site is surrounded by various types of soil profiles. On the
Northern side near Vaghivili island M3-2 soils are predominant. On the
Eastern side near Panvel River M1-1, M2-2, M3-2 are sequentially found
towards the river from land side. On the Southern side R1-2 and R2 soils
are predominant due to the presence of hilly terrain. Near Dungi village in
the South side R1-2 type soils are met with. On the western side near Ulwe
hills R0 and R2 soils are predominant.
Chapter 4 EIA Study of Navi Mumbai International Airport Sheet 40 of 416
CESE, IIT Mumbai CIDCO
4.7.10 Sub-Soil Investigation during TEF Stage:
In order to understand the sub-soil behavior and assess the soil
properties Sub-soil investigation work has been carried out in the field as
well as in the laboratory. Details of the bore logs are enclosed as
Annexure 1 in Chapter-9 Additional Studies, separately.The
exploratory program was restricted to drilling borehole upto the firm
strata, observing in field, conducting field tests and collecting samples
and testing the same in laboratory.
i) Field Operations
The field activity is divided into three phases viz. (a) drilling boreholes (b)
field-testing and (c) sampling. The field activity is concentrated mainly in
the area where most of the critical airport activities are planned to be
located like runway, taxiway, apron and terminal buildings.
a. Drilling Boreholes In total, drilling of 20 No.s of bores were carried out to represent the
airport area. Annexure-I gives the details of the individual borehole logs. A
grid of 300m x 400m was maintained between two boreholes. A
map (Fig. 4.14) showing the disposition of the bore locations which has
been done in accordance with IS 1892: 1972 is presented in the report for
reference. Drilling work of overburden soil i.e in soft strata was carried
out with (Calyx type) rotary drilling machine and water flush method. In
hard strata like bedrock, rotary core drilling using NX size diamond bits
attached to core barrel to facilitate extraction of about 54mm diameter
core samples was adopted.
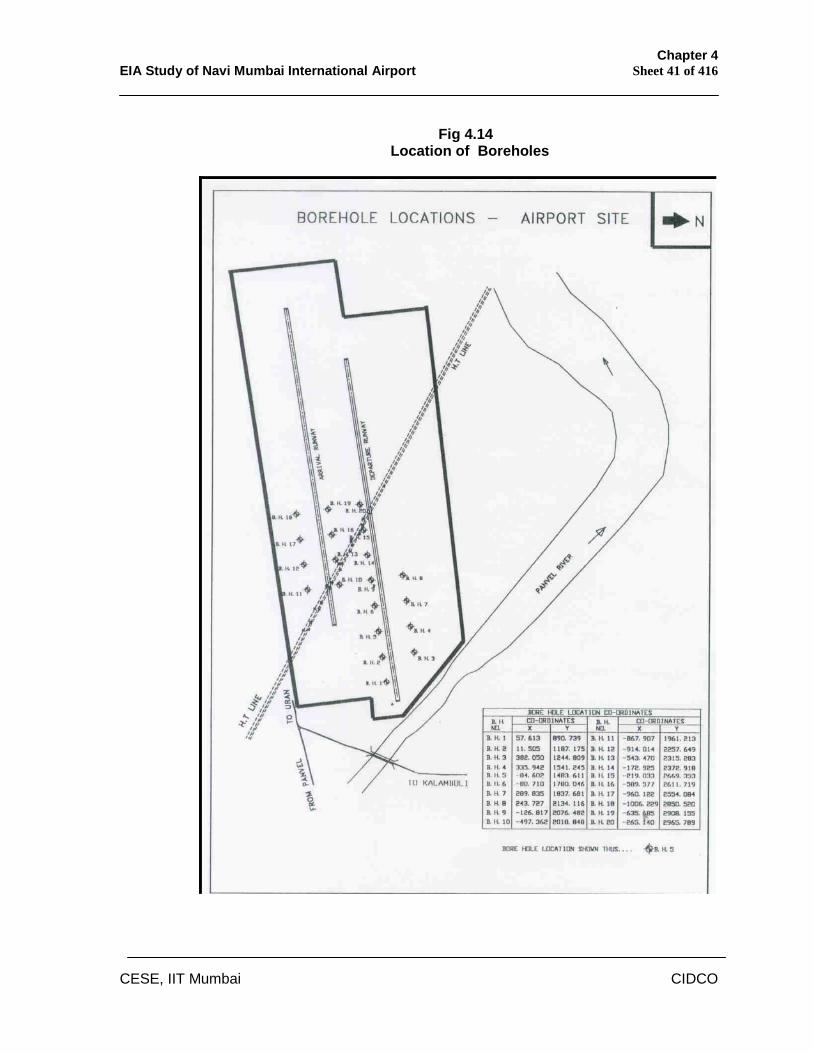
Chapter 4 EIA Study of Navi Mumbai International Airport Sheet 41 of 416
CESE, IIT Mumbai CIDCO
Fig 4.14 Location of Boreholes
Chapter 4 EIA Study of Navi Mumbai International Airport Sheet 42 of 416
CESE, IIT Mumbai CIDCO
b. Field Tests S.P.T. tests were conducted at different depths in bore in accordance with
IS 2131:1981. The number of blows required for each 15cm penetration
upto a total depth of 60cm was recorded. Number of blows required to
penetrate 15cm to 45cm (i.e. middle 30cm depth) was recorded as S.P.T.
value (N).
Field vane shear tests were not carried out owing to the area under
investigation comprising of very less thickness of clay layer. Owing to
absence of the precise location of utility structures like underground water
tank, sewage treatment plant and other storage tanks, the field
permeability tests were not carried out.
c. Sampling Undisturbed Soil samples (UDS) from inside the bores were extracted
using 100mm diameter thin walled M.S.sampling tubes 45cm long in
accordance with IS 2132:1986. The samples were labeled, protected at
the ends with HDPE circular thin disks and cotton waste and then waxed
in the field as per the standard practice. The UDS were then transported
to the laboratory for further testing. In all 16 numbers of UDS were
collected.
Disturbed samples (DS) were obtained from the split-spoon sampler of
the SPT apparatus. These soil samples were collected and preserved in
polythene bags, properly tagged for identification and sent to the
laboratory for further testing.
Ground water level was observed and recorded after 24 hours of
completion of drill of each borehole and ground water samples were
Chapter 4 EIA Study of Navi Mumbai International Airport Sheet 43 of 416
CESE, IIT Mumbai CIDCO
collected in plastic containers. The samples were then sent for chemical
analysis in the laboratory.
ii) Laboratory Operations
The dry samples were prepared for various tests in accordance with IS
2720(Part-1): 1983. The following laboratory tests were conducted in
order to ascertain the soil properties: -
a. Natural Moisture Content ()
This test is essential to determine the in-situ moisture content. This test
enables the geotechnical engineer to determine the group to which the
soil belongs and determine the weight-volume relationship. Besides the
consistency of the soil can be predicted along with the approximate
strength. The tests are conducted in accordance with IS 2720 (Part-2):
1984. In all 16 number of tests are conducted.
b. Bulk and Dry density (b and d) This test is performed to determine the in-situ density (bulk density) and
subsequently with the help of natural moisture content and the dry
density. This enables to classify the soil and compute the overburden
pressure at different levels. The tests are conducted in accordance with
IS 2720 (Part-29): 1984. In all 21 number of tests are conducted.
c. Atterberg’s Limits
This test is performed to determine the plasticity characters of the sub-soil
stratum. Initially the Liquid limit (LL) and the Plastic limit (PL) are found in
the laboratory in accordance with IS-2720 (Part-5): 1970. Based on the LL
and PL values the properties like Plasticity index (PI), Liquidity index (Il),
Consistency index (Ic) are derived. Activity (A) is derived based on the PI
Chapter 4 EIA Study of Navi Mumbai International Airport Sheet 44 of 416
CESE, IIT Mumbai CIDCO
and the clay fraction (F) obtained from the grain size analysis. The
magnitude of the soil properties LL, PL and PI enables the engineer to
classify the soil and assess other soil properties. The Il enables one to
determine the shear strength and estimate the degree of pre-
consolidation. The Ic helps one to study the field behaviour. The A value
helps one to identify the clay mineral and swelling pressure and swell
potential can be computed. In all 21 number of tests are performed in the
laboratory.
d. Specific Gravity (G) This test is conducted to determine the specific gravity of the soil under
consideration. Specific gravity test is conducted in the soil laboratory in
accordance with IS 2720(Part-3)-Sec-1: 1980 for fine-grained soils and in
accordance with IS 2720(Part-3)-Sec-2: 1981 for all types such as fine,
medium and coarse grained soils. This property is required for volume
computations. Twenty-one tests have been conducted for determination
of the specific gravity.
e. Particle Size Distribution These tests are conducted in accordance with IS 2720(Part-4): 1975.
(i) Coarse sieve analysis: - The soil retained on 4.75mm (IS Sieve No.6)
is taken and sieved by hand and the percentage finer in each fraction is
calculated and used for plotting the particle size distribution curve.
(ii) Fine sieve analysis: - The soil passing 4.75mm (IS Sieve No.6) and
retained on 75 (IS Sieve No.14) is taken and oven dried at 100C to
105C. Sieving is done and the percentage finer in each fraction is
calculated and used for plotting the particle size distribution curve.
(iii) Hydrometer analysis: - This test is conducted to determine the
particle size distribution of the fine-grained soils passing 75 (IS Sieve
No.14). the hydrometer measures the unit weight of the soil suspension at
the centre of its bulb. The specific gravity depends upon the mass of
solids present, which, in turn depends on the particle size. Percentage
Chapter 4 EIA Study of Navi Mumbai International Airport Sheet 45 of 416
CESE, IIT Mumbai CIDCO
finer is calculated and the same is used for plotting the particle size
distribution curve.
Other parameters derived from the particle size distribution curve are
effective diameters viz. D10, D15, D30, D50, D60 and D85. These equivalent
sizes are used in further computation of Coefficient of curvature (CC),
Uniformity coefficient (CU) and the clay fraction (F).
These tests enable one to classify the soil, compute the coefficient of
permeability by means of empirical formulae, design the filters, assess the
shear strength of the soil, assess the compressibility of the soil, soil
stabilization, pavement design, deposition of the soil, and the age of the
soil. Twenty tests were conducted on samples obtained from the
boreholes.
f. Direct Shear Test
In order to obtain the angle of shearing resistance () and cohesion (c) of
the soil samples the shear test has been conducted under two types of
drainage conditions (a) Unconsolidated Undrained (UU) test and (b)
Consolidated Drained (CD) test. In the UU test no drainage is permitted
during the consolidation stage as well as the shear stage. In the CD test
drainage is permitted in both the stages. The shear parameters obtained
through UU test are used for short-term design and shear parameters
obtained through UU test are used for long term design of structures. The
tests are conducted in accordance with IS 2720(Part-13): 1972. Five
numbers of UU tests and four numbers of CD tests were conducted in the
Direct shear apparatus.
g. Triaxial Compression Test
Due to the limitations associated with the Direct shear test like stress
conditions are unknown during testing except in failure, difficulty in
controlling drainage conditions, pore pressure are unknown, etc it is
necessary to conduct the Triaxial test. The Triaxial shear test has been
Chapter 4 EIA Study of Navi Mumbai International Airport Sheet 46 of 416
CESE, IIT Mumbai CIDCO
conducted under two types of drainage conditions (a) UU test and (b) CD
test. In the UU test no drainage is permitted during the consolidation
stage as well as the shear stage. In the CD test drainage is permitted in
both the stages. The shear parameters obtained through UU test is used
for short-term design and shear parameters obtained through UU test is
used for long term design of structures. The tests are conducted in
accordance with IS 2720 (Part-11): 1980. Eight numbers each of UU tests
and CD tests were conducted in the Triaxial compression test apparatus.
h. Chemical Analysis
Chemical analysis on (a) soil samples and (b) ground water samples for
obtaining pH value, Cl2 content and SO3 content. These tests are
essential in order to determine the effect of chemicals on foundation
treatment like deep, raft or open foundations to be adopted for various
Airport structures. The tests are conducted in accordance with IS 2720
(Part-25, 26&28): 1980. Ten samples each of soil and ground water were
tested.
i. Tests on Rock Samples Tests on rock cores were conducted for Porosity, specific gravity, water
absorption, and Unconfined compressive strength. These tests are
required to assess the bearing capacity of the founding stratum. The rock
specimen for laboratory testing was prepared in accordance with IS-9179:
1979. The laboratory test for determination of water content, porosity and
Specific gravity was conducted in accordance with IS-13030: 1991.
Unconfined compressive strength was obtained in accordance with IS-
9143: 1979. Nine sets of tests were conducted from the samples obtained
from the boreholes.
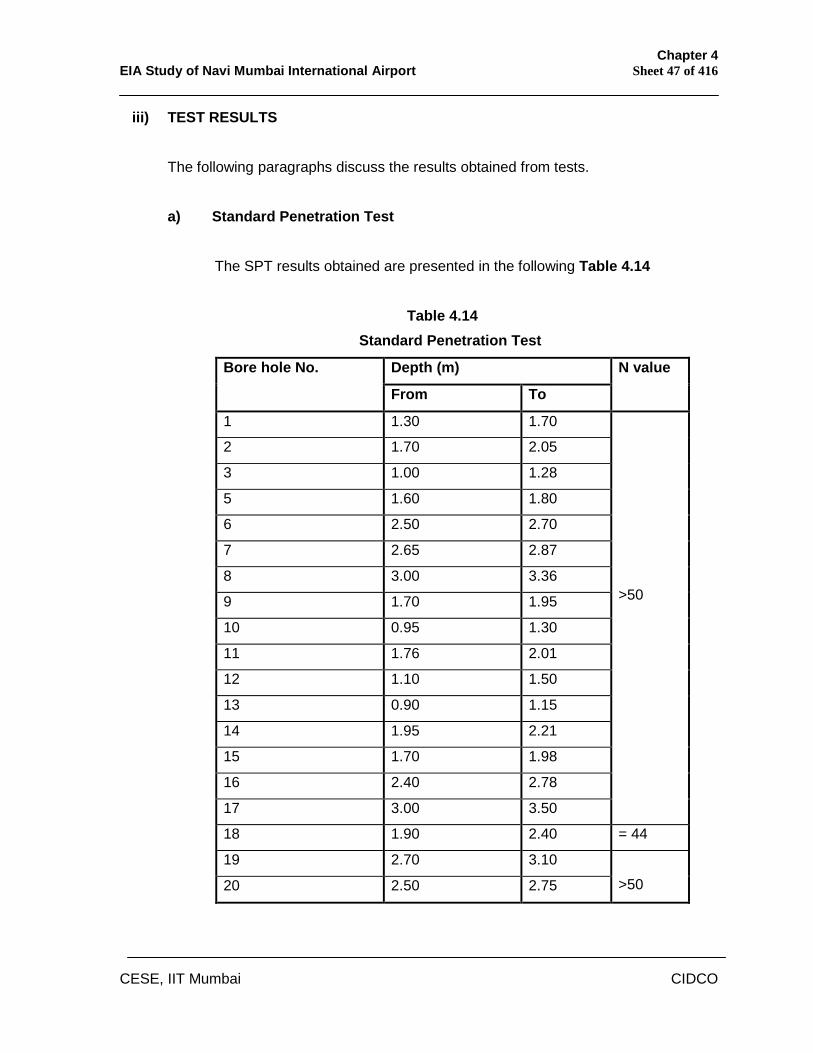
Chapter 4 EIA Study of Navi Mumbai International Airport Sheet 47 of 416
CESE, IIT Mumbai CIDCO
iii) TEST RESULTS
The following paragraphs discuss the results obtained from tests.
a) Standard Penetration Test
The SPT results obtained are presented in the following Table 4.14
Table 4.14 Standard Penetration Test
Depth (m) Bore hole No.
From To
N value
1 1.30 1.70
2 1.70 2.05
3 1.00 1.28
5 1.60 1.80
6 2.50 2.70
7 2.65 2.87
8 3.00 3.36
9 1.70 1.95
10 0.95 1.30
11 1.76 2.01
12 1.10 1.50
13 0.90 1.15
14 1.95 2.21
15 1.70 1.98
16 2.40 2.78
17 3.00 3.50
>50
18 1.90 2.40 = 44
19 2.70 3.10
20 2.50 2.75
>50
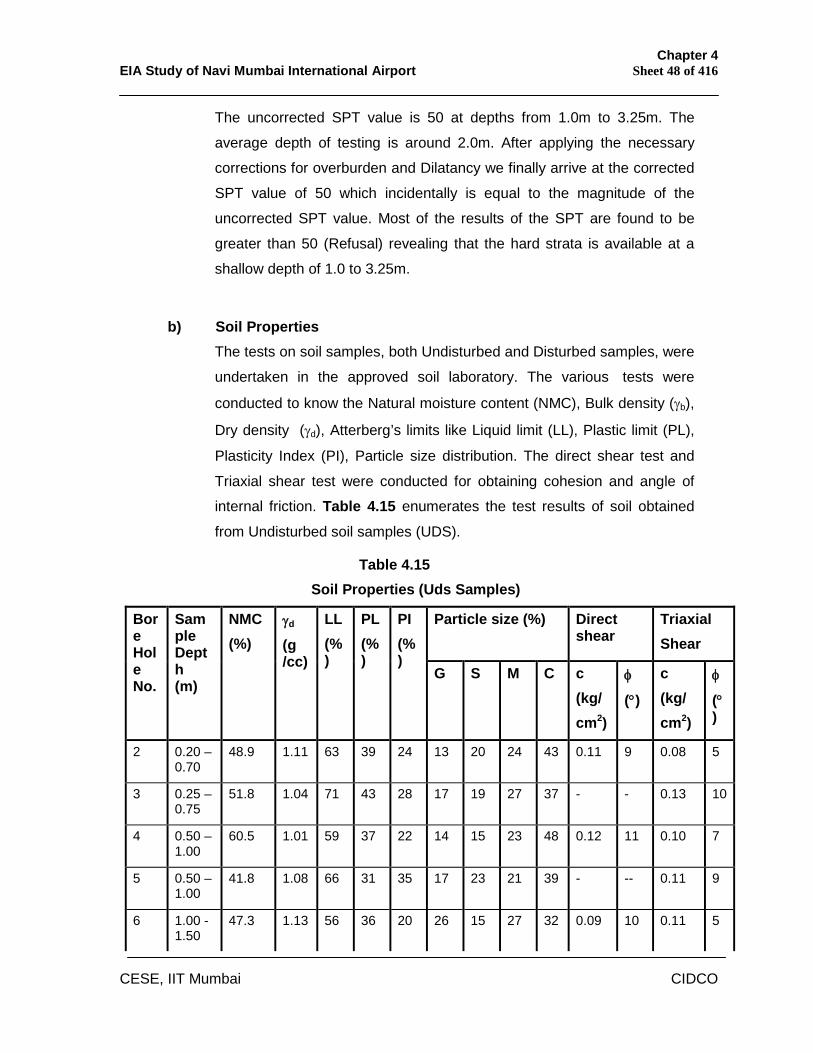
Chapter 4 EIA Study of Navi Mumbai International Airport Sheet 48 of 416
CESE, IIT Mumbai CIDCO
The uncorrected SPT value is 50 at depths from 1.0m to 3.25m. The
average depth of testing is around 2.0m. After applying the necessary
corrections for overburden and Dilatancy we finally arrive at the corrected
SPT value of 50 which incidentally is equal to the magnitude of the
uncorrected SPT value. Most of the results of the SPT are found to be
greater than 50 (Refusal) revealing that the hard strata is available at a
shallow depth of 1.0 to 3.25m.
b) Soil Properties
The tests on soil samples, both Undisturbed and Disturbed samples, were
undertaken in the approved soil laboratory. The various tests were
conducted to know the Natural moisture content (NMC), Bulk density (b),
Dry density (d), Atterberg’s limits like Liquid limit (LL), Plastic limit (PL),
Plasticity Index (PI), Particle size distribution. The direct shear test and
Triaxial shear test were conducted for obtaining cohesion and angle of
internal friction. Table 4.15 enumerates the test results of soil obtained
from Undisturbed soil samples (UDS).
Table 4.15 Soil Properties (Uds Samples)
Particle size (%) Direct shear
Triaxial Shear
Bore Hole No.
Sample Depth (m)
NMC (%)
d (g /cc)
LL (%)
PL (%)
PI (%)
G S M C c (kg/ cm2)
()
c (kg/ cm2)
()
2 0.20 – 0.70
48.9 1.11 63 39 24 13 20 24 43 0.11 9 0.08 5
3 0.25 – 0.75
51.8 1.04 71 43 28 17 19 27 37 - - 0.13 10
4 0.50 – 1.00
60.5 1.01 59 37 22 14 15 23 48 0.12 11 0.10 7
5 0.50 – 1.00
41.8 1.08 66 31 35 17 23 21 39 - -- 0.11 9
6 1.00 -1.50
47.3 1.13 56 36 20 26 15 27 32 0.09 10 0.11 5
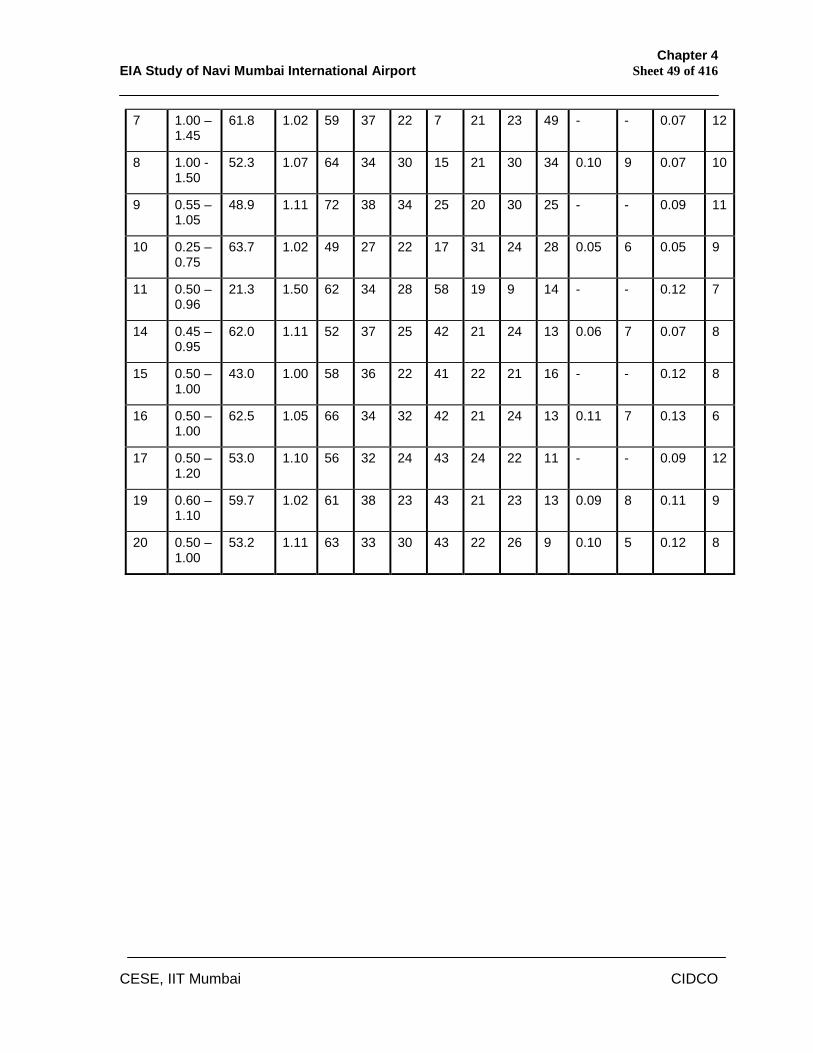
Chapter 4 EIA Study of Navi Mumbai International Airport Sheet 49 of 416
CESE, IIT Mumbai CIDCO
7 1.00 – 1.45
61.8 1.02 59 37 22 7 21 23 49 - - 0.07 12
8 1.00 - 1.50
52.3 1.07 64 34 30 15 21 30 34 0.10 9 0.07 10
9 0.55 – 1.05
48.9 1.11 72 38 34 25 20 30 25 - - 0.09 11
10 0.25 – 0.75
63.7 1.02 49 27 22 17 31 24 28 0.05 6 0.05 9
11 0.50 – 0.96
21.3 1.50 62 34 28 58 19 9 14 - - 0.12 7
14 0.45 – 0.95
62.0 1.11 52 37 25 42 21 24 13 0.06 7 0.07 8
15 0.50 – 1.00
43.0 1.00 58 36 22 41 22 21 16 - - 0.12 8
16 0.50 – 1.00
62.5 1.05 66 34 32 42 21 24 13 0.11 7 0.13 6
17 0.50 – 1.20
53.0 1.10 56 32 24 43 24 22 11 - - 0.09 12
19 0.60 – 1.10
59.7 1.02 61 38 23 43 21 23 13 0.09 8 0.11 9
20 0.50 – 1.00
53.2 1.11 63 33 30 43 22 26 9 0.10 5 0.12 8
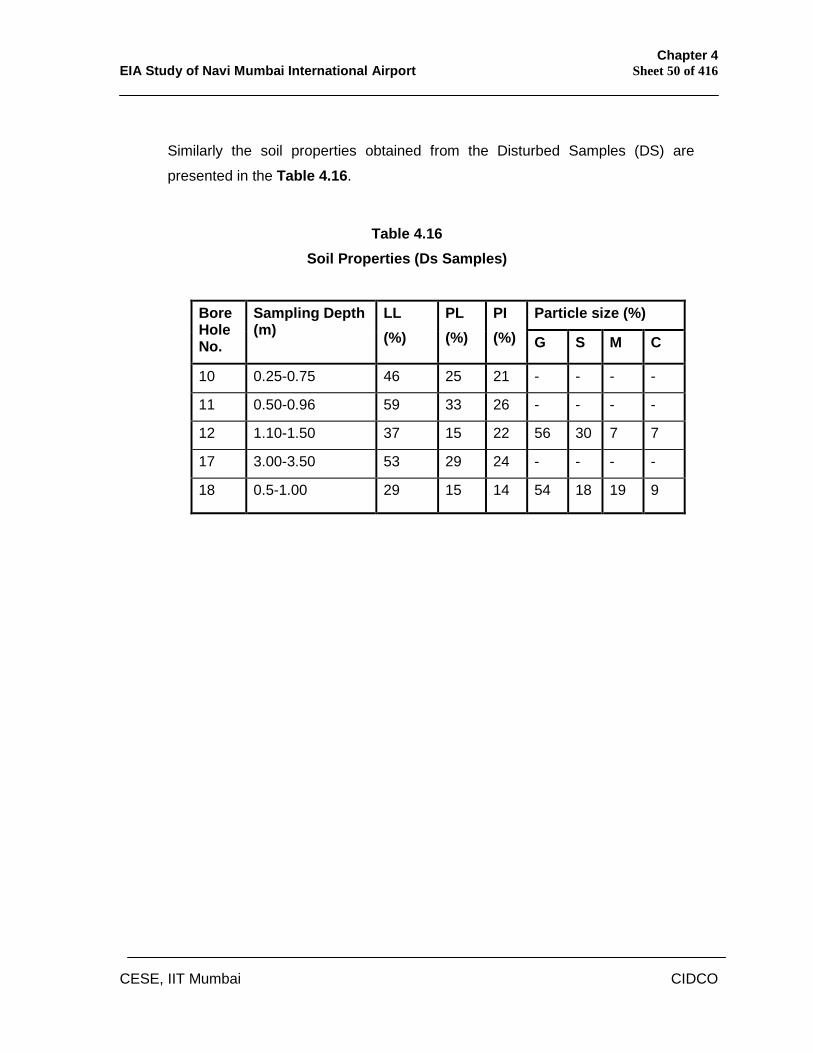
Chapter 4 EIA Study of Navi Mumbai International Airport Sheet 50 of 416
CESE, IIT Mumbai CIDCO
Similarly the soil properties obtained from the Disturbed Samples (DS) are
presented in the Table 4.16.
Table 4.16 Soil Properties (Ds Samples)
Particle size (%) Bore Hole No.
Sampling Depth (m)
LL (%)
PL (%)
PI (%) G S M C
10 0.25-0.75 46 25 21 - - - -
11 0.50-0.96 59 33 26 - - - -
12 1.10-1.50 37 15 22 56 30 7 7
17 3.00-3.50 53 29 24 - - - -
18 0.5-1.00 29 15 14 54 18 19 9
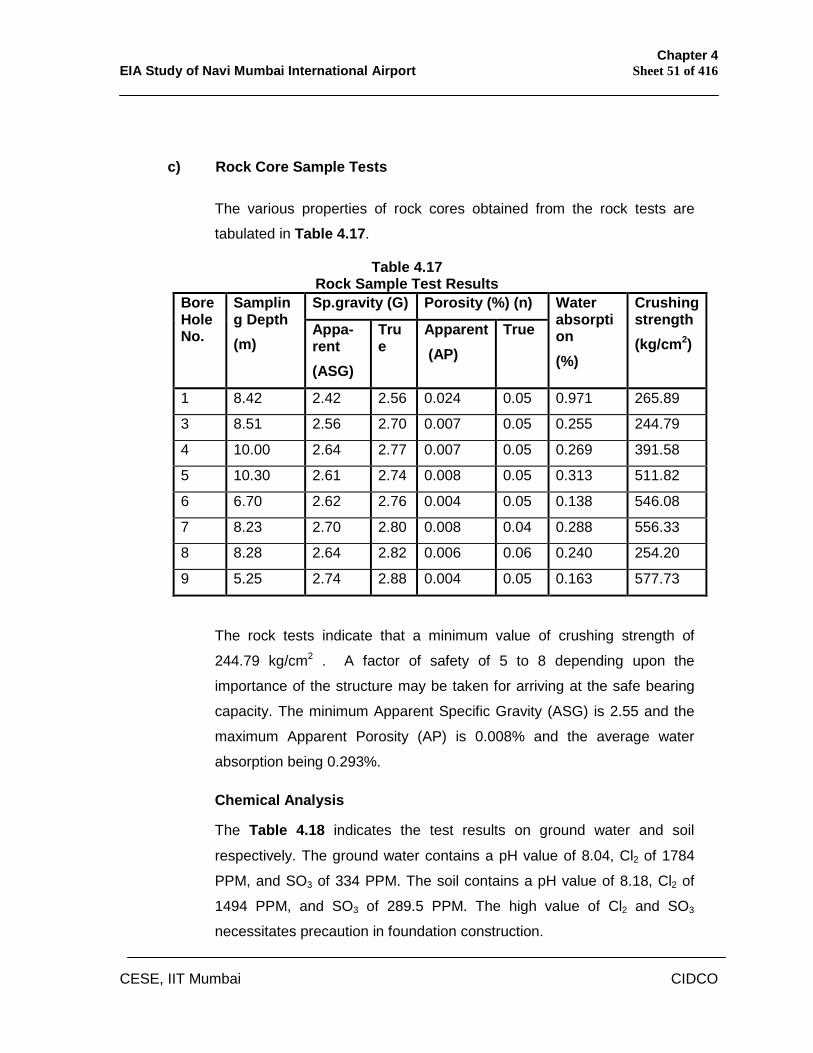
Chapter 4 EIA Study of Navi Mumbai International Airport Sheet 51 of 416
CESE, IIT Mumbai CIDCO
c) Rock Core Sample Tests
The various properties of rock cores obtained from the rock tests are
tabulated in Table 4.17.
Table 4.17 Rock Sample Test Results Sp.gravity (G) Porosity (%) (n) Bore
Hole No.
Sampling Depth (m)
Appa-rent (ASG)
True
Apparent (AP)
True
Water absorption (%)
Crushing strength (kg/cm2)
1 8.42 2.42 2.56 0.024 0.05 0.971 265.89
3 8.51 2.56 2.70 0.007 0.05 0.255 244.79
4 10.00 2.64 2.77 0.007 0.05 0.269 391.58
5 10.30 2.61 2.74 0.008 0.05 0.313 511.82
6 6.70 2.62 2.76 0.004 0.05 0.138 546.08
7 8.23 2.70 2.80 0.008 0.04 0.288 556.33
8 8.28 2.64 2.82 0.006 0.06 0.240 254.20
9 5.25 2.74 2.88 0.004 0.05 0.163 577.73
The rock tests indicate that a minimum value of crushing strength of
244.79 kg/cm2 . A factor of safety of 5 to 8 depending upon the
importance of the structure may be taken for arriving at the safe bearing
capacity. The minimum Apparent Specific Gravity (ASG) is 2.55 and the
maximum Apparent Porosity (AP) is 0.008% and the average water
absorption being 0.293%.
Chemical Analysis
The Table 4.18 indicates the test results on ground water and soil
respectively. The ground water contains a pH value of 8.04, Cl2 of 1784
PPM, and SO3 of 334 PPM. The soil contains a pH value of 8.18, Cl2 of
1494 PPM, and SO3 of 289.5 PPM. The high value of Cl2 and SO3 necessitates precaution in foundation construction.
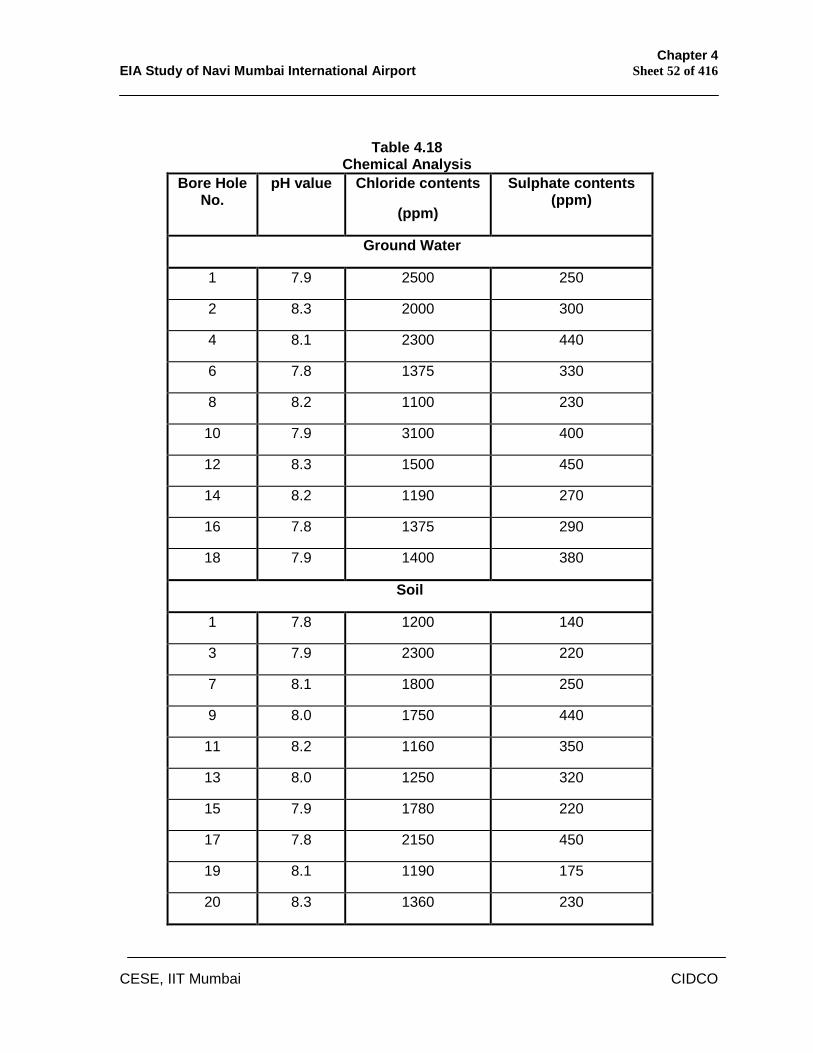
Chapter 4 EIA Study of Navi Mumbai International Airport Sheet 52 of 416
CESE, IIT Mumbai CIDCO
Table 4.18 Chemical Analysis
Bore Hole No.
pH value Chloride contents
(ppm)
Sulphate contents (ppm)
Ground Water
1 7.9 2500 250
2 8.3 2000 300
4 8.1 2300 440
6 7.8 1375 330
8 8.2 1100 230
10 7.9 3100 400
12 8.3 1500 450
14 8.2 1190 270
16 7.8 1375 290
18 7.9 1400 380
Soil
1 7.8 1200 140
3 7.9 2300 220
7 8.1 1800 250
9 8.0 1750 440
11 8.2 1160 350
13 8.0 1250 320
15 7.9 1780 220
17 7.8 2150 450
19 8.1 1190 175
20 8.3 1360 230
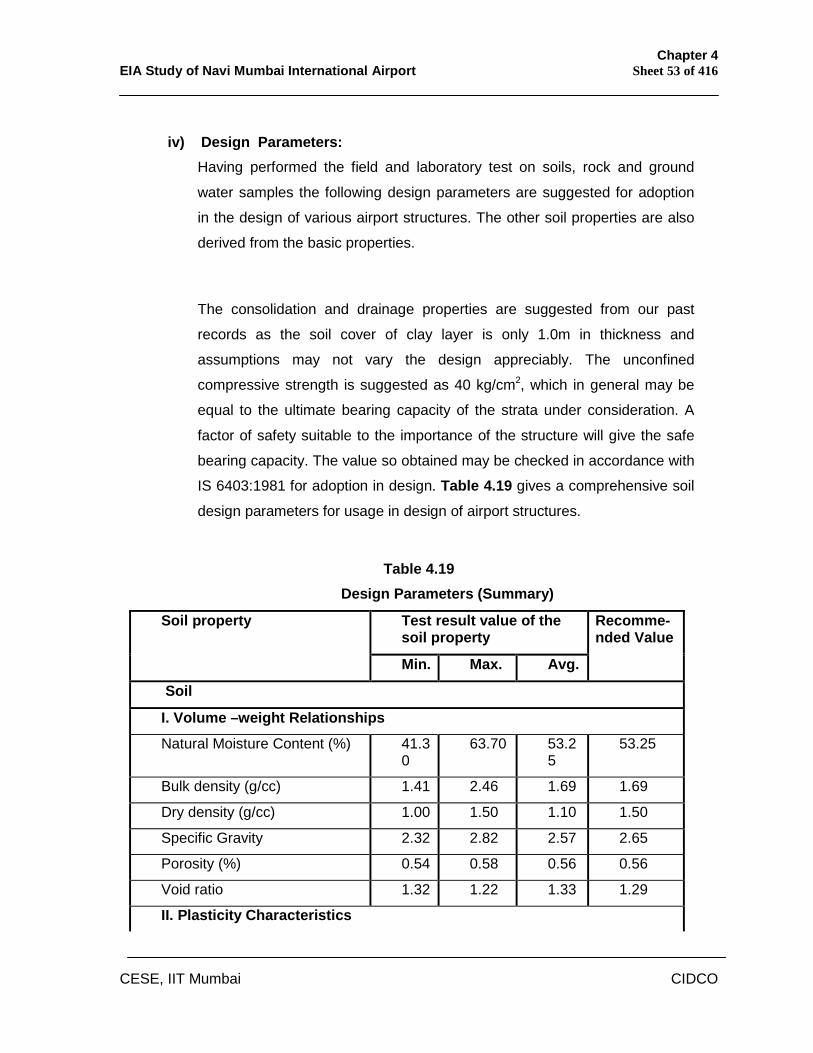
Chapter 4 EIA Study of Navi Mumbai International Airport Sheet 53 of 416
CESE, IIT Mumbai CIDCO
iv) Design Parameters:
Having performed the field and laboratory test on soils, rock and ground
water samples the following design parameters are suggested for adoption
in the design of various airport structures. The other soil properties are also
derived from the basic properties.
The consolidation and drainage properties are suggested from our past
records as the soil cover of clay layer is only 1.0m in thickness and
assumptions may not vary the design appreciably. The unconfined
compressive strength is suggested as 40 kg/cm2, which in general may be
equal to the ultimate bearing capacity of the strata under consideration. A
factor of safety suitable to the importance of the structure will give the safe
bearing capacity. The value so obtained may be checked in accordance with
IS 6403:1981 for adoption in design. Table 4.19 gives a comprehensive soil
design parameters for usage in design of airport structures.
Table 4.19
Design Parameters (Summary)
Test result value of the soil property
Soil property
Min. Max. Avg.
Recomme-nded Value
Soil
I. Volume –weight Relationships
Natural Moisture Content (%) 41.30
63.70 53.25
53.25
Bulk density (g/cc) 1.41 2.46 1.69 1.69
Dry density (g/cc) 1.00 1.50 1.10 1.50
Specific Gravity 2.32 2.82 2.57 2.65
Porosity (%) 0.54 0.58 0.56 0.56
Void ratio 1.32 1.22 1.33 1.29
II. Plasticity Characteristics
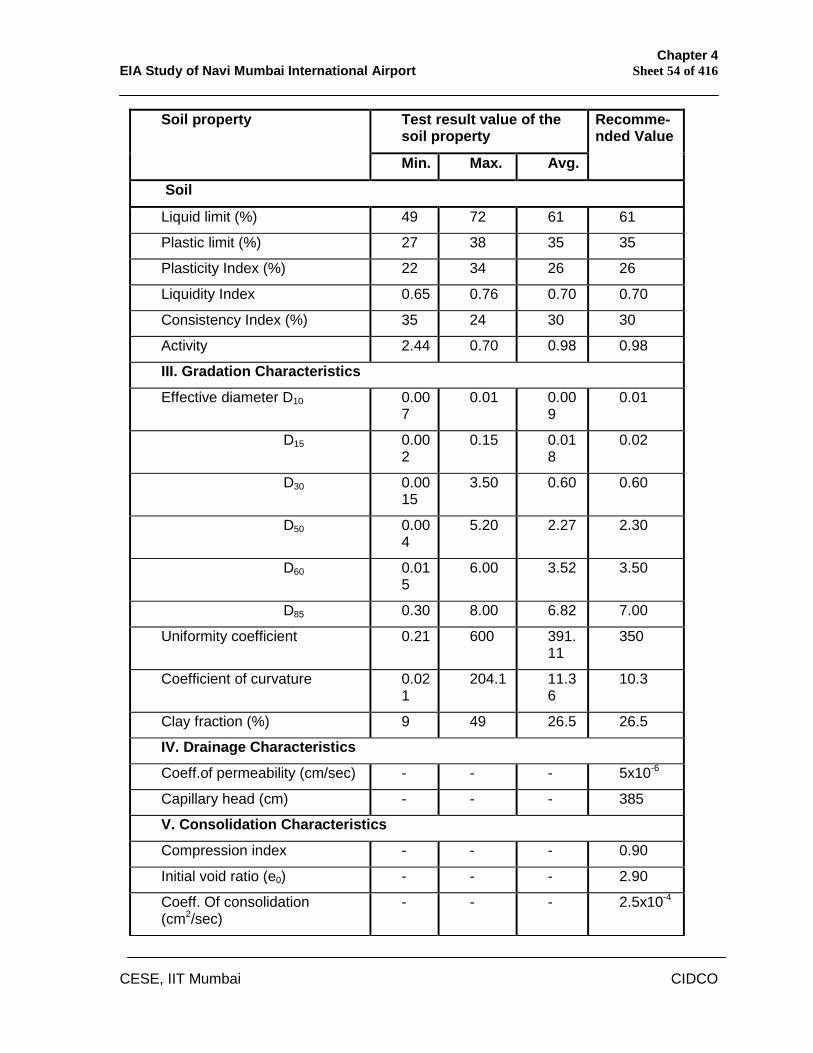
Chapter 4 EIA Study of Navi Mumbai International Airport Sheet 54 of 416
CESE, IIT Mumbai CIDCO
Test result value of the soil property
Soil property
Min. Max. Avg.
Recomme-nded Value
Soil
Liquid limit (%) 49 72 61 61
Plastic limit (%) 27 38 35 35
Plasticity Index (%) 22 34 26 26
Liquidity Index 0.65 0.76 0.70 0.70
Consistency Index (%) 35 24 30 30
Activity 2.44 0.70 0.98 0.98
III. Gradation Characteristics
Effective diameter D10 0.007
0.01 0.009
0.01
D15 0.002
0.15 0.018
0.02
D30 0.0015
3.50 0.60 0.60
D50 0.004
5.20 2.27 2.30
D60 0.015
6.00 3.52 3.50
D85 0.30 8.00 6.82 7.00
Uniformity coefficient 0.21 600 391.11
350
Coefficient of curvature 0.021
204.1 11.36
10.3
Clay fraction (%) 9 49 26.5 26.5
IV. Drainage Characteristics
Coeff.of permeability (cm/sec) - - - 5x10⁻⁶
Capillary head (cm) - - - 385
V. Consolidation Characteristics
Compression index - - - 0.90
Initial void ratio (e0) - - - 2.90
Coeff. Of consolidation (cm2/sec)
- - - 2.5x10⁻⁴
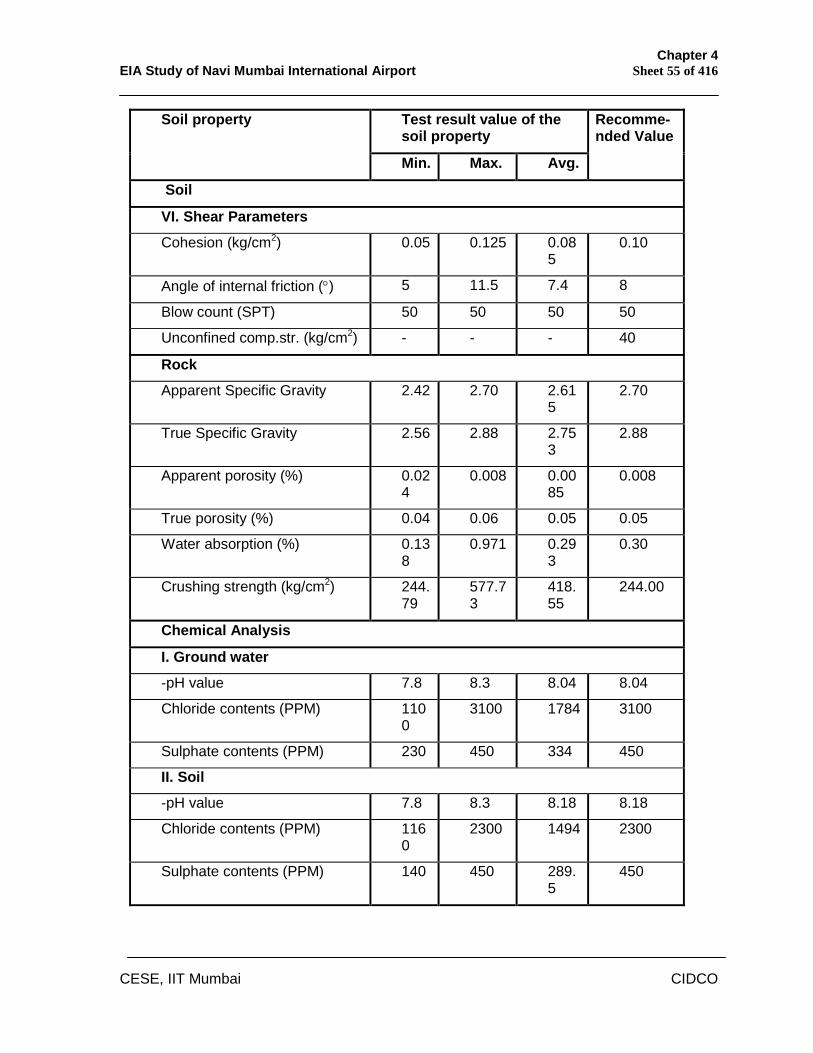
Chapter 4 EIA Study of Navi Mumbai International Airport Sheet 55 of 416
CESE, IIT Mumbai CIDCO
Test result value of the soil property
Soil property
Min. Max. Avg.
Recomme-nded Value
Soil
VI. Shear Parameters
Cohesion (kg/cm2) 0.05 0.125 0.085
0.10
Angle of internal friction () 5 11.5 7.4 8
Blow count (SPT) 50 50 50 50
Unconfined comp.str. (kg/cm2) - - - 40
Rock
Apparent Specific Gravity 2.42 2.70 2.615
2.70
True Specific Gravity 2.56 2.88 2.753
2.88
Apparent porosity (%) 0.024
0.008 0.0085
0.008
True porosity (%) 0.04 0.06 0.05 0.05
Water absorption (%) 0.138
0.971 0.293
0.30
Crushing strength (kg/cm2) 244.79
577.73
418.55
244.00
Chemical Analysis
I. Ground water
-pH value 7.8 8.3 8.04 8.04
Chloride contents (PPM) 1100
3100 1784 3100
Sulphate contents (PPM) 230 450 334 450
II. Soil
-pH value 7.8 8.3 8.18 8.18
Chloride contents (PPM) 1160
2300 1494 2300
Sulphate contents (PPM) 140 450 289.5
450
Chapter 4 EIA Study of Navi Mumbai International Airport Sheet 56 of 416
CESE, IIT Mumbai CIDCO
v) Sub-Soil Profile: Cross sections have been prepared describing the soil profile along (Fig 4.15) and across (Fig 4.16) the airport area. The airport area has two distinct areas
of high and low lands. The high lands comprise of rocks of basaltic origin and
they are exposed in many places. Based on the study of the borehole logs,
two numbers of soil profiles are visualized one along the main runway and
another across the main runway.
The sub-soil in the low lying areas consists of three types of soils viz. Soft
marine clay of around 1.0m thick, residual soils (soft to hard murrum) extends
between 2.75m to 4.65m below the ground level. The rest is basaltic rock,
which is encountered at different depths from, 2.75m to 4.10m below ground
surface and found continuous upto a maximum drilled depth of 13.50m. The
ground water levels are observed to be in the region of 0.15m to 0.60m below
the ground level. Based on the above soil profile the following paragraphs
describe each type of stratum encountered with.
Stratum I: - The Silty plastic clay is observed in this stratum which is a
superficial layer extending upto a depth of 1.0m. This soil is of marine origin.
As per the Indian classification system this soil belongs to CH group indicating
these are inorganic clays with high degree of plasticity.
Stratum II: - This stratum comprises of completely weathered rock locally
known as murrum – Normally it is classified under Indian classification system
as GC or SC. This stratum was found at 0.30m to 1.0m from ground and
extends upto 2.75m to 4.65m below the ground. The boulders about 1.0m
thick are encountered at about 2.0 to 2.50m from ground. Some boulders are
found to be in an isolated lens form of 1.0m thick.
Stratum III: - The basaltic rocks of Amygdaloidal and Compact varieties are
found in the depth region of 2.75m to 8.0m. The Amygdaloidal basalts have
either Chlorophite or Zeolite (green or white respectively) infillings in their
cavities. Amygdaloidal basalts are underlain by the jointed rock, which is
commonly known as Compact basalts. The core recovery varies from 18.66%
(weathered zone) to 100% (in compact rock mass). The RQD is in the range
of 24.66% to 100%.
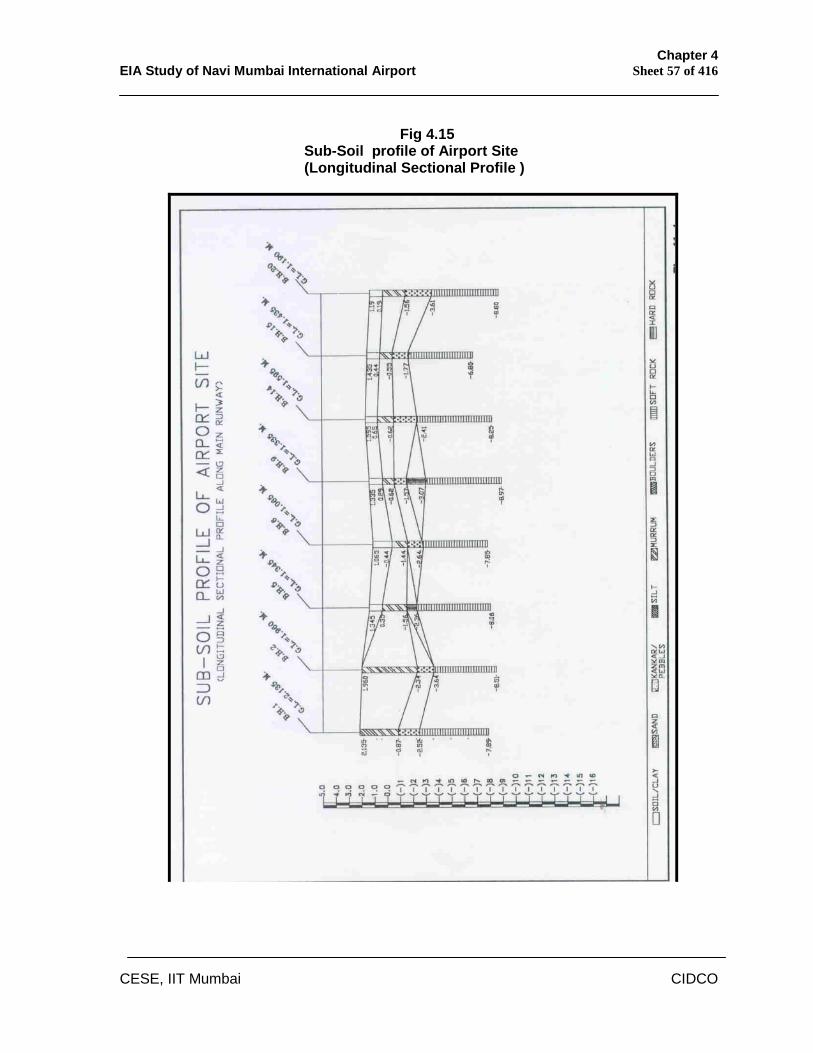
Chapter 4 EIA Study of Navi Mumbai International Airport Sheet 57 of 416
CESE, IIT Mumbai CIDCO
Fig 4.15 Sub-Soil profile of Airport Site (Longitudinal Sectional Profile )
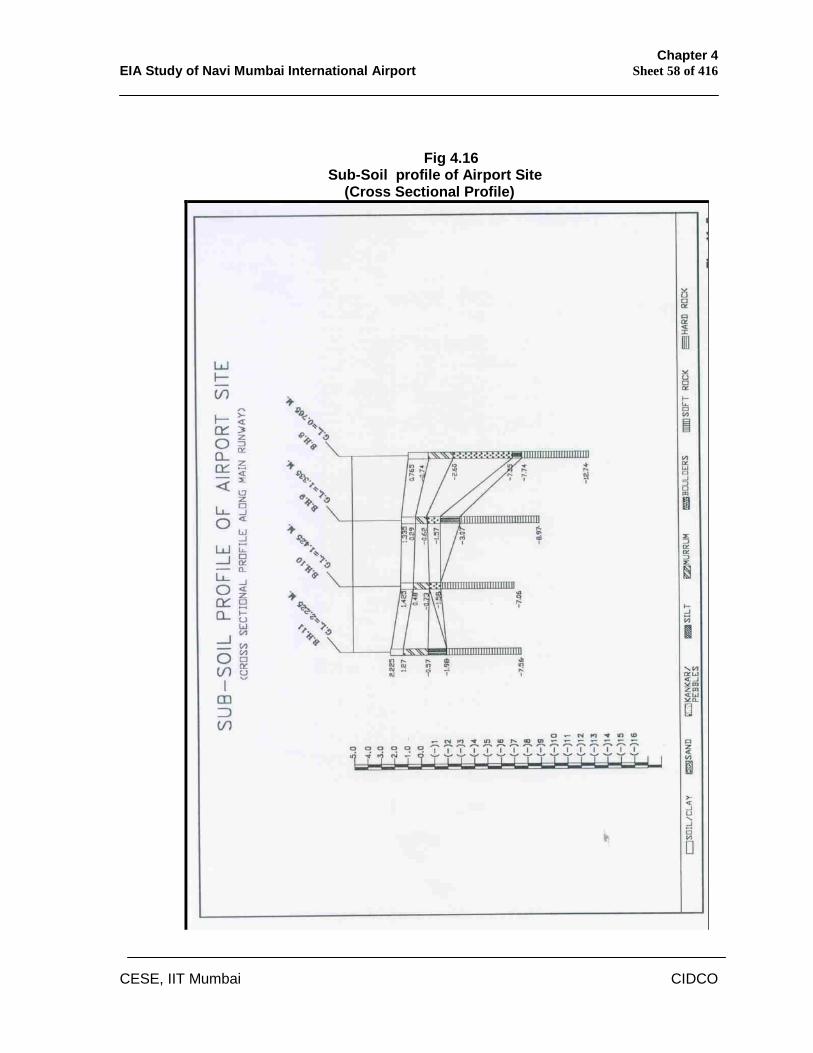
Chapter 4 EIA Study of Navi Mumbai International Airport Sheet 58 of 416
CESE, IIT Mumbai CIDCO
Fig 4.16 Sub-Soil profile of Airport Site (Cross Sectional Profile)
Chapter 4 EIA Study of Navi Mumbai International Airport Sheet 59 of 416
CESE, IIT Mumbai CIDCO
4.7.11 Sub-Soil Investigation During DPR Stage:
The sub-soil investigation similar to TFS stage is again carried out during
the detailed project report stage upon the finalisation of alternative Master
Plan and freezing of runway orientation. In total, drilling of 24 boreholes
spread over the entire airport zone and covering the runway, terminal
area, access and along the proposed diversion and training of rivers were
carried out to get the detail of sub-soil characteristics more precisely. The
spacing of boreholes are kept varying from 300 to 600 keeping in view the
site condition favourable for conducting the work of boreholes. A map
(Fig 4.17) showing the disposition of borehole locations within the airport
zone. Annexure-2 placed in Chapter-9 Additional Studies provides
details of all the borelogs. All the boreholes were taken from 3.00 m
to 3.50 m in to the hard rock. Corresponding termination depths ranged
from 5.50 m to 16.00 m.
In all, twenty four (24) bore holes were drilled using rotary wash method.
Samples collected from the field were tested for Classification. In all,
twenty three (23) rock cores were tested. Tests on rock samples include
specific gravity, porosity, water absorption, uni-axial compressive
strength, etc as per I.S. code. Water table was observed at depths
ranging from 0.30 m to 1.00 m below the existing ground level (GL).
Appropriate tests i.e. Standard Penetration Tests (SPT) were conducted
in-situ. Undisturbed samples were collected from soft to medium stiff clay
deposit. Disturbed Samples (DS and SPT) were collected in brown,
medium dense murum and highly weathered rock. The Table No.4.20, 4.21 and 4.22 gives the result of soil properties of undisturb samples,
disturb samples and rock sample.
Longitudinal Sections indicating the soil profile under the runways, centre
line of airport and along the banks of proposed diverted Gadhi river
using borehole details at both the stages were prepared and given in
Figures 4.18 to 4.22.
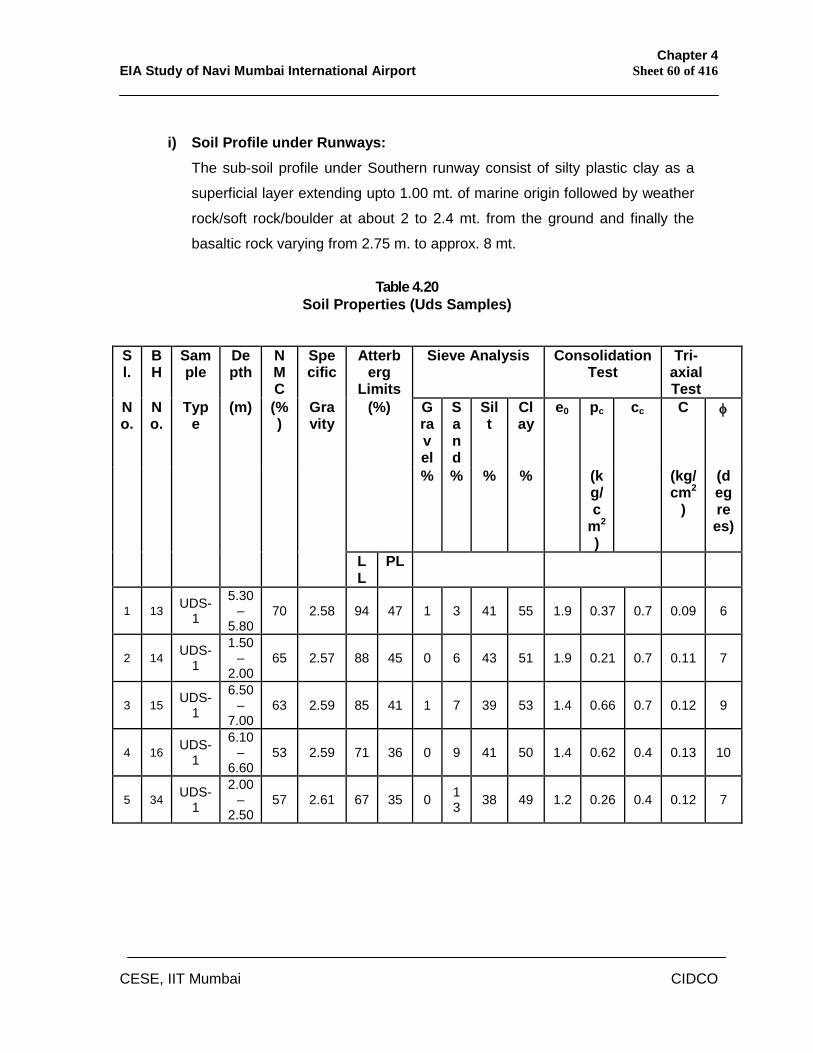
Chapter 4 EIA Study of Navi Mumbai International Airport Sheet 60 of 416
CESE, IIT Mumbai CIDCO
i) Soil Profile under Runways:
The sub-soil profile under Southern runway consist of silty plastic clay as a
superficial layer extending upto 1.00 mt. of marine origin followed by weather
rock/soft rock/boulder at about 2 to 2.4 mt. from the ground and finally the
basaltic rock varying from 2.75 m. to approx. 8 mt.
Table 4.20
Soil Properties (Uds Samples)
Sl.
BH
Sample
Depth
NMC
Specific
Atterberg
Limits
Sieve Analysis Consolidation Test
Tri-axial Test
No.
No.
Type
(m) (%)
Gravity
(%) Gravel
Sand
Silt
Clay
pc C
% % % %
e0
(kg/c
m2
)
cc
(kg/cm2
)
(degrees)
LL
PL
1 13 UDS-1
5.30 –
5.80 70 2.58 94 47 1 3 41 55 1.9 0.37 0.7 0.09 6
2 14 UDS-1
1.50 –
2.00 65 2.57 88 45 0 6 43 51 1.9 0.21 0.7 0.11 7
3 15 UDS-1
6.50 –
7.00 63 2.59 85 41 1 7 39 53 1.4 0.66 0.7 0.12 9
4 16 UDS-1
6.10 –
6.60 53 2.59 71 36 0 9 41 50 1.4 0.62 0.4 0.13 10
5 34 UDS-1
2.00 –
2.50 57 2.61 67 35 0 1
3 38 49 1.2 0.26 0.4 0.12 7
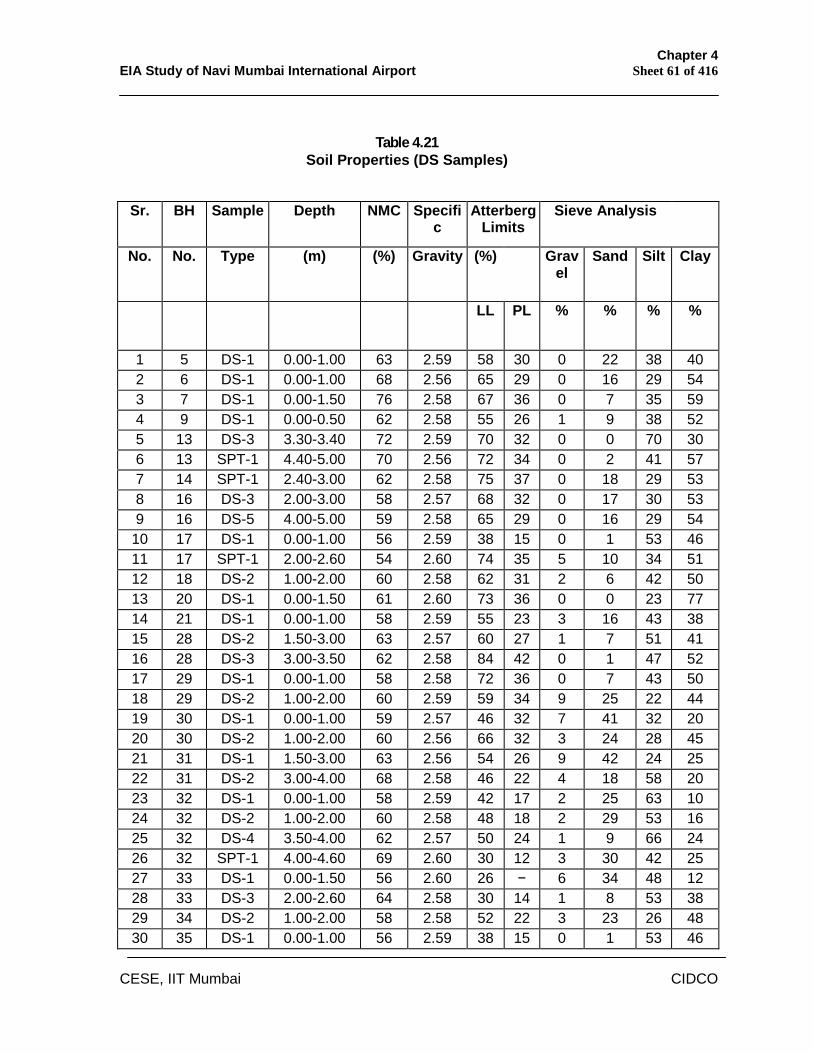
Chapter 4 EIA Study of Navi Mumbai International Airport Sheet 61 of 416
CESE, IIT Mumbai CIDCO
Table 4.21
Soil Properties (DS Samples)
Sr. BH Sample Depth NMC Specific
Atterberg Limits
Sieve Analysis
No. No. Type (m) (%) Gravity (%) Gravel
Sand Silt Clay
LL PL % % % %
1 5 DS-1 0.00-1.00 63 2.59 58 30 0 22 38 40 2 6 DS-1 0.00-1.00 68 2.56 65 29 0 16 29 54 3 7 DS-1 0.00-1.50 76 2.58 67 36 0 7 35 59 4 9 DS-1 0.00-0.50 62 2.58 55 26 1 9 38 52 5 13 DS-3 3.30-3.40 72 2.59 70 32 0 0 70 30 6 13 SPT-1 4.40-5.00 70 2.56 72 34 0 2 41 57 7 14 SPT-1 2.40-3.00 62 2.58 75 37 0 18 29 53 8 16 DS-3 2.00-3.00 58 2.57 68 32 0 17 30 53 9 16 DS-5 4.00-5.00 59 2.58 65 29 0 16 29 54
10 17 DS-1 0.00-1.00 56 2.59 38 15 0 1 53 46 11 17 SPT-1 2.00-2.60 54 2.60 74 35 5 10 34 51 12 18 DS-2 1.00-2.00 60 2.58 62 31 2 6 42 50 13 20 DS-1 0.00-1.50 61 2.60 73 36 0 0 23 77 14 21 DS-1 0.00-1.00 58 2.59 55 23 3 16 43 38 15 28 DS-2 1.50-3.00 63 2.57 60 27 1 7 51 41 16 28 DS-3 3.00-3.50 62 2.58 84 42 0 1 47 52 17 29 DS-1 0.00-1.00 58 2.58 72 36 0 7 43 50 18 29 DS-2 1.00-2.00 60 2.59 59 34 9 25 22 44 19 30 DS-1 0.00-1.00 59 2.57 46 32 7 41 32 20 20 30 DS-2 1.00-2.00 60 2.56 66 32 3 24 28 45 21 31 DS-1 1.50-3.00 63 2.56 54 26 9 42 24 25 22 31 DS-2 3.00-4.00 68 2.58 46 22 4 18 58 20 23 32 DS-1 0.00-1.00 58 2.59 42 17 2 25 63 10 24 32 DS-2 1.00-2.00 60 2.58 48 18 2 29 53 16 25 32 DS-4 3.50-4.00 62 2.57 50 24 1 9 66 24 26 32 SPT-1 4.00-4.60 69 2.60 30 12 3 30 42 25 27 33 DS-1 0.00-1.50 56 2.60 26 − 6 34 48 12 28 33 DS-3 2.00-2.60 64 2.58 30 14 1 8 53 38 29 34 DS-2 1.00-2.00 58 2.58 52 22 3 23 26 48 30 35 DS-1 0.00-1.00 56 2.59 38 15 0 1 53 46
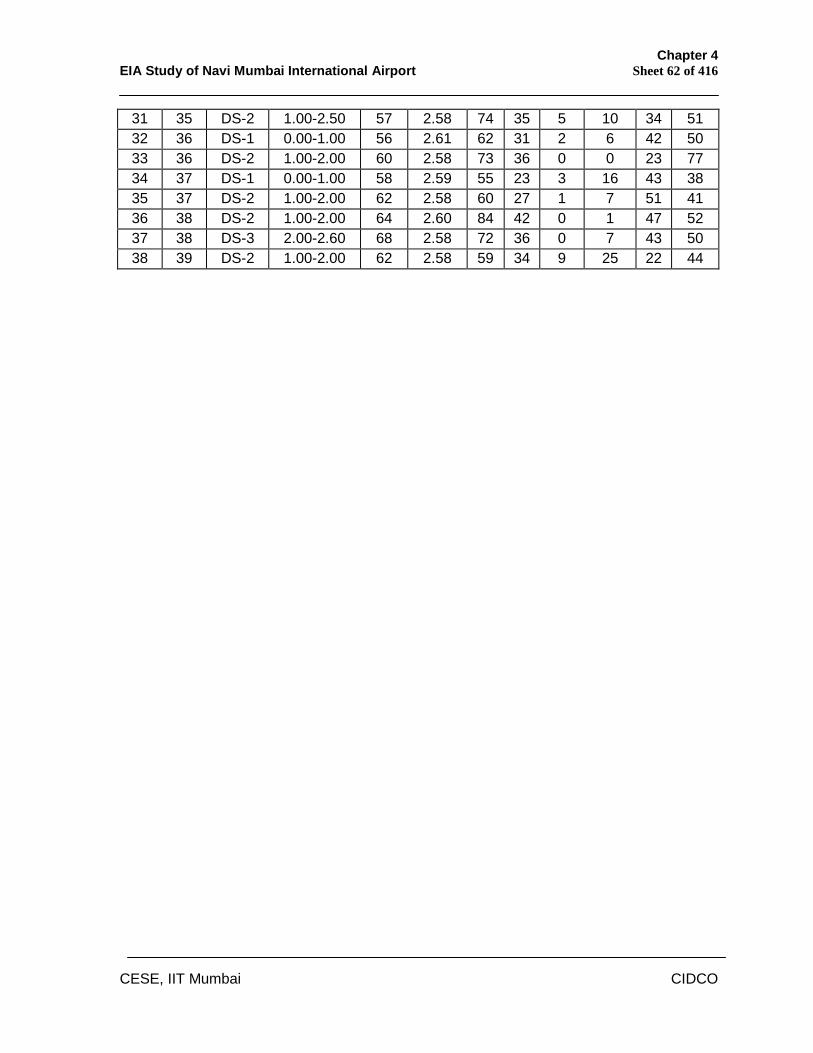
Chapter 4 EIA Study of Navi Mumbai International Airport Sheet 62 of 416
CESE, IIT Mumbai CIDCO
31 35 DS-2 1.00-2.50 57 2.58 74 35 5 10 34 51 32 36 DS-1 0.00-1.00 56 2.61 62 31 2 6 42 50 33 36 DS-2 1.00-2.00 60 2.58 73 36 0 0 23 77 34 37 DS-1 0.00-1.00 58 2.59 55 23 3 16 43 38 35 37 DS-2 1.00-2.00 62 2.58 60 27 1 7 51 41 36 38 DS-2 1.00-2.00 64 2.60 84 42 0 1 47 52 37 38 DS-3 2.00-2.60 68 2.58 72 36 0 7 43 50 38 39 DS-2 1.00-2.00 62 2.58 59 34 9 25 22 44
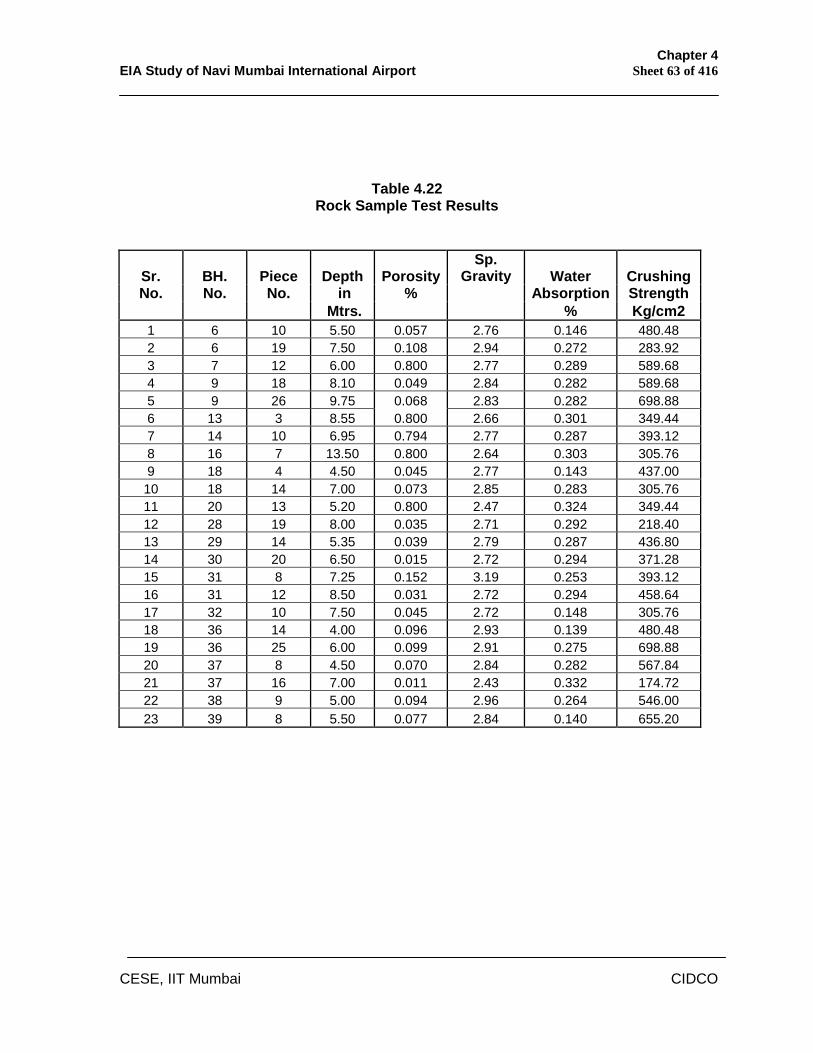
Chapter 4 EIA Study of Navi Mumbai International Airport Sheet 63 of 416
CESE, IIT Mumbai CIDCO
Table 4.22 Rock Sample Test Results
Sr. BH. Piece Depth Porosity Sp.
Gravity Water Crushing No. No. No. in % Absorption Strength
Mtrs. % Kg/cm2 1 6 10 5.50 0.057 2.76 0.146 480.48 2 6 19 7.50 0.108 2.94 0.272 283.92 3 7 12 6.00 0.800 2.77 0.289 589.68 4 9 18 8.10 0.049 2.84 0.282 589.68 5 9 26 9.75 0.068 2.83 0.282 698.88 6 13 3 8.55 0.800 2.66 0.301 349.44 7 14 10 6.95 0.794 2.77 0.287 393.12 8 16 7 13.50 0.800 2.64 0.303 305.76 9 18 4 4.50 0.045 2.77 0.143 437.00 10 18 14 7.00 0.073 2.85 0.283 305.76 11 20 13 5.20 0.800 2.47 0.324 349.44 12 28 19 8.00 0.035 2.71 0.292 218.40 13 29 14 5.35 0.039 2.79 0.287 436.80 14 30 20 6.50 0.015 2.72 0.294 371.28 15 31 8 7.25 0.152 3.19 0.253 393.12 16 31 12 8.50 0.031 2.72 0.294 458.64 17 32 10 7.50 0.045 2.72 0.148 305.76 18 36 14 4.00 0.096 2.93 0.139 480.48 19 36 25 6.00 0.099 2.91 0.275 698.88 20 37 8 4.50 0.070 2.84 0.282 567.84 21 37 16 7.00 0.011 2.43 0.332 174.72 22 38 9 5.00 0.094 2.96 0.264 546.00 23 39 8 5.50 0.077 2.84 0.140 655.20
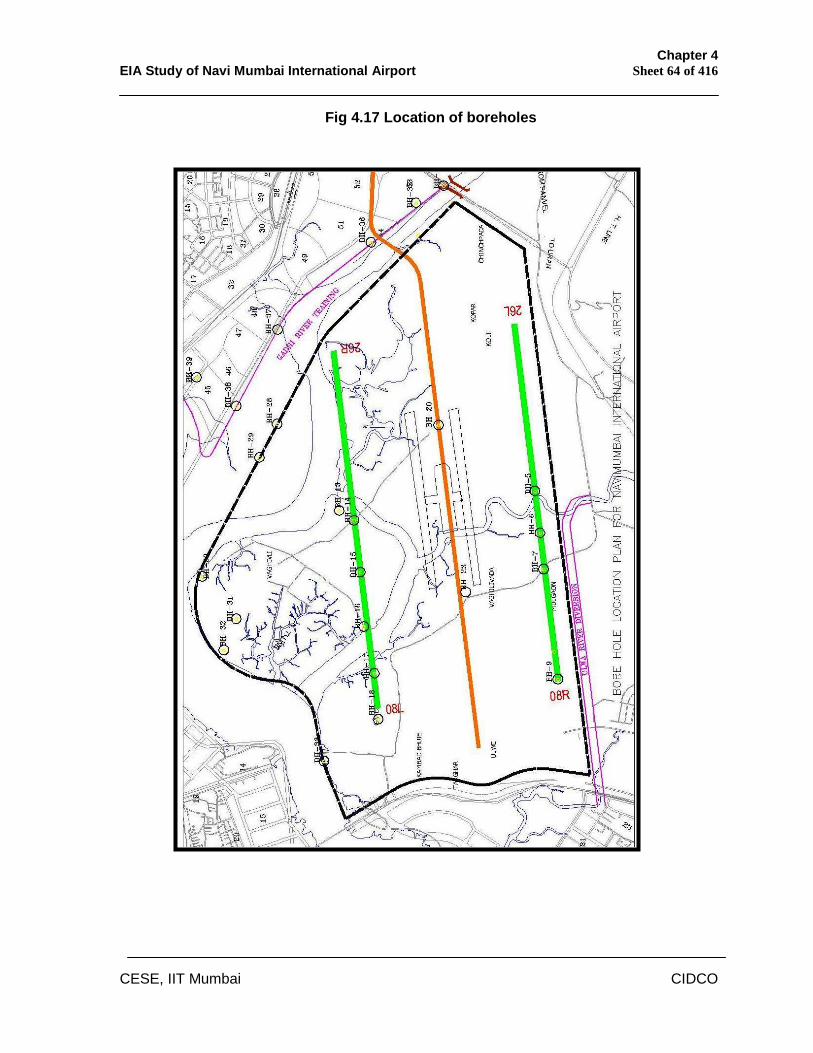
Chapter 4 EIA Study of Navi Mumbai International Airport Sheet 64 of 416
CESE, IIT Mumbai CIDCO
Fig 4.17 Location of boreholes
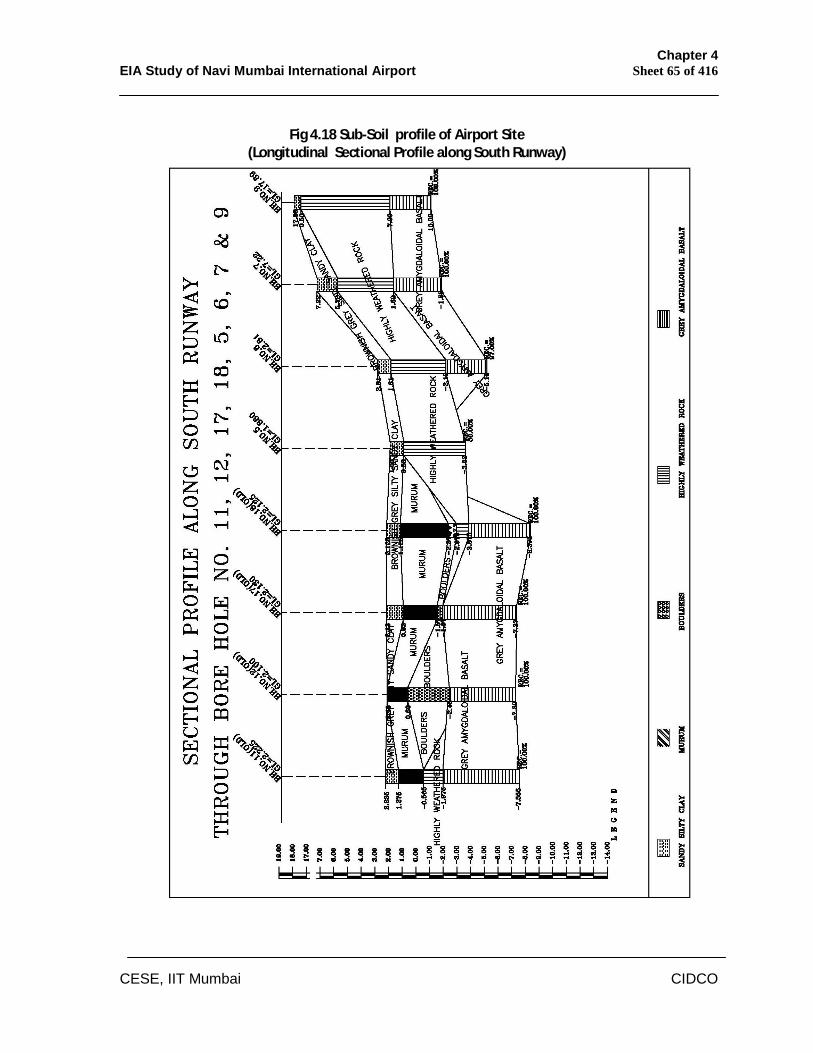
Chapter 4 EIA Study of Navi Mumbai International Airport Sheet 65 of 416
CESE, IIT Mumbai CIDCO
Fig 4.18 Sub-Soil profile of Airport Site
(Longitudinal Sectional Profile along South Runway)
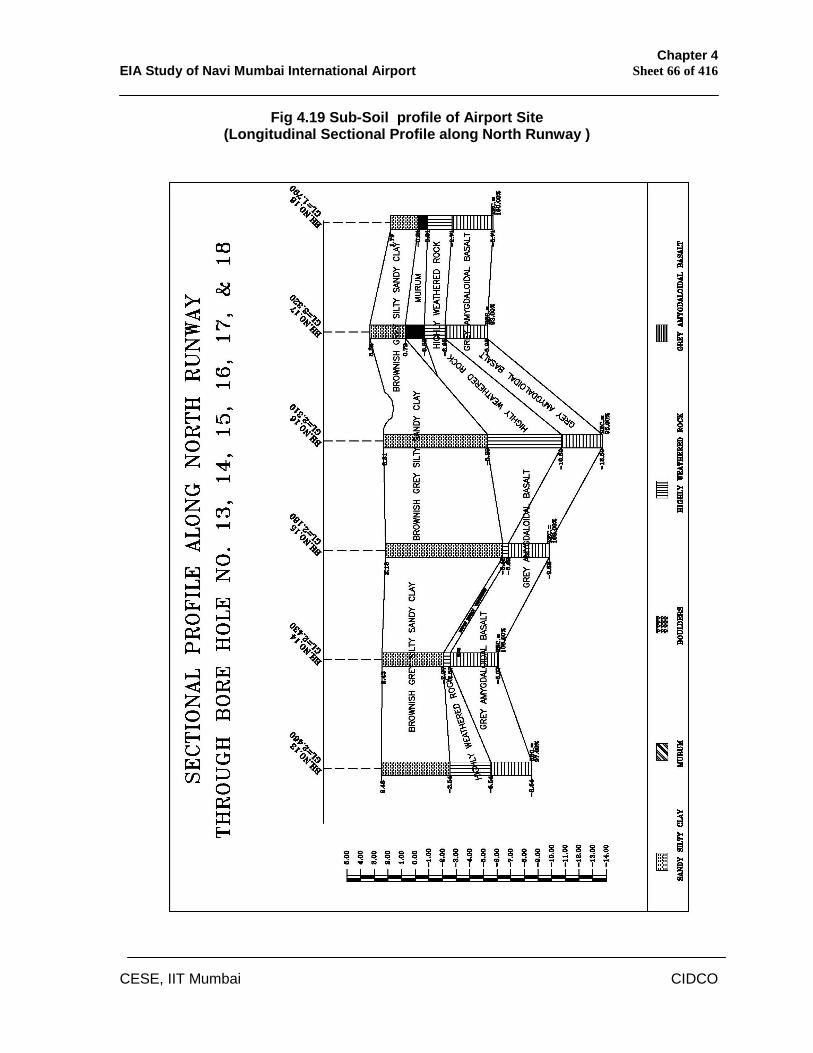
Chapter 4 EIA Study of Navi Mumbai International Airport Sheet 66 of 416
CESE, IIT Mumbai CIDCO
Fig 4.19 Sub-Soil profile of Airport Site (Longitudinal Sectional Profile along North Runway )
Chapter 4 EIA Study of Navi Mumbai International Airport Sheet 67 of 416
CESE, IIT Mumbai CIDCO
The sub-soil profile under Northern runway consist of sand and silt layer varying
from 2.0 mt. and extending upto 8.00 mt. followed by murum/weather rock/soft
rock about 0.5 to 5.0 mt. and finally the basaltic rock varying from 4.4 m. to
approx. 12 mt. from the ground.
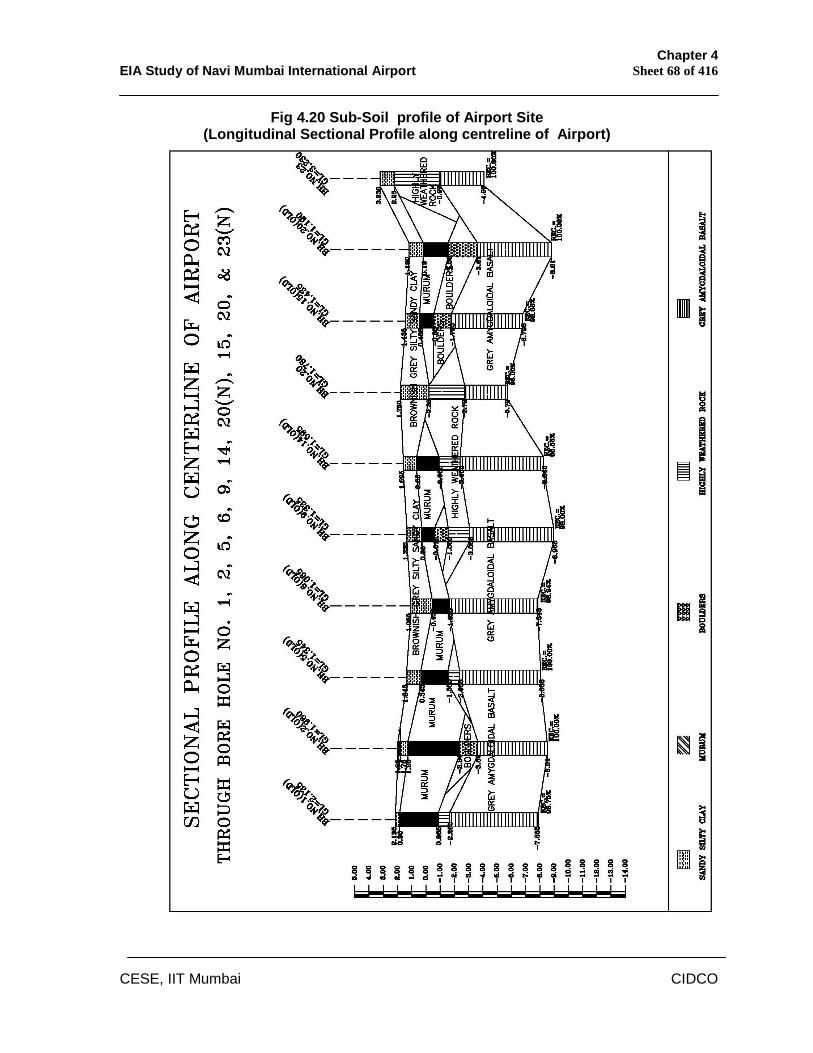
Chapter 4 EIA Study of Navi Mumbai International Airport Sheet 68 of 416
CESE, IIT Mumbai CIDCO
Fig 4.20 Sub-Soil profile of Airport Site (Longitudinal Sectional Profile along centreline of Airport)
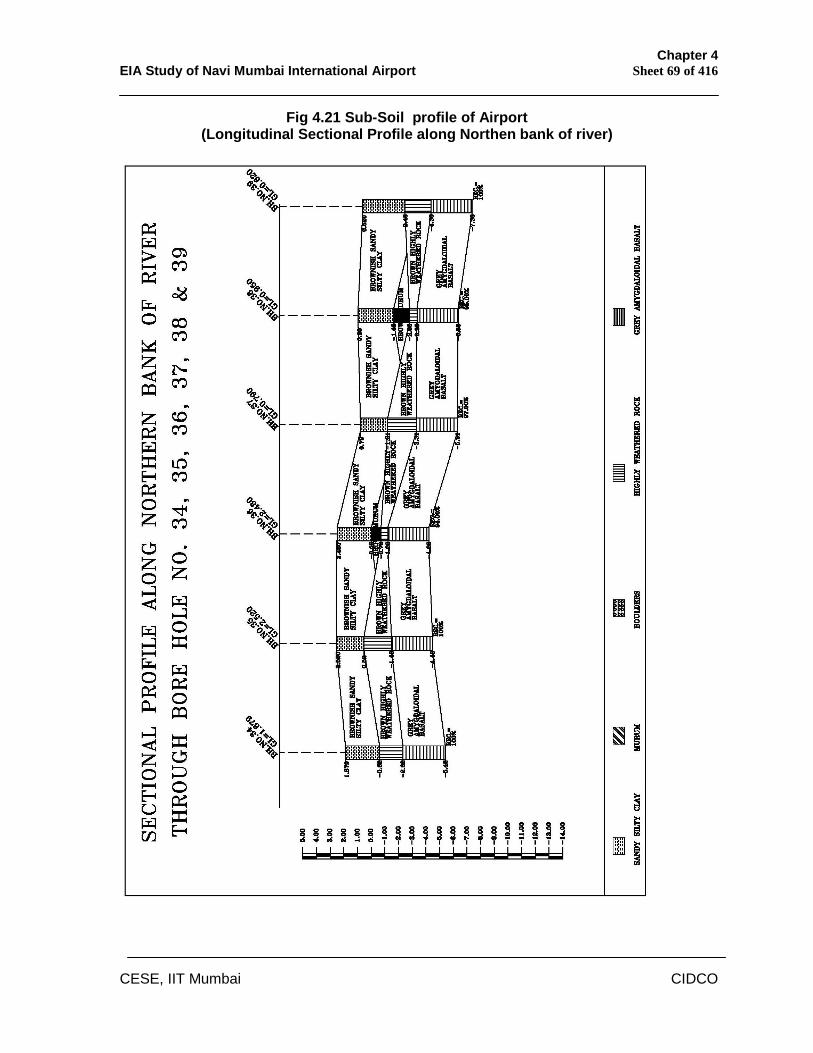
Chapter 4 EIA Study of Navi Mumbai International Airport Sheet 69 of 416
CESE, IIT Mumbai CIDCO
Fig 4.21 Sub-Soil profile of Airport (Longitudinal Sectional Profile along Northen bank of river)
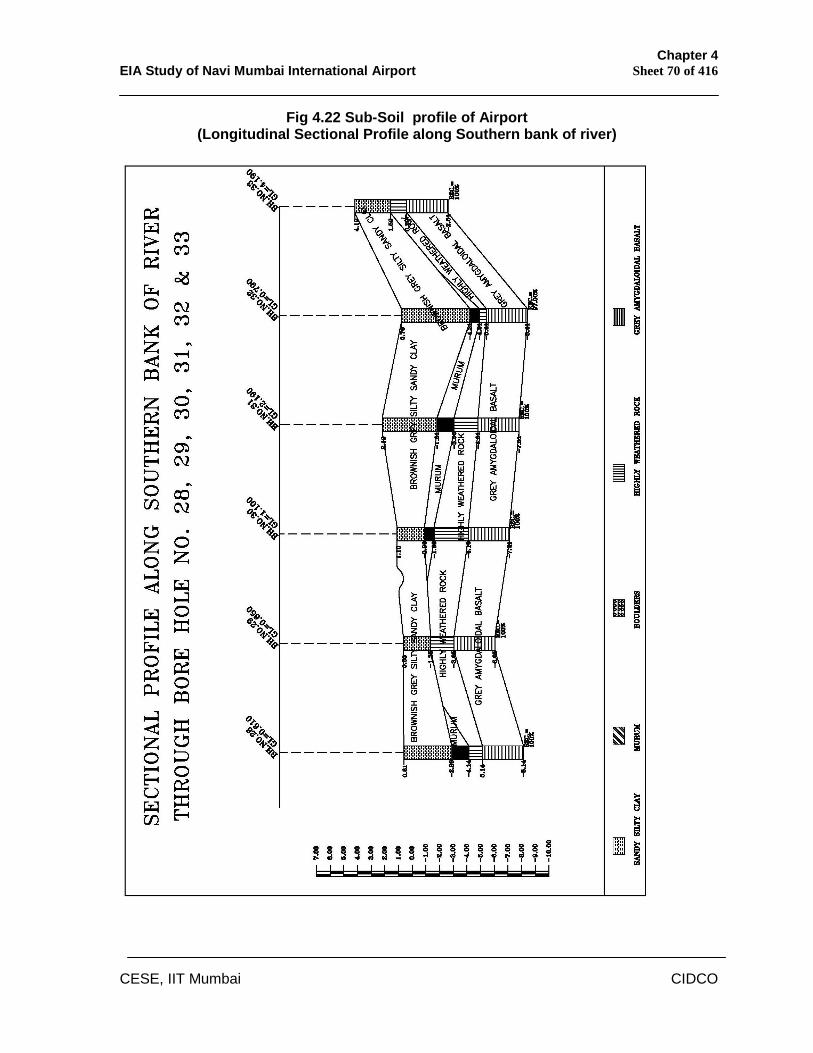
Chapter 4 EIA Study of Navi Mumbai International Airport Sheet 70 of 416
CESE, IIT Mumbai CIDCO
Fig 4.22 Sub-Soil profile of Airport (Longitudinal Sectional Profile along Southern bank of river)
Chapter 4 EIA Study of Navi Mumbai International Airport Sheet 71 of 416
CESE, IIT Mumbai CIDCO
4.8 Water Environment
4.8.1 Water Quality
Water quality plays an important role in the life of humans, plants and
animals; it is used for survival, recreation and transportation etc. Water
also contains many ions, some of which are beneficial, and others that
are harmful. Excessive amounts of any particular contaminant can result
in imbalances in the water chemistry and destroy ecosystems. Long-term
effects of this pollution can harm the food chain, and affect recreational
activities.
i) Marine Water
Marine water quality of the airport area was studied by monitoring at
thirteen stations viz, W1 to W13. Ten stations were in the Gadhi River,
two stations were in Panvel creek and eight stations were in Ulwe River.
Sampling has been done at all stations during December, 2007 (post
monsoon), April, 2008 (pre monsoon), and August, 2008 (monsoon). Post
monsoon season was considered from November, 2007 to January,
2008, pre monsoon season was considered from February, 2008 to May,
2008 and monsoon season was considered from June, 2008 to
September, 2008. The samples collected during post monsoon, pre
monsoon and monsoon seasons were preserved at 40C and then
analyzed for various physical, chemical and biological parameters.
Description for above mentioned water quality monitoring station is given
in Table 4.23.
The following parameters of the creek water quality were analyzed.
a) Physical: Total suspended solids, total dissolved solids, temperature,
depth and turbidity, pH, oil and grease.
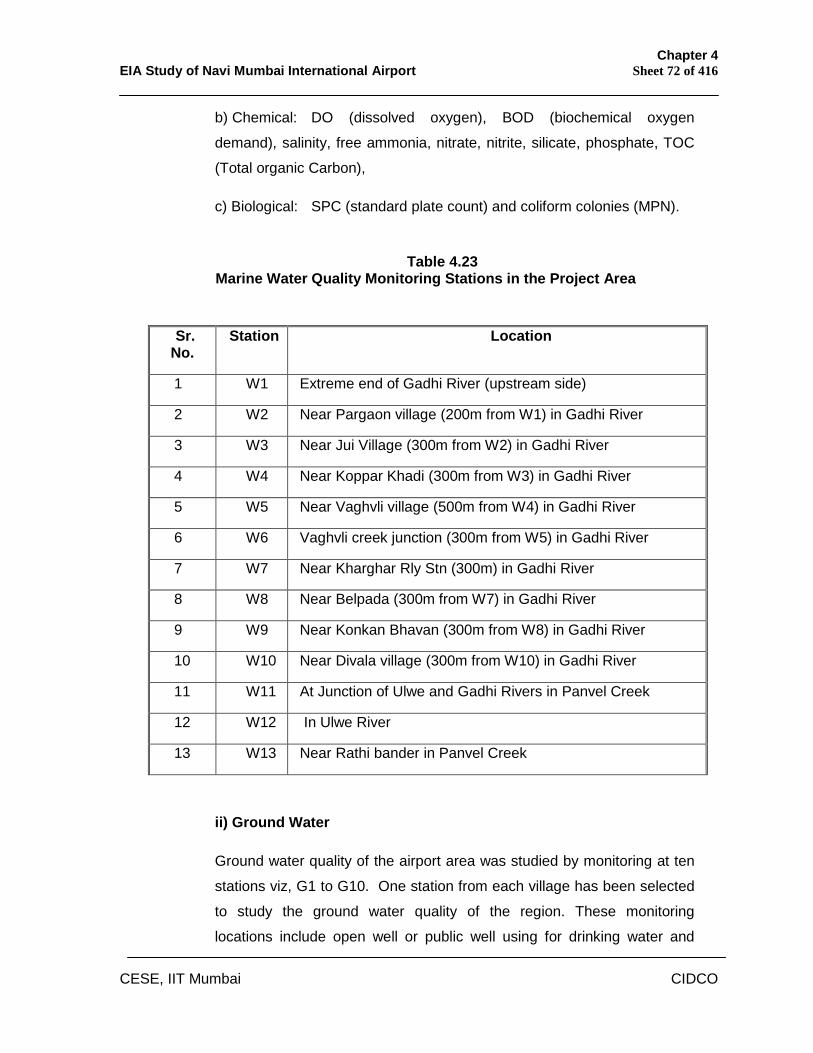
Chapter 4 EIA Study of Navi Mumbai International Airport Sheet 72 of 416
CESE, IIT Mumbai CIDCO
b) Chemical: DO (dissolved oxygen), BOD (biochemical oxygen
demand), salinity, free ammonia, nitrate, nitrite, silicate, phosphate, TOC
(Total organic Carbon),
c) Biological: SPC (standard plate count) and coliform colonies (MPN).
Table 4.23 Marine Water Quality Monitoring Stations in the Project Area
Sr. No.
Station Location
1 W1 Extreme end of Gadhi River (upstream side)
2 W2 Near Pargaon village (200m from W1) in Gadhi River
3 W3 Near Jui Village (300m from W2) in Gadhi River
4 W4 Near Koppar Khadi (300m from W3) in Gadhi River
5 W5 Near Vaghvli village (500m from W4) in Gadhi River
6 W6 Vaghvli creek junction (300m from W5) in Gadhi River
7 W7 Near Kharghar Rly Stn (300m) in Gadhi River
8 W8 Near Belpada (300m from W7) in Gadhi River
9 W9 Near Konkan Bhavan (300m from W8) in Gadhi River
10 W10 Near Divala village (300m from W10) in Gadhi River
11 W11 At Junction of Ulwe and Gadhi Rivers in Panvel Creek
12 W12 In Ulwe River
13 W13 Near Rathi bander in Panvel Creek
ii) Ground Water
Ground water quality of the airport area was studied by monitoring at ten
stations viz, G1 to G10. One station from each village has been selected
to study the ground water quality of the region. These monitoring
locations include open well or public well using for drinking water and
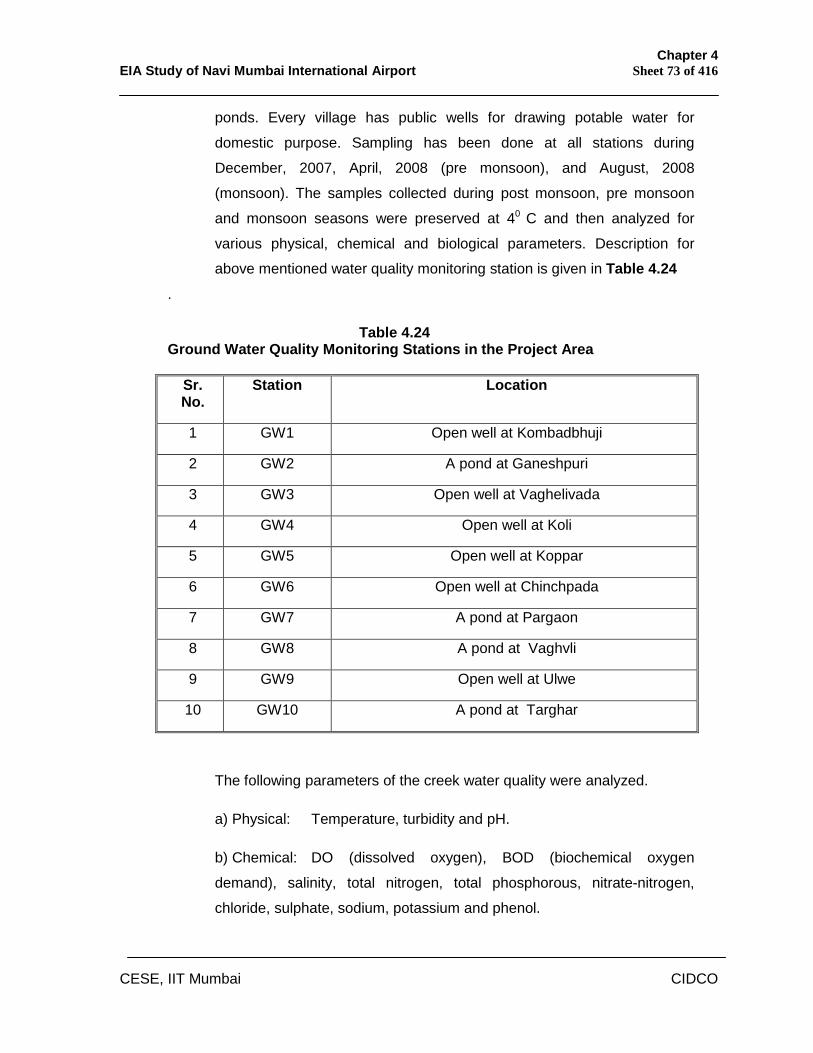
Chapter 4 EIA Study of Navi Mumbai International Airport Sheet 73 of 416
CESE, IIT Mumbai CIDCO
ponds. Every village has public wells for drawing potable water for
domestic purpose. Sampling has been done at all stations during
December, 2007, April, 2008 (pre monsoon), and August, 2008
(monsoon). The samples collected during post monsoon, pre monsoon
and monsoon seasons were preserved at 40 C and then analyzed for
various physical, chemical and biological parameters. Description for
above mentioned water quality monitoring station is given in Table 4.24 .
Table 4.24 Ground Water Quality Monitoring Stations in the Project Area
Sr. No.
Station Location
1 GW1 Open well at Kombadbhuji
2 GW2 A pond at Ganeshpuri
3 GW3 Open well at Vaghelivada
4 GW4 Open well at Koli
5 GW5 Open well at Koppar
6 GW6 Open well at Chinchpada
7 GW7 A pond at Pargaon
8 GW8 A pond at Vaghvli
9 GW9 Open well at Ulwe
10 GW10 A pond at Targhar
The following parameters of the creek water quality were analyzed.
a) Physical: Temperature, turbidity and pH.
b) Chemical: DO (dissolved oxygen), BOD (biochemical oxygen
demand), salinity, total nitrogen, total phosphorous, nitrate-nitrogen,
chloride, sulphate, sodium, potassium and phenol.
Chapter 4 EIA Study of Navi Mumbai International Airport Sheet 74 of 416
CESE, IIT Mumbai CIDCO
c) Biological: SPC (standard plate count) and coliform colonies (MPN).
The selected parameters have specific environmental significance from
the point of view for conserving natural ecosystem and indicative of
pollution. Parameters selected for assessing ground water quality
indicate the suitability of the water source for drinking or bathing purpose
or other domestic purpose. Levels of nutrients, heavy metals can provide
information on probability of eutrophication, toxicity to fish,
bioaccumulation of contaminants in fish tissue thereby entering bio-
geochemical cycle.
Extent of deposition of these non-biodegradable toxic contaminants will
decide its impact on living organisms, as the study zone can be fish
spawning and breeding grounds. Microbial quality will indicate suitability
of water for contact recreation, drinking and bathing. Water quality
analysis can be compared with stipulated standards to find out extent of
compliance with standards.
4.8.2 Water Quality Index
Water Quality Monitoring data consists of routine measurements of
physical, chemical and biological variables that are intended to give
insight into aquatic environment. Once the data is collected, there is a
further need to translate it into a form that is easily understood and
effectively interpreted. Thus, Water Quality Index (WQI) plays an
important role in such translation processes [CPCB, 1986-87]. National
Sanitation Foundation Water Quality Index (1974) has been widely field
tested and applied to data from a number of different geographical areas.
It has following mathematical structure:
Water Quality Index ( IW i
n
iiWQI
1
)
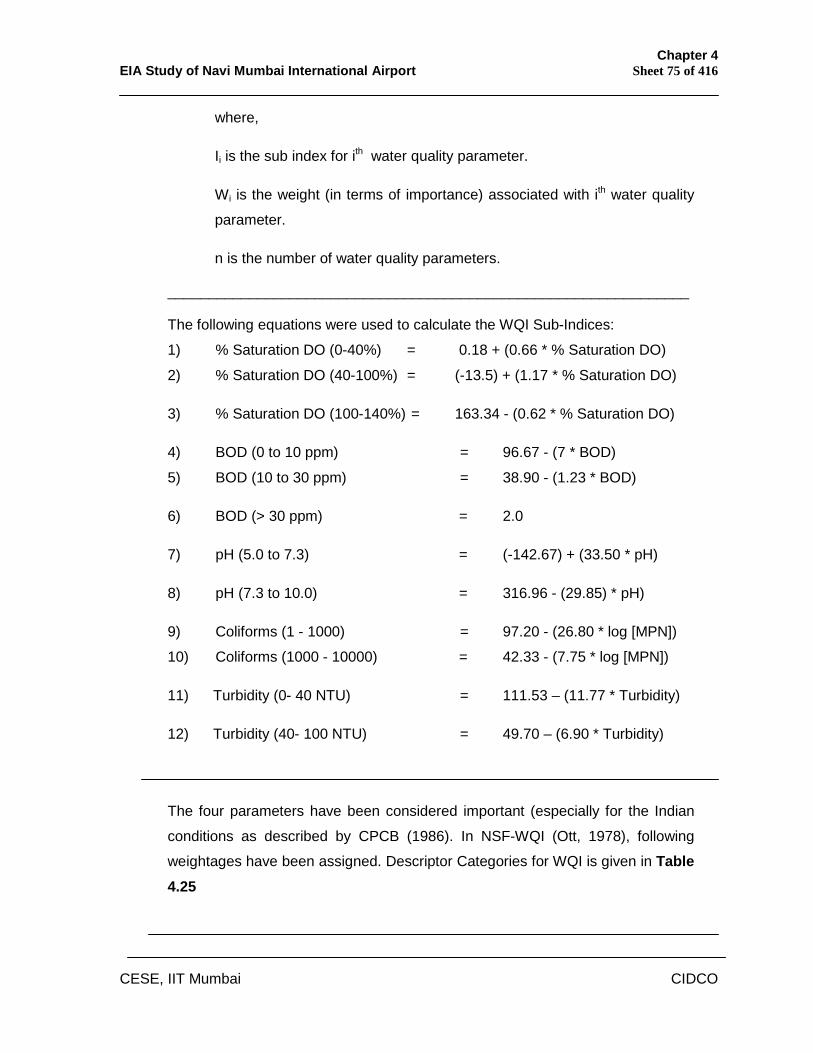
Chapter 4 EIA Study of Navi Mumbai International Airport Sheet 75 of 416
CESE, IIT Mumbai CIDCO
where,
Ii is the sub index for ith water quality parameter.
Wi is the weight (in terms of importance) associated with ith water quality
parameter.
n is the number of water quality parameters.
________________________________________________________________
The following equations were used to calculate the WQI Sub-Indices:
1) % Saturation DO (0-40%) = 0.18 + (0.66 * % Saturation DO)
2) % Saturation DO (40-100%) = (-13.5) + (1.17 * % Saturation DO)
3) % Saturation DO (100-140%) = 163.34 - (0.62 * % Saturation DO)
4) BOD (0 to 10 ppm) = 96.67 - (7 * BOD)
5) BOD (10 to 30 ppm) = 38.90 - (1.23 * BOD)
6) BOD (> 30 ppm) = 2.0
7) pH (5.0 to 7.3) = (-142.67) + (33.50 * pH)
8) pH (7.3 to 10.0) = 316.96 - (29.85) * pH)
9) Coliforms (1 - 1000) = 97.20 - (26.80 * log [MPN])
10) Coliforms (1000 - 10000) = 42.33 - (7.75 * log [MPN])
11) Turbidity (0- 40 NTU) = 111.53 – (11.77 * Turbidity)
12) Turbidity (40- 100 NTU) = 49.70 – (6.90 * Turbidity)
The four parameters have been considered important (especially for the Indian
conditions as described by CPCB (1986). In NSF-WQI (Ott, 1978), following
weightages have been assigned. Descriptor Categories for WQI is given in Table 4.25
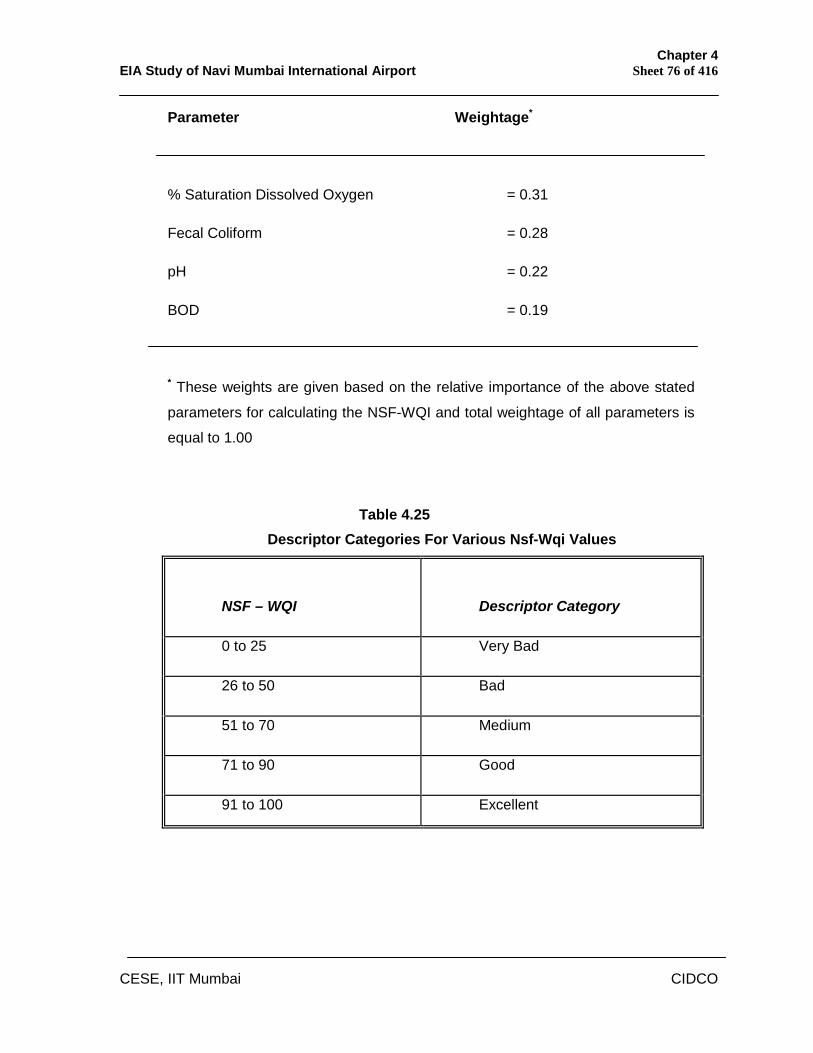
Chapter 4 EIA Study of Navi Mumbai International Airport Sheet 76 of 416
CESE, IIT Mumbai CIDCO
Parameter Weightage*
% Saturation Dissolved Oxygen = 0.31
Fecal Coliform = 0.28
pH = 0.22
BOD = 0.19
* These weights are given based on the relative importance of the above stated
parameters for calculating the NSF-WQI and total weightage of all parameters is
equal to 1.00
Table 4.25 Descriptor Categories For Various Nsf-Wqi Values
NSF – WQI
Descriptor Category
0 to 25 Very Bad
26 to 50 Bad
51 to 70 Medium
71 to 90 Good
91 to 100 Excellent
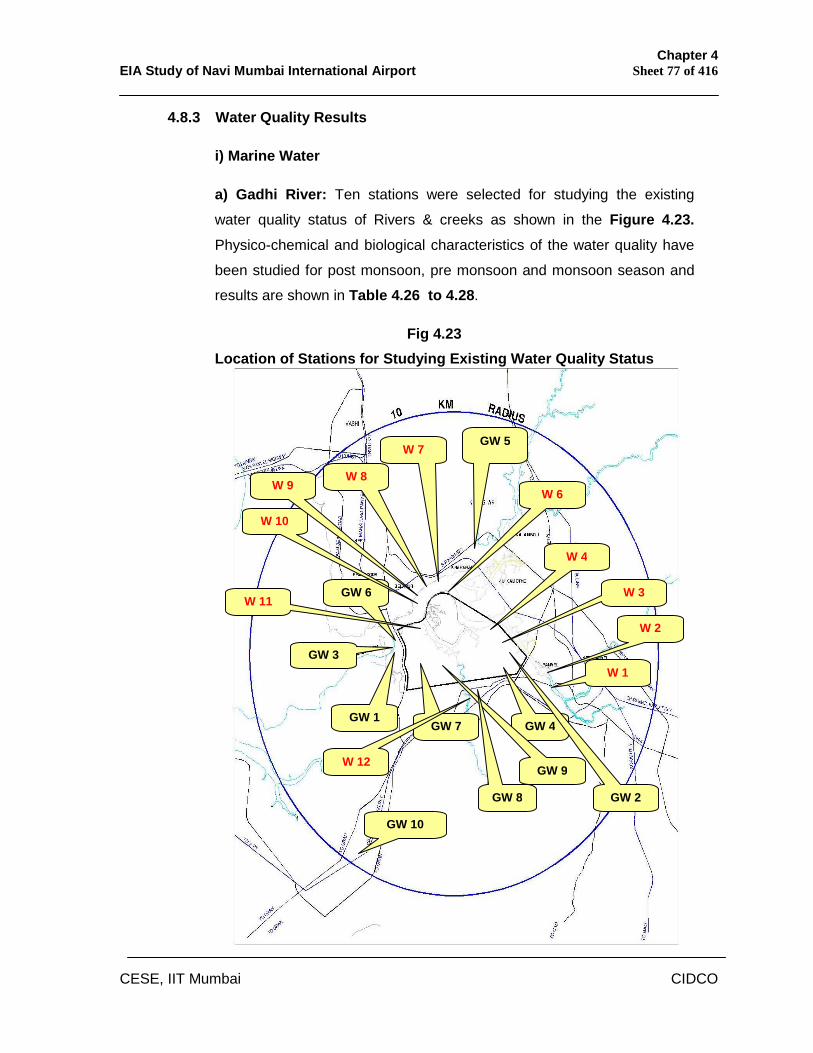
Chapter 4 EIA Study of Navi Mumbai International Airport Sheet 77 of 416
CESE, IIT Mumbai CIDCO
4.8.3 Water Quality Results
i) Marine Water
a) Gadhi River: Ten stations were selected for studying the existing
water quality status of Rivers & creeks as shown in the Figure 4.23. Physico-chemical and biological characteristics of the water quality have
been studied for post monsoon, pre monsoon and monsoon season and
results are shown in Table 4.26 to 4.28.
Fig 4.23 Location of Stations for Studying Existing Water Quality Status
GW 4
GW 6
GW 3
GW 7
GW 2
GW 1
GW 10
GW 9
GW 5
GW 8
W 1
W 12
W 3
W 10
W 9 W 8
W 7
W 6
W 4
W 11
W 2
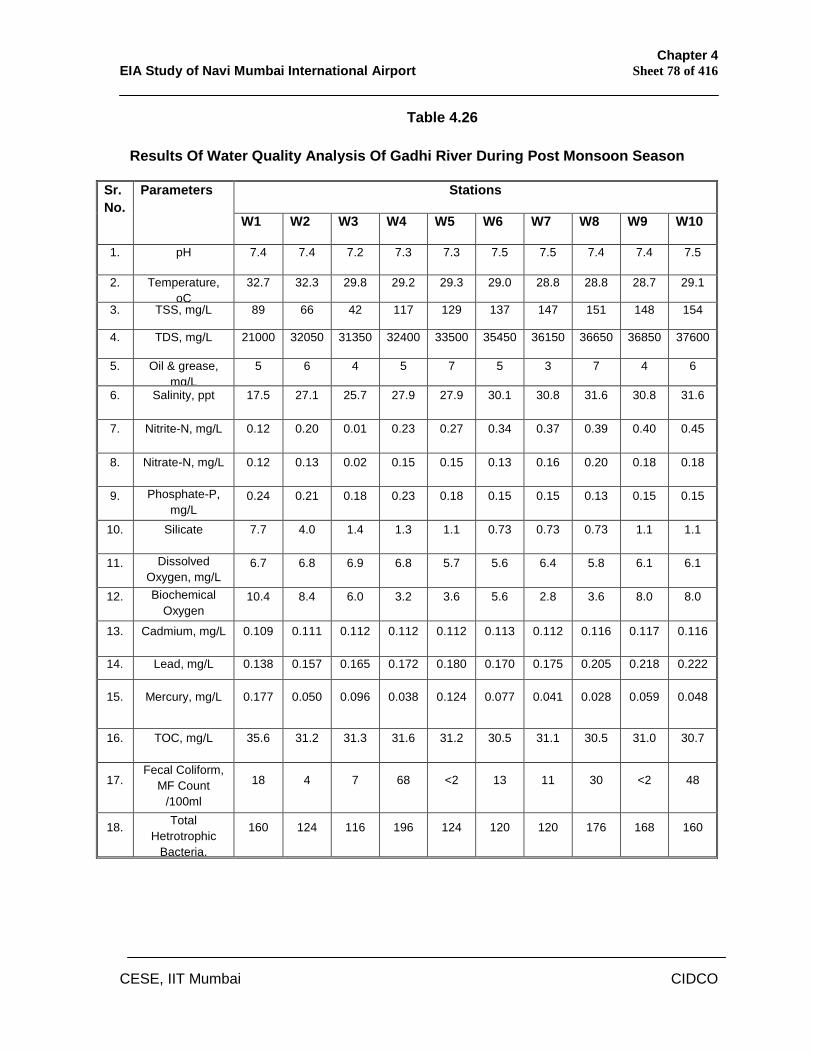
Chapter 4 EIA Study of Navi Mumbai International Airport Sheet 78 of 416
CESE, IIT Mumbai CIDCO
Table 4.26
Results Of Water Quality Analysis Of Gadhi River During Post Monsoon Season
Stations Sr. No.
Parameters
W1 W2 W3 W4 W5 W6 W7 W8 W9 W10
1. pH 7.4 7.4 7.2 7.3 7.3 7.5 7.5 7.4 7.4 7.5
2. Temperature, oC
32.7 32.3 29.8 29.2 29.3 29.0 28.8 28.8 28.7 29.1
3. TSS, mg/L 89 66 42 117 129 137 147 151 148 154
4. TDS, mg/L 21000 32050 31350 32400 33500 35450 36150 36650 36850 37600
5. Oil & grease, mg/L
5 6 4 5 7 5 3 7 4 6
6. Salinity, ppt 17.5 27.1 25.7 27.9 27.9 30.1 30.8 31.6 30.8 31.6
7. Nitrite-N, mg/L 0.12 0.20 0.01 0.23 0.27 0.34 0.37 0.39 0.40 0.45
8. Nitrate-N, mg/L 0.12 0.13 0.02 0.15 0.15 0.13 0.16 0.20 0.18 0.18
9. Phosphate-P, mg/L
0.24 0.21 0.18 0.23 0.18 0.15 0.15 0.13 0.15 0.15
10. Silicate 7.7 4.0 1.4 1.3 1.1 0.73 0.73 0.73 1.1 1.1
11. Dissolved Oxygen, mg/L
6.7 6.8 6.9 6.8 5.7 5.6 6.4 5.8 6.1 6.1
12. Biochemical Oxygen
Demand, mg/L
10.4 8.4 6.0 3.2 3.6 5.6 2.8 3.6 8.0 8.0
13. Cadmium, mg/L 0.109 0.111 0.112 0.112 0.112 0.113 0.112 0.116 0.117 0.116
14. Lead, mg/L 0.138 0.157 0.165 0.172 0.180 0.170 0.175 0.205 0.218 0.222
15. Mercury, mg/L 0.177 0.050 0.096 0.038 0.124 0.077 0.041 0.028 0.059 0.048
16. TOC, mg/L 35.6 31.2 31.3 31.6 31.2 30.5 31.1 30.5 31.0 30.7
17. Fecal Coliform,
MF Count /100ml
18 4 7 68 <2 13 11 30 <2 48
18. Total Hetrotrophic
Bacteria,
160 124 116 196 124 120 120 176 168 160
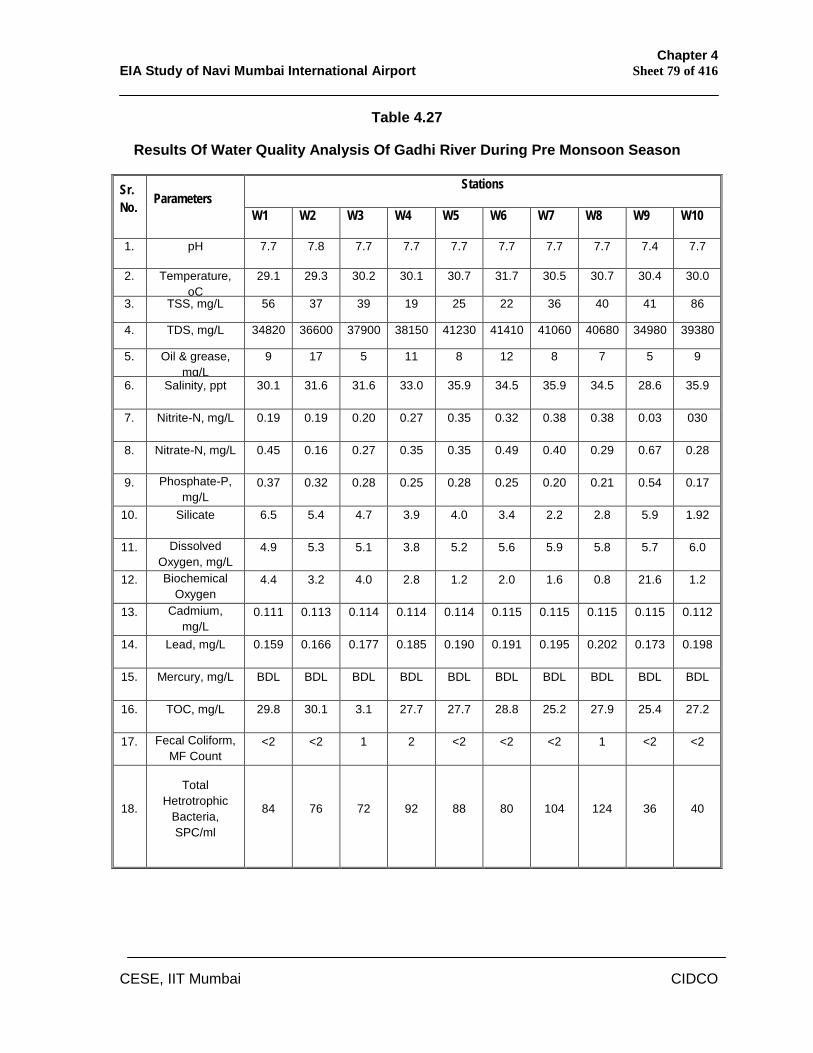
Chapter 4 EIA Study of Navi Mumbai International Airport Sheet 79 of 416
CESE, IIT Mumbai CIDCO
Table 4.27
Results Of Water Quality Analysis Of Gadhi River During Pre Monsoon Season
Stations Sr. No. Parameters
W1 W2 W3 W4 W5 W6 W7 W8 W9 W10
1. pH 7.7 7.8 7.7 7.7 7.7 7.7 7.7 7.7 7.4 7.7
2. Temperature, oC
29.1 29.3 30.2 30.1 30.7 31.7 30.5 30.7 30.4 30.0
3. TSS, mg/L 56 37 39 19 25 22 36 40 41 86
4. TDS, mg/L 34820 36600 37900 38150 41230 41410 41060 40680 34980 39380
5. Oil & grease, mg/L
9 17 5 11 8 12 8 7 5 9
6. Salinity, ppt 30.1 31.6 31.6 33.0 35.9 34.5 35.9 34.5 28.6 35.9
7. Nitrite-N, mg/L 0.19 0.19 0.20 0.27 0.35 0.32 0.38 0.38 0.03 030
8. Nitrate-N, mg/L 0.45 0.16 0.27 0.35 0.35 0.49 0.40 0.29 0.67 0.28
9. Phosphate-P, mg/L
0.37 0.32 0.28 0.25 0.28 0.25 0.20 0.21 0.54 0.17
10. Silicate 6.5 5.4 4.7 3.9 4.0 3.4 2.2 2.8 5.9 1.92
11. Dissolved Oxygen, mg/L
4.9 5.3 5.1 3.8 5.2 5.6 5.9 5.8 5.7 6.0
12. Biochemical Oxygen
4.4 3.2 4.0 2.8 1.2 2.0 1.6 0.8 21.6 1.2
13. Cadmium, mg/L
0.111 0.113 0.114 0.114 0.114 0.115 0.115 0.115 0.115 0.112
14. Lead, mg/L 0.159 0.166 0.177 0.185 0.190 0.191 0.195 0.202 0.173 0.198
15. Mercury, mg/L BDL BDL BDL BDL BDL BDL BDL BDL BDL BDL
16. TOC, mg/L 29.8 30.1 3.1 27.7 27.7 28.8 25.2 27.9 25.4 27.2
17. Fecal Coliform, MF Count
<2 <2 1 2 <2 <2 <2 1 <2 <2
18.
Total Hetrotrophic
Bacteria, SPC/ml
84 76 72 92 88 80 104 124 36 40
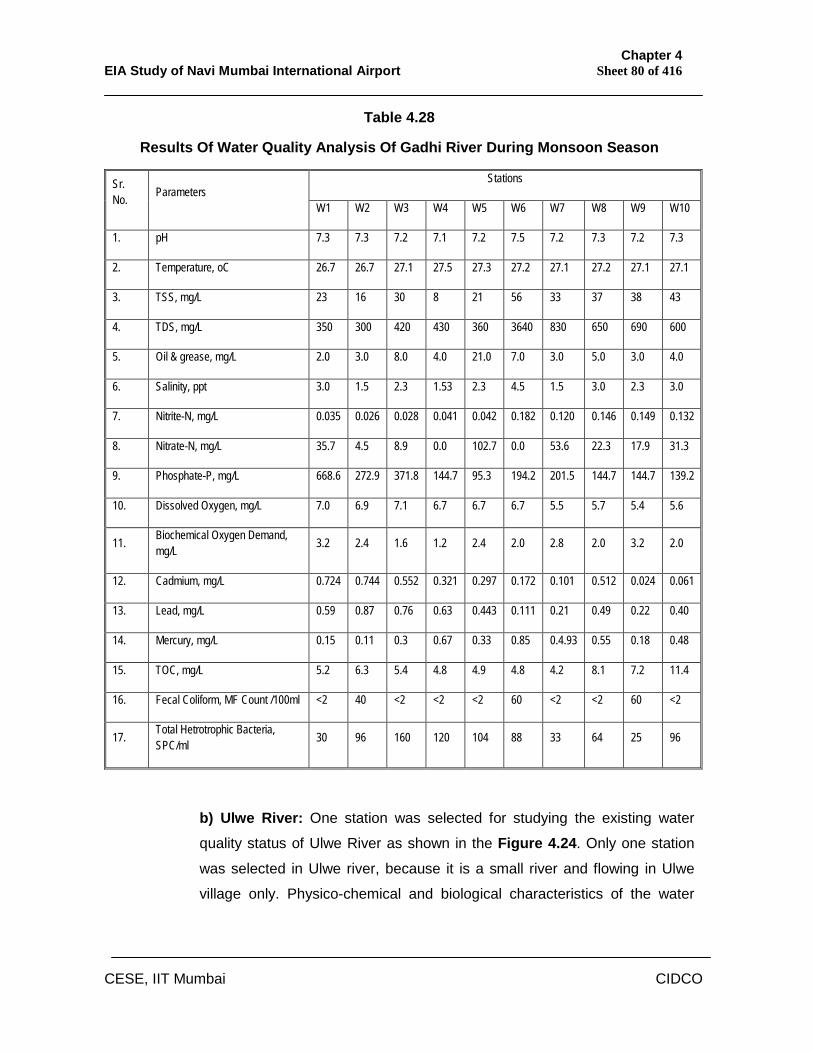
Chapter 4 EIA Study of Navi Mumbai International Airport Sheet 80 of 416
CESE, IIT Mumbai CIDCO
Table 4.28
Results Of Water Quality Analysis Of Gadhi River During Monsoon Season
Stations Sr. No. Parameters
W1 W2 W3 W4 W5 W6 W7 W8 W9 W10
1. pH 7.3 7.3 7.2 7.1 7.2 7.5 7.2 7.3 7.2 7.3
2. Temperature, oC 26.7 26.7 27.1 27.5 27.3 27.2 27.1 27.2 27.1 27.1
3. TSS, mg/L 23 16 30 8 21 56 33 37 38 43
4. TDS, mg/L 350 300 420 430 360 3640 830 650 690 600
5. Oil & grease, mg/L 2.0 3.0 8.0 4.0 21.0 7.0 3.0 5.0 3.0 4.0
6. Salinity, ppt 3.0 1.5 2.3 1.53 2.3 4.5 1.5 3.0 2.3 3.0
7. Nitrite-N, mg/L 0.035 0.026 0.028 0.041 0.042 0.182 0.120 0.146 0.149 0.132
8. Nitrate-N, mg/L 35.7 4.5 8.9 0.0 102.7 0.0 53.6 22.3 17.9 31.3
9. Phosphate-P, mg/L 668.6 272.9 371.8 144.7 95.3 194.2 201.5 144.7 144.7 139.2
10. Dissolved Oxygen, mg/L 7.0 6.9 7.1 6.7 6.7 6.7 5.5 5.7 5.4 5.6
11. Biochemical Oxygen Demand, mg/L 3.2 2.4 1.6 1.2 2.4 2.0 2.8 2.0 3.2 2.0
12. Cadmium, mg/L 0.724 0.744 0.552 0.321 0.297 0.172 0.101 0.512 0.024 0.061
13. Lead, mg/L 0.59 0.87 0.76 0.63 0.443 0.111 0.21 0.49 0.22 0.40
14. Mercury, mg/L 0.15 0.11 0.3 0.67 0.33 0.85 0.4.93 0.55 0.18 0.48
15. TOC, mg/L 5.2 6.3 5.4 4.8 4.9 4.8 4.2 8.1 7.2 11.4
16. Fecal Coliform, MF Count /100ml <2 40 <2 <2 <2 60 <2 <2 60 <2
17. Total Hetrotrophic Bacteria, SPC/ml 30 96 160 120 104 88 33 64 25 96
b) Ulwe River: One station was selected for studying the existing water
quality status of Ulwe River as shown in the Figure 4.24. Only one station
was selected in Ulwe river, because it is a small river and flowing in Ulwe
village only. Physico-chemical and biological characteristics of the water
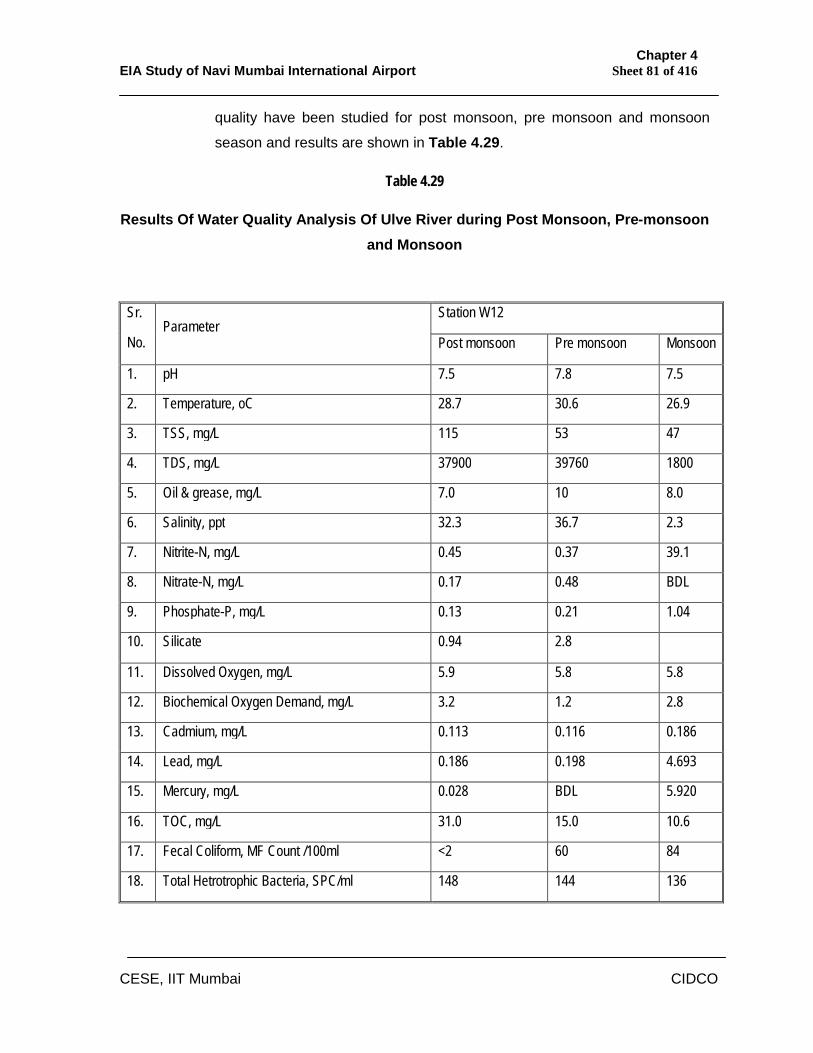
Chapter 4 EIA Study of Navi Mumbai International Airport Sheet 81 of 416
CESE, IIT Mumbai CIDCO
quality have been studied for post monsoon, pre monsoon and monsoon
season and results are shown in Table 4.29.
Table 4.29
Results Of Water Quality Analysis Of Ulve River during Post Monsoon, Pre-monsoon and Monsoon
Station W12 Sr.
No. Parameter
Post monsoon Pre monsoon Monsoon
1. pH 7.5 7.8 7.5
2. Temperature, oC 28.7 30.6 26.9
3. TSS, mg/L 115 53 47
4. TDS, mg/L 37900 39760 1800
5. Oil & grease, mg/L 7.0 10 8.0
6. Salinity, ppt 32.3 36.7 2.3
7. Nitrite-N, mg/L 0.45 0.37 39.1
8. Nitrate-N, mg/L 0.17 0.48 BDL
9. Phosphate-P, mg/L 0.13 0.21 1.04
10. Silicate 0.94 2.8
11. Dissolved Oxygen, mg/L 5.9 5.8 5.8
12. Biochemical Oxygen Demand, mg/L 3.2 1.2 2.8
13. Cadmium, mg/L 0.113 0.116 0.186
14. Lead, mg/L 0.186 0.198 4.693
15. Mercury, mg/L 0.028 BDL 5.920
16. TOC, mg/L 31.0 15.0 10.6
17. Fecal Coliform, MF Count /100ml <2 60 84
18. Total Hetrotrophic Bacteria, SPC/ml 148 144 136
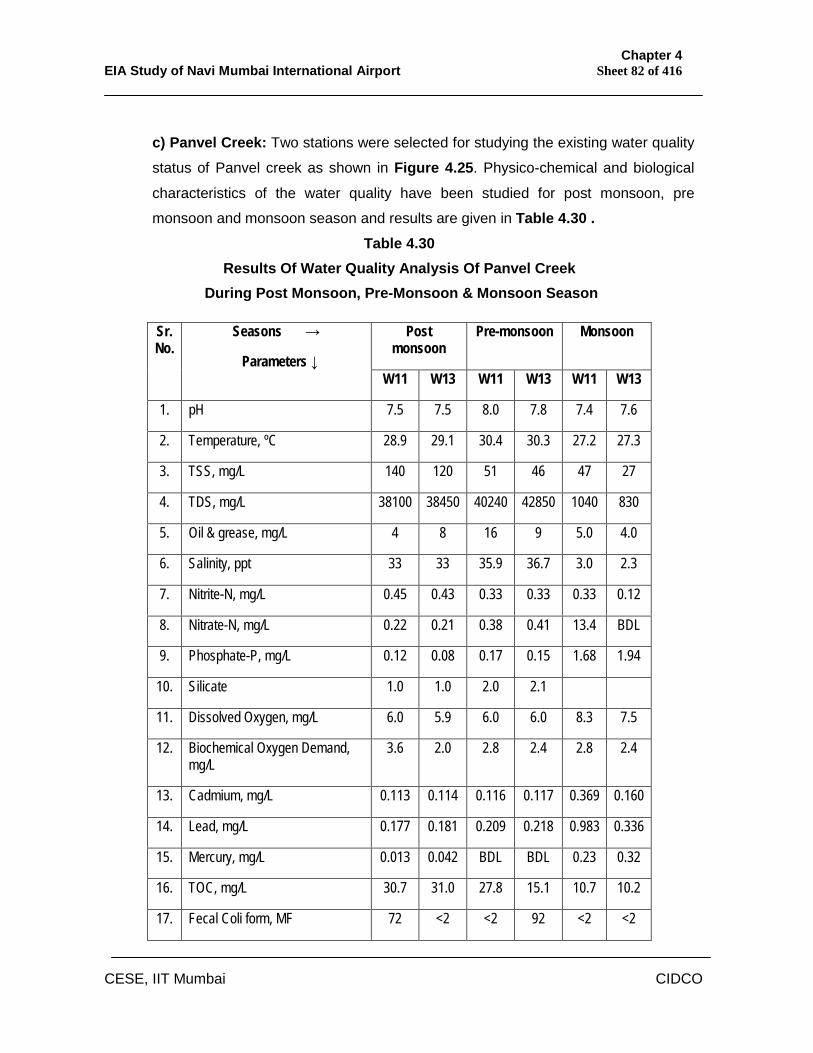
Chapter 4 EIA Study of Navi Mumbai International Airport Sheet 82 of 416
CESE, IIT Mumbai CIDCO
c) Panvel Creek: Two stations were selected for studying the existing water quality
status of Panvel creek as shown in Figure 4.25. Physico-chemical and biological
characteristics of the water quality have been studied for post monsoon, pre
monsoon and monsoon season and results are given in Table 4.30 . Table 4.30
Results Of Water Quality Analysis Of Panvel Creek During Post Monsoon, Pre-Monsoon & Monsoon Season
Post monsoon
Pre-monsoon Monsoon Sr. No.
Seasons →
Parameters ↓ W11 W13 W11 W13 W11 W13
1. pH 7.5 7.5 8.0 7.8 7.4 7.6
2. Temperature, ºC 28.9 29.1 30.4 30.3 27.2 27.3
3. TSS, mg/L 140 120 51 46 47 27
4. TDS, mg/L 38100 38450 40240 42850 1040 830
5. Oil & grease, mg/L 4 8 16 9 5.0 4.0
6. Salinity, ppt 33 33 35.9 36.7 3.0 2.3
7. Nitrite-N, mg/L 0.45 0.43 0.33 0.33 0.33 0.12
8. Nitrate-N, mg/L 0.22 0.21 0.38 0.41 13.4 BDL
9. Phosphate-P, mg/L 0.12 0.08 0.17 0.15 1.68 1.94
10. Silicate 1.0 1.0 2.0 2.1
11. Dissolved Oxygen, mg/L 6.0 5.9 6.0 6.0 8.3 7.5
12. Biochemical Oxygen Demand, mg/L
3.6 2.0 2.8 2.4 2.8 2.4
13. Cadmium, mg/L 0.113 0.114 0.116 0.117 0.369 0.160
14. Lead, mg/L 0.177 0.181 0.209 0.218 0.983 0.336
15. Mercury, mg/L 0.013 0.042 BDL BDL 0.23 0.32
16. TOC, mg/L 30.7 31.0 27.8 15.1 10.7 10.2
17. Fecal Coli form, MF 72 <2 <2 92 <2 <2
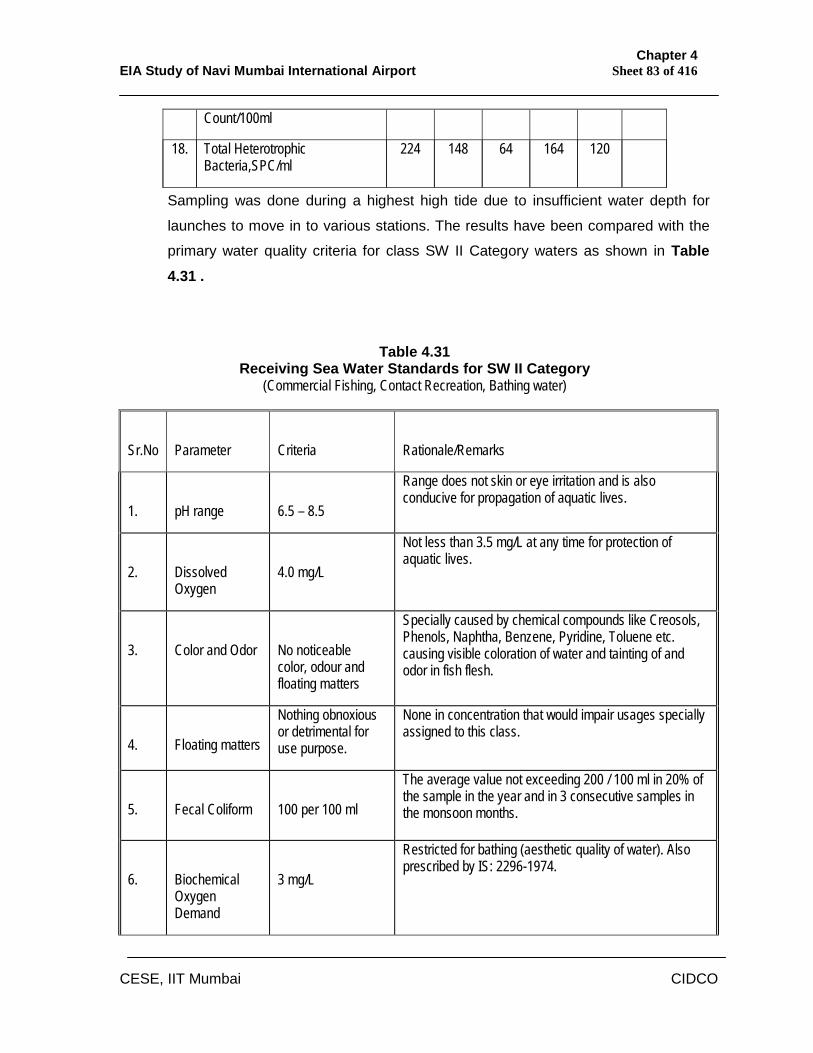
Chapter 4 EIA Study of Navi Mumbai International Airport Sheet 83 of 416
CESE, IIT Mumbai CIDCO
Sampling was done during a highest high tide due to insufficient water depth for
launches to move in to various stations. The results have been compared with the
primary water quality criteria for class SW II Category waters as shown in Table 4.31 .
Table 4.31 Receiving Sea Water Standards for SW II Category
(Commercial Fishing, Contact Recreation, Bathing water)
Sr.No
Parameter
Criteria
Rationale/Remarks
1.
pH range
6.5 – 8.5
Range does not skin or eye irritation and is also conducive for propagation of aquatic lives.
2.
Dissolved Oxygen
4.0 mg/L
Not less than 3.5 mg/L at any time for protection of aquatic lives.
3.
Color and Odor
No noticeable color, odour and floating matters
Specially caused by chemical compounds like Creosols, Phenols, Naphtha, Benzene, Pyridine, Toluene etc. causing visible coloration of water and tainting of and odor in fish flesh.
4.
Floating matters
Nothing obnoxious or detrimental for use purpose.
None in concentration that would impair usages specially assigned to this class.
5.
Fecal Coliform
100 per 100 ml
The average value not exceeding 200 / 100 ml in 20% of the sample in the year and in 3 consecutive samples in the monsoon months.
6.
Biochemical Oxygen Demand
3 mg/L
Restricted for bathing (aesthetic quality of water). Also prescribed by IS: 2296-1974.
Count/100ml
18. Total Heterotrophic Bacteria,SPC/ml
224 148 64 164 120
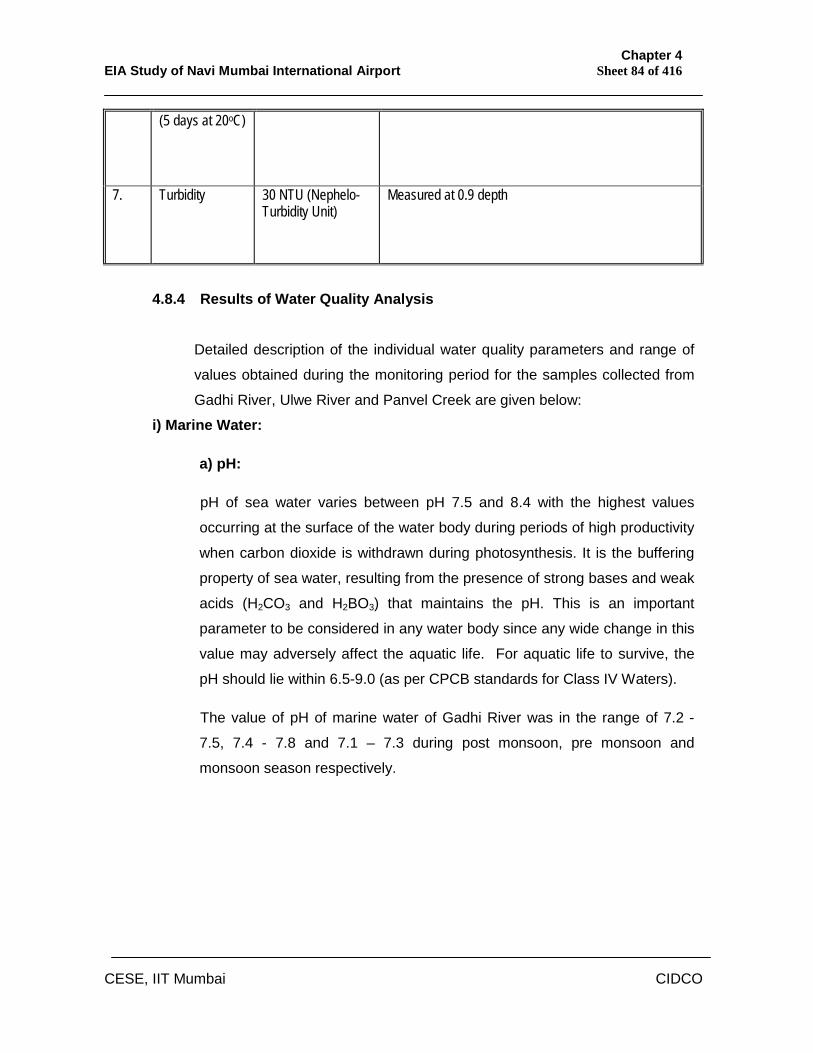
Chapter 4 EIA Study of Navi Mumbai International Airport Sheet 84 of 416
CESE, IIT Mumbai CIDCO
(5 days at 20oC)
7. Turbidity
30 NTU (Nephelo- Turbidity Unit)
Measured at 0.9 depth
4.8.4 Results of Water Quality Analysis
Detailed description of the individual water quality parameters and range of
values obtained during the monitoring period for the samples collected from
Gadhi River, Ulwe River and Panvel Creek are given below:
i) Marine Water:
a) pH:
pH of sea water varies between pH 7.5 and 8.4 with the highest values
occurring at the surface of the water body during periods of high productivity
when carbon dioxide is withdrawn during photosynthesis. It is the buffering
property of sea water, resulting from the presence of strong bases and weak
acids (H2CO3 and H2BO3) that maintains the pH. This is an important
parameter to be considered in any water body since any wide change in this
value may adversely affect the aquatic life. For aquatic life to survive, the
pH should lie within 6.5-9.0 (as per CPCB standards for Class IV Waters).
The value of pH of marine water of Gadhi River was in the range of 7.2 -
7.5, 7.4 - 7.8 and 7.1 – 7.3 during post monsoon, pre monsoon and
monsoon season respectively.
Chapter 4 EIA Study of Navi Mumbai International Airport Sheet 85 of 416
CESE, IIT Mumbai CIDCO
The value of pH of marine water of Ulwe River was 7.5, 7.8 and 7.5 during
post monsoon, pre monsoon and monsoon season respectively.
The value of pH of marine water of Panvel Creek was 7.5, 7.8 – 8.0 and 7.6
– 7.4 during post monsoon, pre monsoon and monsoon season
respectively.
The horizontal gradient was not much predominant at all the stations. The
range of the pH values of Gadhi River, Ulwe River and Panvel creek was
found to lie within the limits prescribed by CPCB for receiving water quality
standards SWII category. The observed pH values are favorable to maintain
a healthy aquatic community in the harbour waters.
b) Temperature
This is one of the most important parameters for the aquatic environment,
because almost all the physical, chemical and biological properties are
governed by it. Temperature limits the saturation values of solids and gases
that are dissolved in it. The rate of chemical reaction and other biological
activity such as corrosion or incrustation, BOD, photosynthesis, growth and
death of micro-organisms are all dependent on temperature. At all stations,
the variation in average temperature were in accordance with ambient air
temperature and time of the day.
The temperature was observed during day time. The value of temperature of
marine water of Gadhi River was in the range of 28.7 - 32.70C, 29.1 - 31.70C
and 26.7 – 27.50C during post monsoon, pre monsoon and monsoon
season respectively.
The value of temperature of marine water of Ulwe River was 28.7 0C, 30.60C
and 26.9 0C during post monsoon, pre monsoon and monsoon season
respectively.
The value of temperature of marine water of Panvel Creek was in the range
of 28.9 - 29.1 0C, 30.3 – 30.4 0C and 27.2 – 27.3 0C during post monsoon,
Chapter 4 EIA Study of Navi Mumbai International Airport Sheet 86 of 416
CESE, IIT Mumbai CIDCO
pre monsoon and monsoon season respectively. The change in temperature
was in accordance with air temperature.
Though temperature has a bearing on the saturation DO, the change in this
parameter did not affect the NSF-WQI significantly.
c) Total Suspended Solids (TSS)
Suspended particulate matter in the sea water originate from organic and
inorganic particles naturally present in water due to vertical mixing action in
sediments by tidal currents and through suspended solids brought in by
wastewater flows from domestic and industrial areas. Suspended solids
cause turbidity which in turn reduces the light penetrating capacity and
ultimately results in becoming an obstacle for the photosynthesis. High
concentration of TSS in sea water also affects its aesthetic value.
The value of TSS of marine water of Gadhi River was in the range of 42 -
154 mg/L, 19 - 86 mg/L and 8 - 56 mg/L during post monsoon, pre monsoon
and monsoon season respectively.
The value of TSS of marine water of Ulwe River was 115 mg/L, 53 mg/L and
47 mg/L during post monsoon, pre monsoon and monsoon season
respectively.
The value of TSS of marine water of Panvel Creek was in the range of 120 -
140 mg/L, 46– 51 mg/L and 27 - 47 mg/L during post monsoon, pre
monsoon and monsoon season respectively.
d) Total Dissolved Solids (TDS)
Total dissolved solid (TDS) is a measure of the total amount of all the
materials that are dissolved in water. These materials, both natural and
anthropogenic (made by humans), are mainly inorganic solids, with a minor
amount of organic material. Depending on the type of water, TDS can vary
greatly from a few milligrams per liter to percent levels (tens of thousands of
milligrams per liter). Seawater contains 3.5% (35,000 mg/L) TDS.
Chapter 4 EIA Study of Navi Mumbai International Airport Sheet 87 of 416
CESE, IIT Mumbai CIDCO
The value of TDS of marine water of Gadhi River was in the range of 21,000
– 37,600 mg/L, 34,820 – 41,410 mg/L and 300 - 3640 mg/L during post
monsoon, pre monsoon and monsoon season respectively.
The value of TDS of marine water of Ulwe River was 37,900 mg/L, 39,760
mg/L and 1800 mg/L during post monsoon, pre monsoon and monsoon
season respectively.
The value of TDS of marine water of Panvel Creek was in the range of
38,100 – 38,450 mg/L, 40,240– 42,850 mg/L and 830 - 1040 mg/L during
post monsoon, pre monsoon and monsoon season respectively.
e) Oil and Grease
Oil pollution at sea essentially takes place in two ways, either as large
quantities during a short period owing to accidents like sinking of oil ships,
collision of vessels or as small but continued amounts over a longer period
through pumping from oil barges or vessels at liquid cargo jetty. Discharge
of oil contaminated bilge water from fishing launches, passenger launches
etc. also contributes oil concentration in coastal water. Discharge of sewage
into sea water contributes grease concentration in inland water.
The value of oil and grease of marine water of Gadhi River was in the range
of 3 - 7 mg/L, 5 – 17 mg/L and 2 - 21 mg/L during post monsoon, pre
monsoon and monsoon season respectively.
The value of oil and grease of marine water of Ulwe River was 7 mg/L, 10
mg/L and 8.0 during post monsoon, pre monsoon and monsoon season
respectively.
The value of oil and grease of marine water of Panvel Creek was in the
range of 4 - 8 mg/L, 9 - 16 mg/L and 4 - 16 mg/L during post monsoon, pre
monsoon and monsoon season respectively. However, some fishing is done
by local villagers.
Chapter 4 EIA Study of Navi Mumbai International Airport Sheet 88 of 416
CESE, IIT Mumbai CIDCO
f) Salinity
The total amount of inorganic material dissolved in sea water is termed as
salinity and is usually about 3.5 % or 35ppth. Temperature and salinity
together influence the density of sea water and to much lesser extent
pressure also. The fact that density of sea water varies with temperature
has important consequences for primary productivity in the sea water.
Average salinity of Arabian Sea is slightly higher than that of ocean.
Moreover, isolated (land locked) sea water body is more saline than an
open sea because of increased evaporation.
The value of salinity of marine water of Gadhi River was in the range of 17.5
- 31.6 ppt, 28.6 – 35.9 ppt and 1.5 – 3.0 ppt during post monsoon, pre
monsoon and monsoon season respectively.
The value of salinity of marine water of Ulwe River was 32.3 ppt, 36.7 ppt
and 2.3 during post monsoon, pre monsoon and monsoon season
respectively.
The value of salinity of marine water of Panvel Creek was in the range of
33.0 ppt, 35.9– 36.7 ppt and 2.3 – 3.0 ppt during post monsoon, pre
monsoon and monsoon season respectively.
Though salinity has a bearing on the saturation DO, the changes in this
parameter did not affect the NSF-WQI significantly.
g) Nitrite
Nitrite in water poisons the fish by binding to the hemoglobin in the blood
preventing oxygen carrying capacity, in effect suffocating the fish .The gills
of fish dying as a result of nitrite poisoning are characteristic brown color.
The nitrite concentration of marine water of Gadhi River was in the range of
0.03 - 0.38mg/L, 0.01 - 0.45 mg/L and 0.026 - 0.182 mg/L during post
monsoon, pre monsoon and monsoon season respectively.
Chapter 4 EIA Study of Navi Mumbai International Airport Sheet 89 of 416
CESE, IIT Mumbai CIDCO
The nitrite concentration of marine water of Ulwe River was 0.45 mg/L, 0.37
mg/L and 39.1 mg/L during post monsoon, pre monsoon and monsoon
season respectively.
The nitrite concentration of marine water of Panvel Creek was in the range
of 0.43 - 0.45 mg/L, 33.0 mg/L, 12.0 – 33.4 mg/L during post monsoon, pre
monsoon and monsoon season respectively.
h) Nitrate -N
Nitrate -N is a nutrient produced in natural water by decomposition of
nitrogenous organic compounds. High level of nitrate represents the
presence of more nitrogenous compounds and resulting in to excessive
growth of algae and other aquatic vegetation. Eutrophication of the water
body is also caused by the presence of excess amount of nitrate -nitrogen
along with other nutrients in the water.
The nitrate concentration of marine water of Gadhi River was in the range of
0.02 - 0.20 mg/L, 0.16 – 0.67 mg/L and 0.0 – 102.7 mg/L during post
monsoon, pre monsoon and monsoon season respectively.
The nitrate concentration of marine water of Ulwe River was 0.17 mg/L, 0.48
mg/L and BDL during post monsoon, pre monsoon and monsoon season
respectively.
The nitrate concentration of marine water of Panvel Creek was in the range
of 0.21 - 0.22 mg/L, 0.38 - 0.41 mg/L and BDL – 13.4 mg/L during post
monsoon, pre monsoon and monsoon season respectively.
i) Phosphate-P
Phosphate-P is a nutrient that acts as a fertilizer. High level of this nutrient
causes excessive plant and algal growth in aquatic ecosystem.
Eutrophication of the water body is also caused by the presence of excess
amount of Phosphate-P along with other nutrients in the water.
Chapter 4 EIA Study of Navi Mumbai International Airport Sheet 90 of 416
CESE, IIT Mumbai CIDCO
The phosphate concentration of marine water of Gadhi River was in the
range of 0.13 - 0.24 mg/L, 0.17 – 0.54 mg/L and 95.3 – 668.6 mg/L during
post monsoon, pre monsoon and monsoon season respectively.
The phosphate concentration of marine water of Ulwe River was 0.13 mg/L,
0.21 mg/L and 104.4 mg/L during post monsoon, pre monsoon and
monsoon season respectively.
The phosphate concentration of marine water of Panvel Creek was in the
range of 0.08 - 0.12 mg/L, 0.15 – 0.17 mg/L and 168.5 – 194.2 mg/L during
post monsoon, pre monsoon and monsoon season respectively.
j) Silicate
The requirement of silicon by Diatoms is not, however entirely limited to
skeletal formation and has particular importance potentially in coastal
upwelling region where Diatoms form a dominant part the phytoplankton. It
appears as oxide in sand and silts. In natural water, it is found as silicate
(SiO2).
The silicate concentration of marine water of Gadhi River was in the range
of 0.73 - 7.7mg/L, 1.9 – 6.5 mg/L and _ - _ mg/L during post monsoon, pre
monsoon and monsoon season respectively.
The silicate concentration of marine water of Ulwe River was 0.94 mg/L, 1.8
mg/L and __ mg/L during post monsoon, pre monsoon and monsoon
season respectively.
The silicate concentration of marine water of Panvel Creek was in the range
of 1.0 mg/L, 2.0 – 2.1 mg/L and _ - _ mg/L during post monsoon, pre
monsoon and monsoon season respectively.
Chapter 4 EIA Study of Navi Mumbai International Airport Sheet 91 of 416
CESE, IIT Mumbai CIDCO
k) Dissolved Oxygen (DO)
Dissolved oxygen is essential to the respiration of aquatic organisms, and its
concentration in sea is a major determinant of the species composition of
biota in the water and underlying sediments. Moreover, the dissolved
oxygen in sea has a profound effect on the biochemical reactions that occur
in water and sediments, which in turn affect numerous aspects of water
quality, including the solubility of many toxic elements and esthetic qualities
of odor and taste. For these reasons, dissolved oxygen historically has been
one of the most frequently measured indicators of water quality.
The value of dissolved oxygen in the Gadhi River was in the range of 5.6 -
6.9 mg/L, 3.8 - 6.0 mg/L and 5.4 – 7.1 mg/L during post monsoon, pre
monsoon and monsoon season respectively.
The value of dissolved oxygen in the Ulwe River was 5.9 mg/L, 5.8 mg/L
and 5.8 mg/L during post monsoon, pre monsoon and monsoon season
respectively.
The value of dissolved oxygen in the Panvel Creek was in the range of 5.9 -
6 mg/L, 6.0 mg/L and 8.3 – 7.5 mg/L during post monsoon, pre monsoon
and monsoon season respectively.
DO is an important parameter in the calculation of NSF-WQI, the changes in
DO levels brought about prominent changes in NSF-WQI.
l) Biochemical Oxygen Demand (BOD)
BOD test shows the amount of molecular oxygen required by bacteria to
reduce the carbonaceous matter. It is also defined as the measure of the
oxygen consumed by living organisms while utilizing the organic matter. It is
a good indicator of pollution.
The value of BOD of marine water of the Gadhi River was in the range of
2.8 - 10.4 mg/L, 3.8 - 6.0 mg/L and 1.2 – 3.2 mg/L during post monsoon, pre
monsoon and monsoon season respectively.
Chapter 4 EIA Study of Navi Mumbai International Airport Sheet 92 of 416
CESE, IIT Mumbai CIDCO
The value of BOD of marine water of the Ulwe River was 3.2 mg/L, 1.2 mg/L
and 2.8 mg/L during post monsoon, pre monsoon and monsoon season
respectively.
The value of BOD of marine water of the Panvel Creek was in the range of 2
- 3.6 mg/L, 2.4 – 2.8 mg/L and 2.4 – 2.8 mg/L during post monsoon, pre
monsoon and monsoon season respectively.
CPCB standard for BOD of sea water (Class II Waters) is 3mg/L. BOD
values were slightly above the standard at some stations in all water bodies
during the monitoring period. This could be due to inflow of wastewater from
nearby villages.
m) Cadmium
Cadmium accumulates in the oceans from sources such as atmospheric
fallout, rivers and direct dumping of waste into the sea. Many types of
marine life, including shellfish, fish, plankton and birds, are known to
concentrate this element which, besides posing an increasing threat to
marine life, may also affect man.
The value of cadmium in the Gadhi River was in the range of 0.109 - 0.117
mg/L, 0.111 – 0.115 mg/L and 0.024 – 0.744 mg/L during post monsoon,
pre monsoon and monsoon season respectively.
The value of cadmium in the Ulwe River was 0.113 mg/L, 0.116 mg/L and
0.186 mg/L during post monsoon, pre monsoon and monsoon season
respectively.
The value of cadmium in the Panvel Creek was in the range of 0.113 -
0.114mg/L, 0.116 – 0.117 mg/L and 0.160 – 0.369 mg/L during post
monsoon, pre monsoon and monsoon season respectively.
n) Lead
Anthropogenic lead (Pb) is considered to be one of the most severe
contaminants for the environments. Although Pb is used for a variety of
Chapter 4 EIA Study of Navi Mumbai International Airport Sheet 93 of 416
CESE, IIT Mumbai CIDCO
purposes in industries, automobile exhaust is a predominant source of Pb
emission due to the use of leaded gasoline. Since anthropogenic Pb is
easily transported via atmosphere, sea surface water is polluted by Pb
mainly through precipitation and deposition of aerosols.
The concentration of lead in the Gadhi River was in the range of 0.138 -
0.222 mg/L, 0.159 – 0.202 mg/L and 0.111 – 8.759 mg/L during post
monsoon, pre monsoon and monsoon season respectively.
The concentration of lead in the Ulwe River was 0.186 mg/L, 0.198 mg/L
and 4.693 mg/L during post monsoon, pre monsoon and monsoon season
respectively.
The concentration of lead in the Panvel Creek was in the range of 0.177 -
0.181 mg/L, 0.209 – 0.218 mg/L and 0.336 – 0.983 mg/L during post
monsoon, pre monsoon and monsoon season respectively.
o) Mercury
Mercury is considered to be a pollutant of the global environment because
of its volatility, long-range atmospheric transport, its transformation to more
toxic compounds and the bio-accumulation of the latter. Sources of mercury
pollution in the environment Coal-burning electric plants are the largest
cause of avoidable mercury emissions includes the disposal of batteries,
thermometers, and gas meters. Mercury is dangerous to humans. High
levels of mercury in a human can affect the nervous system and is
especially harmful to unborn children in the womb. The most common way a
person is exposed to mercury pollution is through eating fish. The mercury is
absorbed into the fatty tissues of fish, which pass that mercury on when the
fish is eaten.
The concentration of mercury in the Gadhi River was in the range of 0.028 -
0.124 mg/L, BDL (Below Detectable Range) and 3.320 - 18.18 mg/L during
post monsoon, pre monsoon and monsoon season respectively.
Chapter 4 EIA Study of Navi Mumbai International Airport Sheet 94 of 416
CESE, IIT Mumbai CIDCO
The concentration of mercury in the Ulwe River was 0.028 mg/L, BDL and
5.920 mg/L during post monsoon, pre monsoon and monsoon season
respectively.
The concentration of mercury in the Panvel Creek was in the range of 0.013
- 0.042 mg/L, BDL and 2.311 – 3.238 mg/L during post monsoon, pre
monsoon and monsoon season respectively.
p) Total Organic Carbon
Total organic carbon (TOC) is the amount of carbon bound in an organic
compound and is often used as a non-specific indicator of water quality.
TOC detection is an important measurement because of the effects it may
have on the environment, human health, and manufacturing processes.
TOC is a highly sensitive, non-specific measurement of all organics present
in a sample. It, therefore, can be used to regulate the organic chemical
discharge to the environment in a manufacturing plant. In addition, low TOC
can confirm the absence of potentially harmful organic chemicals in water
used to manufacture pharmaceutical products. It is highly important
parameter for fresh water quality assessment.
The value of TOC in the Gadhi River was in the range of 30.5 - 35.6 mg/L,
25.2 - 30.1 mg/L and 4.2 – 11.4 mg/L during post monsoon, pre monsoon
and monsoon season respectively.
The value of TOC in the Ulwe River was 31.0 mg/L, 15.0 mg/L and 10.6
mg/L during post monsoon, pre monsoon and monsoon season
respectively.
The value of TOC in the Panvel Creek was in the range of 30.7 - 31.0 mg/L,
15.1 - 27.8 mg/L and 10.2 – 10.7 mg/L during post monsoon, pre monsoon
and monsoon season respectively.
Chapter 4 EIA Study of Navi Mumbai International Airport Sheet 95 of 416
CESE, IIT Mumbai CIDCO
q) Fecal Coliform
Fecal coliform is measured in terms of Most Probable Number (MPN). MPN
is an index of the number of coliform bacteria that, more probably than any
other number, would give the coliform density, since coliform group density
is an important criterion of the degree of fecal pollution. The major risk from
fecal contamination is from contaminated sea food. Coliform bacteria enter
coastal waters through sewage discharge.
The value of fecal coliform in marine water of the Gadhi River was in the
range of <2 - 68 MF Count /100ml, 1 - 2 MF Count /100ml and <2 - 40 MF
Count /100ml during post monsoon, pre monsoon and monsoon season
respectively.
The value of fecal coliform in marine water of the Ulwe River was 48 MF
Count /100ml, 60 MF Count /100ml and 84 MF Count /100ml during post
monsoon, pre monsoon and monsoon season respectively.
The value of fecal coliform in marine water of the Panvel Creek was in the
range of <2 - 72 MF Count /100ml, <2 - 92 MF Count /100ml and <2 MF
Count /100ml during post monsoon, pre monsoon and monsoon season
respectively.
The values of coliform colonies have a direct bearing on the NSF-WQI.
Chapter 4 EIA Study of Navi Mumbai International Airport Sheet 96 of 416
CESE, IIT Mumbai CIDCO
r) Total Heterotrophic Bacteria
Heterotrophic bacteria in the marine environment are involved in a number
of interrelated processes such as decomposition of complex molecules,
respiration, mineralization, remineralization and, uptake of dissolved organic
compounds and their conversion to particulate matter. The very basic
function is decomposition by heterotrophic bacteria is of considerable
ecological and economic importance in pollution clean-up. Native
heterotrophic microflora capable of degrading a variety of environmental and
human health-hazardous toxic substances is quite common in the marine
environment. The ability of such heterotrophic prokaryotes to transform
many highly toxic wastes to substances that are nontoxic, bioavailable and
utilizable by other forms of life is very important in ecosystem stability.
The value of total heterotrophic bacteria in marine water of the Gadhi River
was in the range of 120 - 196 SPC/ml, 36 - 124 SPC/ml and _ - _ SPC/ml
during post monsoon, pre monsoon and monsoon season respectively.
The value of total heterotrophic bacteria in marine water of the Ulwe River
was 192 SPC/ml, 144 SPC/ml and __ SPC/ml during post monsoon, pre
monsoon and monsoon season respectively.
The value of total heterotrophic bacteria in marine water of the Panvel Creek
was in the range of 148 - 224 SPC/ml, 64 - 164 SPC/ml and _ - _ SPC/ml
during post monsoon, pre monsoon and monsoon season respectively.
s) Total Marine Water Quality
All physico-chemical parameters monitored during the entire study period
show that all of them having range of values within their prescribed
standards except for BOD and nutrients. The nutrients values were slightly
above the recommended range for Arabian Sea. This could be due to inflow
of sewage from village and urban area. BOD was maximum in the upstream
end of Gadhi river and this could be because of sewage discharge from
Chapter 4 EIA Study of Navi Mumbai International Airport Sheet 97 of 416
CESE, IIT Mumbai CIDCO
Panvel Town and nearby areas. The presence of fecal coliform in Gadhi
River, Ulwe River and Panvel Creek indicate contamination of marine water
with sanitary waste.
NSF Water Quality Index (WQI) for marine water was calculated during post
monsoon, pre monsoon and monsoon season and is given in Tables 4.32 to 4.34. The WQI calculated for marine water was in the range of 75 to 91,
79 – 94 and 70 to 94.
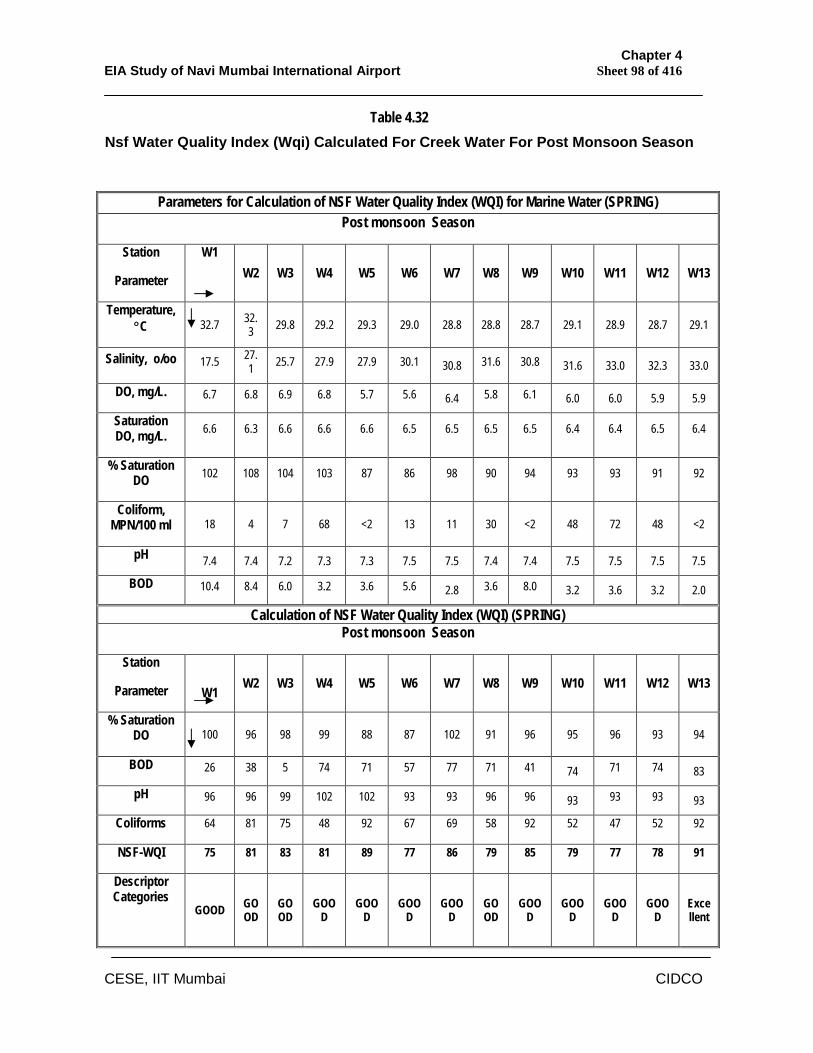
Chapter 4 EIA Study of Navi Mumbai International Airport Sheet 98 of 416
CESE, IIT Mumbai CIDCO
Table 4.32 Nsf Water Quality Index (Wqi) Calculated For Creek Water For Post Monsoon Season
Parameters for Calculation of NSF Water Quality Index (WQI) for Marine Water (SPRING) Post monsoon Season
Station
Parameter
W1 W2 W3 W4 W5 W6 W7 W8 W9 W10 W11 W12 W13
Temperature, C 32.7 32.
3 29.8 29.2 29.3 29.0 28.8 28.8 28.7 29.1 28.9 28.7 29.1
Salinity, o/oo 17.5 27.1 25.7 27.9 27.9 30.1 30.8 31.6 30.8 31.6 33.0 32.3 33.0
DO, mg/L. 6.7 6.8 6.9 6.8 5.7 5.6 6.4 5.8 6.1 6.0 6.0 5.9 5.9
Saturation DO, mg/L. 6.6 6.3 6.6 6.6 6.6 6.5 6.5 6.5 6.5 6.4 6.4 6.5 6.4
% Saturation DO 102 108 104 103 87 86 98 90 94 93 93 91 92
Coliform, MPN/100 ml 18 4 7 68 <2 13 11 30 <2 48 72 48 <2
pH 7.4 7.4 7.2 7.3 7.3 7.5 7.5 7.4 7.4 7.5 7.5 7.5 7.5
BOD 10.4 8.4 6.0 3.2 3.6 5.6 2.8 3.6 8.0 3.2 3.6 3.2 2.0
Calculation of NSF Water Quality Index (WQI) (SPRING) Post monsoon Season
Station
Parameter
W1 W2 W3 W4 W5 W6 W7 W8 W9 W10 W11 W12 W13
% Saturation DO 100 96 98 99 88 87 102 91 96 95 96 93 94
BOD 26 38 5 74 71 57 77 71 41 74 71 74 83
pH 96 96 99 102 102 93 93 96 96 93 93 93 93
Coliforms 64 81 75 48 92 67 69 58 92 52 47 52 92
NSF-WQI 75 81 83 81 89 77 86 79 85 79 77 78 91
Descriptor Categories
GOOD GO
OD GOOD
GOOD
GOOD
GOOD
GOOD
GOOD
GOOD
GOOD
GOOD
GOOD
Excellent
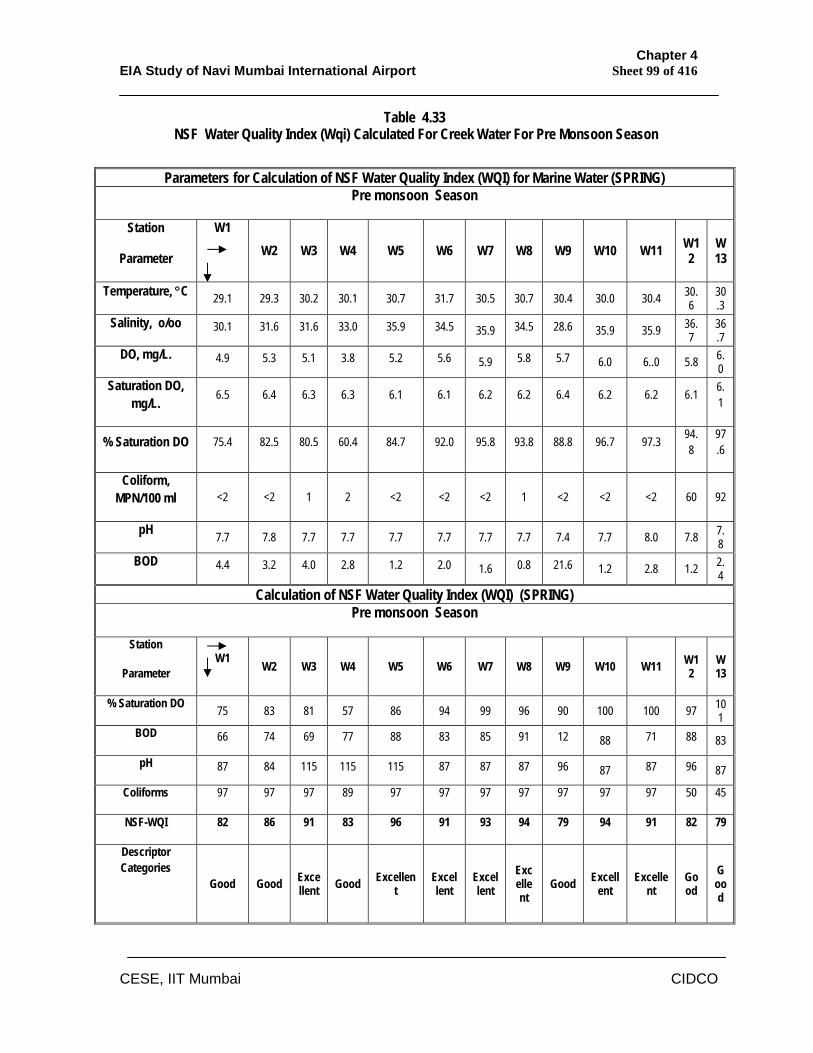
Chapter 4 EIA Study of Navi Mumbai International Airport Sheet 99 of 416
CESE, IIT Mumbai CIDCO
Table 4.33 NSF Water Quality Index (Wqi) Calculated For Creek Water For Pre Monsoon Season
Parameters for Calculation of NSF Water Quality Index (WQI) for Marine Water (SPRING) Pre monsoon Season
Station
Parameter
W1 W2 W3 W4 W5 W6 W7 W8 W9 W10 W11 W1
2 W13
Temperature, C 29.1 29.3 30.2 30.1 30.7 31.7 30.5 30.7 30.4 30.0 30.4 30.6
30.3
Salinity, o/oo 30.1 31.6 31.6 33.0 35.9 34.5 35.9 34.5 28.6 35.9 35.9 36.7
36.7
DO, mg/L. 4.9 5.3 5.1 3.8 5.2 5.6 5.9 5.8 5.7 6.0 6..0 5.8 6.0
Saturation DO, mg/L. 6.5 6.4 6.3 6.3 6.1 6.1 6.2 6.2 6.4 6.2 6.2 6.1 6.
1
% Saturation DO 75.4 82.5 80.5 60.4 84.7 92.0 95.8 93.8 88.8 96.7 97.3 94.8
97.6
Coliform, MPN/100 ml <2 <2 1 2 <2 <2 <2 1 <2 <2 <2 60 92
pH 7.7 7.8 7.7 7.7 7.7 7.7 7.7 7.7 7.4 7.7 8.0 7.8 7.8
BOD 4.4 3.2 4.0 2.8 1.2 2.0 1.6 0.8 21.6 1.2 2.8 1.2 2.4
Calculation of NSF Water Quality Index (WQI) (SPRING) Pre monsoon Season
Station
Parameter
W1 W2 W3 W4 W5 W6 W7 W8 W9 W10 W11 W1
2 W13
% Saturation DO 75 83 81 57 86 94 99 96 90 100 100 97 101
BOD 66 74 69 77 88 83 85 91 12 88 71 88 83
pH 87 84 115 115 115 87 87 87 96 87 87 96 87
Coliforms 97 97 97 89 97 97 97 97 97 97 97 50 45
NSF-WQI 82 86 91 83 96 91 93 94 79 94 91 82 79
Descriptor Categories
Good Good Exce
llent Good Excellent
Excellent
Excellent
Excellent
Good Excellent
Excellent
Good
Good
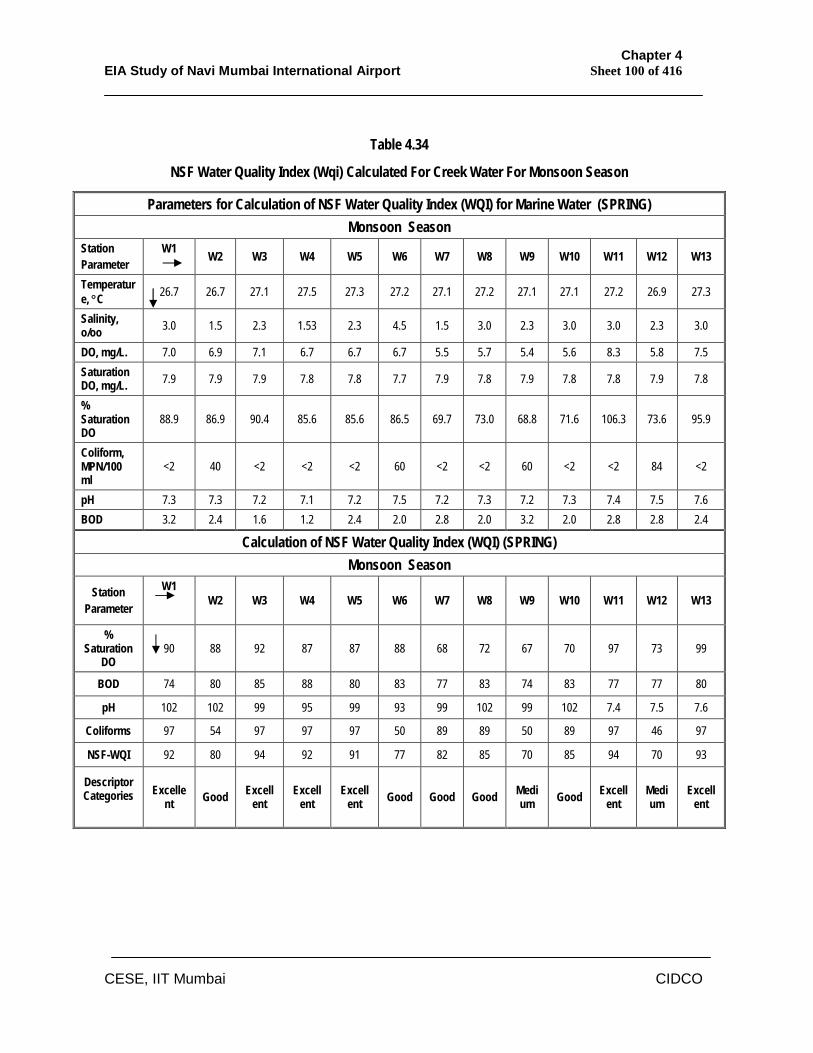
Chapter 4 EIA Study of Navi Mumbai International Airport Sheet 100 of 416
CESE, IIT Mumbai CIDCO
Table 4.34
NSF Water Quality Index (Wqi) Calculated For Creek Water For Monsoon Season
Parameters for Calculation of NSF Water Quality Index (WQI) for Marine Water (SPRING) Monsoon Season
Station Parameter
W1 W2 W3 W4 W5 W6 W7 W8 W9 W10 W11 W12 W13
Temperature, C 26.7 26.7 27.1 27.5 27.3 27.2 27.1 27.2 27.1 27.1 27.2 26.9 27.3
Salinity, o/oo 3.0 1.5 2.3 1.53 2.3 4.5 1.5 3.0 2.3 3.0 3.0 2.3 3.0
DO, mg/L. 7.0 6.9 7.1 6.7 6.7 6.7 5.5 5.7 5.4 5.6 8.3 5.8 7.5 Saturation DO, mg/L. 7.9 7.9 7.9 7.8 7.8 7.7 7.9 7.8 7.9 7.8 7.8 7.9 7.8
% Saturation DO
88.9 86.9 90.4 85.6 85.6 86.5 69.7 73.0 68.8 71.6 106.3 73.6 95.9
Coliform, MPN/100 ml
<2 40 <2 <2 <2 60 <2 <2 60 <2 <2 84 <2
pH 7.3 7.3 7.2 7.1 7.2 7.5 7.2 7.3 7.2 7.3 7.4 7.5 7.6 BOD 3.2 2.4 1.6 1.2 2.4 2.0 2.8 2.0 3.2 2.0 2.8 2.8 2.4
Calculation of NSF Water Quality Index (WQI) (SPRING) Monsoon Season
Station Parameter
W1 W2 W3 W4 W5 W6 W7 W8 W9 W10 W11 W12 W13
% Saturation
DO 90 88 92 87 87 88 68 72 67 70 97 73 99
BOD 74 80 85 88 80 83 77 83 74 83 77 77 80
pH 102 102 99 95 99 93 99 102 99 102 7.4 7.5 7.6
Coliforms 97 54 97 97 97 50 89 89 50 89 97 46 97
NSF-WQI 92 80 94 92 91 77 82 85 70 85 94 70 93
Descriptor Categories
Excellent Good Excell
ent Excell
ent Excell
ent Good Good Good Medium Good Excell
ent Medium
Excellent
Chapter 4 EIA Study of Navi Mumbai International Airport Sheet 101 of 416
CESE, IIT Mumbai CIDCO
According to NSF Water Quality Index (WQI), the quality of water in Gadhi River
was good, excellent during post monsoon and pre monsoon season respectively
and during monsoon season it was in the range of good to excellent.
According to NSF Water Quality Index (WQI), the quality of water in Ulwe River was
good, good and good during post monsoon, pre monsoon and monsoon season
respectively.
According to NSF Water Quality Index (WQI), the quality of water in Panvel Creek
was excellent during post monsoon season and it was good to excellent during pre
monsoon and monsoon season.
The overall quality of marine water in the project area was found to be good based
on NSF Water Quality Index.
ii) Ground Water
The following parameters of the ground water quality were analyzed.
a) Physical: pH, temperature and turbidity.
b) Chemical: DO (dissolved oxygen), BOD (biochemical oxygen demand), COD
(Chemical Oxygen Demand), salinity, total nitrogen, total phosphorous, nitrate-
nitrogen, magnesium hardness, total alkalinity, chloride, sulphate, sodium,
potassium, phenol and fluoride.
c) Biological: SPC (standard plate count), coliform colonies (MPN) and
phytoplankton.
Physico-chemical and biological characteristics of the ground water have been
studied during the post monsoon, pre monsoon and monsoon season and results
are shown in Table 4.35 to 4.37.
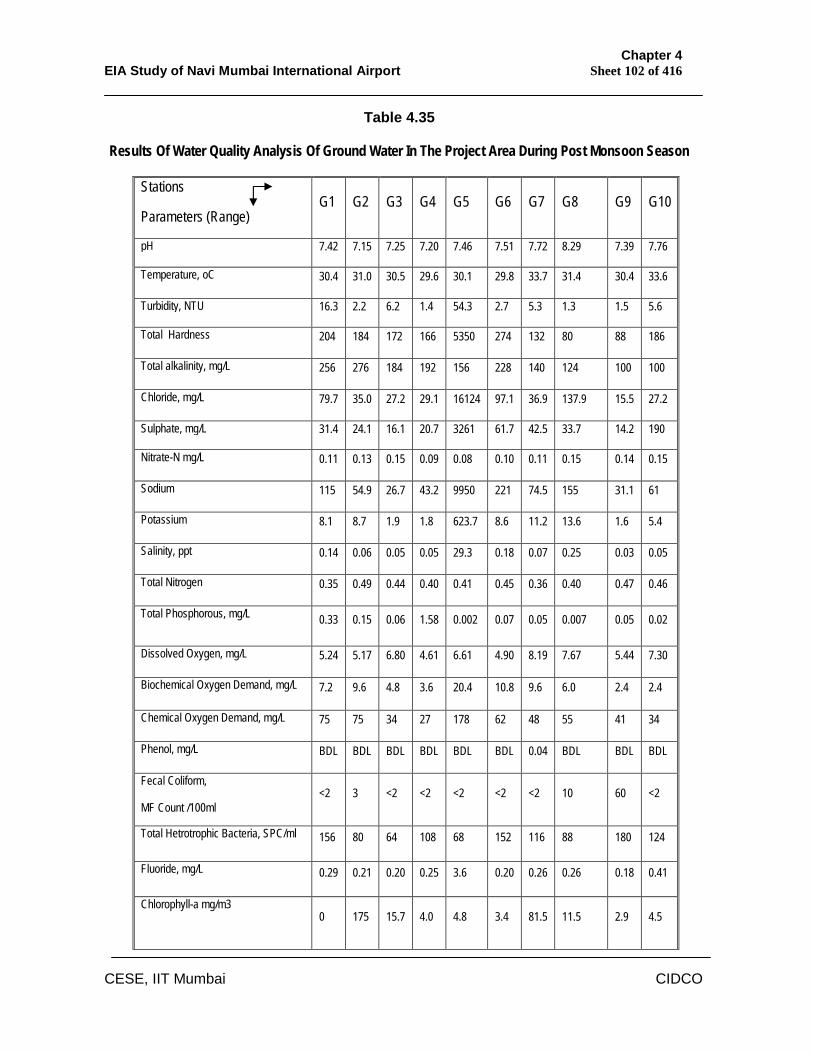
Chapter 4 EIA Study of Navi Mumbai International Airport Sheet 102 of 416
CESE, IIT Mumbai CIDCO
Table 4.35
Results Of Water Quality Analysis Of Ground Water In The Project Area During Post Monsoon Season
Stations
Parameters (Range) G1 G2 G3 G4 G5 G6 G7 G8 G9 G10
pH
7.42 7.15 7.25 7.20 7.46 7.51 7.72 8.29 7.39 7.76
Temperature, oC 30.4 31.0 30.5 29.6 30.1 29.8 33.7 31.4 30.4 33.6
Turbidity, NTU
16.3 2.2 6.2 1.4 54.3 2.7 5.3 1.3 1.5 5.6
Total Hardness 204 184 172 166 5350 274 132 80 88 186
Total alkalinity, mg/L 256 276 184 192 156 228 140 124 100 100
Chloride, mg/L 79.7 35.0 27.2 29.1 16124 97.1 36.9 137.9 15.5 27.2
Sulphate, mg/L
31.4 24.1 16.1 20.7 3261 61.7 42.5 33.7 14.2 190
Nitrate-N mg/L 0.11 0.13 0.15 0.09 0.08 0.10 0.11 0.15 0.14 0.15
Sodium 115 54.9 26.7 43.2 9950 221 74.5 155 31.1 61
Potassium 8.1 8.7 1.9 1.8 623.7 8.6 11.2 13.6 1.6 5.4
Salinity, ppt 0.14 0.06 0.05 0.05 29.3 0.18 0.07 0.25 0.03 0.05
Total Nitrogen 0.35 0.49 0.44 0.40 0.41 0.45 0.36 0.40 0.47 0.46
Total Phosphorous, mg/L 0.33 0.15 0.06 1.58 0.002 0.07 0.05 0.007 0.05 0.02
Dissolved Oxygen, mg/L 5.24 5.17 6.80 4.61 6.61 4.90 8.19 7.67 5.44 7.30
Biochemical Oxygen Demand, mg/L 7.2 9.6 4.8 3.6 20.4 10.8 9.6 6.0 2.4 2.4
Chemical Oxygen Demand, mg/L 75 75 34 27 178 62 48 55 41 34
Phenol, mg/L BDL BDL BDL BDL BDL BDL 0.04 BDL BDL BDL
Fecal Coliform,
MF Count /100ml <2 3 <2 <2 <2 <2 <2 10 60 <2
Total Hetrotrophic Bacteria, SPC/ml 156 80 64 108 68 152 116 88 180 124
Fluoride, mg/L 0.29 0.21 0.20 0.25 3.6 0.20 0.26 0.26 0.18 0.41
Chlorophyll-a mg/m3 0 175 15.7 4.0 4.8 3.4 81.5 11.5 2.9 4.5
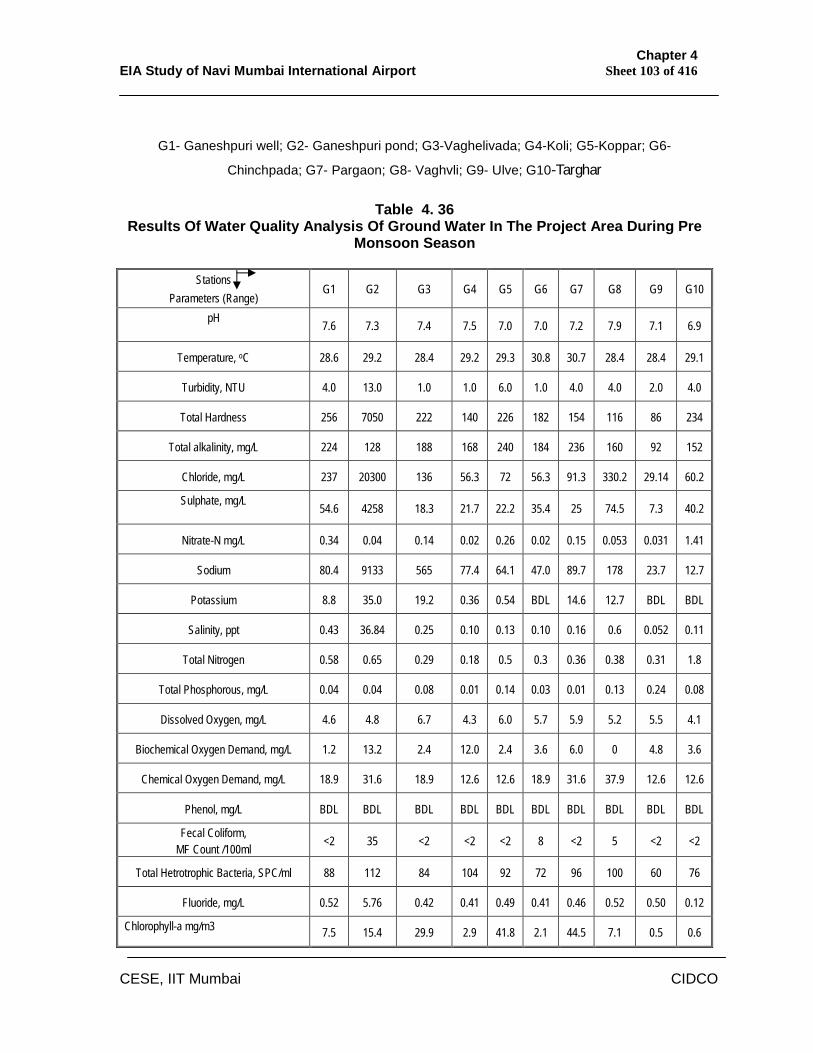
Chapter 4 EIA Study of Navi Mumbai International Airport Sheet 103 of 416
CESE, IIT Mumbai CIDCO
G1- Ganeshpuri well; G2- Ganeshpuri pond; G3-Vaghelivada; G4-Koli; G5-Koppar; G6-
Chinchpada; G7- Pargaon; G8- Vaghvli; G9- Ulve; G10-Targhar
Table 4. 36 Results Of Water Quality Analysis Of Ground Water In The Project Area During Pre
Monsoon Season
Stations Parameters (Range)
G1 G2 G3 G4 G5 G6 G7 G8 G9 G10
pH 7.6 7.3 7.4 7.5 7.0 7.0 7.2 7.9 7.1 6.9
Temperature, oC 28.6 29.2 28.4 29.2 29.3 30.8 30.7 28.4 28.4 29.1
Turbidity, NTU 4.0 13.0 1.0 1.0 6.0 1.0 4.0 4.0 2.0 4.0
Total Hardness 256 7050 222 140 226 182 154 116 86 234
Total alkalinity, mg/L 224 128 188 168 240 184 236 160 92 152
Chloride, mg/L 237 20300 136 56.3 72 56.3 91.3 330.2 29.14 60.2
Sulphate, mg/L 54.6 4258 18.3 21.7 22.2 35.4 25 74.5 7.3 40.2
Nitrate-N mg/L 0.34 0.04 0.14 0.02 0.26 0.02 0.15 0.053 0.031 1.41
Sodium 80.4 9133 565 77.4 64.1 47.0 89.7 178 23.7 12.7
Potassium 8.8 35.0 19.2 0.36 0.54 BDL 14.6 12.7 BDL BDL
Salinity, ppt 0.43 36.84 0.25 0.10 0.13 0.10 0.16 0.6 0.052 0.11
Total Nitrogen 0.58 0.65 0.29 0.18 0.5 0.3 0.36 0.38 0.31 1.8
Total Phosphorous, mg/L 0.04 0.04 0.08 0.01 0.14 0.03 0.01 0.13 0.24 0.08
Dissolved Oxygen, mg/L 4.6 4.8 6.7 4.3 6.0 5.7 5.9 5.2 5.5 4.1
Biochemical Oxygen Demand, mg/L 1.2 13.2 2.4 12.0 2.4 3.6 6.0 0 4.8 3.6
Chemical Oxygen Demand, mg/L 18.9 31.6 18.9 12.6 12.6 18.9 31.6 37.9 12.6 12.6
Phenol, mg/L BDL BDL BDL BDL BDL BDL BDL BDL BDL BDL
Fecal Coliform, MF Count /100ml <2 35 <2 <2 <2 8 <2 5 <2 <2
Total Hetrotrophic Bacteria, SPC/ml 88 112 84 104 92 72 96 100 60 76
Fluoride, mg/L 0.52 5.76 0.42 0.41 0.49 0.41 0.46 0.52 0.50 0.12
Chlorophyll-a mg/m3 7.5 15.4 29.9 2.9 41.8 2.1 44.5 7.1 0.5 0.6
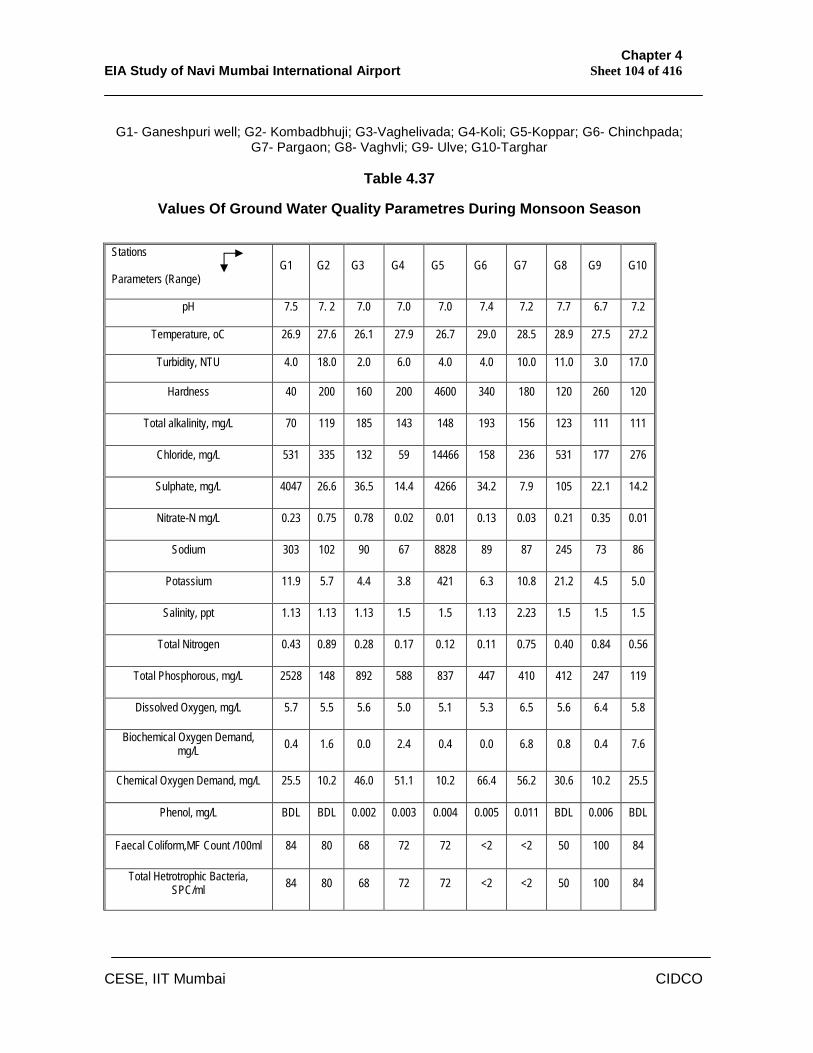
Chapter 4 EIA Study of Navi Mumbai International Airport Sheet 104 of 416
CESE, IIT Mumbai CIDCO
G1- Ganeshpuri well; G2- Kombadbhuji; G3-Vaghelivada; G4-Koli; G5-Koppar; G6- Chinchpada;
G7- Pargaon; G8- Vaghvli; G9- Ulve; G10-Targhar
Table 4.37
Values Of Ground Water Quality Parametres During Monsoon Season
Stations
Parameters (Range) G1 G2 G3 G4 G5 G6 G7 G8 G9 G10
pH 7.5 7. 2 7.0 7.0 7.0 7.4 7.2 7.7 6.7 7.2
Temperature, oC 26.9 27.6 26.1 27.9 26.7 29.0 28.5 28.9 27.5 27.2
Turbidity, NTU 4.0 18.0 2.0 6.0 4.0 4.0 10.0 11.0 3.0 17.0
Hardness 40 200 160 200 4600 340 180 120 260 120
Total alkalinity, mg/L 70 119 185 143 148 193 156 123 111 111
Chloride, mg/L 531 335 132 59 14466 158 236 531 177 276
Sulphate, mg/L 4047 26.6 36.5 14.4 4266 34.2 7.9 105 22.1 14.2
Nitrate-N mg/L 0.23 0.75 0.78 0.02 0.01 0.13 0.03 0.21 0.35 0.01
Sodium 303 102 90 67 8828 89 87 245 73 86
Potassium 11.9 5.7 4.4 3.8 421 6.3 10.8 21.2 4.5 5.0
Salinity, ppt 1.13 1.13 1.13 1.5 1.5 1.13 2.23 1.5 1.5 1.5
Total Nitrogen 0.43 0.89 0.28 0.17 0.12 0.11 0.75 0.40 0.84 0.56
Total Phosphorous, mg/L 2528 148 892 588 837 447 410 412 247 119
Dissolved Oxygen, mg/L 5.7 5.5 5.6 5.0 5.1 5.3 6.5 5.6 6.4 5.8
Biochemical Oxygen Demand, mg/L 0.4 1.6 0.0 2.4 0.4 0.0 6.8 0.8 0.4 7.6
Chemical Oxygen Demand, mg/L 25.5 10.2 46.0 51.1 10.2 66.4 56.2 30.6 10.2 25.5
Phenol, mg/L BDL BDL 0.002 0.003 0.004 0.005 0.011 BDL 0.006 BDL
Faecal Coliform,MF Count /100ml 84 80 68 72 72 <2 <2 50 100 84
Total Hetrotrophic Bacteria, SPC/ml 84 80 68 72 72 <2 <2 50 100 84
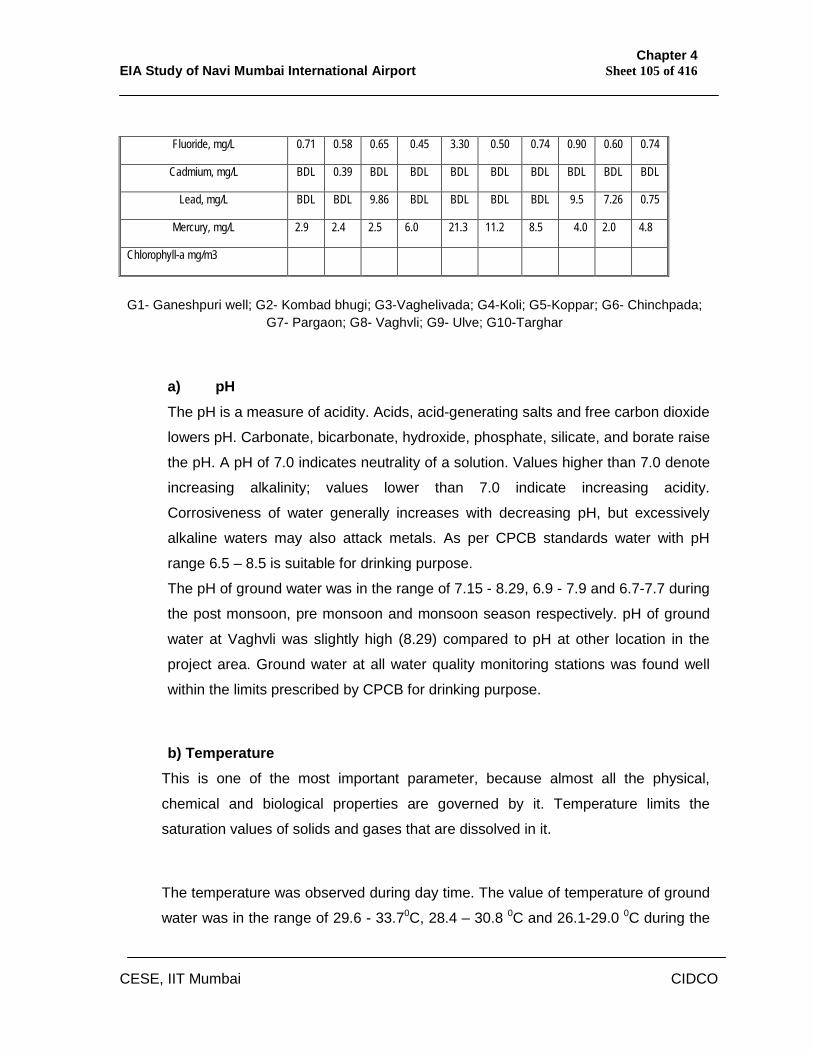
Chapter 4 EIA Study of Navi Mumbai International Airport Sheet 105 of 416
CESE, IIT Mumbai CIDCO
G1- Ganeshpuri well; G2- Kombad bhugi; G3-Vaghelivada; G4-Koli; G5-Koppar; G6- Chinchpada; G7- Pargaon; G8- Vaghvli; G9- Ulve; G10-Targhar
a) pH
The pH is a measure of acidity. Acids, acid-generating salts and free carbon dioxide
lowers pH. Carbonate, bicarbonate, hydroxide, phosphate, silicate, and borate raise
the pH. A pH of 7.0 indicates neutrality of a solution. Values higher than 7.0 denote
increasing alkalinity; values lower than 7.0 indicate increasing acidity.
Corrosiveness of water generally increases with decreasing pH, but excessively
alkaline waters may also attack metals. As per CPCB standards water with pH
range 6.5 – 8.5 is suitable for drinking purpose.
The pH of ground water was in the range of 7.15 - 8.29, 6.9 - 7.9 and 6.7-7.7 during
the post monsoon, pre monsoon and monsoon season respectively. pH of ground
water at Vaghvli was slightly high (8.29) compared to pH at other location in the
project area. Ground water at all water quality monitoring stations was found well
within the limits prescribed by CPCB for drinking purpose.
b) Temperature
This is one of the most important parameter, because almost all the physical,
chemical and biological properties are governed by it. Temperature limits the
saturation values of solids and gases that are dissolved in it.
The temperature was observed during day time. The value of temperature of ground
water was in the range of 29.6 - 33.70C, 28.4 – 30.8 0C and 26.1-29.0 0C during the
Fluoride, mg/L 0.71 0.58 0.65 0.45 3.30 0.50 0.74 0.90 0.60 0.74
Cadmium, mg/L BDL 0.39 BDL BDL BDL BDL BDL BDL BDL BDL
Lead, mg/L BDL BDL 9.86 BDL BDL BDL BDL 9.5 7.26 0.75
Mercury, mg/L 2.9 2.4 2.5 6.0 21.3 11.2 8.5 4.0 2.0 4.8
Chlorophyll-a mg/m3
Chapter 4 EIA Study of Navi Mumbai International Airport Sheet 106 of 416
CESE, IIT Mumbai CIDCO
post monsoon, pre monsoon and monsoon season respectively. The change in
temperature was in accordance with air temperature.
c) Hardness In most waters nearly all the hardness is because of calcium and magnesium. Hard
water consumes soap before lather will form, deposits soap on bathtubs, and forms
scale in boilers, water heaters, and pipes. Waters of hardness 0 to 60 mg/L are
termed soft; 61 to 120 mg/L moderately hard; 121 to 180 mg/L hard; and more than
180 mg/L very hard.
The hardness of ground water was in the range of 34 – 4400 mg/L, 34 – 4700 mg/L
and 40-4600 mg/L during the post monsoon, pre monsoon and monsoon season
respectively. Ground water at Pargaon, Vaghvli, Ulve and Targhar was found to be
soft whereas at Ganeshpuri, Vaghelivada, Koli ground water was moderately hard.
The well water at Koppar was found to be very hard. Such hard water prevents
lather formation with soap solutions. Hence, well water at Koppar is not suitable for
washing, bathing and laundry purpose.
d) Total alkalinity Alkalinity caused by the presence of certain anions, predominantly HCO3 and CO3.
These anions are formed by the action of carbon dioxide in water on carbonate
rocks such as limestone and dolomite. Certain organic materials may also produce
alkalinity. Alkalinity is an indicator of the relative amounts of carbonate (CO3),
bicarbonate (HCO3), and hydroxide ions.
As per the IS Drinking Water Standards, value of alkalinity should between
200mg/L (Desirable Limit).Beyond this limit the taste becomes unpleasant and
permissible limit is 600mg/L( in the absence of alternate source).
The alkalinity of ground water was in the range of 100 – 276 mg/L, 92 – 236 mg/L
and 70-193 mg/L during the post monsoon, pre monsoon and monsoon season
respectively.
Chapter 4 EIA Study of Navi Mumbai International Airport Sheet 107 of 416
CESE, IIT Mumbai CIDCO
e) Chloride Dissolved from rocks and soils. Present in sewage and found in natural and
industrial brines. Chloride salts in excess of 100 mg/L give a salty taste to water.
When combined with calcium and magnesium, chloride may increase the corrosive
activity of water.
The chloride in ground water was in the range of 15.5 mg/L – 137.9 mg/L whereas
at Koppar it was 16124 mg/L during the study period. Chloride content in
groundwater at Koppar is very high and it could be due to encroachment of saline
water because of groundwater exploitation.
f) Sulphate Dissolved from rocks and soils containing gypsum, iron sulfides, and other sulfur
compounds. Often present in some industrial wastes. Sulphate in water containing
calcium forms hard scale in boilers. In high concentrations, sulphate in combination
with other ions gives a bitter taste to water. Concentrations above 250 mg/L may
have a laxative effect. Domestic water supplies containing more than 1000 mg/L
sulphate can be used for drinking if a less mineralized water supply is not available.
The sulphate concentration in ground water was in the range of 14.2 mg/L – 190
mg/L whereas at Koppar it was 3261 mg/L during the post monsoon, pre monsoon
and monsoon season respectively. g) Nitrate The source of nitrate in ground water is decaying organic matter, sewage and
nitrate in soil and in fertilizers. High concentrations of nitrate are generally a
characteristic of individual wells and not of entire aquifers. Nitrate encourages
growth of algae and other organisms which produce undesirable tastes and odours.
There is evidence that more than about 10 mg/L may cause methemoglobinemia
("blue baby syndrome") in infants, which may be fatal. Interference Syndrome is
likely in cattle if stock water exceeds 50 to 100 mg/L of nitrate, especially for long
periods of time. At more than 100 mg/L of nitrate there is the possibility of acute
losses to Interference Syndrome and secondary disease.
Chapter 4 EIA Study of Navi Mumbai International Airport Sheet 108 of 416
CESE, IIT Mumbai CIDCO
The nitrate concentration in ground water was in the range of 0.08 mg/L – 0.15
mg/L, during the post monsoon, pre monsoon and monsoon season respectively. h) Sodium and Potassium Dissolved from most rocks and soils. Also found in brines and sewage. High
concentrations give a salty taste when combined with chloride. For most purposes
moderate levels have little effect on the use of water. Sodium salts may cause
foaming in boilers and high sodium adsorption ratio may limit use of water for
irrigation. Sodium Adsorption Ratio (SAR) is Indicates the relative abundance of
sodium as compared to calcium and magnesium. Greater SAR values indicate a
greater relative abundance of sodium. A high sodium concentration in irrigation
water combined with low calcium and magnesium concentrations usually reduces
soil tilth and impairs plant growth.
The sodium concentration in ground water at all water quality monitoring stations
was in the range of 26.7 mg/L - 221 mg/L except at Koppar where it was 9950 mg/L
during the study period. Sodium concentration in well water at Koppar is very high
and it could be due to encroachment of saline water. The potassium concentration
in ground water was in the range of 1.6 mg/L - 11.2 mg/L whereas at Koppar it was
623.7 mg/L during the post monsoon, pre monsoon and monsoon season
respectively. f) Salinity
The total amount of inorganic material dissolved in sea water is termed as salinity
and is usually about 3.5 % or 35ppth. Temperature and salinity together influence
the density of sea water and to much lesser extent pressure also. The fact that
density of sea water varies with temperature has important consequences for
primary productivity in the sea water. Average salinity of Arabian Sea is slightly
higher than that of ocean. Moreover, isolated (land locked) sea water body is more
saline than an open sea because of increased evaporation.
The value of salinity in ground water at all water quality monitoring stations was in
the range of 26.7 mg/L - 221 mg/L, 1.13 The value of salinity of marine water of
Chapter 4 EIA Study of Navi Mumbai International Airport Sheet 109 of 416
CESE, IIT Mumbai CIDCO
Gadhi River was in the range of 17.5 - 31.6 ppt, 28.6 – 35.9 ppt and 1.5 – 3.0 ppt
during post monsoon, pre monsoon and monsoon season respectively.
Though salinity has a bearing on the saturation DO, the changes in this parameter
did not affect the NSF-WQI significantly.
k) Dissolved Oxygen (DO)
Dissolved oxygen is essential to the respiration of aquatic organisms, and its
concentration in sea is a major determinant of the species composition of biota in
the water and underlying sediments. Moreover, the dissolved oxygen in sea has a
profound effect on the biochemical reactions that occur in water and sediments,
which in turn affect numerous aspects of water quality, including the solubility of
many toxic elements and esthetic qualities of odor and taste. For these reasons,
dissolved oxygen historically has been one of the most frequently measured
indicators of water quality.
The value of dissolved oxygen in ground water at all water quality monitoring
stations was in the range of mg/L during post monsoon, pre monsoon and monsoon
season respectively.
DO is an important parameter in the calculation of NSF-WQI, the changes in DO
levels brought about prominent changes in NSF-WQI.
m) Cadmium
Cadmium accumulates in the oceans from sources such as atmospheric fallout,
rivers and direct dumping of waste into the sea. Many types of marine life, including
shellfish, fish, plankton and birds, are known to concentrate this element which,
besides posing an increasing threat to marine life, may also affect man.
The value of cadmium in the Gadhi River was in the range of 0.109 - 0.117 mg/L,
0.111 – 0.115 mg/L and 0.024 – 0.744 mg/L during post monsoon, pre monsoon
and monsoon season respectively.
The value of cadmium in the Ulwe River was 0.113 mg/L, 0.116 mg/L and 0.186
mg/L during post monsoon, pre monsoon and monsoon season respectively.
Chapter 4 EIA Study of Navi Mumbai International Airport Sheet 110 of 416
CESE, IIT Mumbai CIDCO
The value of cadmium in the Panvel Creek was in the range of 0.113 - 0.114mg/L,
0.116 – 0.117 mg/L and 0.160 – 0.369 mg/L during post monsoon, pre monsoon
and monsoon season respectively.
n) Lead
Anthropogenic lead (Pb) is considered to be one of the most severe contaminants
for the environments. Although Pb is used for a variety of purposes in industries,
automobile exhaust is a predominant source of Pb emission due to the use of
leaded gasoline. Since anthropogenic Pb is easily transported via atmosphere, sea
surface water is polluted by Pb mainly through precipitation and deposition of
aerosols.
The concentration of lead in the Gadhi River was in the range of 0.138 - 0.222
mg/L, 0.159 – 0.202 mg/L and 0.111 – 8.759 mg/L during post monsoon, pre
monsoon and monsoon season respectively.
The concentration of lead in the Ulwe River was 0.186 mg/L, 0.198 mg/L and 4.693
mg/L during post monsoon, pre monsoon and monsoon season respectively.
The concentration of lead in the Panvel Creek was in the range of 0.177 - 0.181
mg/L, 0.209 – 0.218 mg/L and 0.336 – 0.983 mg/L during post monsoon, pre
monsoon and monsoon season respectively.
o) Mercury
Mercury is considered to be a pollutant of the global environment because of its
volatility, long-range atmospheric transport, its transformation to more toxic
compounds and the bio-accumulation of the latter. Sources of mercury pollution in
the environment Coal-burning electric plants are the largest cause of avoidable
mercury emissions includes the disposal of batteries, thermometers, and gas
meters. Mercury is dangerous to humans. High levels of mercury in a human can
affect the nervous system and is especially harmful to unborn children in the womb.
The most common way a person is exposed to mercury pollution is through eating
Chapter 4 EIA Study of Navi Mumbai International Airport Sheet 111 of 416
CESE, IIT Mumbai CIDCO
fish. The mercury is absorbed into the fatty tissues of fish, which pass that mercury
on when the fish is eaten.
The concentration of mercury in the Gadhi River was in the range of 0.028 - 0.124
mg/L, BDL (Below Detectable Range) and 3.320 - 18.18 mg/L during post
monsoon, pre monsoon and monsoon season respectively.
The concentration of mercury in the Ulwe River was 0.028 mg/L, BDL and 5.920
mg/L during post monsoon, pre monsoon and monsoon season respectively.
The concentration of mercury in the Panvel Creek was in the range of 0.013 - 0.042
mg/L, BDL and 2.311 – 3.238 mg/L during post monsoon, pre monsoon and
monsoon season respectively.
j) Fluoride Fluoride is a chemical that occurs naturally within many types of rock. The less
concentrations of fluoride can reduce the risk of dental cavities whereas high
concentration of fluoride can cause dental fluorosis. Studies have shown that
children drinking fluoridated water can expect to have up to 35% less tooth decay
than those drinking non-fluoridated water. The desirable limit of fluoride in drinking
water according to Indian Standards (BIS, 1991), is 0.6 to 1.5 mg/l.
The concentration of fluoride in ground water in the project area was in the range of
0.18 - 0.41 mg/L which is well within the limit except at Koppar where it was 3.6
mg/L. The concentration of fluoride in ground water in the project area was in the
range of 0.18 - 0.41 mg/L, whereas at Koppar it was 3.6 mg/L during post monsoon
season.
The concentration of fluoride in ground water in the project area was in the range of
0.12 - 0.52 mg/L during pre monsoon and 0.45 - 0.9 mg/L during monsoon season
which is well within the limit whereas concentration of fluoride was found to be
exceeded the permissible limit for drinking water at Ganeshpuri (5.76 mg/L) and
Koppar (3.30 mg/L) during pre monsoon and monsoon season respectively.
Chapter 4 EIA Study of Navi Mumbai International Airport Sheet 112 of 416
CESE, IIT Mumbai CIDCO
The highest concentration of fluoride (5.76 mg/L) ______was found at Koppar
during monsoon season. High concentration of fluoride at Koppar might be due to
leachate from soil containing high fluoride content.
k) Fecal Coliform
Fecal coliform is measured in terms of Most Probable Number (MPN). MPN is an
index of the number of coliform bacteria that, more probably than any other
number, would give the coliform density, since coliform group density is an
important criterion of the degree of fecal contamination. The presence of fecal
coliform in well water may indicate contamination of the groundwater by sewage or
animal droppings contain fecal coliforms, which could enter in to the aquifers
through infiltration. Hence, fecal coliform is considered as pollution indicator
organism. Poor well maintenance and construction (particularly shallow dug wells)
can also increase the risk of bacteria and other harmful organisms getting into a
well water supply.
The value of fecal coliform of ground water in the project area was in the range of
<2 - 60 MPN/100ml indicate contamination of ground water with sanitary waste.
The value of fecal coliform of ground water in the project area was in the range of
<2 - 60 MPN/100ml, <2 – 35 MPN/100ml and <2 -100 MPN/100ml during post
monsoon, pre monsoon and monsoon season respectively, indicates contamination
of ground water with sanitary waste.
The presence of fecal coliforms in ground water especially at Vaghvli and Ulwe
indicates fecal contamination. The values of coliform colonies have a direct bearing
on the NSF-WQI.
l) Biochemical Oxygen Demand (BOD)
BOD test shows the amount of molecular oxygen required by bacteria to reduce the
carbonaceous matter. It is also defined as the measure of the oxygen consumed by
living organisms while utilizing the organic matter. It is a good indicator of pollution.
Chapter 4 EIA Study of Navi Mumbai International Airport Sheet 113 of 416
CESE, IIT Mumbai CIDCO
The value of BOD of ground water in the project area was in the range of 2.4 – 20.4
mg/L. The BOD values were found to be high at some locations and it could be due
to infiltration of sewage, agricultural run-off from village. Poor well maintenance and
construction (particularly shallow dug wells) can also increase the risk of
contamination. The values of BOD have a direct bearing on the NSF-WQI.
m) Chemical Oxygen Demand (COD) The chemical oxygen demand (COD) is the amount of oxygen consumed to
chemically oxidize the organic matter to inorganic end products. COD is rapidly
measurable parameter and it is a good indicator of pollution. The value of COD of
ground water in the project area was in the range of 27 – 75 mg/L whereas at
Koppar it was 178 mg/L during post monsoon season. During the pre monsoon and
monsoon season the COD in the ground water was in the range of 12.6-37.9 and
10.2-66.4 respectively.
n) Phenol Phenol is formed during natural decomposition of organic matter. Phenol is also
found in gasoline, diesel engine exhaust and in cigarette smoke. Phenol can be
used as basic parameter for providing information of chemicals concentration in
surface waters. Phenol in air has short half life but it persist in water for much
longer time. Phenolic compounds are biodegradable so it does not have adverse
effect on aquatic life. The transport and movement of phenol in environment is
mainly governed by the pH. Long term exposure to phenol through inhalation and
ingestion may cause loss of appetite, liver and kidney damage, stomach upsets,
mouth ulcers, sore throat and heart effects. The phenol in ground water in the
project area was found to be below detectable limit during post monsoon and pre
monsoon; whereas it was BDL-0.011 mg/L during monsoon season.
o) Heterotrophic Bacteria
Planktonic heterotrophic bacteria are important in aquatic ecosystem as mineralizes
of organic matter and hence in bio-purification of water, which receives organic
pollution. Degradation of the organic matter contributes to the purification of the
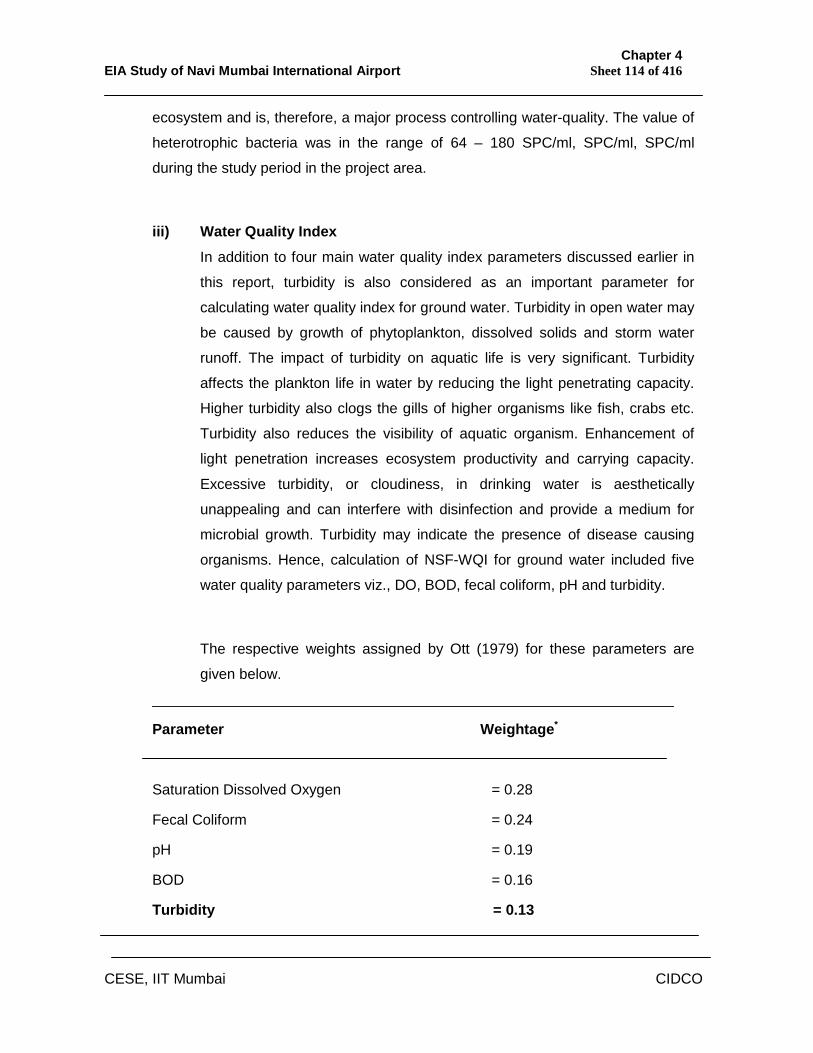
Chapter 4 EIA Study of Navi Mumbai International Airport Sheet 114 of 416
CESE, IIT Mumbai CIDCO
ecosystem and is, therefore, a major process controlling water-quality. The value of
heterotrophic bacteria was in the range of 64 – 180 SPC/ml, SPC/ml, SPC/ml
during the study period in the project area.
iii) Water Quality Index
In addition to four main water quality index parameters discussed earlier in
this report, turbidity is also considered as an important parameter for
calculating water quality index for ground water. Turbidity in open water may
be caused by growth of phytoplankton, dissolved solids and storm water
runoff. The impact of turbidity on aquatic life is very significant. Turbidity
affects the plankton life in water by reducing the light penetrating capacity.
Higher turbidity also clogs the gills of higher organisms like fish, crabs etc.
Turbidity also reduces the visibility of aquatic organism. Enhancement of
light penetration increases ecosystem productivity and carrying capacity.
Excessive turbidity, or cloudiness, in drinking water is aesthetically
unappealing and can interfere with disinfection and provide a medium for
microbial growth. Turbidity may indicate the presence of disease causing
organisms. Hence, calculation of NSF-WQI for ground water included five
water quality parameters viz., DO, BOD, fecal coliform, pH and turbidity.
The respective weights assigned by Ott (1979) for these parameters are
given below.
________________________________________________________________
Parameter Weightage*
Saturation Dissolved Oxygen = 0.28
Fecal Coliform = 0.24
pH = 0.19
BOD = 0.16
Turbidity = 0.13
Chapter 4 EIA Study of Navi Mumbai International Airport Sheet 115 of 416
CESE, IIT Mumbai CIDCO
* These weights are given based on the relative importance of the above stated
parameters for calculating the NSF-WQI and total weightage of all parameters is
equal to 1.00
iv) Total Ground Water Quality
All physico-chemical parameters monitored for the ground water quality
show that all values observed are within their prescribed standards. Values
of BOD were slightly high at many locations and this could be due to
infiltration of sewage, decay of dead organisms or natural organic matters.
The presence of fecal coliform in the ground water collected from Vaghvli
and Ulwe areas indicate contamination with sanitary waste or percolation of
septic tank waste. The presence of high concentration of chlorides, sodium in
ground water indicates saline water intrusion in well waters of Koppar area.
Fluoride concentration and total hardness in the ground waters from Koppar
area was high and hence ground water at Koppar is not suitable for drinking,
bathing and laundry purposes.
Total ground water quality status in the project area could be assessed only
through water quality index which incorporated five parameters, viz. DO,
BOD, pH, fecal coliform and turbidity with independent weight as discussed
earlier in this report. The water quality index calculated for every monitoring
station in during the study period and is given in Table 4.38 to 4.40. The
WQI calculated for ground water was in the range of 75 – 91. According to
NSF Water Quality Index (WQI), the quality of ground water at nine locations
in the project area was good whereas ground water quality at Targhar was
found excellent. The overall quality of ground water in the project area was
found “Good” based on NSF Water Quality Index. The quality assessment
based on index method was done considering only five above said
parameters.
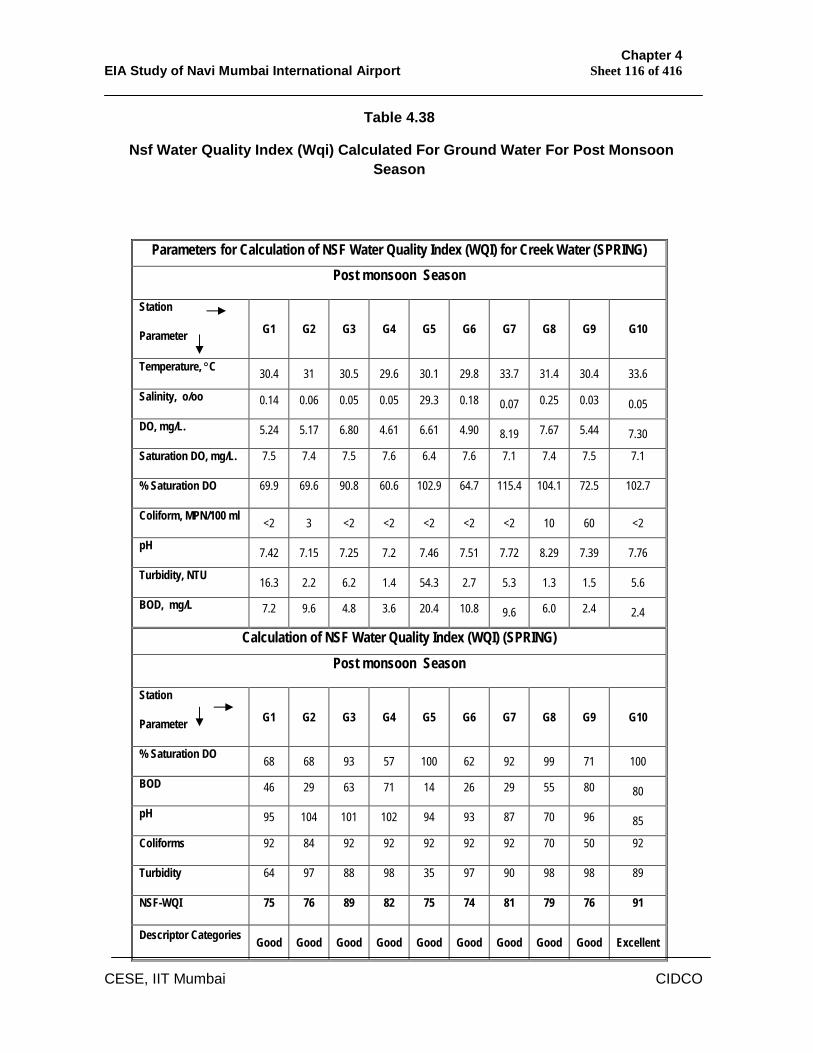
Chapter 4 EIA Study of Navi Mumbai International Airport Sheet 116 of 416
CESE, IIT Mumbai CIDCO
Table 4.38
Nsf Water Quality Index (Wqi) Calculated For Ground Water For Post Monsoon Season
Parameters for Calculation of NSF Water Quality Index (WQI) for Creek Water (SPRING) Post monsoon Season
Station
Parameter G1 G2 G3 G4 G5 G6 G7 G8 G9 G10
Temperature, C 30.4 31 30.5 29.6 30.1 29.8 33.7 31.4 30.4 33.6
Salinity, o/oo 0.14 0.06 0.05 0.05 29.3 0.18 0.07 0.25 0.03 0.05
DO, mg/L. 5.24 5.17 6.80 4.61 6.61 4.90 8.19 7.67 5.44 7.30
Saturation DO, mg/L. 7.5 7.4 7.5 7.6 6.4 7.6 7.1 7.4 7.5 7.1
% Saturation DO 69.9 69.6 90.8 60.6 102.9 64.7 115.4 104.1 72.5 102.7
Coliform, MPN/100 ml <2 3 <2 <2 <2 <2 <2 10 60 <2
pH 7.42 7.15 7.25 7.2 7.46 7.51 7.72 8.29 7.39 7.76
Turbidity, NTU 16.3 2.2 6.2 1.4 54.3 2.7 5.3 1.3 1.5 5.6
BOD, mg/L 7.2 9.6 4.8 3.6 20.4 10.8 9.6 6.0 2.4 2.4
Calculation of NSF Water Quality Index (WQI) (SPRING) Post monsoon Season
Station
Parameter G1 G2 G3 G4 G5 G6 G7 G8 G9 G10
% Saturation DO 68 68 93 57 100 62 92 99 71 100
BOD 46 29 63 71 14 26 29 55 80 80
pH 95 104 101 102 94 93 87 70 96 85
Coliforms 92 84 92 92 92 92 92 70 50 92
Turbidity 64 97 88 98 35 97 90 98 98 89
NSF-WQI 75 76 89 82 75 74 81 79 76 91
Descriptor Categories Good Good Good Good Good Good Good Good Good Excellent
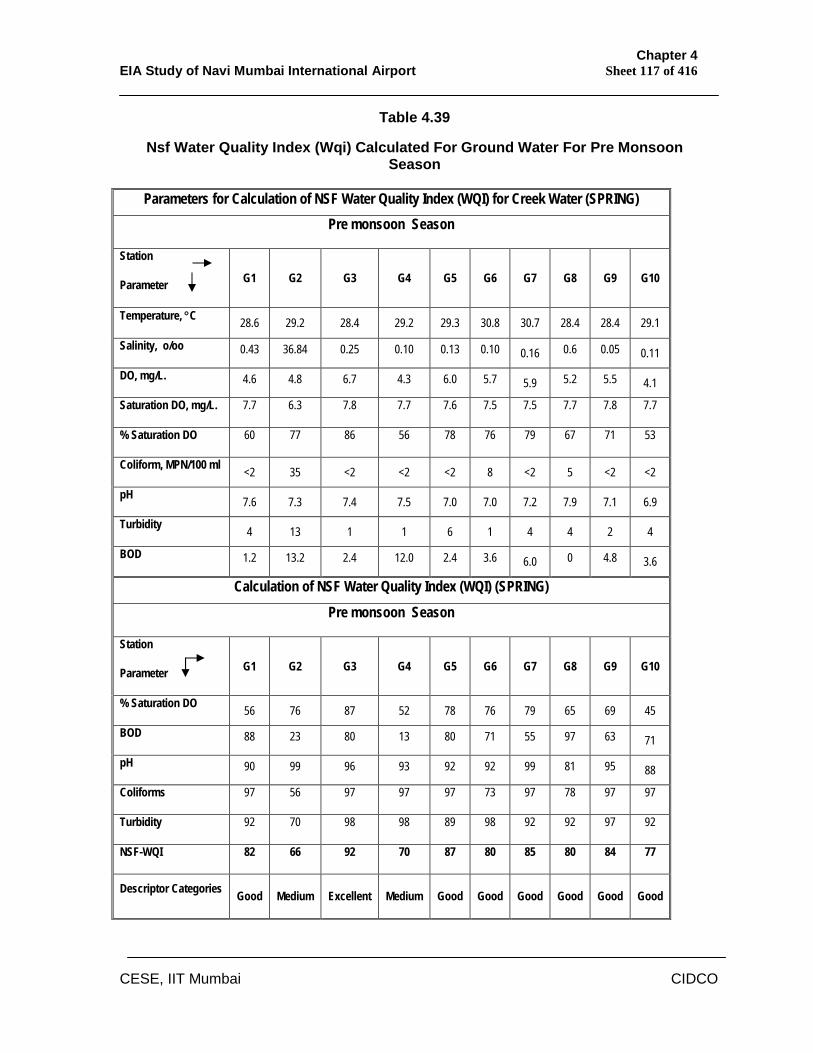
Chapter 4 EIA Study of Navi Mumbai International Airport Sheet 117 of 416
CESE, IIT Mumbai CIDCO
Table 4.39
Nsf Water Quality Index (Wqi) Calculated For Ground Water For Pre Monsoon Season
Parameters for Calculation of NSF Water Quality Index (WQI) for Creek Water (SPRING) Pre monsoon Season
Station
Parameter G1 G2 G3 G4 G5 G6 G7 G8 G9 G10
Temperature, C 28.6 29.2 28.4 29.2 29.3 30.8 30.7 28.4 28.4 29.1
Salinity, o/oo 0.43 36.84 0.25 0.10 0.13 0.10 0.16 0.6 0.05 0.11
DO, mg/L. 4.6 4.8 6.7 4.3 6.0 5.7 5.9 5.2 5.5 4.1
Saturation DO, mg/L. 7.7 6.3 7.8 7.7 7.6 7.5 7.5 7.7 7.8 7.7
% Saturation DO 60 77 86 56 78 76 79 67 71 53
Coliform, MPN/100 ml <2 35 <2 <2 <2 8 <2 5 <2 <2
pH 7.6 7.3 7.4 7.5 7.0 7.0 7.2 7.9 7.1 6.9
Turbidity 4 13 1 1 6 1 4 4 2 4
BOD 1.2 13.2 2.4 12.0 2.4 3.6 6.0 0 4.8 3.6
Calculation of NSF Water Quality Index (WQI) (SPRING) Pre monsoon Season
Station
Parameter G1 G2 G3 G4 G5 G6 G7 G8 G9 G10
% Saturation DO 56 76 87 52 78 76 79 65 69 45
BOD 88 23 80 13 80 71 55 97 63 71
pH 90 99 96 93 92 92 99 81 95 88
Coliforms 97 56 97 97 97 73 97 78 97 97
Turbidity 92 70 98 98 89 98 92 92 97 92
NSF-WQI 82 66 92 70 87 80 85 80 84 77
Descriptor Categories Good Medium Excellent Medium Good Good Good Good Good Good
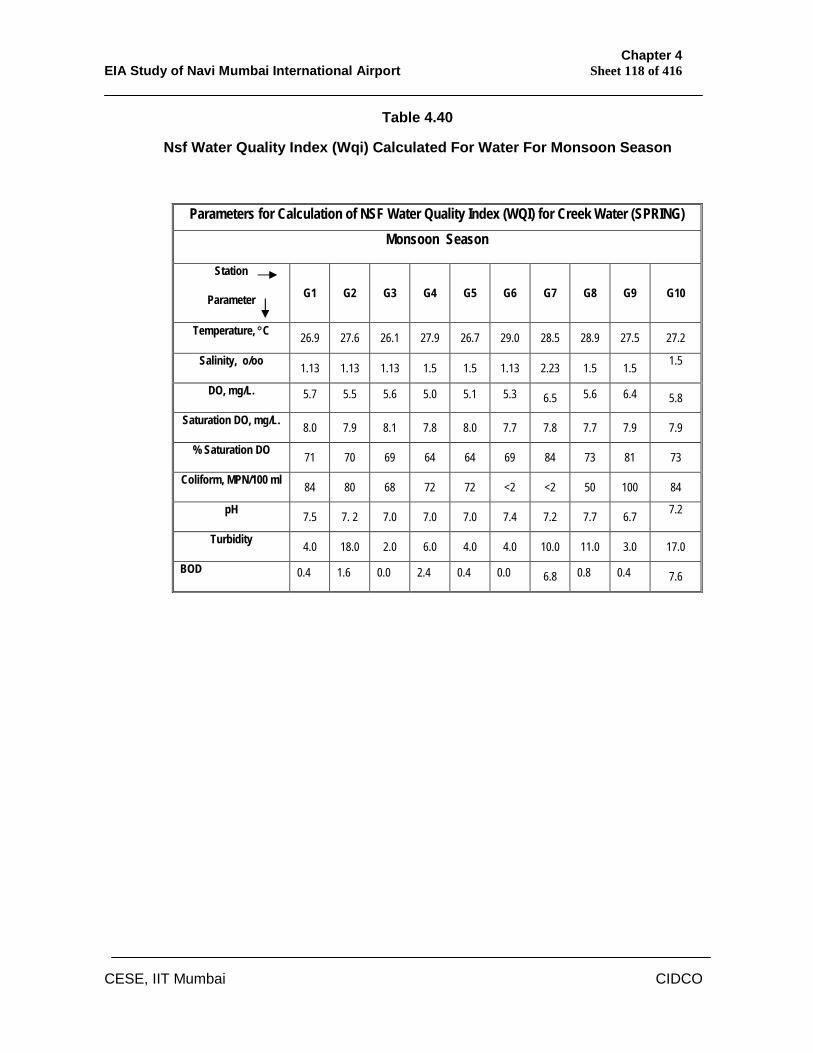
Chapter 4 EIA Study of Navi Mumbai International Airport Sheet 118 of 416
CESE, IIT Mumbai CIDCO
Table 4.40
Nsf Water Quality Index (Wqi) Calculated For Water For Monsoon Season
Parameters for Calculation of NSF Water Quality Index (WQI) for Creek Water (SPRING) Monsoon Season
Station
Parameter G1 G2 G3 G4 G5 G6 G7 G8 G9 G10
Temperature, C 26.9 27.6 26.1 27.9 26.7 29.0 28.5 28.9 27.5 27.2
Salinity, o/oo 1.13 1.13 1.13 1.5 1.5 1.13 2.23 1.5 1.5 1.5
DO, mg/L. 5.7 5.5 5.6 5.0 5.1 5.3 6.5 5.6 6.4 5.8
Saturation DO, mg/L. 8.0 7.9 8.1 7.8 8.0 7.7 7.8 7.7 7.9 7.9
% Saturation DO 71 70 69 64 64 69 84 73 81 73
Coliform, MPN/100 ml 84 80 68 72 72 <2 <2 50 100 84
pH 7.5 7. 2 7.0 7.0 7.0 7.4 7.2 7.7 6.7 7.2
Turbidity 4.0 18.0 2.0 6.0 4.0 4.0 10.0 11.0 3.0 17.0
BOD 0.4 1.6 0.0 2.4 0.4 0.0 6.8 0.8 0.4 7.6
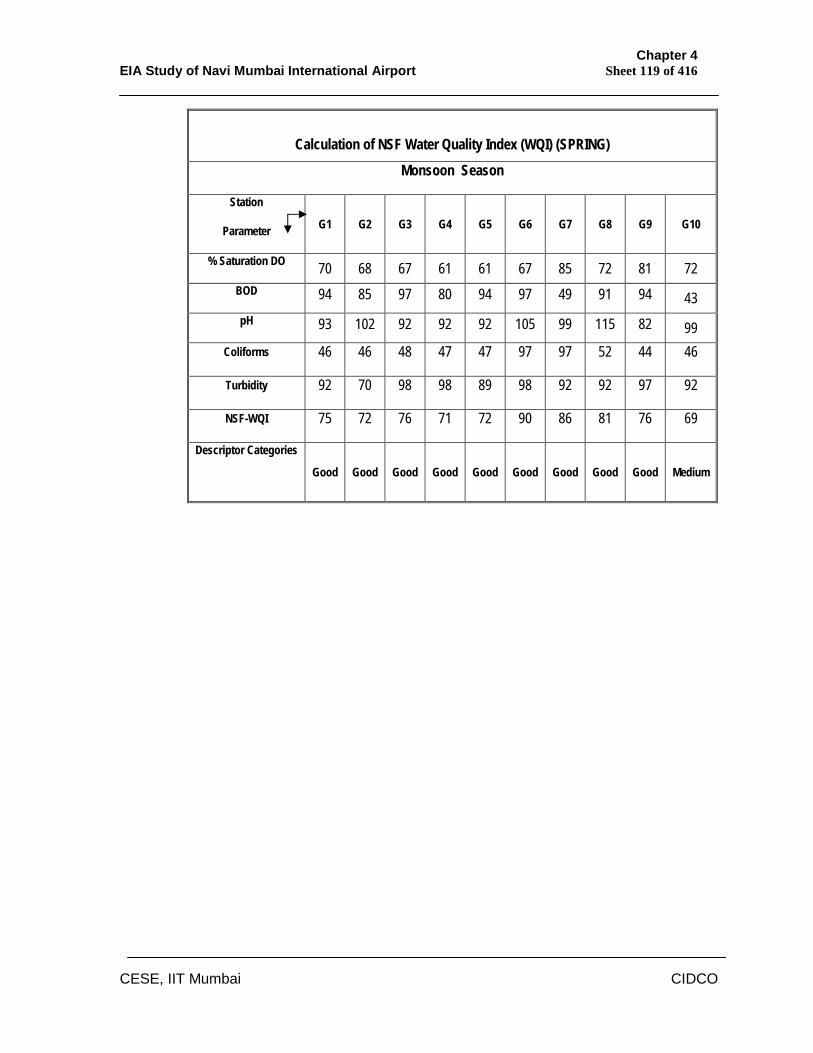
Chapter 4 EIA Study of Navi Mumbai International Airport Sheet 119 of 416
CESE, IIT Mumbai CIDCO
Calculation of NSF Water Quality Index (WQI) (SPRING)
Monsoon Season
Station
Parameter G1 G2 G3 G4 G5 G6 G7 G8 G9 G10
% Saturation DO 70 68 67 61 61 67 85 72 81 72 BOD 94 85 97 80 94 97 49 91 94 43 pH 93 102 92 92 92 105 99 115 82 99
Coliforms 46 46 48 47 47 97 97 52 44 46
Turbidity 92 70 98 98 89 98 92 92 97 92
NSF-WQI 75 72 76 71 72 90 86 81 76 69
Descriptor Categories
Good Good Good Good Good Good Good Good Good Medium
Chapter 4 EIA Study of Navi Mumbai International Airport Sheet 120 of 416
CESE, IIT Mumbai CIDCO
4.9 Air Environment
4.9.1 Air Quality
Air quality of the project area was assessed by monitoring of criteria
pollutants namely total particulate matter (TSP), respirable particulate matter
(RSPM or PM10 ), oxides of nitrogen (NOx), sulfur dioxide (SO2) and
ammonia (NH3), Carbon Monoxide (CO), Hydrocarbons (HC) at ten air
quality monitoring stations within 20 km of the project area. The selections
of stations were based on WHO (1981) guidelines. The monitoring stations
selected were PCO (Panvel CIDCO Office), KRS (Khandeshwar Railway
Station), KCO (Kalamboli CIDCO Office), KNO (Kharghar Nodal Office),
BCB (Belapur CIDCO Bhavan), PHS (Pargaon High School), GWT
(Gavanphata Water Tank), ACL (Ambuja Cement Ltd.), KGH (Kille Gaothan
Guest House) and PGH (Panchsheel Guest House). The monitoring was
done during post monsoon, pre monsoon and monsoon season at a
frequency of twice a week at each station for 24 hours. Post monsoon
season was considered during the month of November, 2007 to October,
2008, Winter season was considered from December, 2007 to February,
2008, pre monsoon season was considered from March, 2008 to May, 2008
and monsoon season was considered from June, 2008 to September, 2008.
Justification for selection of the monitoring stations is given in Table 4.41. Locations of air monitoring stations are given in Figure 4.24.
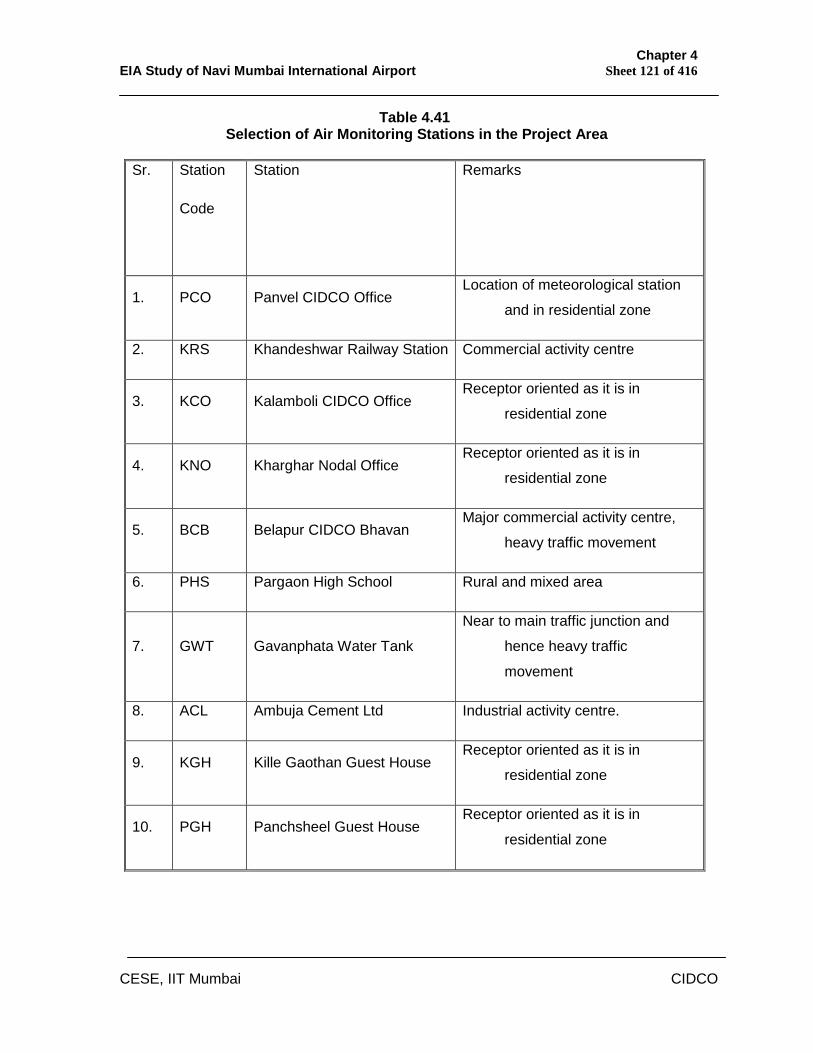
Chapter 4 EIA Study of Navi Mumbai International Airport Sheet 121 of 416
CESE, IIT Mumbai CIDCO
Table 4.41 Selection of Air Monitoring Stations in the Project Area
Sr. Station
Code
Station Remarks
1. PCO Panvel CIDCO Office Location of meteorological station
and in residential zone
2. KRS Khandeshwar Railway Station Commercial activity centre
3. KCO Kalamboli CIDCO Office Receptor oriented as it is in
residential zone
4. KNO Kharghar Nodal Office Receptor oriented as it is in
residential zone
5. BCB Belapur CIDCO Bhavan Major commercial activity centre,
heavy traffic movement
6. PHS Pargaon High School Rural and mixed area
7. GWT Gavanphata Water Tank
Near to main traffic junction and
hence heavy traffic
movement
8. ACL Ambuja Cement Ltd Industrial activity centre.
9. KGH Kille Gaothan Guest House Receptor oriented as it is in
residential zone
10. PGH Panchsheel Guest House Receptor oriented as it is in
residential zone
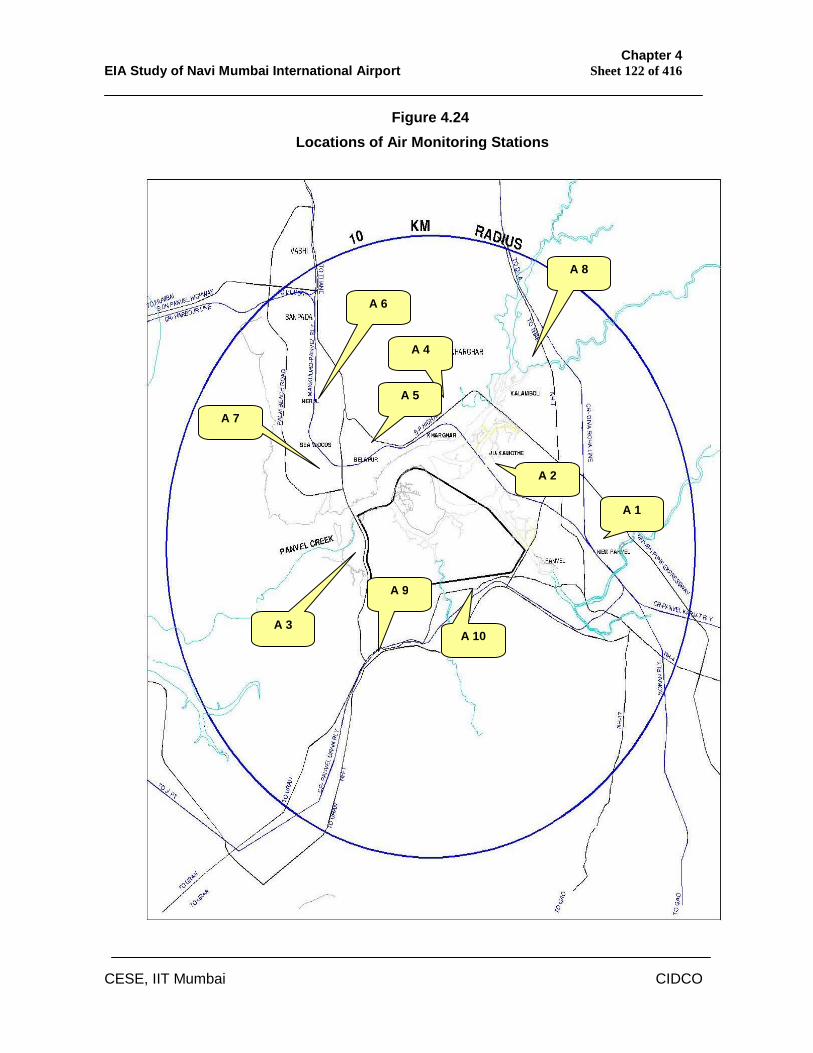
Chapter 4 EIA Study of Navi Mumbai International Airport Sheet 122 of 416
CESE, IIT Mumbai CIDCO
Figure 4.24
Locations of Air Monitoring Stations
A 9
A 1
A 2
A 3
A 4
A 5
A 6
A 7
A 10
A 8
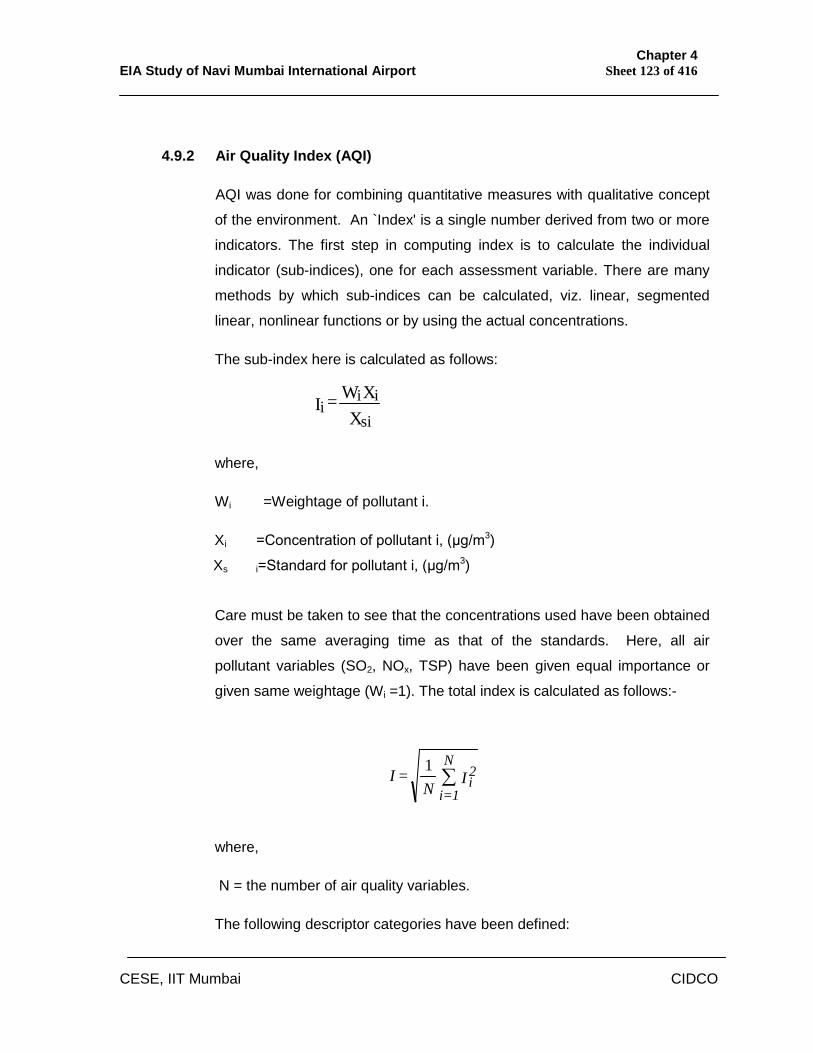
Chapter 4 EIA Study of Navi Mumbai International Airport Sheet 123 of 416
CESE, IIT Mumbai CIDCO
4.9.2 Air Quality Index (AQI)
AQI was done for combining quantitative measures with qualitative concept
of the environment. An `Index' is a single number derived from two or more
indicators. The first step in computing index is to calculate the individual
indicator (sub-indices), one for each assessment variable. There are many
methods by which sub-indices can be calculated, viz. linear, segmented
linear, nonlinear functions or by using the actual concentrations.
The sub-index here is calculated as follows:
XXW = Isi
iii
where,
Wi =Weightage of pollutant i.
Xi =Concentration of pollutant i, (µg/m3)
Xs i=Standard for pollutant i, (µg/m3)
Care must be taken to see that the concentrations used have been obtained
over the same averaging time as that of the standards. Here, all air
pollutant variables (SO2, NOx, TSP) have been given equal importance or
given same weightage (Wi =1). The total index is calculated as follows:-
where,
N = the number of air quality variables.
The following descriptor categories have been defined:
I N
= I 2i
N
1=i
1
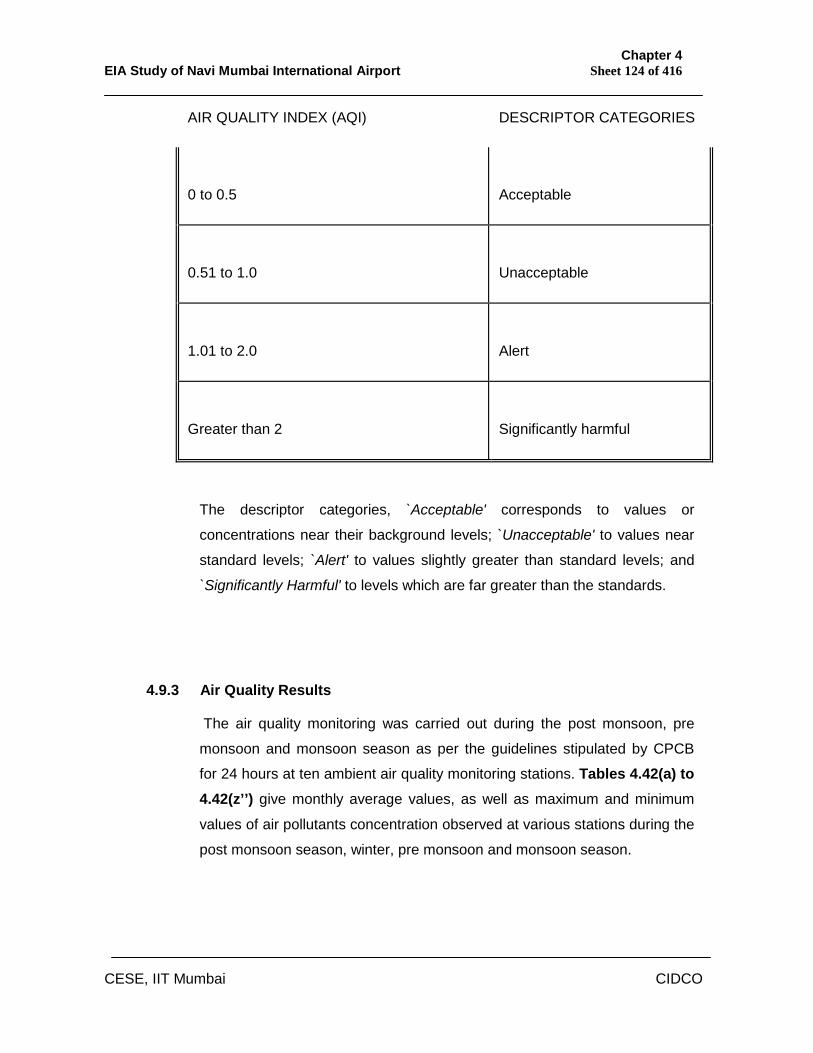
Chapter 4 EIA Study of Navi Mumbai International Airport Sheet 124 of 416
CESE, IIT Mumbai CIDCO
AIR QUALITY INDEX (AQI) DESCRIPTOR CATEGORIES
0 to 0.5
Acceptable
0.51 to 1.0
Unacceptable
1.01 to 2.0
Alert
Greater than 2
Significantly harmful
The descriptor categories, `Acceptable' corresponds to values or
concentrations near their background levels; `Unacceptable' to values near
standard levels; `Alert' to values slightly greater than standard levels; and
`Significantly Harmful' to levels which are far greater than the standards.
4.9.3 Air Quality Results
The air quality monitoring was carried out during the post monsoon, pre
monsoon and monsoon season as per the guidelines stipulated by CPCB
for 24 hours at ten ambient air quality monitoring stations. Tables 4.42(a) to 4.42(z’’) give monthly average values, as well as maximum and minimum
values of air pollutants concentration observed at various stations during the
post monsoon season, winter, pre monsoon and monsoon season.
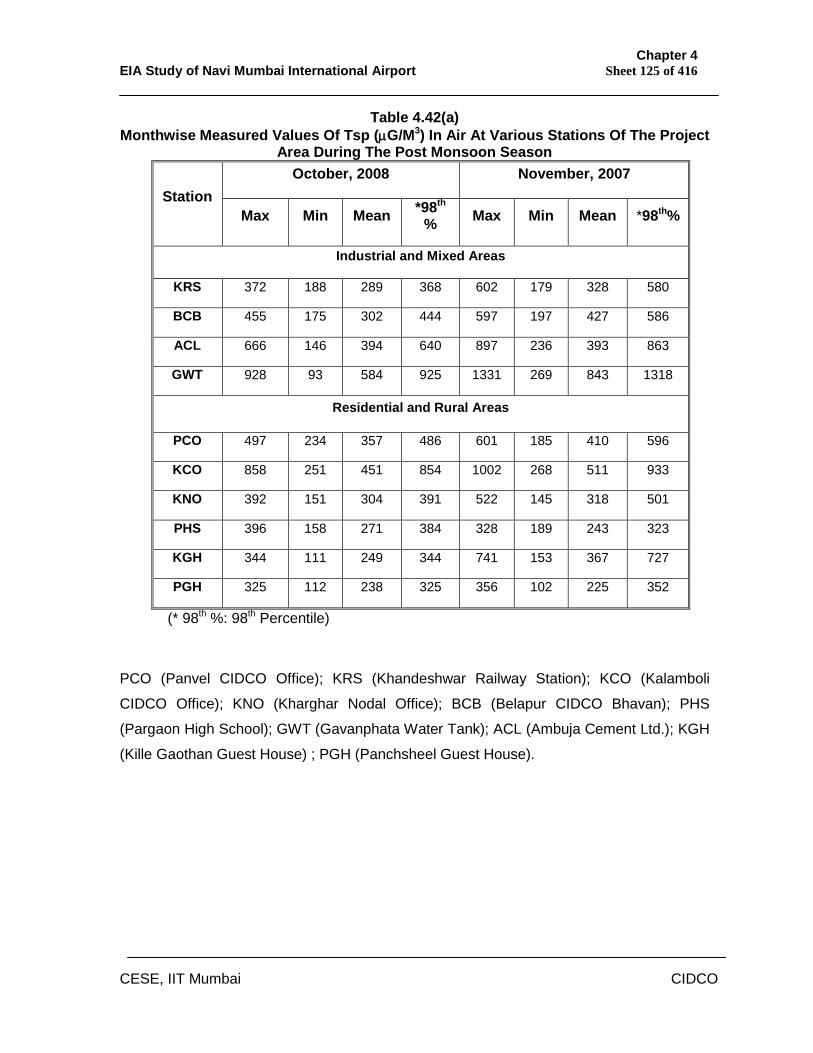
Chapter 4 EIA Study of Navi Mumbai International Airport Sheet 125 of 416
CESE, IIT Mumbai CIDCO
Table 4.42(a) Monthwise Measured Values Of Tsp (G/M3) In Air At Various Stations Of The Project
Area During The Post Monsoon Season October, 2008 November, 2007
Station Max Min Mean *98th
% Max Min Mean *98th%
Industrial and Mixed Areas
KRS 372 188 289 368 602 179 328 580
BCB 455 175 302 444 597 197 427 586
ACL 666 146 394 640 897 236 393 863
GWT 928 93 584 925 1331 269 843 1318
Residential and Rural Areas
PCO 497 234 357 486 601 185 410 596
KCO 858 251 451 854 1002 268 511 933
KNO 392 151 304 391 522 145 318 501
PHS 396 158 271 384 328 189 243 323
KGH 344 111 249 344 741 153 367 727
PGH 325 112 238 325 356 102 225 352
(* 98th %: 98th Percentile)
PCO (Panvel CIDCO Office); KRS (Khandeshwar Railway Station); KCO (Kalamboli
CIDCO Office); KNO (Kharghar Nodal Office); BCB (Belapur CIDCO Bhavan); PHS
(Pargaon High School); GWT (Gavanphata Water Tank); ACL (Ambuja Cement Ltd.); KGH
(Kille Gaothan Guest House) ; PGH (Panchsheel Guest House).
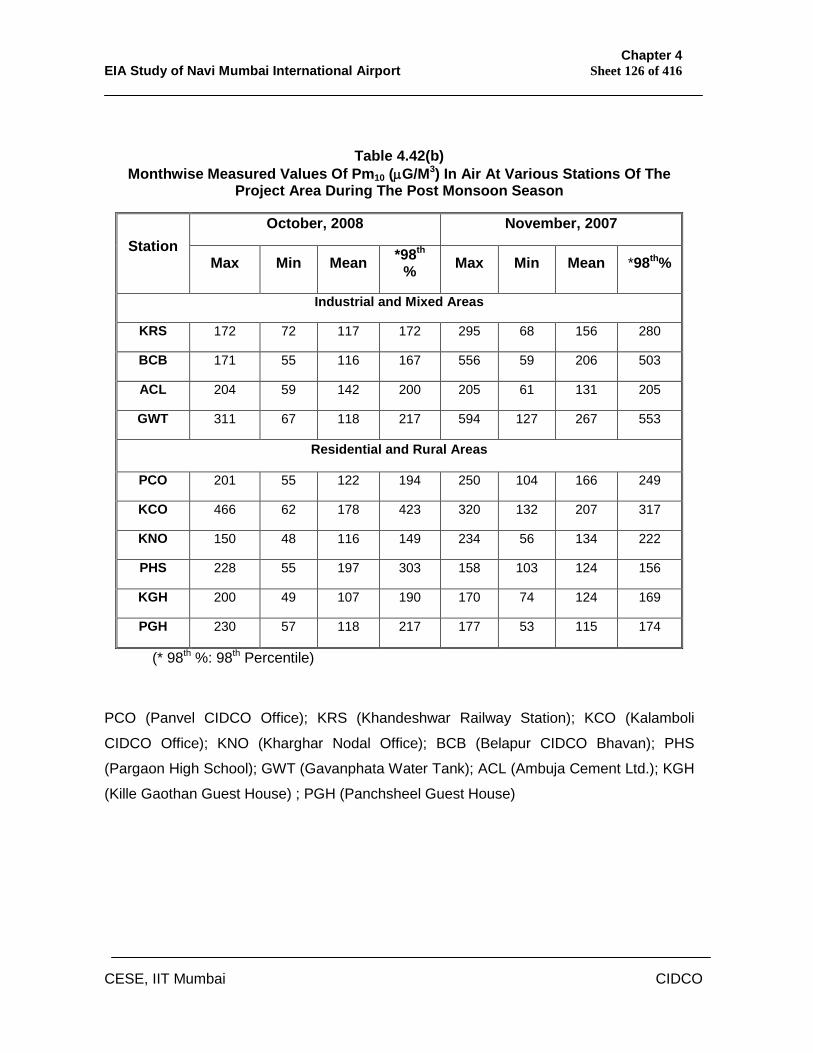
Chapter 4 EIA Study of Navi Mumbai International Airport Sheet 126 of 416
CESE, IIT Mumbai CIDCO
Table 4.42(b) Monthwise Measured Values Of Pm10 (G/M3) In Air At Various Stations Of The
Project Area During The Post Monsoon Season
October, 2008 November, 2007 Station
Max Min Mean *98th % Max Min Mean *98th%
Industrial and Mixed Areas
KRS 172 72 117 172 295 68 156 280
BCB 171 55 116 167 556 59 206 503
ACL 204 59 142 200 205 61 131 205
GWT 311 67 118 217 594 127 267 553
Residential and Rural Areas
PCO 201 55 122 194 250 104 166 249
KCO 466 62 178 423 320 132 207 317
KNO 150 48 116 149 234 56 134 222
PHS 228 55 197 303 158 103 124 156
KGH 200 49 107 190 170 74 124 169
PGH 230 57 118 217 177 53 115 174
(* 98th %: 98th Percentile)
PCO (Panvel CIDCO Office); KRS (Khandeshwar Railway Station); KCO (Kalamboli
CIDCO Office); KNO (Kharghar Nodal Office); BCB (Belapur CIDCO Bhavan); PHS
(Pargaon High School); GWT (Gavanphata Water Tank); ACL (Ambuja Cement Ltd.); KGH
(Kille Gaothan Guest House) ; PGH (Panchsheel Guest House)
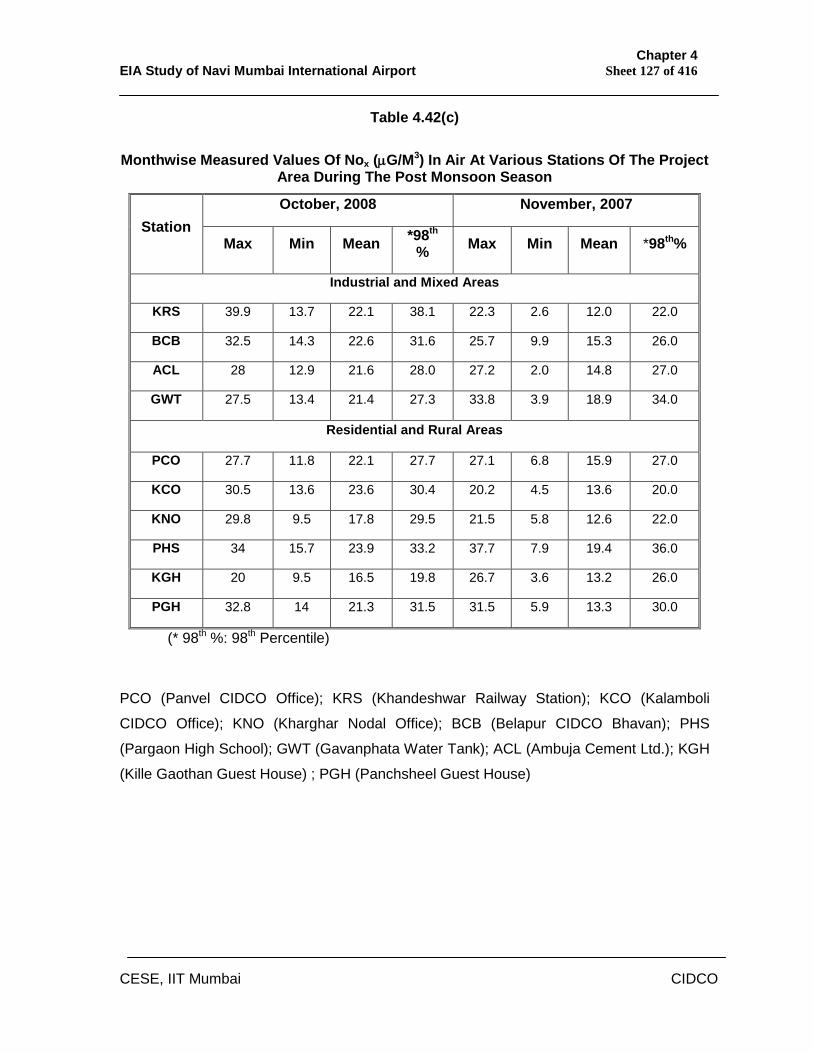
Chapter 4 EIA Study of Navi Mumbai International Airport Sheet 127 of 416
CESE, IIT Mumbai CIDCO
Table 4.42(c)
Monthwise Measured Values Of Nox (G/M3) In Air At Various Stations Of The Project Area During The Post Monsoon Season
October, 2008 November, 2007 Station
Max Min Mean *98th % Max Min Mean *98th%
Industrial and Mixed Areas
KRS 39.9 13.7 22.1 38.1 22.3 2.6 12.0 22.0
BCB 32.5 14.3 22.6 31.6 25.7 9.9 15.3 26.0
ACL 28 12.9 21.6 28.0 27.2 2.0 14.8 27.0
GWT 27.5 13.4 21.4 27.3 33.8 3.9 18.9 34.0
Residential and Rural Areas
PCO 27.7 11.8 22.1 27.7 27.1 6.8 15.9 27.0
KCO 30.5 13.6 23.6 30.4 20.2 4.5 13.6 20.0
KNO 29.8 9.5 17.8 29.5 21.5 5.8 12.6 22.0
PHS 34 15.7 23.9 33.2 37.7 7.9 19.4 36.0
KGH 20 9.5 16.5 19.8 26.7 3.6 13.2 26.0
PGH 32.8 14 21.3 31.5 31.5 5.9 13.3 30.0
(* 98th %: 98th Percentile)
PCO (Panvel CIDCO Office); KRS (Khandeshwar Railway Station); KCO (Kalamboli
CIDCO Office); KNO (Kharghar Nodal Office); BCB (Belapur CIDCO Bhavan); PHS
(Pargaon High School); GWT (Gavanphata Water Tank); ACL (Ambuja Cement Ltd.); KGH
(Kille Gaothan Guest House) ; PGH (Panchsheel Guest House)
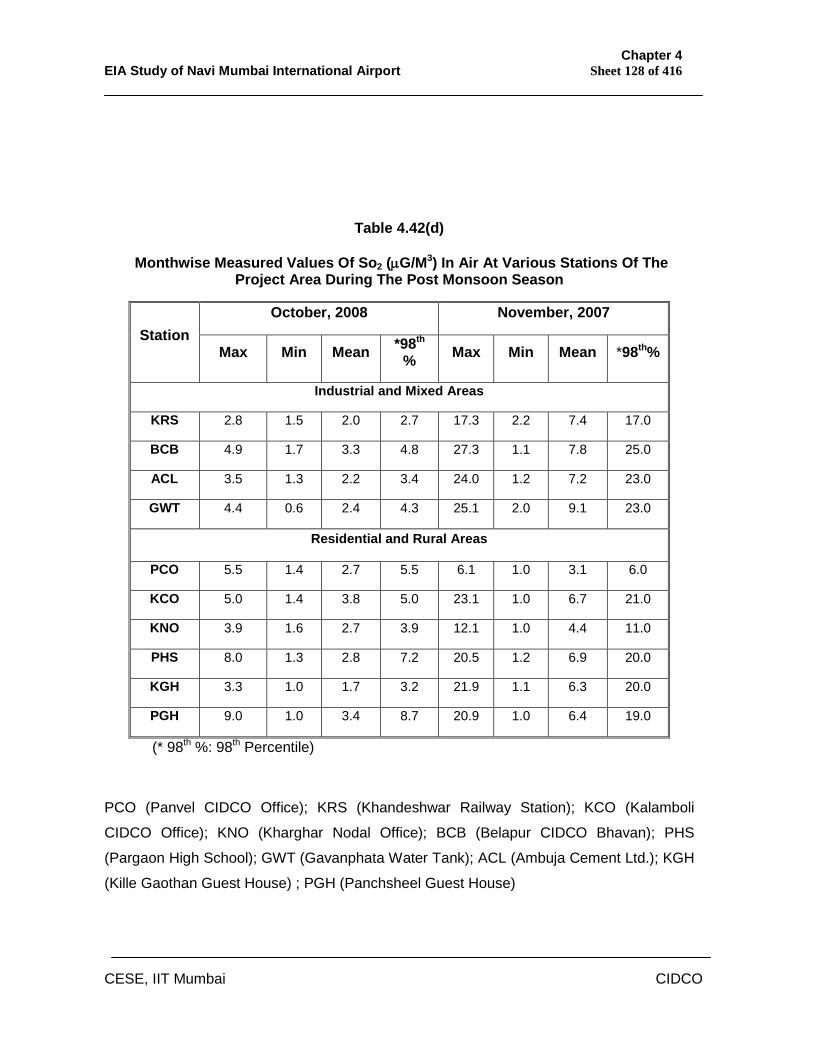
Chapter 4 EIA Study of Navi Mumbai International Airport Sheet 128 of 416
CESE, IIT Mumbai CIDCO
Table 4.42(d)
Monthwise Measured Values Of So2 (G/M3) In Air At Various Stations Of The Project Area During The Post Monsoon Season
October, 2008 November, 2007 Station
Max Min Mean *98th % Max Min Mean *98th%
Industrial and Mixed Areas
KRS 2.8 1.5 2.0 2.7 17.3 2.2 7.4 17.0
BCB 4.9 1.7 3.3 4.8 27.3 1.1 7.8 25.0
ACL 3.5 1.3 2.2 3.4 24.0 1.2 7.2 23.0
GWT 4.4 0.6 2.4 4.3 25.1 2.0 9.1 23.0
Residential and Rural Areas
PCO 5.5 1.4 2.7 5.5 6.1 1.0 3.1 6.0
KCO 5.0 1.4 3.8 5.0 23.1 1.0 6.7 21.0
KNO 3.9 1.6 2.7 3.9 12.1 1.0 4.4 11.0
PHS 8.0 1.3 2.8 7.2 20.5 1.2 6.9 20.0
KGH 3.3 1.0 1.7 3.2 21.9 1.1 6.3 20.0
PGH 9.0 1.0 3.4 8.7 20.9 1.0 6.4 19.0
(* 98th %: 98th Percentile)
PCO (Panvel CIDCO Office); KRS (Khandeshwar Railway Station); KCO (Kalamboli
CIDCO Office); KNO (Kharghar Nodal Office); BCB (Belapur CIDCO Bhavan); PHS
(Pargaon High School); GWT (Gavanphata Water Tank); ACL (Ambuja Cement Ltd.); KGH
(Kille Gaothan Guest House) ; PGH (Panchsheel Guest House)
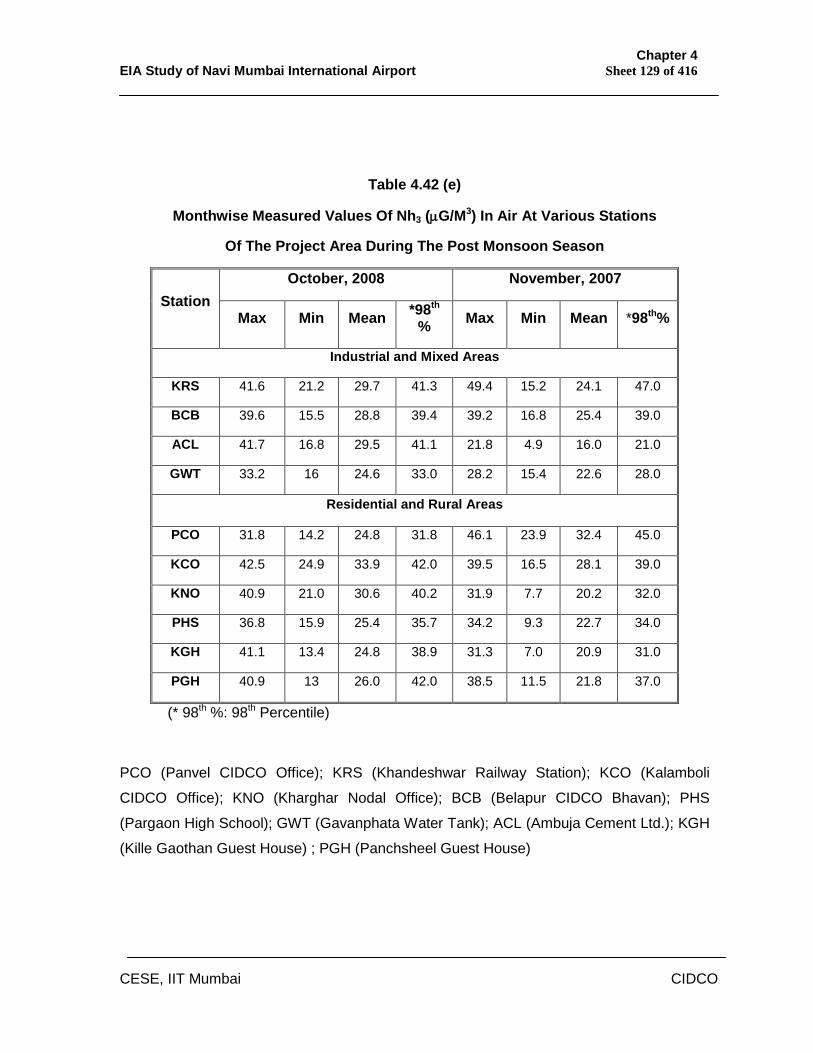
Chapter 4 EIA Study of Navi Mumbai International Airport Sheet 129 of 416
CESE, IIT Mumbai CIDCO
Table 4.42 (e)
Monthwise Measured Values Of Nh3 (G/M3) In Air At Various Stations
Of The Project Area During The Post Monsoon Season
October, 2008 November, 2007 Station
Max Min Mean *98th % Max Min Mean *98th%
Industrial and Mixed Areas
KRS 41.6 21.2 29.7 41.3 49.4 15.2 24.1 47.0
BCB 39.6 15.5 28.8 39.4 39.2 16.8 25.4 39.0
ACL 41.7 16.8 29.5 41.1 21.8 4.9 16.0 21.0
GWT 33.2 16 24.6 33.0 28.2 15.4 22.6 28.0
Residential and Rural Areas
PCO 31.8 14.2 24.8 31.8 46.1 23.9 32.4 45.0
KCO 42.5 24.9 33.9 42.0 39.5 16.5 28.1 39.0
KNO 40.9 21.0 30.6 40.2 31.9 7.7 20.2 32.0
PHS 36.8 15.9 25.4 35.7 34.2 9.3 22.7 34.0
KGH 41.1 13.4 24.8 38.9 31.3 7.0 20.9 31.0
PGH 40.9 13 26.0 42.0 38.5 11.5 21.8 37.0
(* 98th %: 98th Percentile)
PCO (Panvel CIDCO Office); KRS (Khandeshwar Railway Station); KCO (Kalamboli
CIDCO Office); KNO (Kharghar Nodal Office); BCB (Belapur CIDCO Bhavan); PHS
(Pargaon High School); GWT (Gavanphata Water Tank); ACL (Ambuja Cement Ltd.); KGH
(Kille Gaothan Guest House) ; PGH (Panchsheel Guest House)
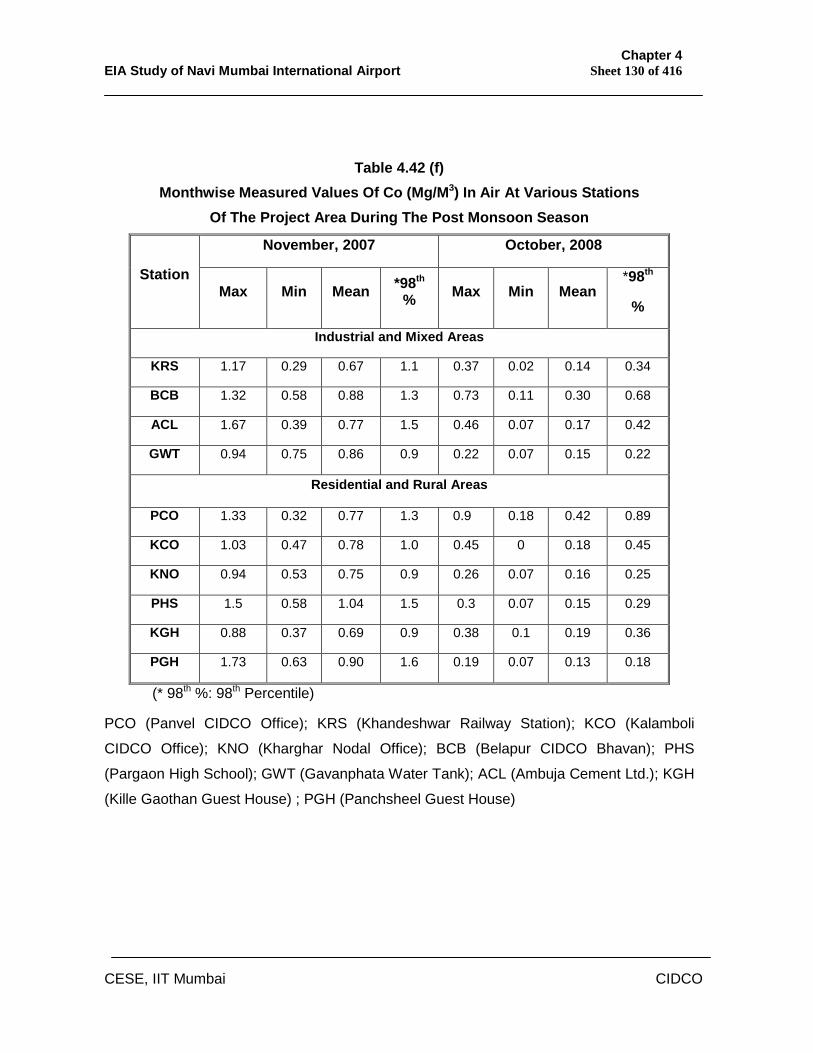
Chapter 4 EIA Study of Navi Mumbai International Airport Sheet 130 of 416
CESE, IIT Mumbai CIDCO
Table 4.42 (f) Monthwise Measured Values Of Co (Mg/M3) In Air At Various Stations
Of The Project Area During The Post Monsoon Season
November, 2007 October, 2008
Station Max Min Mean *98th
% Max Min Mean *98th
%
Industrial and Mixed Areas
KRS 1.17 0.29 0.67 1.1 0.37 0.02 0.14 0.34
BCB 1.32 0.58 0.88 1.3 0.73 0.11 0.30 0.68
ACL 1.67 0.39 0.77 1.5 0.46 0.07 0.17 0.42
GWT 0.94 0.75 0.86 0.9 0.22 0.07 0.15 0.22
Residential and Rural Areas
PCO 1.33 0.32 0.77 1.3 0.9 0.18 0.42 0.89
KCO 1.03 0.47 0.78 1.0 0.45 0 0.18 0.45
KNO 0.94 0.53 0.75 0.9 0.26 0.07 0.16 0.25
PHS 1.5 0.58 1.04 1.5 0.3 0.07 0.15 0.29
KGH 0.88 0.37 0.69 0.9 0.38 0.1 0.19 0.36
PGH 1.73 0.63 0.90 1.6 0.19 0.07 0.13 0.18
(* 98th %: 98th Percentile)
PCO (Panvel CIDCO Office); KRS (Khandeshwar Railway Station); KCO (Kalamboli
CIDCO Office); KNO (Kharghar Nodal Office); BCB (Belapur CIDCO Bhavan); PHS
(Pargaon High School); GWT (Gavanphata Water Tank); ACL (Ambuja Cement Ltd.); KGH
(Kille Gaothan Guest House) ; PGH (Panchsheel Guest House)
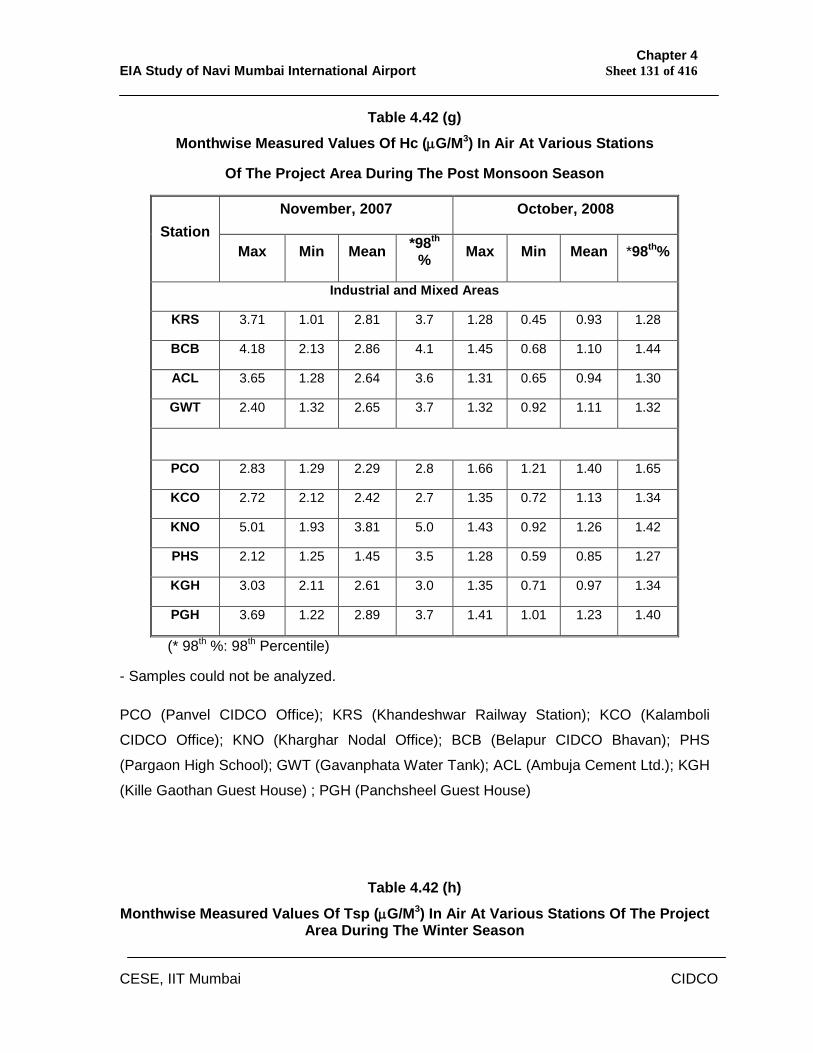
Chapter 4 EIA Study of Navi Mumbai International Airport Sheet 131 of 416
CESE, IIT Mumbai CIDCO
Table 4.42 (g)
Monthwise Measured Values Of Hc (G/M3) In Air At Various Stations
Of The Project Area During The Post Monsoon Season
November, 2007 October, 2008 Station
Max Min Mean *98th % Max Min Mean *98th%
Industrial and Mixed Areas
KRS 3.71 1.01 2.81 3.7 1.28 0.45 0.93 1.28
BCB 4.18 2.13 2.86 4.1 1.45 0.68 1.10 1.44
ACL 3.65 1.28 2.64 3.6 1.31 0.65 0.94 1.30
GWT 2.40 1.32 2.65 3.7 1.32 0.92 1.11 1.32
PCO 2.83 1.29 2.29 2.8 1.66 1.21 1.40 1.65
KCO 2.72 2.12 2.42 2.7 1.35 0.72 1.13 1.34
KNO 5.01 1.93 3.81 5.0 1.43 0.92 1.26 1.42
PHS 2.12 1.25 1.45 3.5 1.28 0.59 0.85 1.27
KGH 3.03 2.11 2.61 3.0 1.35 0.71 0.97 1.34
PGH 3.69 1.22 2.89 3.7 1.41 1.01 1.23 1.40
(* 98th %: 98th Percentile)
- Samples could not be analyzed.
PCO (Panvel CIDCO Office); KRS (Khandeshwar Railway Station); KCO (Kalamboli
CIDCO Office); KNO (Kharghar Nodal Office); BCB (Belapur CIDCO Bhavan); PHS
(Pargaon High School); GWT (Gavanphata Water Tank); ACL (Ambuja Cement Ltd.); KGH
(Kille Gaothan Guest House) ; PGH (Panchsheel Guest House)
Table 4.42 (h)
Monthwise Measured Values Of Tsp (G/M3) In Air At Various Stations Of The Project Area During The Winter Season
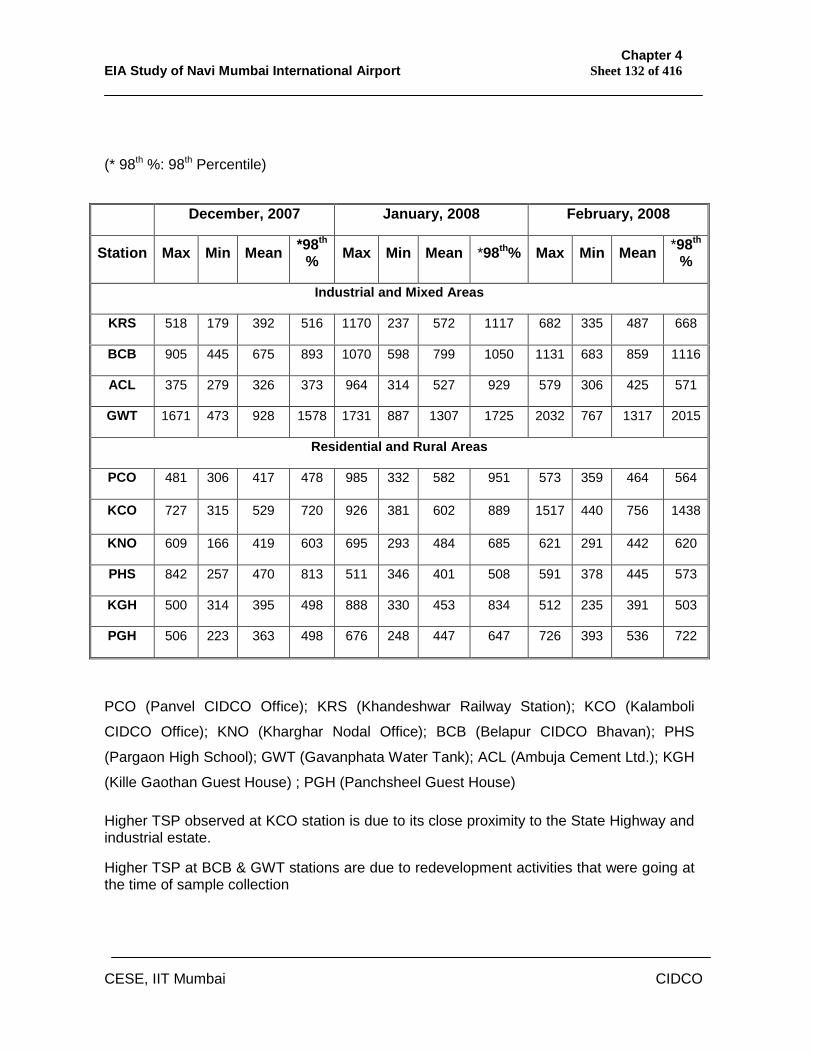
Chapter 4 EIA Study of Navi Mumbai International Airport Sheet 132 of 416
CESE, IIT Mumbai CIDCO
(* 98th %: 98th Percentile)
PCO (Panvel CIDCO Office); KRS (Khandeshwar Railway Station); KCO (Kalamboli
CIDCO Office); KNO (Kharghar Nodal Office); BCB (Belapur CIDCO Bhavan); PHS
(Pargaon High School); GWT (Gavanphata Water Tank); ACL (Ambuja Cement Ltd.); KGH
(Kille Gaothan Guest House) ; PGH (Panchsheel Guest House)
Higher TSP observed at KCO station is due to its close proximity to the State Highway and industrial estate.
Higher TSP at BCB & GWT stations are due to redevelopment activities that were going at the time of sample collection
December, 2007 January, 2008 February, 2008
Station Max Min Mean *98th % Max Min Mean *98th% Max Min Mean *98th
%
Industrial and Mixed Areas
KRS 518 179 392 516 1170 237 572 1117 682 335 487 668
BCB 905 445 675 893 1070 598 799 1050 1131 683 859 1116
ACL 375 279 326 373 964 314 527 929 579 306 425 571
GWT 1671 473 928 1578 1731 887 1307 1725 2032 767 1317 2015
Residential and Rural Areas
PCO 481 306 417 478 985 332 582 951 573 359 464 564
KCO 727 315 529 720 926 381 602 889 1517 440 756 1438
KNO 609 166 419 603 695 293 484 685 621 291 442 620
PHS 842 257 470 813 511 346 401 508 591 378 445 573
KGH 500 314 395 498 888 330 453 834 512 235 391 503
PGH 506 223 363 498 676 248 447 647 726 393 536 722
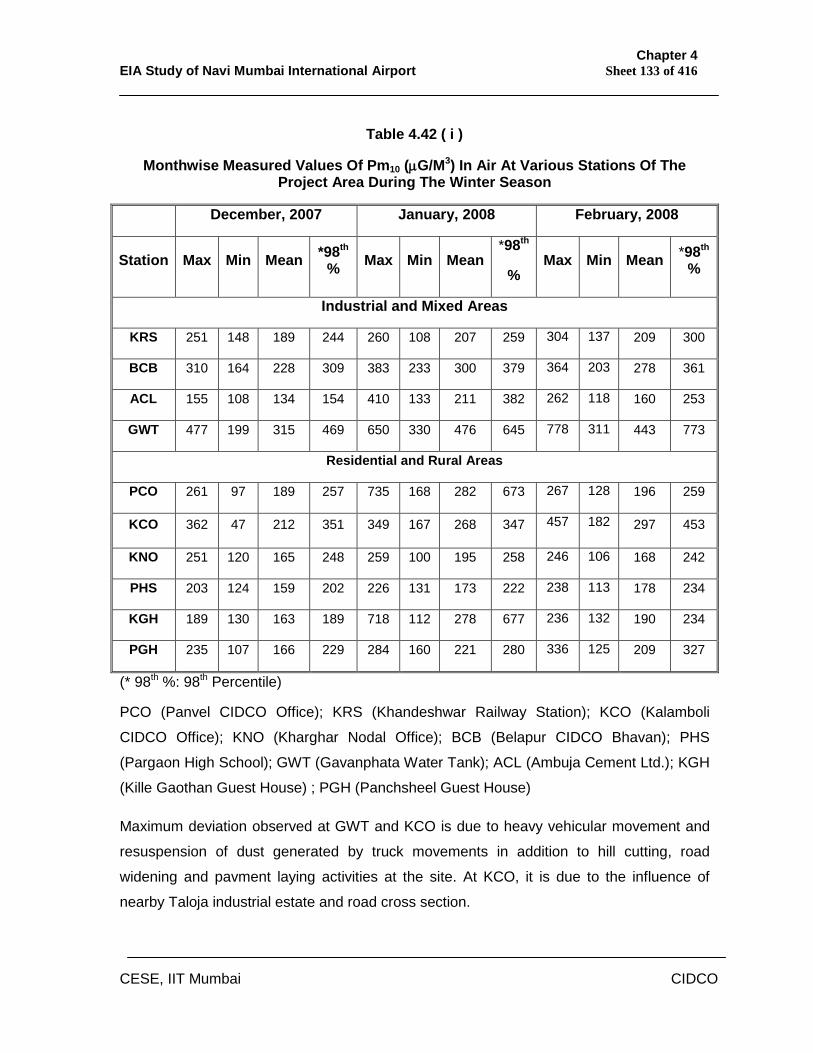
Chapter 4 EIA Study of Navi Mumbai International Airport Sheet 133 of 416
CESE, IIT Mumbai CIDCO
Table 4.42 ( i )
Monthwise Measured Values Of Pm10 (G/M3) In Air At Various Stations Of The Project Area During The Winter Season
December, 2007 January, 2008 February, 2008
Station Max Min Mean *98th % Max Min Mean
*98th
% Max Min Mean *98th
%
Industrial and Mixed Areas
KRS 251 148 189 244 260 108 207 259 304 137 209 300
BCB 310 164 228 309 383 233 300 379 364 203 278 361
ACL 155 108 134 154 410 133 211 382 262 118 160 253
GWT 477 199 315 469 650 330 476 645 778 311 443 773
Residential and Rural Areas
PCO 261 97 189 257 735 168 282 673 267 128 196 259
KCO 362 47 212 351 349 167 268 347 457 182 297 453
KNO 251 120 165 248 259 100 195 258 246 106 168 242
PHS 203 124 159 202 226 131 173 222 238 113 178 234
KGH 189 130 163 189 718 112 278 677 236 132 190 234
PGH 235 107 166 229 284 160 221 280 336 125 209 327
(* 98th %: 98th Percentile)
PCO (Panvel CIDCO Office); KRS (Khandeshwar Railway Station); KCO (Kalamboli
CIDCO Office); KNO (Kharghar Nodal Office); BCB (Belapur CIDCO Bhavan); PHS
(Pargaon High School); GWT (Gavanphata Water Tank); ACL (Ambuja Cement Ltd.); KGH
(Kille Gaothan Guest House) ; PGH (Panchsheel Guest House)
Maximum deviation observed at GWT and KCO is due to heavy vehicular movement and
resuspension of dust generated by truck movements in addition to hill cutting, road
widening and pavment laying activities at the site. At KCO, it is due to the influence of
nearby Taloja industrial estate and road cross section.
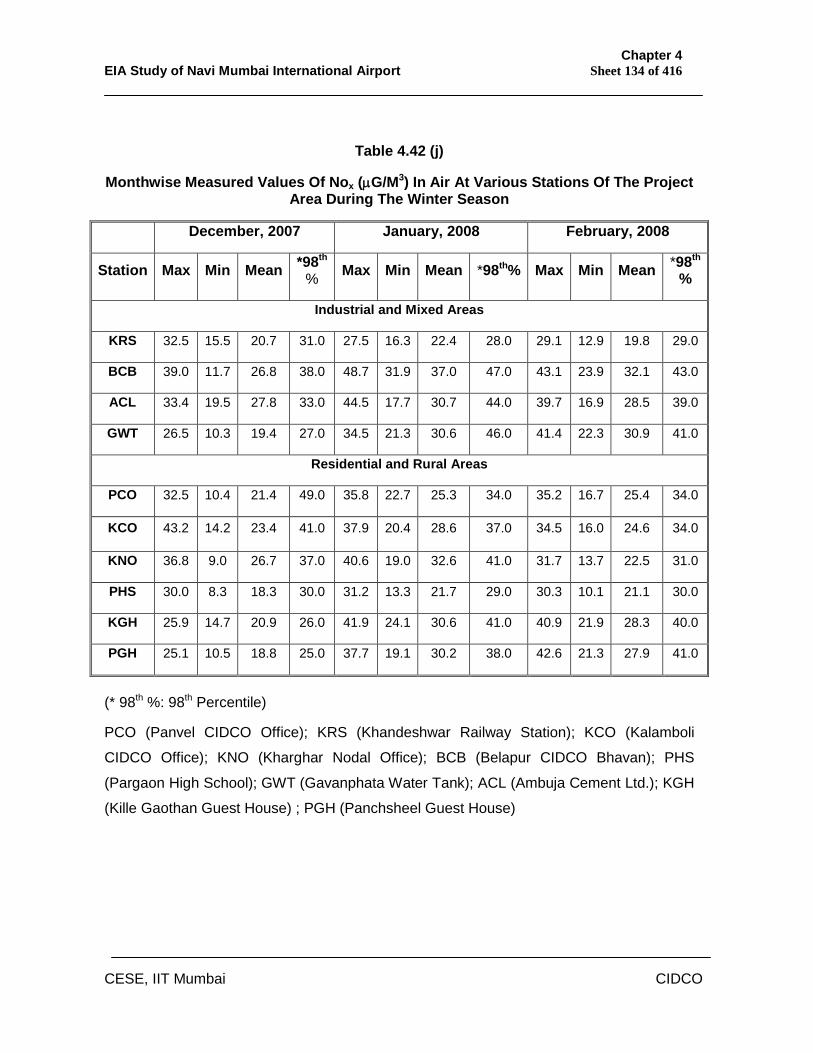
Chapter 4 EIA Study of Navi Mumbai International Airport Sheet 134 of 416
CESE, IIT Mumbai CIDCO
Table 4.42 (j)
Monthwise Measured Values Of Nox (G/M3) In Air At Various Stations Of The Project Area During The Winter Season
December, 2007 January, 2008 February, 2008
Station Max Min Mean *98th % Max Min Mean *98th% Max Min Mean *98th
%
Industrial and Mixed Areas
KRS 32.5 15.5 20.7 31.0 27.5 16.3 22.4 28.0 29.1 12.9 19.8 29.0
BCB 39.0 11.7 26.8 38.0 48.7 31.9 37.0 47.0 43.1 23.9 32.1 43.0
ACL 33.4 19.5 27.8 33.0 44.5 17.7 30.7 44.0 39.7 16.9 28.5 39.0
GWT 26.5 10.3 19.4 27.0 34.5 21.3 30.6 46.0 41.4 22.3 30.9 41.0
Residential and Rural Areas
PCO 32.5 10.4 21.4 49.0 35.8 22.7 25.3 34.0 35.2 16.7 25.4 34.0
KCO 43.2 14.2 23.4 41.0 37.9 20.4 28.6 37.0 34.5 16.0 24.6 34.0
KNO 36.8 9.0 26.7 37.0 40.6 19.0 32.6 41.0 31.7 13.7 22.5 31.0
PHS 30.0 8.3 18.3 30.0 31.2 13.3 21.7 29.0 30.3 10.1 21.1 30.0
KGH 25.9 14.7 20.9 26.0 41.9 24.1 30.6 41.0 40.9 21.9 28.3 40.0
PGH 25.1 10.5 18.8 25.0 37.7 19.1 30.2 38.0 42.6 21.3 27.9 41.0
(* 98th %: 98th Percentile)
PCO (Panvel CIDCO Office); KRS (Khandeshwar Railway Station); KCO (Kalamboli
CIDCO Office); KNO (Kharghar Nodal Office); BCB (Belapur CIDCO Bhavan); PHS
(Pargaon High School); GWT (Gavanphata Water Tank); ACL (Ambuja Cement Ltd.); KGH
(Kille Gaothan Guest House) ; PGH (Panchsheel Guest House)
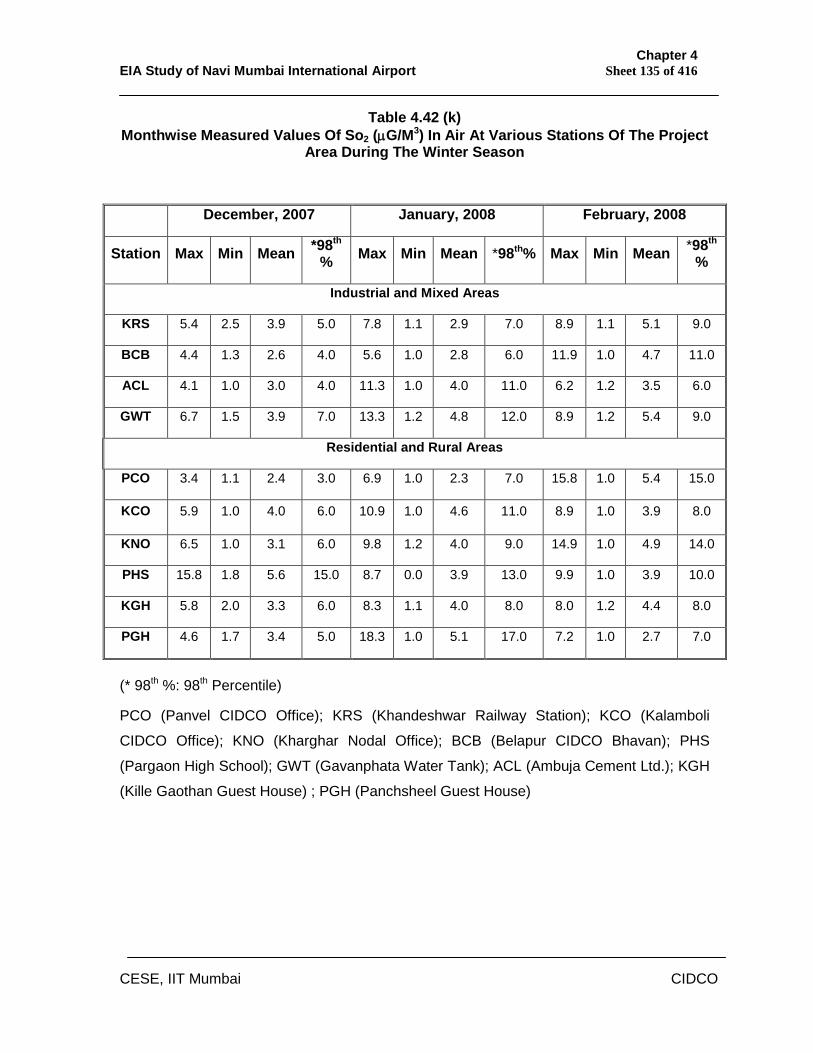
Chapter 4 EIA Study of Navi Mumbai International Airport Sheet 135 of 416
CESE, IIT Mumbai CIDCO
Table 4.42 (k) Monthwise Measured Values Of So2 (G/M3) In Air At Various Stations Of The Project
Area During The Winter Season
December, 2007 January, 2008 February, 2008
Station Max Min Mean *98th % Max Min Mean *98th% Max Min Mean *98th
%
Industrial and Mixed Areas
KRS 5.4 2.5 3.9 5.0 7.8 1.1 2.9 7.0 8.9 1.1 5.1 9.0
BCB 4.4 1.3 2.6 4.0 5.6 1.0 2.8 6.0 11.9 1.0 4.7 11.0
ACL 4.1 1.0 3.0 4.0 11.3 1.0 4.0 11.0 6.2 1.2 3.5 6.0
GWT 6.7 1.5 3.9 7.0 13.3 1.2 4.8 12.0 8.9 1.2 5.4 9.0
Residential and Rural Areas
PCO 3.4 1.1 2.4 3.0 6.9 1.0 2.3 7.0 15.8 1.0 5.4 15.0
KCO 5.9 1.0 4.0 6.0 10.9 1.0 4.6 11.0 8.9 1.0 3.9 8.0
KNO 6.5 1.0 3.1 6.0 9.8 1.2 4.0 9.0 14.9 1.0 4.9 14.0
PHS 15.8 1.8 5.6 15.0 8.7 0.0 3.9 13.0 9.9 1.0 3.9 10.0
KGH 5.8 2.0 3.3 6.0 8.3 1.1 4.0 8.0 8.0 1.2 4.4 8.0
PGH 4.6 1.7 3.4 5.0 18.3 1.0 5.1 17.0 7.2 1.0 2.7 7.0
(* 98th %: 98th Percentile)
PCO (Panvel CIDCO Office); KRS (Khandeshwar Railway Station); KCO (Kalamboli
CIDCO Office); KNO (Kharghar Nodal Office); BCB (Belapur CIDCO Bhavan); PHS
(Pargaon High School); GWT (Gavanphata Water Tank); ACL (Ambuja Cement Ltd.); KGH
(Kille Gaothan Guest House) ; PGH (Panchsheel Guest House)
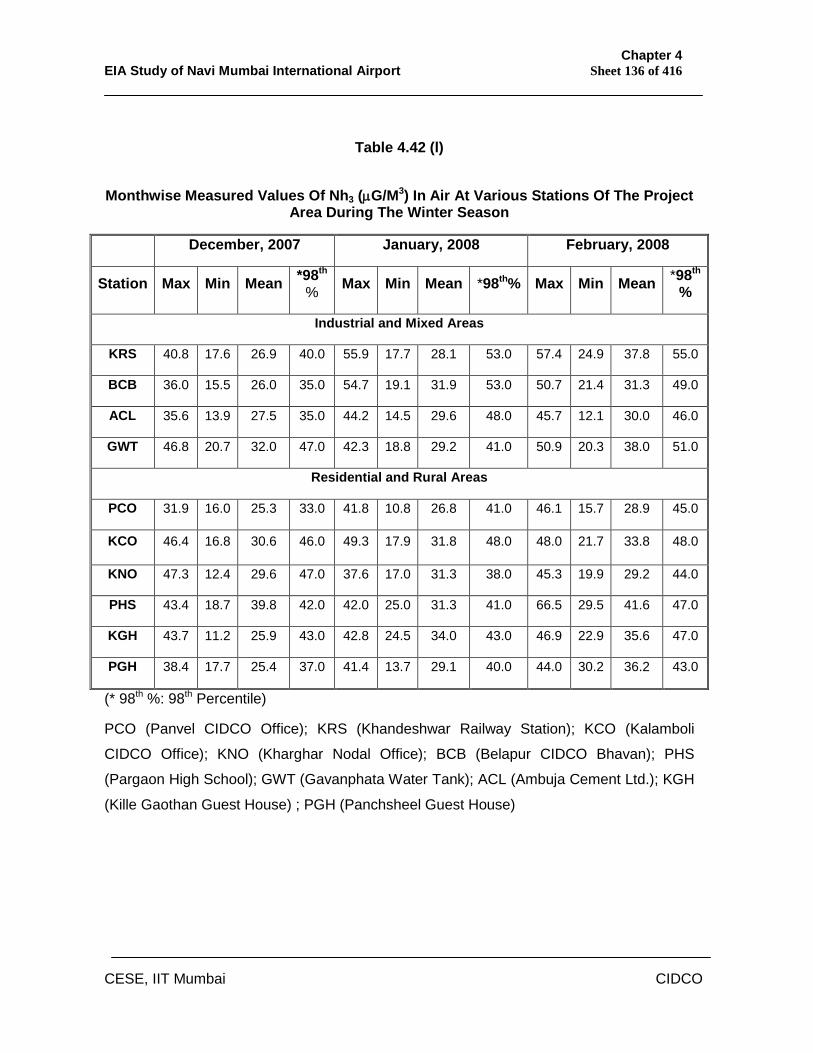
Chapter 4 EIA Study of Navi Mumbai International Airport Sheet 136 of 416
CESE, IIT Mumbai CIDCO
Table 4.42 (l)
Monthwise Measured Values Of Nh3 (G/M3) In Air At Various Stations Of The Project
Area During The Winter Season
December, 2007 January, 2008 February, 2008
Station Max Min Mean *98th % Max Min Mean *98th% Max Min Mean *98th
%
Industrial and Mixed Areas
KRS 40.8 17.6 26.9 40.0 55.9 17.7 28.1 53.0 57.4 24.9 37.8 55.0
BCB 36.0 15.5 26.0 35.0 54.7 19.1 31.9 53.0 50.7 21.4 31.3 49.0
ACL 35.6 13.9 27.5 35.0 44.2 14.5 29.6 48.0 45.7 12.1 30.0 46.0
GWT 46.8 20.7 32.0 47.0 42.3 18.8 29.2 41.0 50.9 20.3 38.0 51.0
Residential and Rural Areas
PCO 31.9 16.0 25.3 33.0 41.8 10.8 26.8 41.0 46.1 15.7 28.9 45.0
KCO 46.4 16.8 30.6 46.0 49.3 17.9 31.8 48.0 48.0 21.7 33.8 48.0
KNO 47.3 12.4 29.6 47.0 37.6 17.0 31.3 38.0 45.3 19.9 29.2 44.0
PHS 43.4 18.7 39.8 42.0 42.0 25.0 31.3 41.0 66.5 29.5 41.6 47.0
KGH 43.7 11.2 25.9 43.0 42.8 24.5 34.0 43.0 46.9 22.9 35.6 47.0
PGH 38.4 17.7 25.4 37.0 41.4 13.7 29.1 40.0 44.0 30.2 36.2 43.0
(* 98th %: 98th Percentile)
PCO (Panvel CIDCO Office); KRS (Khandeshwar Railway Station); KCO (Kalamboli
CIDCO Office); KNO (Kharghar Nodal Office); BCB (Belapur CIDCO Bhavan); PHS
(Pargaon High School); GWT (Gavanphata Water Tank); ACL (Ambuja Cement Ltd.); KGH
(Kille Gaothan Guest House) ; PGH (Panchsheel Guest House)
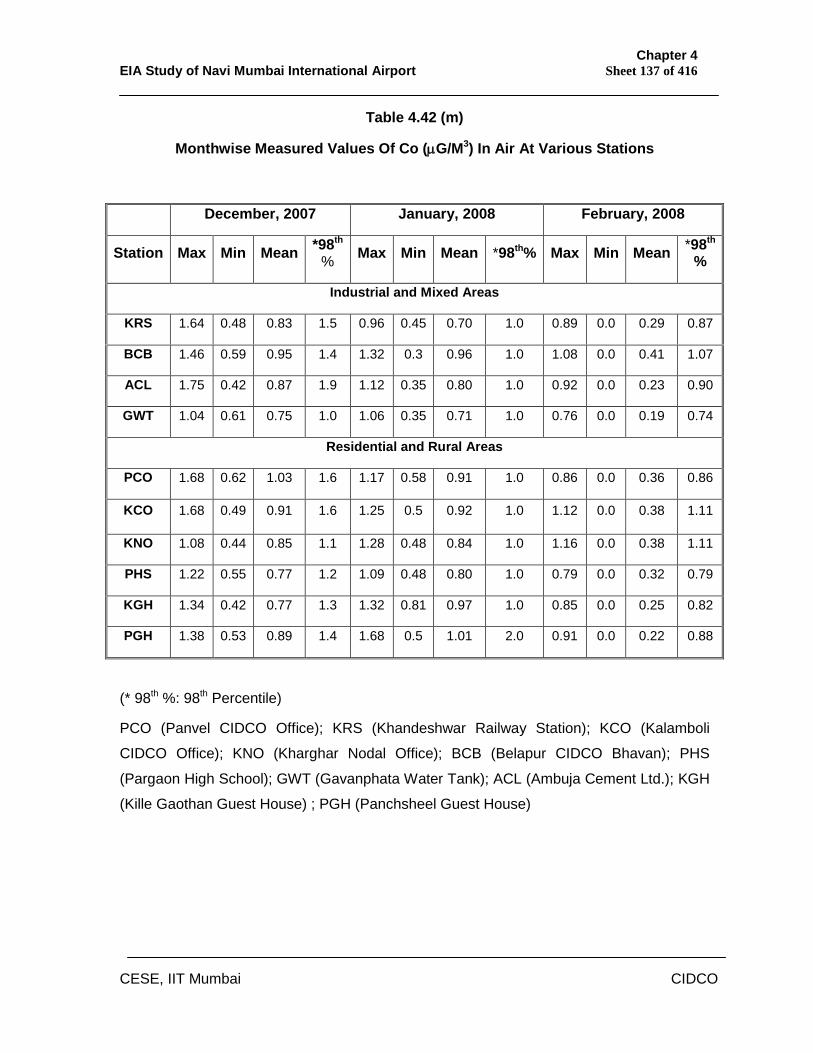
Chapter 4 EIA Study of Navi Mumbai International Airport Sheet 137 of 416
CESE, IIT Mumbai CIDCO
Table 4.42 (m)
Monthwise Measured Values Of Co (G/M3) In Air At Various Stations
(* 98th %: 98th Percentile)
PCO (Panvel CIDCO Office); KRS (Khandeshwar Railway Station); KCO (Kalamboli
CIDCO Office); KNO (Kharghar Nodal Office); BCB (Belapur CIDCO Bhavan); PHS
(Pargaon High School); GWT (Gavanphata Water Tank); ACL (Ambuja Cement Ltd.); KGH
(Kille Gaothan Guest House) ; PGH (Panchsheel Guest House)
December, 2007 January, 2008 February, 2008
Station Max Min Mean *98th % Max Min Mean *98th% Max Min Mean *98th
%
Industrial and Mixed Areas
KRS 1.64 0.48 0.83 1.5 0.96 0.45 0.70 1.0 0.89 0.0 0.29 0.87
BCB 1.46 0.59 0.95 1.4 1.32 0.3 0.96 1.0 1.08 0.0 0.41 1.07
ACL 1.75 0.42 0.87 1.9 1.12 0.35 0.80 1.0 0.92 0.0 0.23 0.90
GWT 1.04 0.61 0.75 1.0 1.06 0.35 0.71 1.0 0.76 0.0 0.19 0.74
Residential and Rural Areas
PCO 1.68 0.62 1.03 1.6 1.17 0.58 0.91 1.0 0.86 0.0 0.36 0.86
KCO 1.68 0.49 0.91 1.6 1.25 0.5 0.92 1.0 1.12 0.0 0.38 1.11
KNO 1.08 0.44 0.85 1.1 1.28 0.48 0.84 1.0 1.16 0.0 0.38 1.11
PHS 1.22 0.55 0.77 1.2 1.09 0.48 0.80 1.0 0.79 0.0 0.32 0.79
KGH 1.34 0.42 0.77 1.3 1.32 0.81 0.97 1.0 0.85 0.0 0.25 0.82
PGH 1.38 0.53 0.89 1.4 1.68 0.5 1.01 2.0 0.91 0.0 0.22 0.88
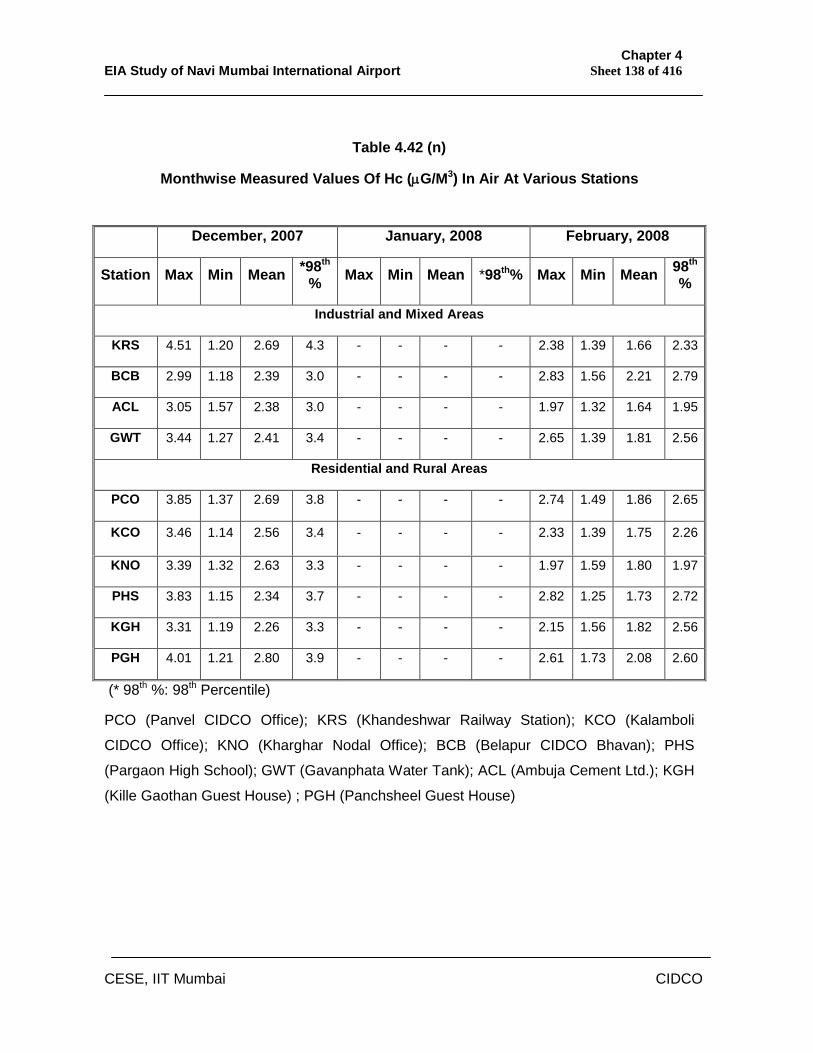
Chapter 4 EIA Study of Navi Mumbai International Airport Sheet 138 of 416
CESE, IIT Mumbai CIDCO
Table 4.42 (n)
Monthwise Measured Values Of Hc (G/M3) In Air At Various Stations
(* 98th %: 98th Percentile)
PCO (Panvel CIDCO Office); KRS (Khandeshwar Railway Station); KCO (Kalamboli
CIDCO Office); KNO (Kharghar Nodal Office); BCB (Belapur CIDCO Bhavan); PHS
(Pargaon High School); GWT (Gavanphata Water Tank); ACL (Ambuja Cement Ltd.); KGH
(Kille Gaothan Guest House) ; PGH (Panchsheel Guest House)
December, 2007 January, 2008 February, 2008
Station Max Min Mean *98th % Max Min Mean *98th% Max Min Mean 98th
%
Industrial and Mixed Areas
KRS 4.51 1.20 2.69 4.3 - - - - 2.38 1.39 1.66 2.33
BCB 2.99 1.18 2.39 3.0 - - - - 2.83 1.56 2.21 2.79
ACL 3.05 1.57 2.38 3.0 - - - - 1.97 1.32 1.64 1.95
GWT 3.44 1.27 2.41 3.4 - - - - 2.65 1.39 1.81 2.56
Residential and Rural Areas
PCO 3.85 1.37 2.69 3.8 - - - - 2.74 1.49 1.86 2.65
KCO 3.46 1.14 2.56 3.4 - - - - 2.33 1.39 1.75 2.26
KNO 3.39 1.32 2.63 3.3 - - - - 1.97 1.59 1.80 1.97
PHS 3.83 1.15 2.34 3.7 - - - - 2.82 1.25 1.73 2.72
KGH 3.31 1.19 2.26 3.3 - - - - 2.15 1.56 1.82 2.56
PGH 4.01 1.21 2.80 3.9 - - - - 2.61 1.73 2.08 2.60
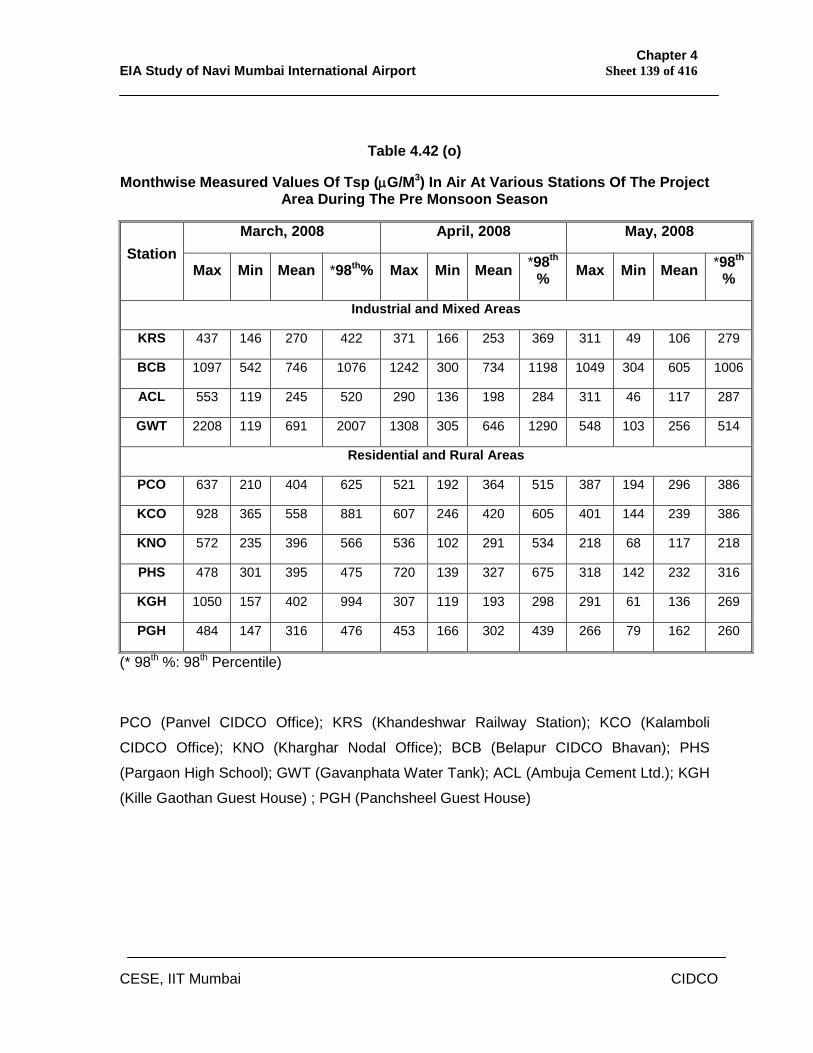
Chapter 4 EIA Study of Navi Mumbai International Airport Sheet 139 of 416
CESE, IIT Mumbai CIDCO
Table 4.42 (o)
Monthwise Measured Values Of Tsp (G/M3) In Air At Various Stations Of The Project Area During The Pre Monsoon Season
March, 2008 April, 2008 May, 2008 Station
Max Min Mean *98th% Max Min Mean *98th % Max Min Mean *98th
%
Industrial and Mixed Areas
KRS 437 146 270 422 371 166 253 369 311 49 106 279
BCB 1097 542 746 1076 1242 300 734 1198 1049 304 605 1006
ACL 553 119 245 520 290 136 198 284 311 46 117 287
GWT 2208 119 691 2007 1308 305 646 1290 548 103 256 514
Residential and Rural Areas
PCO 637 210 404 625 521 192 364 515 387 194 296 386
KCO 928 365 558 881 607 246 420 605 401 144 239 386
KNO 572 235 396 566 536 102 291 534 218 68 117 218
PHS 478 301 395 475 720 139 327 675 318 142 232 316
KGH 1050 157 402 994 307 119 193 298 291 61 136 269
PGH 484 147 316 476 453 166 302 439 266 79 162 260
(* 98th %: 98th Percentile)
PCO (Panvel CIDCO Office); KRS (Khandeshwar Railway Station); KCO (Kalamboli
CIDCO Office); KNO (Kharghar Nodal Office); BCB (Belapur CIDCO Bhavan); PHS
(Pargaon High School); GWT (Gavanphata Water Tank); ACL (Ambuja Cement Ltd.); KGH
(Kille Gaothan Guest House) ; PGH (Panchsheel Guest House)
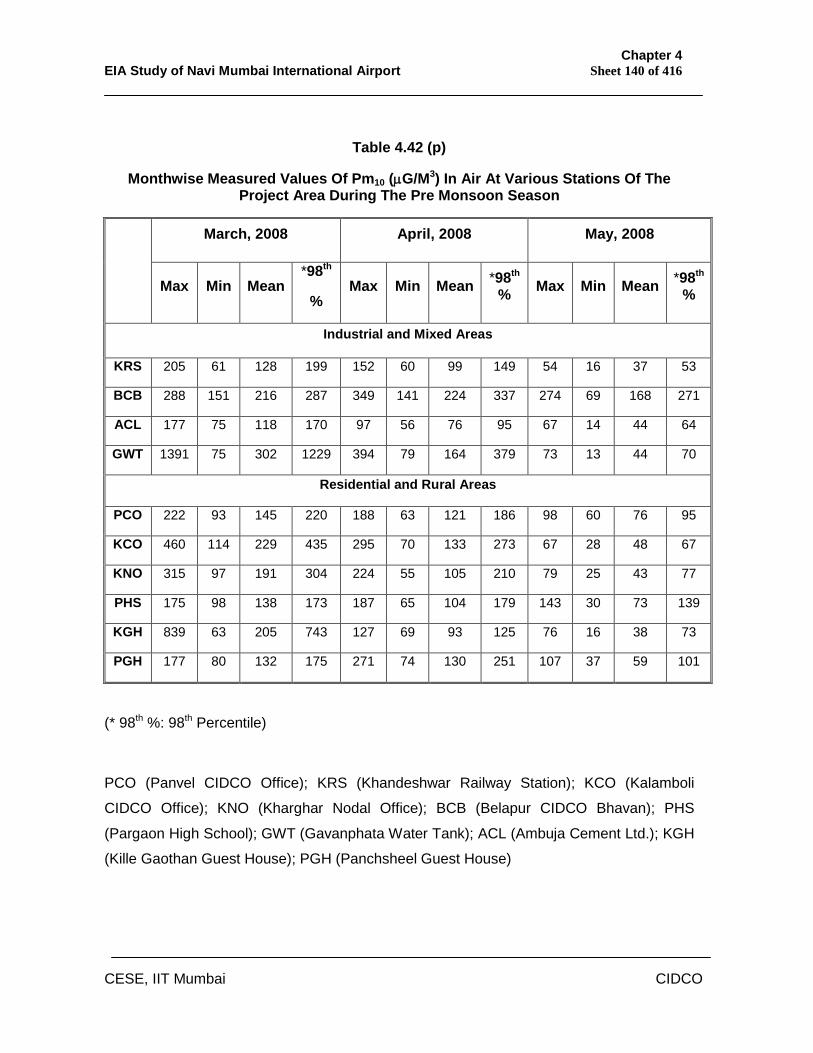
Chapter 4 EIA Study of Navi Mumbai International Airport Sheet 140 of 416
CESE, IIT Mumbai CIDCO
Table 4.42 (p)
Monthwise Measured Values Of Pm10 (G/M3) In Air At Various Stations Of The Project Area During The Pre Monsoon Season
March, 2008 April, 2008 May, 2008
Max Min Mean *98th
% Max Min Mean *98th
% Max Min Mean *98th %
Industrial and Mixed Areas
KRS 205 61 128 199 152 60 99 149 54 16 37 53
BCB 288 151 216 287 349 141 224 337 274 69 168 271
ACL 177 75 118 170 97 56 76 95 67 14 44 64
GWT 1391 75 302 1229 394 79 164 379 73 13 44 70
Residential and Rural Areas
PCO 222 93 145 220 188 63 121 186 98 60 76 95
KCO 460 114 229 435 295 70 133 273 67 28 48 67
KNO 315 97 191 304 224 55 105 210 79 25 43 77
PHS 175 98 138 173 187 65 104 179 143 30 73 139
KGH 839 63 205 743 127 69 93 125 76 16 38 73
PGH 177 80 132 175 271 74 130 251 107 37 59 101
(* 98th %: 98th Percentile)
PCO (Panvel CIDCO Office); KRS (Khandeshwar Railway Station); KCO (Kalamboli
CIDCO Office); KNO (Kharghar Nodal Office); BCB (Belapur CIDCO Bhavan); PHS
(Pargaon High School); GWT (Gavanphata Water Tank); ACL (Ambuja Cement Ltd.); KGH
(Kille Gaothan Guest House); PGH (Panchsheel Guest House)
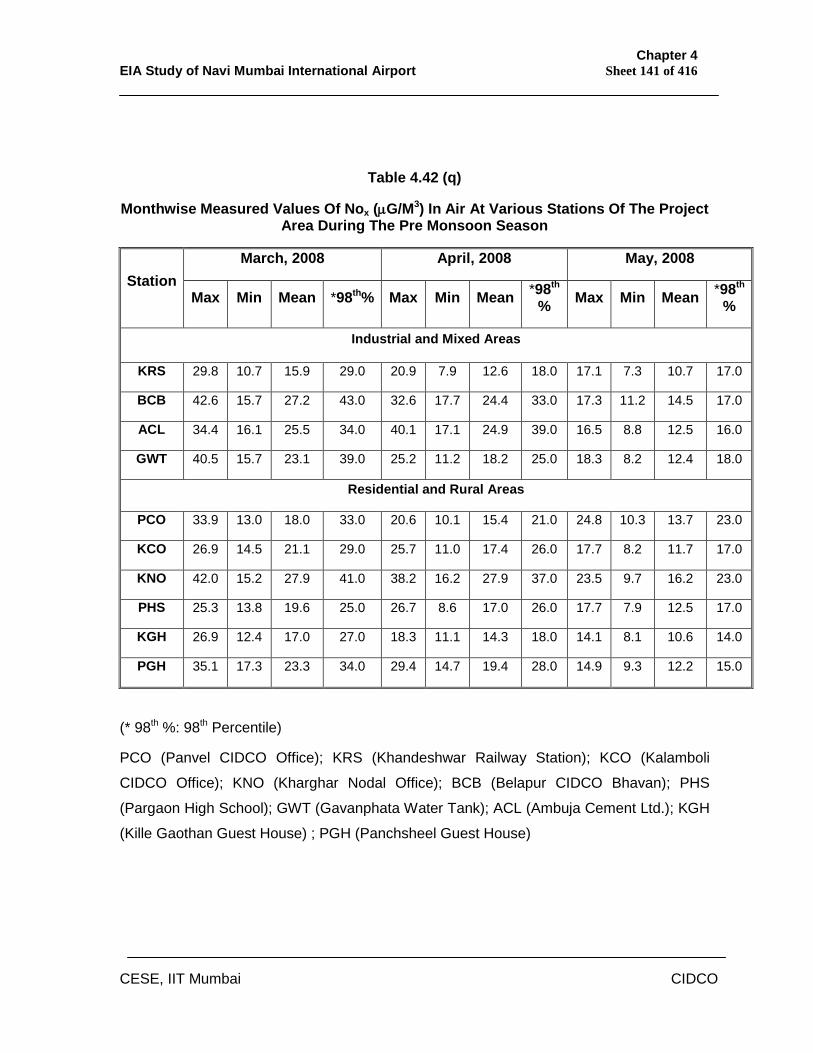
Chapter 4 EIA Study of Navi Mumbai International Airport Sheet 141 of 416
CESE, IIT Mumbai CIDCO
Table 4.42 (q)
Monthwise Measured Values Of Nox (G/M3) In Air At Various Stations Of The Project Area During The Pre Monsoon Season
March, 2008 April, 2008 May, 2008 Station
Max Min Mean *98th% Max Min Mean *98th % Max Min Mean *98th
%
Industrial and Mixed Areas
KRS 29.8 10.7 15.9 29.0 20.9 7.9 12.6 18.0 17.1 7.3 10.7 17.0
BCB 42.6 15.7 27.2 43.0 32.6 17.7 24.4 33.0 17.3 11.2 14.5 17.0
ACL 34.4 16.1 25.5 34.0 40.1 17.1 24.9 39.0 16.5 8.8 12.5 16.0
GWT 40.5 15.7 23.1 39.0 25.2 11.2 18.2 25.0 18.3 8.2 12.4 18.0
Residential and Rural Areas
PCO 33.9 13.0 18.0 33.0 20.6 10.1 15.4 21.0 24.8 10.3 13.7 23.0
KCO 26.9 14.5 21.1 29.0 25.7 11.0 17.4 26.0 17.7 8.2 11.7 17.0
KNO 42.0 15.2 27.9 41.0 38.2 16.2 27.9 37.0 23.5 9.7 16.2 23.0
PHS 25.3 13.8 19.6 25.0 26.7 8.6 17.0 26.0 17.7 7.9 12.5 17.0
KGH 26.9 12.4 17.0 27.0 18.3 11.1 14.3 18.0 14.1 8.1 10.6 14.0
PGH 35.1 17.3 23.3 34.0 29.4 14.7 19.4 28.0 14.9 9.3 12.2 15.0
(* 98th %: 98th Percentile)
PCO (Panvel CIDCO Office); KRS (Khandeshwar Railway Station); KCO (Kalamboli
CIDCO Office); KNO (Kharghar Nodal Office); BCB (Belapur CIDCO Bhavan); PHS
(Pargaon High School); GWT (Gavanphata Water Tank); ACL (Ambuja Cement Ltd.); KGH
(Kille Gaothan Guest House) ; PGH (Panchsheel Guest House)
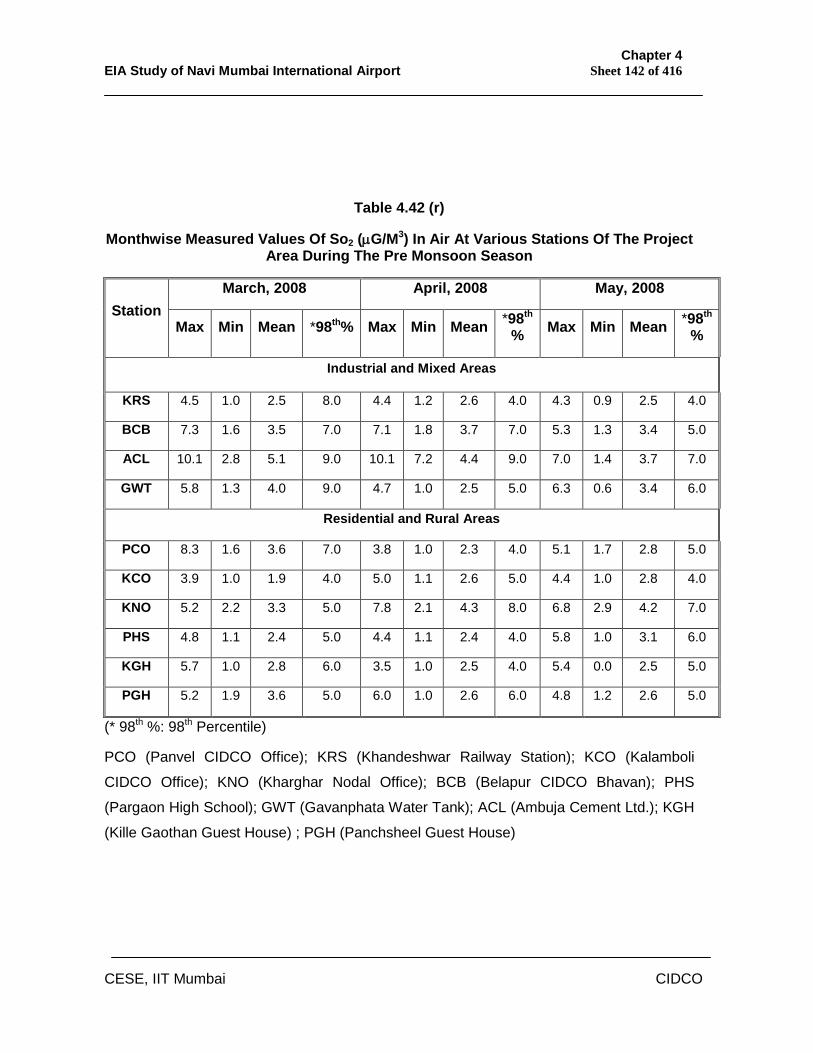
Chapter 4 EIA Study of Navi Mumbai International Airport Sheet 142 of 416
CESE, IIT Mumbai CIDCO
Table 4.42 (r)
Monthwise Measured Values Of So2 (G/M3) In Air At Various Stations Of The Project Area During The Pre Monsoon Season
March, 2008 April, 2008 May, 2008 Station
Max Min Mean *98th% Max Min Mean *98th % Max Min Mean *98th
%
Industrial and Mixed Areas
KRS 4.5 1.0 2.5 8.0 4.4 1.2 2.6 4.0 4.3 0.9 2.5 4.0
BCB 7.3 1.6 3.5 7.0 7.1 1.8 3.7 7.0 5.3 1.3 3.4 5.0
ACL 10.1 2.8 5.1 9.0 10.1 7.2 4.4 9.0 7.0 1.4 3.7 7.0
GWT 5.8 1.3 4.0 9.0 4.7 1.0 2.5 5.0 6.3 0.6 3.4 6.0
Residential and Rural Areas
PCO 8.3 1.6 3.6 7.0 3.8 1.0 2.3 4.0 5.1 1.7 2.8 5.0
KCO 3.9 1.0 1.9 4.0 5.0 1.1 2.6 5.0 4.4 1.0 2.8 4.0
KNO 5.2 2.2 3.3 5.0 7.8 2.1 4.3 8.0 6.8 2.9 4.2 7.0
PHS 4.8 1.1 2.4 5.0 4.4 1.1 2.4 4.0 5.8 1.0 3.1 6.0
KGH 5.7 1.0 2.8 6.0 3.5 1.0 2.5 4.0 5.4 0.0 2.5 5.0
PGH 5.2 1.9 3.6 5.0 6.0 1.0 2.6 6.0 4.8 1.2 2.6 5.0
(* 98th %: 98th Percentile)
PCO (Panvel CIDCO Office); KRS (Khandeshwar Railway Station); KCO (Kalamboli
CIDCO Office); KNO (Kharghar Nodal Office); BCB (Belapur CIDCO Bhavan); PHS
(Pargaon High School); GWT (Gavanphata Water Tank); ACL (Ambuja Cement Ltd.); KGH
(Kille Gaothan Guest House) ; PGH (Panchsheel Guest House)
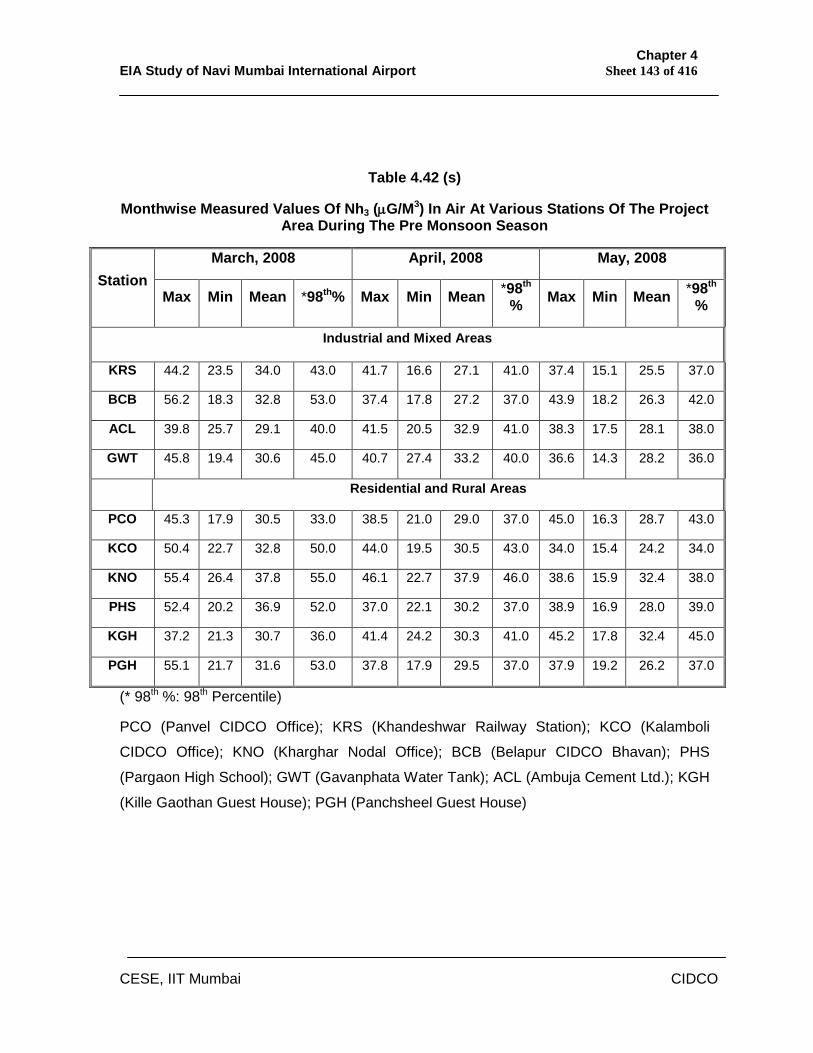
Chapter 4 EIA Study of Navi Mumbai International Airport Sheet 143 of 416
CESE, IIT Mumbai CIDCO
Table 4.42 (s)
Monthwise Measured Values Of Nh3 (G/M3) In Air At Various Stations Of The Project Area During The Pre Monsoon Season
March, 2008 April, 2008 May, 2008 Station
Max Min Mean *98th% Max Min Mean *98th % Max Min Mean *98th
%
Industrial and Mixed Areas
KRS 44.2 23.5 34.0 43.0 41.7 16.6 27.1 41.0 37.4 15.1 25.5 37.0
BCB 56.2 18.3 32.8 53.0 37.4 17.8 27.2 37.0 43.9 18.2 26.3 42.0
ACL 39.8 25.7 29.1 40.0 41.5 20.5 32.9 41.0 38.3 17.5 28.1 38.0
GWT 45.8 19.4 30.6 45.0 40.7 27.4 33.2 40.0 36.6 14.3 28.2 36.0
Residential and Rural Areas
PCO 45.3 17.9 30.5 33.0 38.5 21.0 29.0 37.0 45.0 16.3 28.7 43.0
KCO 50.4 22.7 32.8 50.0 44.0 19.5 30.5 43.0 34.0 15.4 24.2 34.0
KNO 55.4 26.4 37.8 55.0 46.1 22.7 37.9 46.0 38.6 15.9 32.4 38.0
PHS 52.4 20.2 36.9 52.0 37.0 22.1 30.2 37.0 38.9 16.9 28.0 39.0
KGH 37.2 21.3 30.7 36.0 41.4 24.2 30.3 41.0 45.2 17.8 32.4 45.0
PGH 55.1 21.7 31.6 53.0 37.8 17.9 29.5 37.0 37.9 19.2 26.2 37.0
(* 98th %: 98th Percentile)
PCO (Panvel CIDCO Office); KRS (Khandeshwar Railway Station); KCO (Kalamboli
CIDCO Office); KNO (Kharghar Nodal Office); BCB (Belapur CIDCO Bhavan); PHS
(Pargaon High School); GWT (Gavanphata Water Tank); ACL (Ambuja Cement Ltd.); KGH
(Kille Gaothan Guest House); PGH (Panchsheel Guest House)
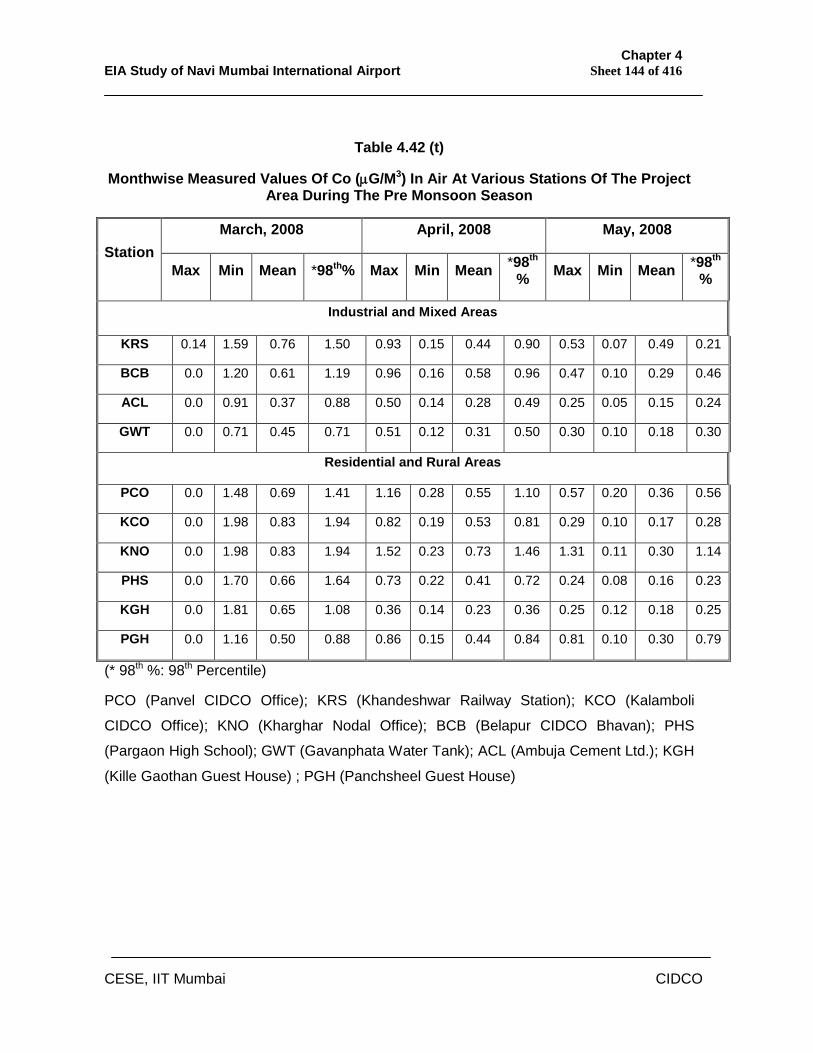
Chapter 4 EIA Study of Navi Mumbai International Airport Sheet 144 of 416
CESE, IIT Mumbai CIDCO
Table 4.42 (t)
Monthwise Measured Values Of Co (G/M3) In Air At Various Stations Of The Project Area During The Pre Monsoon Season
March, 2008 April, 2008 May, 2008 Station
Max Min Mean *98th% Max Min Mean *98th % Max Min Mean *98th
%
Industrial and Mixed Areas
KRS 0.14 1.59 0.76 1.50 0.93 0.15 0.44 0.90 0.53 0.07 0.49 0.21
BCB 0.0 1.20 0.61 1.19 0.96 0.16 0.58 0.96 0.47 0.10 0.29 0.46
ACL 0.0 0.91 0.37 0.88 0.50 0.14 0.28 0.49 0.25 0.05 0.15 0.24
GWT 0.0 0.71 0.45 0.71 0.51 0.12 0.31 0.50 0.30 0.10 0.18 0.30
Residential and Rural Areas
PCO 0.0 1.48 0.69 1.41 1.16 0.28 0.55 1.10 0.57 0.20 0.36 0.56
KCO 0.0 1.98 0.83 1.94 0.82 0.19 0.53 0.81 0.29 0.10 0.17 0.28
KNO 0.0 1.98 0.83 1.94 1.52 0.23 0.73 1.46 1.31 0.11 0.30 1.14
PHS 0.0 1.70 0.66 1.64 0.73 0.22 0.41 0.72 0.24 0.08 0.16 0.23
KGH 0.0 1.81 0.65 1.08 0.36 0.14 0.23 0.36 0.25 0.12 0.18 0.25
PGH 0.0 1.16 0.50 0.88 0.86 0.15 0.44 0.84 0.81 0.10 0.30 0.79
(* 98th %: 98th Percentile)
PCO (Panvel CIDCO Office); KRS (Khandeshwar Railway Station); KCO (Kalamboli
CIDCO Office); KNO (Kharghar Nodal Office); BCB (Belapur CIDCO Bhavan); PHS
(Pargaon High School); GWT (Gavanphata Water Tank); ACL (Ambuja Cement Ltd.); KGH
(Kille Gaothan Guest House) ; PGH (Panchsheel Guest House)
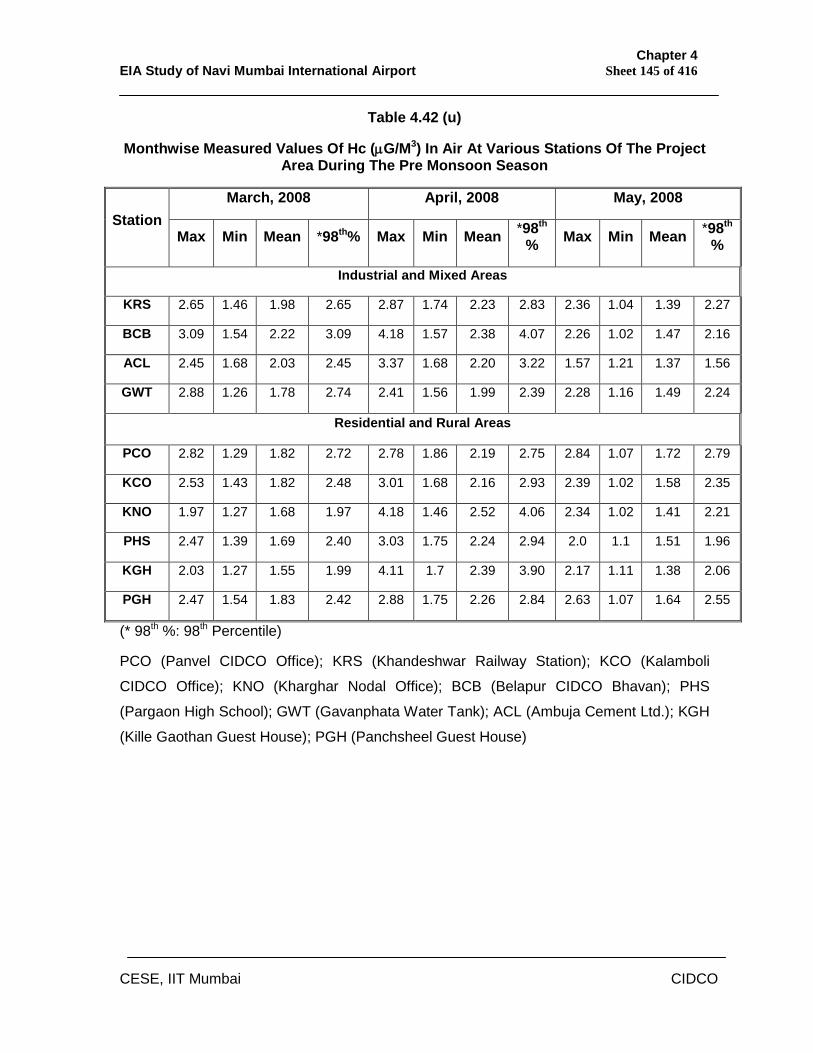
Chapter 4 EIA Study of Navi Mumbai International Airport Sheet 145 of 416
CESE, IIT Mumbai CIDCO
Table 4.42 (u)
Monthwise Measured Values Of Hc (G/M3) In Air At Various Stations Of The Project Area During The Pre Monsoon Season
March, 2008 April, 2008 May, 2008 Station
Max Min Mean *98th% Max Min Mean *98th % Max Min Mean *98th
%
Industrial and Mixed Areas
KRS 2.65 1.46 1.98 2.65 2.87 1.74 2.23 2.83 2.36 1.04 1.39 2.27
BCB 3.09 1.54 2.22 3.09 4.18 1.57 2.38 4.07 2.26 1.02 1.47 2.16
ACL 2.45 1.68 2.03 2.45 3.37 1.68 2.20 3.22 1.57 1.21 1.37 1.56
GWT 2.88 1.26 1.78 2.74 2.41 1.56 1.99 2.39 2.28 1.16 1.49 2.24
Residential and Rural Areas
PCO 2.82 1.29 1.82 2.72 2.78 1.86 2.19 2.75 2.84 1.07 1.72 2.79
KCO 2.53 1.43 1.82 2.48 3.01 1.68 2.16 2.93 2.39 1.02 1.58 2.35
KNO 1.97 1.27 1.68 1.97 4.18 1.46 2.52 4.06 2.34 1.02 1.41 2.21
PHS 2.47 1.39 1.69 2.40 3.03 1.75 2.24 2.94 2.0 1.1 1.51 1.96
KGH 2.03 1.27 1.55 1.99 4.11 1.7 2.39 3.90 2.17 1.11 1.38 2.06
PGH 2.47 1.54 1.83 2.42 2.88 1.75 2.26 2.84 2.63 1.07 1.64 2.55
(* 98th %: 98th Percentile)
PCO (Panvel CIDCO Office); KRS (Khandeshwar Railway Station); KCO (Kalamboli
CIDCO Office); KNO (Kharghar Nodal Office); BCB (Belapur CIDCO Bhavan); PHS
(Pargaon High School); GWT (Gavanphata Water Tank); ACL (Ambuja Cement Ltd.); KGH
(Kille Gaothan Guest House); PGH (Panchsheel Guest House)
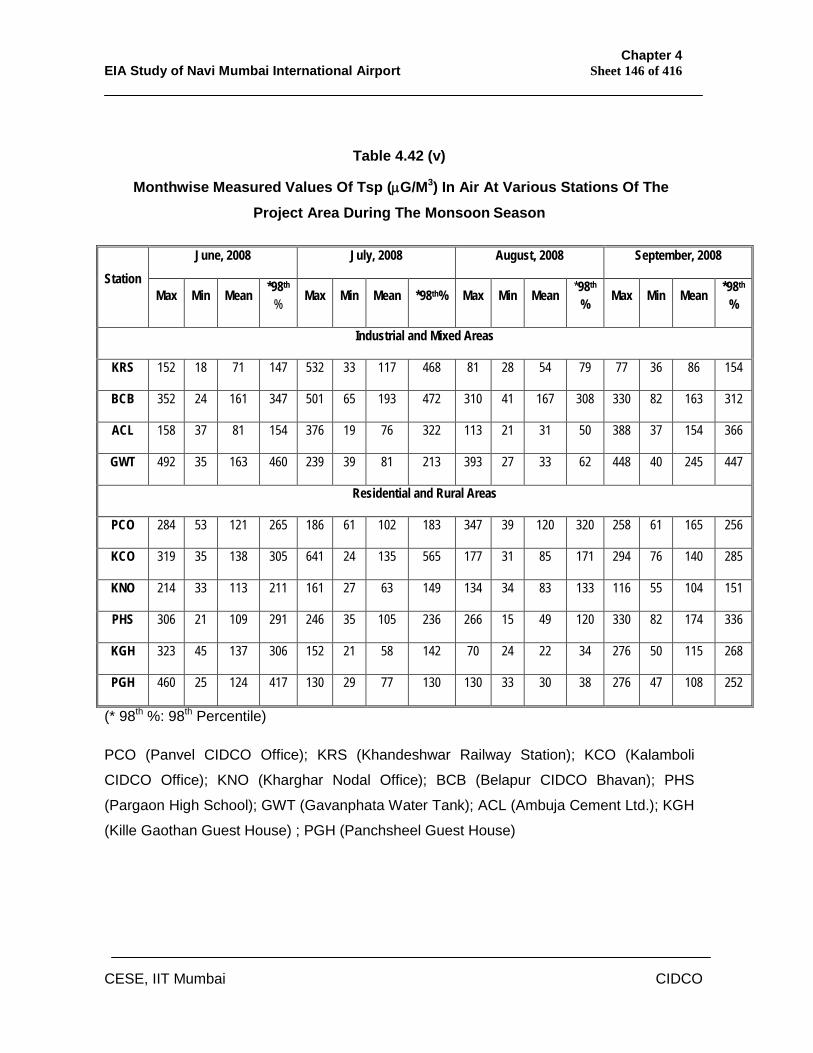
Chapter 4 EIA Study of Navi Mumbai International Airport Sheet 146 of 416
CESE, IIT Mumbai CIDCO
Table 4.42 (v)
Monthwise Measured Values Of Tsp (G/M3) In Air At Various Stations Of The
Project Area During The Monsoon Season
(* 98th %: 98th Percentile)
PCO (Panvel CIDCO Office); KRS (Khandeshwar Railway Station); KCO (Kalamboli
CIDCO Office); KNO (Kharghar Nodal Office); BCB (Belapur CIDCO Bhavan); PHS
(Pargaon High School); GWT (Gavanphata Water Tank); ACL (Ambuja Cement Ltd.); KGH
(Kille Gaothan Guest House) ; PGH (Panchsheel Guest House)
June, 2008 July, 2008 August, 2008 September, 2008
Station Max Min Mean *98th
% Max Min Mean *98th% Max Min Mean *98th % Max Min Mean *98th
%
Industrial and Mixed Areas
KRS 152 18 71 147 532 33 117 468 81 28 54 79 77 36 86 154
BCB 352 24 161 347 501 65 193 472 310 41 167 308 330 82 163 312
ACL 158 37 81 154 376 19 76 322 113 21 31 50 388 37 154 366
GWT 492 35 163 460 239 39 81 213 393 27 33 62 448 40 245 447
Residential and Rural Areas
PCO 284 53 121 265 186 61 102 183 347 39 120 320 258 61 165 256
KCO 319 35 138 305 641 24 135 565 177 31 85 171 294 76 140 285
KNO 214 33 113 211 161 27 63 149 134 34 83 133 116 55 104 151
PHS 306 21 109 291 246 35 105 236 266 15 49 120 330 82 174 336
KGH 323 45 137 306 152 21 58 142 70 24 22 34 276 50 115 268
PGH 460 25 124 417 130 29 77 130 130 33 30 38 276 47 108 252
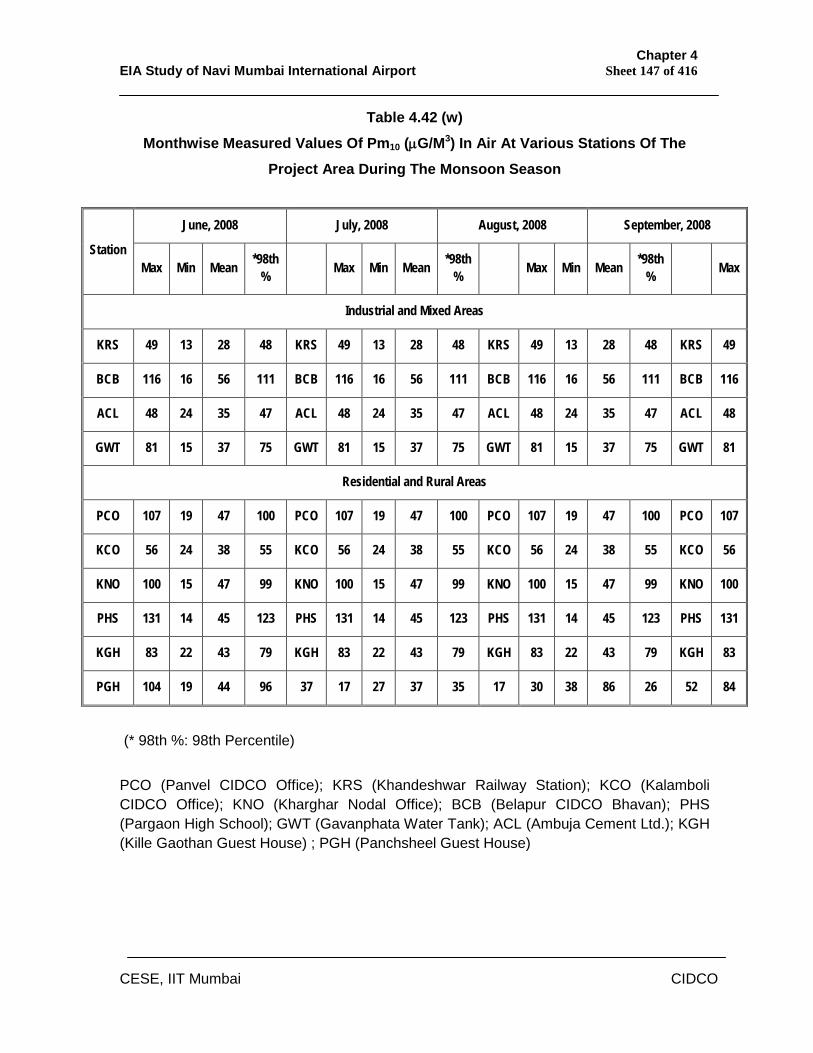
Chapter 4 EIA Study of Navi Mumbai International Airport Sheet 147 of 416
CESE, IIT Mumbai CIDCO
Table 4.42 (w)
Monthwise Measured Values Of Pm10 (G/M3) In Air At Various Stations Of The
Project Area During The Monsoon Season
(* 98th %: 98th Percentile)
PCO (Panvel CIDCO Office); KRS (Khandeshwar Railway Station); KCO (Kalamboli CIDCO Office); KNO (Kharghar Nodal Office); BCB (Belapur CIDCO Bhavan); PHS (Pargaon High School); GWT (Gavanphata Water Tank); ACL (Ambuja Cement Ltd.); KGH (Kille Gaothan Guest House) ; PGH (Panchsheel Guest House)
June, 2008 July, 2008 August, 2008 September, 2008
Station Max Min Mean *98th
% Max Min Mean *98th % Max Min Mean *98th
% Max
Industrial and Mixed Areas
KRS 49 13 28 48 KRS 49 13 28 48 KRS 49 13 28 48 KRS 49
BCB 116 16 56 111 BCB 116 16 56 111 BCB 116 16 56 111 BCB 116
ACL 48 24 35 47 ACL 48 24 35 47 ACL 48 24 35 47 ACL 48
GWT 81 15 37 75 GWT 81 15 37 75 GWT 81 15 37 75 GWT 81
Residential and Rural Areas
PCO 107 19 47 100 PCO 107 19 47 100 PCO 107 19 47 100 PCO 107
KCO 56 24 38 55 KCO 56 24 38 55 KCO 56 24 38 55 KCO 56
KNO 100 15 47 99 KNO 100 15 47 99 KNO 100 15 47 99 KNO 100
PHS 131 14 45 123 PHS 131 14 45 123 PHS 131 14 45 123 PHS 131
KGH 83 22 43 79 KGH 83 22 43 79 KGH 83 22 43 79 KGH 83
PGH 104 19 44 96 37 17 27 37 35 17 30 38 86 26 52 84
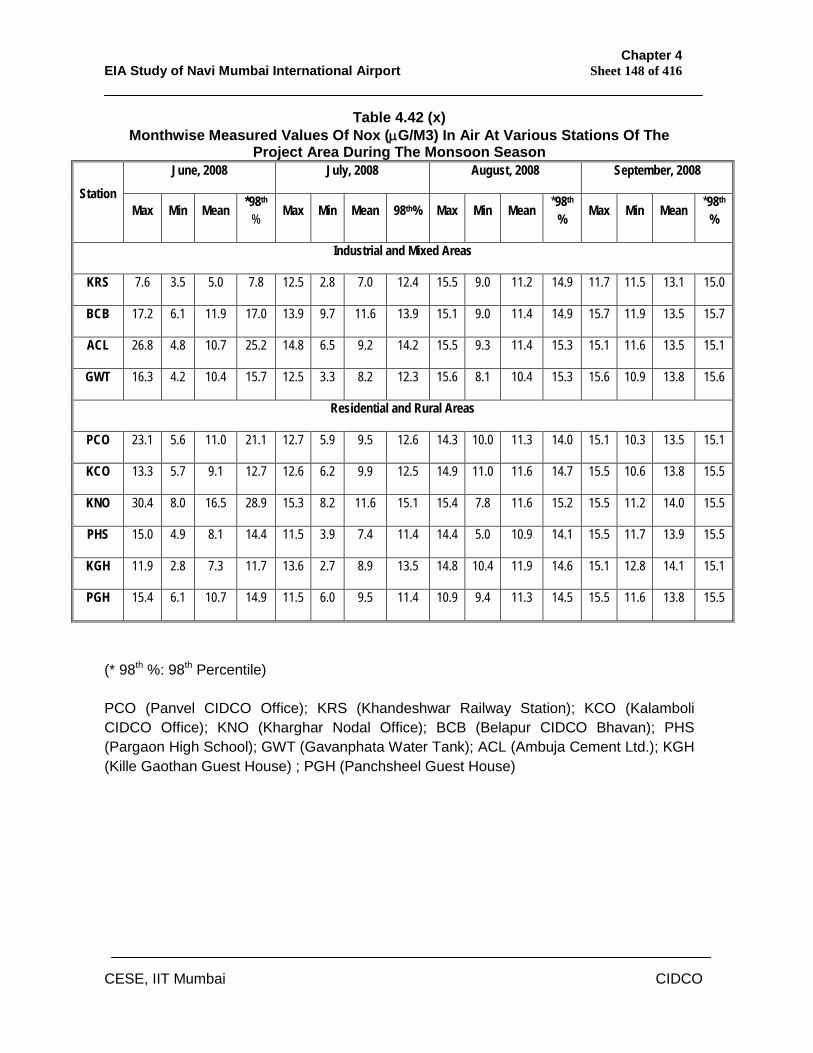
Chapter 4 EIA Study of Navi Mumbai International Airport Sheet 148 of 416
CESE, IIT Mumbai CIDCO
Table 4.42 (x) Monthwise Measured Values Of Nox (G/M3) In Air At Various Stations Of The
Project Area During The Monsoon Season June, 2008 July, 2008 August, 2008 September, 2008
Station Max Min Mean *98th
% Max Min Mean 98th% Max Min Mean *98th % Max Min Mean *98th
%
Industrial and Mixed Areas
KRS 7.6 3.5 5.0 7.8 12.5 2.8 7.0 12.4 15.5 9.0 11.2 14.9 11.7 11.5 13.1 15.0
BCB 17.2 6.1 11.9 17.0 13.9 9.7 11.6 13.9 15.1 9.0 11.4 14.9 15.7 11.9 13.5 15.7
ACL 26.8 4.8 10.7 25.2 14.8 6.5 9.2 14.2 15.5 9.3 11.4 15.3 15.1 11.6 13.5 15.1
GWT 16.3 4.2 10.4 15.7 12.5 3.3 8.2 12.3 15.6 8.1 10.4 15.3 15.6 10.9 13.8 15.6
Residential and Rural Areas
PCO 23.1 5.6 11.0 21.1 12.7 5.9 9.5 12.6 14.3 10.0 11.3 14.0 15.1 10.3 13.5 15.1
KCO 13.3 5.7 9.1 12.7 12.6 6.2 9.9 12.5 14.9 11.0 11.6 14.7 15.5 10.6 13.8 15.5
KNO 30.4 8.0 16.5 28.9 15.3 8.2 11.6 15.1 15.4 7.8 11.6 15.2 15.5 11.2 14.0 15.5
PHS 15.0 4.9 8.1 14.4 11.5 3.9 7.4 11.4 14.4 5.0 10.9 14.1 15.5 11.7 13.9 15.5
KGH 11.9 2.8 7.3 11.7 13.6 2.7 8.9 13.5 14.8 10.4 11.9 14.6 15.1 12.8 14.1 15.1
PGH 15.4 6.1 10.7 14.9 11.5 6.0 9.5 11.4 10.9 9.4 11.3 14.5 15.5 11.6 13.8 15.5
(* 98th %: 98th Percentile)
PCO (Panvel CIDCO Office); KRS (Khandeshwar Railway Station); KCO (Kalamboli CIDCO Office); KNO (Kharghar Nodal Office); BCB (Belapur CIDCO Bhavan); PHS (Pargaon High School); GWT (Gavanphata Water Tank); ACL (Ambuja Cement Ltd.); KGH (Kille Gaothan Guest House) ; PGH (Panchsheel Guest House)
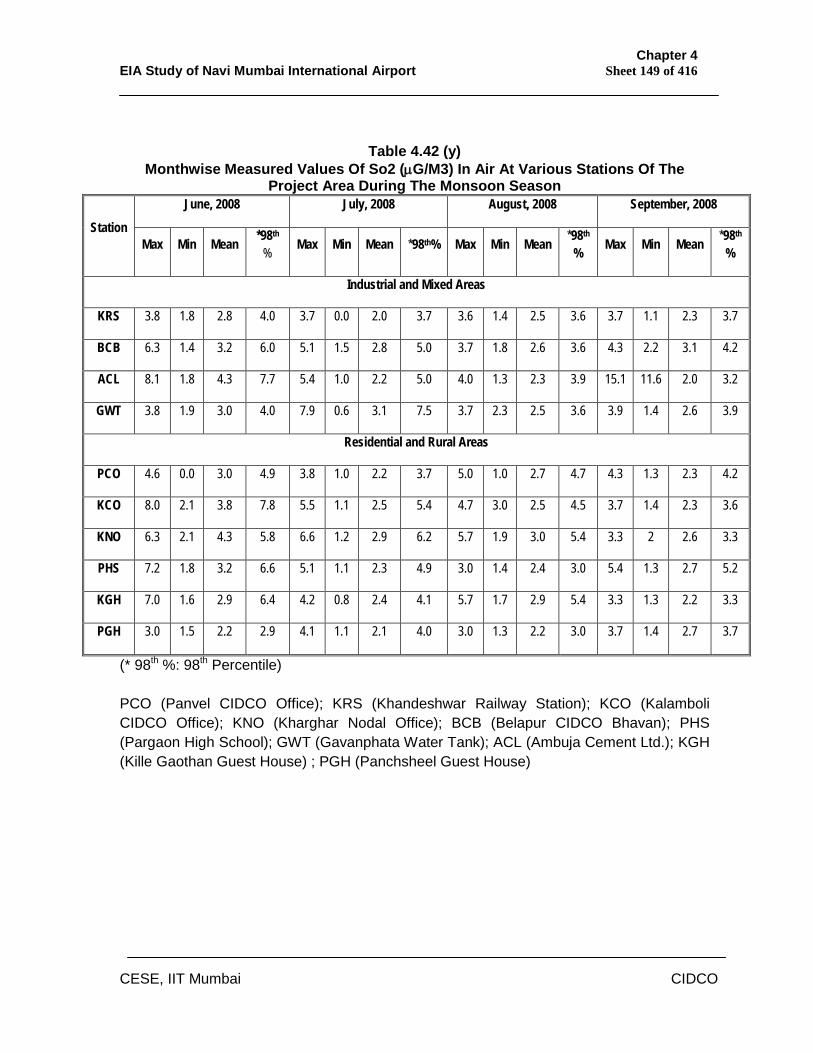
Chapter 4 EIA Study of Navi Mumbai International Airport Sheet 149 of 416
CESE, IIT Mumbai CIDCO
Table 4.42 (y) Monthwise Measured Values Of So2 (G/M3) In Air At Various Stations Of The
Project Area During The Monsoon Season June, 2008 July, 2008 August, 2008 September, 2008
Station Max Min Mean *98th
% Max Min Mean *98th% Max Min Mean *98th % Max Min Mean *98th
%
Industrial and Mixed Areas
KRS 3.8 1.8 2.8 4.0 3.7 0.0 2.0 3.7 3.6 1.4 2.5 3.6 3.7 1.1 2.3 3.7
BCB 6.3 1.4 3.2 6.0 5.1 1.5 2.8 5.0 3.7 1.8 2.6 3.6 4.3 2.2 3.1 4.2
ACL 8.1 1.8 4.3 7.7 5.4 1.0 2.2 5.0 4.0 1.3 2.3 3.9 15.1 11.6 2.0 3.2
GWT 3.8 1.9 3.0 4.0 7.9 0.6 3.1 7.5 3.7 2.3 2.5 3.6 3.9 1.4 2.6 3.9
Residential and Rural Areas
PCO 4.6 0.0 3.0 4.9 3.8 1.0 2.2 3.7 5.0 1.0 2.7 4.7 4.3 1.3 2.3 4.2
KCO 8.0 2.1 3.8 7.8 5.5 1.1 2.5 5.4 4.7 3.0 2.5 4.5 3.7 1.4 2.3 3.6
KNO 6.3 2.1 4.3 5.8 6.6 1.2 2.9 6.2 5.7 1.9 3.0 5.4 3.3 2 2.6 3.3
PHS 7.2 1.8 3.2 6.6 5.1 1.1 2.3 4.9 3.0 1.4 2.4 3.0 5.4 1.3 2.7 5.2
KGH 7.0 1.6 2.9 6.4 4.2 0.8 2.4 4.1 5.7 1.7 2.9 5.4 3.3 1.3 2.2 3.3
PGH 3.0 1.5 2.2 2.9 4.1 1.1 2.1 4.0 3.0 1.3 2.2 3.0 3.7 1.4 2.7 3.7
(* 98th %: 98th Percentile)
PCO (Panvel CIDCO Office); KRS (Khandeshwar Railway Station); KCO (Kalamboli CIDCO Office); KNO (Kharghar Nodal Office); BCB (Belapur CIDCO Bhavan); PHS (Pargaon High School); GWT (Gavanphata Water Tank); ACL (Ambuja Cement Ltd.); KGH (Kille Gaothan Guest House) ; PGH (Panchsheel Guest House)
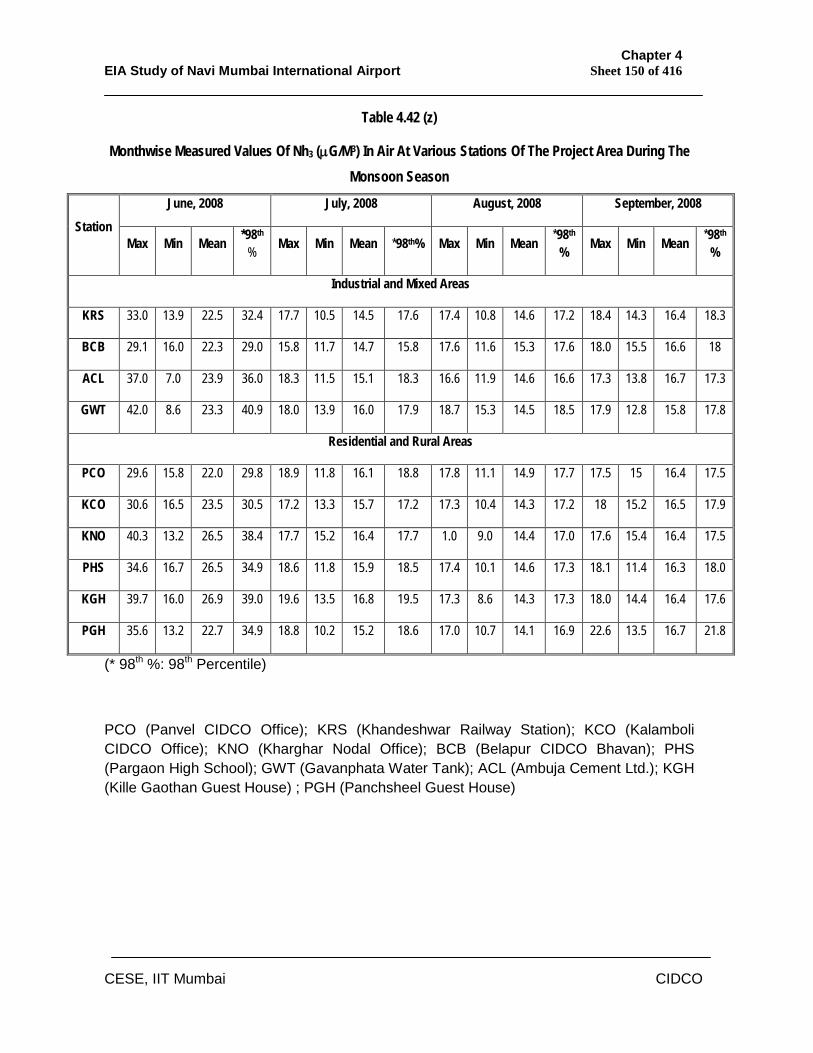
Chapter 4 EIA Study of Navi Mumbai International Airport Sheet 150 of 416
CESE, IIT Mumbai CIDCO
Table 4.42 (z)
Monthwise Measured Values Of Nh3 (G/M3) In Air At Various Stations Of The Project Area During The Monsoon Season
June, 2008 July, 2008 August, 2008 September, 2008
Station Max Min Mean *98th
% Max Min Mean *98th% Max Min Mean *98th % Max Min Mean *98th
%
Industrial and Mixed Areas
KRS 33.0 13.9 22.5 32.4 17.7 10.5 14.5 17.6 17.4 10.8 14.6 17.2 18.4 14.3 16.4 18.3
BCB 29.1 16.0 22.3 29.0 15.8 11.7 14.7 15.8 17.6 11.6 15.3 17.6 18.0 15.5 16.6 18
ACL 37.0 7.0 23.9 36.0 18.3 11.5 15.1 18.3 16.6 11.9 14.6 16.6 17.3 13.8 16.7 17.3
GWT 42.0 8.6 23.3 40.9 18.0 13.9 16.0 17.9 18.7 15.3 14.5 18.5 17.9 12.8 15.8 17.8
Residential and Rural Areas
PCO 29.6 15.8 22.0 29.8 18.9 11.8 16.1 18.8 17.8 11.1 14.9 17.7 17.5 15 16.4 17.5
KCO 30.6 16.5 23.5 30.5 17.2 13.3 15.7 17.2 17.3 10.4 14.3 17.2 18 15.2 16.5 17.9
KNO 40.3 13.2 26.5 38.4 17.7 15.2 16.4 17.7 1.0 9.0 14.4 17.0 17.6 15.4 16.4 17.5
PHS 34.6 16.7 26.5 34.9 18.6 11.8 15.9 18.5 17.4 10.1 14.6 17.3 18.1 11.4 16.3 18.0
KGH 39.7 16.0 26.9 39.0 19.6 13.5 16.8 19.5 17.3 8.6 14.3 17.3 18.0 14.4 16.4 17.6
PGH 35.6 13.2 22.7 34.9 18.8 10.2 15.2 18.6 17.0 10.7 14.1 16.9 22.6 13.5 16.7 21.8
(* 98th %: 98th Percentile)
PCO (Panvel CIDCO Office); KRS (Khandeshwar Railway Station); KCO (Kalamboli CIDCO Office); KNO (Kharghar Nodal Office); BCB (Belapur CIDCO Bhavan); PHS (Pargaon High School); GWT (Gavanphata Water Tank); ACL (Ambuja Cement Ltd.); KGH (Kille Gaothan Guest House) ; PGH (Panchsheel Guest House)
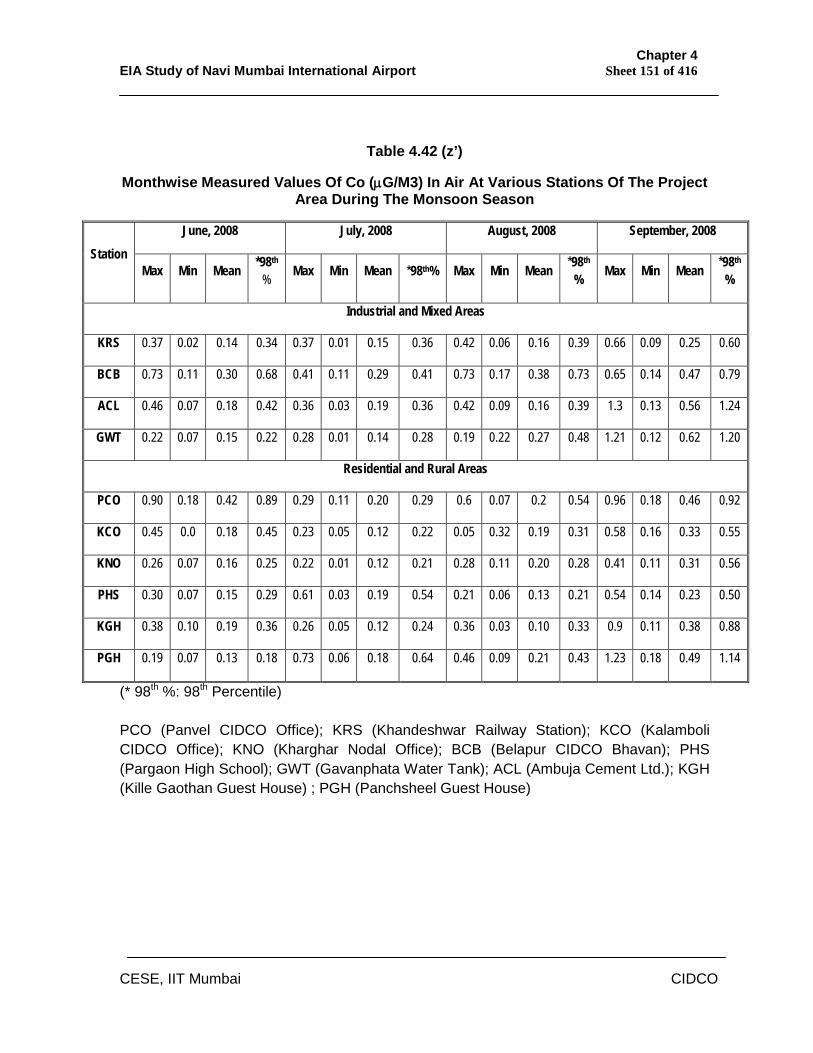
Chapter 4 EIA Study of Navi Mumbai International Airport Sheet 151 of 416
CESE, IIT Mumbai CIDCO
Table 4.42 (z’)
Monthwise Measured Values Of Co (G/M3) In Air At Various Stations Of The Project Area During The Monsoon Season
June, 2008 July, 2008 August, 2008 September, 2008
Station Max Min Mean *98th
% Max Min Mean *98th% Max Min Mean *98th % Max Min Mean *98th
%
Industrial and Mixed Areas
KRS 0.37 0.02 0.14 0.34 0.37 0.01 0.15 0.36 0.42 0.06 0.16 0.39 0.66 0.09 0.25 0.60
BCB 0.73 0.11 0.30 0.68 0.41 0.11 0.29 0.41 0.73 0.17 0.38 0.73 0.65 0.14 0.47 0.79
ACL 0.46 0.07 0.18 0.42 0.36 0.03 0.19 0.36 0.42 0.09 0.16 0.39 1.3 0.13 0.56 1.24
GWT 0.22 0.07 0.15 0.22 0.28 0.01 0.14 0.28 0.19 0.22 0.27 0.48 1.21 0.12 0.62 1.20
Residential and Rural Areas
PCO 0.90 0.18 0.42 0.89 0.29 0.11 0.20 0.29 0.6 0.07 0.2 0.54 0.96 0.18 0.46 0.92
KCO 0.45 0.0 0.18 0.45 0.23 0.05 0.12 0.22 0.05 0.32 0.19 0.31 0.58 0.16 0.33 0.55
KNO 0.26 0.07 0.16 0.25 0.22 0.01 0.12 0.21 0.28 0.11 0.20 0.28 0.41 0.11 0.31 0.56
PHS 0.30 0.07 0.15 0.29 0.61 0.03 0.19 0.54 0.21 0.06 0.13 0.21 0.54 0.14 0.23 0.50
KGH 0.38 0.10 0.19 0.36 0.26 0.05 0.12 0.24 0.36 0.03 0.10 0.33 0.9 0.11 0.38 0.88
PGH 0.19 0.07 0.13 0.18 0.73 0.06 0.18 0.64 0.46 0.09 0.21 0.43 1.23 0.18 0.49 1.14
(* 98th %: 98th Percentile)
PCO (Panvel CIDCO Office); KRS (Khandeshwar Railway Station); KCO (Kalamboli CIDCO Office); KNO (Kharghar Nodal Office); BCB (Belapur CIDCO Bhavan); PHS (Pargaon High School); GWT (Gavanphata Water Tank); ACL (Ambuja Cement Ltd.); KGH (Kille Gaothan Guest House) ; PGH (Panchsheel Guest House)
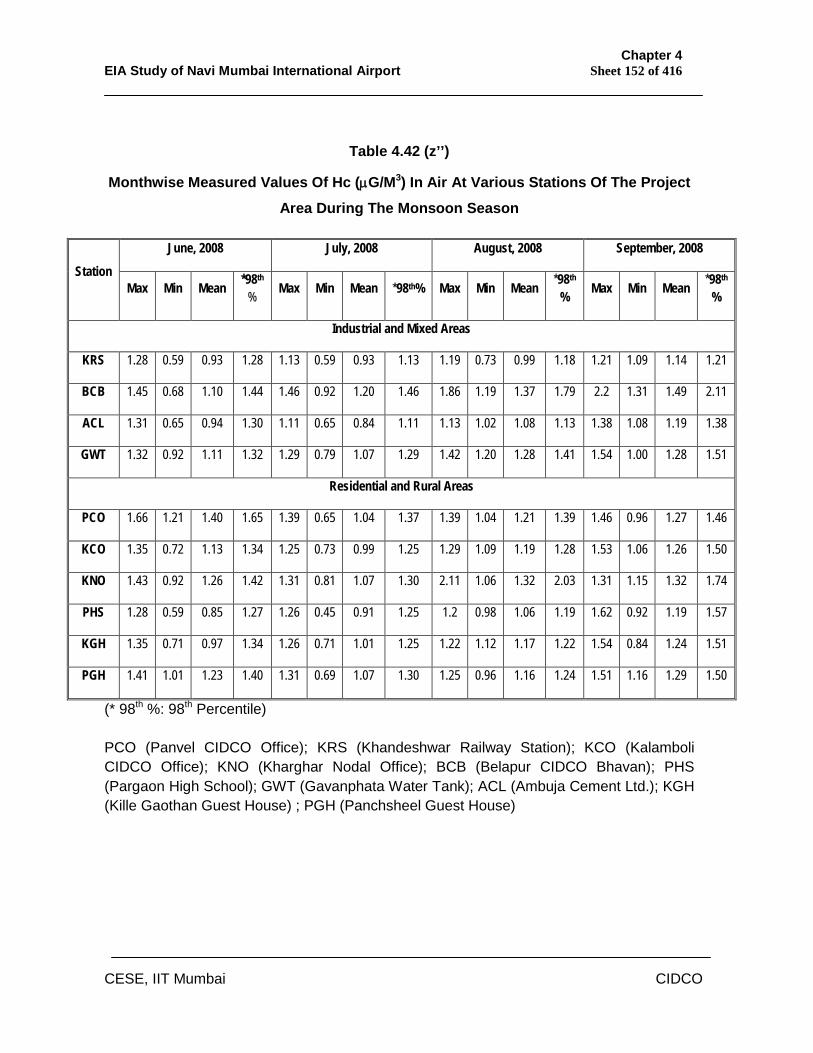
Chapter 4 EIA Study of Navi Mumbai International Airport Sheet 152 of 416
CESE, IIT Mumbai CIDCO
Table 4.42 (z’’)
Monthwise Measured Values Of Hc (G/M3) In Air At Various Stations Of The Project
Area During The Monsoon Season
June, 2008 July, 2008 August, 2008 September, 2008
Station Max Min Mean *98th
% Max Min Mean *98th% Max Min Mean *98th % Max Min Mean *98th
%
Industrial and Mixed Areas
KRS 1.28 0.59 0.93 1.28 1.13 0.59 0.93 1.13 1.19 0.73 0.99 1.18 1.21 1.09 1.14 1.21
BCB 1.45 0.68 1.10 1.44 1.46 0.92 1.20 1.46 1.86 1.19 1.37 1.79 2.2 1.31 1.49 2.11
ACL 1.31 0.65 0.94 1.30 1.11 0.65 0.84 1.11 1.13 1.02 1.08 1.13 1.38 1.08 1.19 1.38
GWT 1.32 0.92 1.11 1.32 1.29 0.79 1.07 1.29 1.42 1.20 1.28 1.41 1.54 1.00 1.28 1.51
Residential and Rural Areas
PCO 1.66 1.21 1.40 1.65 1.39 0.65 1.04 1.37 1.39 1.04 1.21 1.39 1.46 0.96 1.27 1.46
KCO 1.35 0.72 1.13 1.34 1.25 0.73 0.99 1.25 1.29 1.09 1.19 1.28 1.53 1.06 1.26 1.50
KNO 1.43 0.92 1.26 1.42 1.31 0.81 1.07 1.30 2.11 1.06 1.32 2.03 1.31 1.15 1.32 1.74
PHS 1.28 0.59 0.85 1.27 1.26 0.45 0.91 1.25 1.2 0.98 1.06 1.19 1.62 0.92 1.19 1.57
KGH 1.35 0.71 0.97 1.34 1.26 0.71 1.01 1.25 1.22 1.12 1.17 1.22 1.54 0.84 1.24 1.51
PGH 1.41 1.01 1.23 1.40 1.31 0.69 1.07 1.30 1.25 0.96 1.16 1.24 1.51 1.16 1.29 1.50
(* 98th %: 98th Percentile)
PCO (Panvel CIDCO Office); KRS (Khandeshwar Railway Station); KCO (Kalamboli CIDCO Office); KNO (Kharghar Nodal Office); BCB (Belapur CIDCO Bhavan); PHS (Pargaon High School); GWT (Gavanphata Water Tank); ACL (Ambuja Cement Ltd.); KGH (Kille Gaothan Guest House) ; PGH (Panchsheel Guest House)
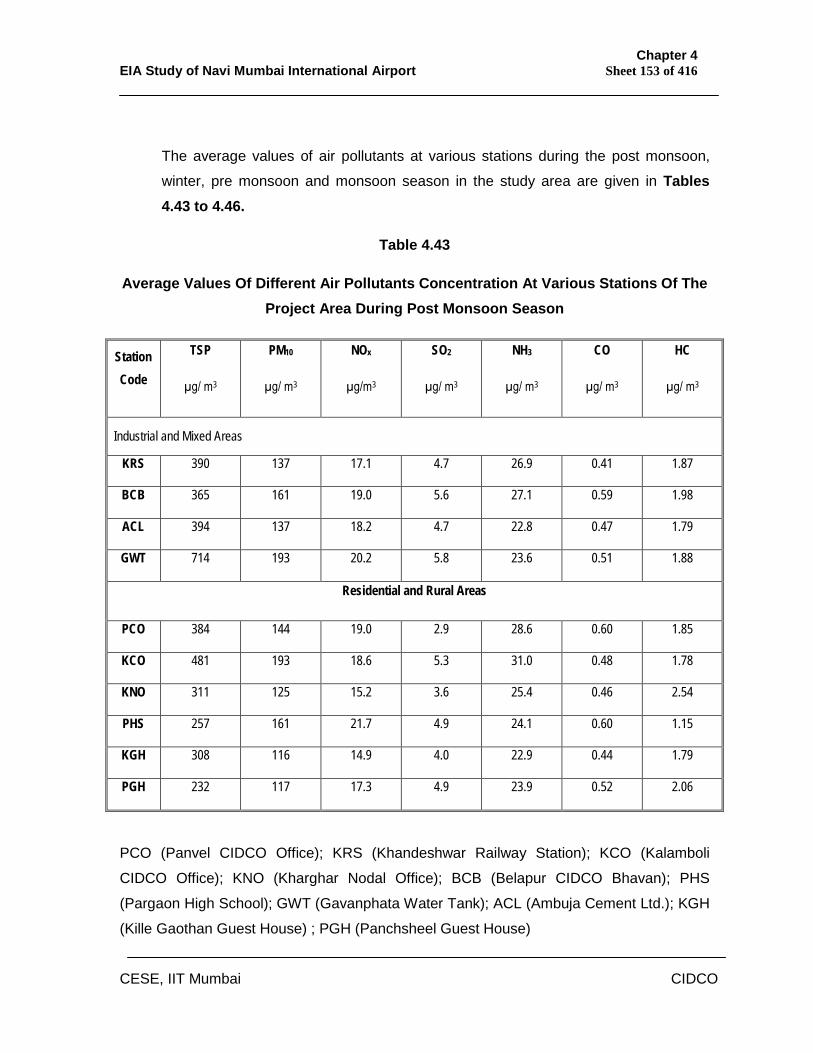
Chapter 4 EIA Study of Navi Mumbai International Airport Sheet 153 of 416
CESE, IIT Mumbai CIDCO
The average values of air pollutants at various stations during the post monsoon,
winter, pre monsoon and monsoon season in the study area are given in Tables 4.43 to 4.46.
Table 4.43
Average Values Of Different Air Pollutants Concentration At Various Stations Of The Project Area During Post Monsoon Season
Station Code
TSP
µg/ m3
PM10
µg/ m3
NOx
µg/m3
SO2
µg/ m3
NH3
µg/ m3
CO
µg/ m3
HC
µg/ m3
Industrial and Mixed Areas
KRS 390 137 17.1 4.7 26.9 0.41 1.87
BCB 365 161 19.0 5.6 27.1 0.59 1.98
ACL 394 137 18.2 4.7 22.8 0.47 1.79
GWT 714 193 20.2 5.8 23.6 0.51 1.88
Residential and Rural Areas
PCO 384 144 19.0 2.9 28.6 0.60 1.85
KCO 481 193 18.6 5.3 31.0 0.48 1.78
KNO 311 125 15.2 3.6 25.4 0.46 2.54
PHS 257 161 21.7 4.9 24.1 0.60 1.15
KGH 308 116 14.9 4.0 22.9 0.44 1.79
PGH 232 117 17.3 4.9 23.9 0.52 2.06
PCO (Panvel CIDCO Office); KRS (Khandeshwar Railway Station); KCO (Kalamboli
CIDCO Office); KNO (Kharghar Nodal Office); BCB (Belapur CIDCO Bhavan); PHS
(Pargaon High School); GWT (Gavanphata Water Tank); ACL (Ambuja Cement Ltd.); KGH
(Kille Gaothan Guest House) ; PGH (Panchsheel Guest House)
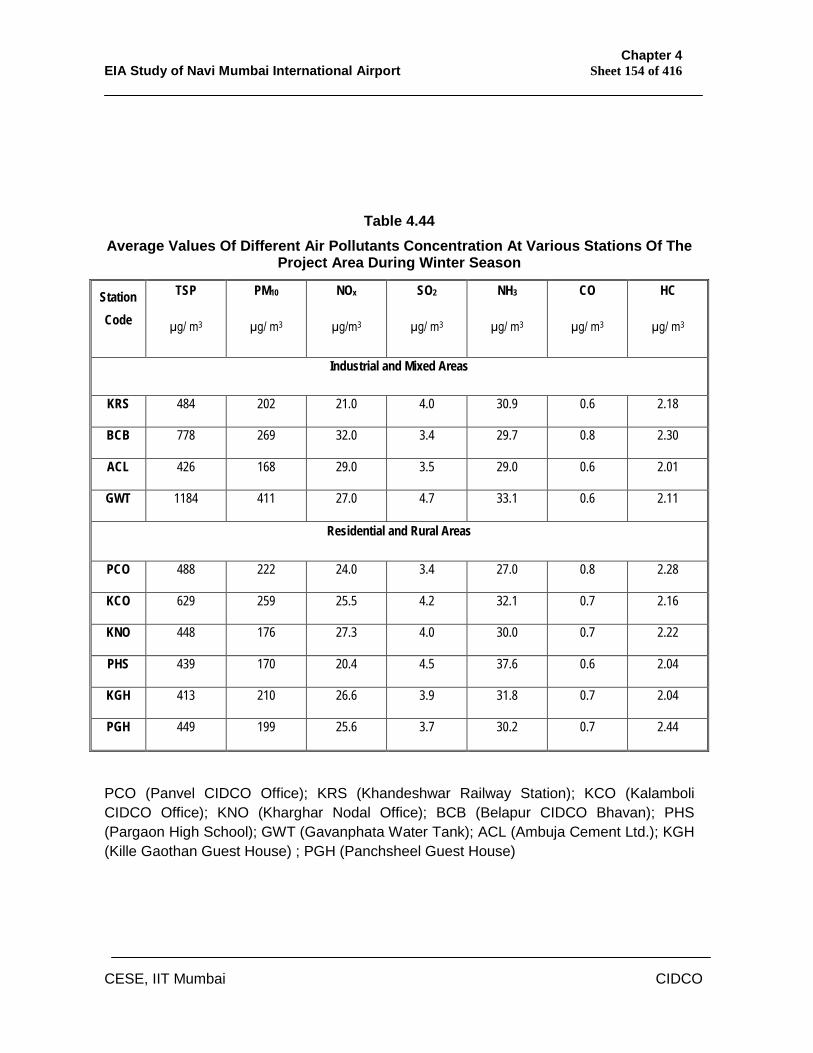
Chapter 4 EIA Study of Navi Mumbai International Airport Sheet 154 of 416
CESE, IIT Mumbai CIDCO
Table 4.44 Average Values Of Different Air Pollutants Concentration At Various Stations Of The
Project Area During Winter Season
Station Code
TSP
µg/ m3
PM10
µg/ m3
NOx
µg/m3
SO2
µg/ m3
NH3
µg/ m3
CO
µg/ m3
HC
µg/ m3
Industrial and Mixed Areas
KRS 484 202 21.0 4.0 30.9 0.6 2.18
BCB 778 269 32.0 3.4 29.7 0.8 2.30
ACL 426 168 29.0 3.5 29.0 0.6 2.01
GWT 1184 411 27.0 4.7 33.1 0.6 2.11
Residential and Rural Areas
PCO 488 222 24.0 3.4 27.0 0.8 2.28
KCO 629 259 25.5 4.2 32.1 0.7 2.16
KNO 448 176 27.3 4.0 30.0 0.7 2.22
PHS 439 170 20.4 4.5 37.6 0.6 2.04
KGH 413 210 26.6 3.9 31.8 0.7 2.04
PGH 449 199 25.6 3.7 30.2 0.7 2.44
PCO (Panvel CIDCO Office); KRS (Khandeshwar Railway Station); KCO (Kalamboli CIDCO Office); KNO (Kharghar Nodal Office); BCB (Belapur CIDCO Bhavan); PHS (Pargaon High School); GWT (Gavanphata Water Tank); ACL (Ambuja Cement Ltd.); KGH (Kille Gaothan Guest House) ; PGH (Panchsheel Guest House)
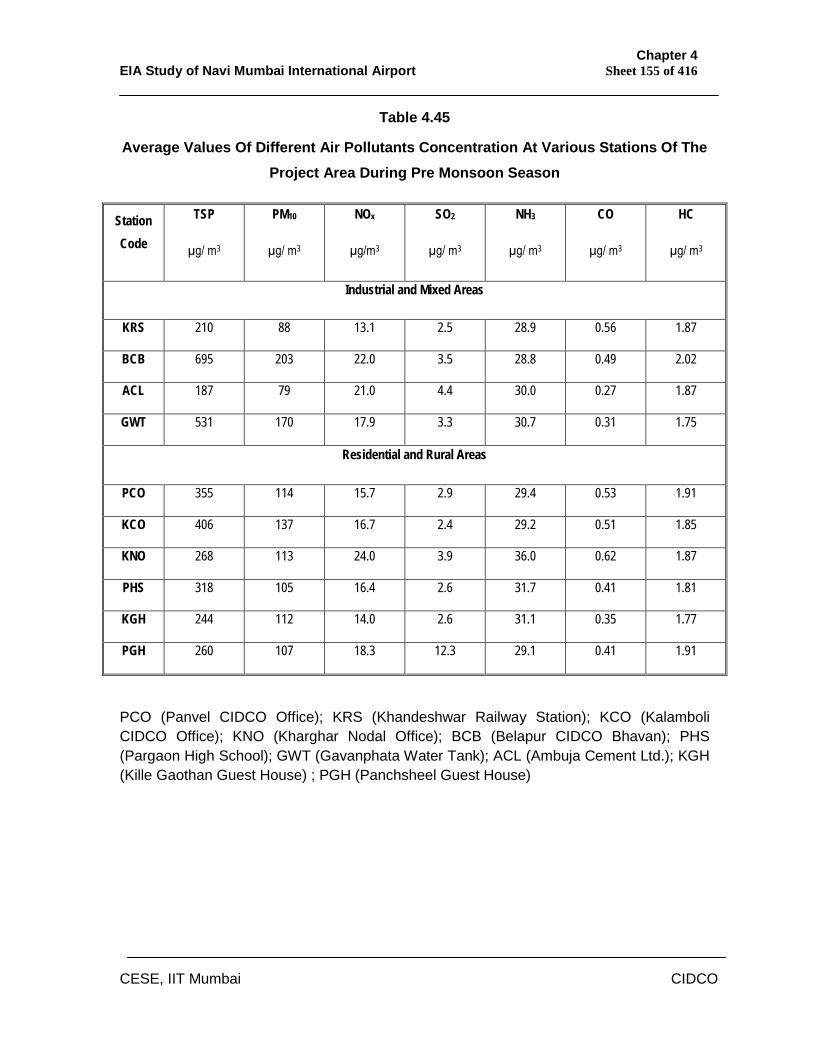
Chapter 4 EIA Study of Navi Mumbai International Airport Sheet 155 of 416
CESE, IIT Mumbai CIDCO
Table 4.45
Average Values Of Different Air Pollutants Concentration At Various Stations Of The Project Area During Pre Monsoon Season
Station Code
TSP
µg/ m3
PM10
µg/ m3
NOx
µg/m3
SO2
µg/ m3
NH3
µg/ m3
CO
µg/ m3
HC
µg/ m3
Industrial and Mixed Areas
KRS 210 88 13.1 2.5 28.9 0.56 1.87
BCB 695 203 22.0 3.5 28.8 0.49 2.02
ACL 187 79 21.0 4.4 30.0 0.27 1.87
GWT 531 170 17.9 3.3 30.7 0.31 1.75
Residential and Rural Areas
PCO 355 114 15.7 2.9 29.4 0.53 1.91
KCO 406 137 16.7 2.4 29.2 0.51 1.85
KNO 268 113 24.0 3.9 36.0 0.62 1.87
PHS 318 105 16.4 2.6 31.7 0.41 1.81
KGH 244 112 14.0 2.6 31.1 0.35 1.77
PGH 260 107 18.3 12.3 29.1 0.41 1.91
PCO (Panvel CIDCO Office); KRS (Khandeshwar Railway Station); KCO (Kalamboli CIDCO Office); KNO (Kharghar Nodal Office); BCB (Belapur CIDCO Bhavan); PHS (Pargaon High School); GWT (Gavanphata Water Tank); ACL (Ambuja Cement Ltd.); KGH (Kille Gaothan Guest House) ; PGH (Panchsheel Guest House)
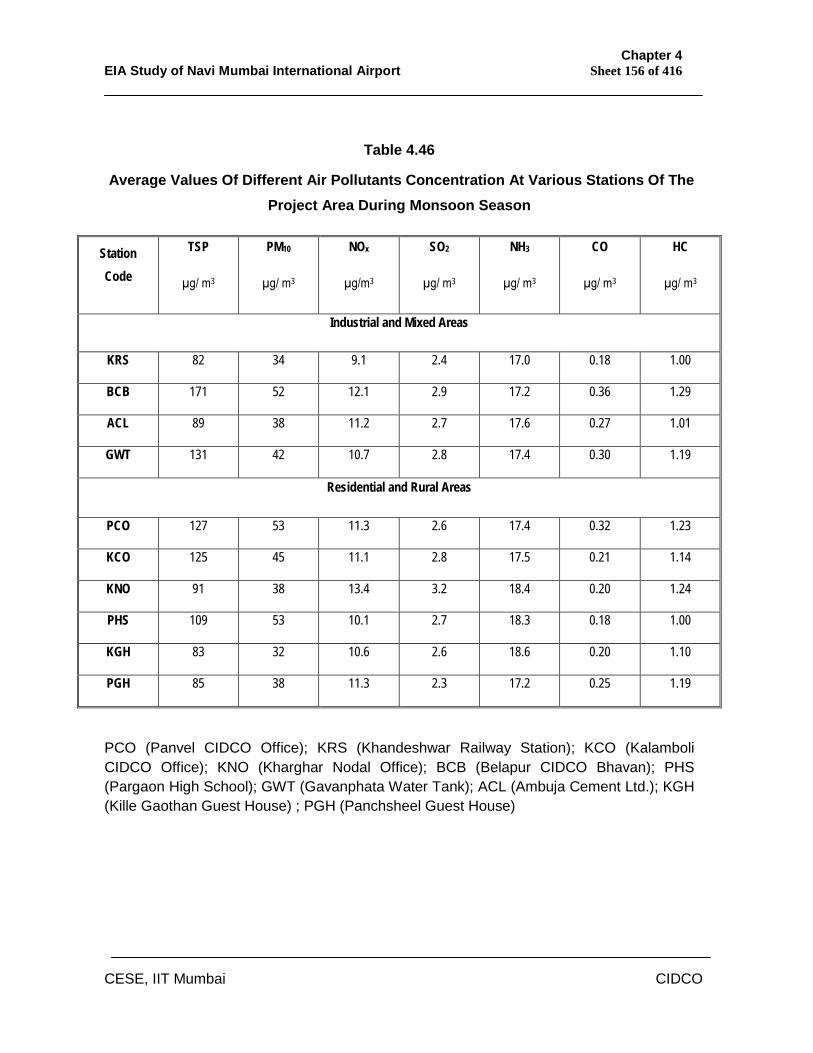
Chapter 4 EIA Study of Navi Mumbai International Airport Sheet 156 of 416
CESE, IIT Mumbai CIDCO
Table 4.46
Average Values Of Different Air Pollutants Concentration At Various Stations Of The Project Area During Monsoon Season
Station Code
TSP
µg/ m3
PM10
µg/ m3
NOx
µg/m3
SO2
µg/ m3
NH3
µg/ m3
CO
µg/ m3
HC
µg/ m3
Industrial and Mixed Areas
KRS 82 34 9.1 2.4 17.0 0.18 1.00
BCB 171 52 12.1 2.9 17.2 0.36 1.29
ACL 89 38 11.2 2.7 17.6 0.27 1.01
GWT 131 42 10.7 2.8 17.4 0.30 1.19
Residential and Rural Areas
PCO 127 53 11.3 2.6 17.4 0.32 1.23
KCO 125 45 11.1 2.8 17.5 0.21 1.14
KNO 91 38 13.4 3.2 18.4 0.20 1.24
PHS 109 53 10.1 2.7 18.3 0.18 1.00
KGH 83 32 10.6 2.6 18.6 0.20 1.10
PGH 85 38 11.3 2.3 17.2 0.25 1.19
PCO (Panvel CIDCO Office); KRS (Khandeshwar Railway Station); KCO (Kalamboli CIDCO Office); KNO (Kharghar Nodal Office); BCB (Belapur CIDCO Bhavan); PHS (Pargaon High School); GWT (Gavanphata Water Tank); ACL (Ambuja Cement Ltd.); KGH (Kille Gaothan Guest House) ; PGH (Panchsheel Guest House)
Chapter 4 EIA Study of Navi Mumbai International Airport Sheet 157 of 416
CESE, IIT Mumbai CIDCO
The monitoring stations such as ACL, BCB, KRS and GWT are considered
in the industrial and mixed areas whereas, PCO, KCO, KNO, PGH, KGH
and PHS are considered in the residential, rural and other areas. The results
obtained are compared with the respective standards for different land use
areas as given by Central Pollution Control Board (CPCB), New Delhi and
found that all values for gaseous pollutants are well within prescribed limit
except TSP and PM 10 during the study period at all stations.
The average concentrations of TSP, PM10, NOx, SO2, NH3, CO and HC for
industrial and mixed areas in study area during post monsoon season were
in the range of 289-843 µg/m3, 116 - 267 µg/m3, 12 – 22.6 µg/m3, 2.0 – 9.1
µg/m3, 16 – 29.7 µg/m3, 0.14-0.88 µg/m3, 0.93 -2.86 µg/m3.
The average concentrations of TSP, PM10, NOx, SO2, NH3, CO and HC for
industrial and mixed areas in study area during winter season were in the
range 326- 1317µg/m3, 134- 476µg/m3, 19.4 – 37.0 µg/m3, 2.6- 5.4µg/m3,
26.0 – 38.0 µg/m3, 0.19- 0.96 µg/m3, 1.64 – 2.69 µg/m3HC.
The average concentrations of TSP, PM10, NOx, SO2, NH3, CO and HC for
industrial and mixed areas in study area during pre monsoon season were
in the range 106-746 µg/m3, 37- 302µg/m3, 10.7 – 27.2 µg/m3, 2.5-
5.1µg/m3, 25.5 – 34.0 µg/m3, 0.15- 0.76 µg/m3, 1.37 – 2.38 µg/m3HC. The
average concentrations of TSP, PM10, NOx, SO2, NH3, CO and HC for
industrial and mixed areas in study area during monsoon season were in the
range 31-245 µg/m3, 20-64 µg/m3, 5-13.8 µg/m3, µg/m3, 2.0 - 4.3 µg/m3,
14.5 - 23.9 µg/m3, 0.14 - 0.62 µg/m3, 0.84 - 1.49µg/m3 The gaseous air
pollutant like NOx, SO2, NH3, and CO concentrations in the air always
remained within limits prescribed by CPCB for industrial and mixed areas
during all seasons. The criteria pollutants, TSP and PM10 sometimes
exceeded the limits prescribed by CPCB at some stations during post
monsoon and pre monsoon seasons. The high values of TSP and PM10
might be due to wind blown dust and resuspended road dust due to the road
construction work and vehicular movement on unpaved roads at these
areas. Gavanphata area was observed to have maximum TSP and PM10
concentration compared to other areas in study area. This could be due to
Chapter 4 EIA Study of Navi Mumbai International Airport Sheet 158 of 416
CESE, IIT Mumbai CIDCO
increased vehicular traffic as it is a junction. Gavanphata is also surrounded
by spacious open area on one side and huge water tanks and vegetation on
other side. Hence, resuspended road dust from continuous movement of
heavy vehicles on unpaved road and wind blown dust trapped here, and
resulted in high levels of TSP and PM10 concentrations at the monitoring
station in this area. Hill cutting, road construction activities worsen the
situation of TSP and PM10 in Gavanphata area. The average concentrations
of TSP and PM10 in CBD, Belapur area were sometimes exceeded the
CPCB limits; this could be due to road construction activities and increased
vehicular traffic. Total air monitoring results of the survey during study
period showed that TSP and PM10 were highest during winter season
whereas concentration of TSP and PM10 was observed to be decreased
during pre monsoon, monsoon and post monsoon season. Winter season is
the worst time for air quality, in this season, surface atmospheric
temperature drops down with an inversion condition. So, ground level
concentration of the pollutants in air will be more than the upper
atmosphere. Little mixing or dilution of pollutants takes place at this stability
condition (low mixing height) of the atmosphere and hindered pollutant
dispersion during winter months. Moreover, suspended particles in the study
area are natural and not chemical in nature and may not have adverse
effect on human health. Pollutant dispersion due to meteorological condition
during pre monsoon season resulted in decrease in TSP concentration.
During monsoon season, there was a considerable decrease in TSP. This
was because of rain wash out (precipitation scavenging of pollutants) at
these stations. The concentration of criteria pollutants were gradually
increased during post monsoon season.
The average concentrations of TSP, PM10, NOx, SO2 and NH3, CO and HC
for residential and rural areas in study area during post monsoon season
were observed to be in the range of 225 to 511 µg/m3, 107 to 207 µg/m3,
12.6 to 23.9 µg/m3, 1.7 to 6.9 µg/m3, 20.2 to 33.9 µg/m3, 0.13 to 1.04 µg/m3,
0.85 to 3.81 µg/m3.
Chapter 4 EIA Study of Navi Mumbai International Airport Sheet 159 of 416
CESE, IIT Mumbai CIDCO
The average concentrations of TSP, PM10, NOx, SO2, NH3, CO and HC for
residential and rural areas in study area during winter season were in the
range of 363- 756 µg/m3, 159- 297µg/m3, 18.3 – 32.6 µg/m3, 2.3 – 5.6
µg/m3, 25.3 - 41.6µg/m3, 0.22 – 1.03µg/m3, 1.73 – 2.80µg/m3HC.
The average concentrations of TSP, PM10, NOx, SO2, NH3, CO and HC for
residential and rural areas in study area during pre monsoon season were in
the range of 117- 558µg/m3, 38- 229µg/m3, 10.6 – 27.9 µg/m3, 1.9 – 31.6
µg/m3, 24.2 – 37.9µg/m3, 0.16 - 0.83µg/m3, 1.38 – 2.52µg/m3HC.
The average concentrations of TSP, PM10, NOx, SO2, NH3, CO and HC for
residential and rural areas in study area during monsoon season were in the
range of 22 - 174 µg/m3, 19 - 76 µg/m3, 7.3 - 16.5 µg/m3, 2.1 - 4.3 µg/m3,
14.1 - 26.9 µg/m3, 0.1 - 0.49 µg/m3, 0.85 - 1.4 µg/m3HC.
The higher value of TSP and PM10 might be due to wind blown dust.
Resuspension of dust due to vehicular movement on unpaved roads and
road construction activities being undertaken at some stations also
contributed to increased level of TSP in air at Panvel, Kalamboli and
Kharghar areas. Vehicular movement on unpaved roads, operation of stone
quarries at Kombadbhuji and new road construction work led to high levels
of TSP and PM10 at Kille Gaothan and Pargaon.
The overall average concentrations of TSP, PM10, NOx, SO2, NH3, CO and
HC in the study area were found to be in the range 88 to1184µg/m3, 32 to
411 µg/m3, 9.1 to 32 µg/m3, 2.3 to 12.3 µg/m3, 17 to 37.6 µg/m3, 0.18 to 0.8
µg/m3, 1.0 to 2.54 µg/m3 respectively.
The maximum concentrations of TSP for industrial and mixed area were
found to be 843 µg/m3, 1317µg/m3, 746µg/m3 and 245 µg/m3 whereas in
residential and rural areas it was found to be 511 µg/m3, 756µg/m3, 558
µg/m3 and 174 µg/m3 during post monsoon, winter, pre monsoon and
monsoon season respectively.
The minimum concentrations of TSP for industrial and mixed area were
found to be 289 µg/m3, 326µg/m3, 106µg/m3 and 31µg/m3 whereas in
Chapter 4 EIA Study of Navi Mumbai International Airport Sheet 160 of 416
CESE, IIT Mumbai CIDCO
residential and rural areas it was found to be 225 µg/m3, 363µg/m3,
117µg/m3 and 22µg/m3 during post monsoon, winter, pre monsoon and
monsoon season respectively.
The maximum concentrations of TSP, PM10, NOx, SO2, NH3, CO and HC for
industrial and mixed area in study area during post monsoon season were
found to be 1331 µg/m3, 594µg/m3, 39.9 µg/m3, 27.3 µg/m3, 49.4µg/m3,
1.67µg/m3 and 4.18µg/m3 at GWT, GWT, KRS, BCB, KRS, ACL and BCB
stations respectively.
The minimum concentrations of TSP, PM10, NOx, SO2, NH3, CO and HC for
industrial and mixed area in study area during post monsoon season were
found to be 93 µg/m3, 55 µg/m3, 2.0µg/m3, 0.6 µg/m3, 4.9µg/m3, 0.02µg/m3,
and 0.45µg/m3 at GWT, BCB, ACL, GWT, ACL, KRS, and KRS stations
respectively.
The maximum concentrations of TSP, PM10, NOx, SO2, NH3, CO and HC for
residential and rural area in study area during post monsoon season were
found to be 1002 µg/m3, 466 µg/m3, 37.7 µg/m3, 23.1 µg/m3, 46.1 µg/m3,
1.73 µg/m3 and 5.01 µg/m3 at KCO, KCO, PHS, KCO, PCO, PGH and KNO
stations respectively.
The minimum concentrations of TSP, PM10, NOx, SO2, NH3, CO and HC for
residential and rural area in study area during post monsoon season were
found to be 102 µg/m3, 48µg/m3, 3.6µg/m3, 1.0 µg/m3, 7.0µg/m3, BDL, and
0.59µg/m3 at PGH, KNO, KGH, KGH, KGH, KCO and PHS stations
respectively.
The maximum concentrations of TSP, PM10, NOx, SO2, NH3, CO and HC for
industrial and mixed areas in the study area during winter season were
found to be 2032 µg/m3, 778µg/m3, 48.7µg/m3, 13.3µg/m3, 57.4 µg/m3, 1.75
and 4.51µg/m3 GWT, GWT, BCB, GWT, KRS, ACL and GWT respectively.
The minimum concentrations of TSP, PM10, NOx, SO2, NH3, CO and HC for
industrial and mixed areas in the study area during winter season were
found to be 179 µg/m3, 108µg/m3, 10.3 µg/m3, 1.0µg/m3, 12.1 µg/m3,
Chapter 4 EIA Study of Navi Mumbai International Airport Sheet 161 of 416
CESE, IIT Mumbai CIDCO
BDLµg/m3 and 1.18µg/m3 KRS, ACL, GWT, ACL, ACL, KRS and BCB
respectively.
The maximum concentrations of TSP, PM10, NOx, SO2, NH3, CO and HC
residential and rural areas in study area during winter season were found to
be 1517µg/m3, 735µg/m3, 43.2 µg/m3, 18.3µg/m3, 66.5µg/m3, 1.68 µg/m3,
4.01µg/m3 at KCO, PCO, KCO, PGH, PHS, PGH and PGH, stations
respectively.
The minimum concentrations of TSP, PM10, NOx, SO2, NH3, CO and HC for
residential and rural areas in the study area during winter season were
found to be 166 µg/m3, 47µg/m3, 8.3 µg/m3, BDL µg/m3, 10.8 µg/m3,
BDLµg/m3 and 1.14 µg/m3 KNO, KCO, PHS, PHS, PCO, PCO, and KCO
respectively.
The maximum concentrations of TSP, PM10, NOx, SO2, NH3, CO and HC
industrial and mixed areas in study area during pre monsoon season were
found to be 2208 µg/m3, 151 µg/m3, 42.6 µg/m3, 10.1 µg/m3, 56.2 µg/m3,
0.96 µg/m3, 4.18 µg/m3 at GWT, BCB, BCB, ACL,BCB, BCB and BCB
stations respectively.
The minimum concentrations of TSP, PM10, NOx, SO2, NH3, CO and HC for
industrial and mixed areas in the study area during pre monsoon season
were found to be 46 µg/m3, 13 µg/m3, 7.3 µg/m3, 0.6 µg/m3, 14.3 µg/m3,
0.05µg/m3, 1.02 µg/m3, KRS, GWT, KRS, GWT, GWT, ACL and BCB
respectively.
The maximum concentrations of TSP, PM10, NOx, SO2, NH3, CO and HC for
residential and rural areas in the study area during pre monsoon season
were found to be 1050 µg/m3, 839µg/m3, 42.0 µg/m3, 8.3 µg/m3, 55.4 µg/m3,
1.52 µg/m3 and 2.84 µg/m3, KGH, KGH, KNO, PCO, KNO, KNO, PCO
respectively.
The minimum concentrations of TSP, PM10, NOx, SO2, NH3, CO and HC for
residential and rural areas in study area during pre monsoon season were
found to be 61 µg/m3, 16 µg/m3, 7.9 µg/m3, BDL, 15.4 µg/m3, 0.08 µg/m3,
Chapter 4 EIA Study of Navi Mumbai International Airport Sheet 162 of 416
CESE, IIT Mumbai CIDCO
1.02 µg/m3 at KGH, KGH, PHS, KGH, KCO, PHS, and KCO stations
respectively.
The maximum concentrations of TSP, PM10, NOx, SO2, NH3, CO and HC for
industrial and mixed areas in the study area during monsoon season were
found to be 532 µg/m3, 116 µg/m3, 26.8 µg/m3, 15.1 µg/m3, 42.0 µg/m3, 1.3
µg/m3, 2.2 µg/m3 KRS, BCB, ACL, ACL, GWT ACL, BCB respectively.
The minimum concentrations of TSP, PM10, NOx, SO2, NH3, CO and HC
industrial and mixed areas in study area during monsoon season were
found to be 18 µg/m3, 11µg/m3, 2.8 µg/m3, BDL , 7.0 µg/m3, 0.02 µg/m3,
0.59 µg/m3 at KRS, ACL, KRS, KRS, ACL, KRS AND KRS stations
respectively.
The maximum concentrations of TSP, PM10, NOx, SO2, NH3, CO and HC for
residential and rural areas in the study area during monsoon season were
found to be 641 µg/m3, 200 µg/m3, 30.4 µg/m3, 8.0 µg/m3, 40.3 µg/m3, 1.23
µg/m3 and 2.11 µg/m3 KCO, PHS, KNO, KCO, KNO, PGH, KNO stations
respectively.
The minimum concentrations of TSP, PM10, NOx, SO2, NH3, CO and HC for
residential and rural areas in study area during monsoon season were found
to be 15 µg/m3, 3 µg/m3, 2.7 µg/m3, BDL , 8.6 µg/m3, BDL , 0.45 µg/m3 at
PHS, PHS, KGH, PCO, KGH, KCO and PHS stations respectively.
The highest concentration of TSP and PM10 was observed 2032 µg/m3, 778 µg/m3 in the winter season at GWT
4.9.4 Total Air quality
Total air quality status of the project area was assessed with help of Air
Quality Index (AQI). Air quality index has been calculated for each station
for the post monsoon, winter, pre monsoon and monsoon season and the
results are shown in Tables 4.47 to 4.50.
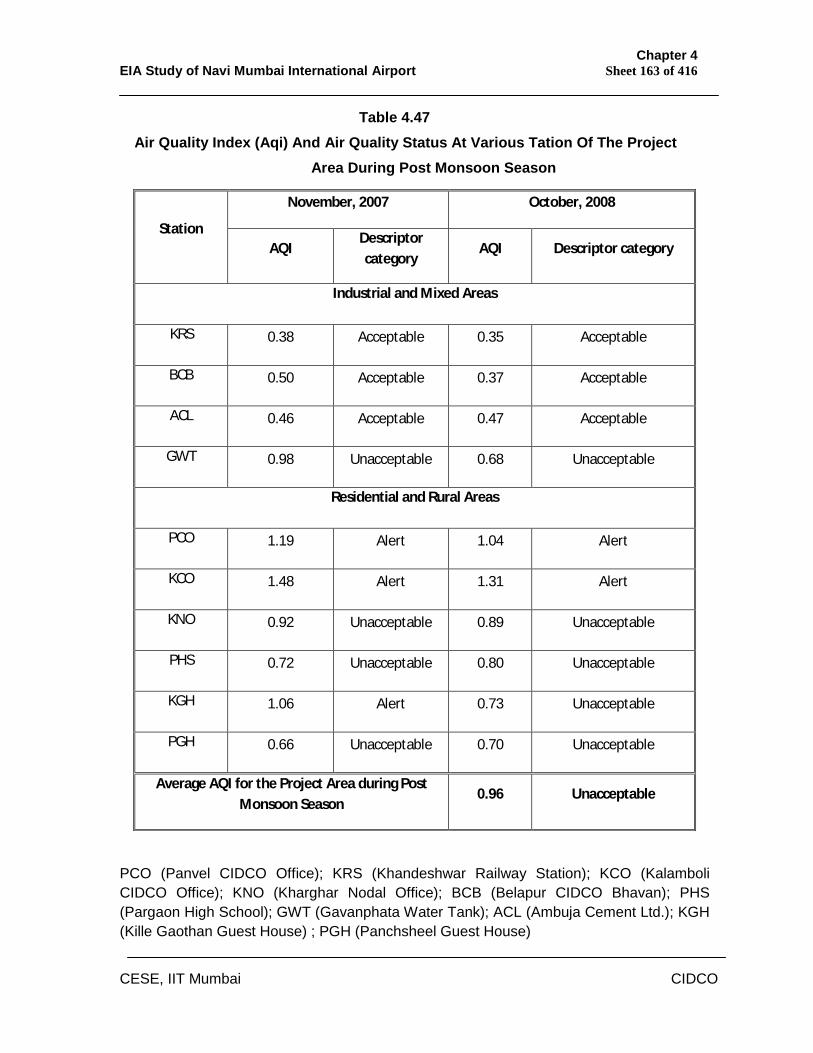
Chapter 4 EIA Study of Navi Mumbai International Airport Sheet 163 of 416
CESE, IIT Mumbai CIDCO
Table 4.47 Air Quality Index (Aqi) And Air Quality Status At Various Tation Of The Project
Area During Post Monsoon Season
PCO (Panvel CIDCO Office); KRS (Khandeshwar Railway Station); KCO (Kalamboli CIDCO Office); KNO (Kharghar Nodal Office); BCB (Belapur CIDCO Bhavan); PHS (Pargaon High School); GWT (Gavanphata Water Tank); ACL (Ambuja Cement Ltd.); KGH (Kille Gaothan Guest House) ; PGH (Panchsheel Guest House)
November, 2007 October, 2008
Station AQI
Descriptor category
AQI Descriptor category
Industrial and Mixed Areas
KRS 0.38 Acceptable 0.35 Acceptable
BCB 0.50 Acceptable 0.37 Acceptable
ACL 0.46 Acceptable 0.47 Acceptable
GWT 0.98 Unacceptable 0.68 Unacceptable
Residential and Rural Areas
PCO 1.19 Alert 1.04 Alert
KCO 1.48 Alert 1.31 Alert
KNO 0.92 Unacceptable 0.89 Unacceptable
PHS 0.72 Unacceptable 0.80 Unacceptable
KGH 1.06 Alert 0.73 Unacceptable
PGH 0.66 Unacceptable 0.70 Unacceptable
Average AQI for the Project Area during Post Monsoon Season
0.96 Unacceptable
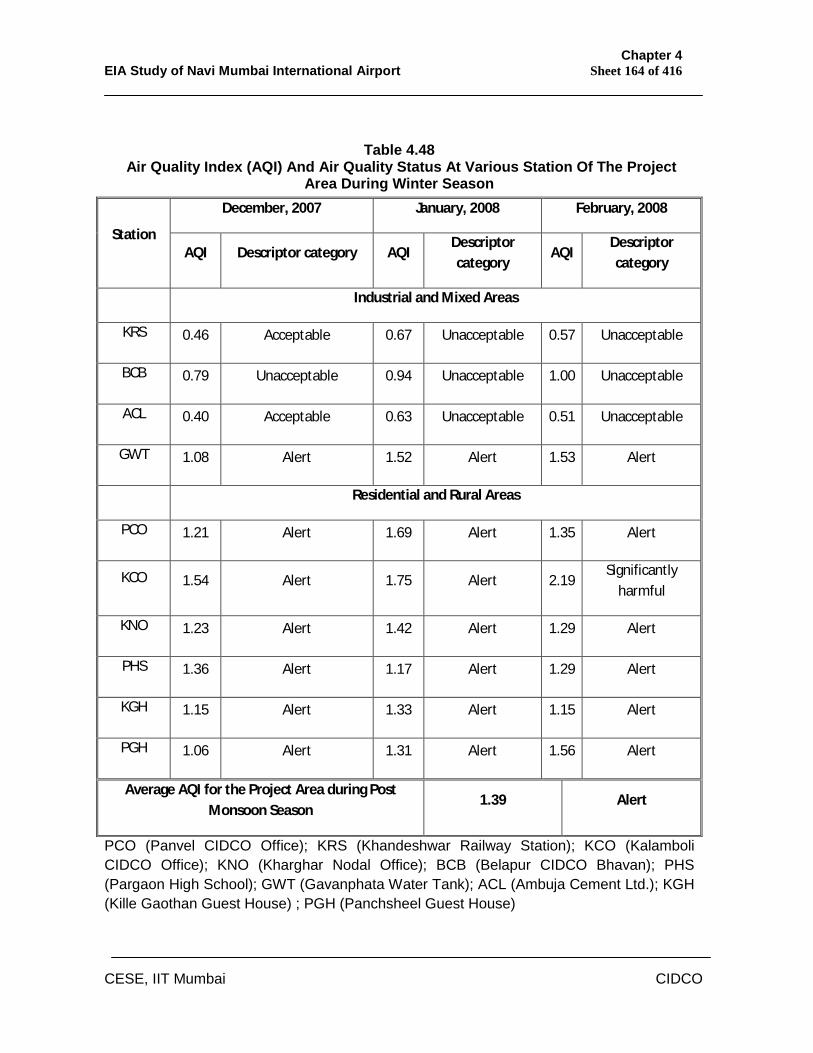
Chapter 4 EIA Study of Navi Mumbai International Airport Sheet 164 of 416
CESE, IIT Mumbai CIDCO
Table 4.48 Air Quality Index (AQI) And Air Quality Status At Various Station Of The Project
Area During Winter Season
PCO (Panvel CIDCO Office); KRS (Khandeshwar Railway Station); KCO (Kalamboli CIDCO Office); KNO (Kharghar Nodal Office); BCB (Belapur CIDCO Bhavan); PHS (Pargaon High School); GWT (Gavanphata Water Tank); ACL (Ambuja Cement Ltd.); KGH (Kille Gaothan Guest House) ; PGH (Panchsheel Guest House)
December, 2007 January, 2008 February, 2008
Station AQI Descriptor category AQI
Descriptor category
AQI Descriptor category
Industrial and Mixed Areas
KRS 0.46 Acceptable 0.67 Unacceptable 0.57 Unacceptable
BCB 0.79 Unacceptable 0.94 Unacceptable 1.00 Unacceptable
ACL 0.40 Acceptable 0.63 Unacceptable 0.51 Unacceptable
GWT 1.08 Alert 1.52 Alert 1.53 Alert
Residential and Rural Areas
PCO 1.21 Alert 1.69 Alert 1.35 Alert
KCO 1.54 Alert 1.75 Alert 2.19 Significantly
harmful
KNO 1.23 Alert 1.42 Alert 1.29 Alert
PHS 1.36 Alert 1.17 Alert 1.29 Alert
KGH 1.15 Alert 1.33 Alert 1.15 Alert
PGH 1.06 Alert 1.31 Alert 1.56 Alert
Average AQI for the Project Area during Post Monsoon Season
1.39 Alert
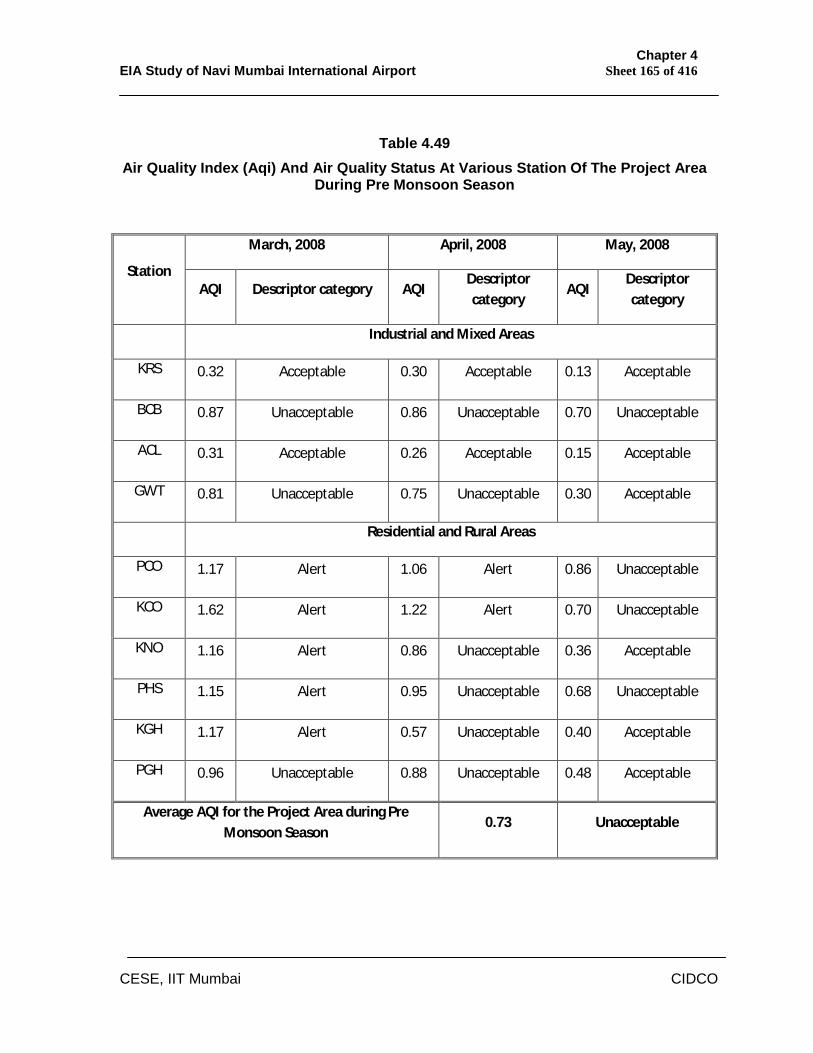
Chapter 4 EIA Study of Navi Mumbai International Airport Sheet 165 of 416
CESE, IIT Mumbai CIDCO
Table 4.49 Air Quality Index (Aqi) And Air Quality Status At Various Station Of The Project Area
During Pre Monsoon Season
March, 2008 April, 2008 May, 2008
Station AQI Descriptor category AQI
Descriptor category
AQI Descriptor category
Industrial and Mixed Areas
KRS 0.32 Acceptable 0.30 Acceptable 0.13 Acceptable
BCB 0.87 Unacceptable 0.86 Unacceptable 0.70 Unacceptable
ACL 0.31 Acceptable 0.26 Acceptable 0.15 Acceptable
GWT 0.81 Unacceptable 0.75 Unacceptable 0.30 Acceptable
Residential and Rural Areas
PCO 1.17 Alert 1.06 Alert 0.86 Unacceptable
KCO 1.62 Alert 1.22 Alert 0.70 Unacceptable
KNO 1.16 Alert 0.86 Unacceptable 0.36 Acceptable
PHS 1.15 Alert 0.95 Unacceptable 0.68 Unacceptable
KGH 1.17 Alert 0.57 Unacceptable 0.40 Acceptable
PGH 0.96 Unacceptable 0.88 Unacceptable 0.48 Acceptable
Average AQI for the Project Area during Pre Monsoon Season
0.73 Unacceptable
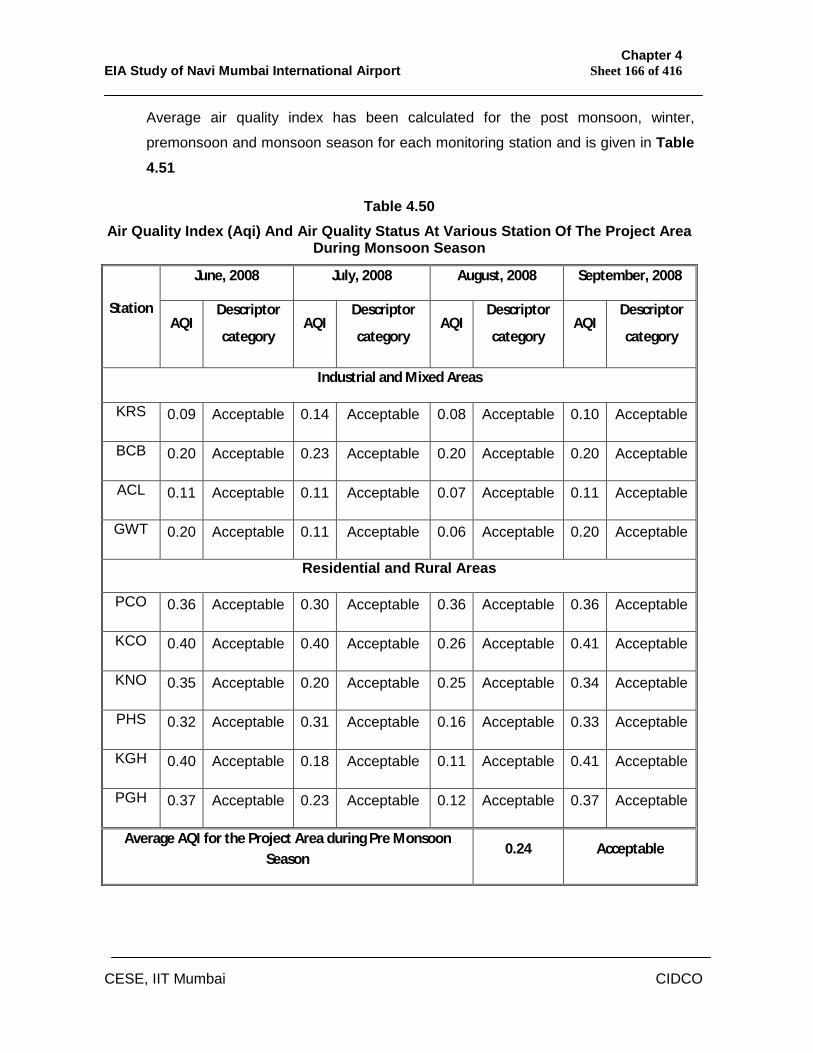
Chapter 4 EIA Study of Navi Mumbai International Airport Sheet 166 of 416
CESE, IIT Mumbai CIDCO
Average air quality index has been calculated for the post monsoon, winter,
premonsoon and monsoon season for each monitoring station and is given in Table 4.51
Table 4.50 Air Quality Index (Aqi) And Air Quality Status At Various Station Of The Project Area
During Monsoon Season
June, 2008 July, 2008 August, 2008 September, 2008
Station AQI
Descriptor
category AQI
Descriptor
category AQI
Descriptor
category AQI
Descriptor
category
Industrial and Mixed Areas
KRS 0.09 Acceptable 0.14 Acceptable 0.08 Acceptable 0.10 Acceptable
BCB 0.20 Acceptable 0.23 Acceptable 0.20 Acceptable 0.20 Acceptable
ACL 0.11 Acceptable 0.11 Acceptable 0.07 Acceptable 0.11 Acceptable
GWT 0.20 Acceptable 0.11 Acceptable 0.06 Acceptable 0.20 Acceptable
Residential and Rural Areas
PCO 0.36 Acceptable 0.30 Acceptable 0.36 Acceptable 0.36 Acceptable
KCO 0.40 Acceptable 0.40 Acceptable 0.26 Acceptable 0.41 Acceptable
KNO 0.35 Acceptable 0.20 Acceptable 0.25 Acceptable 0.34 Acceptable
PHS 0.32 Acceptable 0.31 Acceptable 0.16 Acceptable 0.33 Acceptable
KGH 0.40 Acceptable 0.18 Acceptable 0.11 Acceptable 0.41 Acceptable
PGH 0.37 Acceptable 0.23 Acceptable 0.12 Acceptable 0.37 Acceptable
Average AQI for the Project Area during Pre Monsoon Season
0.24 Acceptable
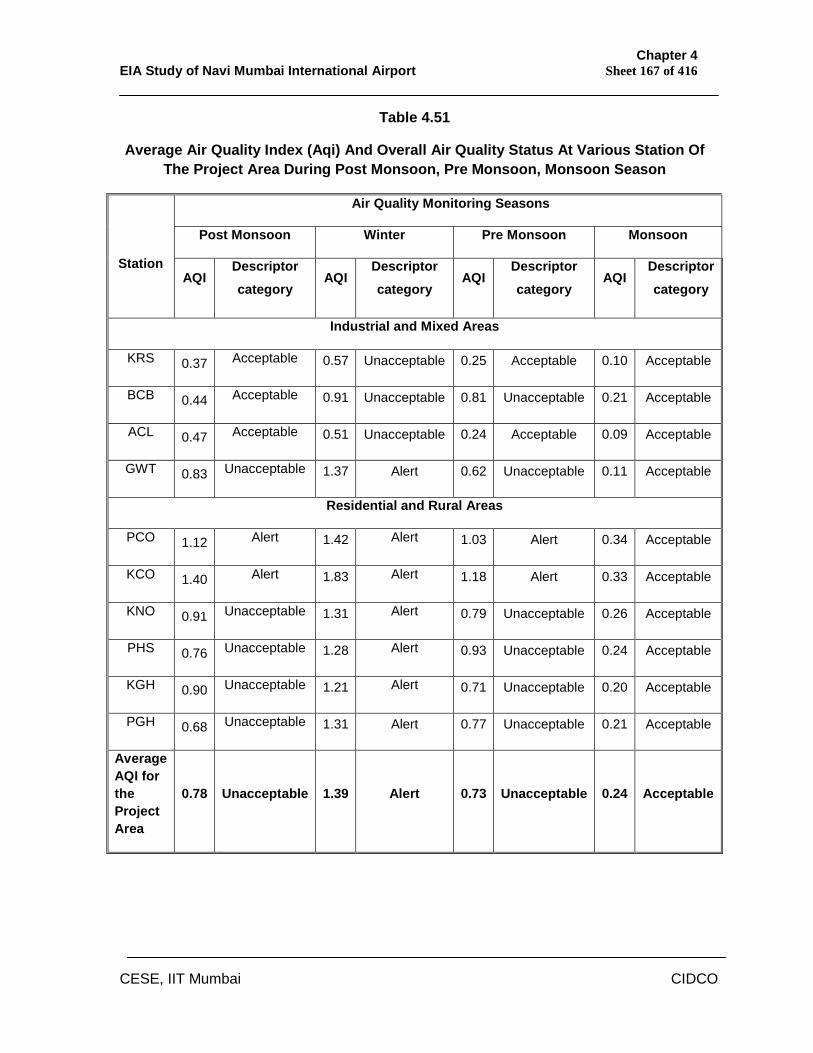
Chapter 4 EIA Study of Navi Mumbai International Airport Sheet 167 of 416
CESE, IIT Mumbai CIDCO
Table 4.51
Average Air Quality Index (Aqi) And Overall Air Quality Status At Various Station Of The Project Area During Post Monsoon, Pre Monsoon, Monsoon Season
Air Quality Monitoring Seasons
Post Monsoon Winter Pre Monsoon Monsoon
Station AQI
Descriptor
category AQI
Descriptor
category AQI
Descriptor
category AQI
Descriptor
category
Industrial and Mixed Areas
KRS 0.37 Acceptable 0.57 Unacceptable 0.25 Acceptable 0.10 Acceptable
BCB 0.44 Acceptable 0.91 Unacceptable 0.81 Unacceptable 0.21 Acceptable
ACL 0.47 Acceptable 0.51 Unacceptable 0.24 Acceptable 0.09 Acceptable
GWT 0.83 Unacceptable 1.37 Alert 0.62 Unacceptable 0.11 Acceptable
Residential and Rural Areas
PCO 1.12 Alert 1.42 Alert 1.03 Alert 0.34 Acceptable
KCO 1.40 Alert 1.83 Alert 1.18 Alert 0.33 Acceptable
KNO 0.91 Unacceptable 1.31 Alert 0.79 Unacceptable 0.26 Acceptable
PHS 0.76 Unacceptable 1.28 Alert 0.93 Unacceptable 0.24 Acceptable
KGH 0.90 Unacceptable 1.21 Alert 0.71 Unacceptable 0.20 Acceptable
PGH 0.68 Unacceptable 1.31 Alert 0.77 Unacceptable 0.21 Acceptable
Average AQI for the Project Area
0.78 Unacceptable 1.39 Alert 0.73 Unacceptable 0.24 Acceptable
Chapter 4 EIA Study of Navi Mumbai International Airport Sheet 168 of 416
CESE, IIT Mumbai CIDCO
The Air quality index values showed significant variation during study period.
The average value of air quality index observed for industrial and mixed
areas was in the range, 0.37 to 0.83, 0.51 to 1.37, 0.24 to 0.81 and 0.09 to
0.21 during post monsoon, winter, pre monsoon and monsoon season
respectively. The average value of air quality index observed for residential
and rural areas was in the range, 0.68 to 1.4, 1.21 to 1.83, 0.71 to 1.18 and
0.2 to 0.34 during post monsoon, winter, pre monsoon and monsoon season
respectively.
The average value of air quality index indicated that the industrial and mixed
area falls in the “Acceptable” category during monsoon season,
“Unacceptable to Acceptable” category during post monsoon season,
“Acceptable to Alert” category in pre monsoon season and it was in
“Unacceptable to Alert” category during winter. Similarly the average value
of air quality index indicated that the residential and rural area falls in the
“Acceptable” category during monsoon season, “Acceptable to Alert”
category during pre monsoon and post monsoon season it was found to be
in “Unacceptable to Alert” whereas during winter it was in “Alert” category.
According to the average air quality index calculated for total project area,
the air quality status of the study area was found to be in “Unacceptable”
category during post monsoon and pre monsoon season, whereas during
winter season it was in “Alert” category. During monsoon season the air
quality status of the study area was found to be in “Acceptable” category.
The seasonal air quality status at each monitoring station varied
considerably during study period. Air quality status of the total study area
during winter season was found to be in “Alert” category. It was due to the
high concentration of TSP in the study area. Concentration of TSP in the
project area was mainly due to the re-suspended and wind- blown dust from
construction area, unpaved roads, and traffic junctions, hill cutting, sand
dredging as well as from quarry operation. The Air quality status of the total
study area during pre monsoon season was found to be in Unacceptable
category. It was due to meteorological condition during pre monsoon season
which allows proper/better dispersion of pollutants. The Air quality status of
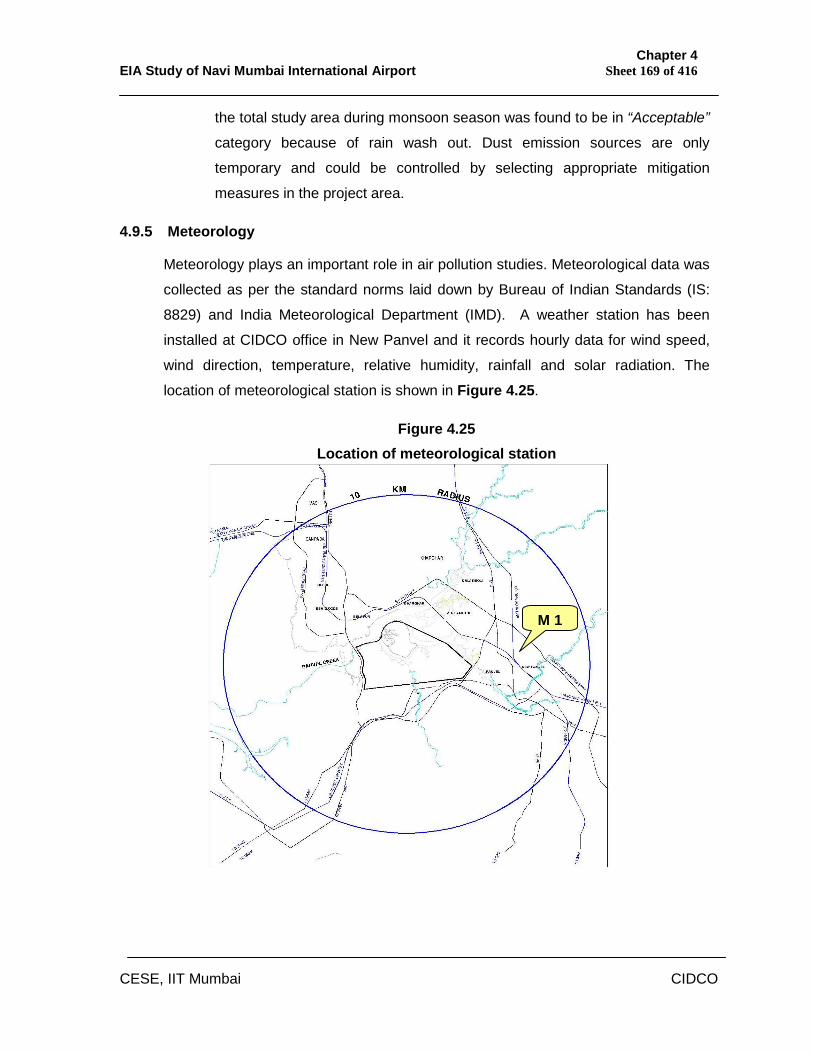
Chapter 4 EIA Study of Navi Mumbai International Airport Sheet 169 of 416
CESE, IIT Mumbai CIDCO
the total study area during monsoon season was found to be in “Acceptable”
category because of rain wash out. Dust emission sources are only
temporary and could be controlled by selecting appropriate mitigation
measures in the project area.
4.9.5 Meteorology
Meteorology plays an important role in air pollution studies. Meteorological data was
collected as per the standard norms laid down by Bureau of Indian Standards (IS:
8829) and India Meteorological Department (IMD). A weather station has been
installed at CIDCO office in New Panvel and it records hourly data for wind speed,
wind direction, temperature, relative humidity, rainfall and solar radiation. The
location of meteorological station is shown in Figure 4.25.
Figure 4.25 Location of meteorological station
M 1
Chapter 4 EIA Study of Navi Mumbai International Airport Sheet 170 of 416
CESE, IIT Mumbai CIDCO
Meteorological data recorded for wind speed and wind direction revealed that
meteorological conditions varied significantly during post monsoon, pre monsoon
and monsoon season. Table 4.52(a) to 4.52(l) gives details of meteorological data
recorded for the months of November, 2007 to October, 2008 and Table 4.53 to 4.56 gives the summary of meteorological data recorded at New Panvel for post
monsoon, pre monsoon and monsoon season. Maximum wind speed (10.3 m/s)
was recorded during monsoon season and Maximum temperature, relative humidity
and solar radiation recorded during post monsoon season were 37.40C, 99.9% and
154.5 Watts/m2 respectively in November, 2007. Maximum wind speed recorded
during post monsoon season at JN Port area was 7.6 m/s, 7.8 m/s and 8.5 m/s in
November, 2007, December, 2007 and January, 2008 respectively. Maximum wind
speed in the project area was much less than that in JN Port area though both are in
Navi Mumbai Region. Minimum temperature and relative humidity of the ambient air
in the project area during post monsoon season was 12.50C and 17.2% in January,
2008 and November, 2007 respectively. Average wind speed, temperature, relative
humidity during post monsoon season were observed to be in the range 0.1 - 0.7
m/s, 16.3 0C - 33.40C, 29.4 % - 88.5 %, respectively. Average wind speed in the
project area during post monsoon was almost within the calm period.
Hourly Average wind speed, temperature, relative humidity, solar radiation for the
month of November, 2007, December, 2007 and January, 2008 is graphically
depicted in Figures 4.26(a - d) to 4.29(a - c). Wind speed was minimum in the
month of November, 2007 and had maximum calm period (77.08%) whereas, it was
maximum in the month of January, 2008 and had minimum calm period (50.13%).
Minimum temperature was recorded in January, 2008 during the post monsoon
season. Temperature was observed to be decreased suddenly till 160C during
morning hours (6.00 AM to 8.00 PM) in January month, and lowest temperature of
12.50C was recorded on 23rd January, 2008 during post monsoon season. Highest
temperature of 37.40C was recorded during post monsoon season on 5th
November, 2007. Figures 4.30 (a) to 4.30 (l) show wind roses plotted for the
months of November, 2007 to September 2008. Predominant wind direction during
Chapter 4 EIA Study of Navi Mumbai International Airport Sheet 171 of 416
CESE, IIT Mumbai CIDCO
November, 2007, December, 2007 and January, 2008 was East South East (ESE),
West North West (WNW), and West North West (WNW) respectively. Prevailing
wind direction during post monsoon season was from West North West (WNW) with
66.86% calm condition.
Tables 4.57 to 4.60 show cloud type observed during study period and it was
observed that predominant cloud type in the study area during post monsoon
season was fine cloud. The cloud cover observed in study area during the months
of November 2007 to October 2008 is given in Tables 4.61 (a) to 4.61 (l). Visibility
observed in project area during various seasons is given in Tables 4.62 to 4.65.
The visibility observed in project area during November, 2007 was between 200-
300 meters in morning hours for 11 days and 400-600 meters in the evening hours
for 16 days. Visibility observed in the project area during morning hours in
December was less than 200 meter for 15 days. The lowest visibility recorded
during post monsoon season in project area was observed in January, 2008.
Visibility observed in the project area during the morning hours of the month of
January, 2008 was even less than 100 meters for 24 days and it was less than 200
meters in the evening hours for 19 days. The low visibility observed during morning
hours of January, 2008 might be due to temperature inversion which is a normal
phenomenon in winter season. High concentration of re-suspended dust in the
lower atmosphere might have caused poor visibility especially in January month.
During inversion, vertical air movement in the atmosphere is suppressed and
hence, pollutants in the air are get trapped in the lower atmosphere close to the
ground. Study area is surrounded by hills and free movement of wind is restricted
which can also cause to build up dust particles just above the ground surface and
may lead to poor visibility of the atmosphere. Visibility impairment in this area may
also take place due to conventional brick kilns near Khandeshwar and Pargaon
area as well as domestic waste burning in local villages especially in morning
hours. Burning of bricks in the final stage of manufacturing process, leads to
emission of CO, CO2 and soot particles which can also reduce visibility of the
atmosphere. Dust emission sources are only temporary and could be controlled by
selecting appropriate mitigation measures in the project area which may improve
visibility in this area. Transport of pollutants from urban Mumbai may also expect in
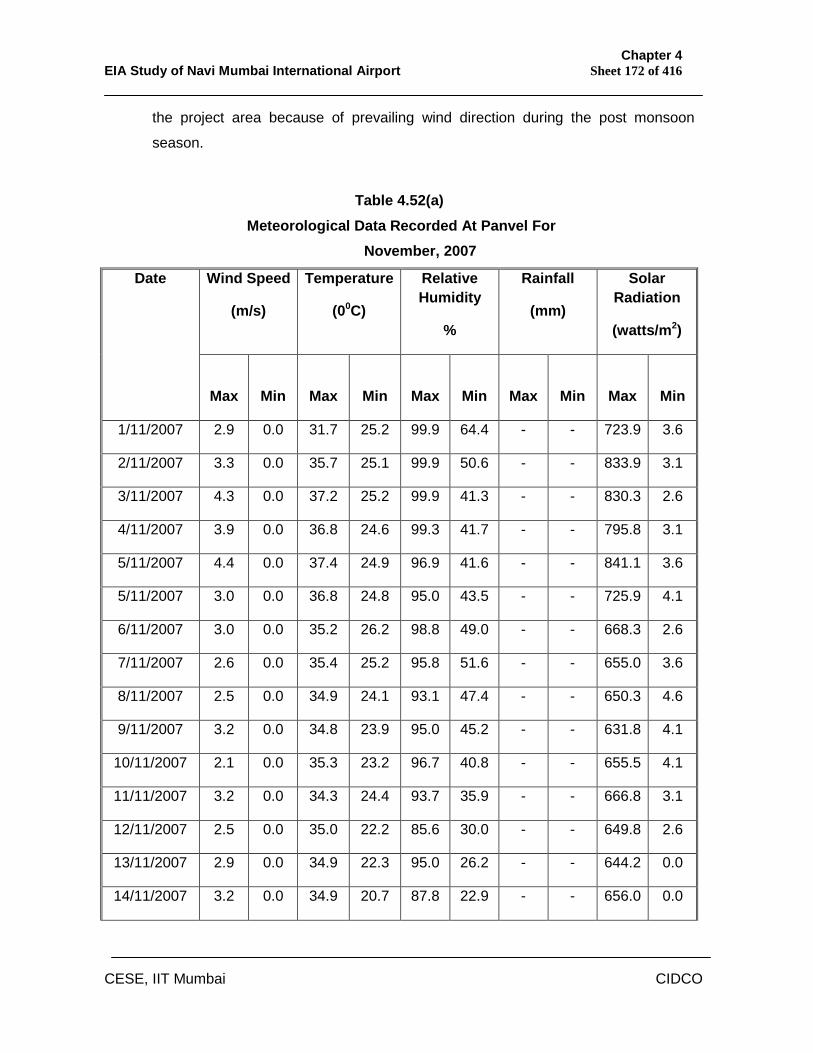
Chapter 4 EIA Study of Navi Mumbai International Airport Sheet 172 of 416
CESE, IIT Mumbai CIDCO
the project area because of prevailing wind direction during the post monsoon
season.
Table 4.52(a) Meteorological Data Recorded At Panvel For
November, 2007
Wind Speed
(m/s)
Temperature
(00C)
Relative Humidity
%
Rainfall
(mm)
Solar Radiation
(watts/m2)
Date
Max
Min
Max
Min
Max
Min
Max
Min
Max
Min
1/11/2007 2.9 0.0 31.7 25.2 99.9 64.4 - - 723.9 3.6
2/11/2007 3.3 0.0 35.7 25.1 99.9 50.6 - - 833.9 3.1
3/11/2007 4.3 0.0 37.2 25.2 99.9 41.3 - - 830.3 2.6
4/11/2007 3.9 0.0 36.8 24.6 99.3 41.7 - - 795.8 3.1
5/11/2007 4.4 0.0 37.4 24.9 96.9 41.6 - - 841.1 3.6
5/11/2007 3.0 0.0 36.8 24.8 95.0 43.5 - - 725.9 4.1
6/11/2007 3.0 0.0 35.2 26.2 98.8 49.0 - - 668.3 2.6
7/11/2007 2.6 0.0 35.4 25.2 95.8 51.6 - - 655.0 3.6
8/11/2007 2.5 0.0 34.9 24.1 93.1 47.4 - - 650.3 4.6
9/11/2007 3.2 0.0 34.8 23.9 95.0 45.2 - - 631.8 4.1
10/11/2007 2.1 0.0 35.3 23.2 96.7 40.8 - - 655.5 4.1
11/11/2007 3.2 0.0 34.3 24.4 93.7 35.9 - - 666.8 3.1
12/11/2007 2.5 0.0 35.0 22.2 85.6 30.0 - - 649.8 2.6
13/11/2007 2.9 0.0 34.9 22.3 95.0 26.2 - - 644.2 0.0
14/11/2007 3.2 0.0 34.9 20.7 87.8 22.9 - - 656.0 0.0
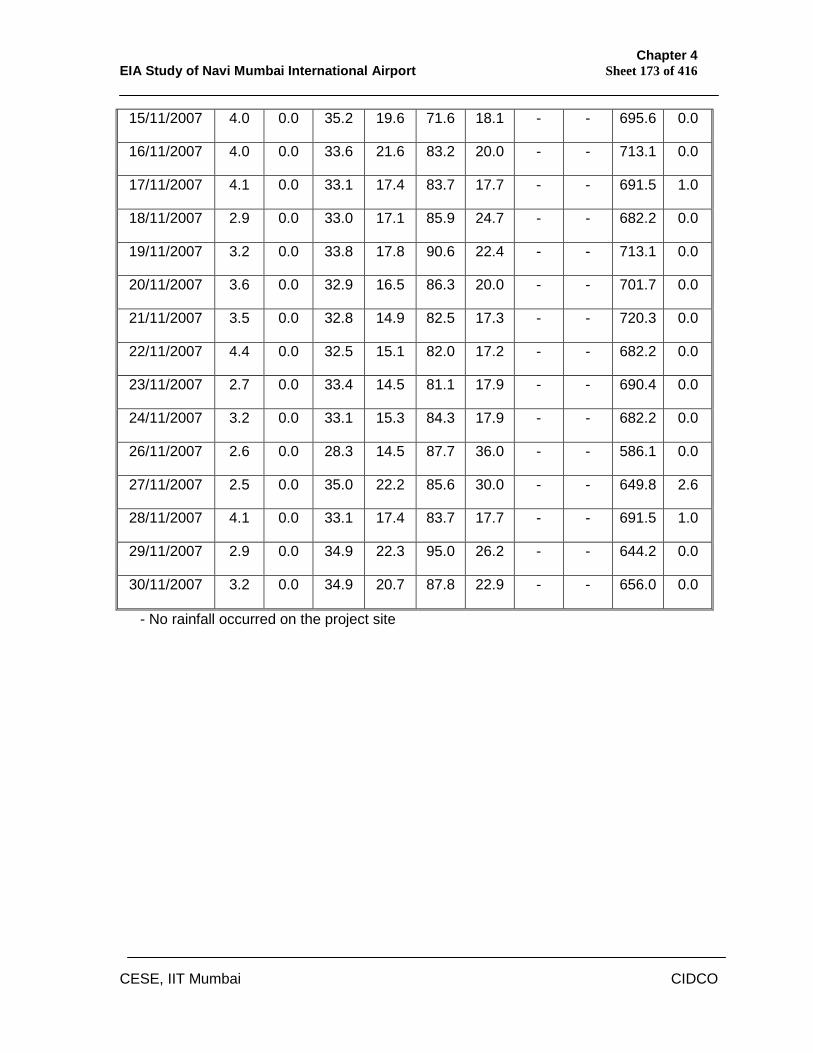
Chapter 4 EIA Study of Navi Mumbai International Airport Sheet 173 of 416
CESE, IIT Mumbai CIDCO
15/11/2007 4.0 0.0 35.2 19.6 71.6 18.1 - - 695.6 0.0
16/11/2007 4.0 0.0 33.6 21.6 83.2 20.0 - - 713.1 0.0
17/11/2007 4.1 0.0 33.1 17.4 83.7 17.7 - - 691.5 1.0
18/11/2007 2.9 0.0 33.0 17.1 85.9 24.7 - - 682.2 0.0
19/11/2007 3.2 0.0 33.8 17.8 90.6 22.4 - - 713.1 0.0
20/11/2007 3.6 0.0 32.9 16.5 86.3 20.0 - - 701.7 0.0
21/11/2007 3.5 0.0 32.8 14.9 82.5 17.3 - - 720.3 0.0
22/11/2007 4.4 0.0 32.5 15.1 82.0 17.2 - - 682.2 0.0
23/11/2007 2.7 0.0 33.4 14.5 81.1 17.9 - - 690.4 0.0
24/11/2007 3.2 0.0 33.1 15.3 84.3 17.9 - - 682.2 0.0
26/11/2007 2.6 0.0 28.3 14.5 87.7 36.0 - - 586.1 0.0
27/11/2007 2.5 0.0 35.0 22.2 85.6 30.0 - - 649.8 2.6
28/11/2007 4.1 0.0 33.1 17.4 83.7 17.7 - - 691.5 1.0
29/11/2007 2.9 0.0 34.9 22.3 95.0 26.2 - - 644.2 0.0
30/11/2007 3.2 0.0 34.9 20.7 87.8 22.9 - - 656.0 0.0
- No rainfall occurred on the project site
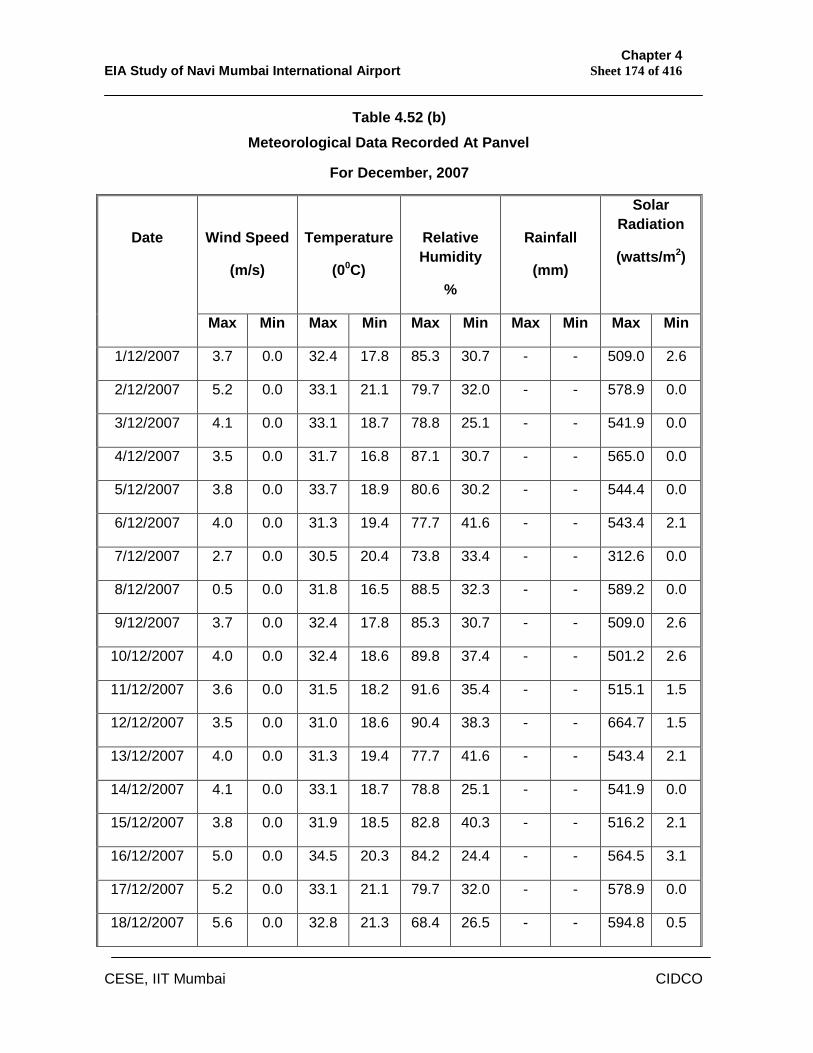
Chapter 4 EIA Study of Navi Mumbai International Airport Sheet 174 of 416
CESE, IIT Mumbai CIDCO
Table 4.52 (b) Meteorological Data Recorded At Panvel
For December, 2007
Wind Speed
(m/s)
Temperature
(00C)
Relative Humidity
%
Rainfall
(mm)
Solar Radiation
(watts/m2)
Date
Max Min Max Min Max Min Max Min Max Min
1/12/2007 3.7 0.0 32.4 17.8 85.3 30.7 - - 509.0 2.6
2/12/2007 5.2 0.0 33.1 21.1 79.7 32.0 - - 578.9 0.0
3/12/2007 4.1 0.0 33.1 18.7 78.8 25.1 - - 541.9 0.0
4/12/2007 3.5 0.0 31.7 16.8 87.1 30.7 - - 565.0 0.0
5/12/2007 3.8 0.0 33.7 18.9 80.6 30.2 - - 544.4 0.0
6/12/2007 4.0 0.0 31.3 19.4 77.7 41.6 - - 543.4 2.1
7/12/2007 2.7 0.0 30.5 20.4 73.8 33.4 - - 312.6 0.0
8/12/2007 0.5 0.0 31.8 16.5 88.5 32.3 - - 589.2 0.0
9/12/2007 3.7 0.0 32.4 17.8 85.3 30.7 - - 509.0 2.6
10/12/2007 4.0 0.0 32.4 18.6 89.8 37.4 - - 501.2 2.6
11/12/2007 3.6 0.0 31.5 18.2 91.6 35.4 - - 515.1 1.5
12/12/2007 3.5 0.0 31.0 18.6 90.4 38.3 - - 664.7 1.5
13/12/2007 4.0 0.0 31.3 19.4 77.7 41.6 - - 543.4 2.1
14/12/2007 4.1 0.0 33.1 18.7 78.8 25.1 - - 541.9 0.0
15/12/2007 3.8 0.0 31.9 18.5 82.8 40.3 - - 516.2 2.1
16/12/2007 5.0 0.0 34.5 20.3 84.2 24.4 - - 564.5 3.1
17/12/2007 5.2 0.0 33.1 21.1 79.7 32.0 - - 578.9 0.0
18/12/2007 5.6 0.0 32.8 21.3 68.4 26.5 - - 594.8 0.5
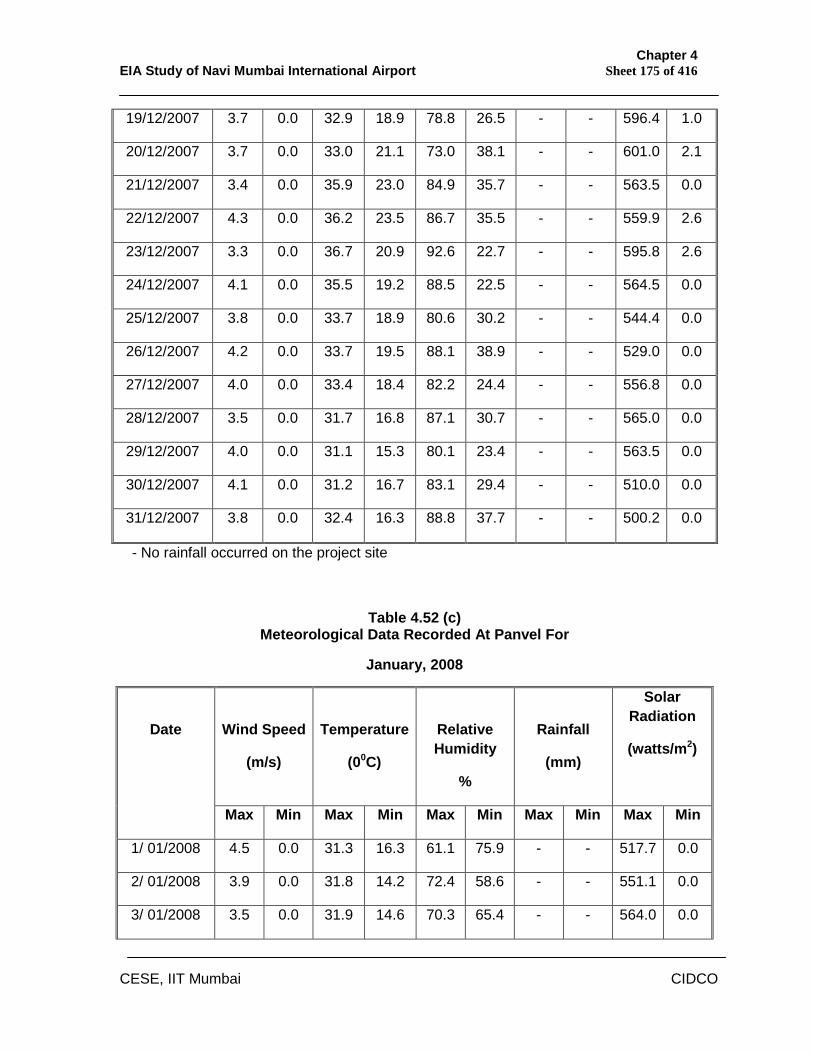
Chapter 4 EIA Study of Navi Mumbai International Airport Sheet 175 of 416
CESE, IIT Mumbai CIDCO
19/12/2007 3.7 0.0 32.9 18.9 78.8 26.5 - - 596.4 1.0
20/12/2007 3.7 0.0 33.0 21.1 73.0 38.1 - - 601.0 2.1
21/12/2007 3.4 0.0 35.9 23.0 84.9 35.7 - - 563.5 0.0
22/12/2007 4.3 0.0 36.2 23.5 86.7 35.5 - - 559.9 2.6
23/12/2007 3.3 0.0 36.7 20.9 92.6 22.7 - - 595.8 2.6
24/12/2007 4.1 0.0 35.5 19.2 88.5 22.5 - - 564.5 0.0
25/12/2007 3.8 0.0 33.7 18.9 80.6 30.2 - - 544.4 0.0
26/12/2007 4.2 0.0 33.7 19.5 88.1 38.9 - - 529.0 0.0
27/12/2007 4.0 0.0 33.4 18.4 82.2 24.4 - - 556.8 0.0
28/12/2007 3.5 0.0 31.7 16.8 87.1 30.7 - - 565.0 0.0
29/12/2007 4.0 0.0 31.1 15.3 80.1 23.4 - - 563.5 0.0
30/12/2007 4.1 0.0 31.2 16.7 83.1 29.4 - - 510.0 0.0
31/12/2007 3.8 0.0 32.4 16.3 88.8 37.7 - - 500.2 0.0
- No rainfall occurred on the project site
Table 4.52 (c) Meteorological Data Recorded At Panvel For
January, 2008
Wind Speed
(m/s)
Temperature
(00C)
Relative Humidity
%
Rainfall
(mm)
Solar Radiation
(watts/m2)
Date
Max Min Max Min Max Min Max Min Max Min
1/ 01/2008 4.5 0.0 31.3 16.3 61.1 75.9 - - 517.7 0.0
2/ 01/2008 3.9 0.0 31.8 14.2 72.4 58.6 - - 551.1 0.0
3/ 01/2008 3.5 0.0 31.9 14.6 70.3 65.4 - - 564.0 0.0
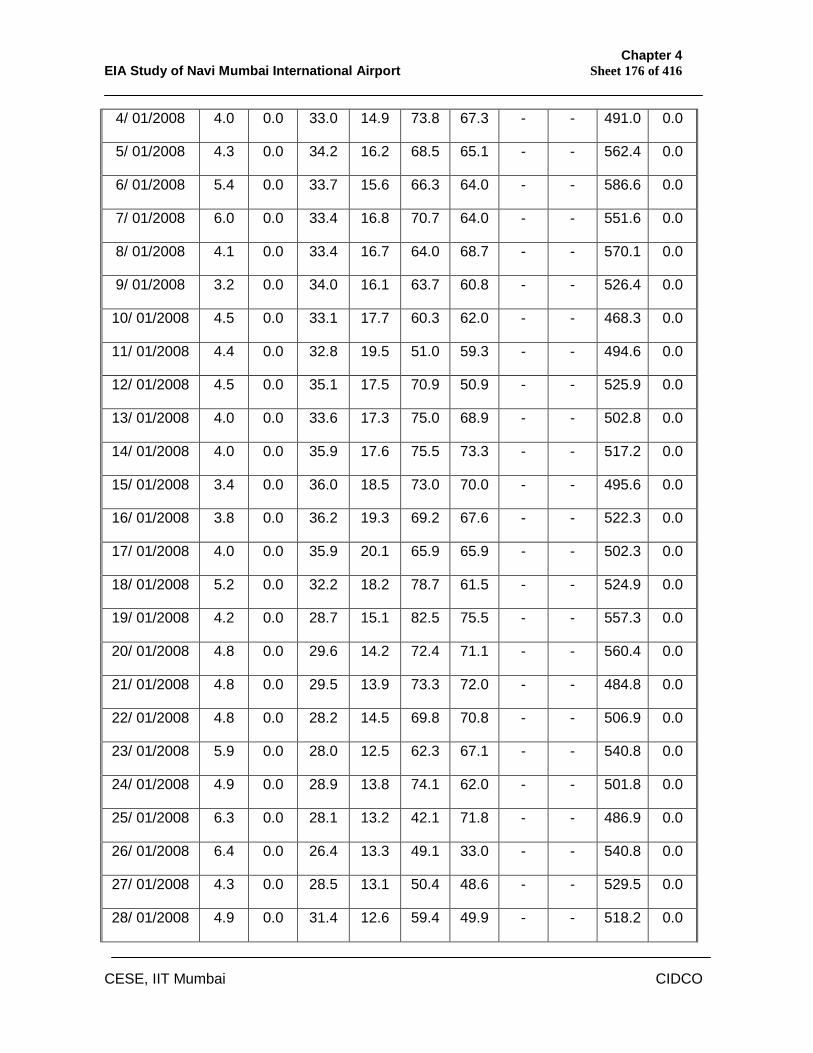
Chapter 4 EIA Study of Navi Mumbai International Airport Sheet 176 of 416
CESE, IIT Mumbai CIDCO
4/ 01/2008 4.0 0.0 33.0 14.9 73.8 67.3 - - 491.0 0.0
5/ 01/2008 4.3 0.0 34.2 16.2 68.5 65.1 - - 562.4 0.0
6/ 01/2008 5.4 0.0 33.7 15.6 66.3 64.0 - - 586.6 0.0
7/ 01/2008 6.0 0.0 33.4 16.8 70.7 64.0 - - 551.6 0.0
8/ 01/2008 4.1 0.0 33.4 16.7 64.0 68.7 - - 570.1 0.0
9/ 01/2008 3.2 0.0 34.0 16.1 63.7 60.8 - - 526.4 0.0
10/ 01/2008 4.5 0.0 33.1 17.7 60.3 62.0 - - 468.3 0.0
11/ 01/2008 4.4 0.0 32.8 19.5 51.0 59.3 - - 494.6 0.0
12/ 01/2008 4.5 0.0 35.1 17.5 70.9 50.9 - - 525.9 0.0
13/ 01/2008 4.0 0.0 33.6 17.3 75.0 68.9 - - 502.8 0.0
14/ 01/2008 4.0 0.0 35.9 17.6 75.5 73.3 - - 517.2 0.0
15/ 01/2008 3.4 0.0 36.0 18.5 73.0 70.0 - - 495.6 0.0
16/ 01/2008 3.8 0.0 36.2 19.3 69.2 67.6 - - 522.3 0.0
17/ 01/2008 4.0 0.0 35.9 20.1 65.9 65.9 - - 502.3 0.0
18/ 01/2008 5.2 0.0 32.2 18.2 78.7 61.5 - - 524.9 0.0
19/ 01/2008 4.2 0.0 28.7 15.1 82.5 75.5 - - 557.3 0.0
20/ 01/2008 4.8 0.0 29.6 14.2 72.4 71.1 - - 560.4 0.0
21/ 01/2008 4.8 0.0 29.5 13.9 73.3 72.0 - - 484.8 0.0
22/ 01/2008 4.8 0.0 28.2 14.5 69.8 70.8 - - 506.9 0.0
23/ 01/2008 5.9 0.0 28.0 12.5 62.3 67.1 - - 540.8 0.0
24/ 01/2008 4.9 0.0 28.9 13.8 74.1 62.0 - - 501.8 0.0
25/ 01/2008 6.3 0.0 28.1 13.2 42.1 71.8 - - 486.9 0.0
26/ 01/2008 6.4 0.0 26.4 13.3 49.1 33.0 - - 540.8 0.0
27/ 01/2008 4.3 0.0 28.5 13.1 50.4 48.6 - - 529.5 0.0
28/ 01/2008 4.9 0.0 31.4 12.6 59.4 49.9 - - 518.2 0.0
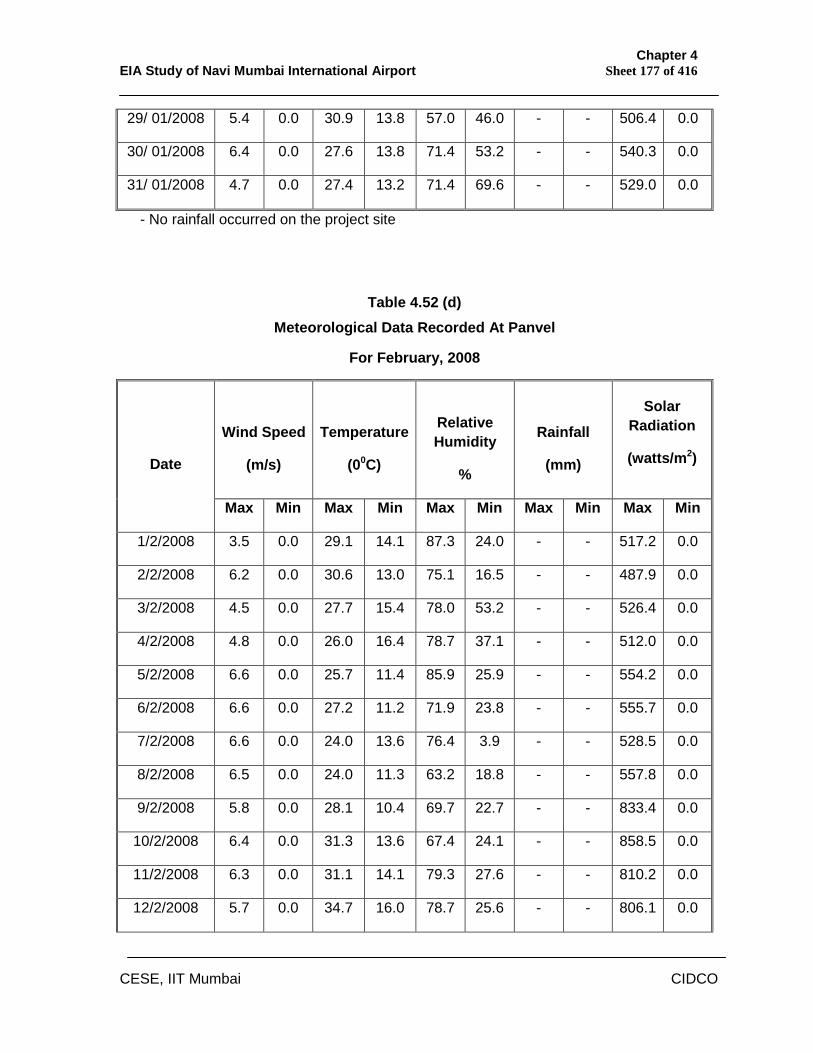
Chapter 4 EIA Study of Navi Mumbai International Airport Sheet 177 of 416
CESE, IIT Mumbai CIDCO
29/ 01/2008 5.4 0.0 30.9 13.8 57.0 46.0 - - 506.4 0.0
30/ 01/2008 6.4 0.0 27.6 13.8 71.4 53.2 - - 540.3 0.0
31/ 01/2008 4.7 0.0 27.4 13.2 71.4 69.6 - - 529.0 0.0
- No rainfall occurred on the project site
Table 4.52 (d) Meteorological Data Recorded At Panvel
For February, 2008
Wind Speed
(m/s)
Temperature
(00C)
Relative Humidity
%
Rainfall
(mm)
Solar Radiation
(watts/m2)
Date
Max Min Max Min Max Min Max Min Max Min
1/2/2008 3.5 0.0 29.1 14.1 87.3 24.0 - - 517.2 0.0
2/2/2008 6.2 0.0 30.6 13.0 75.1 16.5 - - 487.9 0.0
3/2/2008 4.5 0.0 27.7 15.4 78.0 53.2 - - 526.4 0.0
4/2/2008 4.8 0.0 26.0 16.4 78.7 37.1 - - 512.0 0.0
5/2/2008 6.6 0.0 25.7 11.4 85.9 25.9 - - 554.2 0.0
6/2/2008 6.6 0.0 27.2 11.2 71.9 23.8 - - 555.7 0.0
7/2/2008 6.6 0.0 24.0 13.6 76.4 3.9 - - 528.5 0.0
8/2/2008 6.5 0.0 24.0 11.3 63.2 18.8 - - 557.8 0.0
9/2/2008 5.8 0.0 28.1 10.4 69.7 22.7 - - 833.4 0.0
10/2/2008 6.4 0.0 31.3 13.6 67.4 24.1 - - 858.5 0.0
11/2/2008 6.3 0.0 31.1 14.1 79.3 27.6 - - 810.2 0.0
12/2/2008 5.7 0.0 34.7 16.0 78.7 25.6 - - 806.1 0.0
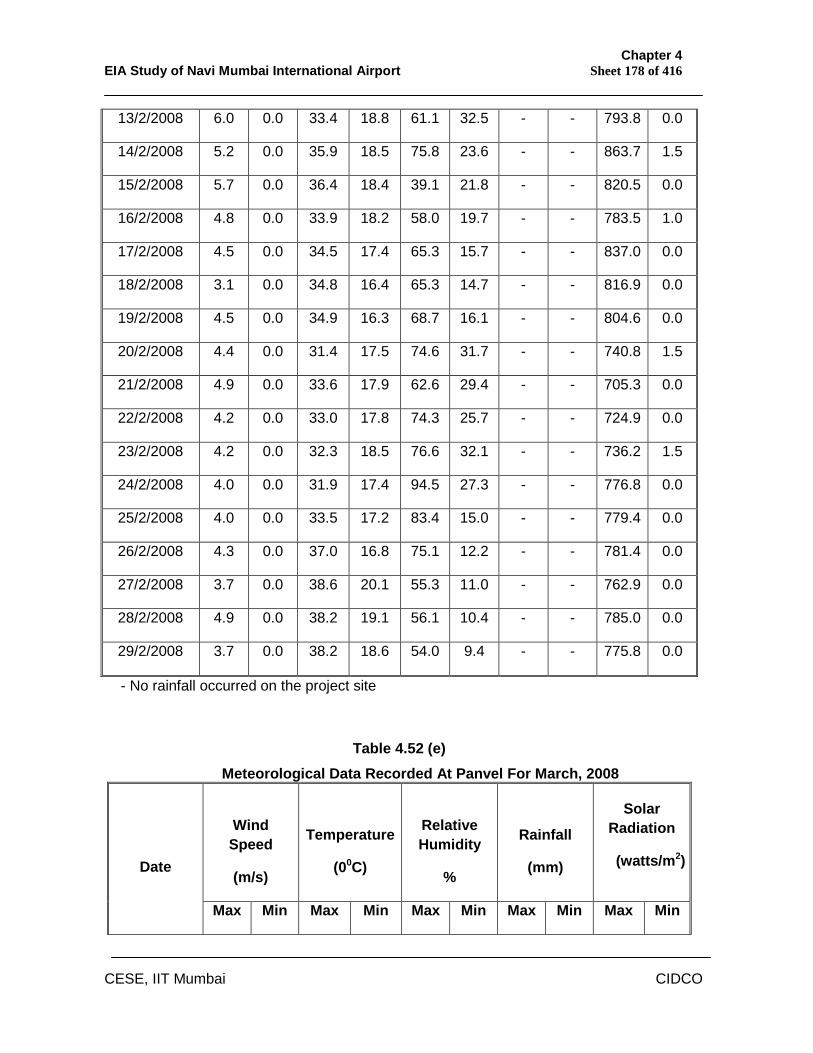
Chapter 4 EIA Study of Navi Mumbai International Airport Sheet 178 of 416
CESE, IIT Mumbai CIDCO
13/2/2008 6.0 0.0 33.4 18.8 61.1 32.5 - - 793.8 0.0
14/2/2008 5.2 0.0 35.9 18.5 75.8 23.6 - - 863.7 1.5
15/2/2008 5.7 0.0 36.4 18.4 39.1 21.8 - - 820.5 0.0
16/2/2008 4.8 0.0 33.9 18.2 58.0 19.7 - - 783.5 1.0
17/2/2008 4.5 0.0 34.5 17.4 65.3 15.7 - - 837.0 0.0
18/2/2008 3.1 0.0 34.8 16.4 65.3 14.7 - - 816.9 0.0
19/2/2008 4.5 0.0 34.9 16.3 68.7 16.1 - - 804.6 0.0
20/2/2008 4.4 0.0 31.4 17.5 74.6 31.7 - - 740.8 1.5
21/2/2008 4.9 0.0 33.6 17.9 62.6 29.4 - - 705.3 0.0
22/2/2008 4.2 0.0 33.0 17.8 74.3 25.7 - - 724.9 0.0
23/2/2008 4.2 0.0 32.3 18.5 76.6 32.1 - - 736.2 1.5
24/2/2008 4.0 0.0 31.9 17.4 94.5 27.3 - - 776.8 0.0
25/2/2008 4.0 0.0 33.5 17.2 83.4 15.0 - - 779.4 0.0
26/2/2008 4.3 0.0 37.0 16.8 75.1 12.2 - - 781.4 0.0
27/2/2008 3.7 0.0 38.6 20.1 55.3 11.0 - - 762.9 0.0
28/2/2008 4.9 0.0 38.2 19.1 56.1 10.4 - - 785.0 0.0
29/2/2008 3.7 0.0 38.2 18.6 54.0 9.4 - - 775.8 0.0
- No rainfall occurred on the project site
Table 4.52 (e) Meteorological Data Recorded At Panvel For March, 2008
Wind Speed
(m/s)
Temperature
(00C)
Relative Humidity
%
Rainfall
(mm)
Solar Radiation
(watts/m2)
Date
Max Min Max Min Max Min Max Min Max Min
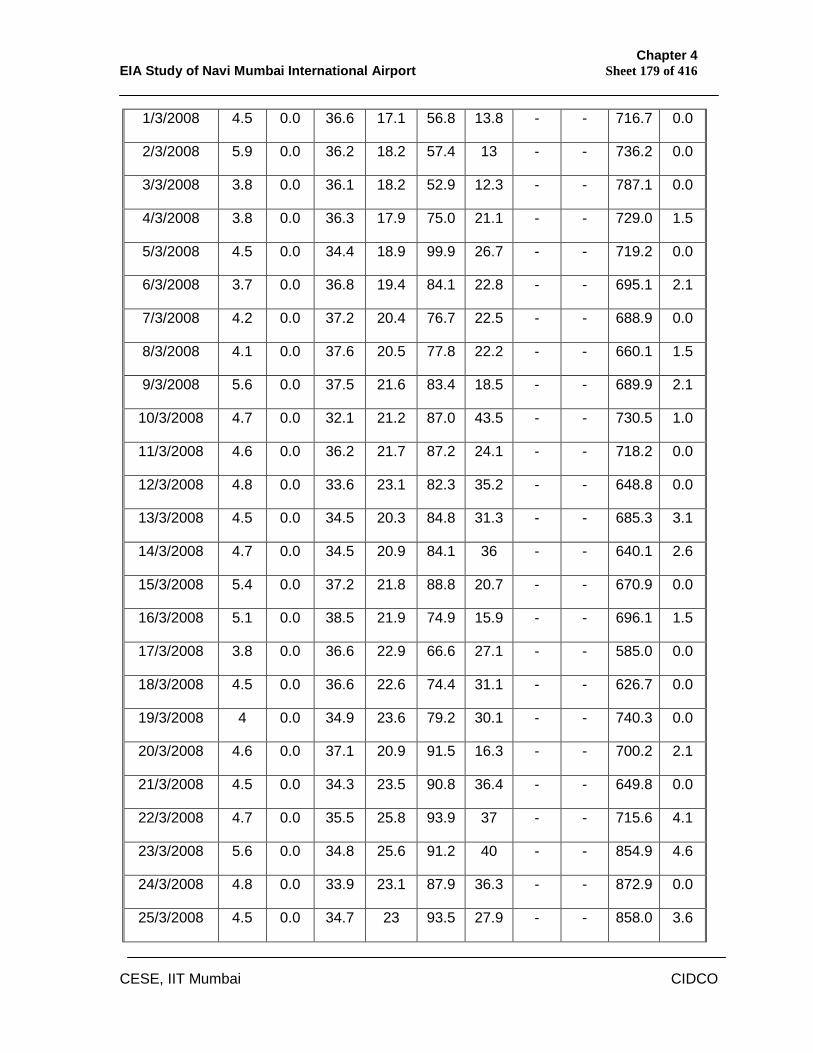
Chapter 4 EIA Study of Navi Mumbai International Airport Sheet 179 of 416
CESE, IIT Mumbai CIDCO
1/3/2008 4.5 0.0 36.6 17.1 56.8 13.8 - - 716.7 0.0
2/3/2008 5.9 0.0 36.2 18.2 57.4 13 - - 736.2 0.0
3/3/2008 3.8 0.0 36.1 18.2 52.9 12.3 - - 787.1 0.0
4/3/2008 3.8 0.0 36.3 17.9 75.0 21.1 - - 729.0 1.5
5/3/2008 4.5 0.0 34.4 18.9 99.9 26.7 - - 719.2 0.0
6/3/2008 3.7 0.0 36.8 19.4 84.1 22.8 - - 695.1 2.1
7/3/2008 4.2 0.0 37.2 20.4 76.7 22.5 - - 688.9 0.0
8/3/2008 4.1 0.0 37.6 20.5 77.8 22.2 - - 660.1 1.5
9/3/2008 5.6 0.0 37.5 21.6 83.4 18.5 - - 689.9 2.1
10/3/2008 4.7 0.0 32.1 21.2 87.0 43.5 - - 730.5 1.0
11/3/2008 4.6 0.0 36.2 21.7 87.2 24.1 - - 718.2 0.0
12/3/2008 4.8 0.0 33.6 23.1 82.3 35.2 - - 648.8 0.0
13/3/2008 4.5 0.0 34.5 20.3 84.8 31.3 - - 685.3 3.1
14/3/2008 4.7 0.0 34.5 20.9 84.1 36 - - 640.1 2.6
15/3/2008 5.4 0.0 37.2 21.8 88.8 20.7 - - 670.9 0.0
16/3/2008 5.1 0.0 38.5 21.9 74.9 15.9 - - 696.1 1.5
17/3/2008 3.8 0.0 36.6 22.9 66.6 27.1 - - 585.0 0.0
18/3/2008 4.5 0.0 36.6 22.6 74.4 31.1 - - 626.7 0.0
19/3/2008 4 0.0 34.9 23.6 79.2 30.1 - - 740.3 0.0
20/3/2008 4.6 0.0 37.1 20.9 91.5 16.3 - - 700.2 2.1
21/3/2008 4.5 0.0 34.3 23.5 90.8 36.4 - - 649.8 0.0
22/3/2008 4.7 0.0 35.5 25.8 93.9 37 - - 715.6 4.1
23/3/2008 5.6 0.0 34.8 25.6 91.2 40 - - 854.9 4.6
24/3/2008 4.8 0.0 33.9 23.1 87.9 36.3 - - 872.9 0.0
25/3/2008 4.5 0.0 34.7 23 93.5 27.9 - - 858.0 3.6
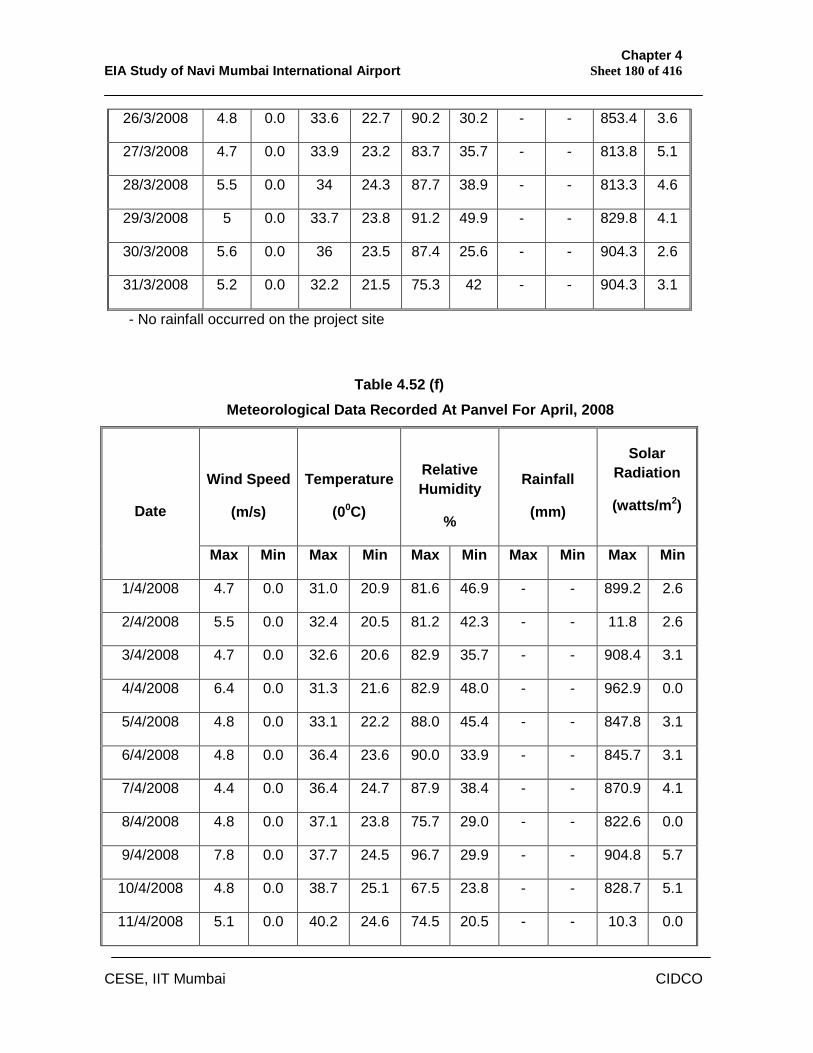
Chapter 4 EIA Study of Navi Mumbai International Airport Sheet 180 of 416
CESE, IIT Mumbai CIDCO
26/3/2008 4.8 0.0 33.6 22.7 90.2 30.2 - - 853.4 3.6
27/3/2008 4.7 0.0 33.9 23.2 83.7 35.7 - - 813.8 5.1
28/3/2008 5.5 0.0 34 24.3 87.7 38.9 - - 813.3 4.6
29/3/2008 5 0.0 33.7 23.8 91.2 49.9 - - 829.8 4.1
30/3/2008 5.6 0.0 36 23.5 87.4 25.6 - - 904.3 2.6
31/3/2008 5.2 0.0 32.2 21.5 75.3 42 - - 904.3 3.1
- No rainfall occurred on the project site
Table 4.52 (f) Meteorological Data Recorded At Panvel For April, 2008
Wind Speed
(m/s)
Temperature
(00C)
Relative Humidity
%
Rainfall
(mm)
Solar Radiation
(watts/m2)
Date
Max Min Max Min Max Min Max Min Max Min
1/4/2008 4.7 0.0 31.0 20.9 81.6 46.9 - - 899.2 2.6
2/4/2008 5.5 0.0 32.4 20.5 81.2 42.3 - - 11.8 2.6
3/4/2008 4.7 0.0 32.6 20.6 82.9 35.7 - - 908.4 3.1
4/4/2008 6.4 0.0 31.3 21.6 82.9 48.0 - - 962.9 0.0
5/4/2008 4.8 0.0 33.1 22.2 88.0 45.4 - - 847.8 3.1
6/4/2008 4.8 0.0 36.4 23.6 90.0 33.9 - - 845.7 3.1
7/4/2008 4.4 0.0 36.4 24.7 87.9 38.4 - - 870.9 4.1
8/4/2008 4.8 0.0 37.1 23.8 75.7 29.0 - - 822.6 0.0
9/4/2008 7.8 0.0 37.7 24.5 96.7 29.9 - - 904.8 5.7
10/4/2008 4.8 0.0 38.7 25.1 67.5 23.8 - - 828.7 5.1
11/4/2008 5.1 0.0 40.2 24.6 74.5 20.5 - - 10.3 0.0
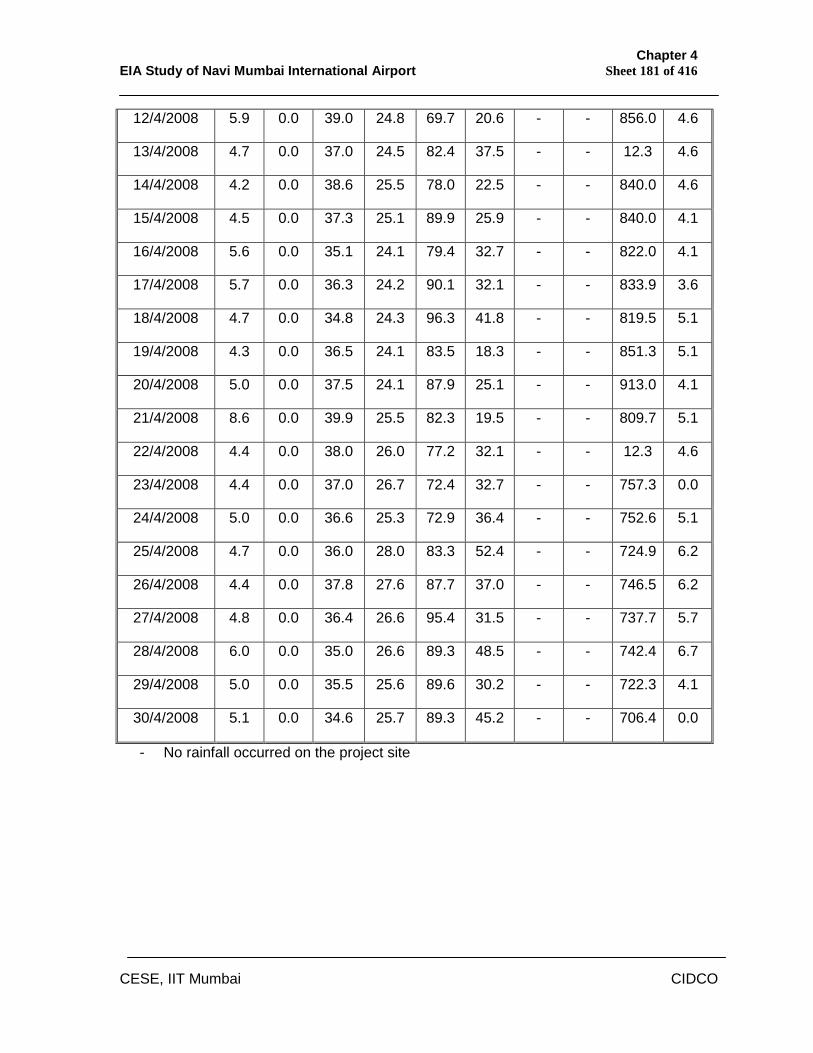
Chapter 4 EIA Study of Navi Mumbai International Airport Sheet 181 of 416
CESE, IIT Mumbai CIDCO
12/4/2008 5.9 0.0 39.0 24.8 69.7 20.6 - - 856.0 4.6
13/4/2008 4.7 0.0 37.0 24.5 82.4 37.5 - - 12.3 4.6
14/4/2008 4.2 0.0 38.6 25.5 78.0 22.5 - - 840.0 4.6
15/4/2008 4.5 0.0 37.3 25.1 89.9 25.9 - - 840.0 4.1
16/4/2008 5.6 0.0 35.1 24.1 79.4 32.7 - - 822.0 4.1
17/4/2008 5.7 0.0 36.3 24.2 90.1 32.1 - - 833.9 3.6
18/4/2008 4.7 0.0 34.8 24.3 96.3 41.8 - - 819.5 5.1
19/4/2008 4.3 0.0 36.5 24.1 83.5 18.3 - - 851.3 5.1
20/4/2008 5.0 0.0 37.5 24.1 87.9 25.1 - - 913.0 4.1
21/4/2008 8.6 0.0 39.9 25.5 82.3 19.5 - - 809.7 5.1
22/4/2008 4.4 0.0 38.0 26.0 77.2 32.1 - - 12.3 4.6
23/4/2008 4.4 0.0 37.0 26.7 72.4 32.7 - - 757.3 0.0
24/4/2008 5.0 0.0 36.6 25.3 72.9 36.4 - - 752.6 5.1
25/4/2008 4.7 0.0 36.0 28.0 83.3 52.4 - - 724.9 6.2
26/4/2008 4.4 0.0 37.8 27.6 87.7 37.0 - - 746.5 6.2
27/4/2008 4.8 0.0 36.4 26.6 95.4 31.5 - - 737.7 5.7
28/4/2008 6.0 0.0 35.0 26.6 89.3 48.5 - - 742.4 6.7
29/4/2008 5.0 0.0 35.5 25.6 89.6 30.2 - - 722.3 4.1
30/4/2008 5.1 0.0 34.6 25.7 89.3 45.2 - - 706.4 0.0
- No rainfall occurred on the project site
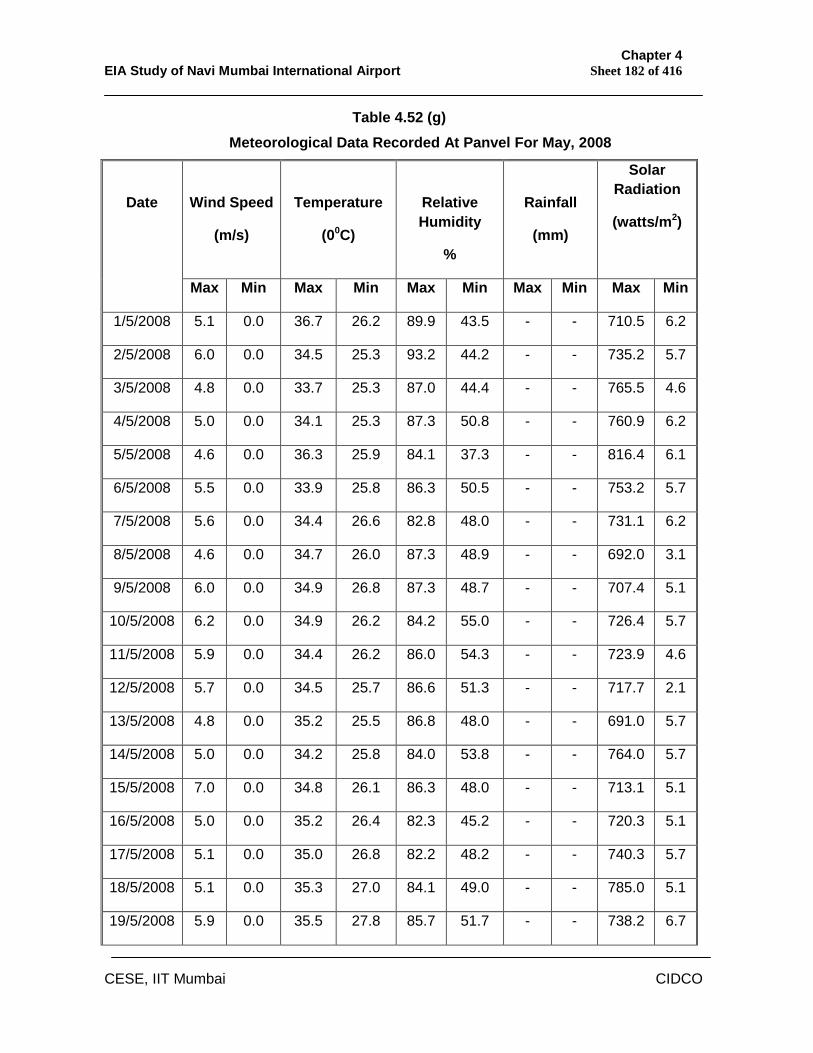
Chapter 4 EIA Study of Navi Mumbai International Airport Sheet 182 of 416
CESE, IIT Mumbai CIDCO
Table 4.52 (g) Meteorological Data Recorded At Panvel For May, 2008
Wind Speed
(m/s)
Temperature
(00C)
Relative Humidity
%
Rainfall
(mm)
Solar Radiation
(watts/m2)
Date
Max Min Max Min Max Min Max Min Max Min
1/5/2008 5.1 0.0 36.7 26.2 89.9 43.5 - - 710.5 6.2
2/5/2008 6.0 0.0 34.5 25.3 93.2 44.2 - - 735.2 5.7
3/5/2008 4.8 0.0 33.7 25.3 87.0 44.4 - - 765.5 4.6
4/5/2008 5.0 0.0 34.1 25.3 87.3 50.8 - - 760.9 6.2
5/5/2008 4.6 0.0 36.3 25.9 84.1 37.3 - - 816.4 6.1
6/5/2008 5.5 0.0 33.9 25.8 86.3 50.5 - - 753.2 5.7
7/5/2008 5.6 0.0 34.4 26.6 82.8 48.0 - - 731.1 6.2
8/5/2008 4.6 0.0 34.7 26.0 87.3 48.9 - - 692.0 3.1
9/5/2008 6.0 0.0 34.9 26.8 87.3 48.7 - - 707.4 5.1
10/5/2008 6.2 0.0 34.9 26.2 84.2 55.0 - - 726.4 5.7
11/5/2008 5.9 0.0 34.4 26.2 86.0 54.3 - - 723.9 4.6
12/5/2008 5.7 0.0 34.5 25.7 86.6 51.3 - - 717.7 2.1
13/5/2008 4.8 0.0 35.2 25.5 86.8 48.0 - - 691.0 5.7
14/5/2008 5.0 0.0 34.2 25.8 84.0 53.8 - - 764.0 5.7
15/5/2008 7.0 0.0 34.8 26.1 86.3 48.0 - - 713.1 5.1
16/5/2008 5.0 0.0 35.2 26.4 82.3 45.2 - - 720.3 5.1
17/5/2008 5.1 0.0 35.0 26.8 82.2 48.2 - - 740.3 5.7
18/5/2008 5.1 0.0 35.3 27.0 84.1 49.0 - - 785.0 5.1
19/5/2008 5.9 0.0 35.5 27.8 85.7 51.7 - - 738.2 6.7
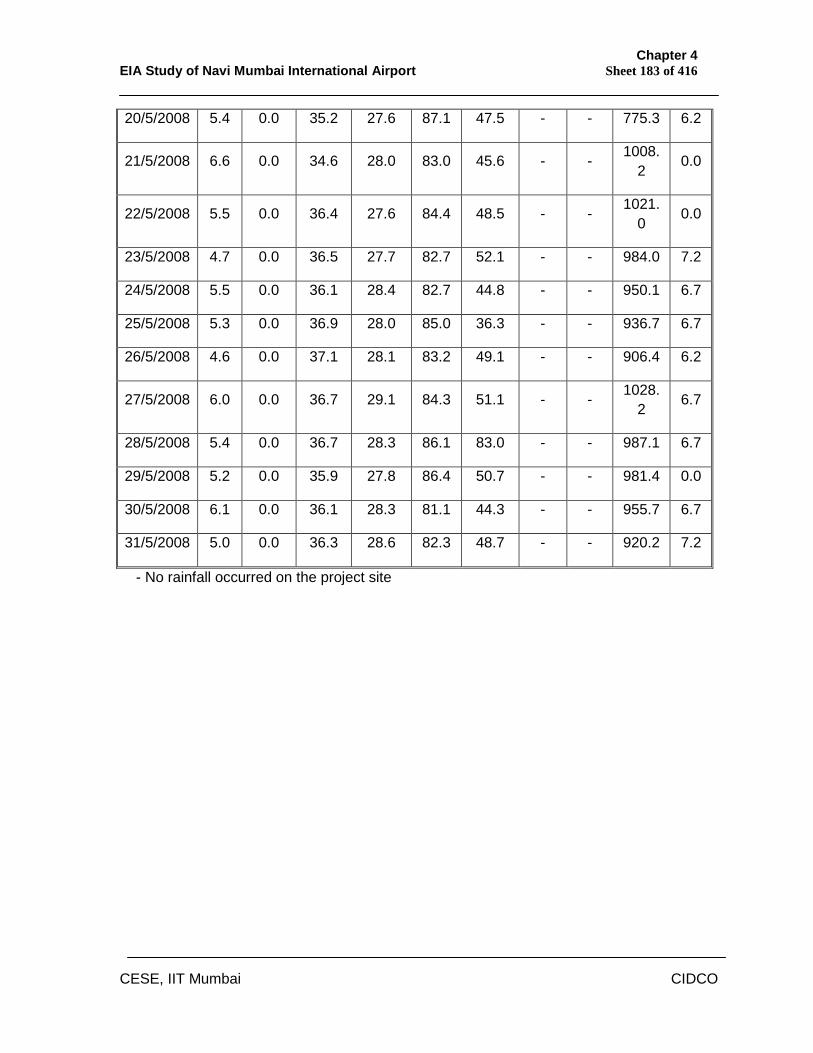
Chapter 4 EIA Study of Navi Mumbai International Airport Sheet 183 of 416
CESE, IIT Mumbai CIDCO
20/5/2008 5.4 0.0 35.2 27.6 87.1 47.5 - - 775.3 6.2
21/5/2008 6.6 0.0 34.6 28.0 83.0 45.6 - - 1008.2
0.0
22/5/2008 5.5 0.0 36.4 27.6 84.4 48.5 - - 1021.0
0.0
23/5/2008 4.7 0.0 36.5 27.7 82.7 52.1 - - 984.0 7.2
24/5/2008 5.5 0.0 36.1 28.4 82.7 44.8 - - 950.1 6.7
25/5/2008 5.3 0.0 36.9 28.0 85.0 36.3 - - 936.7 6.7
26/5/2008 4.6 0.0 37.1 28.1 83.2 49.1 - - 906.4 6.2
27/5/2008 6.0 0.0 36.7 29.1 84.3 51.1 - - 1028.2 6.7
28/5/2008 5.4 0.0 36.7 28.3 86.1 83.0 - - 987.1 6.7
29/5/2008 5.2 0.0 35.9 27.8 86.4 50.7 - - 981.4 0.0
30/5/2008 6.1 0.0 36.1 28.3 81.1 44.3 - - 955.7 6.7
31/5/2008 5.0 0.0 36.3 28.6 82.3 48.7 - - 920.2 7.2
- No rainfall occurred on the project site
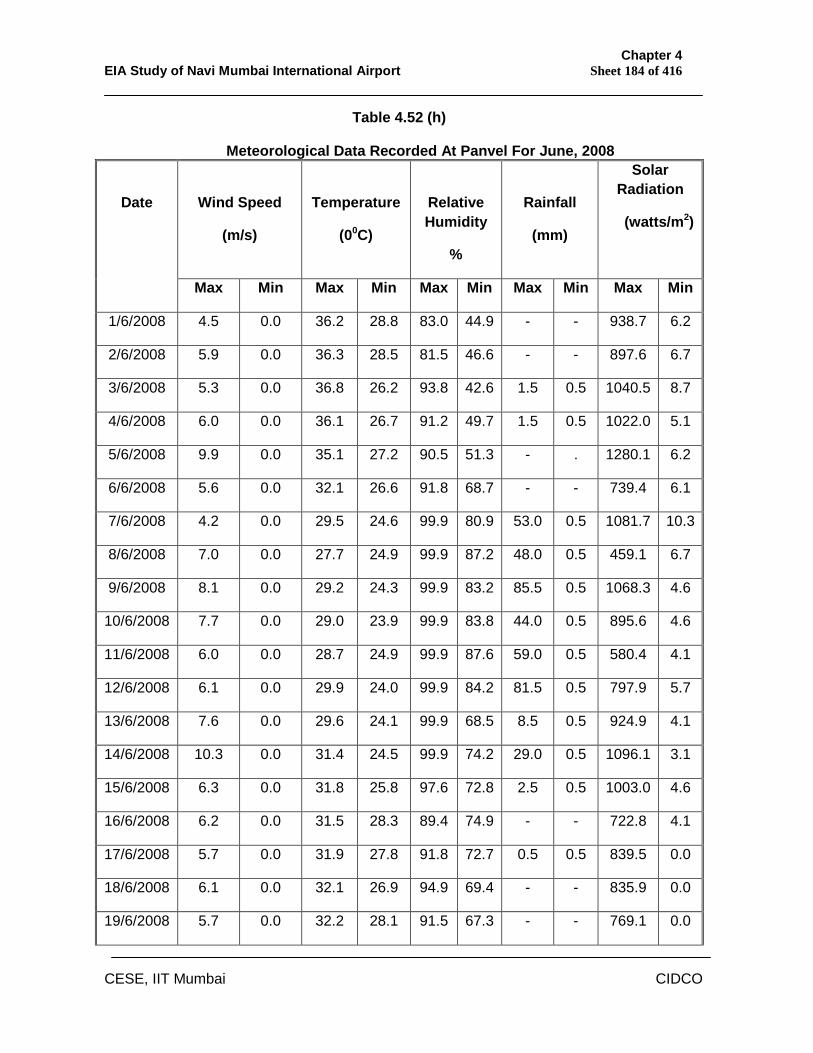
Chapter 4 EIA Study of Navi Mumbai International Airport Sheet 184 of 416
CESE, IIT Mumbai CIDCO
Table 4.52 (h)
Meteorological Data Recorded At Panvel For June, 2008
Wind Speed
(m/s)
Temperature
(00C)
Relative Humidity
%
Rainfall
(mm)
Solar Radiation
(watts/m2)
Date
Max Min Max Min Max Min Max Min Max Min
1/6/2008 4.5 0.0 36.2 28.8 83.0 44.9 - - 938.7 6.2
2/6/2008 5.9 0.0 36.3 28.5 81.5 46.6 - - 897.6 6.7
3/6/2008 5.3 0.0 36.8 26.2 93.8 42.6 1.5 0.5 1040.5 8.7
4/6/2008 6.0 0.0 36.1 26.7 91.2 49.7 1.5 0.5 1022.0 5.1
5/6/2008 9.9 0.0 35.1 27.2 90.5 51.3 - . 1280.1 6.2
6/6/2008 5.6 0.0 32.1 26.6 91.8 68.7 - - 739.4 6.1
7/6/2008 4.2 0.0 29.5 24.6 99.9 80.9 53.0 0.5 1081.7 10.3
8/6/2008 7.0 0.0 27.7 24.9 99.9 87.2 48.0 0.5 459.1 6.7
9/6/2008 8.1 0.0 29.2 24.3 99.9 83.2 85.5 0.5 1068.3 4.6
10/6/2008 7.7 0.0 29.0 23.9 99.9 83.8 44.0 0.5 895.6 4.6
11/6/2008 6.0 0.0 28.7 24.9 99.9 87.6 59.0 0.5 580.4 4.1
12/6/2008 6.1 0.0 29.9 24.0 99.9 84.2 81.5 0.5 797.9 5.7
13/6/2008 7.6 0.0 29.6 24.1 99.9 68.5 8.5 0.5 924.9 4.1
14/6/2008 10.3 0.0 31.4 24.5 99.9 74.2 29.0 0.5 1096.1 3.1
15/6/2008 6.3 0.0 31.8 25.8 97.6 72.8 2.5 0.5 1003.0 4.6
16/6/2008 6.2 0.0 31.5 28.3 89.4 74.9 - - 722.8 4.1
17/6/2008 5.7 0.0 31.9 27.8 91.8 72.7 0.5 0.5 839.5 0.0
18/6/2008 6.1 0.0 32.1 26.9 94.9 69.4 - - 835.9 0.0
19/6/2008 5.7 0.0 32.2 28.1 91.5 67.3 - - 769.1 0.0
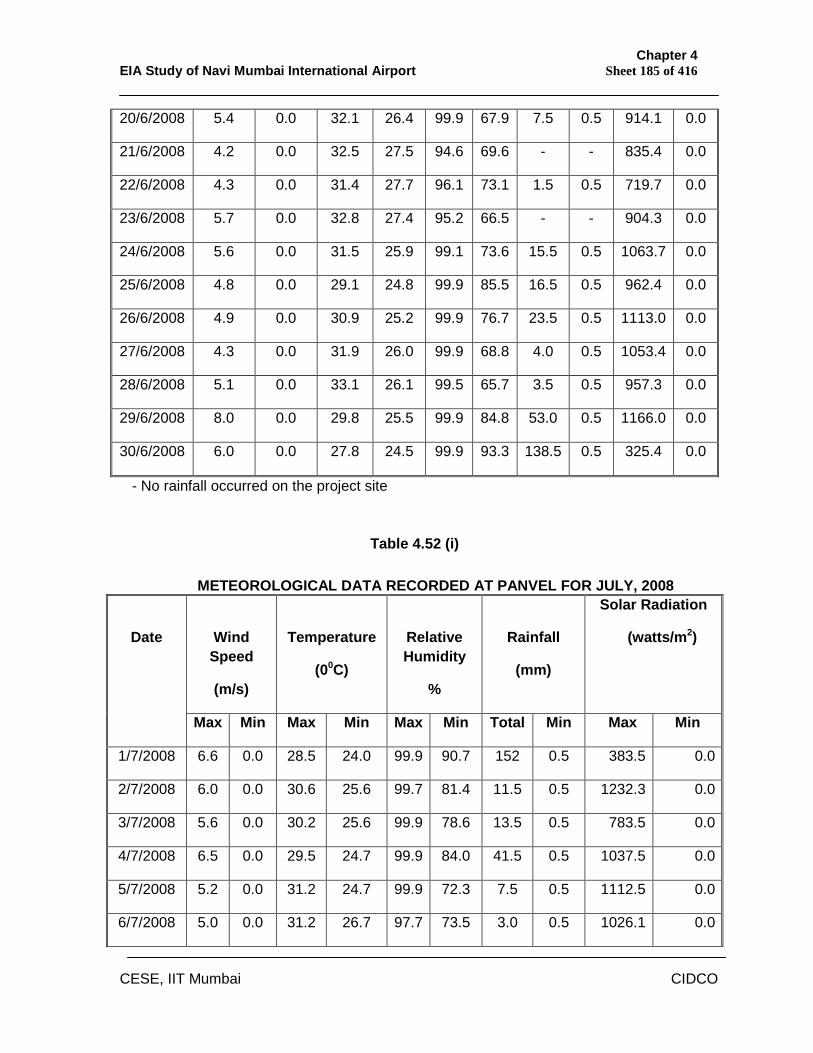
Chapter 4 EIA Study of Navi Mumbai International Airport Sheet 185 of 416
CESE, IIT Mumbai CIDCO
20/6/2008 5.4 0.0 32.1 26.4 99.9 67.9 7.5 0.5 914.1 0.0
21/6/2008 4.2 0.0 32.5 27.5 94.6 69.6 - - 835.4 0.0
22/6/2008 4.3 0.0 31.4 27.7 96.1 73.1 1.5 0.5 719.7 0.0
23/6/2008 5.7 0.0 32.8 27.4 95.2 66.5 - - 904.3 0.0
24/6/2008 5.6 0.0 31.5 25.9 99.1 73.6 15.5 0.5 1063.7 0.0
25/6/2008 4.8 0.0 29.1 24.8 99.9 85.5 16.5 0.5 962.4 0.0
26/6/2008 4.9 0.0 30.9 25.2 99.9 76.7 23.5 0.5 1113.0 0.0
27/6/2008 4.3 0.0 31.9 26.0 99.9 68.8 4.0 0.5 1053.4 0.0
28/6/2008 5.1 0.0 33.1 26.1 99.5 65.7 3.5 0.5 957.3 0.0
29/6/2008 8.0 0.0 29.8 25.5 99.9 84.8 53.0 0.5 1166.0 0.0
30/6/2008 6.0 0.0 27.8 24.5 99.9 93.3 138.5 0.5 325.4 0.0
- No rainfall occurred on the project site
Table 4.52 (i)
METEOROLOGICAL DATA RECORDED AT PANVEL FOR JULY, 2008
Wind Speed
(m/s)
Temperature
(00C)
Relative Humidity
%
Rainfall
(mm)
Solar Radiation
(watts/m2)
Date
Max Min Max Min Max Min Total Min Max Min
1/7/2008 6.6 0.0 28.5 24.0 99.9 90.7 152 0.5 383.5 0.0
2/7/2008 6.0 0.0 30.6 25.6 99.7 81.4 11.5 0.5 1232.3 0.0
3/7/2008 5.6 0.0 30.2 25.6 99.9 78.6 13.5 0.5 783.5 0.0
4/7/2008 6.5 0.0 29.5 24.7 99.9 84.0 41.5 0.5 1037.5 0.0
5/7/2008 5.2 0.0 31.2 24.7 99.9 72.3 7.5 0.5 1112.5 0.0
6/7/2008 5.0 0.0 31.2 26.7 97.7 73.5 3.0 0.5 1026.1 0.0
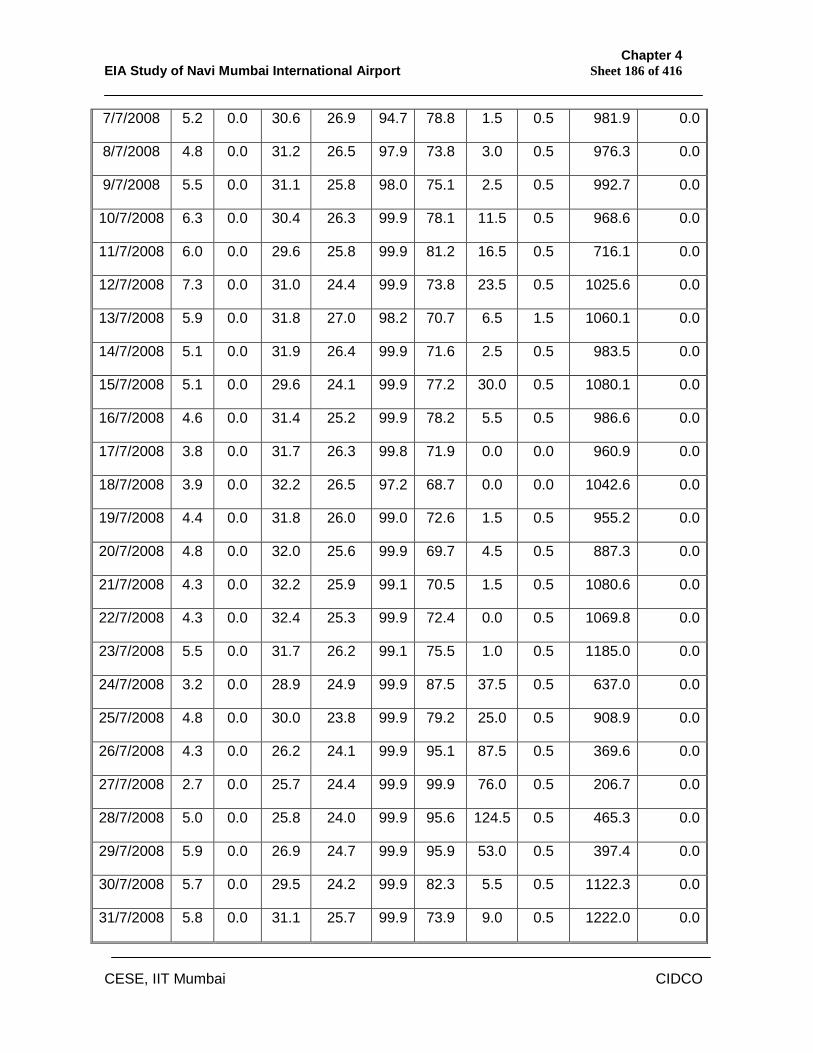
Chapter 4 EIA Study of Navi Mumbai International Airport Sheet 186 of 416
CESE, IIT Mumbai CIDCO
7/7/2008 5.2 0.0 30.6 26.9 94.7 78.8 1.5 0.5 981.9 0.0
8/7/2008 4.8 0.0 31.2 26.5 97.9 73.8 3.0 0.5 976.3 0.0
9/7/2008 5.5 0.0 31.1 25.8 98.0 75.1 2.5 0.5 992.7 0.0
10/7/2008 6.3 0.0 30.4 26.3 99.9 78.1 11.5 0.5 968.6 0.0
11/7/2008 6.0 0.0 29.6 25.8 99.9 81.2 16.5 0.5 716.1 0.0
12/7/2008 7.3 0.0 31.0 24.4 99.9 73.8 23.5 0.5 1025.6 0.0
13/7/2008 5.9 0.0 31.8 27.0 98.2 70.7 6.5 1.5 1060.1 0.0
14/7/2008 5.1 0.0 31.9 26.4 99.9 71.6 2.5 0.5 983.5 0.0
15/7/2008 5.1 0.0 29.6 24.1 99.9 77.2 30.0 0.5 1080.1 0.0
16/7/2008 4.6 0.0 31.4 25.2 99.9 78.2 5.5 0.5 986.6 0.0
17/7/2008 3.8 0.0 31.7 26.3 99.8 71.9 0.0 0.0 960.9 0.0
18/7/2008 3.9 0.0 32.2 26.5 97.2 68.7 0.0 0.0 1042.6 0.0
19/7/2008 4.4 0.0 31.8 26.0 99.0 72.6 1.5 0.5 955.2 0.0
20/7/2008 4.8 0.0 32.0 25.6 99.9 69.7 4.5 0.5 887.3 0.0
21/7/2008 4.3 0.0 32.2 25.9 99.1 70.5 1.5 0.5 1080.6 0.0
22/7/2008 4.3 0.0 32.4 25.3 99.9 72.4 0.0 0.5 1069.8 0.0
23/7/2008 5.5 0.0 31.7 26.2 99.1 75.5 1.0 0.5 1185.0 0.0
24/7/2008 3.2 0.0 28.9 24.9 99.9 87.5 37.5 0.5 637.0 0.0
25/7/2008 4.8 0.0 30.0 23.8 99.9 79.2 25.0 0.5 908.9 0.0
26/7/2008 4.3 0.0 26.2 24.1 99.9 95.1 87.5 0.5 369.6 0.0
27/7/2008 2.7 0.0 25.7 24.4 99.9 99.9 76.0 0.5 206.7 0.0
28/7/2008 5.0 0.0 25.8 24.0 99.9 95.6 124.5 0.5 465.3 0.0
29/7/2008 5.9 0.0 26.9 24.7 99.9 95.9 53.0 0.5 397.4 0.0
30/7/2008 5.7 0.0 29.5 24.2 99.9 82.3 5.5 0.5 1122.3 0.0
31/7/2008 5.8 0.0 31.1 25.7 99.9 73.9 9.0 0.5 1222.0 0.0
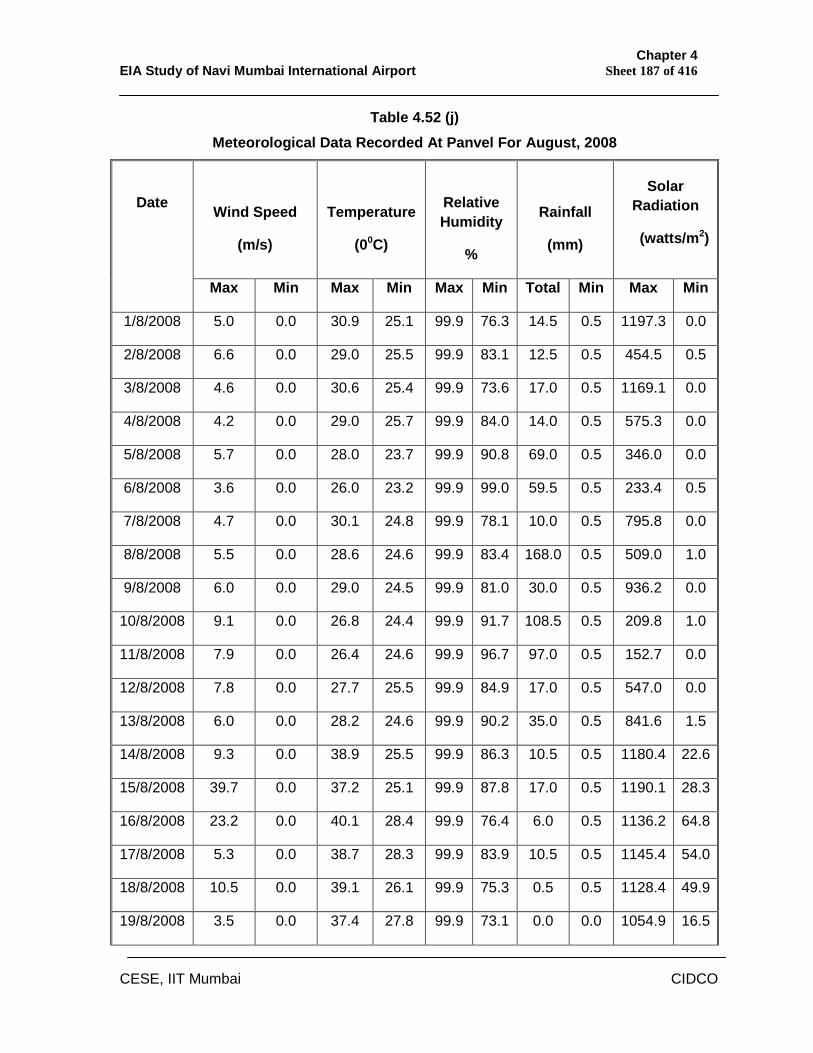
Chapter 4 EIA Study of Navi Mumbai International Airport Sheet 187 of 416
CESE, IIT Mumbai CIDCO
Table 4.52 (j) Meteorological Data Recorded At Panvel For August, 2008
Wind Speed
(m/s)
Temperature
(00C)
Relative Humidity
%
Rainfall
(mm)
Solar Radiation
(watts/m2)
Date
Max Min Max Min Max Min Total Min Max Min
1/8/2008 5.0 0.0 30.9 25.1 99.9 76.3 14.5 0.5 1197.3 0.0
2/8/2008 6.6 0.0 29.0 25.5 99.9 83.1 12.5 0.5 454.5 0.5
3/8/2008 4.6 0.0 30.6 25.4 99.9 73.6 17.0 0.5 1169.1 0.0
4/8/2008 4.2 0.0 29.0 25.7 99.9 84.0 14.0 0.5 575.3 0.0
5/8/2008 5.7 0.0 28.0 23.7 99.9 90.8 69.0 0.5 346.0 0.0
6/8/2008 3.6 0.0 26.0 23.2 99.9 99.0 59.5 0.5 233.4 0.5
7/8/2008 4.7 0.0 30.1 24.8 99.9 78.1 10.0 0.5 795.8 0.0
8/8/2008 5.5 0.0 28.6 24.6 99.9 83.4 168.0 0.5 509.0 1.0
9/8/2008 6.0 0.0 29.0 24.5 99.9 81.0 30.0 0.5 936.2 0.0
10/8/2008 9.1 0.0 26.8 24.4 99.9 91.7 108.5 0.5 209.8 1.0
11/8/2008 7.9 0.0 26.4 24.6 99.9 96.7 97.0 0.5 152.7 0.0
12/8/2008 7.8 0.0 27.7 25.5 99.9 84.9 17.0 0.5 547.0 0.0
13/8/2008 6.0 0.0 28.2 24.6 99.9 90.2 35.0 0.5 841.6 1.5
14/8/2008 9.3 0.0 38.9 25.5 99.9 86.3 10.5 0.5 1180.4 22.6
15/8/2008 39.7 0.0 37.2 25.1 99.9 87.8 17.0 0.5 1190.1 28.3
16/8/2008 23.2 0.0 40.1 28.4 99.9 76.4 6.0 0.5 1136.2 64.8
17/8/2008 5.3 0.0 38.7 28.3 99.9 83.9 10.5 0.5 1145.4 54.0
18/8/2008 10.5 0.0 39.1 26.1 99.9 75.3 0.5 0.5 1128.4 49.9
19/8/2008 3.5 0.0 37.4 27.8 99.9 73.1 0.0 0.0 1054.9 16.5
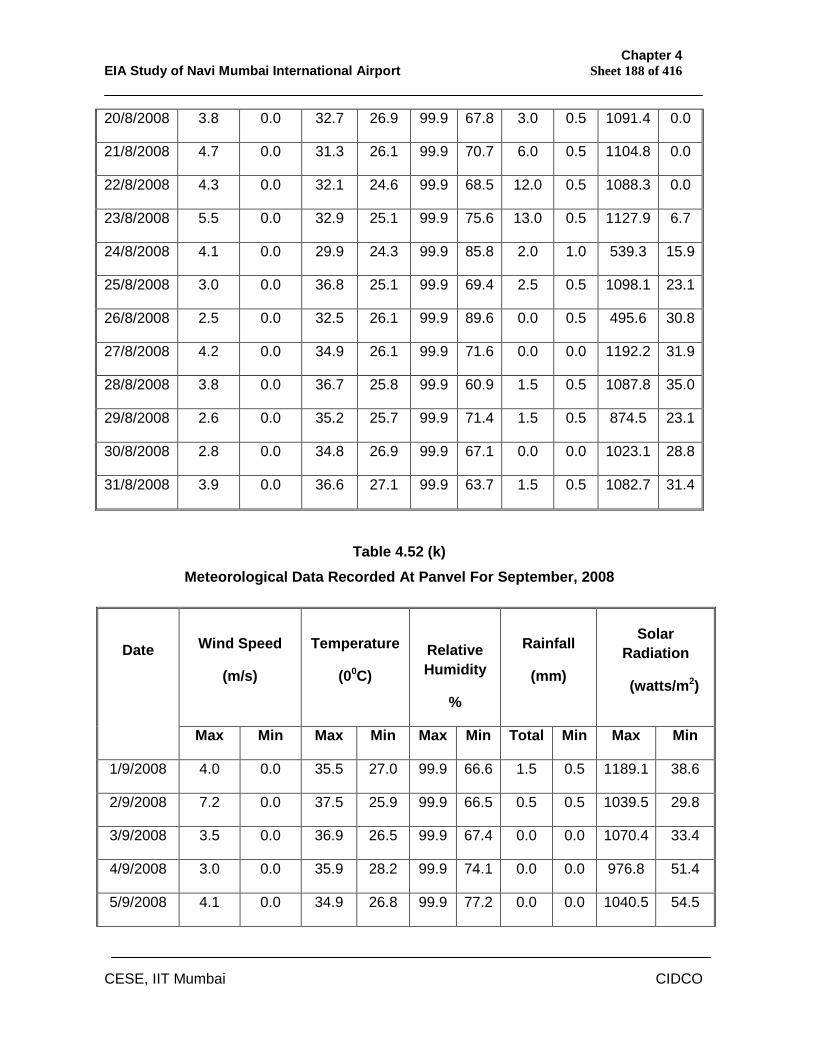
Chapter 4 EIA Study of Navi Mumbai International Airport Sheet 188 of 416
CESE, IIT Mumbai CIDCO
20/8/2008 3.8 0.0 32.7 26.9 99.9 67.8 3.0 0.5 1091.4 0.0
21/8/2008 4.7 0.0 31.3 26.1 99.9 70.7 6.0 0.5 1104.8 0.0
22/8/2008 4.3 0.0 32.1 24.6 99.9 68.5 12.0 0.5 1088.3 0.0
23/8/2008 5.5 0.0 32.9 25.1 99.9 75.6 13.0 0.5 1127.9 6.7
24/8/2008 4.1 0.0 29.9 24.3 99.9 85.8 2.0 1.0 539.3 15.9
25/8/2008 3.0 0.0 36.8 25.1 99.9 69.4 2.5 0.5 1098.1 23.1
26/8/2008 2.5 0.0 32.5 26.1 99.9 89.6 0.0 0.5 495.6 30.8
27/8/2008 4.2 0.0 34.9 26.1 99.9 71.6 0.0 0.0 1192.2 31.9
28/8/2008 3.8 0.0 36.7 25.8 99.9 60.9 1.5 0.5 1087.8 35.0
29/8/2008 2.6 0.0 35.2 25.7 99.9 71.4 1.5 0.5 874.5 23.1
30/8/2008 2.8 0.0 34.8 26.9 99.9 67.1 0.0 0.0 1023.1 28.8
31/8/2008 3.9 0.0 36.6 27.1 99.9 63.7 1.5 0.5 1082.7 31.4
Table 4.52 (k) Meteorological Data Recorded At Panvel For September, 2008
Wind Speed
(m/s)
Temperature
(00C)
Relative Humidity
%
Rainfall
(mm)
Solar Radiation
(watts/m2)
Date
Max Min Max Min Max Min Total Min Max Min
1/9/2008 4.0 0.0 35.5 27.0 99.9 66.6 1.5 0.5 1189.1 38.6
2/9/2008 7.2 0.0 37.5 25.9 99.9 66.5 0.5 0.5 1039.5 29.8
3/9/2008 3.5 0.0 36.9 26.5 99.9 67.4 0.0 0.0 1070.4 33.4
4/9/2008 3.0 0.0 35.9 28.2 99.9 74.1 0.0 0.0 976.8 51.4
5/9/2008 4.1 0.0 34.9 26.8 99.9 77.2 0.0 0.0 1040.5 54.5
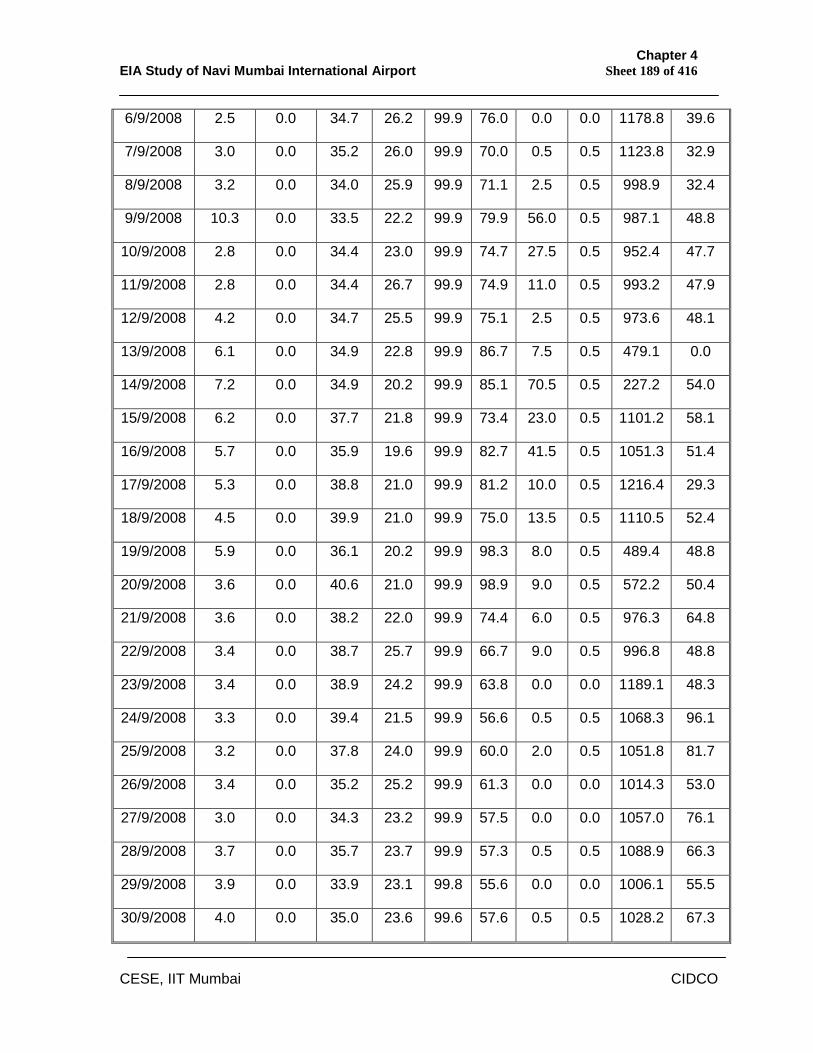
Chapter 4 EIA Study of Navi Mumbai International Airport Sheet 189 of 416
CESE, IIT Mumbai CIDCO
6/9/2008 2.5 0.0 34.7 26.2 99.9 76.0 0.0 0.0 1178.8 39.6
7/9/2008 3.0 0.0 35.2 26.0 99.9 70.0 0.5 0.5 1123.8 32.9
8/9/2008 3.2 0.0 34.0 25.9 99.9 71.1 2.5 0.5 998.9 32.4
9/9/2008 10.3 0.0 33.5 22.2 99.9 79.9 56.0 0.5 987.1 48.8
10/9/2008 2.8 0.0 34.4 23.0 99.9 74.7 27.5 0.5 952.4 47.7
11/9/2008 2.8 0.0 34.4 26.7 99.9 74.9 11.0 0.5 993.2 47.9
12/9/2008 4.2 0.0 34.7 25.5 99.9 75.1 2.5 0.5 973.6 48.1
13/9/2008 6.1 0.0 34.9 22.8 99.9 86.7 7.5 0.5 479.1 0.0
14/9/2008 7.2 0.0 34.9 20.2 99.9 85.1 70.5 0.5 227.2 54.0
15/9/2008 6.2 0.0 37.7 21.8 99.9 73.4 23.0 0.5 1101.2 58.1
16/9/2008 5.7 0.0 35.9 19.6 99.9 82.7 41.5 0.5 1051.3 51.4
17/9/2008 5.3 0.0 38.8 21.0 99.9 81.2 10.0 0.5 1216.4 29.3
18/9/2008 4.5 0.0 39.9 21.0 99.9 75.0 13.5 0.5 1110.5 52.4
19/9/2008 5.9 0.0 36.1 20.2 99.9 98.3 8.0 0.5 489.4 48.8
20/9/2008 3.6 0.0 40.6 21.0 99.9 98.9 9.0 0.5 572.2 50.4
21/9/2008 3.6 0.0 38.2 22.0 99.9 74.4 6.0 0.5 976.3 64.8
22/9/2008 3.4 0.0 38.7 25.7 99.9 66.7 9.0 0.5 996.8 48.8
23/9/2008 3.4 0.0 38.9 24.2 99.9 63.8 0.0 0.0 1189.1 48.3
24/9/2008 3.3 0.0 39.4 21.5 99.9 56.6 0.5 0.5 1068.3 96.1
25/9/2008 3.2 0.0 37.8 24.0 99.9 60.0 2.0 0.5 1051.8 81.7
26/9/2008 3.4 0.0 35.2 25.2 99.9 61.3 0.0 0.0 1014.3 53.0
27/9/2008 3.0 0.0 34.3 23.2 99.9 57.5 0.0 0.0 1057.0 76.1
28/9/2008 3.7 0.0 35.7 23.7 99.9 57.3 0.5 0.5 1088.9 66.3
29/9/2008 3.9 0.0 33.9 23.1 99.8 55.6 0.0 0.0 1006.1 55.5
30/9/2008 4.0 0.0 35.0 23.6 99.6 57.6 0.5 0.5 1028.2 67.3
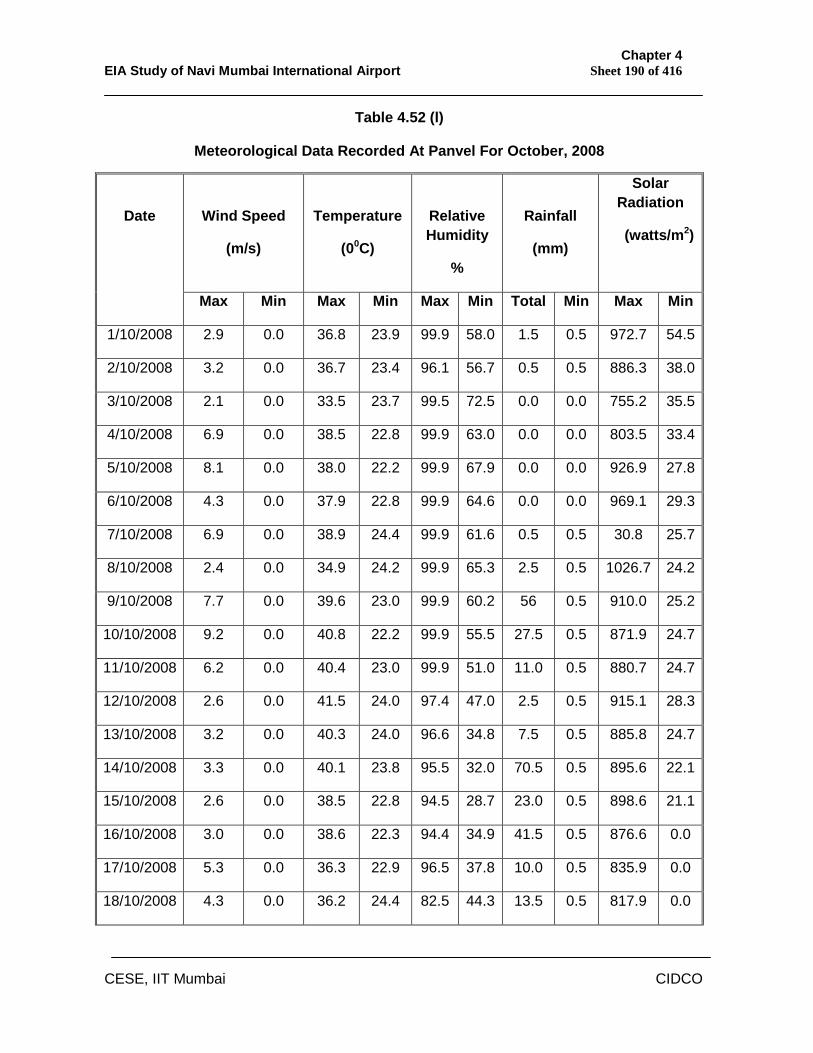
Chapter 4 EIA Study of Navi Mumbai International Airport Sheet 190 of 416
CESE, IIT Mumbai CIDCO
Table 4.52 (l)
Meteorological Data Recorded At Panvel For October, 2008
Wind Speed
(m/s)
Temperature
(00C)
Relative Humidity
%
Rainfall
(mm)
Solar Radiation
(watts/m2)
Date
Max Min Max Min Max Min Total Min Max Min
1/10/2008 2.9 0.0 36.8 23.9 99.9 58.0 1.5 0.5 972.7 54.5
2/10/2008 3.2 0.0 36.7 23.4 96.1 56.7 0.5 0.5 886.3 38.0
3/10/2008 2.1 0.0 33.5 23.7 99.5 72.5 0.0 0.0 755.2 35.5
4/10/2008 6.9 0.0 38.5 22.8 99.9 63.0 0.0 0.0 803.5 33.4
5/10/2008 8.1 0.0 38.0 22.2 99.9 67.9 0.0 0.0 926.9 27.8
6/10/2008 4.3 0.0 37.9 22.8 99.9 64.6 0.0 0.0 969.1 29.3
7/10/2008 6.9 0.0 38.9 24.4 99.9 61.6 0.5 0.5 30.8 25.7
8/10/2008 2.4 0.0 34.9 24.2 99.9 65.3 2.5 0.5 1026.7 24.2
9/10/2008 7.7 0.0 39.6 23.0 99.9 60.2 56 0.5 910.0 25.2
10/10/2008 9.2 0.0 40.8 22.2 99.9 55.5 27.5 0.5 871.9 24.7
11/10/2008 6.2 0.0 40.4 23.0 99.9 51.0 11.0 0.5 880.7 24.7
12/10/2008 2.6 0.0 41.5 24.0 97.4 47.0 2.5 0.5 915.1 28.3
13/10/2008 3.2 0.0 40.3 24.0 96.6 34.8 7.5 0.5 885.8 24.7
14/10/2008 3.3 0.0 40.1 23.8 95.5 32.0 70.5 0.5 895.6 22.1
15/10/2008 2.6 0.0 38.5 22.8 94.5 28.7 23.0 0.5 898.6 21.1
16/10/2008 3.0 0.0 38.6 22.3 94.4 34.9 41.5 0.5 876.6 0.0
17/10/2008 5.3 0.0 36.3 22.9 96.5 37.8 10.0 0.5 835.9 0.0
18/10/2008 4.3 0.0 36.2 24.4 82.5 44.3 13.5 0.5 817.9 0.0
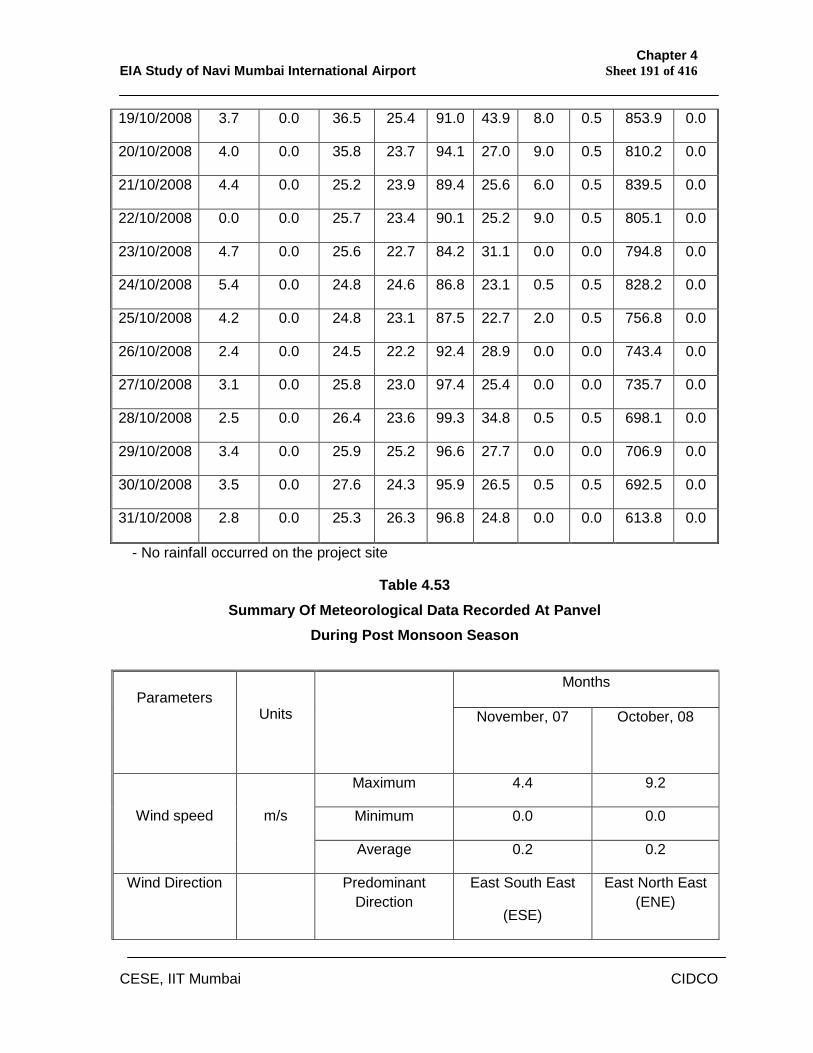
Chapter 4 EIA Study of Navi Mumbai International Airport Sheet 191 of 416
CESE, IIT Mumbai CIDCO
19/10/2008 3.7 0.0 36.5 25.4 91.0 43.9 8.0 0.5 853.9 0.0
20/10/2008 4.0 0.0 35.8 23.7 94.1 27.0 9.0 0.5 810.2 0.0
21/10/2008 4.4 0.0 25.2 23.9 89.4 25.6 6.0 0.5 839.5 0.0
22/10/2008 0.0 0.0 25.7 23.4 90.1 25.2 9.0 0.5 805.1 0.0
23/10/2008 4.7 0.0 25.6 22.7 84.2 31.1 0.0 0.0 794.8 0.0
24/10/2008 5.4 0.0 24.8 24.6 86.8 23.1 0.5 0.5 828.2 0.0
25/10/2008 4.2 0.0 24.8 23.1 87.5 22.7 2.0 0.5 756.8 0.0
26/10/2008 2.4 0.0 24.5 22.2 92.4 28.9 0.0 0.0 743.4 0.0
27/10/2008 3.1 0.0 25.8 23.0 97.4 25.4 0.0 0.0 735.7 0.0
28/10/2008 2.5 0.0 26.4 23.6 99.3 34.8 0.5 0.5 698.1 0.0
29/10/2008 3.4 0.0 25.9 25.2 96.6 27.7 0.0 0.0 706.9 0.0
30/10/2008 3.5 0.0 27.6 24.3 95.9 26.5 0.5 0.5 692.5 0.0
31/10/2008 2.8 0.0 25.3 26.3 96.8 24.8 0.0 0.0 613.8 0.0
- No rainfall occurred on the project site
Table 4.53 Summary Of Meteorological Data Recorded At Panvel
During Post Monsoon Season
Months Parameters
Units November, 07
October, 08
Maximum 4.4 9.2
Minimum 0.0 0.0 Wind speed
m/s
Average 0.2 0.2
Wind Direction
Predominant Direction
East South East
(ESE)
East North East (ENE)
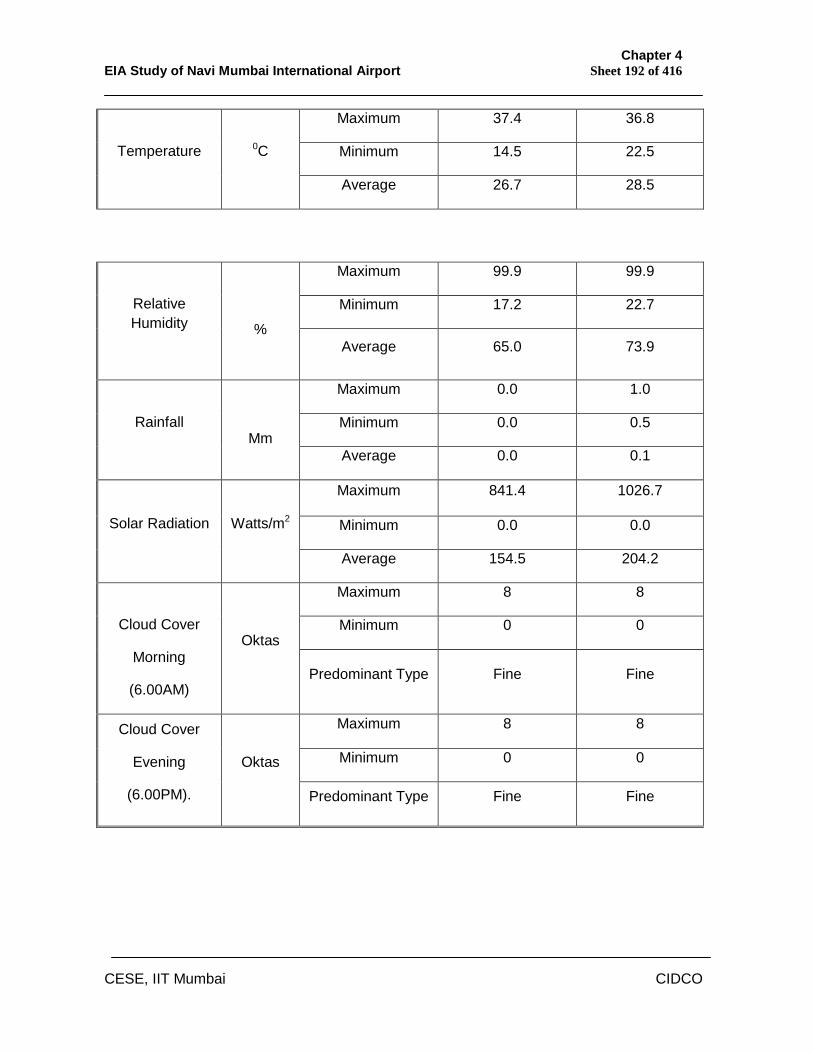
Chapter 4 EIA Study of Navi Mumbai International Airport Sheet 192 of 416
CESE, IIT Mumbai CIDCO
Maximum 37.4 36.8
Minimum 14.5 22.5 Temperature 0C
Average 26.7 28.5
Maximum 99.9 99.9
Minimum 17.2 22.7
Relative Humidity
% Average 65.0 73.9
Maximum 0.0 1.0
Minimum 0.0 0.5
Rainfall
Mm Average 0.0 0.1
Maximum 841.4 1026.7
Minimum 0.0 0.0
Solar Radiation
Watts/m2
Average 154.5 204.2
Maximum 8 8
Minimum 0 0
Cloud Cover
Morning
(6.00AM)
Oktas
Predominant Type Fine Fine
Maximum 8 8
Minimum 0 0
Cloud Cover
Evening
(6.00PM).
Oktas
Predominant Type Fine Fine
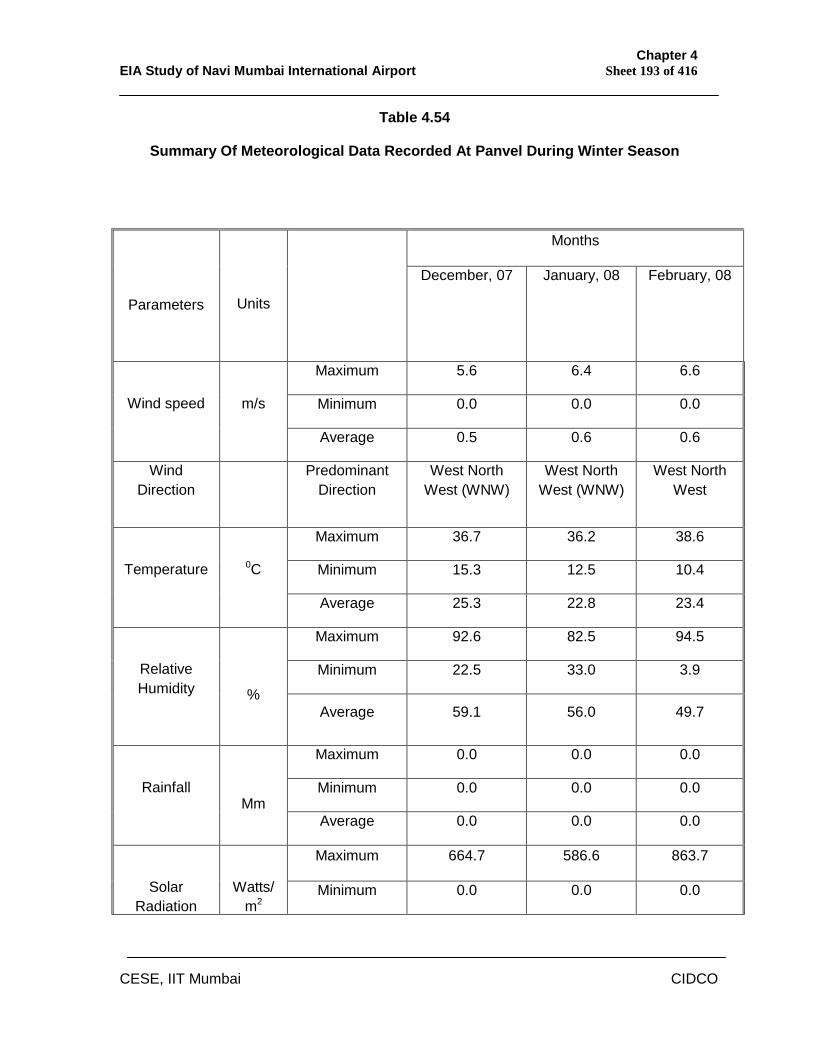
Chapter 4 EIA Study of Navi Mumbai International Airport Sheet 193 of 416
CESE, IIT Mumbai CIDCO
Table 4.54
Summary Of Meteorological Data Recorded At Panvel During Winter Season
Months
Parameters
Units
December, 07 January, 08 February, 08
Maximum 5.6 6.4 6.6
Minimum 0.0 0.0 0.0 Wind speed
m/s
Average 0.5 0.6 0.6
Wind Direction
Predominant Direction
West North West (WNW)
West North West (WNW)
West North West
Maximum 36.7 36.2 38.6
Minimum 15.3 12.5 10.4 Temperature 0C
Average 25.3 22.8 23.4
Maximum 92.6 82.5 94.5
Minimum 22.5 33.0 3.9
Relative Humidity
% Average 59.1 56.0 49.7
Maximum 0.0 0.0 0.0
Minimum 0.0 0.0 0.0
Rainfall
Mm Average 0.0 0.0 0.0
Maximum 664.7 586.6 863.7
Solar Radiation
Watts/m2
Minimum 0.0 0.0 0.0
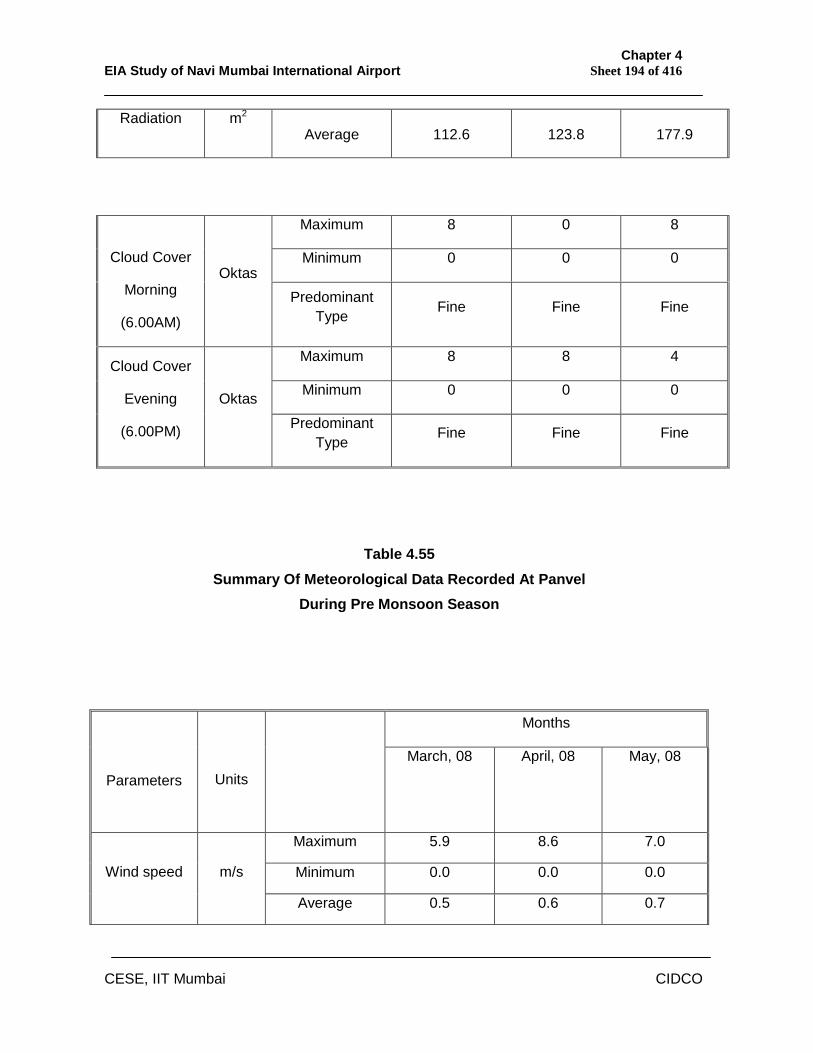
Chapter 4 EIA Study of Navi Mumbai International Airport Sheet 194 of 416
CESE, IIT Mumbai CIDCO
Table 4.55 Summary Of Meteorological Data Recorded At Panvel
During Pre Monsoon Season
Radiation
m2
Average 112.6 123.8 177.9
Maximum 8 0 8
Minimum 0 0 0
Cloud Cover
Morning
(6.00AM)
Oktas
Predominant Type Fine Fine Fine
Maximum 8 8 4
Minimum 0 0 0 Cloud Cover
Evening
(6.00PM)
Oktas
Predominant Type Fine Fine Fine
Months
Parameters
Units March, 08 April, 08 May, 08
Maximum 5.9 8.6 7.0
Minimum 0.0 0.0 0.0 Wind speed
m/s
Average 0.5 0.6 0.7
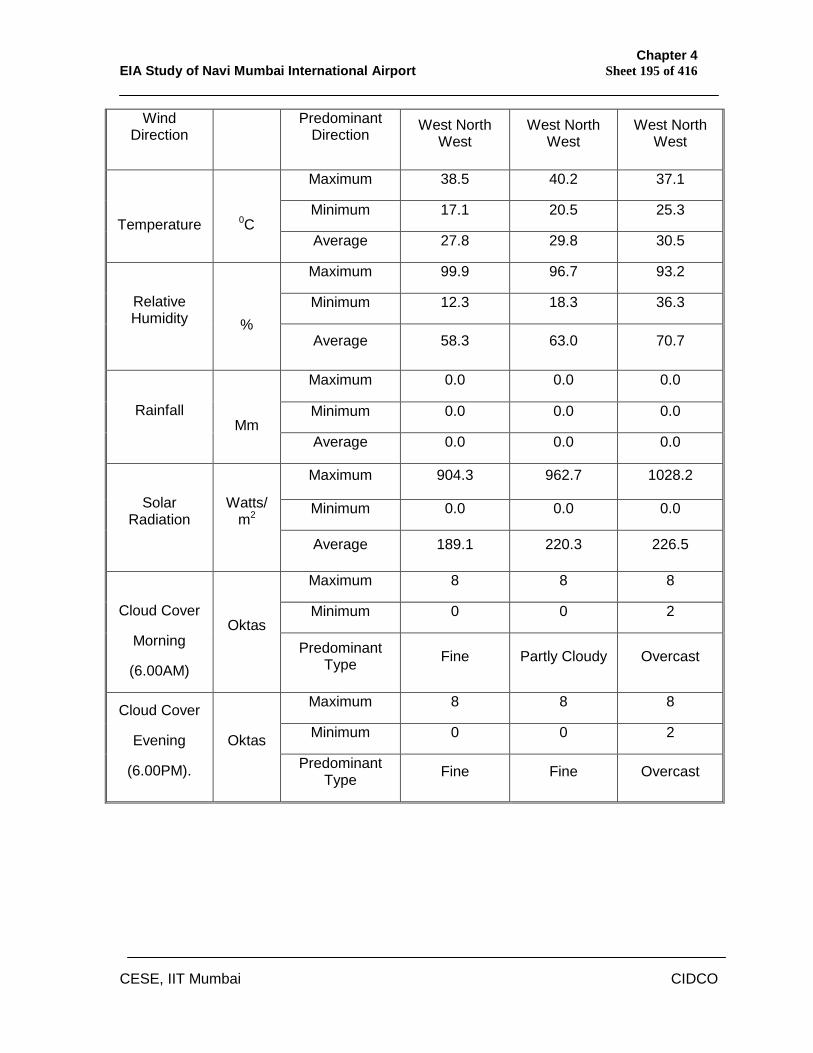
Chapter 4 EIA Study of Navi Mumbai International Airport Sheet 195 of 416
CESE, IIT Mumbai CIDCO
Wind Direction
Predominant Direction
West North West
West North West
West North West
Maximum 38.5 40.2 37.1
Minimum 17.1 20.5 25.3
Temperature
0C
Average 27.8 29.8 30.5
Maximum 99.9 96.7 93.2
Minimum 12.3 18.3 36.3
Relative Humidity
% Average 58.3 63.0 70.7
Maximum 0.0 0.0 0.0
Minimum 0.0 0.0 0.0
Rainfall
Mm Average 0.0 0.0 0.0
Maximum 904.3 962.7 1028.2
Minimum 0.0 0.0 0.0
Solar Radiation
Watts/m2
Average 189.1 220.3 226.5
Maximum 8 8 8
Minimum 0 0 2
Cloud Cover
Morning
(6.00AM)
Oktas
Predominant Type Fine Partly Cloudy Overcast
Maximum 8 8 8
Minimum 0 0 2 Cloud Cover
Evening
(6.00PM).
Oktas
Predominant Type Fine Fine Overcast
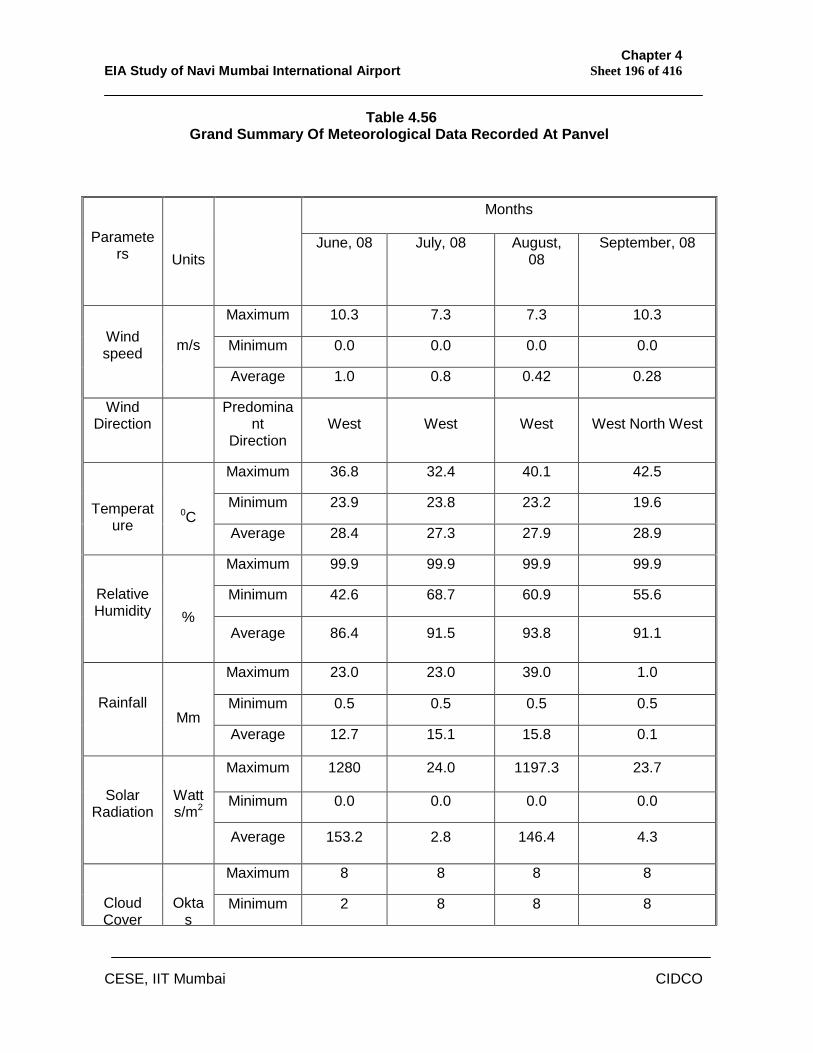
Chapter 4 EIA Study of Navi Mumbai International Airport Sheet 196 of 416
CESE, IIT Mumbai CIDCO
Table 4.56 Grand Summary Of Meteorological Data Recorded At Panvel
Months
Parameters
Units
June, 08 July, 08 August, 08
September, 08
Maximum 10.3 7.3 7.3 10.3
Minimum 0.0 0.0 0.0 0.0 Wind speed
m/s
Average 1.0 0.8 0.42 0.28
Wind Direction
Predominant
Direction West West West West North West
Maximum 36.8 32.4 40.1 42.5
Minimum 23.9 23.8 23.2 19.6
Temperature
0C
Average 28.4 27.3 27.9 28.9
Maximum 99.9 99.9 99.9 99.9
Minimum 42.6 68.7 60.9 55.6
Relative Humidity
% Average 86.4 91.5 93.8 91.1
Maximum 23.0 23.0 39.0 1.0
Minimum 0.5 0.5 0.5 0.5
Rainfall
Mm Average 12.7 15.1 15.8 0.1
Maximum 1280 24.0 1197.3 23.7
Minimum 0.0 0.0 0.0 0.0
Solar Radiation
Watts/m2
Average 153.2 2.8 146.4 4.3
Maximum 8 8 8 8
Cloud Cover
Oktas
Minimum 2 8 8 8
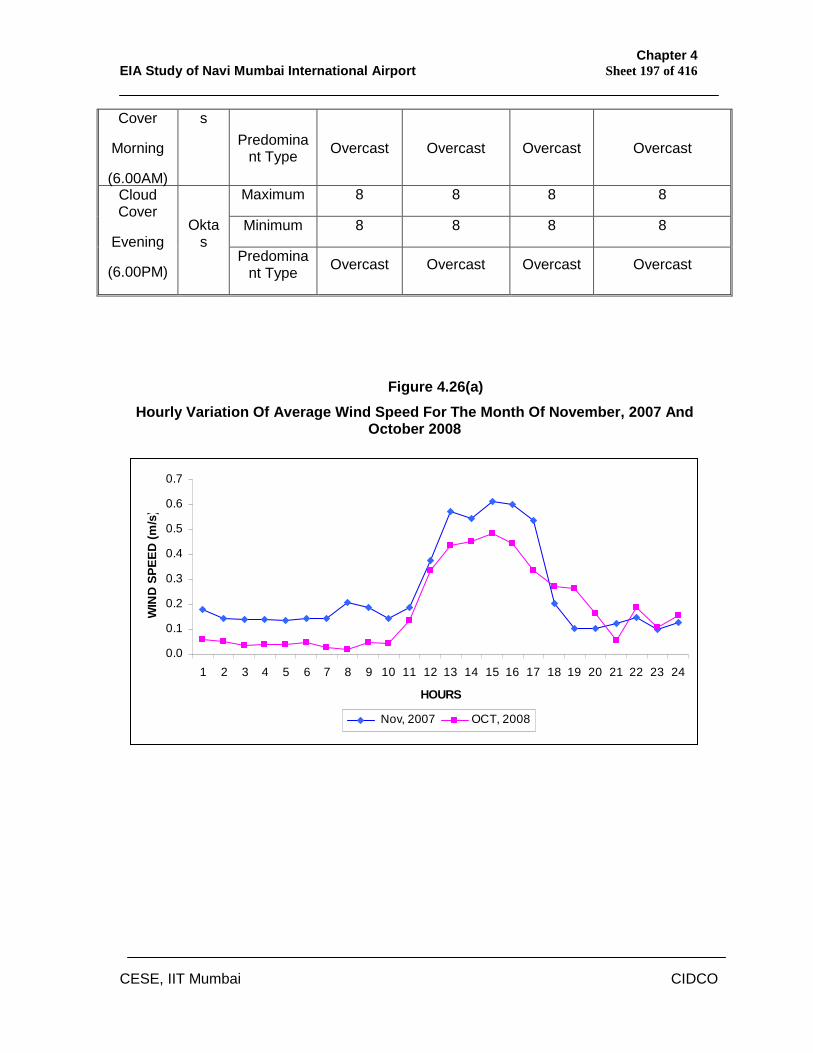
Chapter 4 EIA Study of Navi Mumbai International Airport Sheet 197 of 416
CESE, IIT Mumbai CIDCO
Figure 4.26(a) Hourly Variation Of Average Wind Speed For The Month Of November, 2007 And
October 2008
0.0
0.1
0.2
0.3
0.4
0.5
0.6
0.7
1 2 3 4 5 6 7 8 9 10 11 12 13 14 15 16 17 18 19 20 21 22 23 24
HOURS
WIN
D S
PEED
(m/s
)
Nov, 2007 OCT, 2008
Cover
Morning
(6.00AM)
s
Predominant Type Overcast Overcast Overcast Overcast
Maximum 8 8 8 8
Minimum 8 8 8 8
Cloud Cover
Evening
(6.00PM)
Oktas
Predomina
nt Type Overcast Overcast Overcast Overcast
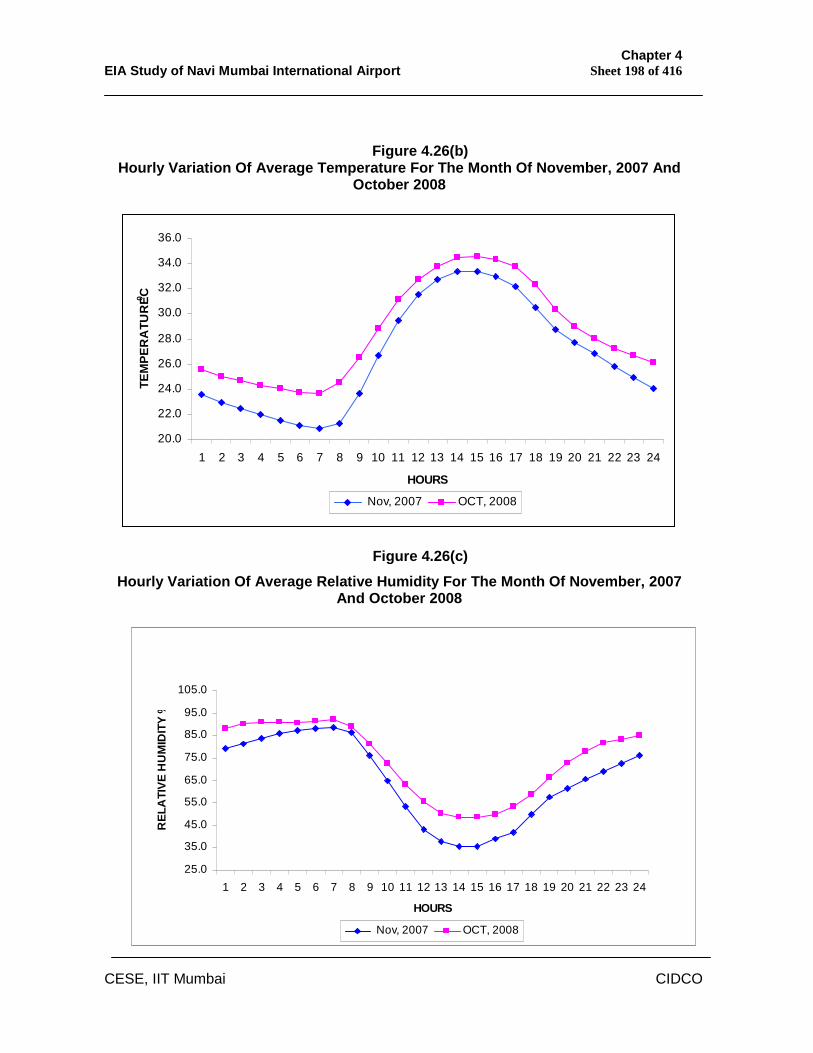
Chapter 4 EIA Study of Navi Mumbai International Airport Sheet 198 of 416
CESE, IIT Mumbai CIDCO
Figure 4.26(b) Hourly Variation Of Average Temperature For The Month Of November, 2007 And
October 2008
20.0
22.0
24.0
26.0
28.0
30.0
32.0
34.0
36.0
1 2 3 4 5 6 7 8 9 10 11 12 13 14 15 16 17 18 19 20 21 22 23 24
HOURS
TEM
PER
ATU
RE 0 C
Nov, 2007 OCT, 2008
Figure 4.26(c) Hourly Variation Of Average Relative Humidity For The Month Of November, 2007
And October 2008
25.0
35.0
45.0
55.0
65.0
75.0
85.0
95.0
105.0
1 2 3 4 5 6 7 8 9 10 11 12 13 14 15 16 17 18 19 20 21 22 23 24
HOURS
REL
ATI
VE H
UM
IDIT
Y %
Nov, 2007 OCT, 2008
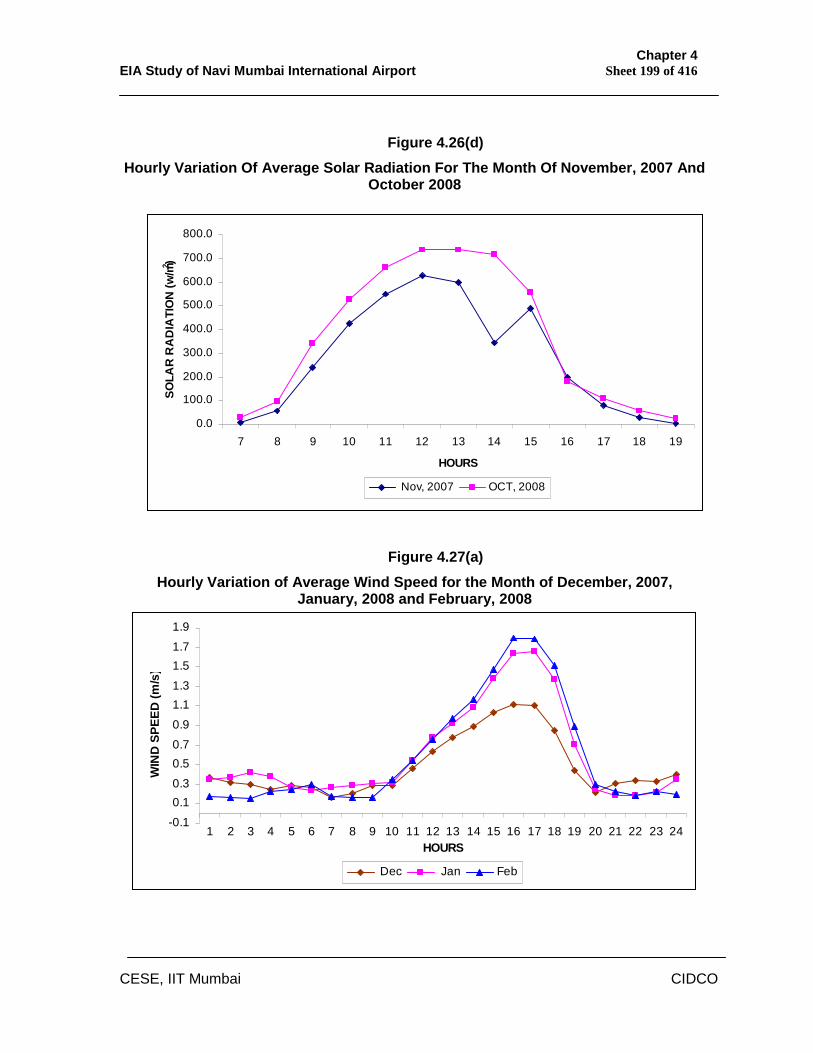
Chapter 4 EIA Study of Navi Mumbai International Airport Sheet 199 of 416
CESE, IIT Mumbai CIDCO
Figure 4.26(d)
Hourly Variation Of Average Solar Radiation For The Month Of November, 2007 And October 2008
0.0
100.0
200.0
300.0
400.0
500.0
600.0
700.0
800.0
7 8 9 10 11 12 13 14 15 16 17 18 19
HOURS
SOLA
R R
AD
IATI
ON
(w/m2 )
Nov, 2007 OCT, 2008
Figure 4.27(a)
Hourly Variation of Average Wind Speed for the Month of December, 2007, January, 2008 and February, 2008
-0.1
0.10.3
0.50.7
0.9
1.11.3
1.51.7
1.9
1 2 3 4 5 6 7 8 9 10 11 12 13 14 15 16 17 18 19 20 21 22 23 24HOURS
WIN
D S
PEED
(m/s
)
Dec Jan Feb
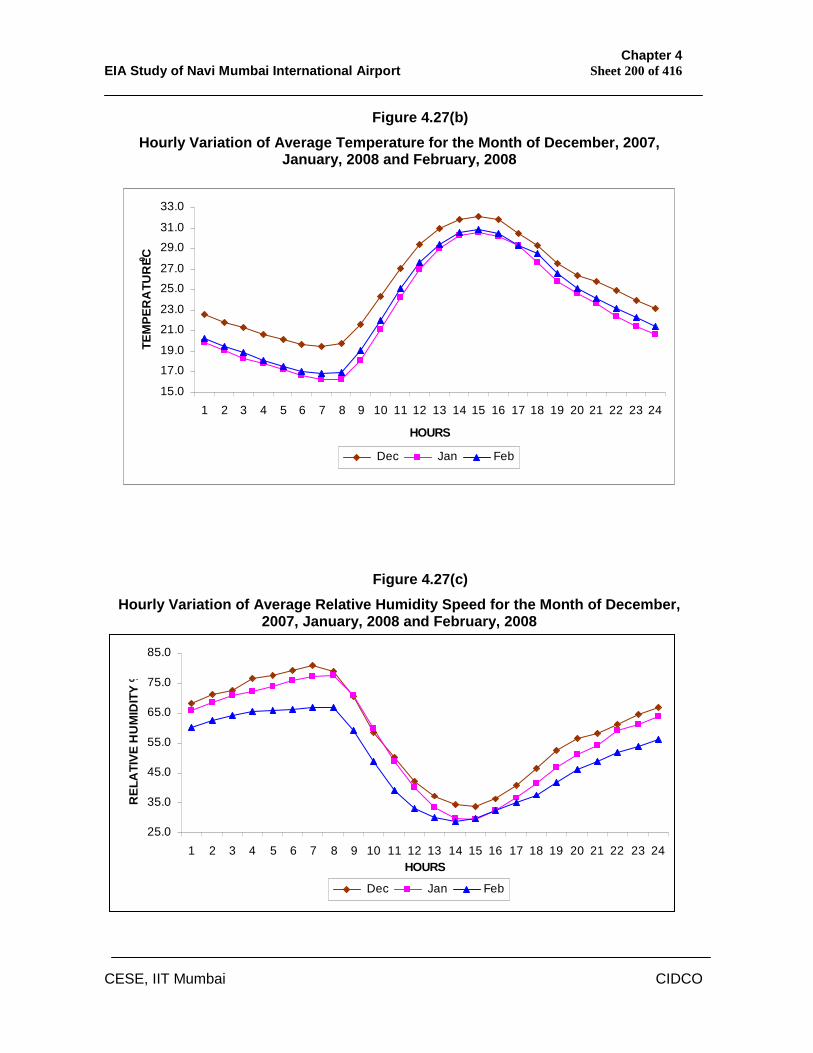
Chapter 4 EIA Study of Navi Mumbai International Airport Sheet 200 of 416
CESE, IIT Mumbai CIDCO
Figure 4.27(b) Hourly Variation of Average Temperature for the Month of December, 2007,
January, 2008 and February, 2008
15.0
17.0
19.0
21.0
23.0
25.027.0
29.031.0
33.0
1 2 3 4 5 6 7 8 9 10 11 12 13 14 15 16 17 18 19 20 21 22 23 24
HOURS
TEM
PER
ATU
RE 0 C
Dec Jan Feb
Figure 4.27(c) Hourly Variation of Average Relative Humidity Speed for the Month of December,
2007, January, 2008 and February, 2008
25.0
35.0
45.0
55.0
65.0
75.0
85.0
1 2 3 4 5 6 7 8 9 10 11 12 13 14 15 16 17 18 19 20 21 22 23 24HOURS
REL
ATI
VE H
UM
IDIT
Y %
Dec Jan Feb
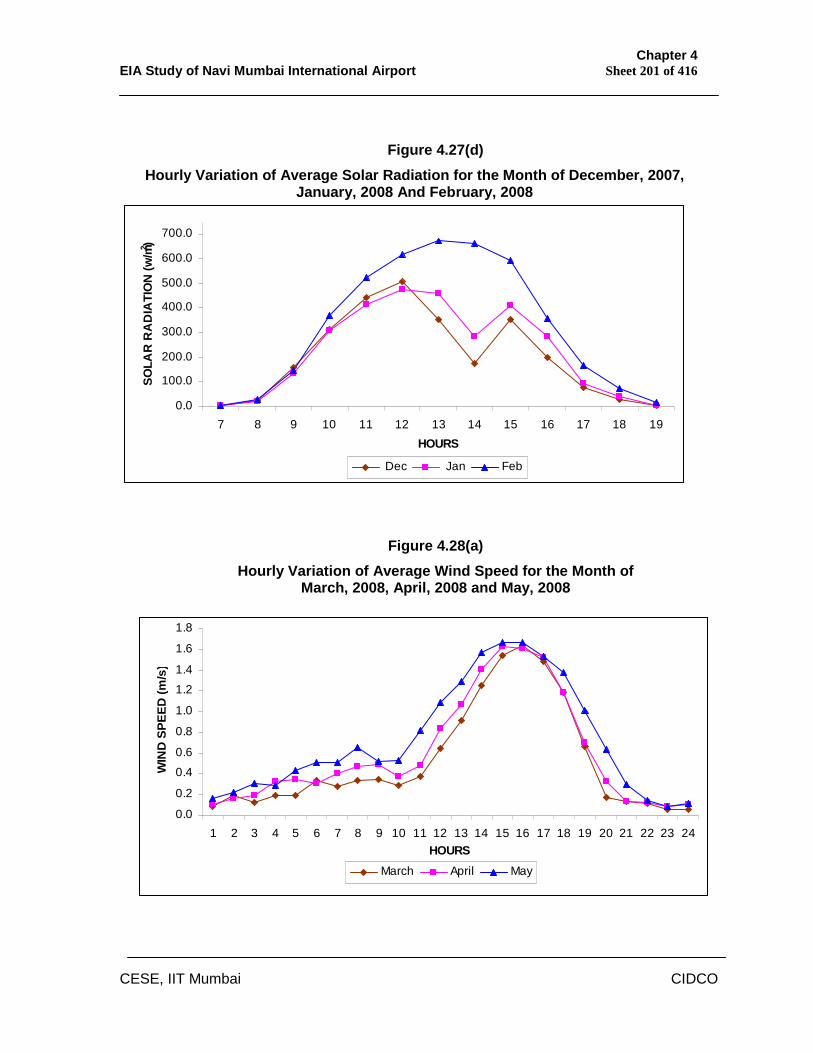
Chapter 4 EIA Study of Navi Mumbai International Airport Sheet 201 of 416
CESE, IIT Mumbai CIDCO
Figure 4.27(d) Hourly Variation of Average Solar Radiation for the Month of December, 2007,
January, 2008 And February, 2008
0.0
100.0
200.0
300.0
400.0
500.0
600.0
700.0
7 8 9 10 11 12 13 14 15 16 17 18 19HOURS
SOLA
R R
AD
IATI
ON
(w/m2 )
Dec Jan Feb
Figure 4.28(a) Hourly Variation of Average Wind Speed for the Month of
March, 2008, April, 2008 and May, 2008
0.0
0.2
0.4
0.6
0.8
1.0
1.2
1.4
1.6
1.8
1 2 3 4 5 6 7 8 9 10 11 12 13 14 15 16 17 18 19 20 21 22 23 24HOURS
WIN
D S
PEED
(m/s
)
March April May
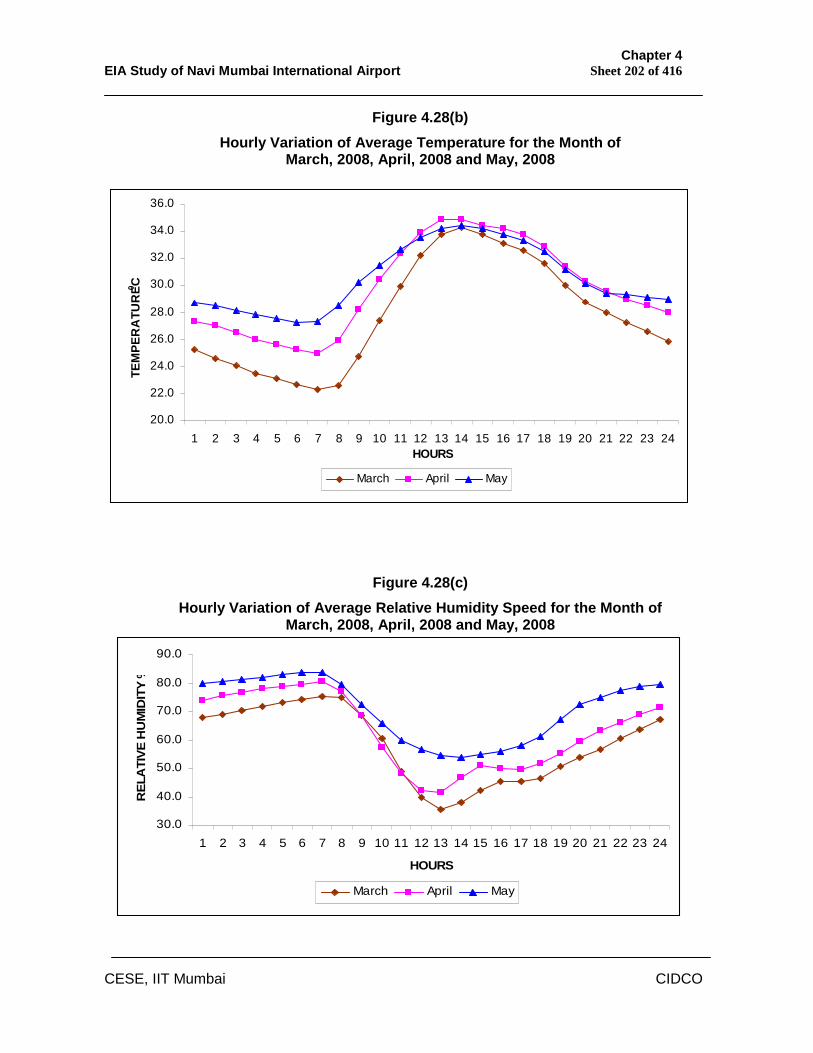
Chapter 4 EIA Study of Navi Mumbai International Airport Sheet 202 of 416
CESE, IIT Mumbai CIDCO
Figure 4.28(b) Hourly Variation of Average Temperature for the Month of
March, 2008, April, 2008 and May, 2008
20.0
22.0
24.0
26.0
28.0
30.0
32.0
34.0
36.0
1 2 3 4 5 6 7 8 9 10 11 12 13 14 15 16 17 18 19 20 21 22 23 24HOURS
TEM
PER
ATU
RE 0 C
March April May
Figure 4.28(c) Hourly Variation of Average Relative Humidity Speed for the Month of
March, 2008, April, 2008 and May, 2008
30.0
40.0
50.0
60.0
70.0
80.0
90.0
1 2 3 4 5 6 7 8 9 10 11 12 13 14 15 16 17 18 19 20 21 22 23 24
HOURS
REL
ATI
VE H
UM
IDIT
Y %
March April May
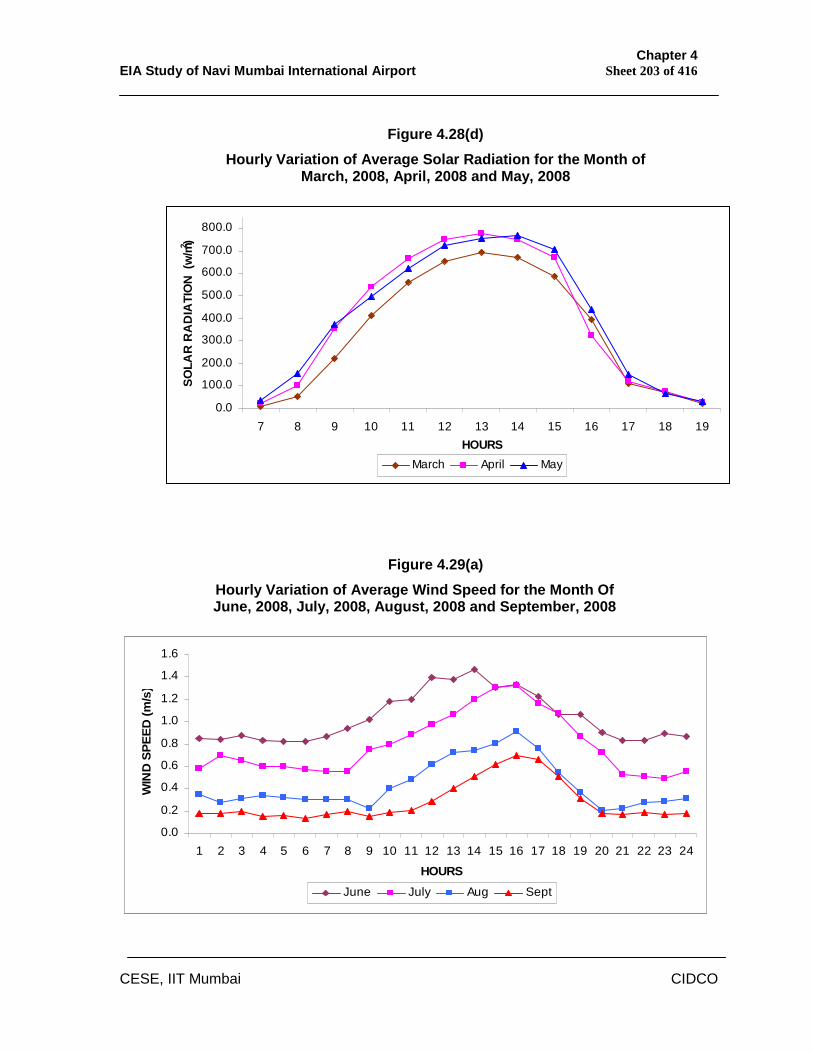
Chapter 4 EIA Study of Navi Mumbai International Airport Sheet 203 of 416
CESE, IIT Mumbai CIDCO
Figure 4.28(d)
Hourly Variation of Average Solar Radiation for the Month of March, 2008, April, 2008 and May, 2008
0.0
100.0
200.0
300.0
400.0
500.0
600.0
700.0
800.0
7 8 9 10 11 12 13 14 15 16 17 18 19HOURS
SOLA
R R
AD
IATI
ON
(w
/m2 )
March April May
Figure 4.29(a) Hourly Variation of Average Wind Speed for the Month Of June, 2008, July, 2008, August, 2008 and September, 2008
0.0
0.2
0.4
0.6
0.8
1.0
1.2
1.4
1.6
1 2 3 4 5 6 7 8 9 10 11 12 13 14 15 16 17 18 19 20 21 22 23 24
HOURS
WIN
D S
PEED
(m/s
)
June July Aug Sept
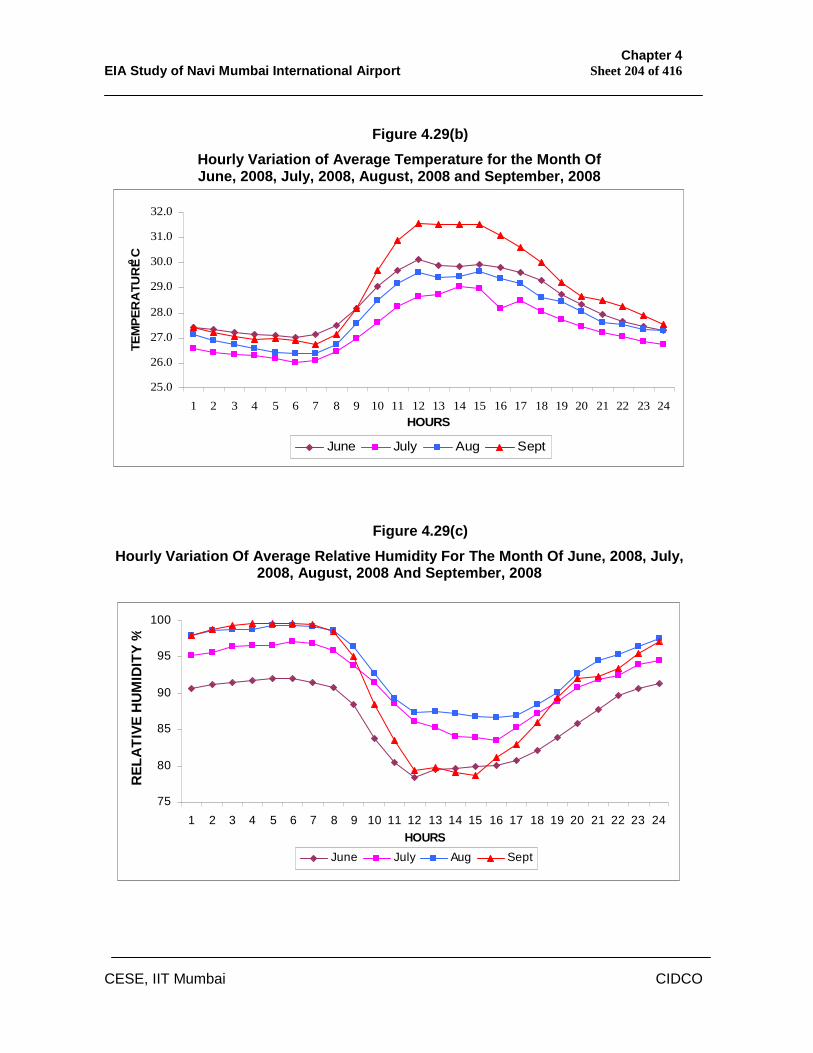
Chapter 4 EIA Study of Navi Mumbai International Airport Sheet 204 of 416
CESE, IIT Mumbai CIDCO
Figure 4.29(b)
Hourly Variation of Average Temperature for the Month Of June, 2008, July, 2008, August, 2008 and September, 2008
25.0
26.0
27.0
28.0
29.0
30.0
31.0
32.0
1 2 3 4 5 6 7 8 9 10 11 12 13 14 15 16 17 18 19 20 21 22 23 24HOURS
TEM
PER
ATU
RE 0 C
June July Aug Sept
Figure 4.29(c) Hourly Variation Of Average Relative Humidity For The Month Of June, 2008, July,
2008, August, 2008 And September, 2008
75
80
85
90
95
100
1 2 3 4 5 6 7 8 9 10 11 12 13 14 15 16 17 18 19 20 21 22 23 24HOURS
REL
ATI
VE H
UM
IDIT
Y %
June July Aug Sept
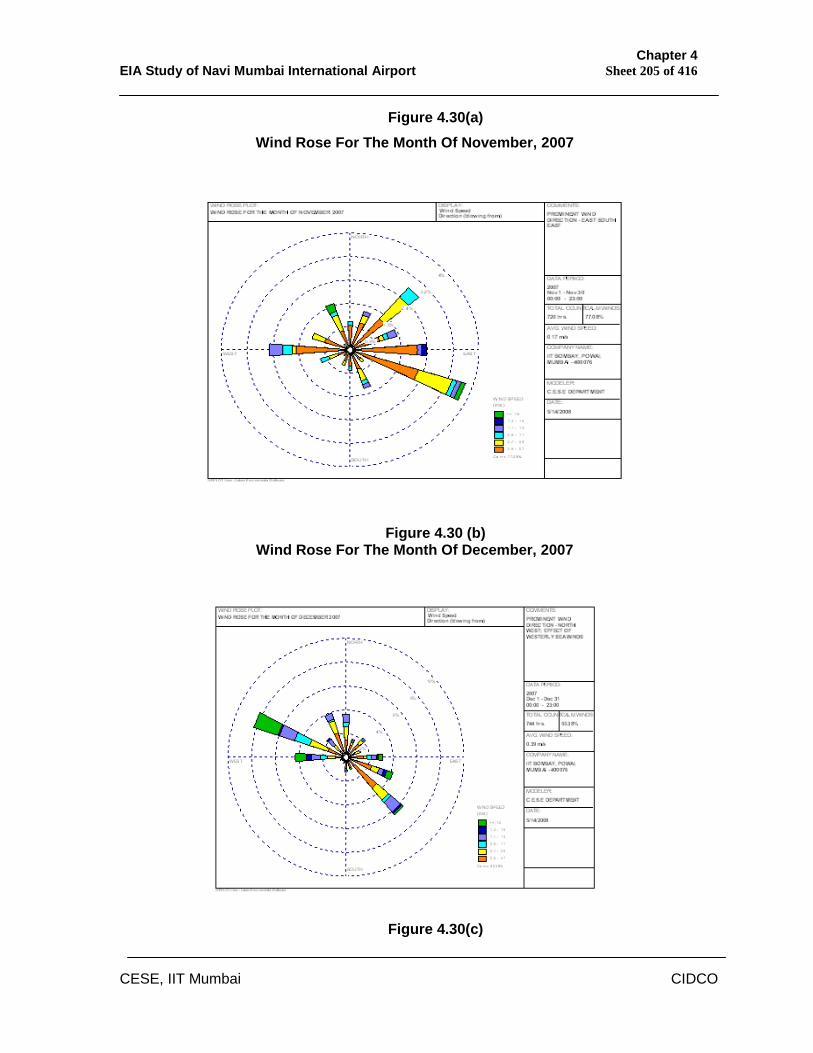
Chapter 4 EIA Study of Navi Mumbai International Airport Sheet 205 of 416
CESE, IIT Mumbai CIDCO
Figure 4.30(a) Wind Rose For The Month Of November, 2007
Figure 4.30 (b) Wind Rose For The Month Of December, 2007
Figure 4.30(c)
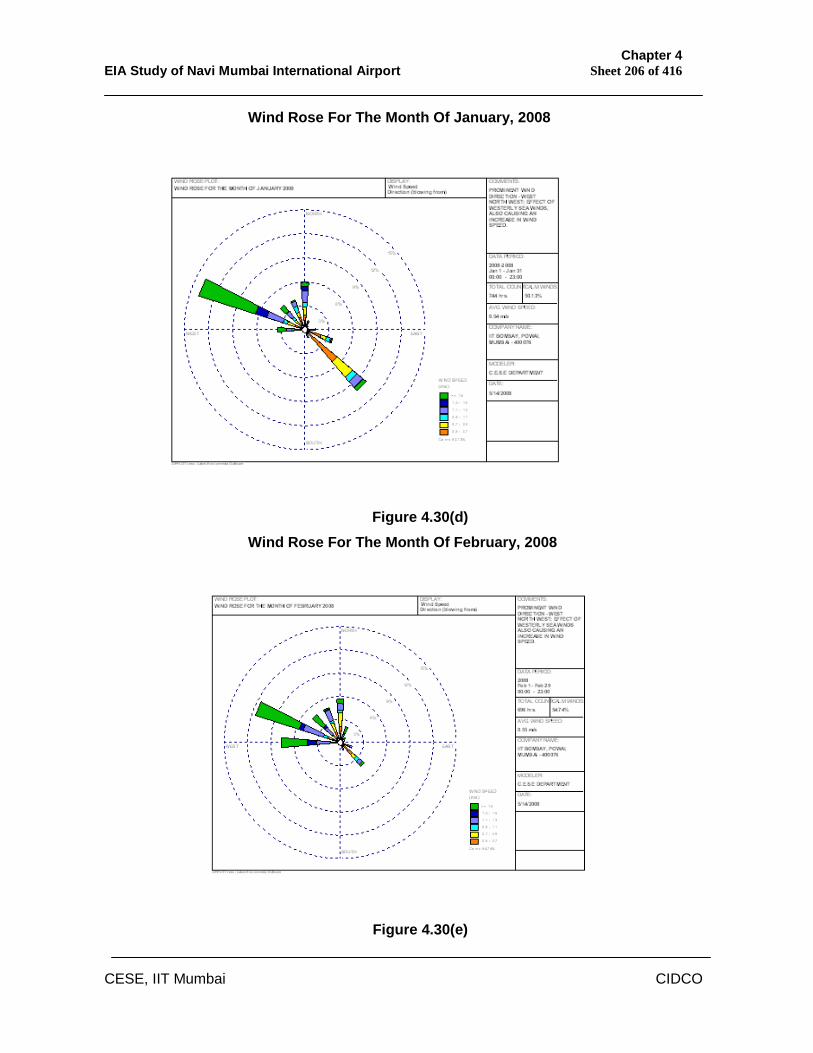
Chapter 4 EIA Study of Navi Mumbai International Airport Sheet 206 of 416
CESE, IIT Mumbai CIDCO
Wind Rose For The Month Of January, 2008
Figure 4.30(d) Wind Rose For The Month Of February, 2008
Figure 4.30(e)
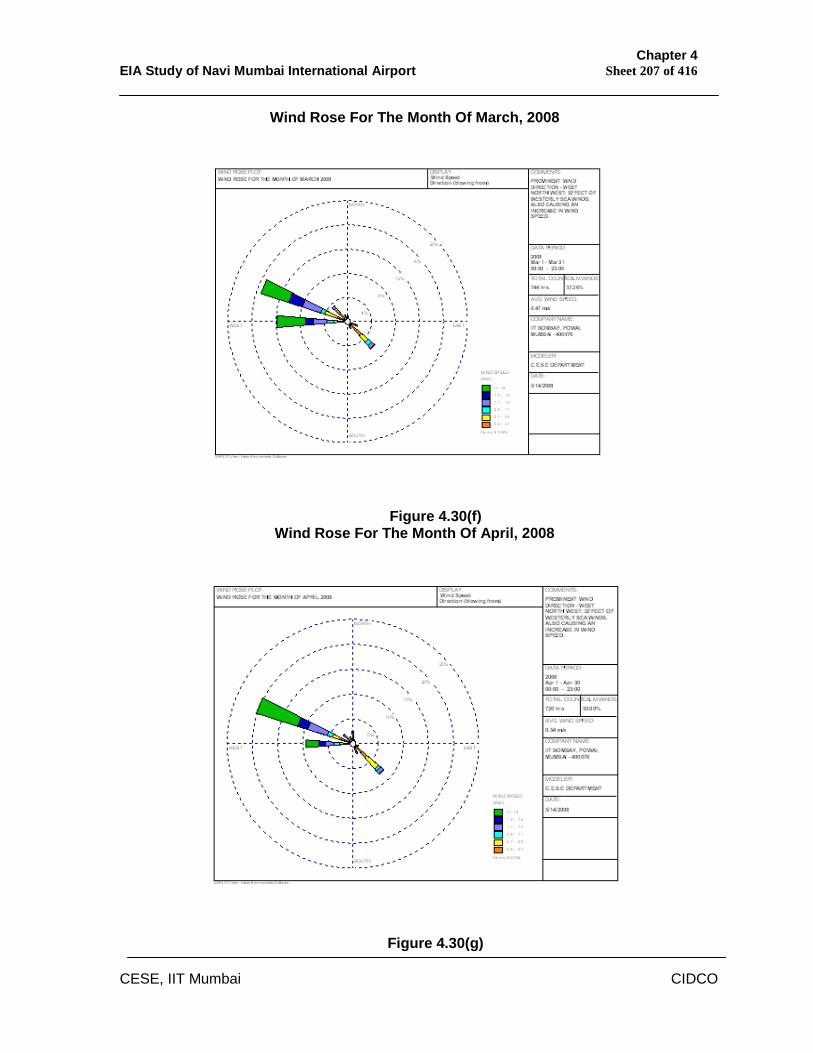
Chapter 4 EIA Study of Navi Mumbai International Airport Sheet 207 of 416
CESE, IIT Mumbai CIDCO
Wind Rose For The Month Of March, 2008
Figure 4.30(f) Wind Rose For The Month Of April, 2008
Figure 4.30(g)
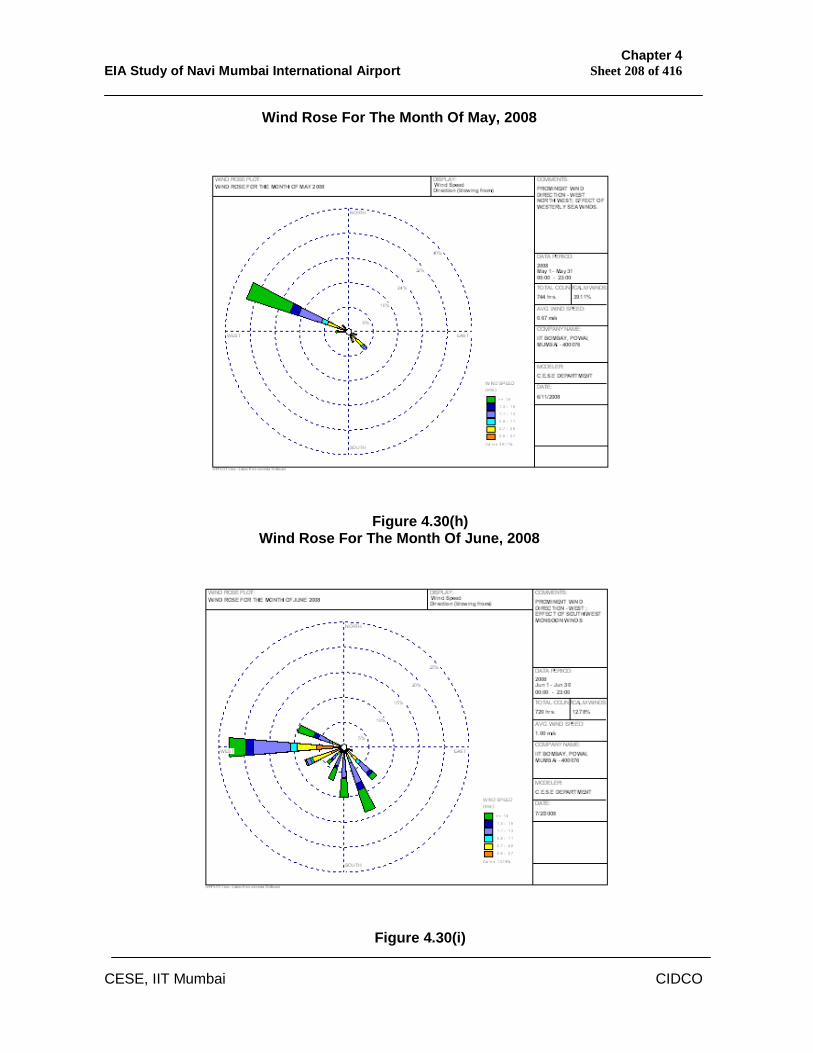
Chapter 4 EIA Study of Navi Mumbai International Airport Sheet 208 of 416
CESE, IIT Mumbai CIDCO
Wind Rose For The Month Of May, 2008
Figure 4.30(h) Wind Rose For The Month Of June, 2008
Figure 4.30(i)
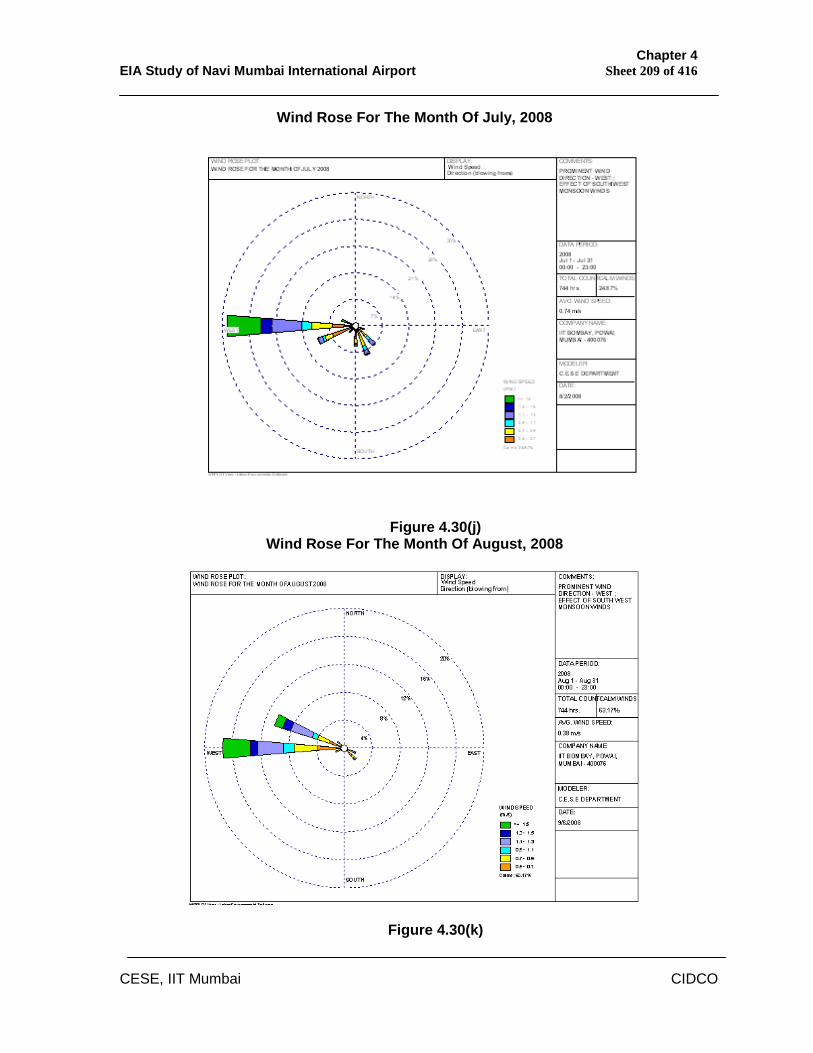
Chapter 4 EIA Study of Navi Mumbai International Airport Sheet 209 of 416
CESE, IIT Mumbai CIDCO
Wind Rose For The Month Of July, 2008
Figure 4.30(j) Wind Rose For The Month Of August, 2008
Figure 4.30(k)
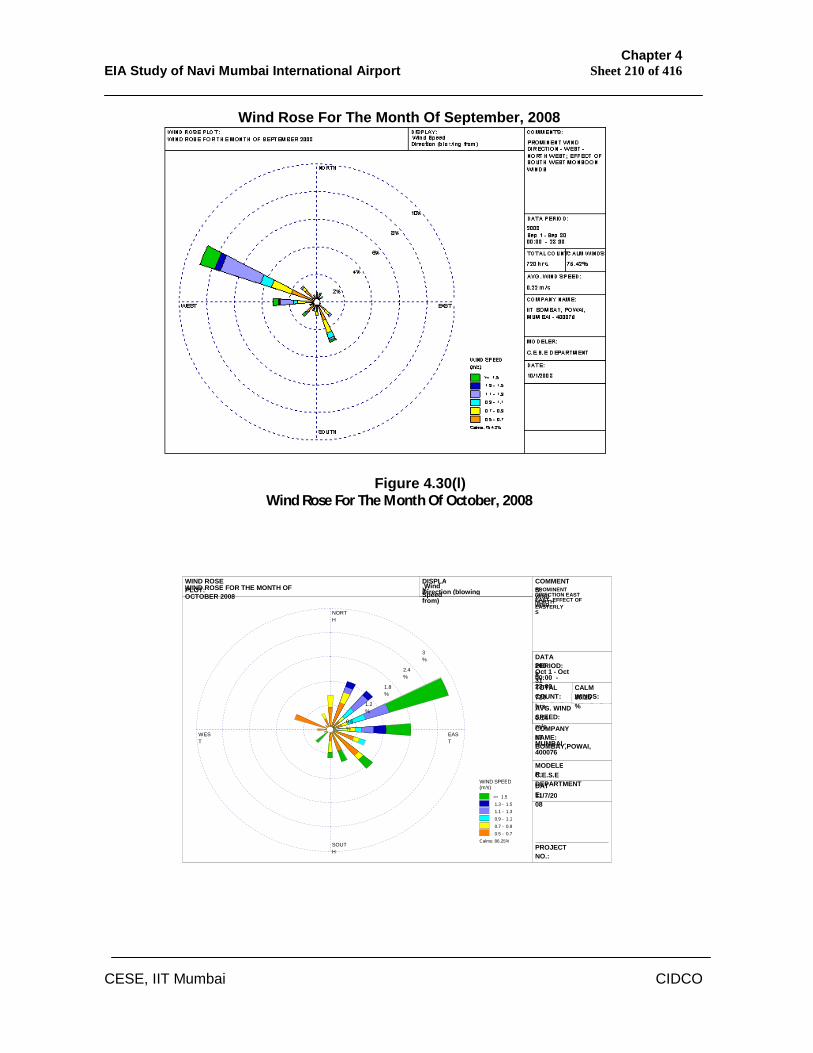
Chapter 4 EIA Study of Navi Mumbai International Airport Sheet 210 of 416
CESE, IIT Mumbai CIDCO
Wind Rose For The Month Of September, 2008
Figure 4.30(l) Wind Rose For The Month Of October, 2008
Table 4.55
PROJECT NO.:
DATE: 11/7/2008
MODELER: C.E.S.E DEPARTMENT
COMPANY NAME: IIT BOMBAY,POWAI, MUMBAI - 400076
COMMENTS: PROMINENT WIND DIRECTION EAST NORTH EAST- EFFECT OF EASTERLY WINDS
WIND ROSE PLOT: WIND ROSE FOR THE MONTH OF OCTOBER 2008
NORTH
SOUTH
WEST
EAST
0.6%
1.2%
1.8%
2.4%
3% DATA
PERIOD: 2008 Oct 1 - Oct 31 00:00 - 23:00
WI ND SPEED
(m/ s)
>=
1. 5
1.3
- 1.5
1.1
- 1.3
0.9
- 1.1
0.7
- 0.9
0.5
- 0.7
Calms: 86.25%
AVG. WIND SPEED: 0.14 m/s
CALM WINDS: 86.25%
TOTAL COUNT: 720 hrs.
DISPLAY: Wind Speed Direction (blowing from)
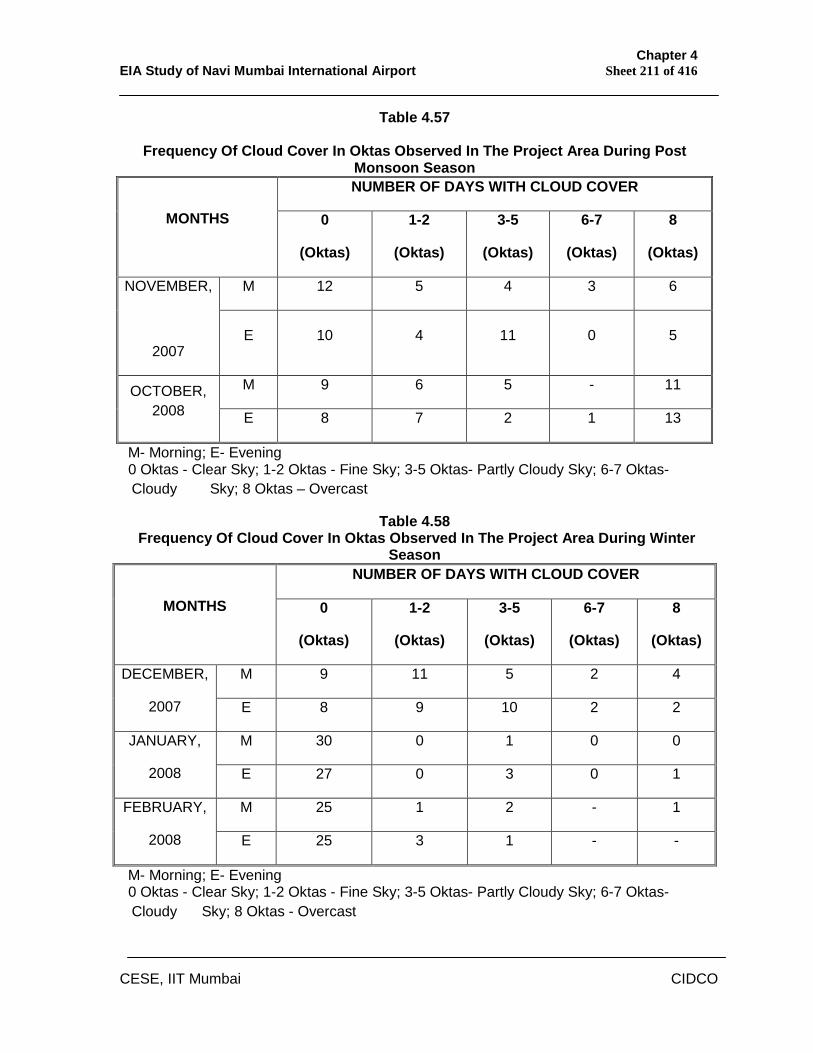
Chapter 4 EIA Study of Navi Mumbai International Airport Sheet 211 of 416
CESE, IIT Mumbai CIDCO
Table 4.57
Frequency Of Cloud Cover In Oktas Observed In The Project Area During Post Monsoon Season NUMBER OF DAYS WITH CLOUD COVER
MONTHS 0
(Oktas)
1-2
(Oktas)
3-5
(Oktas)
6-7
(Oktas)
8
(Oktas)
M 12 5 4 3 6 NOVEMBER,
2007 E 10 4 11 0 5
M 9 6 5 - 11 OCTOBER, 2008 E 8 7 2 1 13
M- Morning; E- Evening 0 Oktas - Clear Sky; 1-2 Oktas - Fine Sky; 3-5 Oktas- Partly Cloudy Sky; 6-7 Oktas-
Cloudy Sky; 8 Oktas – Overcast
Table 4.58 Frequency Of Cloud Cover In Oktas Observed In The Project Area During Winter
Season NUMBER OF DAYS WITH CLOUD COVER
MONTHS 0
(Oktas)
1-2
(Oktas)
3-5
(Oktas)
6-7
(Oktas)
8
(Oktas)
M 9 11 5 2 4 DECEMBER,
2007 E 8 9 10 2 2
M 30 0 1 0 0 JANUARY,
2008 E 27 0 3 0 1
M 25 1 2 - 1 FEBRUARY,
2008 E 25 3 1 - -
M- Morning; E- Evening 0 Oktas - Clear Sky; 1-2 Oktas - Fine Sky; 3-5 Oktas- Partly Cloudy Sky; 6-7 Oktas-
Cloudy Sky; 8 Oktas - Overcast
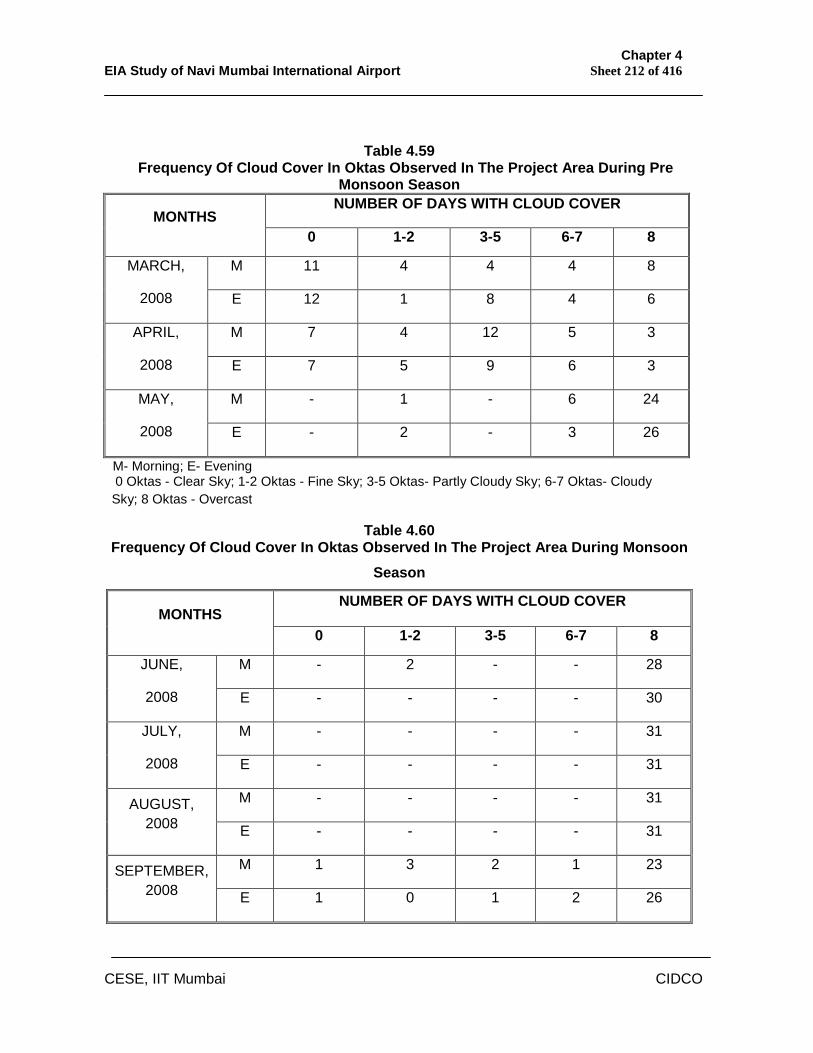
Chapter 4 EIA Study of Navi Mumbai International Airport Sheet 212 of 416
CESE, IIT Mumbai CIDCO
Table 4.59 Frequency Of Cloud Cover In Oktas Observed In The Project Area During Pre
Monsoon Season NUMBER OF DAYS WITH CLOUD COVER
MONTHS 0 1-2 3-5 6-7 8
M 11 4 4 4 8 MARCH,
2008 E 12 1 8 4 6
M 7 4 12 5 3 APRIL,
2008 E 7 5 9 6 3
M - 1 - 6 24 MAY,
2008 E - 2 - 3 26
M- Morning; E- Evening 0 Oktas - Clear Sky; 1-2 Oktas - Fine Sky; 3-5 Oktas- Partly Cloudy Sky; 6-7 Oktas- Cloudy Sky; 8 Oktas - Overcast
Table 4.60 Frequency Of Cloud Cover In Oktas Observed In The Project Area During Monsoon
Season
NUMBER OF DAYS WITH CLOUD COVER MONTHS
0 1-2 3-5 6-7 8
M - 2 - - 28 JUNE,
2008 E - - - - 30
M - - - - 31 JULY,
2008 E - - - - 31
M - - - - 31 AUGUST, 2008 E - - - - 31
M 1 3 2 1 23 SEPTEMBER, 2008 E 1 0 1 2 26
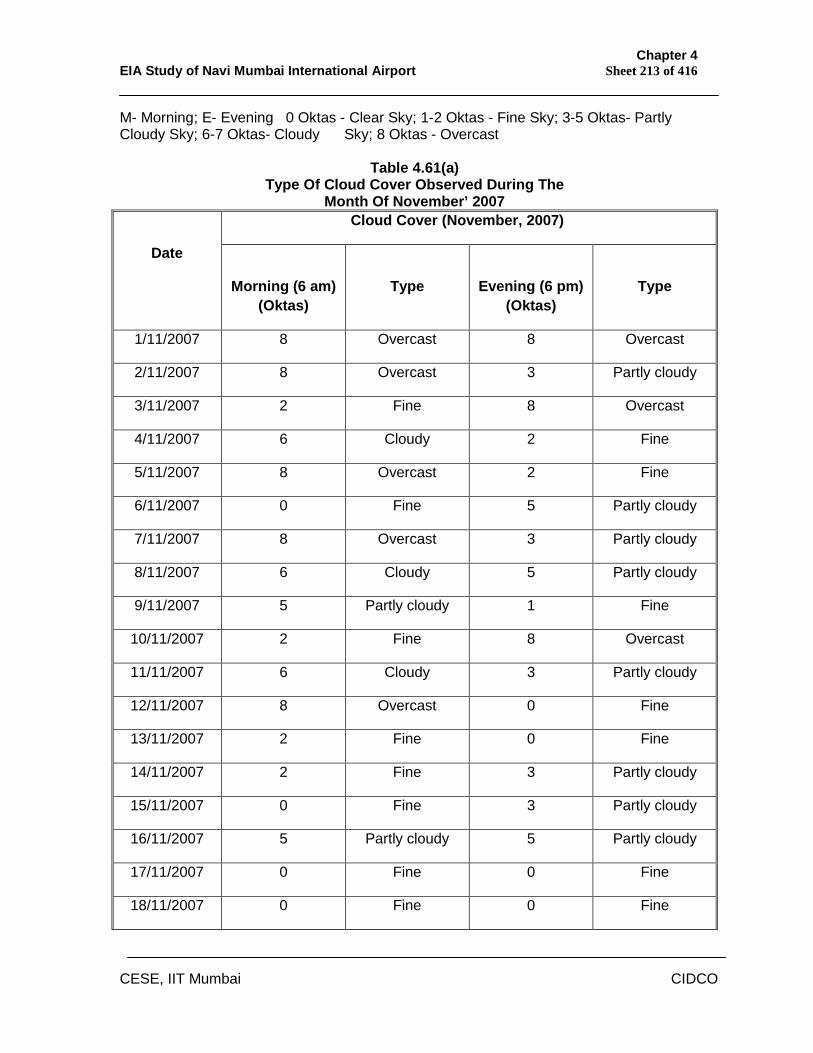
Chapter 4 EIA Study of Navi Mumbai International Airport Sheet 213 of 416
CESE, IIT Mumbai CIDCO
M- Morning; E- Evening 0 Oktas - Clear Sky; 1-2 Oktas - Fine Sky; 3-5 Oktas- Partly Cloudy Sky; 6-7 Oktas- Cloudy Sky; 8 Oktas - Overcast
Table 4.61(a)
Type Of Cloud Cover Observed During The Month Of November’ 2007
Cloud Cover (November, 2007)
Date
Morning (6 am) (Oktas)
Type
Evening (6 pm) (Oktas)
Type
1/11/2007 8 Overcast 8 Overcast
2/11/2007 8 Overcast 3 Partly cloudy
3/11/2007 2 Fine 8 Overcast
4/11/2007 6 Cloudy 2 Fine
5/11/2007 8 Overcast 2 Fine
6/11/2007 0 Fine 5 Partly cloudy
7/11/2007 8 Overcast 3 Partly cloudy
8/11/2007 6 Cloudy 5 Partly cloudy
9/11/2007 5 Partly cloudy 1 Fine
10/11/2007 2 Fine 8 Overcast
11/11/2007 6 Cloudy 3 Partly cloudy
12/11/2007 8 Overcast 0 Fine
13/11/2007 2 Fine 0 Fine
14/11/2007 2 Fine 3 Partly cloudy
15/11/2007 0 Fine 3 Partly cloudy
16/11/2007 5 Partly cloudy 5 Partly cloudy
17/11/2007 0 Fine 0 Fine
18/11/2007 0 Fine 0 Fine
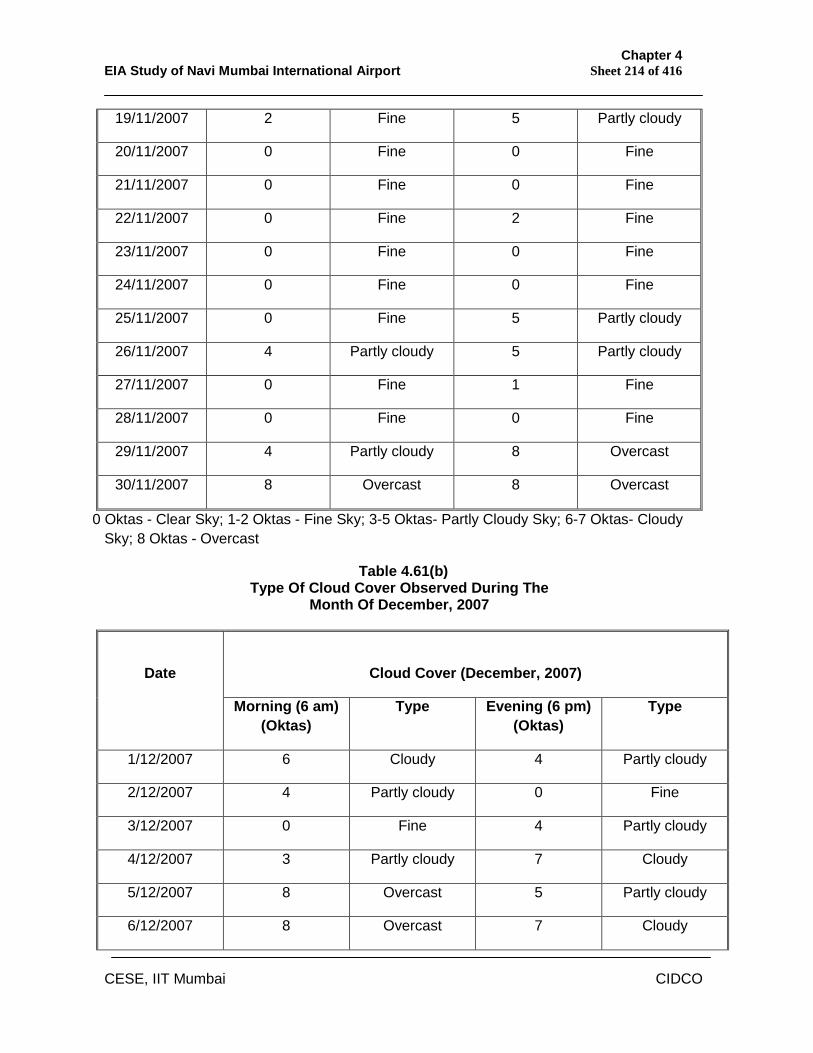
Chapter 4 EIA Study of Navi Mumbai International Airport Sheet 214 of 416
CESE, IIT Mumbai CIDCO
19/11/2007 2 Fine 5 Partly cloudy
20/11/2007 0 Fine 0 Fine
21/11/2007 0 Fine 0 Fine
22/11/2007 0 Fine 2 Fine
23/11/2007 0 Fine 0 Fine
24/11/2007 0 Fine 0 Fine
25/11/2007 0 Fine 5 Partly cloudy
26/11/2007 4 Partly cloudy 5 Partly cloudy
27/11/2007 0 Fine 1 Fine
28/11/2007 0 Fine 0 Fine
29/11/2007 4 Partly cloudy 8 Overcast
30/11/2007 8 Overcast 8 Overcast
0 Oktas - Clear Sky; 1-2 Oktas - Fine Sky; 3-5 Oktas- Partly Cloudy Sky; 6-7 Oktas- Cloudy Sky; 8 Oktas - Overcast
Table 4.61(b) Type Of Cloud Cover Observed During The
Month Of December, 2007
Cloud Cover (December, 2007)
Date
Morning (6 am) (Oktas)
Type Evening (6 pm) (Oktas)
Type
1/12/2007 6 Cloudy 4 Partly cloudy
2/12/2007 4 Partly cloudy 0 Fine
3/12/2007 0 Fine 4 Partly cloudy
4/12/2007 3 Partly cloudy 7 Cloudy
5/12/2007 8 Overcast 5 Partly cloudy
6/12/2007 8 Overcast 7 Cloudy
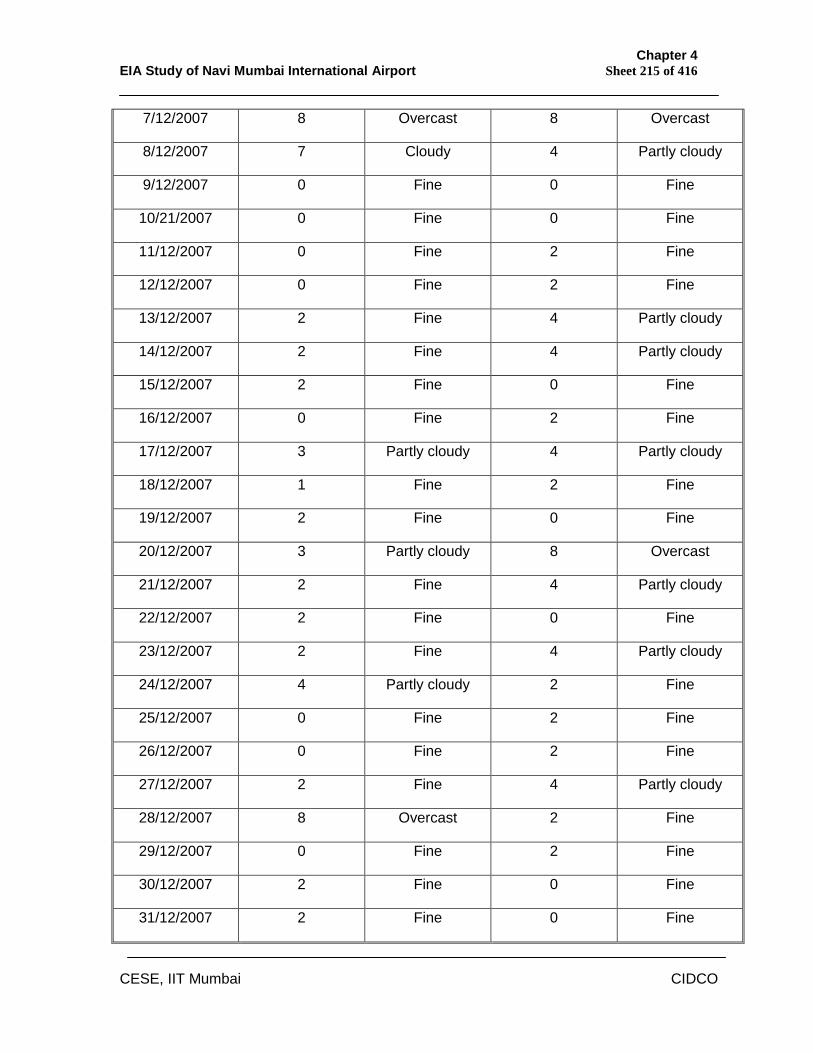
Chapter 4 EIA Study of Navi Mumbai International Airport Sheet 215 of 416
CESE, IIT Mumbai CIDCO
7/12/2007 8 Overcast 8 Overcast
8/12/2007 7 Cloudy 4 Partly cloudy
9/12/2007 0 Fine 0 Fine
10/21/2007 0 Fine 0 Fine
11/12/2007 0 Fine 2 Fine
12/12/2007 0 Fine 2 Fine
13/12/2007 2 Fine 4 Partly cloudy
14/12/2007 2 Fine 4 Partly cloudy
15/12/2007 2 Fine 0 Fine
16/12/2007 0 Fine 2 Fine
17/12/2007 3 Partly cloudy 4 Partly cloudy
18/12/2007 1 Fine 2 Fine
19/12/2007 2 Fine 0 Fine
20/12/2007 3 Partly cloudy 8 Overcast
21/12/2007 2 Fine 4 Partly cloudy
22/12/2007 2 Fine 0 Fine
23/12/2007 2 Fine 4 Partly cloudy
24/12/2007 4 Partly cloudy 2 Fine
25/12/2007 0 Fine 2 Fine
26/12/2007 0 Fine 2 Fine
27/12/2007 2 Fine 4 Partly cloudy
28/12/2007 8 Overcast 2 Fine
29/12/2007 0 Fine 2 Fine
30/12/2007 2 Fine 0 Fine
31/12/2007 2 Fine 0 Fine
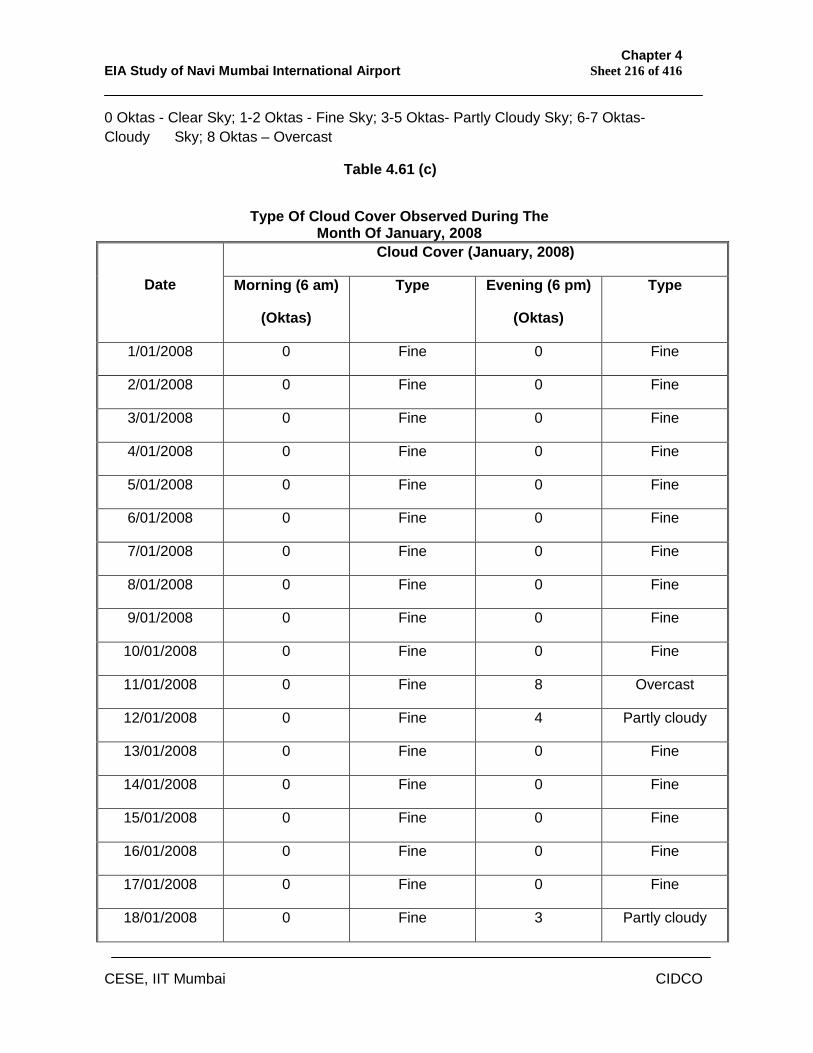
Chapter 4 EIA Study of Navi Mumbai International Airport Sheet 216 of 416
CESE, IIT Mumbai CIDCO
0 Oktas - Clear Sky; 1-2 Oktas - Fine Sky; 3-5 Oktas- Partly Cloudy Sky; 6-7 Oktas- Cloudy Sky; 8 Oktas – Overcast
Table 4.61 (c)
Type Of Cloud Cover Observed During The
Month Of January, 2008 Cloud Cover (January, 2008)
Date Morning (6 am)
(Oktas)
Type Evening (6 pm)
(Oktas)
Type
1/01/2008 0 Fine 0 Fine
2/01/2008 0 Fine 0 Fine
3/01/2008 0 Fine 0 Fine
4/01/2008 0 Fine 0 Fine
5/01/2008 0 Fine 0 Fine
6/01/2008 0 Fine 0 Fine
7/01/2008 0 Fine 0 Fine
8/01/2008 0 Fine 0 Fine
9/01/2008 0 Fine 0 Fine
10/01/2008 0 Fine 0 Fine
11/01/2008 0 Fine 8 Overcast
12/01/2008 0 Fine 4 Partly cloudy
13/01/2008 0 Fine 0 Fine
14/01/2008 0 Fine 0 Fine
15/01/2008 0 Fine 0 Fine
16/01/2008 0 Fine 0 Fine
17/01/2008 0 Fine 0 Fine
18/01/2008 0 Fine 3 Partly cloudy
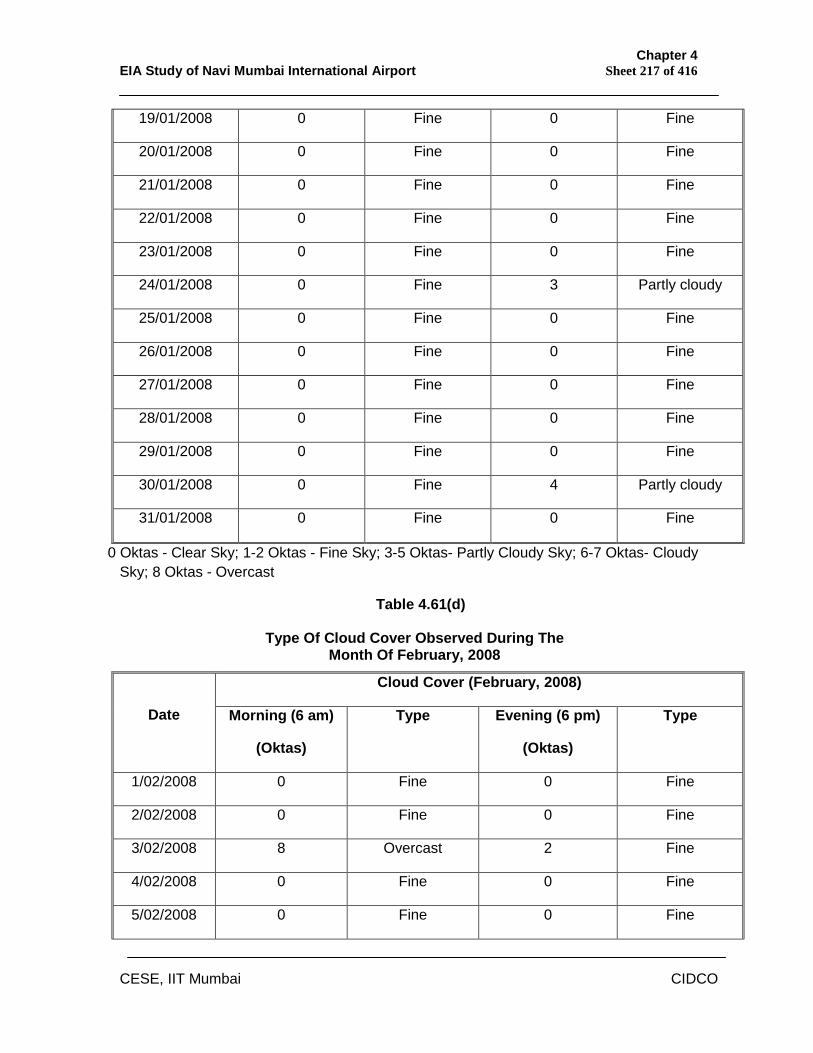
Chapter 4 EIA Study of Navi Mumbai International Airport Sheet 217 of 416
CESE, IIT Mumbai CIDCO
19/01/2008 0 Fine 0 Fine
20/01/2008 0 Fine 0 Fine
21/01/2008 0 Fine 0 Fine
22/01/2008 0 Fine 0 Fine
23/01/2008 0 Fine 0 Fine
24/01/2008 0 Fine 3 Partly cloudy
25/01/2008 0 Fine 0 Fine
26/01/2008 0 Fine 0 Fine
27/01/2008 0 Fine 0 Fine
28/01/2008 0 Fine 0 Fine
29/01/2008 0 Fine 0 Fine
30/01/2008 0 Fine 4 Partly cloudy
31/01/2008 0 Fine 0 Fine
0 Oktas - Clear Sky; 1-2 Oktas - Fine Sky; 3-5 Oktas- Partly Cloudy Sky; 6-7 Oktas- Cloudy Sky; 8 Oktas - Overcast
Table 4.61(d)
Type Of Cloud Cover Observed During The Month Of February, 2008
Cloud Cover (February, 2008)
Date Morning (6 am)
(Oktas)
Type Evening (6 pm)
(Oktas)
Type
1/02/2008 0 Fine 0 Fine
2/02/2008 0 Fine 0 Fine
3/02/2008 8 Overcast 2 Fine
4/02/2008 0 Fine 0 Fine
5/02/2008 0 Fine 0 Fine
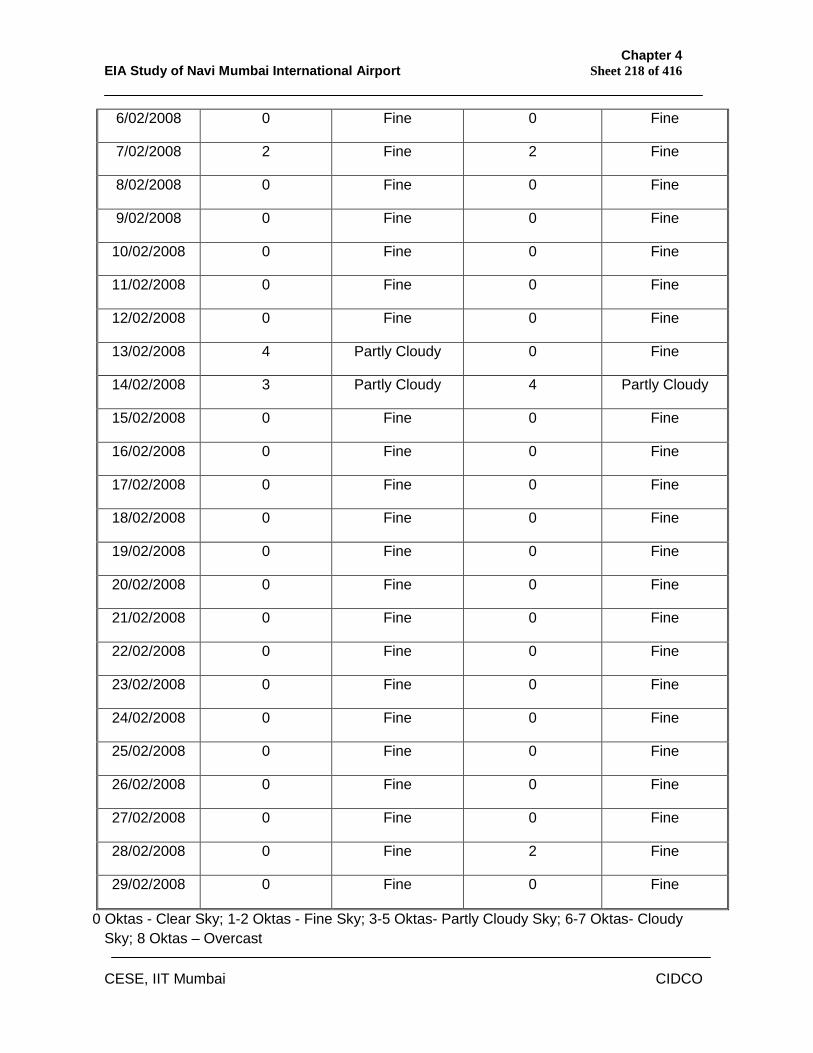
Chapter 4 EIA Study of Navi Mumbai International Airport Sheet 218 of 416
CESE, IIT Mumbai CIDCO
6/02/2008 0 Fine 0 Fine
7/02/2008 2 Fine 2 Fine
8/02/2008 0 Fine 0 Fine
9/02/2008 0 Fine 0 Fine
10/02/2008 0 Fine 0 Fine
11/02/2008 0 Fine 0 Fine
12/02/2008 0 Fine 0 Fine
13/02/2008 4 Partly Cloudy 0 Fine
14/02/2008 3 Partly Cloudy 4 Partly Cloudy
15/02/2008 0 Fine 0 Fine
16/02/2008 0 Fine 0 Fine
17/02/2008 0 Fine 0 Fine
18/02/2008 0 Fine 0 Fine
19/02/2008 0 Fine 0 Fine
20/02/2008 0 Fine 0 Fine
21/02/2008 0 Fine 0 Fine
22/02/2008 0 Fine 0 Fine
23/02/2008 0 Fine 0 Fine
24/02/2008 0 Fine 0 Fine
25/02/2008 0 Fine 0 Fine
26/02/2008 0 Fine 0 Fine
27/02/2008 0 Fine 0 Fine
28/02/2008 0 Fine 2 Fine
29/02/2008 0 Fine 0 Fine
0 Oktas - Clear Sky; 1-2 Oktas - Fine Sky; 3-5 Oktas- Partly Cloudy Sky; 6-7 Oktas- Cloudy Sky; 8 Oktas – Overcast
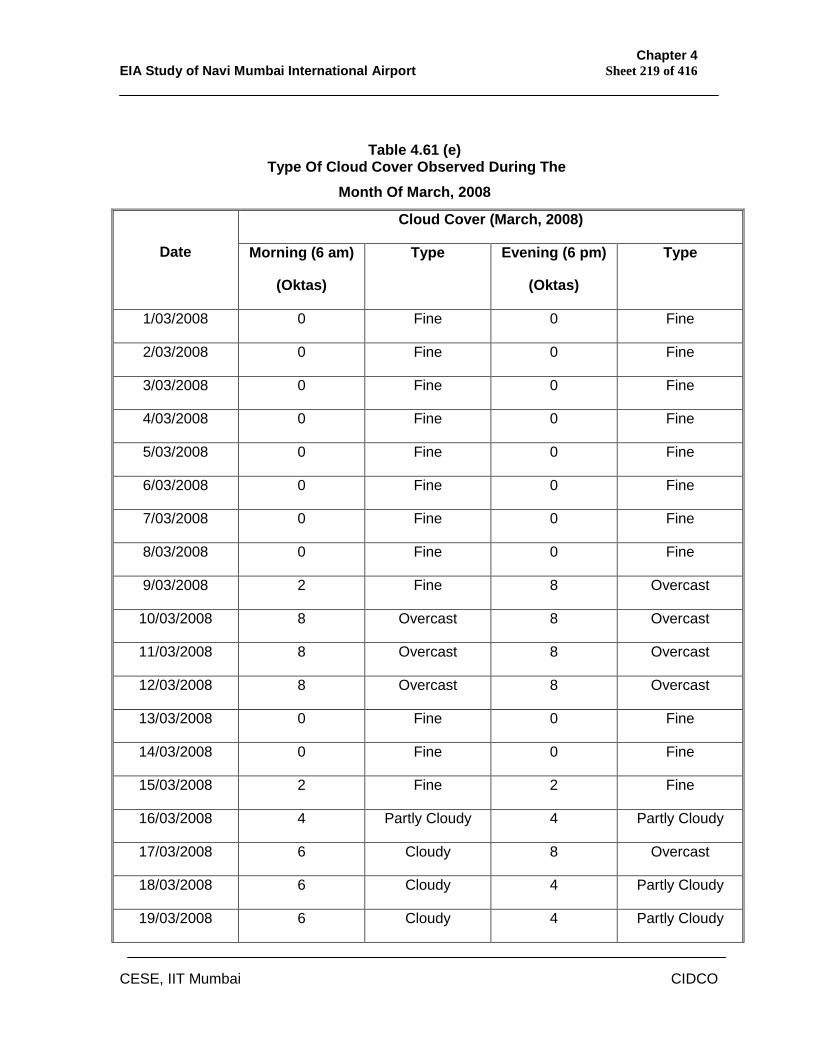
Chapter 4 EIA Study of Navi Mumbai International Airport Sheet 219 of 416
CESE, IIT Mumbai CIDCO
Table 4.61 (e) Type Of Cloud Cover Observed During The
Month Of March, 2008
Cloud Cover (March, 2008)
Date Morning (6 am)
(Oktas)
Type Evening (6 pm)
(Oktas)
Type
1/03/2008 0 Fine 0 Fine
2/03/2008 0 Fine 0 Fine
3/03/2008 0 Fine 0 Fine
4/03/2008 0 Fine 0 Fine
5/03/2008 0 Fine 0 Fine
6/03/2008 0 Fine 0 Fine
7/03/2008 0 Fine 0 Fine
8/03/2008 0 Fine 0 Fine
9/03/2008 2 Fine 8 Overcast
10/03/2008 8 Overcast 8 Overcast
11/03/2008 8 Overcast 8 Overcast
12/03/2008 8 Overcast 8 Overcast
13/03/2008 0 Fine 0 Fine
14/03/2008 0 Fine 0 Fine
15/03/2008 2 Fine 2 Fine
16/03/2008 4 Partly Cloudy 4 Partly Cloudy
17/03/2008 6 Cloudy 8 Overcast
18/03/2008 6 Cloudy 4 Partly Cloudy
19/03/2008 6 Cloudy 4 Partly Cloudy
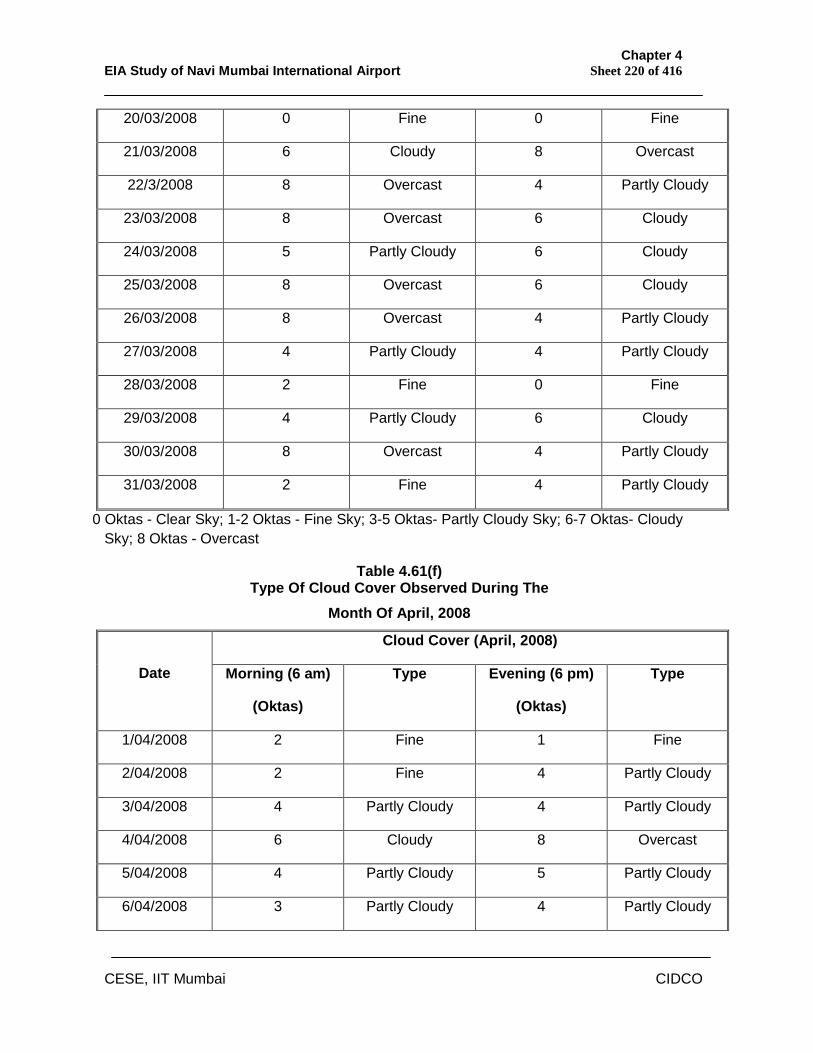
Chapter 4 EIA Study of Navi Mumbai International Airport Sheet 220 of 416
CESE, IIT Mumbai CIDCO
20/03/2008 0 Fine 0 Fine
21/03/2008 6 Cloudy 8 Overcast
22/3/2008 8 Overcast 4 Partly Cloudy
23/03/2008 8 Overcast 6 Cloudy
24/03/2008 5 Partly Cloudy 6 Cloudy
25/03/2008 8 Overcast 6 Cloudy
26/03/2008 8 Overcast 4 Partly Cloudy
27/03/2008 4 Partly Cloudy 4 Partly Cloudy
28/03/2008 2 Fine 0 Fine
29/03/2008 4 Partly Cloudy 6 Cloudy
30/03/2008 8 Overcast 4 Partly Cloudy
31/03/2008 2 Fine 4 Partly Cloudy
0 Oktas - Clear Sky; 1-2 Oktas - Fine Sky; 3-5 Oktas- Partly Cloudy Sky; 6-7 Oktas- Cloudy Sky; 8 Oktas - Overcast
Table 4.61(f) Type Of Cloud Cover Observed During The
Month Of April, 2008
Cloud Cover (April, 2008)
Date Morning (6 am)
(Oktas)
Type Evening (6 pm)
(Oktas)
Type
1/04/2008 2 Fine 1 Fine
2/04/2008 2 Fine 4 Partly Cloudy
3/04/2008 4 Partly Cloudy 4 Partly Cloudy
4/04/2008 6 Cloudy 8 Overcast
5/04/2008 4 Partly Cloudy 5 Partly Cloudy
6/04/2008 3 Partly Cloudy 4 Partly Cloudy
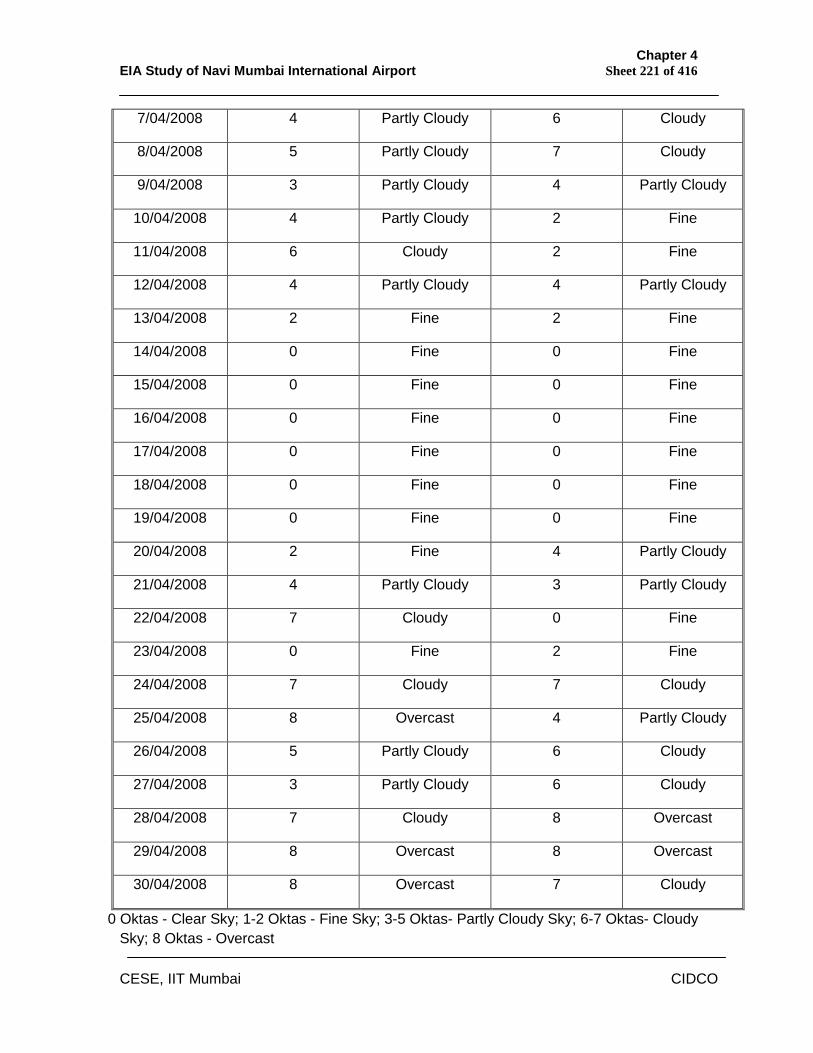
Chapter 4 EIA Study of Navi Mumbai International Airport Sheet 221 of 416
CESE, IIT Mumbai CIDCO
7/04/2008 4 Partly Cloudy 6 Cloudy
8/04/2008 5 Partly Cloudy 7 Cloudy
9/04/2008 3 Partly Cloudy 4 Partly Cloudy
10/04/2008 4 Partly Cloudy 2 Fine
11/04/2008 6 Cloudy 2 Fine
12/04/2008 4 Partly Cloudy 4 Partly Cloudy
13/04/2008 2 Fine 2 Fine
14/04/2008 0 Fine 0 Fine
15/04/2008 0 Fine 0 Fine
16/04/2008 0 Fine 0 Fine
17/04/2008 0 Fine 0 Fine
18/04/2008 0 Fine 0 Fine
19/04/2008 0 Fine 0 Fine
20/04/2008 2 Fine 4 Partly Cloudy
21/04/2008 4 Partly Cloudy 3 Partly Cloudy
22/04/2008 7 Cloudy 0 Fine
23/04/2008 0 Fine 2 Fine
24/04/2008 7 Cloudy 7 Cloudy
25/04/2008 8 Overcast 4 Partly Cloudy
26/04/2008 5 Partly Cloudy 6 Cloudy
27/04/2008 3 Partly Cloudy 6 Cloudy
28/04/2008 7 Cloudy 8 Overcast
29/04/2008 8 Overcast 8 Overcast
30/04/2008 8 Overcast 7 Cloudy
0 Oktas - Clear Sky; 1-2 Oktas - Fine Sky; 3-5 Oktas- Partly Cloudy Sky; 6-7 Oktas- Cloudy Sky; 8 Oktas - Overcast
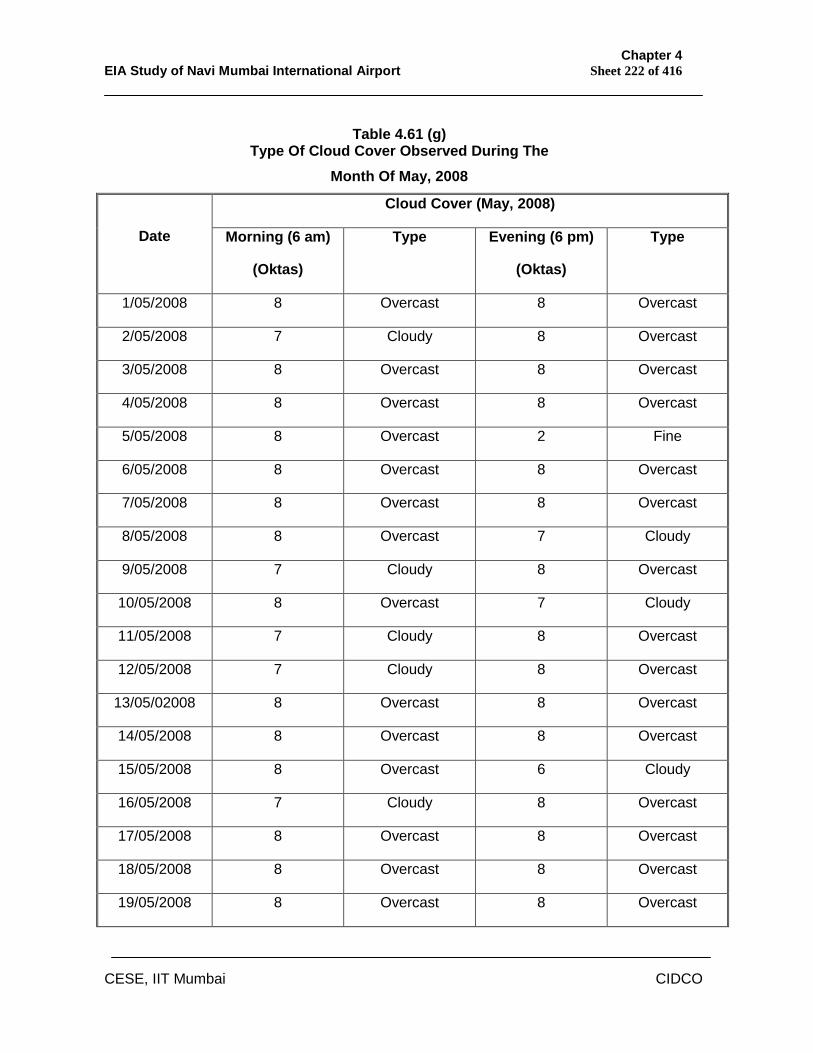
Chapter 4 EIA Study of Navi Mumbai International Airport Sheet 222 of 416
CESE, IIT Mumbai CIDCO
Table 4.61 (g)
Type Of Cloud Cover Observed During The Month Of May, 2008
Cloud Cover (May, 2008)
Date Morning (6 am)
(Oktas)
Type Evening (6 pm)
(Oktas)
Type
1/05/2008 8 Overcast 8 Overcast
2/05/2008 7 Cloudy 8 Overcast
3/05/2008 8 Overcast 8 Overcast
4/05/2008 8 Overcast 8 Overcast
5/05/2008 8 Overcast 2 Fine
6/05/2008 8 Overcast 8 Overcast
7/05/2008 8 Overcast 8 Overcast
8/05/2008 8 Overcast 7 Cloudy
9/05/2008 7 Cloudy 8 Overcast
10/05/2008 8 Overcast 7 Cloudy
11/05/2008 7 Cloudy 8 Overcast
12/05/2008 7 Cloudy 8 Overcast
13/05/02008 8 Overcast 8 Overcast
14/05/2008 8 Overcast 8 Overcast
15/05/2008 8 Overcast 6 Cloudy
16/05/2008 7 Cloudy 8 Overcast
17/05/2008 8 Overcast 8 Overcast
18/05/2008 8 Overcast 8 Overcast
19/05/2008 8 Overcast 8 Overcast
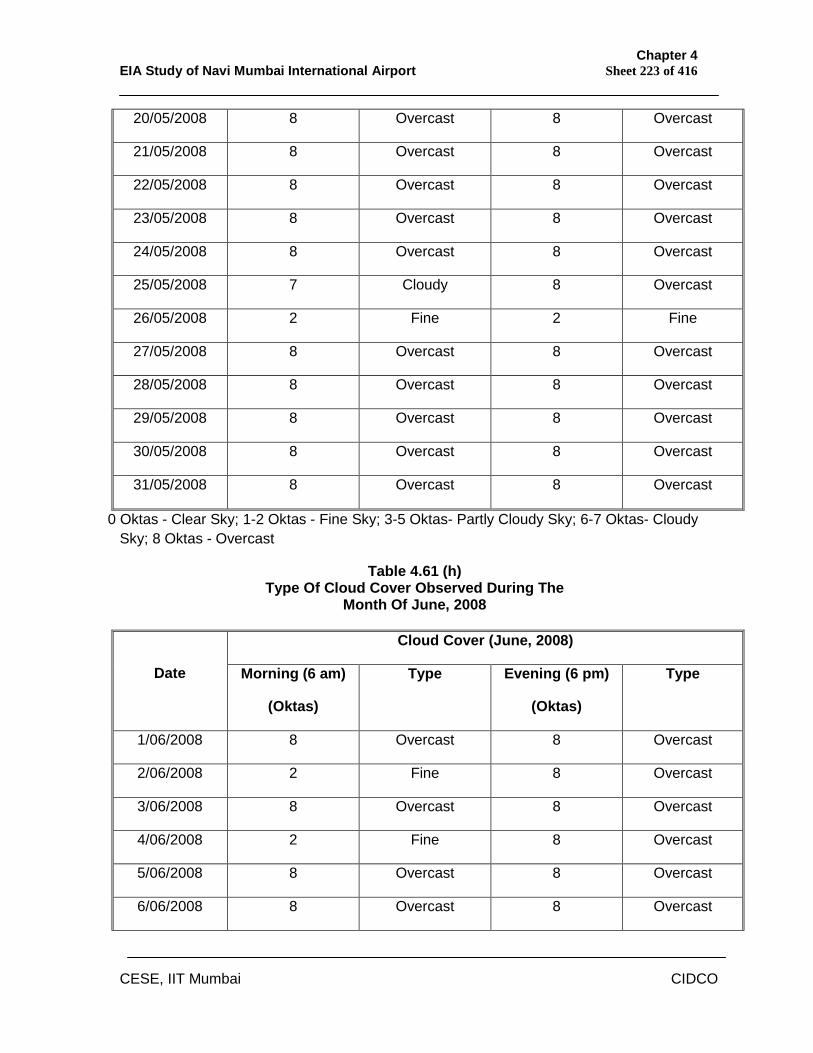
Chapter 4 EIA Study of Navi Mumbai International Airport Sheet 223 of 416
CESE, IIT Mumbai CIDCO
20/05/2008 8 Overcast 8 Overcast
21/05/2008 8 Overcast 8 Overcast
22/05/2008 8 Overcast 8 Overcast
23/05/2008 8 Overcast 8 Overcast
24/05/2008 8 Overcast 8 Overcast
25/05/2008 7 Cloudy 8 Overcast
26/05/2008 2 Fine 2 Fine
27/05/2008 8 Overcast 8 Overcast
28/05/2008 8 Overcast 8 Overcast
29/05/2008 8 Overcast 8 Overcast
30/05/2008 8 Overcast 8 Overcast
31/05/2008 8 Overcast 8 Overcast
0 Oktas - Clear Sky; 1-2 Oktas - Fine Sky; 3-5 Oktas- Partly Cloudy Sky; 6-7 Oktas- Cloudy Sky; 8 Oktas - Overcast
Table 4.61 (h) Type Of Cloud Cover Observed During The
Month Of June, 2008
Cloud Cover (June, 2008)
Date Morning (6 am)
(Oktas)
Type Evening (6 pm)
(Oktas)
Type
1/06/2008 8 Overcast 8 Overcast
2/06/2008 2 Fine 8 Overcast
3/06/2008 8 Overcast 8 Overcast
4/06/2008 2 Fine 8 Overcast
5/06/2008 8 Overcast 8 Overcast
6/06/2008 8 Overcast 8 Overcast
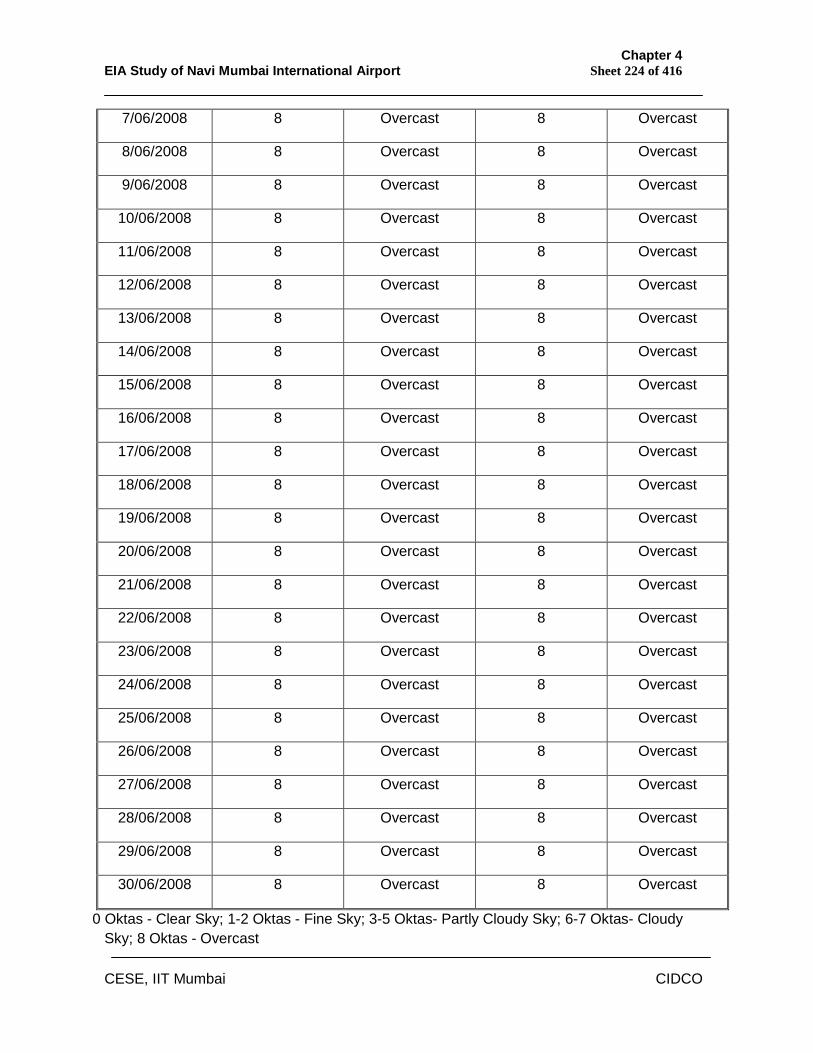
Chapter 4 EIA Study of Navi Mumbai International Airport Sheet 224 of 416
CESE, IIT Mumbai CIDCO
7/06/2008 8 Overcast 8 Overcast
8/06/2008 8 Overcast 8 Overcast
9/06/2008 8 Overcast 8 Overcast
10/06/2008 8 Overcast 8 Overcast
11/06/2008 8 Overcast 8 Overcast
12/06/2008 8 Overcast 8 Overcast
13/06/2008 8 Overcast 8 Overcast
14/06/2008 8 Overcast 8 Overcast
15/06/2008 8 Overcast 8 Overcast
16/06/2008 8 Overcast 8 Overcast
17/06/2008 8 Overcast 8 Overcast
18/06/2008 8 Overcast 8 Overcast
19/06/2008 8 Overcast 8 Overcast
20/06/2008 8 Overcast 8 Overcast
21/06/2008 8 Overcast 8 Overcast
22/06/2008 8 Overcast 8 Overcast
23/06/2008 8 Overcast 8 Overcast
24/06/2008 8 Overcast 8 Overcast
25/06/2008 8 Overcast 8 Overcast
26/06/2008 8 Overcast 8 Overcast
27/06/2008 8 Overcast 8 Overcast
28/06/2008 8 Overcast 8 Overcast
29/06/2008 8 Overcast 8 Overcast
30/06/2008 8 Overcast 8 Overcast
0 Oktas - Clear Sky; 1-2 Oktas - Fine Sky; 3-5 Oktas- Partly Cloudy Sky; 6-7 Oktas- Cloudy Sky; 8 Oktas - Overcast
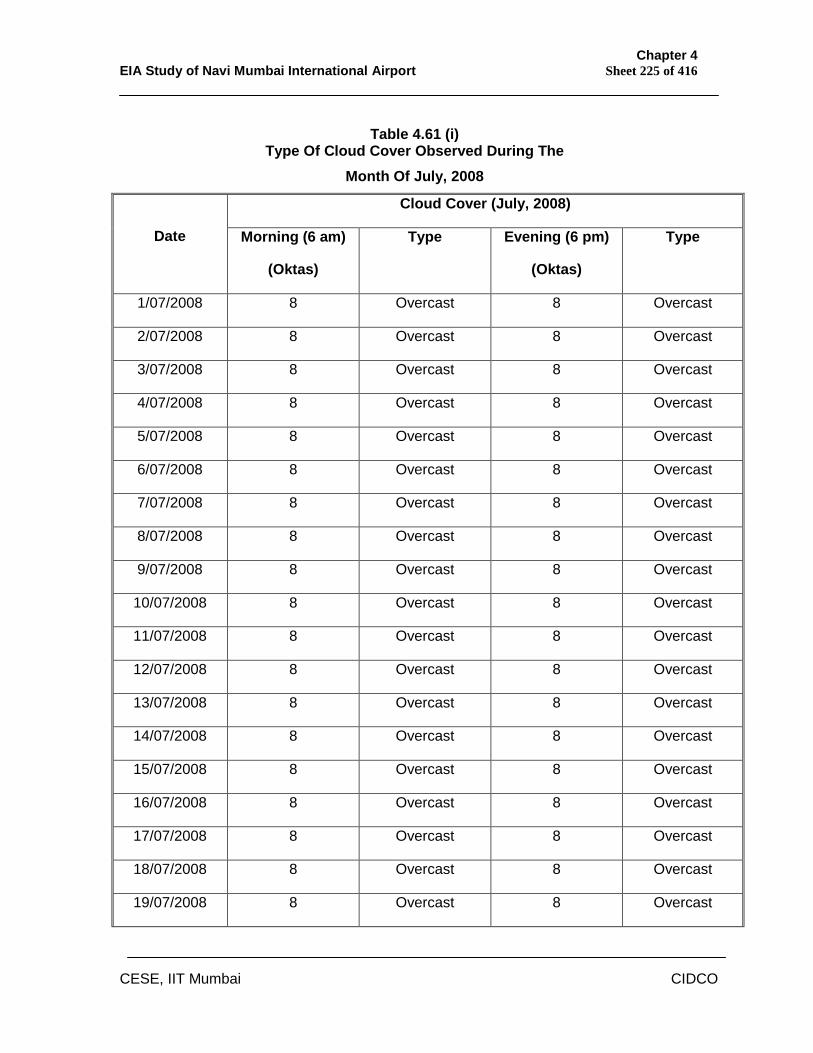
Chapter 4 EIA Study of Navi Mumbai International Airport Sheet 225 of 416
CESE, IIT Mumbai CIDCO
Table 4.61 (i)
Type Of Cloud Cover Observed During The Month Of July, 2008
Cloud Cover (July, 2008)
Date Morning (6 am)
(Oktas)
Type Evening (6 pm)
(Oktas)
Type
1/07/2008 8 Overcast 8 Overcast
2/07/2008 8 Overcast 8 Overcast
3/07/2008 8 Overcast 8 Overcast
4/07/2008 8 Overcast 8 Overcast
5/07/2008 8 Overcast 8 Overcast
6/07/2008 8 Overcast 8 Overcast
7/07/2008 8 Overcast 8 Overcast
8/07/2008 8 Overcast 8 Overcast
9/07/2008 8 Overcast 8 Overcast
10/07/2008 8 Overcast 8 Overcast
11/07/2008 8 Overcast 8 Overcast
12/07/2008 8 Overcast 8 Overcast
13/07/2008 8 Overcast 8 Overcast
14/07/2008 8 Overcast 8 Overcast
15/07/2008 8 Overcast 8 Overcast
16/07/2008 8 Overcast 8 Overcast
17/07/2008 8 Overcast 8 Overcast
18/07/2008 8 Overcast 8 Overcast
19/07/2008 8 Overcast 8 Overcast
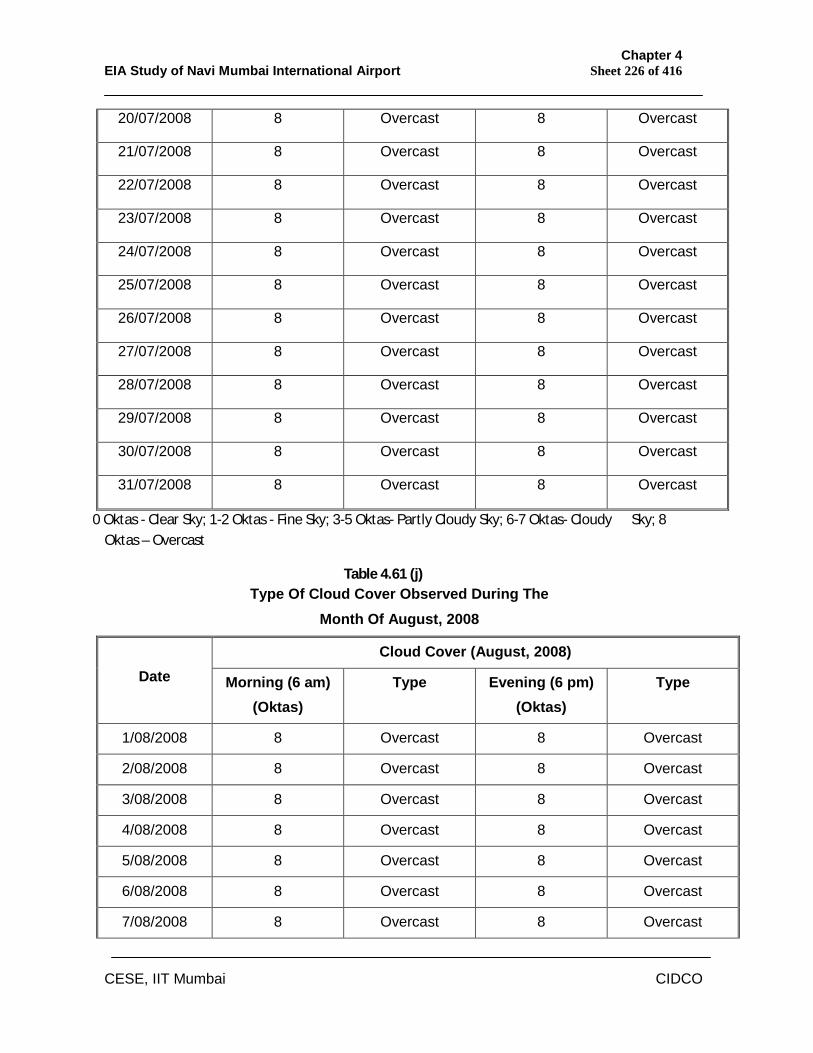
Chapter 4 EIA Study of Navi Mumbai International Airport Sheet 226 of 416
CESE, IIT Mumbai CIDCO
20/07/2008 8 Overcast 8 Overcast
21/07/2008 8 Overcast 8 Overcast
22/07/2008 8 Overcast 8 Overcast
23/07/2008 8 Overcast 8 Overcast
24/07/2008 8 Overcast 8 Overcast
25/07/2008 8 Overcast 8 Overcast
26/07/2008 8 Overcast 8 Overcast
27/07/2008 8 Overcast 8 Overcast
28/07/2008 8 Overcast 8 Overcast
29/07/2008 8 Overcast 8 Overcast
30/07/2008 8 Overcast 8 Overcast
31/07/2008 8 Overcast 8 Overcast
0 Oktas - Clear Sky; 1-2 Oktas - Fine Sky; 3-5 Oktas- Partly Cloudy Sky; 6-7 Oktas- Cloudy Sky; 8 Oktas – Overcast
Table 4.61 (j) Type Of Cloud Cover Observed During The
Month Of August, 2008
Cloud Cover (August, 2008) Date Morning (6 am)
(Oktas) Type Evening (6 pm)
(Oktas) Type
1/08/2008 8 Overcast 8 Overcast
2/08/2008 8 Overcast 8 Overcast
3/08/2008 8 Overcast 8 Overcast
4/08/2008 8 Overcast 8 Overcast
5/08/2008 8 Overcast 8 Overcast
6/08/2008 8 Overcast 8 Overcast
7/08/2008 8 Overcast 8 Overcast
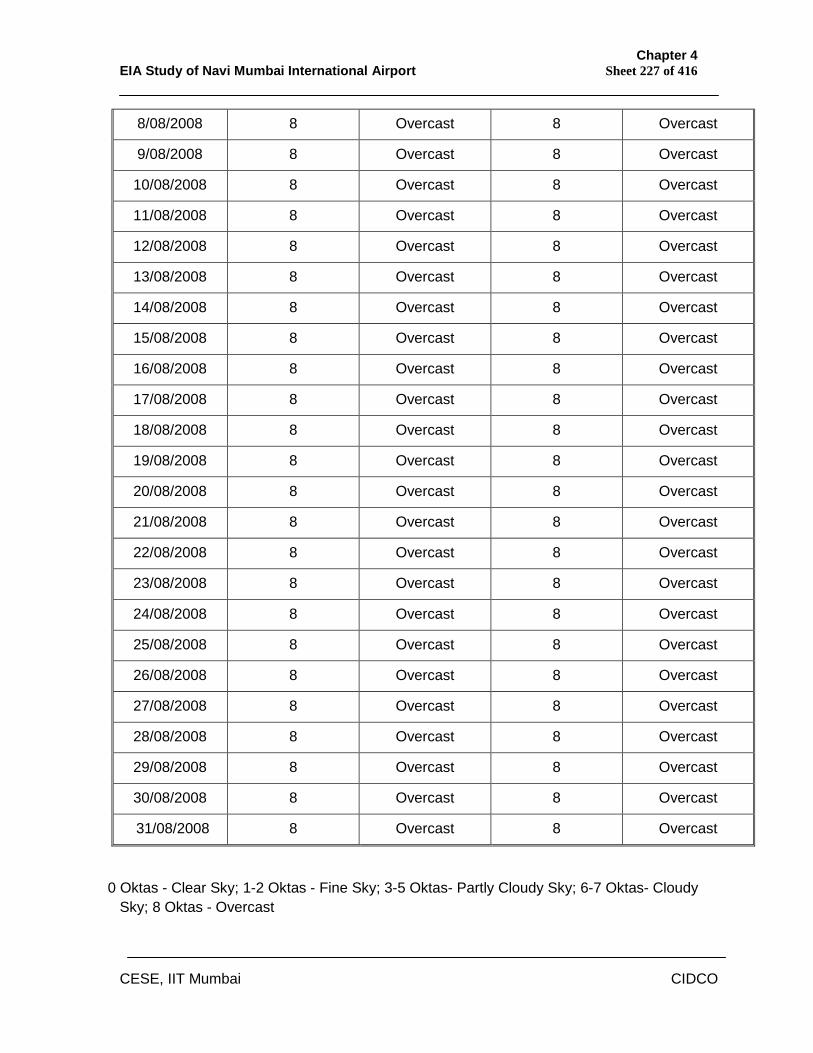
Chapter 4 EIA Study of Navi Mumbai International Airport Sheet 227 of 416
CESE, IIT Mumbai CIDCO
8/08/2008 8 Overcast 8 Overcast
9/08/2008 8 Overcast 8 Overcast
10/08/2008 8 Overcast 8 Overcast
11/08/2008 8 Overcast 8 Overcast
12/08/2008 8 Overcast 8 Overcast
13/08/2008 8 Overcast 8 Overcast
14/08/2008 8 Overcast 8 Overcast
15/08/2008 8 Overcast 8 Overcast
16/08/2008 8 Overcast 8 Overcast
17/08/2008 8 Overcast 8 Overcast
18/08/2008 8 Overcast 8 Overcast
19/08/2008 8 Overcast 8 Overcast
20/08/2008 8 Overcast 8 Overcast
21/08/2008 8 Overcast 8 Overcast
22/08/2008 8 Overcast 8 Overcast
23/08/2008 8 Overcast 8 Overcast
24/08/2008 8 Overcast 8 Overcast
25/08/2008 8 Overcast 8 Overcast
26/08/2008 8 Overcast 8 Overcast
27/08/2008 8 Overcast 8 Overcast
28/08/2008 8 Overcast 8 Overcast
29/08/2008 8 Overcast 8 Overcast
30/08/2008 8 Overcast 8 Overcast
31/08/2008 8 Overcast 8 Overcast
0 Oktas - Clear Sky; 1-2 Oktas - Fine Sky; 3-5 Oktas- Partly Cloudy Sky; 6-7 Oktas- Cloudy Sky; 8 Oktas - Overcast
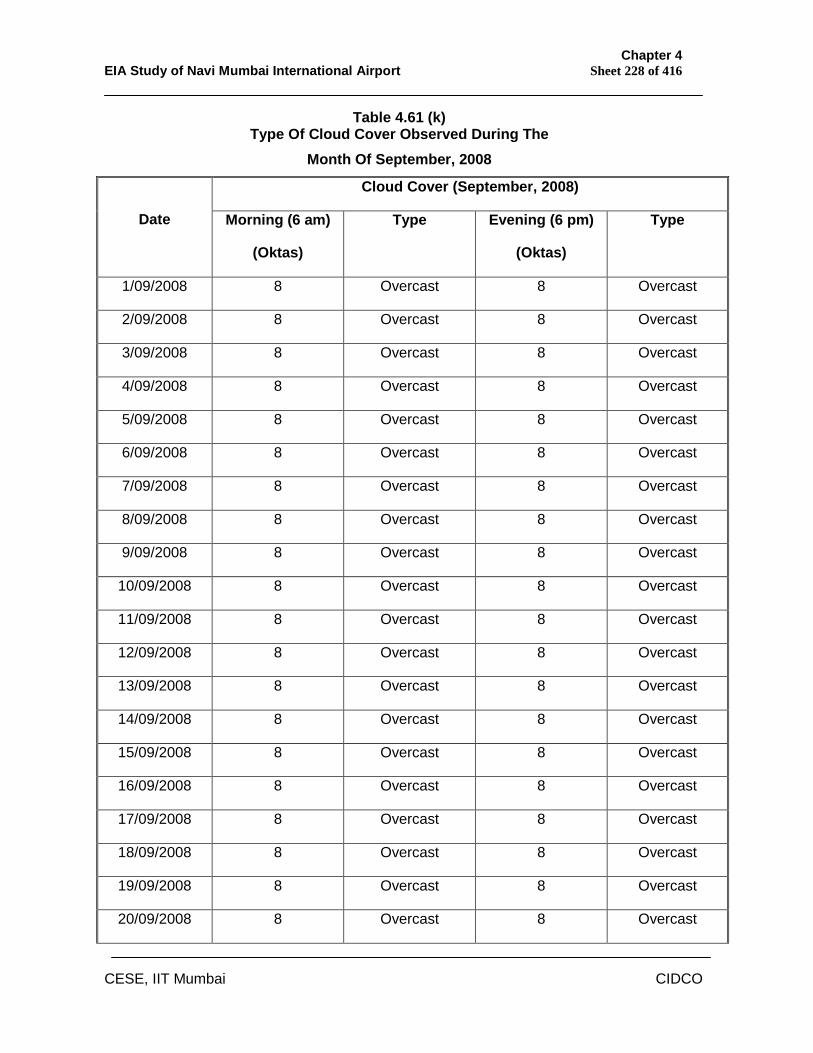
Chapter 4 EIA Study of Navi Mumbai International Airport Sheet 228 of 416
CESE, IIT Mumbai CIDCO
Table 4.61 (k) Type Of Cloud Cover Observed During The
Month Of September, 2008
Cloud Cover (September, 2008)
Date Morning (6 am)
(Oktas)
Type Evening (6 pm)
(Oktas)
Type
1/09/2008 8 Overcast 8 Overcast
2/09/2008 8 Overcast 8 Overcast
3/09/2008 8 Overcast 8 Overcast
4/09/2008 8 Overcast 8 Overcast
5/09/2008 8 Overcast 8 Overcast
6/09/2008 8 Overcast 8 Overcast
7/09/2008 8 Overcast 8 Overcast
8/09/2008 8 Overcast 8 Overcast
9/09/2008 8 Overcast 8 Overcast
10/09/2008 8 Overcast 8 Overcast
11/09/2008 8 Overcast 8 Overcast
12/09/2008 8 Overcast 8 Overcast
13/09/2008 8 Overcast 8 Overcast
14/09/2008 8 Overcast 8 Overcast
15/09/2008 8 Overcast 8 Overcast
16/09/2008 8 Overcast 8 Overcast
17/09/2008 8 Overcast 8 Overcast
18/09/2008 8 Overcast 8 Overcast
19/09/2008 8 Overcast 8 Overcast
20/09/2008 8 Overcast 8 Overcast
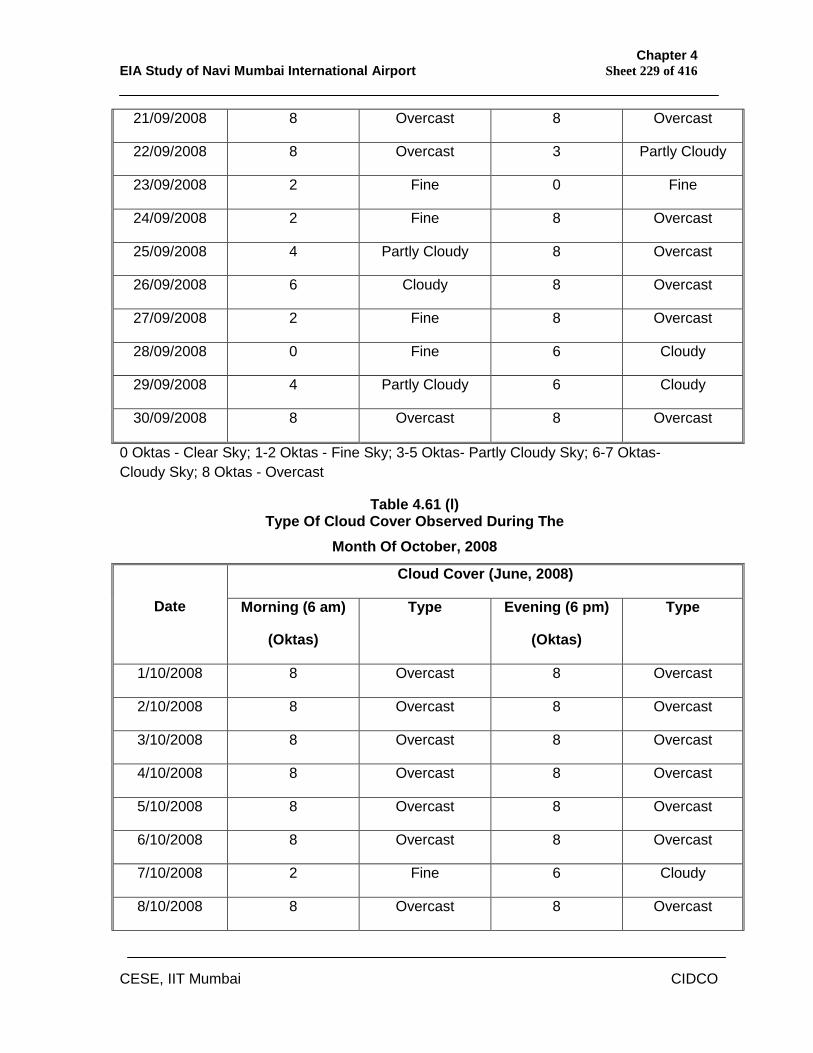
Chapter 4 EIA Study of Navi Mumbai International Airport Sheet 229 of 416
CESE, IIT Mumbai CIDCO
21/09/2008 8 Overcast 8 Overcast
22/09/2008 8 Overcast 3 Partly Cloudy
23/09/2008 2 Fine 0 Fine
24/09/2008 2 Fine 8 Overcast
25/09/2008 4 Partly Cloudy 8 Overcast
26/09/2008 6 Cloudy 8 Overcast
27/09/2008 2 Fine 8 Overcast
28/09/2008 0 Fine 6 Cloudy
29/09/2008 4 Partly Cloudy 6 Cloudy
30/09/2008 8 Overcast 8 Overcast
0 Oktas - Clear Sky; 1-2 Oktas - Fine Sky; 3-5 Oktas- Partly Cloudy Sky; 6-7 Oktas- Cloudy Sky; 8 Oktas - Overcast
Table 4.61 (l) Type Of Cloud Cover Observed During The
Month Of October, 2008
Cloud Cover (June, 2008)
Date Morning (6 am)
(Oktas)
Type Evening (6 pm)
(Oktas)
Type
1/10/2008 8 Overcast 8 Overcast
2/10/2008 8 Overcast 8 Overcast
3/10/2008 8 Overcast 8 Overcast
4/10/2008 8 Overcast 8 Overcast
5/10/2008 8 Overcast 8 Overcast
6/10/2008 8 Overcast 8 Overcast
7/10/2008 2 Fine 6 Cloudy
8/10/2008 8 Overcast 8 Overcast
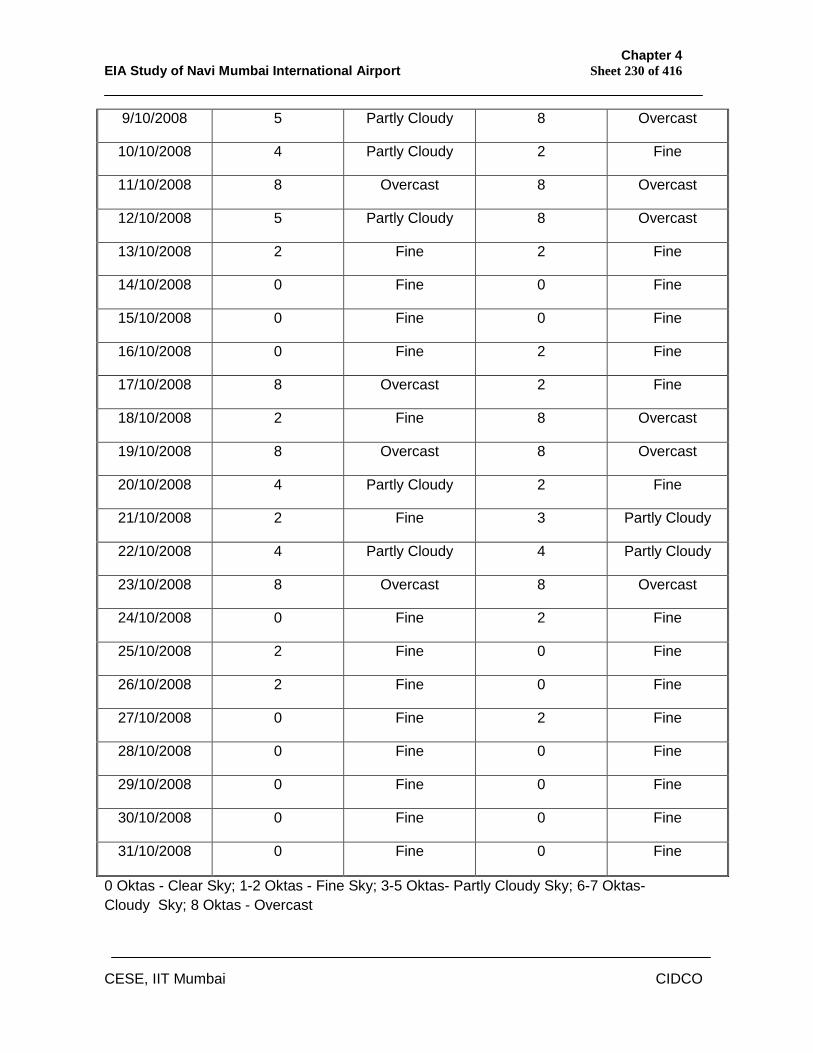
Chapter 4 EIA Study of Navi Mumbai International Airport Sheet 230 of 416
CESE, IIT Mumbai CIDCO
9/10/2008 5 Partly Cloudy 8 Overcast
10/10/2008 4 Partly Cloudy 2 Fine
11/10/2008 8 Overcast 8 Overcast
12/10/2008 5 Partly Cloudy 8 Overcast
13/10/2008 2 Fine 2 Fine
14/10/2008 0 Fine 0 Fine
15/10/2008 0 Fine 0 Fine
16/10/2008 0 Fine 2 Fine
17/10/2008 8 Overcast 2 Fine
18/10/2008 2 Fine 8 Overcast
19/10/2008 8 Overcast 8 Overcast
20/10/2008 4 Partly Cloudy 2 Fine
21/10/2008 2 Fine 3 Partly Cloudy
22/10/2008 4 Partly Cloudy 4 Partly Cloudy
23/10/2008 8 Overcast 8 Overcast
24/10/2008 0 Fine 2 Fine
25/10/2008 2 Fine 0 Fine
26/10/2008 2 Fine 0 Fine
27/10/2008 0 Fine 2 Fine
28/10/2008 0 Fine 0 Fine
29/10/2008 0 Fine 0 Fine
30/10/2008 0 Fine 0 Fine
31/10/2008 0 Fine 0 Fine
0 Oktas - Clear Sky; 1-2 Oktas - Fine Sky; 3-5 Oktas- Partly Cloudy Sky; 6-7 Oktas- Cloudy Sky; 8 Oktas - Overcast
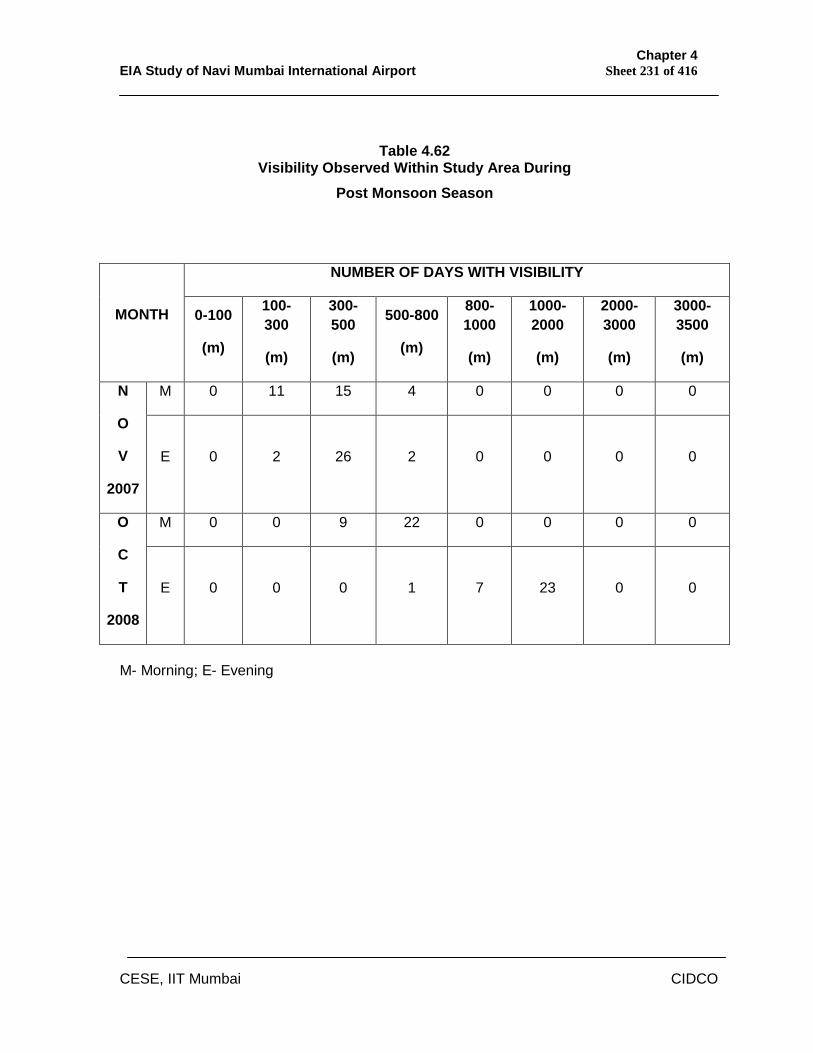
Chapter 4 EIA Study of Navi Mumbai International Airport Sheet 231 of 416
CESE, IIT Mumbai CIDCO
Table 4.62 Visibility Observed Within Study Area During
Post Monsoon Season
M- Morning; E- Evening
NUMBER OF DAYS WITH VISIBILITY
MONTH 0-100
(m)
100-300
(m)
300-500
(m)
500-800
(m)
800-1000
(m)
1000-2000
(m)
2000-3000
(m)
3000-3500
(m)
M 0 11 15 4 0 0 0 0 N
O
V
2007
E 0 2 26 2 0 0 0 0
M 0 0 9 22 0 0 0 0 O
C
T
2008
E 0 0 0 1 7 23 0 0
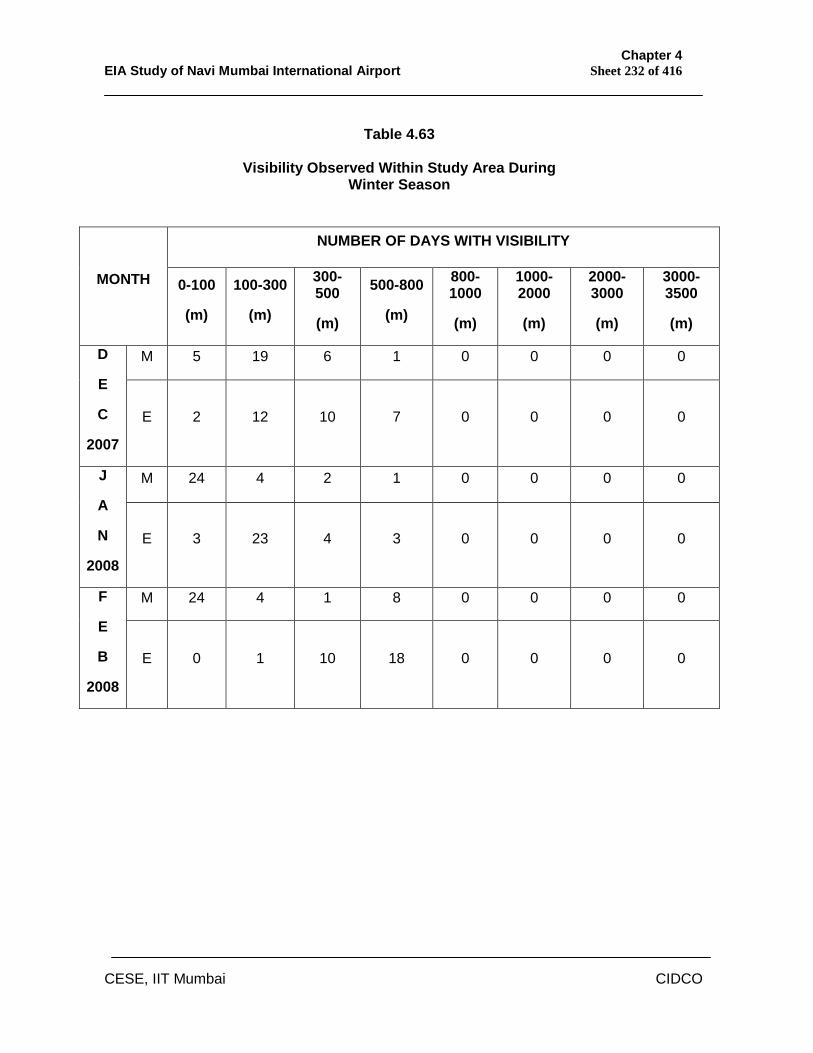
Chapter 4 EIA Study of Navi Mumbai International Airport Sheet 232 of 416
CESE, IIT Mumbai CIDCO
Table 4.63
Visibility Observed Within Study Area During
Winter Season
NUMBER OF DAYS WITH VISIBILITY
MONTH 0-100
(m)
100-300
(m)
300-500
(m)
500-800
(m)
800-1000
(m)
1000-2000
(m)
2000-3000
(m)
3000-3500
(m)
M 5 19 6 1 0 0 0 0 D
E
C
2007
E 2 12 10 7 0 0 0 0
M 24 4 2 1 0 0 0 0 J
A
N
2008
E 3 23 4 3 0 0 0 0
M 24 4 1 8 0 0 0 0 F
E
B
2008
E 0 1 10 18 0 0 0 0
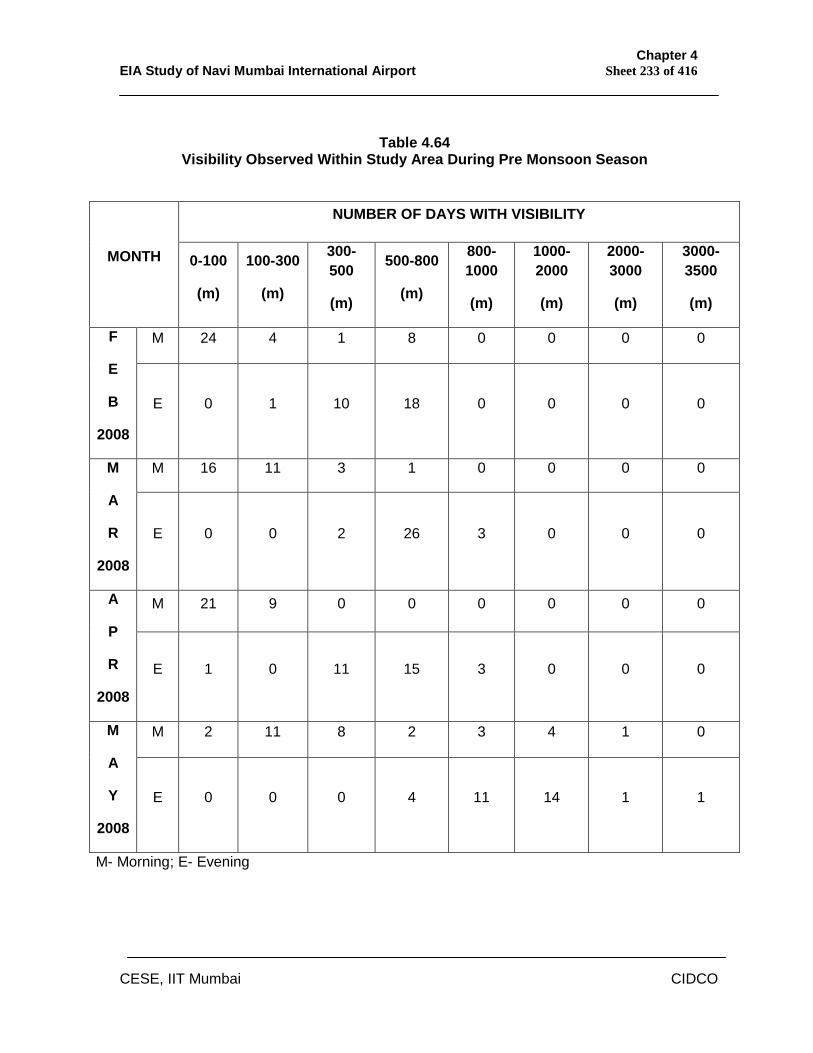
Chapter 4 EIA Study of Navi Mumbai International Airport Sheet 233 of 416
CESE, IIT Mumbai CIDCO
Table 4.64
Visibility Observed Within Study Area During Pre Monsoon Season
NUMBER OF DAYS WITH VISIBILITY
MONTH 0-100
(m)
100-300
(m)
300-500
(m)
500-800
(m)
800-1000
(m)
1000-2000
(m)
2000-3000
(m)
3000-3500
(m)
M 24 4 1 8 0 0 0 0 F
E
B
2008
E 0 1 10 18 0 0 0 0
M 16 11 3 1 0 0 0 0 M
A
R
2008
E 0 0 2 26 3 0 0 0
M 21 9 0 0 0 0 0 0 A
P
R
2008
E 1 0 11 15 3 0 0 0
M 2 11 8 2 3 4 1 0 M
A
Y
2008
E 0 0 0 4 11 14 1 1
M- Morning; E- Evening
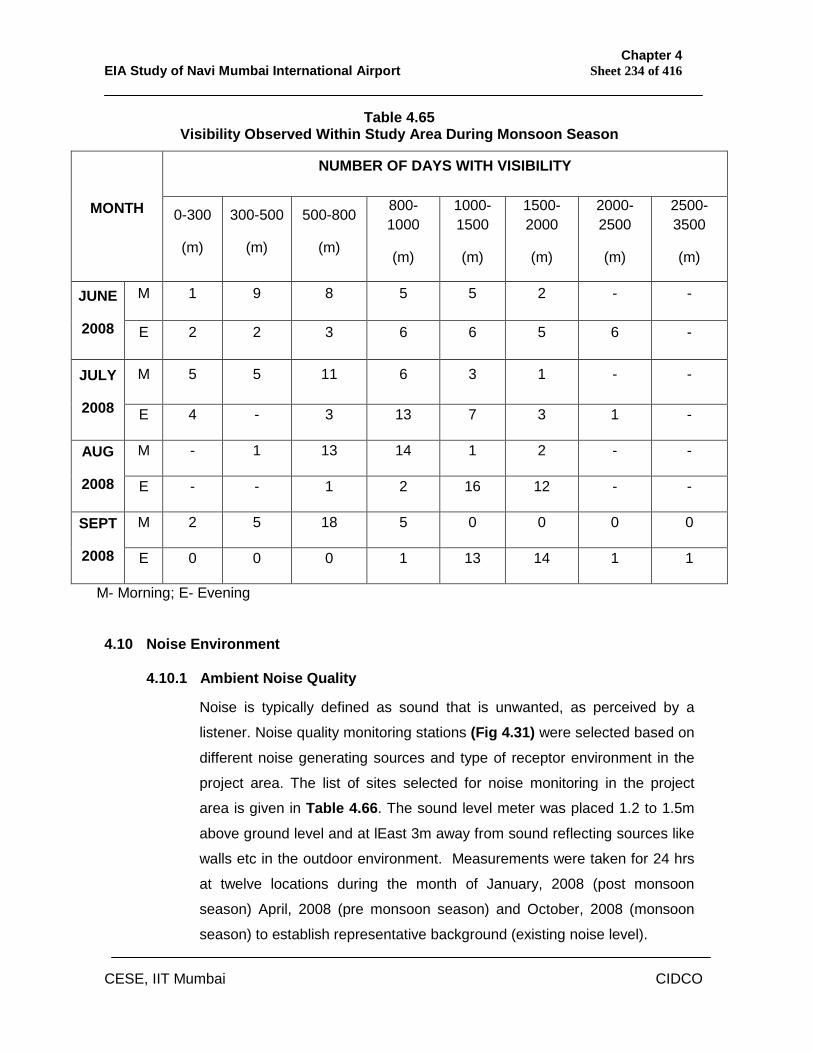
Chapter 4 EIA Study of Navi Mumbai International Airport Sheet 234 of 416
CESE, IIT Mumbai CIDCO
Table 4.65 Visibility Observed Within Study Area During Monsoon Season
NUMBER OF DAYS WITH VISIBILITY
MONTH 0-300
(m)
300-500
(m)
500-800
(m)
800-1000
(m)
1000-1500
(m)
1500-2000
(m)
2000-2500
(m)
2500-3500
(m)
M 1 9 8 5 5 2 - - JUNE
2008 E 2 2 3 6 6 5 6 -
M 5 5 11 6 3 1 - - JULY
2008 E 4 - 3 13 7 3 1 -
M - 1 13 14 1 2 - - AUG
2008 E - - 1 2 16 12 - -
M 2 5 18 5 0 0 0 0 SEPT
2008 E 0 0 0 1 13 14 1 1
M- Morning; E- Evening
4.10 Noise Environment
4.10.1 Ambient Noise Quality
Noise is typically defined as sound that is unwanted, as perceived by a
listener. Noise quality monitoring stations (Fig 4.31) were selected based on
different noise generating sources and type of receptor environment in the
project area. The list of sites selected for noise monitoring in the project
area is given in Table 4.66. The sound level meter was placed 1.2 to 1.5m
above ground level and at lEast 3m away from sound reflecting sources like
walls etc in the outdoor environment. Measurements were taken for 24 hrs
at twelve locations during the month of January, 2008 (post monsoon
season) April, 2008 (pre monsoon season) and October, 2008 (monsoon
season) to establish representative background (existing noise level).
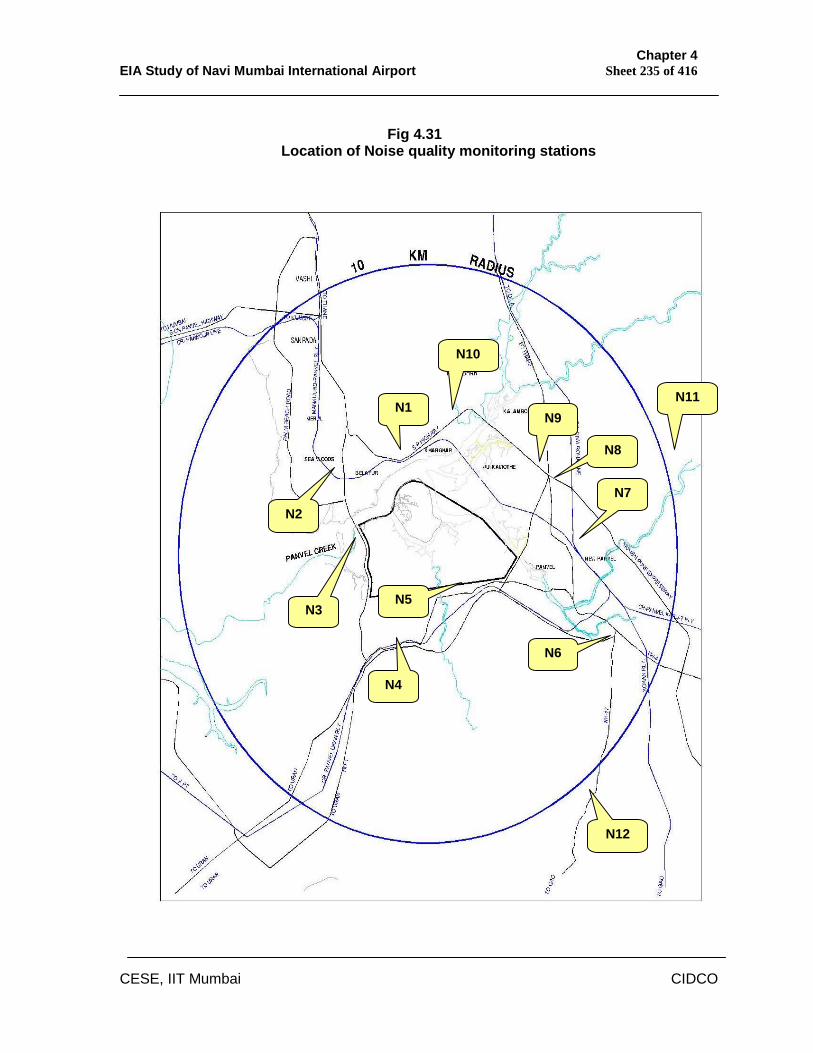
Chapter 4 EIA Study of Navi Mumbai International Airport Sheet 235 of 416
CESE, IIT Mumbai CIDCO
Fig 4.31
Location of Noise quality monitoring stations
N2
N1
N10
N9
N8
N7
N12
N6
N5
N4
N3
N11
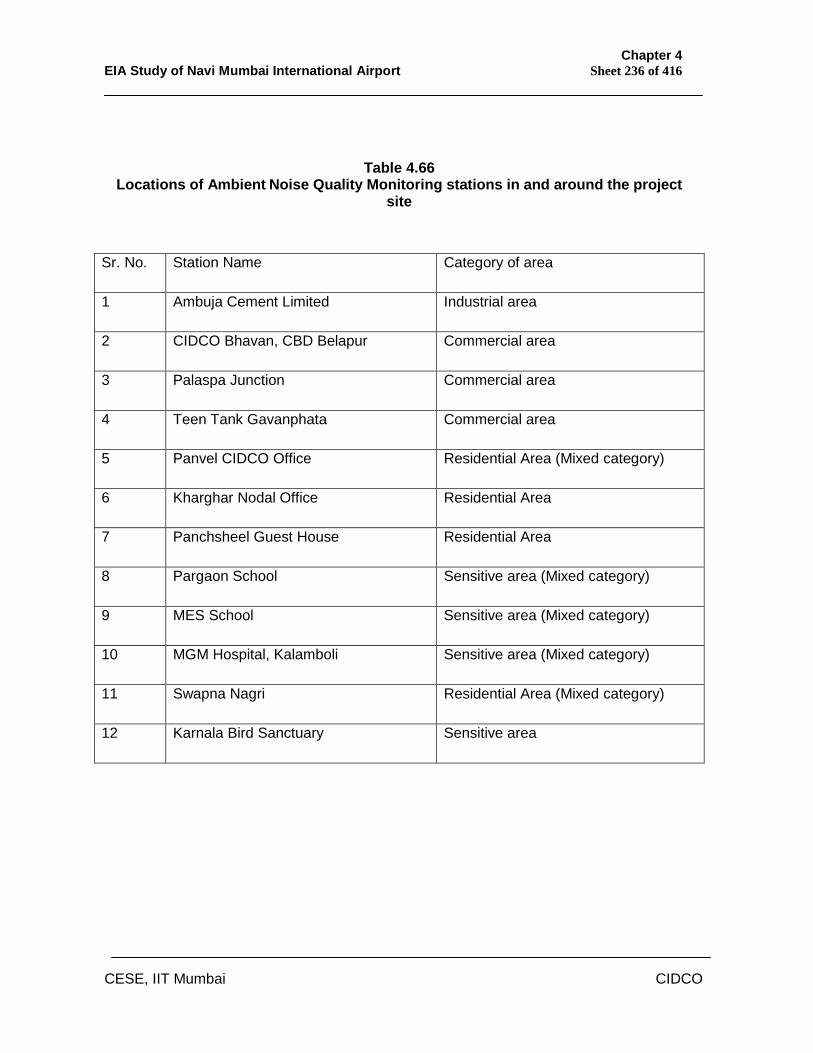
Chapter 4 EIA Study of Navi Mumbai International Airport Sheet 236 of 416
CESE, IIT Mumbai CIDCO
Table 4.66 Locations of Ambient Noise Quality Monitoring stations in and around the project
site
Sr. No. Station Name Category of area
1 Ambuja Cement Limited Industrial area
2 CIDCO Bhavan, CBD Belapur Commercial area
3 Palaspa Junction Commercial area
4 Teen Tank Gavanphata Commercial area
5 Panvel CIDCO Office Residential Area (Mixed category)
6 Kharghar Nodal Office Residential Area
7 Panchsheel Guest House Residential Area
8 Pargaon School Sensitive area (Mixed category)
9 MES School Sensitive area (Mixed category)
10 MGM Hospital, Kalamboli Sensitive area (Mixed category)
11 Swapna Nagri Residential Area (Mixed category)
12 Karnala Bird Sanctuary Sensitive area
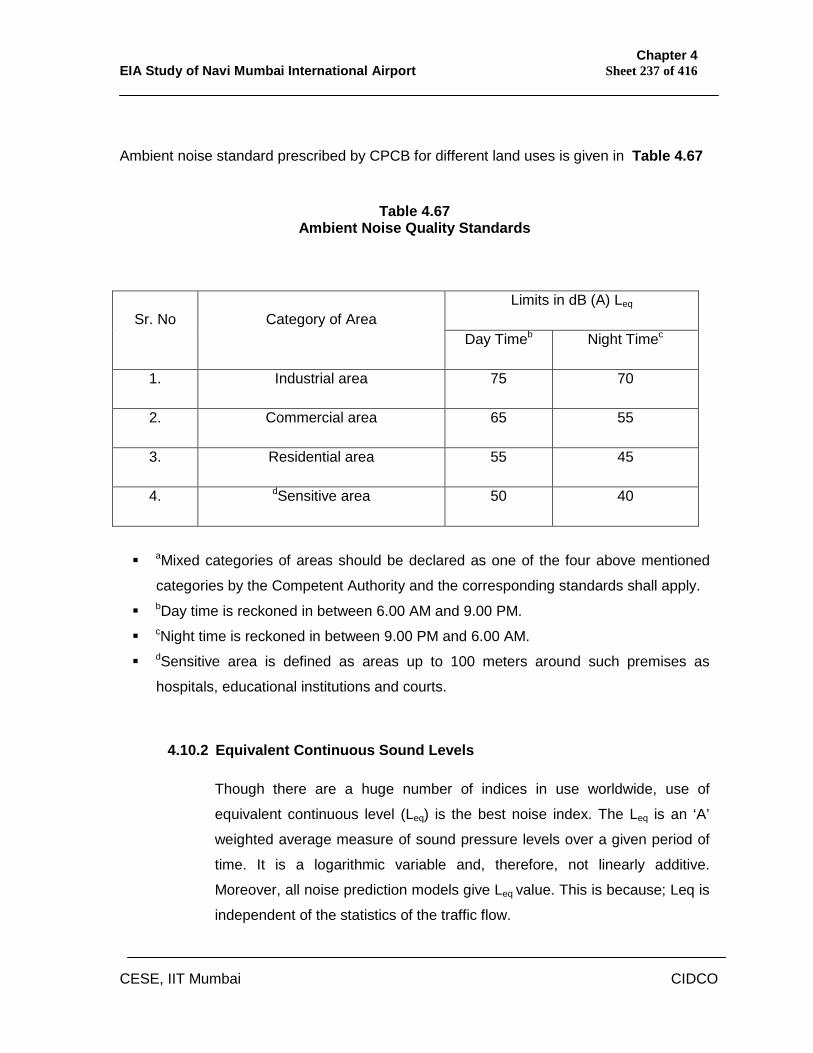
Chapter 4 EIA Study of Navi Mumbai International Airport Sheet 237 of 416
CESE, IIT Mumbai CIDCO
Ambient noise standard prescribed by CPCB for different land uses is given in Table 4.67
Table 4.67 Ambient Noise Quality Standards
Limits in dB (A) Leq Sr. No Category of Area
Day Timeb Night Timec
1. Industrial area 75 70
2. Commercial area 65 55
3. Residential area 55 45
4. dSensitive area 50 40
aMixed categories of areas should be declared as one of the four above mentioned
categories by the Competent Authority and the corresponding standards shall apply.
bDay time is reckoned in between 6.00 AM and 9.00 PM.
cNight time is reckoned in between 9.00 PM and 6.00 AM.
dSensitive area is defined as areas up to 100 meters around such premises as
hospitals, educational institutions and courts.
4.10.2 Equivalent Continuous Sound Levels
Though there are a huge number of indices in use worldwide, use of
equivalent continuous level (Leq) is the best noise index. The Leq is an ‘A’
weighted average measure of sound pressure levels over a given period of
time. It is a logarithmic variable and, therefore, not linearly additive.
Moreover, all noise prediction models give Leq value. This is because; Leq is
independent of the statistics of the traffic flow.
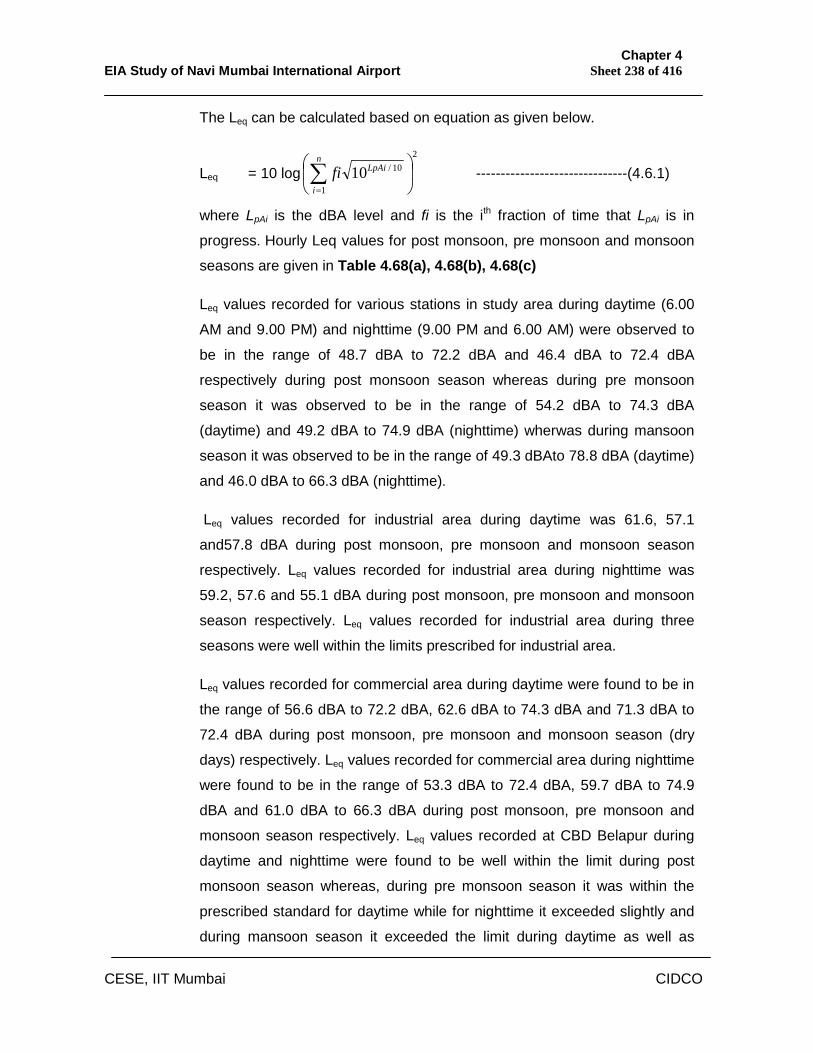
Chapter 4 EIA Study of Navi Mumbai International Airport Sheet 238 of 416
CESE, IIT Mumbai CIDCO
The Leq can be calculated based on equation as given below.
Leq = 10 log2
1
10/10
n
i
LpAifi -------------------------------(4.6.1)
where LpAi is the dBA level and fi is the ith fraction of time that LpAi is in
progress. Hourly Leq values for post monsoon, pre monsoon and monsoon
seasons are given in Table 4.68(a), 4.68(b), 4.68(c)
Leq values recorded for various stations in study area during daytime (6.00
AM and 9.00 PM) and nighttime (9.00 PM and 6.00 AM) were observed to
be in the range of 48.7 dBA to 72.2 dBA and 46.4 dBA to 72.4 dBA
respectively during post monsoon season whereas during pre monsoon
season it was observed to be in the range of 54.2 dBA to 74.3 dBA
(daytime) and 49.2 dBA to 74.9 dBA (nighttime) wherwas during mansoon
season it was observed to be in the range of 49.3 dBAto 78.8 dBA (daytime)
and 46.0 dBA to 66.3 dBA (nighttime).
Leq values recorded for industrial area during daytime was 61.6, 57.1
and57.8 dBA during post monsoon, pre monsoon and monsoon season
respectively. Leq values recorded for industrial area during nighttime was
59.2, 57.6 and 55.1 dBA during post monsoon, pre monsoon and monsoon
season respectively. Leq values recorded for industrial area during three
seasons were well within the limits prescribed for industrial area.
Leq values recorded for commercial area during daytime were found to be in
the range of 56.6 dBA to 72.2 dBA, 62.6 dBA to 74.3 dBA and 71.3 dBA to
72.4 dBA during post monsoon, pre monsoon and monsoon season (dry
days) respectively. Leq values recorded for commercial area during nighttime
were found to be in the range of 53.3 dBA to 72.4 dBA, 59.7 dBA to 74.9
dBA and 61.0 dBA to 66.3 dBA during post monsoon, pre monsoon and
monsoon season respectively. Leq values recorded at CBD Belapur during
daytime and nighttime were found to be well within the limit during post
monsoon season whereas, during pre monsoon season it was within the
prescribed standard for daytime while for nighttime it exceeded slightly and
during mansoon season it exceeded the limit during daytime as well as
Chapter 4 EIA Study of Navi Mumbai International Airport Sheet 239 of 416
CESE, IIT Mumbai CIDCO
nighttime. This could be due to traffic noise as it is a Central Business
District of Navi Mumbai and house several economic and Government
administrative and private company’s offices. This area is one of the fastest
developing regions in Navi Mumbai hence, road construction activities and
commercial construction projects further contribute to the noise level.
The noise levels at traffic junctions such as Phalaspa and Gavanphata were
exceeding the limits during daytime as well as nighttime during post
monsoon, pre monsoon and monsoon season. The night time noise levels
at teen tank Gavanphata exceeded the standard during all the seasons
while the daytime values exceeded the standard only during monsoon
season. Gavanphata was selected nearby a traffic junction. Hence, noise
due to vehicle will be main source at this location. Movement of heavy
vehicles on the up terrain also creates a noisy environment at this location.
The road construction activities going around Gavanphata further augment
the noise level at this traffic junction. Continuous movement of heavy
vehicles particularly diesel engine vehicles during daytime as well as nigh
time contributed to higher noise level at Phalaspa station also. The
background noise will be relatively less during night time and hence, noises
at nearby sources will be more predominant. Hence the noise level recorded
at three stations in commercial area remains high even during nighttime.
Sound levels recorded for residential area during daytime were found to be
in the range of 48.7 dBA to 65.7 dBA, 54.2 dBA to 67.6 dBA and 49.3 dBA
to 78.8 dBA during post monsoon, pre monsoon and monsoon season
respectively. Leq values recorded for residential area during nighttime were
found to be in the range of 46.4 dBA to 59.1 dBA, 49.2 dBA to 69.6 dBA and
46.0 dBA to 63.0 dBA during post monsoon, pre monsoon and monsoon
season respectively. Leq values recorded at Swapna Nagri during daytime
were found to be well within the limit whereas it was exceeded the limit
during nighttime during all the seasons. During pre monsoon season Leq
values recorded at Swapna Nagri were exceeded the limit during daytime as
well as nighttime. Swapna Nagri is well known Bollywood shooting place
hence, noise due to film shooting created noisy environment at Swapna
Chapter 4 EIA Study of Navi Mumbai International Airport Sheet 240 of 416
CESE, IIT Mumbai CIDCO
Nagri. The noise levels recorded at Panvel, Kharghar, and Panchsheel
locations were exceeding the limits during daytime as well as nighttime
during post monsoon, pre monsoon and monsoon seasons. This could be
due to domestic noise as well as traffic noise at these areas. The higher
noise level at these places could be due to high rise buildings located close
to each other which would not allow dispersion of noise and caused
magnified sound. The high noise level at Panchsheel could be due to its
close proximity to Sion-Panvel highway and Amra Marg.
Leq values recorded for sensitive area during daytime were found to be in
the range of 49.5 dBA to 71.0 dBA, 57.9 dBA to 68.3 dBA and 62.5 dBA to
68.3 dBA during post monsoon, pre monsoon and monsoon season
respectively. Leq values recorded for sensitive area during nighttime were
found to be in the range of 48.7 dBA to 60.1 dBA, 50.8 dBA to 70.4 dBA and
49.6 dBA to 65.6 dBA during post monsoon, pre monsoon and monsoon
season respectively.
Leq values recorded at Karnala Bird Sanctuary during nighttime was found
to be above the limits prescribed for sensitive zone but during daytime of
post monsoon season it was slightly below the standard. The noise levels
recorded at Karnala Bird Sanctuary during pre monsoon and monsoon
season were exceeded the limits during daytime as well as nighttime.
Karnala Bird Sanctuary is near Mumbai-Goa National Highway (NH) 17 and
continuous vehicular movement and hence traffic noise at this National
Highway caused an increase in noise level at Karnala Bird Sanctuary. The
tourist and visitors parked their vehicles inside the sanctuary at the bottom
of the fort, hence vehicular movement, horns, and loud music played by
visitors further contributed to the noise level. Karnala Fort and the forest
favoured echoing of vehicular sound at this area. This noise level can affect
the wildlife at Karnala. Noise level recorded at Kalamboli, and Pargaon were
exceeding the limits during daytime as well as nighttime. Noise level at
Kalamboli area was exceeded 57 dBA above 90% of the time. Though,
Kalamboli is a sensitive area it is one kilometer away from National Highway
(NH) 4 and the Mumbai-Pune Expressway and is connected to these
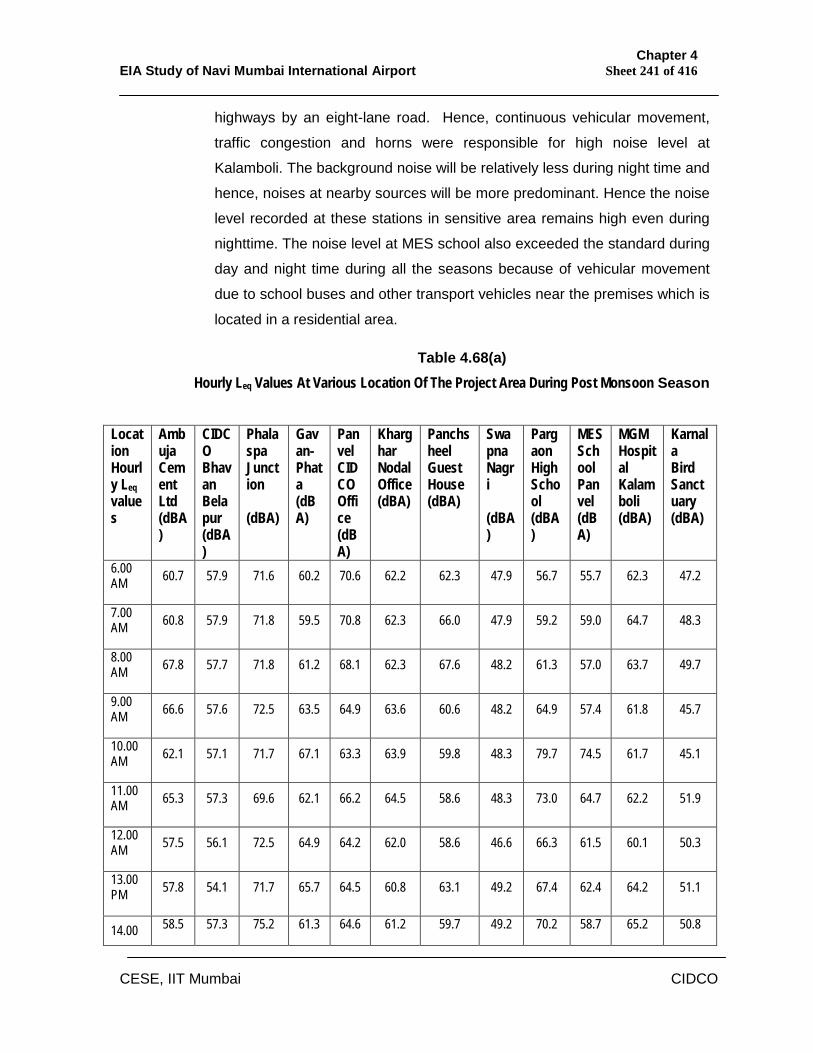
Chapter 4 EIA Study of Navi Mumbai International Airport Sheet 241 of 416
CESE, IIT Mumbai CIDCO
highways by an eight-lane road. Hence, continuous vehicular movement,
traffic congestion and horns were responsible for high noise level at
Kalamboli. The background noise will be relatively less during night time and
hence, noises at nearby sources will be more predominant. Hence the noise
level recorded at these stations in sensitive area remains high even during
nighttime. The noise level at MES school also exceeded the standard during
day and night time during all the seasons because of vehicular movement
due to school buses and other transport vehicles near the premises which is
located in a residential area.
Table 4.68(a) Hourly Leq Values At Various Location Of The Project Area During Post Monsoon Season
Location Hourly Leq values
Ambuja Cement Ltd (dBA)
CIDCO Bhavan Belapur (dBA)
Phalaspa Junction (dBA)
Gavan- Phata (dBA)
Panvel CIDCO Office (dBA)
Kharghar Nodal Office (dBA)
Panchsheel Guest House (dBA)
Swapna Nagri (dBA)
Pargaon High School (dBA)
MES School Panvel (dBA)
MGM Hospital Kalamboli (dBA)
Karnala Bird Sanctuary (dBA)
6.00 AM 60.7 57.9 71.6 60.2 70.6 62.2 62.3 47.9 56.7 55.7 62.3 47.2
7.00 AM 60.8 57.9 71.8 59.5 70.8 62.3 66.0 47.9 59.2 59.0 64.7 48.3
8.00 AM 67.8 57.7 71.8 61.2 68.1 62.3 67.6 48.2 61.3 57.0 63.7 49.7
9.00 AM 66.6 57.6 72.5 63.5 64.9 63.6 60.6 48.2 64.9 57.4 61.8 45.7
10.00 AM 62.1 57.1 71.7 67.1 63.3 63.9 59.8 48.3 79.7 74.5 61.7 45.1
11.00 AM 65.3 57.3 69.6 62.1 66.2 64.5 58.6 48.3 73.0 64.7 62.2 51.9
12.00 AM 57.5 56.1 72.5 64.9 64.2 62.0 58.6 46.6 66.3 61.5 60.1 50.3
13.00 PM 57.8 54.1 71.7 65.7 64.5 60.8 63.1 49.2 67.4 62.4 64.2 51.1
14.00 58.5 57.3 75.2 61.3 64.6 61.2 59.7 49.2 70.2 58.7 65.2 50.8
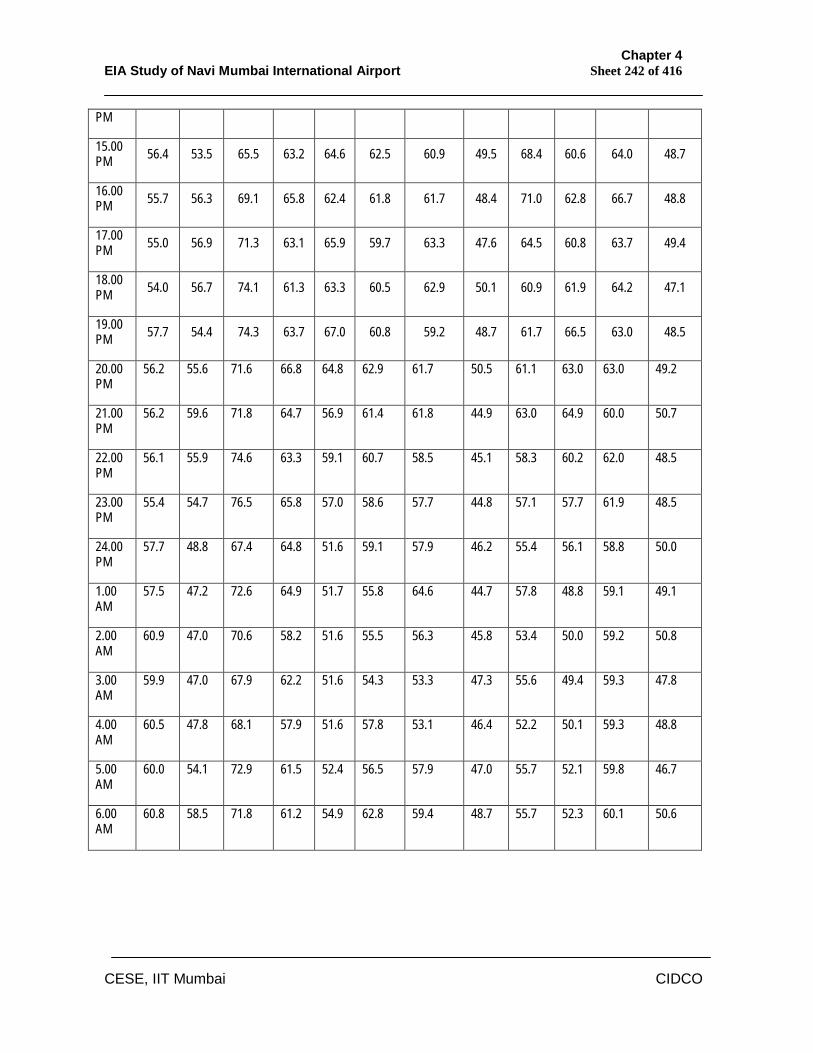
Chapter 4 EIA Study of Navi Mumbai International Airport Sheet 242 of 416
CESE, IIT Mumbai CIDCO
PM
15.00 PM 56.4 53.5 65.5 63.2 64.6 62.5 60.9 49.5 68.4 60.6 64.0 48.7
16.00 PM 55.7 56.3 69.1 65.8 62.4 61.8 61.7 48.4 71.0 62.8 66.7 48.8
17.00 PM 55.0 56.9 71.3 63.1 65.9 59.7 63.3 47.6 64.5 60.8 63.7 49.4
18.00 PM 54.0 56.7 74.1 61.3 63.3 60.5 62.9 50.1 60.9 61.9 64.2 47.1
19.00 PM 57.7 54.4 74.3 63.7 67.0 60.8 59.2 48.7 61.7 66.5 63.0 48.5
20.00 PM
56.2 55.6 71.6 66.8 64.8 62.9 61.7 50.5 61.1 63.0 63.0 49.2
21.00 PM
56.2 59.6 71.8 64.7 56.9 61.4 61.8 44.9 63.0 64.9 60.0 50.7
22.00 PM
56.1 55.9 74.6 63.3 59.1 60.7 58.5 45.1 58.3 60.2 62.0 48.5
23.00 PM
55.4 54.7 76.5 65.8 57.0 58.6 57.7 44.8 57.1 57.7 61.9 48.5
24.00 PM
57.7 48.8 67.4 64.8 51.6 59.1 57.9 46.2 55.4 56.1 58.8 50.0
1.00 AM
57.5 47.2 72.6 64.9 51.7 55.8 64.6 44.7 57.8 48.8 59.1 49.1
2.00 AM
60.9 47.0 70.6 58.2 51.6 55.5 56.3 45.8 53.4 50.0 59.2 50.8
3.00 AM
59.9 47.0 67.9 62.2 51.6 54.3 53.3 47.3 55.6 49.4 59.3 47.8
4.00 AM
60.5 47.8 68.1 57.9 51.6 57.8 53.1 46.4 52.2 50.1 59.3 48.8
5.00 AM
60.0 54.1 72.9 61.5 52.4 56.5 57.9 47.0 55.7 52.1 59.8 46.7
6.00 AM
60.8 58.5 71.8 61.2 54.9 62.8 59.4 48.7 55.7 52.3 60.1 50.6

Chapter 4 EIA Study of Navi Mumbai International Airport Sheet 243 of 416
CESE, IIT Mumbai CIDCO
Table 4.68(b)
Hourly Leq Values At Various Location Of The Project AreaDuring Pre Monsoon Season
Location Hourly Leq values
Ambuja Cement Ltd (dBA)
CIDCO Bhavan Belapur (dBA)
Phalaspa Junction (dBA)
Gavan- Phata (dBA)
Panvel CIDCO Office (dBA)
Kharghar Nodal Office (dBA)
Panchshel Guest House (dBA)
Swapna Nagri (dBA)
Pargaon High School (dBA)
MES School Panvel (dBA)
MGM Hospital Kalamboli (dBA)
Karnala Bird Sanctuary (dBA)
6.00 AM 57.9 62.1 68.7 64.6 62.3 60.8 57.9 53.8 57.3 60.1 61.2 77.8
7.00 AM 58.3 68.3 71.4 64.7 65.3 62.1 60.4 56.7 61.3 60.4 63.5 78.9
8.00 AM 54.5 60.8 71.9 63.0 65.6 63.8 63.8 63.4 58.8 60.6 69.0 66.5
9.00 AM 53.9 60.3 65.0 63.2 64.5 63.7 56.3 53.2 60.3 60.3 71.2 56.9
10.00 AM 52.9 62.2 71.0 62.9 63.6 68.1 53.1 49.6 62.3 64.9 65.7 58.8
11.00 AM 57.5 62.6 84.2 65.4 63.6 65.8 53.5 51.1 58.2 59.5 68.5 60.7
12.00 AM 56.0 62.9 69.8 61.0 63.0 66.3 55.8 49.9 55.6 59.1 64.3 56.8
13.00 PM 57.5 61.2 65.8 63.5 68.6 62.8 53.6 48.9 59.9 59.2 65.7 63.6
14.00 PM 60.0 62.3 73.3 60.3 65.7 65.0 54.2 49.3 59.7 60.8 67.0 59.5
15.00 PM 59.5 60.3 71.6 64.6 62.2 65.1 56.6 50.5 61.8 61.9 64.1 63.3
16.00 PM 59.1 63.3 66.9 64.1 72.1 63.7 57.7 50.2 56.6 59.1 69.0 63.6
17.00 PM 55.4 62.2 70.6 63.3 70.9 61.0 56.6 53.1 61.8 56.5 65.9 66.8
18.00 PM 57.4 62.1 69.1 63.7 72.8 61.3 62.5 47.3 61.1 60.3 71.7 64.1
19.00 PM 56.9 61.9 69.6 63.7 65.5 59.4 51.6 47.4 55.6 62.8 71.4 59.9
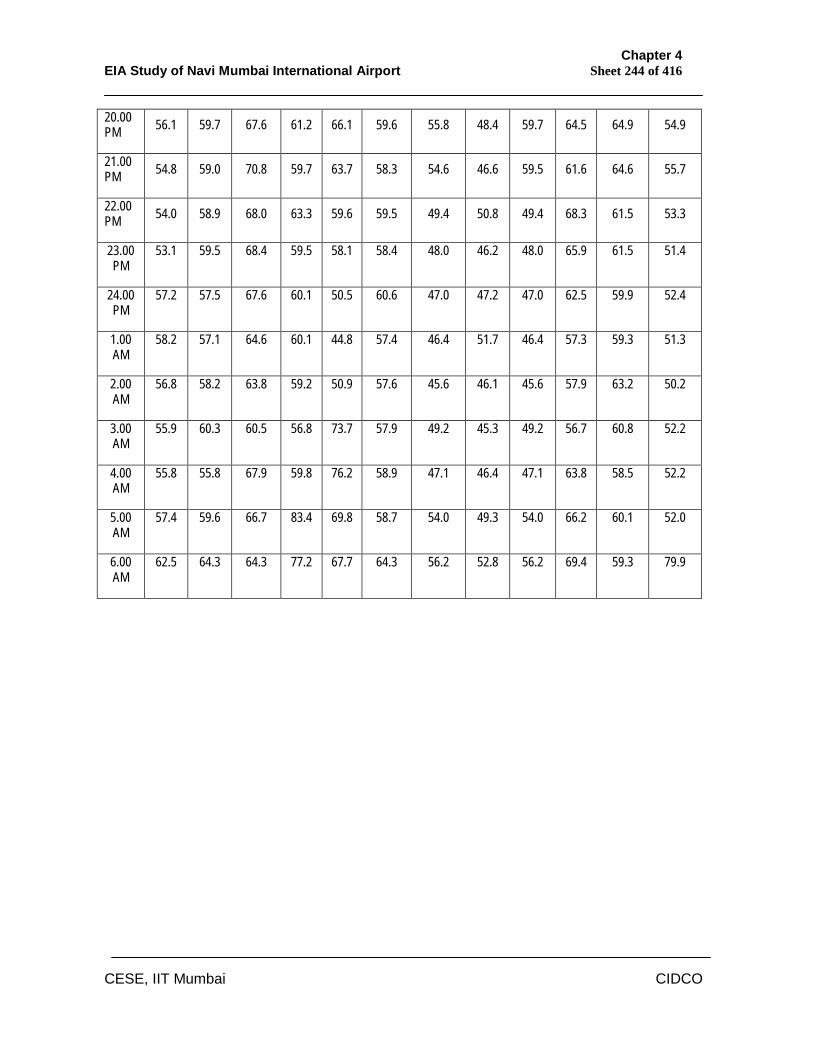
Chapter 4 EIA Study of Navi Mumbai International Airport Sheet 244 of 416
CESE, IIT Mumbai CIDCO
20.00 PM 56.1 59.7 67.6 61.2 66.1 59.6 55.8 48.4 59.7 64.5 64.9 54.9
21.00 PM 54.8 59.0 70.8 59.7 63.7 58.3 54.6 46.6 59.5 61.6 64.6 55.7
22.00 PM 54.0 58.9 68.0 63.3 59.6 59.5 49.4 50.8 49.4 68.3 61.5 53.3
23.00 PM
53.1 59.5 68.4 59.5 58.1 58.4 48.0 46.2 48.0 65.9 61.5 51.4
24.00 PM
57.2 57.5 67.6 60.1 50.5 60.6 47.0 47.2 47.0 62.5 59.9 52.4
1.00 AM
58.2 57.1 64.6 60.1 44.8 57.4 46.4 51.7 46.4 57.3 59.3 51.3
2.00 AM
56.8 58.2 63.8 59.2 50.9 57.6 45.6 46.1 45.6 57.9 63.2 50.2
3.00 AM
55.9 60.3 60.5 56.8 73.7 57.9 49.2 45.3 49.2 56.7 60.8 52.2
4.00 AM
55.8 55.8 67.9 59.8 76.2 58.9 47.1 46.4 47.1 63.8 58.5 52.2
5.00 AM
57.4 59.6 66.7 83.4 69.8 58.7 54.0 49.3 54.0 66.2 60.1 52.0
6.00 AM
62.5 64.3 64.3 77.2 67.7 64.3 56.2 52.8 56.2 69.4 59.3 79.9
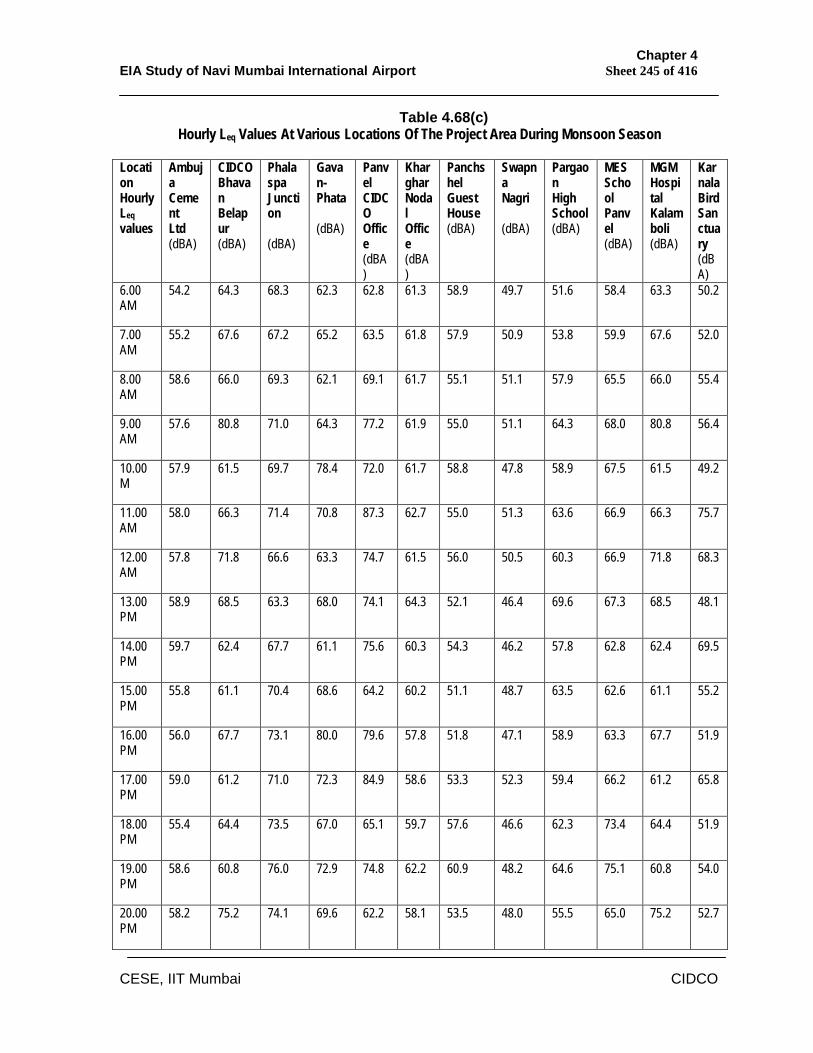
Chapter 4 EIA Study of Navi Mumbai International Airport Sheet 245 of 416
CESE, IIT Mumbai CIDCO
Table 4.68(c) Hourly Leq Values At Various Locations Of The Project Area During Monsoon Season
Location Hourly Leq values
Ambuja Cement Ltd (dBA)
CIDCO Bhavan Belapur (dBA)
Phalaspa Junction (dBA)
Gavan- Phata (dBA)
Panvel CIDCO Office (dBA)
Kharghar Nodal Office (dBA)
Panchshel Guest House (dBA)
Swapna Nagri (dBA)
Pargaon High School (dBA)
MES School Panvel (dBA)
MGM Hospital Kalamboli (dBA)
Karnala Bird Sanctuary (dBA)
6.00 AM
54.2 64.3 68.3 62.3 62.8 61.3 58.9 49.7 51.6 58.4 63.3 50.2
7.00 AM
55.2 67.6 67.2 65.2 63.5 61.8 57.9 50.9 53.8 59.9 67.6 52.0
8.00 AM
58.6 66.0 69.3 62.1 69.1 61.7 55.1 51.1 57.9 65.5 66.0 55.4
9.00 AM
57.6 80.8 71.0 64.3 77.2 61.9 55.0 51.1 64.3 68.0 80.8 56.4
10.00 M
57.9 61.5 69.7 78.4 72.0 61.7 58.8 47.8 58.9 67.5 61.5 49.2
11.00 AM
58.0 66.3 71.4 70.8 87.3 62.7 55.0 51.3 63.6 66.9 66.3 75.7
12.00 AM
57.8 71.8 66.6 63.3 74.7 61.5 56.0 50.5 60.3 66.9 71.8 68.3
13.00 PM
58.9 68.5 63.3 68.0 74.1 64.3 52.1 46.4 69.6 67.3 68.5 48.1
14.00 PM
59.7 62.4 67.7 61.1 75.6 60.3 54.3 46.2 57.8 62.8 62.4 69.5
15.00 PM
55.8 61.1 70.4 68.6 64.2 60.2 51.1 48.7 63.5 62.6 61.1 55.2
16.00 PM
56.0 67.7 73.1 80.0 79.6 57.8 51.8 47.1 58.9 63.3 67.7 51.9
17.00 PM
59.0 61.2 71.0 72.3 84.9 58.6 53.3 52.3 59.4 66.2 61.2 65.8
18.00 PM
55.4 64.4 73.5 67.0 65.1 59.7 57.6 46.6 62.3 73.4 64.4 51.9
19.00 PM
58.6 60.8 76.0 72.9 74.8 62.2 60.9 48.2 64.6 75.1 60.8 54.0
20.00 PM
58.2 75.2 74.1 69.6 62.2 58.1 53.5 48.0 55.5 65.0 75.2 52.7
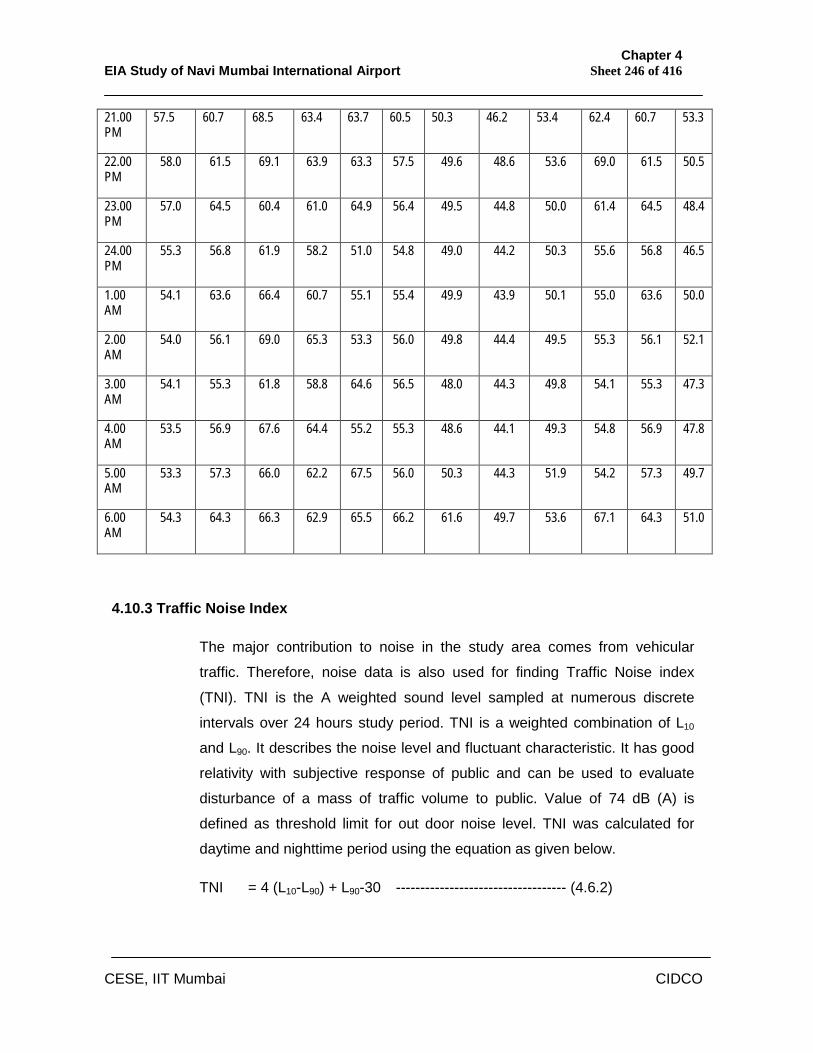
Chapter 4 EIA Study of Navi Mumbai International Airport Sheet 246 of 416
CESE, IIT Mumbai CIDCO
21.00 PM
57.5 60.7 68.5 63.4 63.7 60.5 50.3 46.2 53.4 62.4 60.7 53.3
22.00 PM
58.0 61.5 69.1 63.9 63.3 57.5 49.6 48.6 53.6 69.0 61.5 50.5
23.00 PM
57.0 64.5 60.4 61.0 64.9 56.4 49.5 44.8 50.0 61.4 64.5 48.4
24.00 PM
55.3 56.8 61.9 58.2 51.0 54.8 49.0 44.2 50.3 55.6 56.8 46.5
1.00 AM
54.1 63.6 66.4 60.7 55.1 55.4 49.9 43.9 50.1 55.0 63.6 50.0
2.00 AM
54.0 56.1 69.0 65.3 53.3 56.0 49.8 44.4 49.5 55.3 56.1 52.1
3.00 AM
54.1 55.3 61.8 58.8 64.6 56.5 48.0 44.3 49.8 54.1 55.3 47.3
4.00 AM
53.5 56.9 67.6 64.4 55.2 55.3 48.6 44.1 49.3 54.8 56.9 47.8
5.00 AM
53.3 57.3 66.0 62.2 67.5 56.0 50.3 44.3 51.9 54.2 57.3 49.7
6.00 AM
54.3 64.3 66.3 62.9 65.5 66.2 61.6 49.7 53.6 67.1 64.3 51.0
4.10.3 Traffic Noise Index
The major contribution to noise in the study area comes from vehicular
traffic. Therefore, noise data is also used for finding Traffic Noise index
(TNI). TNI is the A weighted sound level sampled at numerous discrete
intervals over 24 hours study period. TNI is a weighted combination of L10
and L90. It describes the noise level and fluctuant characteristic. It has good
relativity with subjective response of public and can be used to evaluate
disturbance of a mass of traffic volume to public. Value of 74 dB (A) is
defined as threshold limit for out door noise level. TNI was calculated for
daytime and nighttime period using the equation as given below.
TNI = 4 (L10-L90) + L90-30 ----------------------------------- (4.6.2)
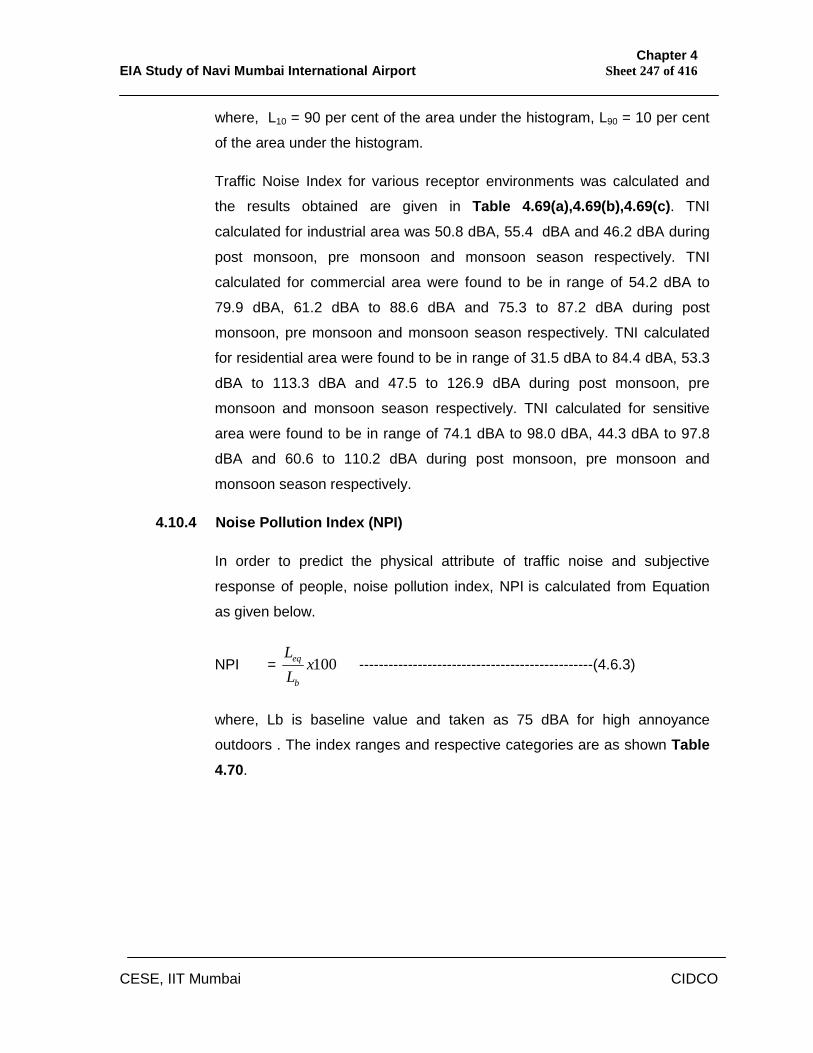
Chapter 4 EIA Study of Navi Mumbai International Airport Sheet 247 of 416
CESE, IIT Mumbai CIDCO
where, L10 = 90 per cent of the area under the histogram, L90 = 10 per cent
of the area under the histogram.
Traffic Noise Index for various receptor environments was calculated and
the results obtained are given in Table 4.69(a),4.69(b),4.69(c). TNI
calculated for industrial area was 50.8 dBA, 55.4 dBA and 46.2 dBA during
post monsoon, pre monsoon and monsoon season respectively. TNI
calculated for commercial area were found to be in range of 54.2 dBA to
79.9 dBA, 61.2 dBA to 88.6 dBA and 75.3 to 87.2 dBA during post
monsoon, pre monsoon and monsoon season respectively. TNI calculated
for residential area were found to be in range of 31.5 dBA to 84.4 dBA, 53.3
dBA to 113.3 dBA and 47.5 to 126.9 dBA during post monsoon, pre
monsoon and monsoon season respectively. TNI calculated for sensitive
area were found to be in range of 74.1 dBA to 98.0 dBA, 44.3 dBA to 97.8
dBA and 60.6 to 110.2 dBA during post monsoon, pre monsoon and
monsoon season respectively.
4.10.4 Noise Pollution Index (NPI)
In order to predict the physical attribute of traffic noise and subjective
response of people, noise pollution index, NPI is calculated from Equation
as given below.
NPI = 100xLL
b
eq ------------------------------------------------(4.6.3)
where, Lb is baseline value and taken as 75 dBA for high annoyance
outdoors . The index ranges and respective categories are as shown Table 4.70.
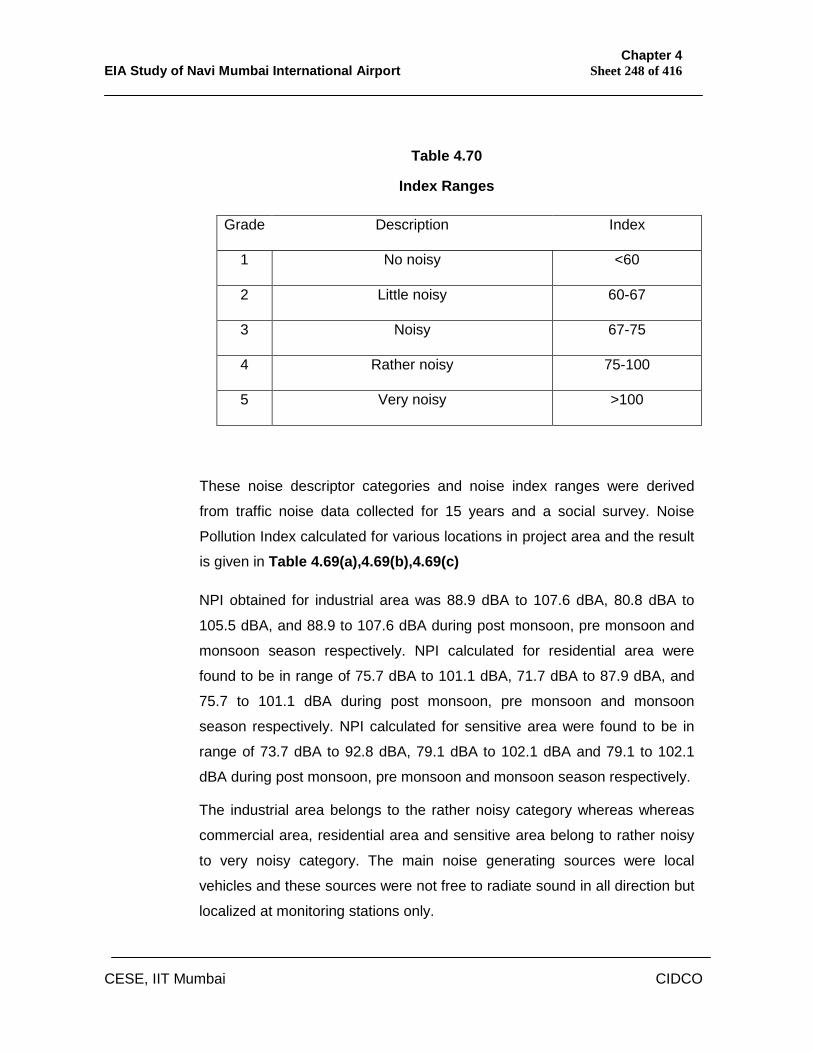
Chapter 4 EIA Study of Navi Mumbai International Airport Sheet 248 of 416
CESE, IIT Mumbai CIDCO
Table 4.70
Index Ranges
These noise descriptor categories and noise index ranges were derived
from traffic noise data collected for 15 years and a social survey. Noise
Pollution Index calculated for various locations in project area and the result
is given in Table 4.69(a),4.69(b),4.69(c)
NPI obtained for industrial area was 88.9 dBA to 107.6 dBA, 80.8 dBA to
105.5 dBA, and 88.9 to 107.6 dBA during post monsoon, pre monsoon and
monsoon season respectively. NPI calculated for residential area were
found to be in range of 75.7 dBA to 101.1 dBA, 71.7 dBA to 87.9 dBA, and
75.7 to 101.1 dBA during post monsoon, pre monsoon and monsoon
season respectively. NPI calculated for sensitive area were found to be in
range of 73.7 dBA to 92.8 dBA, 79.1 dBA to 102.1 dBA and 79.1 to 102.1
dBA during post monsoon, pre monsoon and monsoon season respectively.
The industrial area belongs to the rather noisy category whereas whereas
commercial area, residential area and sensitive area belong to rather noisy
to very noisy category. The main noise generating sources were local
vehicles and these sources were not free to radiate sound in all direction but
localized at monitoring stations only.
Grade Description Index
1 No noisy <60
2 Little noisy 60-67
3 Noisy 67-75
4 Rather noisy 75-100
5 Very noisy >100
Chapter 4 EIA Study of Navi Mumbai International Airport Sheet 249 of 416
CESE, IIT Mumbai CIDCO
4.10.5 Average Noise Level
Different receptor environment were monitored during daytime and night
time and Leq values of each station have been calculated separately using
the above equation for Leq. Average noise level of the project area during
day time was calculated using the Equation as given below.
LeqPa(D) = 10 log (10Leq I(D)/10+ 10LeqC(D)/10+ 10LeqR(D)/10 +10LeqS(D)/10) -----
(4.6.4)
where, LeqPa (D) is equivalent continuous sound level (average) during
nighttime in the project area.
LeqI(D), LeqC(D), LeqR(D) and LeqS(D) are equivalent continuous sound level
during daytime in industrial, commercial, residential and sensitive areas
respectively.
Similarly, average noise level of the project area during nighttime is also
calculated and the results of the noise analysis are given in Table 4.71(a) to 4.71(c ).
The average noise levels calculated for industrial area during daytime were
were 34.8 dBA, 36.8 dBA and 35.1 dBA whereas during night time it were
35.0 dBA, 35.7 dBA and 33.9 dBA during post monsoon, pre monsoon and
monsoon season respectively. The average noise levels calculated for
commercial area during daytime were were 44.4 dBA , 43.5 dBA and 45.9
dBA whereas during night time it were 43.3 dBA, 44.7 dBA and 42.4 dBA
during post monsoon, pre monsoon and monsoon season respectively.
The average noise levels calculated for residential area during daytime were 43.0 dBA, 42.5 dBA and 45.4 dBA whereas during night time it were were 42.4 dBA, 40.3 dBA and 40.9 dBA during post monsoon, pre monsoon and monsoon season respectively..
The average noise levels calculated for residential area during daytime were
42.5 dBA, 43.0 dBA and 45.4 dBA whereas during night time it were 40.3
dBA, 42.4 dBA and 40.9 dBA during post monsoon, pre monsoon and
monsoon season respectively.
Chapter 4 EIA Study of Navi Mumbai International Airport Sheet 250 of 416
CESE, IIT Mumbai CIDCO
The average noise levels calculated for sensitive area during daytime were
44.2 dBA, 44.2 dBA and 44.8 dBA whereas during night time it were 40.2
dBA, 43.0 dBA and 40.8 dBA during post monsoon, pre monsoon and
monsoon season respectively. The overall average noise level during
daytime in the project area was 34.3dBA, 34.4 dBA and 35.0 dBA and
during nighttime it was 33.5 dBA, 34.2 dBA and 33.4 dBA during post
monsoon, pre monsoon and monsoon season respectively.
The average noise levels for industrial, commercial, residential and sensitive
areas are well within the limits though Leq values recorded at individual
stations showed high noise levels. This could be due to the fact that the
main noise generating sources were local vehicles and these sources were
not free to radiate sound in all direction but localized at monitoring stations
only.
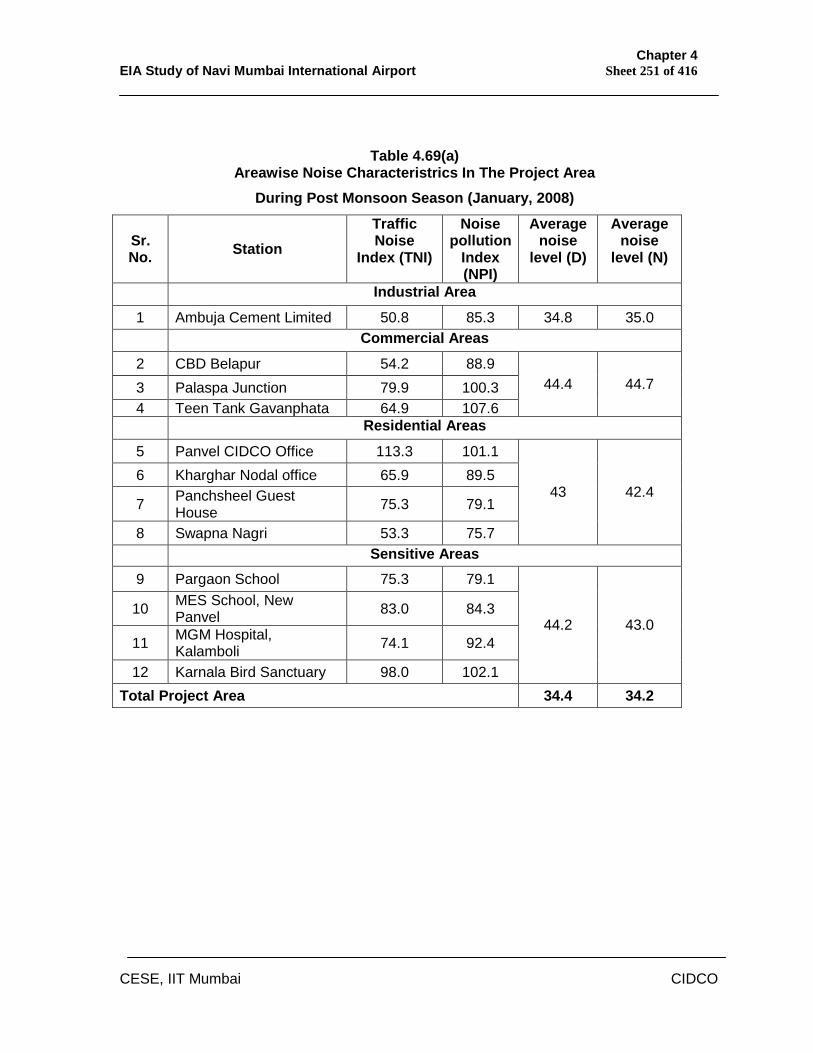
Chapter 4 EIA Study of Navi Mumbai International Airport Sheet 251 of 416
CESE, IIT Mumbai CIDCO
Table 4.69(a) Areawise Noise Characteristrics In The Project Area
During Post Monsoon Season (January, 2008)
Sr. No. Station
Traffic Noise
Index (TNI)
Noise pollution
Index (NPI)
Average noise
level (D)
Average noise
level (N)
Industrial Area
1 Ambuja Cement Limited 50.8 85.3 34.8 35.0 Commercial Areas
2 CBD Belapur 54.2 88.9 3 Palaspa Junction 79.9 100.3 4 Teen Tank Gavanphata 64.9 107.6
44.4 44.7
Residential Areas
5 Panvel CIDCO Office 113.3 101.1 6 Kharghar Nodal office 65.9 89.5
7 Panchsheel Guest House 75.3 79.1
8 Swapna Nagri 53.3 75.7
43 42.4
Sensitive Areas 9 Pargaon School 75.3 79.1
10 MES School, New Panvel 83.0 84.3
11 MGM Hospital, Kalamboli 74.1 92.4
12 Karnala Bird Sanctuary 98.0 102.1
44.2 43.0
Total Project Area 34.4 34.2
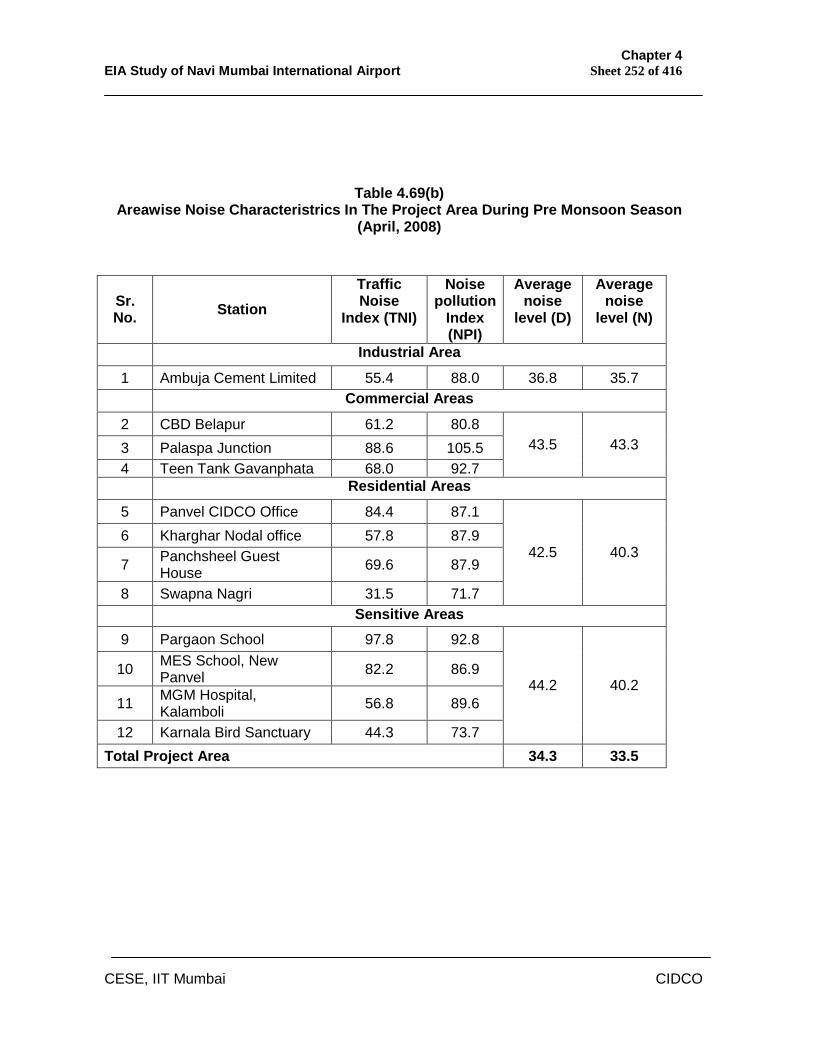
Chapter 4 EIA Study of Navi Mumbai International Airport Sheet 252 of 416
CESE, IIT Mumbai CIDCO
Table 4.69(b) Areawise Noise Characteristrics In The Project Area During Pre Monsoon Season
(April, 2008)
Sr. No. Station
Traffic Noise
Index (TNI)
Noise pollution
Index (NPI)
Average noise
level (D)
Average noise
level (N)
Industrial Area
1 Ambuja Cement Limited 55.4 88.0 36.8 35.7 Commercial Areas
2 CBD Belapur 61.2 80.8 3 Palaspa Junction 88.6 105.5 4 Teen Tank Gavanphata 68.0 92.7
43.5 43.3
Residential Areas
5 Panvel CIDCO Office 84.4 87.1 6 Kharghar Nodal office 57.8 87.9
7 Panchsheel Guest House 69.6 87.9
8 Swapna Nagri 31.5 71.7
42.5 40.3
Sensitive Areas 9 Pargaon School 97.8 92.8
10 MES School, New Panvel 82.2 86.9
11 MGM Hospital, Kalamboli 56.8 89.6
12 Karnala Bird Sanctuary 44.3 73.7
44.2 40.2
Total Project Area 34.3 33.5
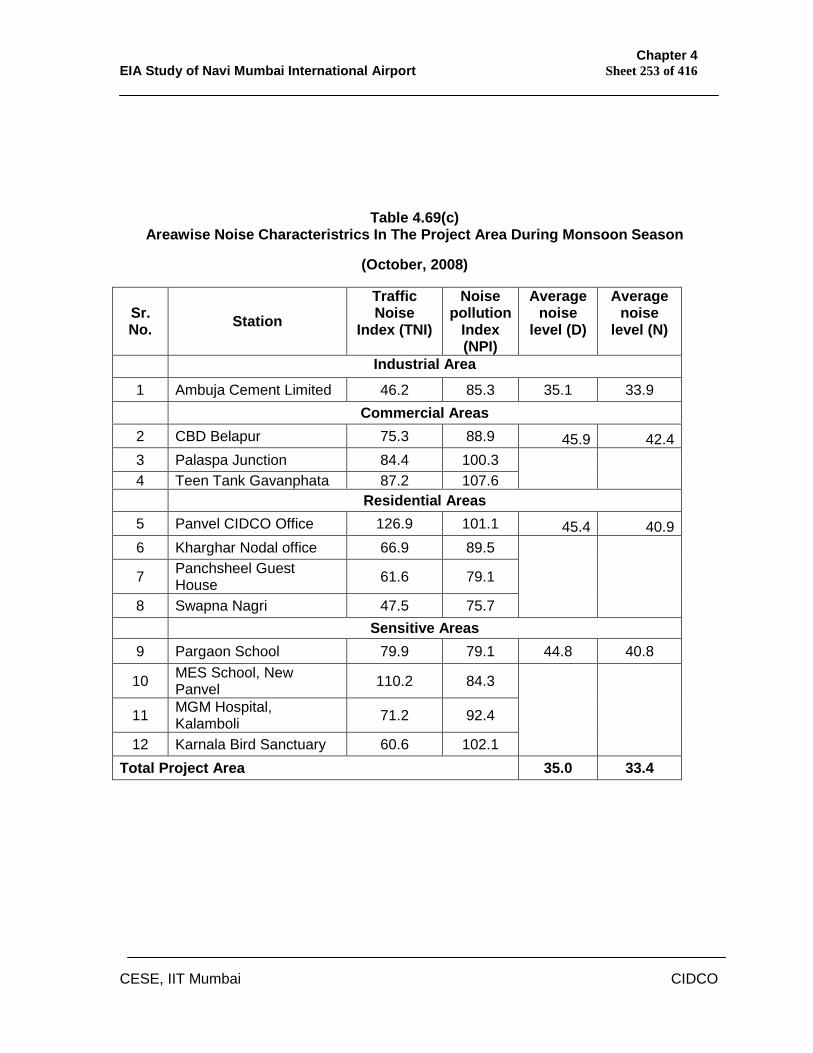
Chapter 4 EIA Study of Navi Mumbai International Airport Sheet 253 of 416
CESE, IIT Mumbai CIDCO
Table 4.69(c) Areawise Noise Characteristrics In The Project Area During Monsoon Season
(October, 2008)
Sr. No. Station
Traffic Noise
Index (TNI)
Noise pollution
Index (NPI)
Average noise
level (D)
Average noise
level (N)
Industrial Area
1 Ambuja Cement Limited 46.2 85.3 35.1 33.9 Commercial Areas
2 CBD Belapur 75.3 88.9 45.9 42.4 3 Palaspa Junction 84.4 100.3 4 Teen Tank Gavanphata 87.2 107.6 Residential Areas
5 Panvel CIDCO Office 126.9 101.1 45.4 40.9 6 Kharghar Nodal office 66.9 89.5
7 Panchsheel Guest House 61.6 79.1
8 Swapna Nagri 47.5 75.7 Sensitive Areas
9 Pargaon School 79.9 79.1 44.8 40.8
10 MES School, New Panvel 110.2 84.3
11 MGM Hospital, Kalamboli 71.2 92.4
12 Karnala Bird Sanctuary 60.6 102.1 Total Project Area 35.0 33.4
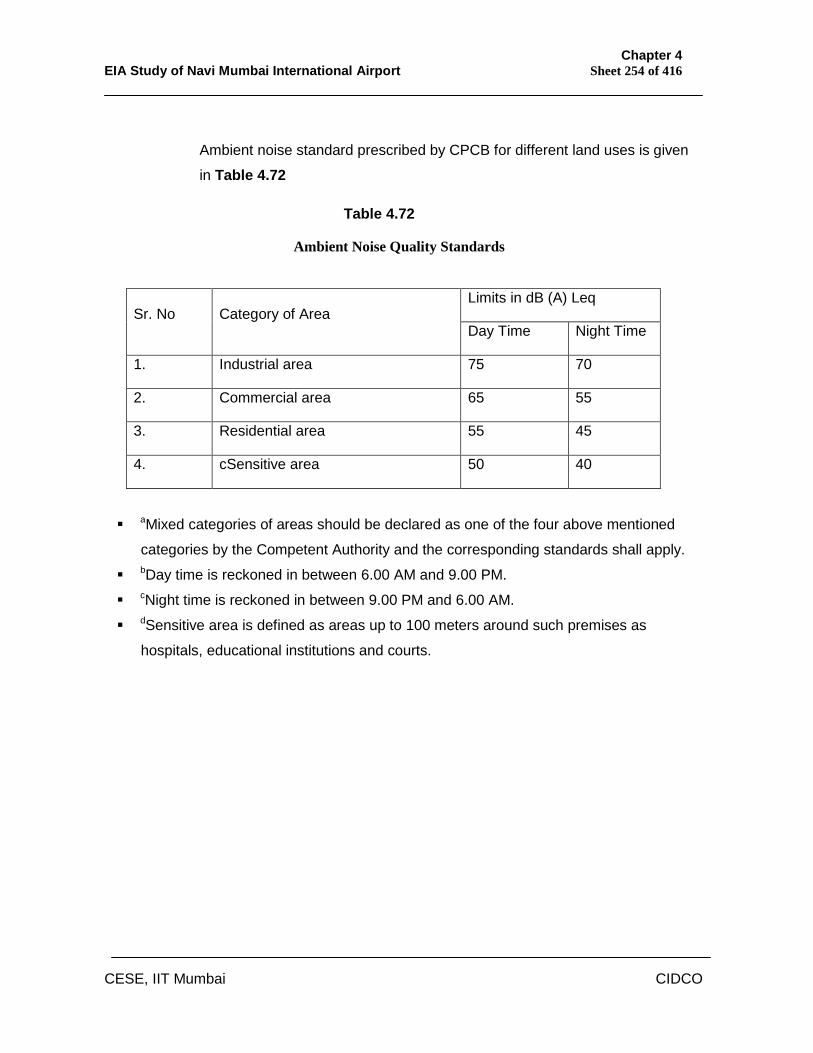
Chapter 4 EIA Study of Navi Mumbai International Airport Sheet 254 of 416
CESE, IIT Mumbai CIDCO
Ambient noise standard prescribed by CPCB for different land uses is given
in Table 4.72
Table 4.72
Ambient Noise Quality Standards
Limits in dB (A) Leq Sr. No Category of Area
Day Time Night Time
1. Industrial area 75 70
2. Commercial area 65 55
3. Residential area 55 45
4. cSensitive area 50 40
aMixed categories of areas should be declared as one of the four above mentioned
categories by the Competent Authority and the corresponding standards shall apply.
bDay time is reckoned in between 6.00 AM and 9.00 PM.
cNight time is reckoned in between 9.00 PM and 6.00 AM.
dSensitive area is defined as areas up to 100 meters around such premises as
hospitals, educational institutions and courts.
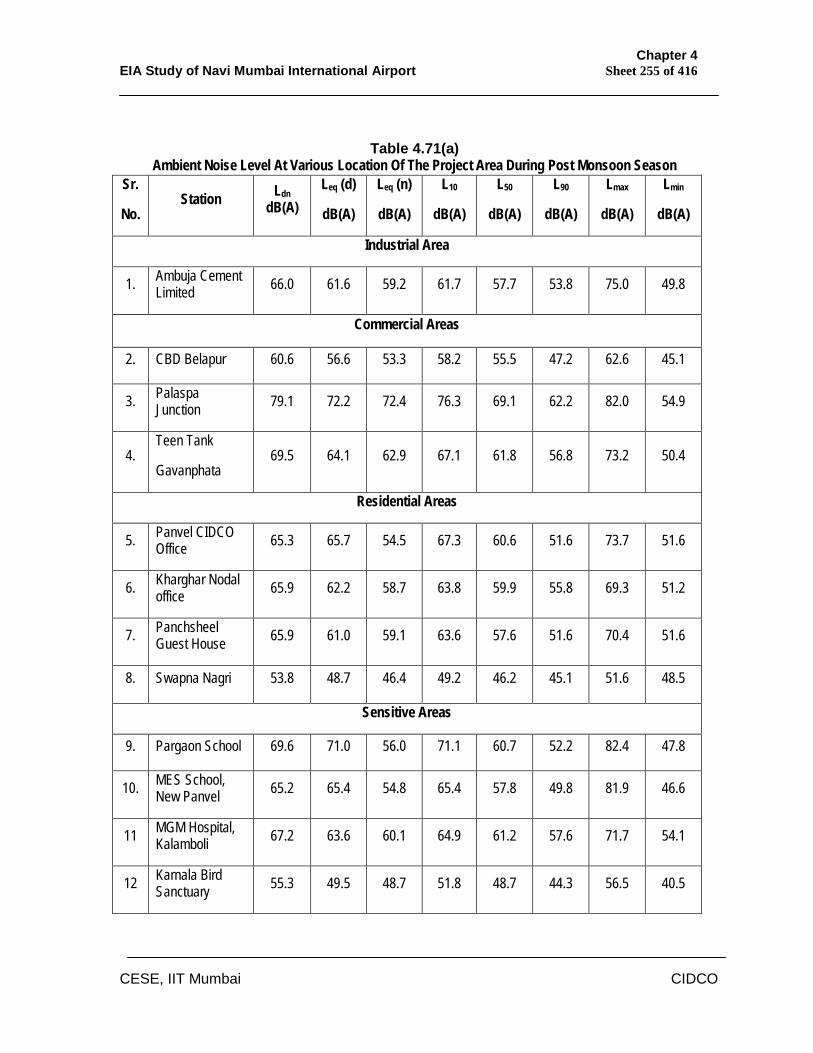
Chapter 4 EIA Study of Navi Mumbai International Airport Sheet 255 of 416
CESE, IIT Mumbai CIDCO
Table 4.71(a) Ambient Noise Level At Various Location Of The Project Area During Post Monsoon Season
Sr.
No. Station Ldn
dB(A) Leq (d)
dB(A)
Leq (n)
dB(A)
L10
dB(A)
L50
dB(A)
L90
dB(A)
Lmax
dB(A)
Lmin
dB(A)
Industrial Area
1. Ambuja Cement Limited 66.0 61.6 59.2 61.7 57.7 53.8 75.0 49.8
Commercial Areas
2. CBD Belapur 60.6 56.6 53.3 58.2 55.5 47.2 62.6 45.1
3. Palaspa Junction 79.1 72.2 72.4 76.3 69.1 62.2 82.0 54.9
4. Teen Tank
Gavanphata 69.5 64.1 62.9 67.1 61.8 56.8 73.2 50.4
Residential Areas
5. Panvel CIDCO Office 65.3 65.7 54.5 67.3 60.6 51.6 73.7 51.6
6. Kharghar Nodal office 65.9 62.2 58.7 63.8 59.9 55.8 69.3 51.2
7. Panchsheel Guest House 65.9 61.0 59.1 63.6 57.6 51.6 70.4 51.6
8. Swapna Nagri 53.8 48.7 46.4 49.2 46.2 45.1 51.6 48.5
Sensitive Areas
9. Pargaon School 69.6 71.0 56.0 71.1 60.7 52.2 82.4 47.8
10. MES School, New Panvel 65.2 65.4 54.8 65.4 57.8 49.8 81.9 46.6
11 MGM Hospital, Kalamboli 67.2 63.6 60.1 64.9 61.2 57.6 71.7 54.1
12 Karnala Bird Sanctuary 55.3 49.5 48.7 51.8 48.7 44.3 56.5 40.5
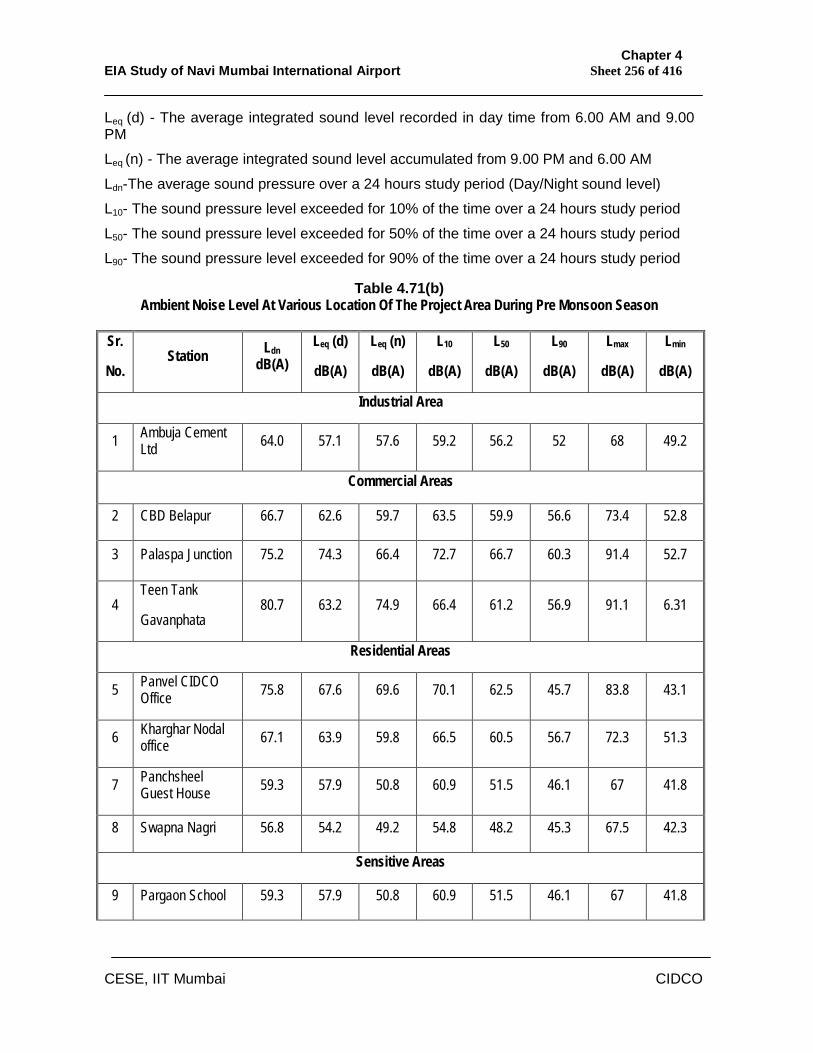
Chapter 4 EIA Study of Navi Mumbai International Airport Sheet 256 of 416
CESE, IIT Mumbai CIDCO
Leq (d) - The average integrated sound level recorded in day time from 6.00 AM and 9.00 PM
Leq (n) - The average integrated sound level accumulated from 9.00 PM and 6.00 AM
Ldn-The average sound pressure over a 24 hours study period (Day/Night sound level)
L10- The sound pressure level exceeded for 10% of the time over a 24 hours study period
L50- The sound pressure level exceeded for 50% of the time over a 24 hours study period
L90- The sound pressure level exceeded for 90% of the time over a 24 hours study period
Table 4.71(b) Ambient Noise Level At Various Location Of The Project Area During Pre Monsoon Season
Sr.
No. Station Ldn
dB(A) Leq (d)
dB(A)
Leq (n)
dB(A)
L10
dB(A)
L50
dB(A)
L90
dB(A)
Lmax
dB(A)
Lmin
dB(A)
Industrial Area
1 Ambuja Cement Ltd 64.0 57.1 57.6 59.2 56.2 52 68 49.2
Commercial Areas
2 CBD Belapur 66.7 62.6 59.7 63.5 59.9 56.6 73.4 52.8
3 Palaspa Junction 75.2 74.3 66.4 72.7 66.7 60.3 91.4 52.7
4 Teen Tank
Gavanphata 80.7 63.2 74.9 66.4 61.2 56.9 91.1 6.31
Residential Areas
5 Panvel CIDCO Office 75.8 67.6 69.6 70.1 62.5 45.7 83.8 43.1
6 Kharghar Nodal office 67.1 63.9 59.8 66.5 60.5 56.7 72.3 51.3
7 Panchsheel Guest House 59.3 57.9 50.8 60.9 51.5 46.1 67 41.8
8 Swapna Nagri 56.8 54.2 49.2 54.8 48.2 45.3 67.5 42.3
Sensitive Areas
9 Pargaon School 59.3 57.9 50.8 60.9 51.5 46.1 67 41.8
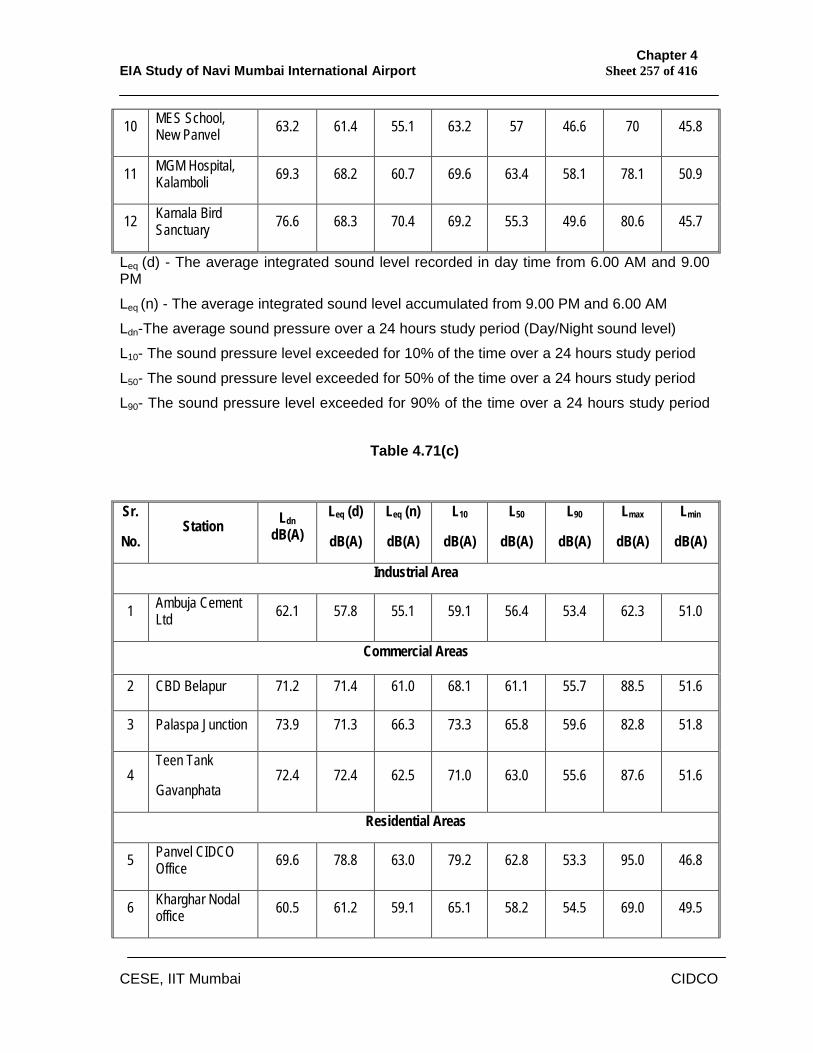
Chapter 4 EIA Study of Navi Mumbai International Airport Sheet 257 of 416
CESE, IIT Mumbai CIDCO
Leq (d) - The average integrated sound level recorded in day time from 6.00 AM and 9.00 PM
Leq (n) - The average integrated sound level accumulated from 9.00 PM and 6.00 AM
Ldn-The average sound pressure over a 24 hours study period (Day/Night sound level)
L10- The sound pressure level exceeded for 10% of the time over a 24 hours study period
L50- The sound pressure level exceeded for 50% of the time over a 24 hours study period
L90- The sound pressure level exceeded for 90% of the time over a 24 hours study period
Table 4.71(c)
10 MES School, New Panvel 63.2 61.4 55.1 63.2 57 46.6 70 45.8
11 MGM Hospital, Kalamboli 69.3 68.2 60.7 69.6 63.4 58.1 78.1 50.9
12 Karnala Bird Sanctuary 76.6 68.3 70.4 69.2 55.3 49.6 80.6 45.7
Sr.
No. Station Ldn
dB(A) Leq (d)
dB(A)
Leq (n)
dB(A)
L10
dB(A)
L50
dB(A)
L90
dB(A)
Lmax
dB(A)
Lmin
dB(A)
Industrial Area
1 Ambuja Cement Ltd 62.1 57.8 55.1 59.1 56.4 53.4 62.3 51.0
Commercial Areas
2 CBD Belapur 71.2 71.4 61.0 68.1 61.1 55.7 88.5 51.6
3 Palaspa Junction 73.9 71.3 66.3 73.3 65.8 59.6 82.8 51.8
4 Teen Tank
Gavanphata 72.4 72.4 62.5 71.0 63.0 55.6 87.6 51.6
Residential Areas
5 Panvel CIDCO Office 69.6 78.8 63.0 79.2 62.8 53.3 95.0 46.8
6 Kharghar Nodal office 60.5 61.2 59.1 65.1 58.2 54.5 69.0 49.5
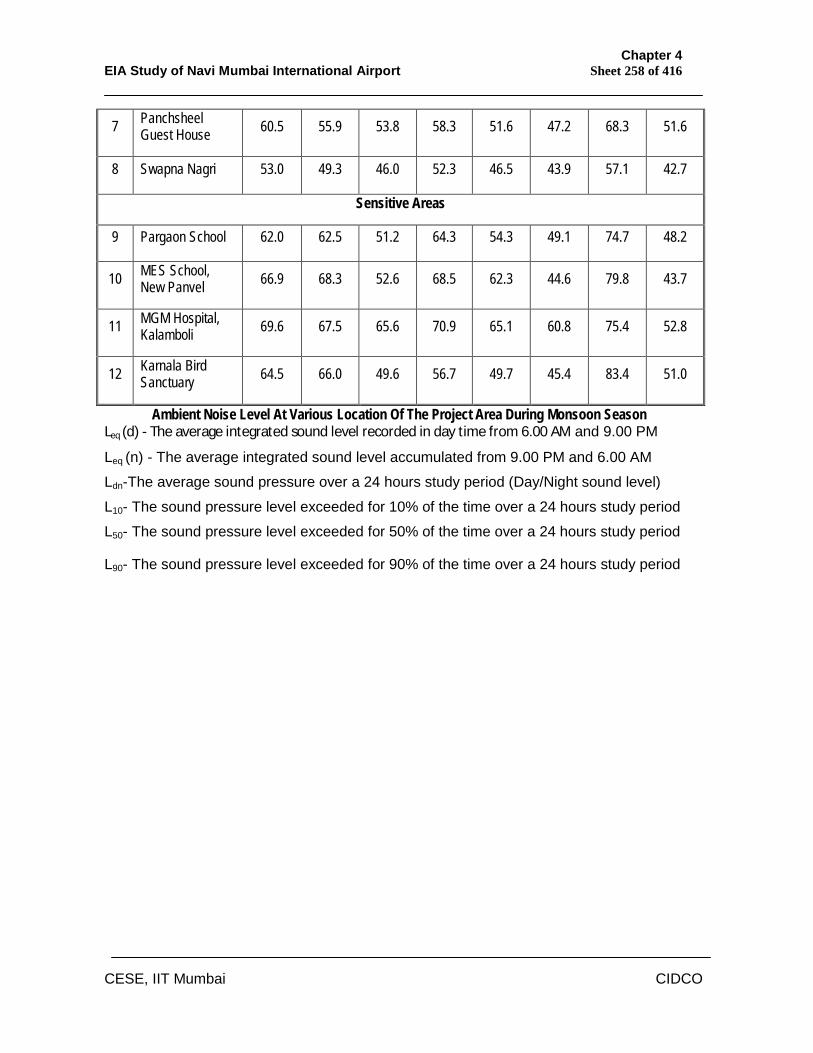
Chapter 4 EIA Study of Navi Mumbai International Airport Sheet 258 of 416
CESE, IIT Mumbai CIDCO
Ambient Noise Level At Various Location Of The Project Area During Monsoon Season Leq (d) - The average integrated sound level recorded in day time from 6.00 AM and 9.00 PM
Leq (n) - The average integrated sound level accumulated from 9.00 PM and 6.00 AM
Ldn-The average sound pressure over a 24 hours study period (Day/Night sound level)
L10- The sound pressure level exceeded for 10% of the time over a 24 hours study period
L50- The sound pressure level exceeded for 50% of the time over a 24 hours study period
L90- The sound pressure level exceeded for 90% of the time over a 24 hours study period
7 Panchsheel Guest House 60.5 55.9 53.8 58.3 51.6 47.2 68.3 51.6
8 Swapna Nagri 53.0 49.3 46.0 52.3 46.5 43.9 57.1 42.7
Sensitive Areas
9 Pargaon School 62.0 62.5 51.2 64.3 54.3 49.1 74.7 48.2
10 MES School, New Panvel 66.9 68.3 52.6 68.5 62.3 44.6 79.8 43.7
11 MGM Hospital, Kalamboli 69.6 67.5 65.6 70.9 65.1 60.8 75.4 52.8
12 Karnala Bird Sanctuary 64.5 66.0 49.6 56.7 49.7 45.4 83.4 51.0
Chapter 4 EIA Study of Navi Mumbai International Airport Sheet 259 of 416
CESE, IIT Mumbai CIDCO
4.11 Ecology
Natural flora and fauna are organized into natural communities and constantly
interact with their physical environment as well as among themselves. They show
various responses and sensitivities to outside influences. Hence, for a meaningful
assessment, It is necessary to fully understand the ecological status of the
proposed site for any development project before evaluating the probable
environmental impact of the project. This impact can be maintained at a minimal
level or can even be ameliorated if the probable shift the proposed activities
envisaged in the project may induce in the dynamic equilibrium maintained in the
ecosystem through the intricate interactions between the operative abiotic and
biotic factors.
For the comprehensive ecological survey and to predict the probable impact of
various stages of the project on the environment, it is necessary to follow the steps
as given below.
a. Recognizance of the area under project and ancillary development
b. Delineation and stratification of the area for ecological assessment
c. Collection of primary (base line) information on ecological features and
ecological values of the area
d. Survey of habitats, communities, distribution trends etc to establish
importance values of species and ecological indices for the communities
e. Assessment of rare, endangered and economically important site
f. Monitoring the existing constraints on wildlife
g. Interpretation of special and ecological data
h. Impact prediction
i. Mitigation planning
The area of the proposed site for the International Airport and the ancillary
developments was visited during pre monsoon season for a rapid assessment of the
kinds of habitats, general status of vegetation, wildlife, rare-endangered species and
also to judge the magnitude of the intended development as well as of the impact this
may have on the environment. Pre monsoon season was selected for rapid
assessment of ecological status of the project area because dry season is critical for
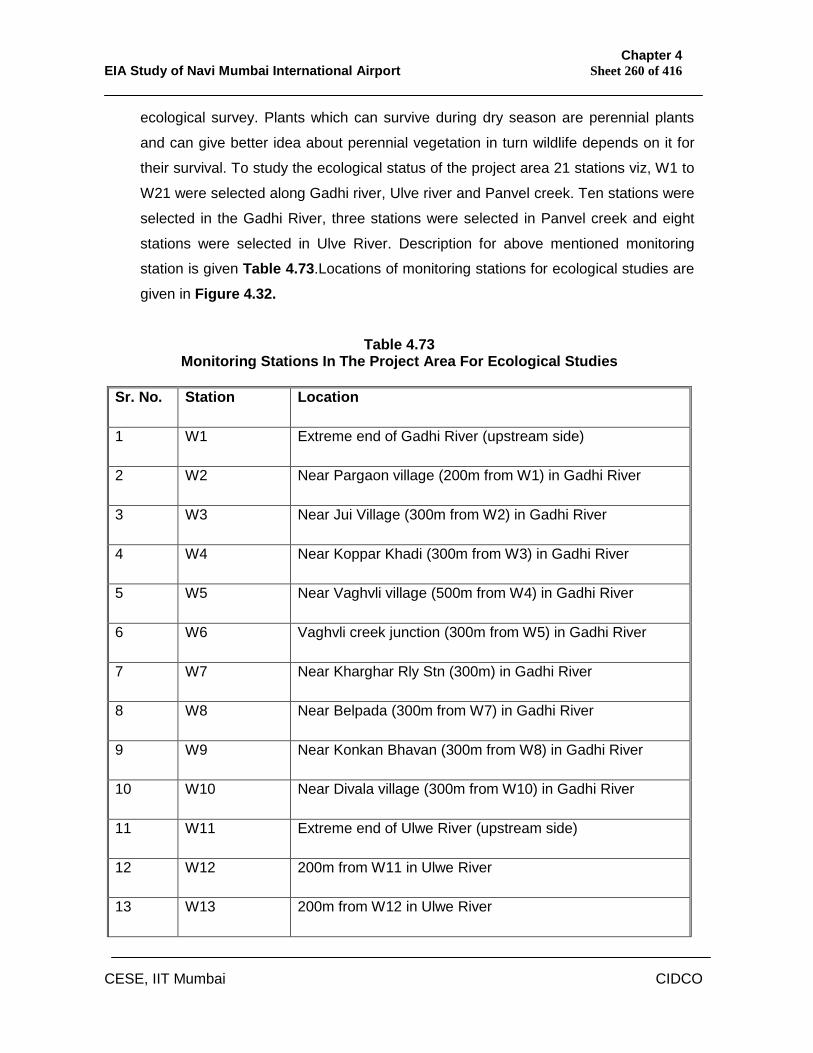
Chapter 4 EIA Study of Navi Mumbai International Airport Sheet 260 of 416
CESE, IIT Mumbai CIDCO
ecological survey. Plants which can survive during dry season are perennial plants
and can give better idea about perennial vegetation in turn wildlife depends on it for
their survival. To study the ecological status of the project area 21 stations viz, W1 to
W21 were selected along Gadhi river, Ulve river and Panvel creek. Ten stations were
selected in the Gadhi River, three stations were selected in Panvel creek and eight
stations were selected in Ulve River. Description for above mentioned monitoring
station is given Table 4.73.Locations of monitoring stations for ecological studies are
given in Figure 4.32.
Table 4.73 Monitoring Stations In The Project Area For Ecological Studies
Sr. No. Station Location
1 W1 Extreme end of Gadhi River (upstream side)
2 W2 Near Pargaon village (200m from W1) in Gadhi River
3 W3 Near Jui Village (300m from W2) in Gadhi River
4 W4 Near Koppar Khadi (300m from W3) in Gadhi River
5 W5 Near Vaghvli village (500m from W4) in Gadhi River
6 W6 Vaghvli creek junction (300m from W5) in Gadhi River
7 W7 Near Kharghar Rly Stn (300m) in Gadhi River
8 W8 Near Belpada (300m from W7) in Gadhi River
9 W9 Near Konkan Bhavan (300m from W8) in Gadhi River
10 W10 Near Divala village (300m from W10) in Gadhi River
11 W11 Extreme end of Ulwe River (upstream side)
12 W12 200m from W11 in Ulwe River
13 W13 200m from W12 in Ulwe River
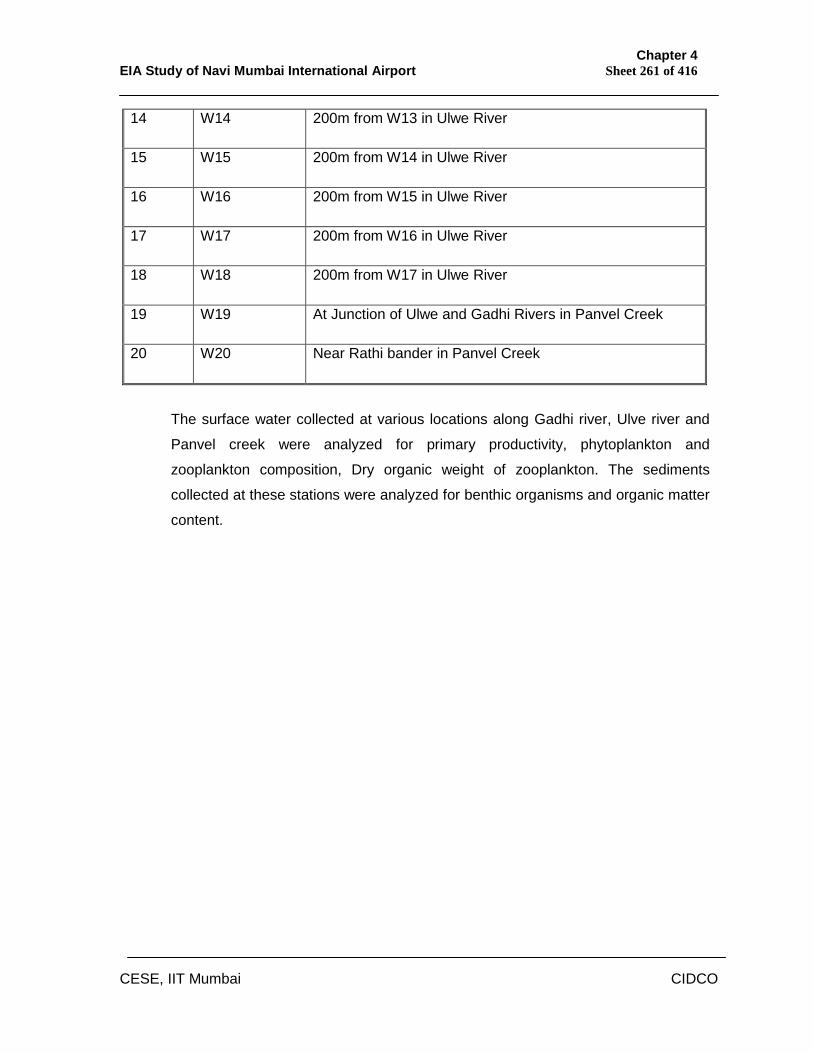
Chapter 4 EIA Study of Navi Mumbai International Airport Sheet 261 of 416
CESE, IIT Mumbai CIDCO
14 W14 200m from W13 in Ulwe River
15 W15 200m from W14 in Ulwe River
16 W16 200m from W15 in Ulwe River
17 W17 200m from W16 in Ulwe River
18 W18 200m from W17 in Ulwe River
19 W19 At Junction of Ulwe and Gadhi Rivers in Panvel Creek
20 W20 Near Rathi bander in Panvel Creek
The surface water collected at various locations along Gadhi river, Ulve river and
Panvel creek were analyzed for primary productivity, phytoplankton and
zooplankton composition, Dry organic weight of zooplankton. The sediments
collected at these stations were analyzed for benthic organisms and organic matter
content.
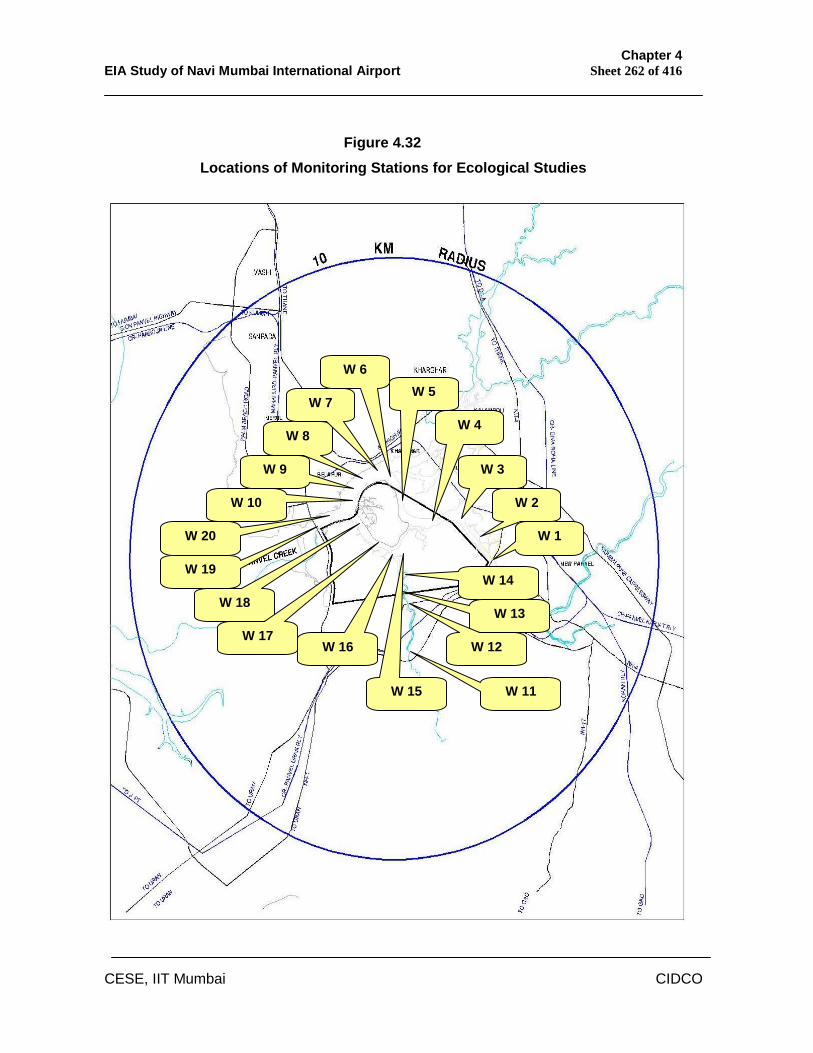
Chapter 4 EIA Study of Navi Mumbai International Airport Sheet 262 of 416
CESE, IIT Mumbai CIDCO
Figure 4.32 Locations of Monitoring Stations for Ecological Studies
W 15
W 14
W 13
W 12
W 11
W 10
W 9
W 8
W 7
W 6
W 1
W 5
W 4
W 3
W 2
W 20
W 19
W 18
W 17 W 16
Chapter 4 EIA Study of Navi Mumbai International Airport Sheet 263 of 416
CESE, IIT Mumbai CIDCO
4.11.1 Terrestrial Habitats The satellite images of the area were used to determine the more sensitive
areas for rigorous assessment. For the survey of the terrestrial habitat, 45
stations spread across the entire project area were surveyed. For the ease
in visiting them repeatedly, they have been numbered starting from the
approach road entering the project area near Targhar. The Ulve river,
Gandhi river and Panvel creek were assessed in mechanized boats. The
sample plots were chosen and the terrestrial habitats were surveyed using
quadrant and transect methods for assessing biotic communities. The
commonly accepted plot sizes of 0.1sq.m for soil covered with mosses,
lichens, and liverworts, 1.0 sq.m for herbaceous vegetation as well as
grasses, 10-20sq.m for shrubs and 100sq.m for tree communities were
intended for use. The 1st and the last plot sizes were eliminated due to the
lack of such localities. The line transect method has particular value in
assessing vegetation transition zones and requires minimum time as well as
equipments so that this too was frequently used. The standing crop biomass
was assessed by clipping all the vegetation above ground from sample
quadrants. A metal cylinder of the dimension 2.5``x10`` was dug into the
ground in sample plots and the withdrawn samples of soil were examined
for soil biota, soil texture etc.
4.11.2 Avifauna
A total number of 58 species of birds including aquatic birds were
identified during the ecological survey during different season. The Table 4.74 gives the list of Avifauna recorded in the study area. The most
striking was the avifauna and due to the active locomotion of their body
cataloguing species list method was applied in the assessment. The fauna
being very scarce the drive count/call count methods were not applicable.
The density measurement by counting crab holes was possible at only few
places. The mark-recapture method was also not practicable.
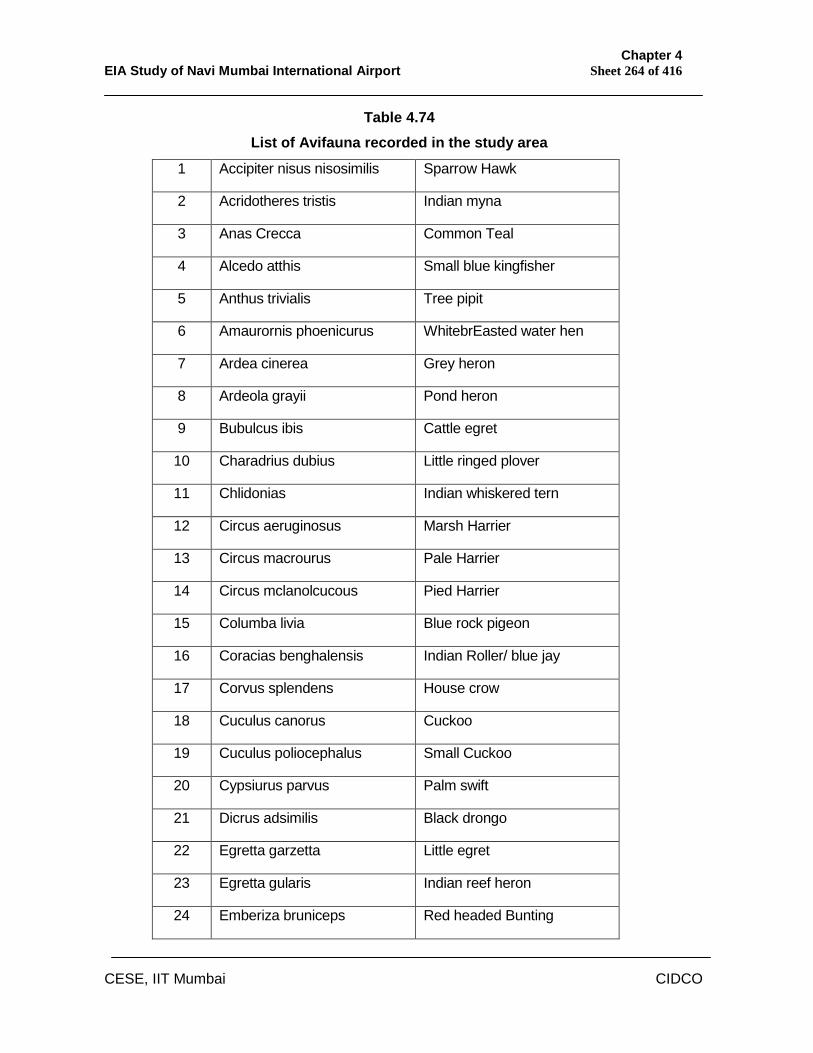
Chapter 4 EIA Study of Navi Mumbai International Airport Sheet 264 of 416
CESE, IIT Mumbai CIDCO
Table 4.74 List of Avifauna recorded in the study area
1 Accipiter nisus nisosimilis Sparrow Hawk
2 Acridotheres tristis Indian myna
3 Anas Crecca Common Teal
4 Alcedo atthis Small blue kingfisher
5 Anthus trivialis Tree pipit
6 Amaurornis phoenicurus WhitebrEasted water hen
7 Ardea cinerea Grey heron
8 Ardeola grayii Pond heron
9 Bubulcus ibis Cattle egret
10 Charadrius dubius Little ringed plover
11 Chlidonias Indian whiskered tern
12 Circus aeruginosus Marsh Harrier
13 Circus macrourus Pale Harrier
14 Circus mclanolcucous Pied Harrier
15 Columba livia Blue rock pigeon
16 Coracias benghalensis Indian Roller/ blue jay
17 Corvus splendens House crow
18 Cuculus canorus Cuckoo
19 Cuculus poliocephalus Small Cuckoo
20 Cypsiurus parvus Palm swift
21 Dicrus adsimilis Black drongo
22 Egretta garzetta Little egret
23 Egretta gularis Indian reef heron
24 Emberiza bruniceps Red headed Bunting
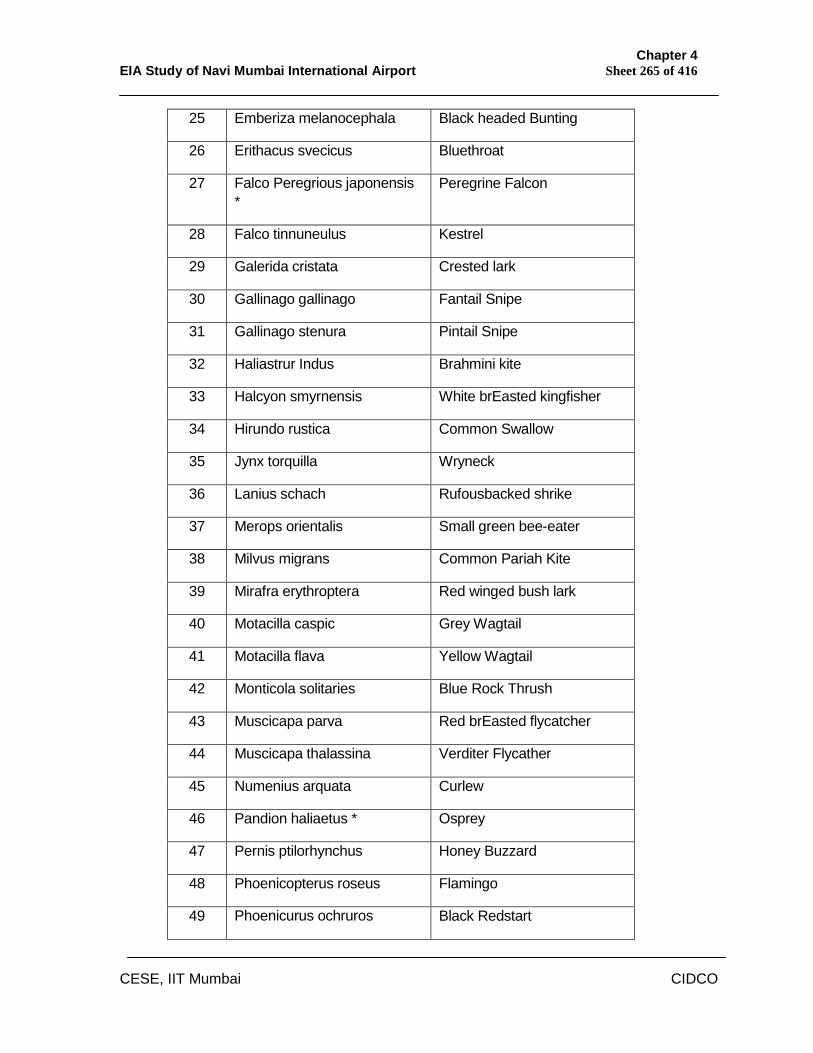
Chapter 4 EIA Study of Navi Mumbai International Airport Sheet 265 of 416
CESE, IIT Mumbai CIDCO
25 Emberiza melanocephala Black headed Bunting
26 Erithacus svecicus Bluethroat
27 Falco Peregrious japonensis *
Peregrine Falcon
28 Falco tinnuneulus Kestrel
29 Galerida cristata Crested lark
30 Gallinago gallinago Fantail Snipe
31 Gallinago stenura Pintail Snipe
32 Haliastrur Indus Brahmini kite
33 Halcyon smyrnensis White brEasted kingfisher
34 Hirundo rustica Common Swallow
35 Jynx torquilla Wryneck
36 Lanius schach Rufousbacked shrike
37 Merops orientalis Small green bee-eater
38 Milvus migrans Common Pariah Kite
39 Mirafra erythroptera Red winged bush lark
40 Motacilla caspic Grey Wagtail
41 Motacilla flava Yellow Wagtail
42 Monticola solitaries Blue Rock Thrush
43 Muscicapa parva Red brEasted flycatcher
44 Muscicapa thalassina Verditer Flycather
45 Numenius arquata Curlew
46 Pandion haliaetus * Osprey
47 Pernis ptilorhynchus Honey Buzzard
48 Phoenicopterus roseus Flamingo
49 Phoenicurus ochruros Black Redstart
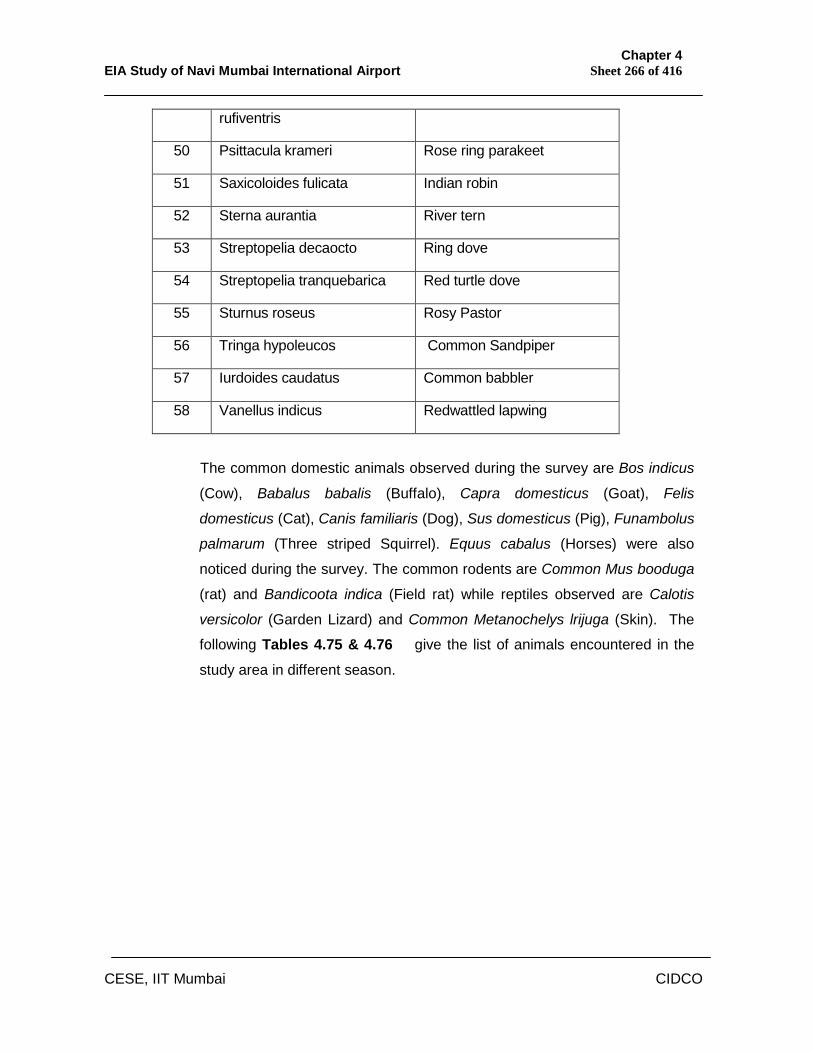
Chapter 4 EIA Study of Navi Mumbai International Airport Sheet 266 of 416
CESE, IIT Mumbai CIDCO
rufiventris
50 Psittacula krameri Rose ring parakeet
51 Saxicoloides fulicata Indian robin
52 Sterna aurantia River tern
53 Streptopelia decaocto Ring dove
54 Streptopelia tranquebarica Red turtle dove
55 Sturnus roseus Rosy Pastor
56 Tringa hypoleucos Common Sandpiper
57 Iurdoides caudatus Common babbler
58 Vanellus indicus Redwattled lapwing
The common domestic animals observed during the survey are Bos indicus
(Cow), Babalus babalis (Buffalo), Capra domesticus (Goat), Felis
domesticus (Cat), Canis familiaris (Dog), Sus domesticus (Pig), Funambolus
palmarum (Three striped Squirrel). Equus cabalus (Horses) were also
noticed during the survey. The common rodents are Common Mus booduga
(rat) and Bandicoota indica (Field rat) while reptiles observed are Calotis
versicolor (Garden Lizard) and Common Metanochelys lrijuga (Skin). The
following Tables 4.75 & 4.76 give the list of animals encountered in the
study area in different season.
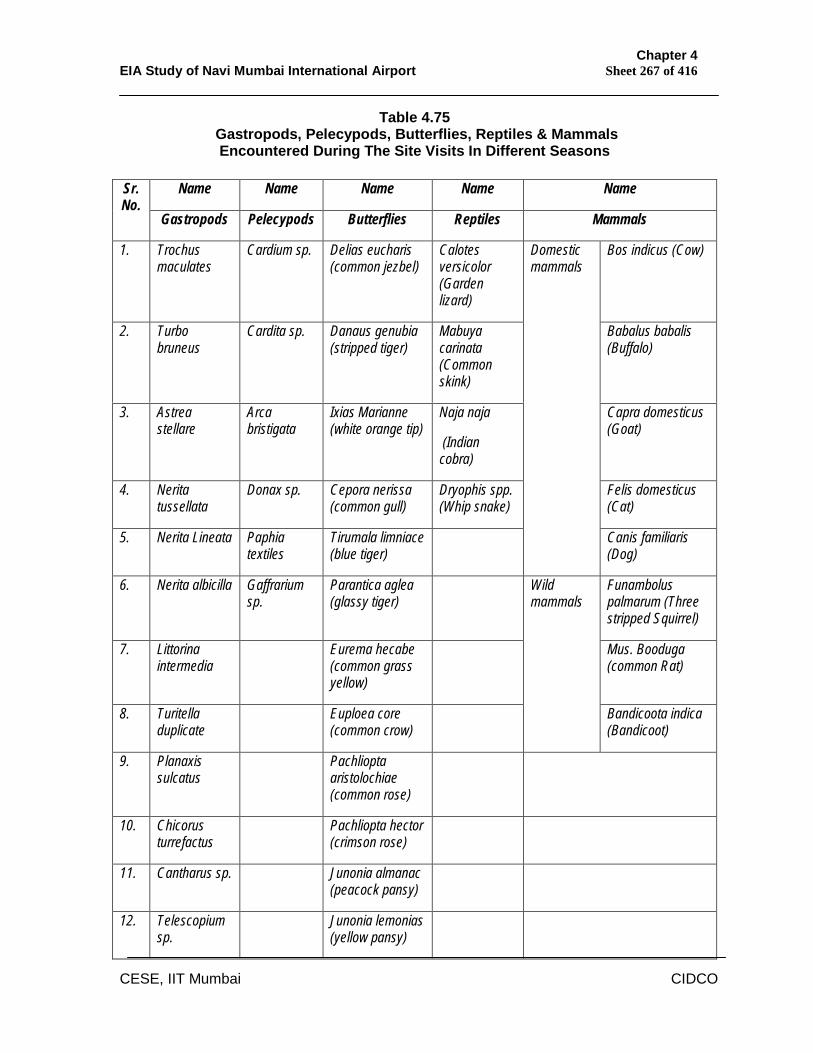
Chapter 4 EIA Study of Navi Mumbai International Airport Sheet 267 of 416
CESE, IIT Mumbai CIDCO
Table 4.75 Gastropods, Pelecypods, Butterflies, Reptiles & Mammals Encountered During The Site Visits In Different Seasons
Name Name Name Name Name Sr. No.
Gastropods Pelecypods Butterflies Reptiles Mammals
1. Trochus maculates
Cardium sp. Delias eucharis (common jezbel)
Calotes versicolor (Garden lizard)
Bos indicus (Cow)
2. Turbo bruneus
Cardita sp. Danaus genubia (stripped tiger)
Mabuya carinata (Common skink)
Babalus babalis (Buffalo)
3. Astrea stellare
Arca bristigata
Ixias Marianne (white orange tip)
Naja naja
(Indian cobra)
Capra domesticus (Goat)
4. Nerita tussellata
Donax sp. Cepora nerissa (common gull)
Dryophis spp. (Whip snake)
Felis domesticus (Cat)
5. Nerita Lineata Paphia textiles
Tirumala limniace (blue tiger)
Domestic mammals
Canis familiaris (Dog)
6. Nerita albicilla Gaffrarium sp.
Parantica aglea (glassy tiger)
Funambolus palmarum (Three stripped Squirrel)
7. Littorina intermedia
Eurema hecabe (common grass yellow)
Mus. Booduga (common Rat)
8. Turitella duplicate
Euploea core (common crow)
Wild mammals
Bandicoota indica (Bandicoot)
9. Planaxis sulcatus
Pachliopta aristolochiae (common rose)
10. Chicorus turrefactus
Pachliopta hector (crimson rose)
11. Cantharus sp. Junonia almanac (peacock pansy)
12. Telescopium sp.
Junonia lemonias (yellow pansy)
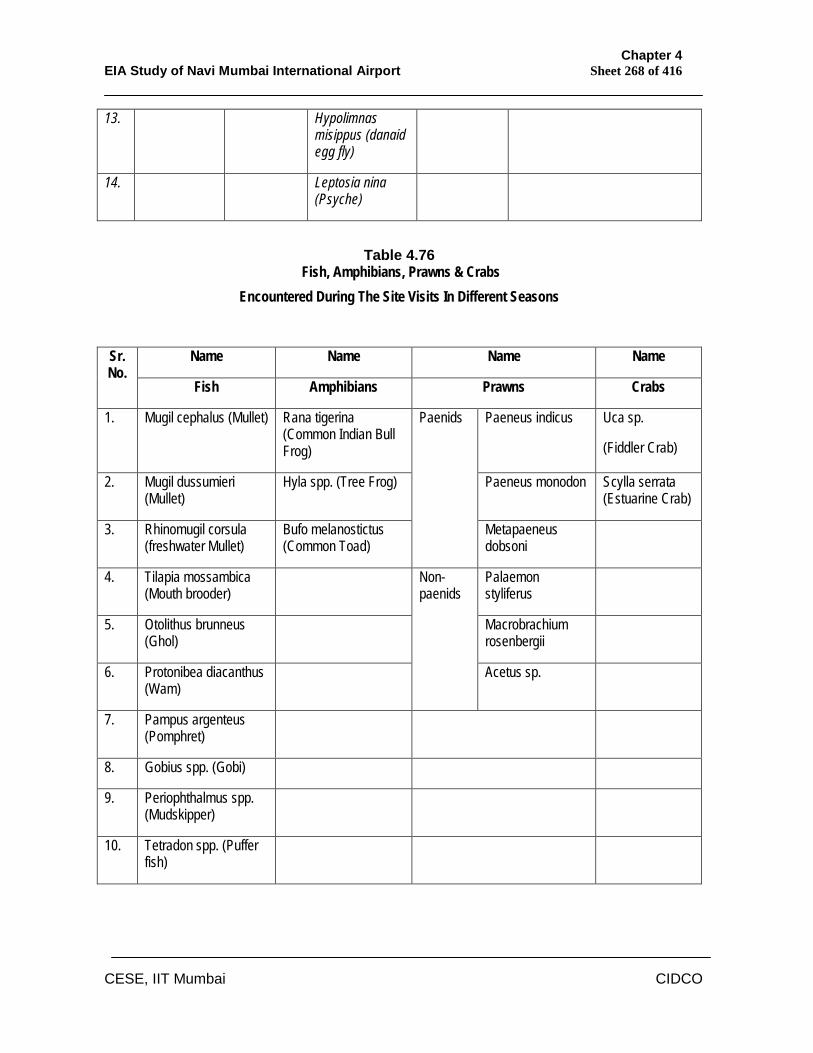
Chapter 4 EIA Study of Navi Mumbai International Airport Sheet 268 of 416
CESE, IIT Mumbai CIDCO
Table 4.76 Fish, Amphibians, Prawns & Crabs
Encountered During The Site Visits In Different Seasons
13. Hypolimnas misippus (danaid egg fly)
14. Leptosia nina (Psyche)
Name Name Name Name Sr. No.
Fish Amphibians Prawns Crabs
1. Mugil cephalus (Mullet) Rana tigerina (Common Indian Bull Frog)
Paeneus indicus Uca sp.
(Fiddler Crab)
2. Mugil dussumieri (Mullet)
Hyla spp. (Tree Frog) Paeneus monodon Scylla serrata (Estuarine Crab)
3. Rhinomugil corsula (freshwater Mullet)
Bufo melanostictus (Common Toad)
Paenids
Metapaeneus dobsoni
4. Tilapia mossambica (Mouth brooder)
Palaemon styliferus
5. Otolithus brunneus (Ghol)
Macrobrachium rosenbergii
6. Protonibea diacanthus (Wam)
Non-paenids
Acetus sp.
7. Pampus argenteus (Pomphret)
8. Gobius spp. (Gobi)
9. Periophthalmus spp. (Mudskipper)
10. Tetradon spp. (Puffer fish)
Chapter 4 EIA Study of Navi Mumbai International Airport Sheet 269 of 416
CESE, IIT Mumbai CIDCO
The surface water was collected for assessing the primary productivity and
for analyzing phytoplankton following the treatment with Lugol’s iodine.
Depth was ganged using meter marked strings while the sechhi disc was
used to determine turbidity. The sediment samples were examined for
mesobenthos and the organic content was estimated by the Walkley and
Black method. 4.11.3 Habitats Encountered In the Project Area
1. Open land
2. Salt Marshes
3. Mangrove forest
4. Agricultural lands
5. Man-made groves
Over 50% of the 1615 hectare area under the project is under open land.
The salt marshes cover another 25% area while 10% is under mangrove
forest. Rain fed agriculture occupies barely 7% area while the rest has other
uses including man-made groves, brick kilns, stone quarries etc.
1. Open Land
The open land includes the hilly terrain extending NW and is towards the
SW end of the proposed runway. Both the proposed runways would be
across this terrain in the Southern half. The Ulwe-Targhar side of the hill,
which is the west side of the hill, is with very poor soil cover with the rock
crops exposed at places in pre-monsoon season though in monsoon season
there were plenty of herbs, grasses and bryophytes. Except for some
sparse growth of bamboos and manually planted trees between and
around the houses of the villages, there is hardly any vegetation in pre-
monsoon season though in monsoon the region was lush green due to the
growth of annual herbs and grasses. The soil cover of Bryophytes was also
noticed at certain places. In the post-monsoon season most of the grasses,
herbs and many of the shrubs were already dried. The overall impression
was that the standing crop biomass as well as diversity and density of the
Chapter 4 EIA Study of Navi Mumbai International Airport Sheet 270 of 416
CESE, IIT Mumbai CIDCO
plants were almost same as in pre-monsoon season, at most of the plots
surveyed. At places, these parameters were marginally poorer than in pre-
monsoon, indicating a trend towards progressive degradation of the habitat.
The hill has a number of quarries and stone crushing sites particularly facing
NE. These activities have already caused the NE slopes of the hill and a
considerable adjacent area to be denuded of its vegetation cover. Even the
mangroves and other vegetation between the hill and Ulwe River seem to
have been severely affected by the dust load they have to carry. In
monsoon, though, the dust load seems to get washed away and the
seasonal hers and grasses seem to grow at all conceivable places. The
slopes of all hillocks and hills were with abundant moisture and growth of
annual herbs, grasses and ground cover of algae/bryophytes.
In post monsoon season, it was noticed that the stone quarrying, breaking
and crushing activities had increased still further. The soil cover was found
totally degraded and the seasonal growth of grasses, herbs and shrubs had
already vanished or dried completely.. The man-made groves, particularly of
Bamboos stand out in stark contrast, particularly at Targhar. At a few
locations, herbs adapted to survive in adverse, dry conditions were however
noticed. The dust load was apparently even more than in pre-monsoon. The
vegetation between the stone quarries/ crushers and the Ulwe River,
already degraded, was found almost vanished in large patches. The grassy
plains along Pargaon had also dried and at a few places, commercial
exploitation of this grass was also noticed.
2. Salt Marshes Right from Targhar in the west to Pargaon in the East and Vaghvli in North
to Ulwe and Mulgaon in South, there are scattered marshes. These are,
however, more common in the Eastern region of the site of proposed airport
than in the west. Many of the marshes seem to be the abandoned prawn
culture ponds and therefore man-made rather than natural. There is no trace
of life in majority of them and anaerobic conditions seem to prevail. At many
Chapter 4 EIA Study of Navi Mumbai International Airport Sheet 271 of 416
CESE, IIT Mumbai CIDCO
places the salt seemed have precipitated, making the conditions even more
stressed, so that no life could propagate.
In monsoon the salts seemed to have been washed away from many of
these places and some sparse growth of herbs and grasses was evident.
The marshes formed due to tidal activity are however with life and a variety
of gastropods as well as fiddler crabs dominate the macrofauna. The
microfauna are dominated by a variety of foraminiferans. The mud is quite
rich in organic content and out welling from it must be proving beneficial for
the life in Ulwe as well as Gadhi River. The organic contents were, however,
found to have been depleted during monsoon, probably due to washing
away and/or dripping to the deeper layers. The productivity of the waters of
the two Rivers was also found to have decreased in monsoon supporting
the assumption.
In post-monsoon survey it was noticed that the marshes were already drying
fast . A few were totally dry . Some were found to be still productive and
fishing efforts being put in by the local population were evident . Majority of
these marshes are not supporting much of the biota. At several of the
commercially exploited, man-made marshes, the post-monsoon survey
revealed excessive algal growth or break for maintenance . The pump sets
for drawing creek water into these ponds could be noticed at few places.
The discussion with local prawn farmers, however, revealed that many of
the farm operations are not being done professionally and are not very
profitable.
Some marshes along the creek showed scanty life forms. They included
barnacles , fiddler crabs, hermit crabs, various gastropods, mudskippers
and some egg masses.
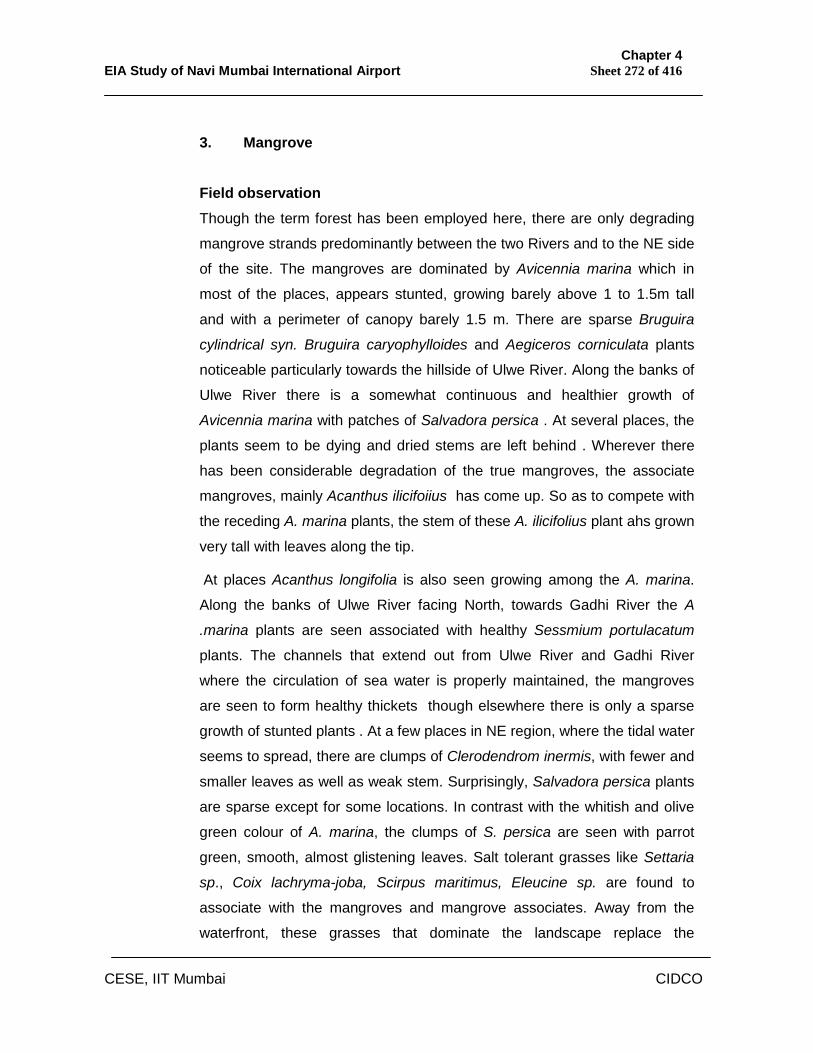
Chapter 4 EIA Study of Navi Mumbai International Airport Sheet 272 of 416
CESE, IIT Mumbai CIDCO
3. Mangrove Field observation Though the term forest has been employed here, there are only degrading
mangrove strands predominantly between the two Rivers and to the NE side
of the site. The mangroves are dominated by Avicennia marina which in
most of the places, appears stunted, growing barely above 1 to 1.5m tall
and with a perimeter of canopy barely 1.5 m. There are sparse Bruguira
cylindrical syn. Bruguira caryophylloides and Aegiceros corniculata plants
noticeable particularly towards the hillside of Ulwe River. Along the banks of
Ulwe River there is a somewhat continuous and healthier growth of
Avicennia marina with patches of Salvadora persica . At several places, the
plants seem to be dying and dried stems are left behind . Wherever there
has been considerable degradation of the true mangroves, the associate
mangroves, mainly Acanthus ilicifoiius has come up. So as to compete with
the receding A. marina plants, the stem of these A. ilicifolius plant ahs grown
very tall with leaves along the tip.
At places Acanthus longifolia is also seen growing among the A. marina.
Along the banks of Ulwe River facing North, towards Gadhi River the A
.marina plants are seen associated with healthy Sessmium portulacatum
plants. The channels that extend out from Ulwe River and Gadhi River
where the circulation of sea water is properly maintained, the mangroves
are seen to form healthy thickets though elsewhere there is only a sparse
growth of stunted plants . At a few places in NE region, where the tidal water
seems to spread, there are clumps of Clerodendrom inermis, with fewer and
smaller leaves as well as weak stem. Surprisingly, Salvadora persica plants
are sparse except for some locations. In contrast with the whitish and olive
green colour of A. marina, the clumps of S. persica are seen with parrot
green, smooth, almost glistening leaves. Salt tolerant grasses like Settaria
sp., Coix lachryma-joba, Scirpus maritimus, Eleucine sp. are found to
associate with the mangroves and mangrove associates. Away from the
waterfront, these grasses that dominate the landscape replace the
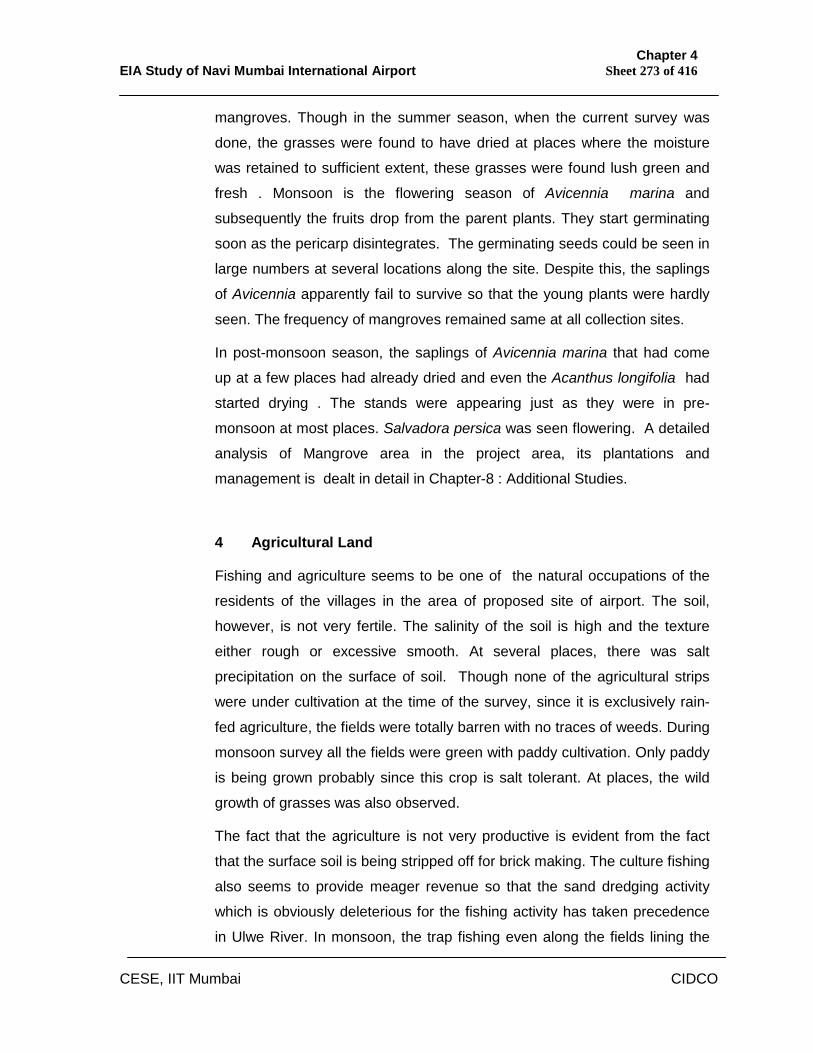
Chapter 4 EIA Study of Navi Mumbai International Airport Sheet 273 of 416
CESE, IIT Mumbai CIDCO
mangroves. Though in the summer season, when the current survey was
done, the grasses were found to have dried at places where the moisture
was retained to sufficient extent, these grasses were found lush green and
fresh . Monsoon is the flowering season of Avicennia marina and
subsequently the fruits drop from the parent plants. They start germinating
soon as the pericarp disintegrates. The germinating seeds could be seen in
large numbers at several locations along the site. Despite this, the saplings
of Avicennia apparently fail to survive so that the young plants were hardly
seen. The frequency of mangroves remained same at all collection sites.
In post-monsoon season, the saplings of Avicennia marina that had come
up at a few places had already dried and even the Acanthus longifolia had
started drying . The stands were appearing just as they were in pre-
monsoon at most places. Salvadora persica was seen flowering. A detailed
analysis of Mangrove area in the project area, its plantations and
management is dealt in detail in Chapter-8 : Additional Studies.
4 Agricultural Land
Fishing and agriculture seems to be one of the natural occupations of the
residents of the villages in the area of proposed site of airport. The soil,
however, is not very fertile. The salinity of the soil is high and the texture
either rough or excessive smooth. At several places, there was salt
precipitation on the surface of soil. Though none of the agricultural strips
were under cultivation at the time of the survey, since it is exclusively rain-
fed agriculture, the fields were totally barren with no traces of weeds. During
monsoon survey all the fields were green with paddy cultivation. Only paddy
is being grown probably since this crop is salt tolerant. At places, the wild
growth of grasses was also observed.
The fact that the agriculture is not very productive is evident from the fact
that the surface soil is being stripped off for brick making. The culture fishing
also seems to provide meager revenue so that the sand dredging activity
which is obviously deleterious for the fishing activity has taken precedence
in Ulwe River. In monsoon, the trap fishing even along the fields lining the
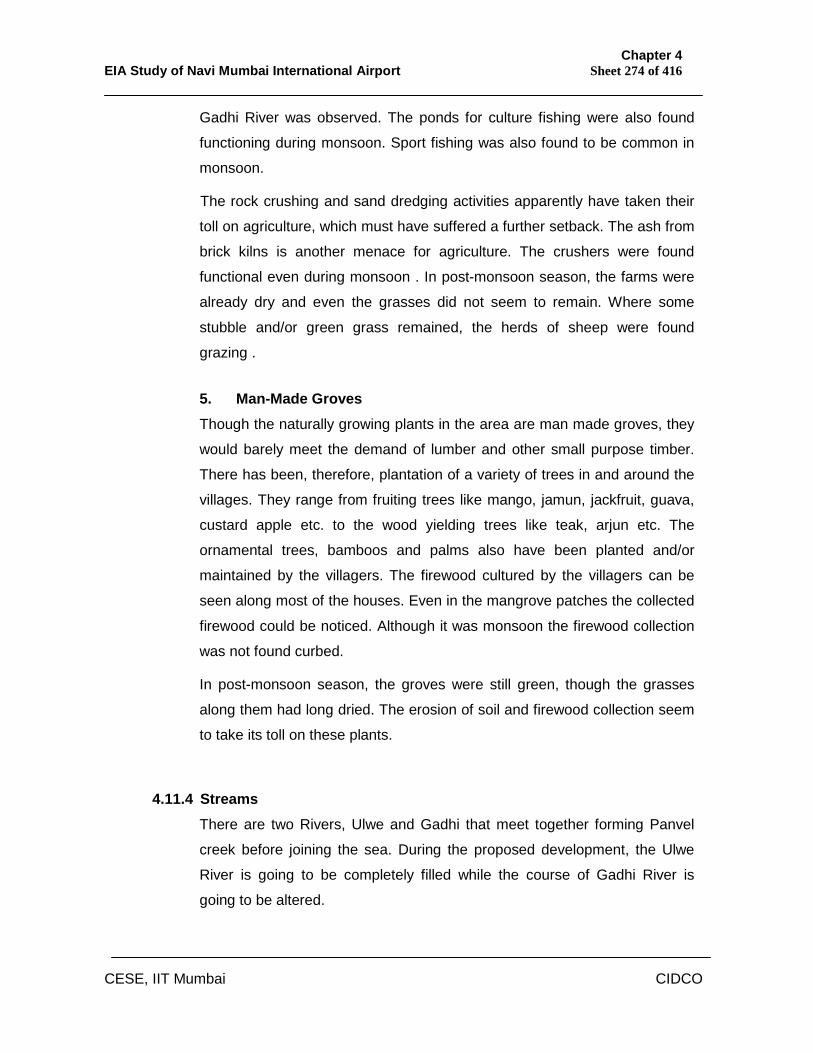
Chapter 4 EIA Study of Navi Mumbai International Airport Sheet 274 of 416
CESE, IIT Mumbai CIDCO
Gadhi River was observed. The ponds for culture fishing were also found
functioning during monsoon. Sport fishing was also found to be common in
monsoon.
The rock crushing and sand dredging activities apparently have taken their
toll on agriculture, which must have suffered a further setback. The ash from
brick kilns is another menace for agriculture. The crushers were found
functional even during monsoon . In post-monsoon season, the farms were
already dry and even the grasses did not seem to remain. Where some
stubble and/or green grass remained, the herds of sheep were found
grazing .
5. Man-Made Groves Though the naturally growing plants in the area are man made groves, they
would barely meet the demand of lumber and other small purpose timber.
There has been, therefore, plantation of a variety of trees in and around the
villages. They range from fruiting trees like mango, jamun, jackfruit, guava,
custard apple etc. to the wood yielding trees like teak, arjun etc. The
ornamental trees, bamboos and palms also have been planted and/or
maintained by the villagers. The firewood cultured by the villagers can be
seen along most of the houses. Even in the mangrove patches the collected
firewood could be noticed. Although it was monsoon the firewood collection
was not found curbed.
In post-monsoon season, the groves were still green, though the grasses
along them had long dried. The erosion of soil and firewood collection seem
to take its toll on these plants.
4.11.4 Streams There are two Rivers, Ulwe and Gadhi that meet together forming Panvel
creek before joining the sea. During the proposed development, the Ulwe
River is going to be completely filled while the course of Gadhi River is
going to be altered.
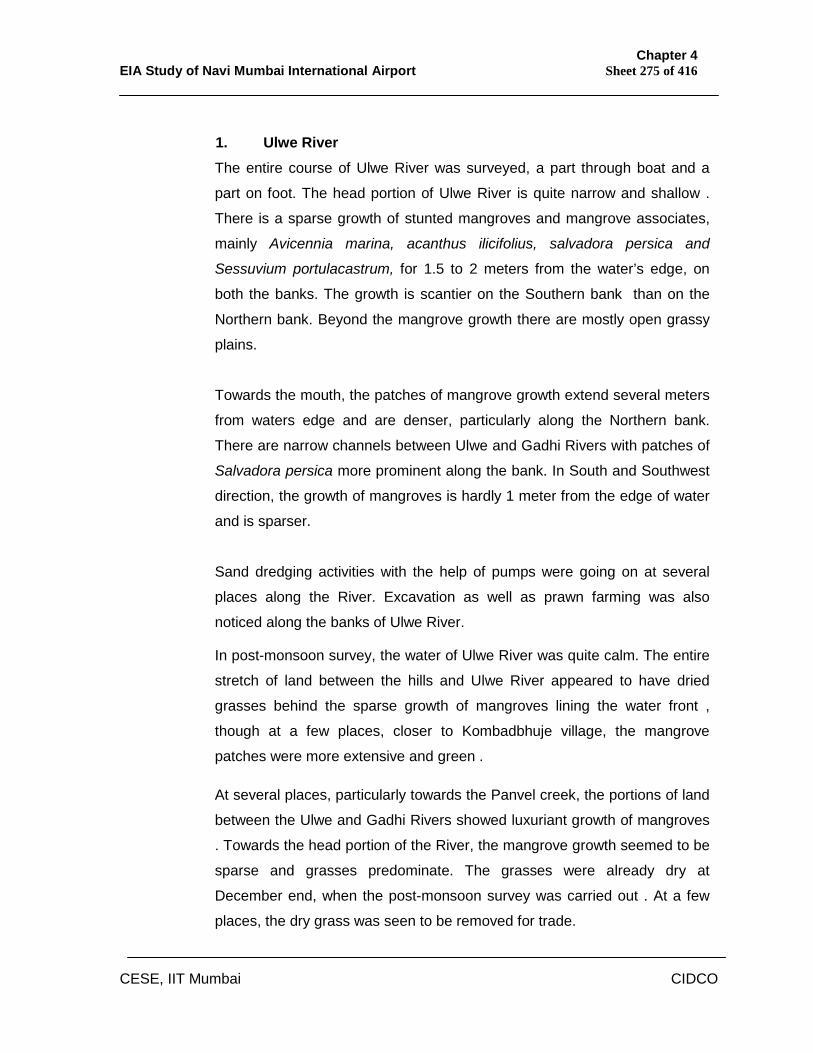
Chapter 4 EIA Study of Navi Mumbai International Airport Sheet 275 of 416
CESE, IIT Mumbai CIDCO
1. Ulwe River The entire course of Ulwe River was surveyed, a part through boat and a
part on foot. The head portion of Ulwe River is quite narrow and shallow .
There is a sparse growth of stunted mangroves and mangrove associates,
mainly Avicennia marina, acanthus ilicifolius, salvadora persica and
Sessuvium portulacastrum, for 1.5 to 2 meters from the water’s edge, on
both the banks. The growth is scantier on the Southern bank than on the
Northern bank. Beyond the mangrove growth there are mostly open grassy
plains.
Towards the mouth, the patches of mangrove growth extend several meters
from waters edge and are denser, particularly along the Northern bank.
There are narrow channels between Ulwe and Gadhi Rivers with patches of
Salvadora persica more prominent along the bank. In South and Southwest
direction, the growth of mangroves is hardly 1 meter from the edge of water
and is sparser.
Sand dredging activities with the help of pumps were going on at several
places along the River. Excavation as well as prawn farming was also
noticed along the banks of Ulwe River.
In post-monsoon survey, the water of Ulwe River was quite calm. The entire
stretch of land between the hills and Ulwe River appeared to have dried
grasses behind the sparse growth of mangroves lining the water front ,
though at a few places, closer to Kombadbhuje village, the mangrove
patches were more extensive and green .
At several places, particularly towards the Panvel creek, the portions of land
between the Ulwe and Gadhi Rivers showed luxuriant growth of mangroves
. Towards the head portion of the River, the mangrove growth seemed to be
sparse and grasses predominate. The grasses were already dry at
December end, when the post-monsoon survey was carried out . At a few
places, the dry grass was seen to be removed for trade.
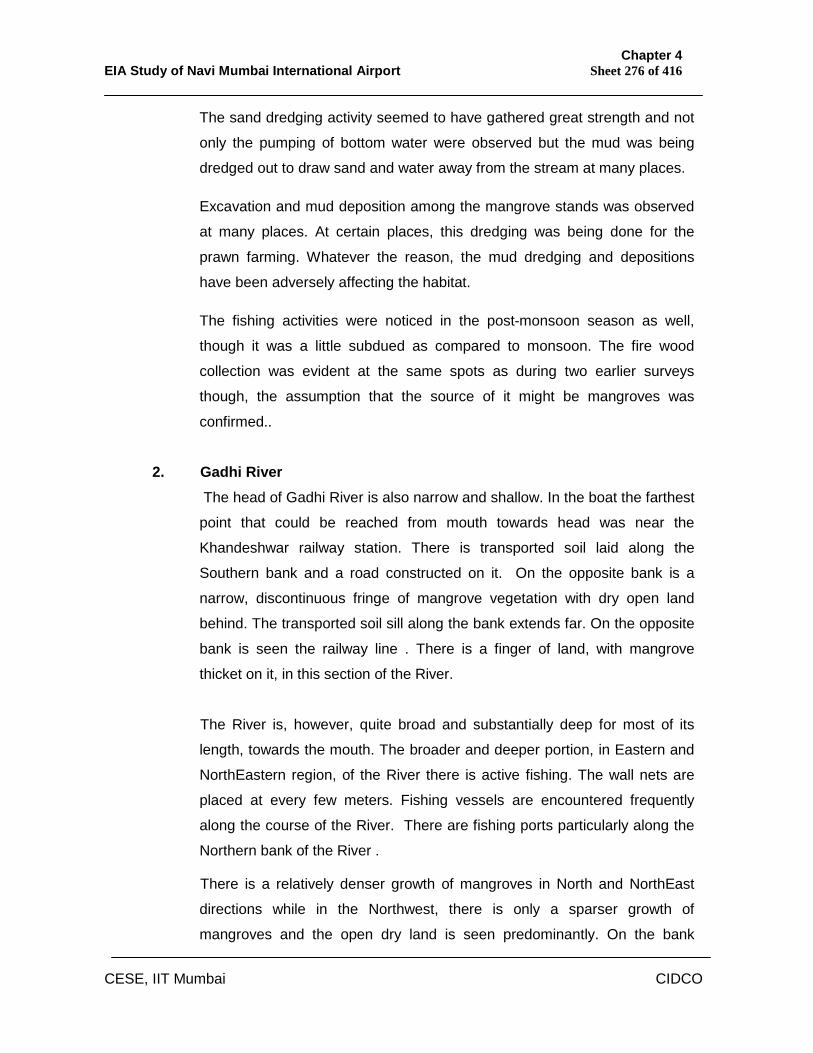
Chapter 4 EIA Study of Navi Mumbai International Airport Sheet 276 of 416
CESE, IIT Mumbai CIDCO
The sand dredging activity seemed to have gathered great strength and not
only the pumping of bottom water were observed but the mud was being
dredged out to draw sand and water away from the stream at many places.
Excavation and mud deposition among the mangrove stands was observed
at many places. At certain places, this dredging was being done for the
prawn farming. Whatever the reason, the mud dredging and depositions
have been adversely affecting the habitat.
The fishing activities were noticed in the post-monsoon season as well,
though it was a little subdued as compared to monsoon. The fire wood
collection was evident at the same spots as during two earlier surveys
though, the assumption that the source of it might be mangroves was
confirmed..
2. Gadhi River
The head of Gadhi River is also narrow and shallow. In the boat the farthest
point that could be reached from mouth towards head was near the
Khandeshwar railway station. There is transported soil laid along the
Southern bank and a road constructed on it. On the opposite bank is a
narrow, discontinuous fringe of mangrove vegetation with dry open land
behind. The transported soil sill along the bank extends far. On the opposite
bank is seen the railway line . There is a finger of land, with mangrove
thicket on it, in this section of the River.
The River is, however, quite broad and substantially deep for most of its
length, towards the mouth. The broader and deeper portion, in Eastern and
NorthEastern region, of the River there is active fishing. The wall nets are
placed at every few meters. Fishing vessels are encountered frequently
along the course of the River. There are fishing ports particularly along the
Northern bank of the River .
There is a relatively denser growth of mangroves in North and NorthEast
directions while in the Northwest, there is only a sparser growth of
mangroves and the open dry land is seen predominantly. On the bank
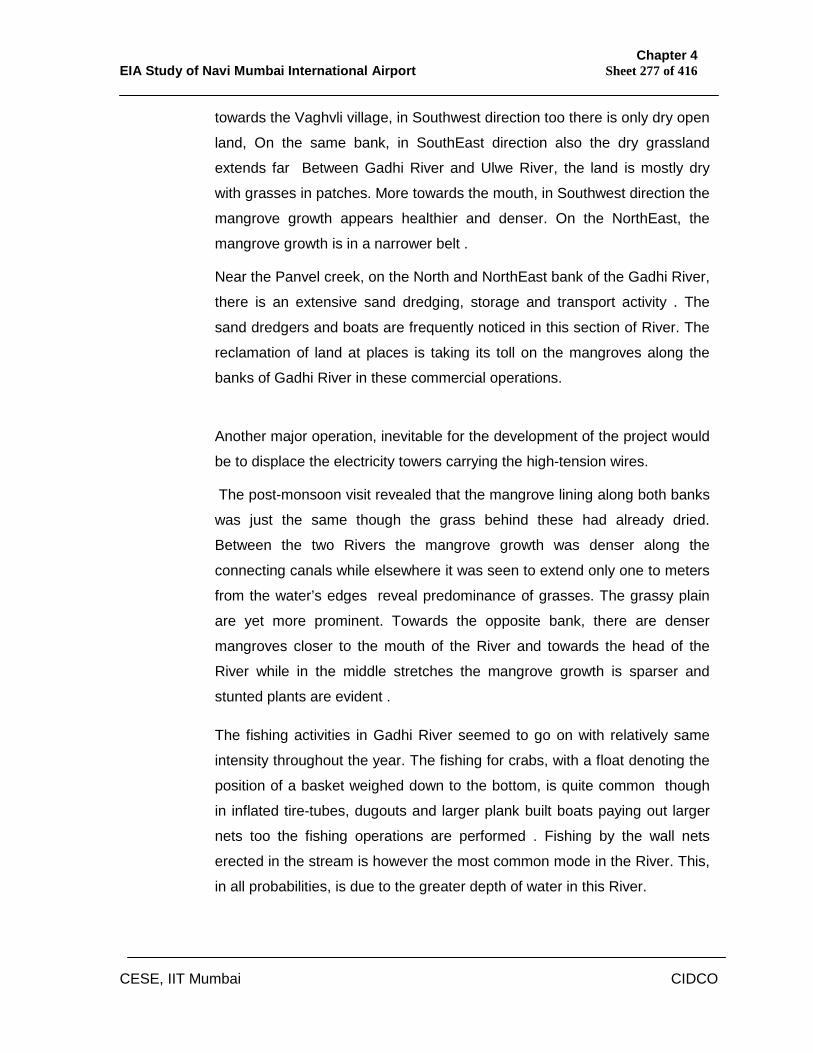
Chapter 4 EIA Study of Navi Mumbai International Airport Sheet 277 of 416
CESE, IIT Mumbai CIDCO
towards the Vaghvli village, in Southwest direction too there is only dry open
land, On the same bank, in SouthEast direction also the dry grassland
extends far Between Gadhi River and Ulwe River, the land is mostly dry
with grasses in patches. More towards the mouth, in Southwest direction the
mangrove growth appears healthier and denser. On the NorthEast, the
mangrove growth is in a narrower belt .
Near the Panvel creek, on the North and NorthEast bank of the Gadhi River,
there is an extensive sand dredging, storage and transport activity . The
sand dredgers and boats are frequently noticed in this section of River. The
reclamation of land at places is taking its toll on the mangroves along the
banks of Gadhi River in these commercial operations.
Another major operation, inevitable for the development of the project would
be to displace the electricity towers carrying the high-tension wires.
The post-monsoon visit revealed that the mangrove lining along both banks
was just the same though the grass behind these had already dried.
Between the two Rivers the mangrove growth was denser along the
connecting canals while elsewhere it was seen to extend only one to meters
from the water’s edges reveal predominance of grasses. The grassy plain
are yet more prominent. Towards the opposite bank, there are denser
mangroves closer to the mouth of the River and towards the head of the
River while in the middle stretches the mangrove growth is sparser and
stunted plants are evident .
The fishing activities in Gadhi River seemed to go on with relatively same
intensity throughout the year. The fishing for crabs, with a float denoting the
position of a basket weighed down to the bottom, is quite common though
in inflated tire-tubes, dugouts and larger plank built boats paying out larger
nets too the fishing operations are performed . Fishing by the wall nets
erected in the stream is however the most common mode in the River. This,
in all probabilities, is due to the greater depth of water in this River.
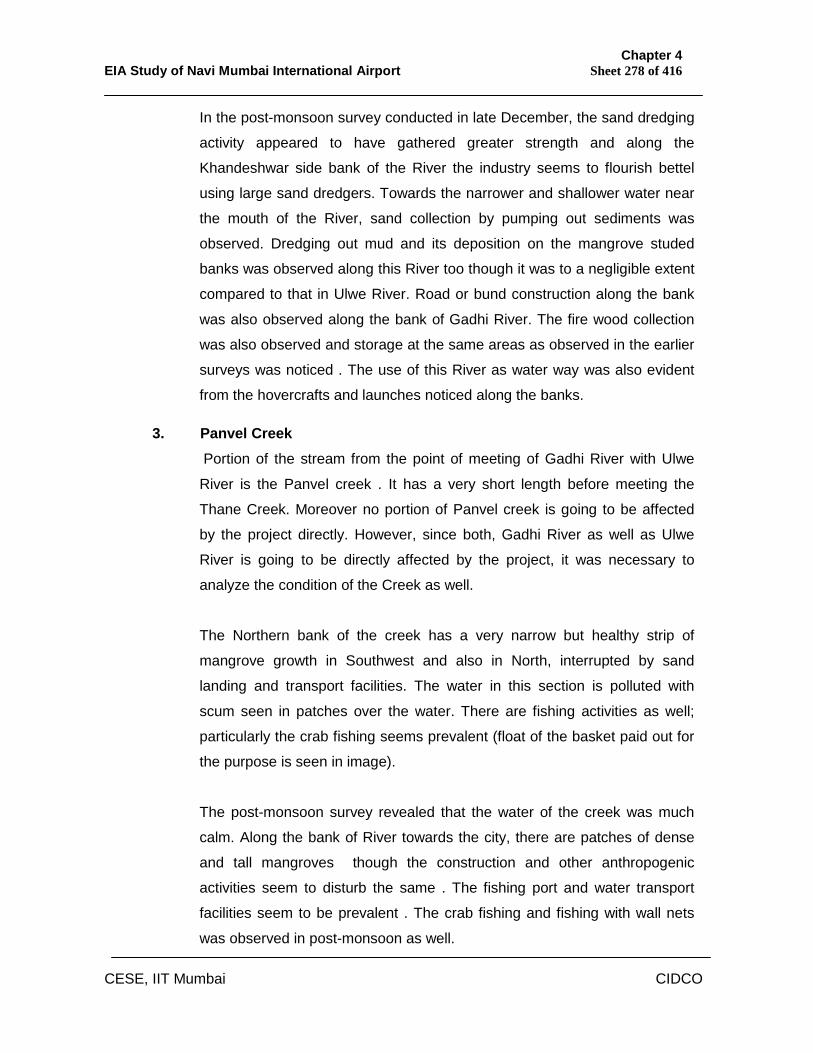
Chapter 4 EIA Study of Navi Mumbai International Airport Sheet 278 of 416
CESE, IIT Mumbai CIDCO
In the post-monsoon survey conducted in late December, the sand dredging
activity appeared to have gathered greater strength and along the
Khandeshwar side bank of the River the industry seems to flourish bettel
using large sand dredgers. Towards the narrower and shallower water near
the mouth of the River, sand collection by pumping out sediments was
observed. Dredging out mud and its deposition on the mangrove studed
banks was observed along this River too though it was to a negligible extent
compared to that in Ulwe River. Road or bund construction along the bank
was also observed along the bank of Gadhi River. The fire wood collection
was also observed and storage at the same areas as observed in the earlier
surveys was noticed . The use of this River as water way was also evident
from the hovercrafts and launches noticed along the banks.
3. Panvel Creek
Portion of the stream from the point of meeting of Gadhi River with Ulwe
River is the Panvel creek . It has a very short length before meeting the
Thane Creek. Moreover no portion of Panvel creek is going to be affected
by the project directly. However, since both, Gadhi River as well as Ulwe
River is going to be directly affected by the project, it was necessary to
analyze the condition of the Creek as well.
The Northern bank of the creek has a very narrow but healthy strip of
mangrove growth in Southwest and also in North, interrupted by sand
landing and transport facilities. The water in this section is polluted with
scum seen in patches over the water. There are fishing activities as well;
particularly the crab fishing seems prevalent (float of the basket paid out for
the purpose is seen in image).
The post-monsoon survey revealed that the water of the creek was much
calm. Along the bank of River towards the city, there are patches of dense
and tall mangroves though the construction and other anthropogenic
activities seem to disturb the same . The fishing port and water transport
facilities seem to be prevalent . The crab fishing and fishing with wall nets
was observed in post-monsoon as well.

Chapter 4 EIA Study of Navi Mumbai International Airport Sheet 279 of 416
CESE, IIT Mumbai CIDCO
4.11.5 Community analysis for Terrestrial Habitats
The survey of the terrestrial habitat, numbering 45 stations, spread across
the entire project area were surveyed. The result of assessments are
given in the Tables 4.77(a) to 4.77(c). At each station at lEast two
transects were taken and wherever feasible quadrants were also taken. The
line transect method was used for analyzing the qualitative characters of
each type of community through the computation of ecological indices. The
frequency or importance probability was calculated as the ratio of the
number of individuals of a given species in all transects laid in the terrestrial
habitats to the total number of individuals of all species, encountered in the
habitat. Though the number of trees and shrubs encountered in the
transects was much smaller, the shrubs, herbs and grasses also were not
too abundant. The comparative data for all transects considered together
yielded a fair picture of the overall community. A total of 87 transects were
laid and a total number of 923 plants were encountered in pre monsoon
season whereas 1542 plants were encountered in monsoon season.
Mangroves were encountered along 15 transects, hence 17.24% of
transects exhibited mangrove or associated mangrove plants. Avicennia
marina was found along 13 transects (14.94%) whereas A. ilicifoleus was
observed along 11 transects (12.64%). Salvadora persica was noticed in 27
(9.2%) and Clerodendron inermi at 4 (4.6%) places. Sessuvium
portulacatum was encountered along 8 transects (9.2%). Hence, Avicennia
marina was dominant species whereas mangrove associated A. ilicifoleus
occupied second position in abundance. The salt tolerant grass Eleucine
was found along 12 (13.79%) transects.
Shannon and Weiner species Diversity Index Shannon-Weiner diversity index provides a means of comparing the
diversity between two or more ecosystems. For the mangrove community
alone, the species diversity index was 1.536 while the Shannon and Weiner
index of general diversity was 1.668 in pre-monsoon whereas in monsoon
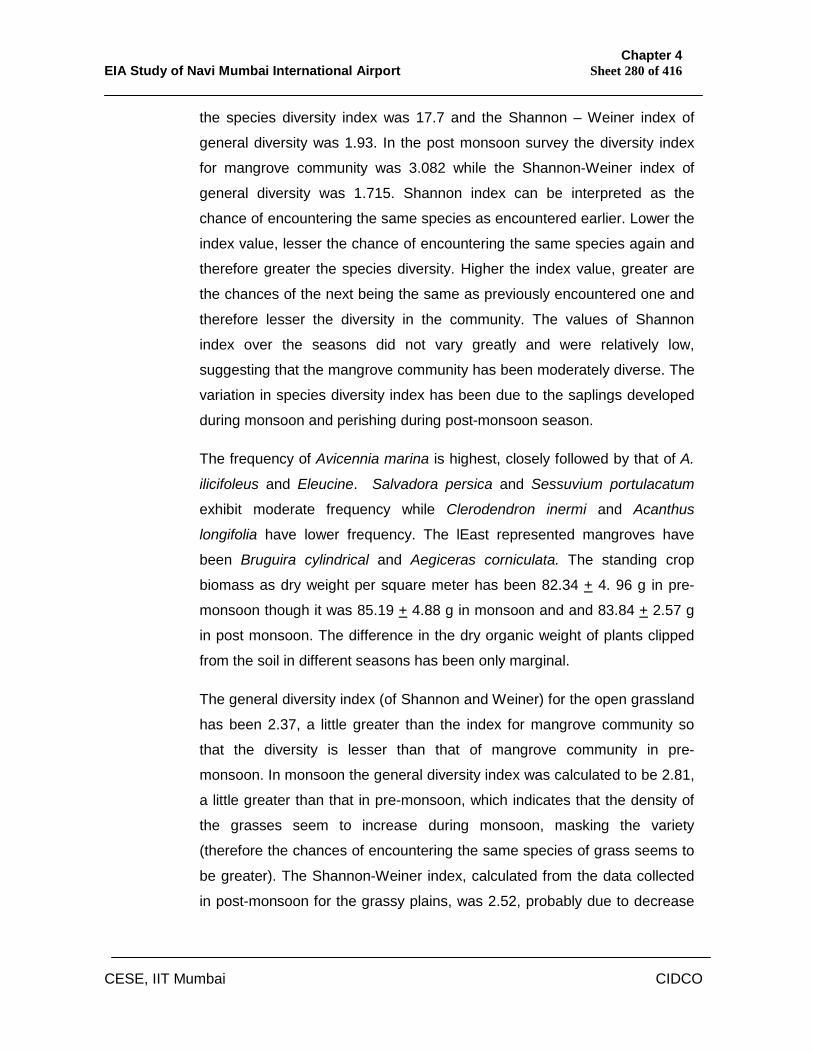
Chapter 4 EIA Study of Navi Mumbai International Airport Sheet 280 of 416
CESE, IIT Mumbai CIDCO
the species diversity index was 17.7 and the Shannon – Weiner index of
general diversity was 1.93. In the post monsoon survey the diversity index
for mangrove community was 3.082 while the Shannon-Weiner index of
general diversity was 1.715. Shannon index can be interpreted as the
chance of encountering the same species as encountered earlier. Lower the
index value, lesser the chance of encountering the same species again and
therefore greater the species diversity. Higher the index value, greater are
the chances of the next being the same as previously encountered one and
therefore lesser the diversity in the community. The values of Shannon
index over the seasons did not vary greatly and were relatively low,
suggesting that the mangrove community has been moderately diverse. The
variation in species diversity index has been due to the saplings developed
during monsoon and perishing during post-monsoon season.
The frequency of Avicennia marina is highest, closely followed by that of A.
ilicifoleus and Eleucine. Salvadora persica and Sessuvium portulacatum
exhibit moderate frequency while Clerodendron inermi and Acanthus
longifolia have lower frequency. The lEast represented mangroves have
been Bruguira cylindrical and Aegiceras corniculata. The standing crop
biomass as dry weight per square meter has been 82.34 + 4. 96 g in pre-
monsoon though it was 85.19 + 4.88 g in monsoon and and 83.84 + 2.57 g
in post monsoon. The difference in the dry organic weight of plants clipped
from the soil in different seasons has been only marginal.
The general diversity index (of Shannon and Weiner) for the open grassland
has been 2.37, a little greater than the index for mangrove community so
that the diversity is lesser than that of mangrove community in pre-
monsoon. In monsoon the general diversity index was calculated to be 2.81,
a little greater than that in pre-monsoon, which indicates that the density of
the grasses seem to increase during monsoon, masking the variety
(therefore the chances of encountering the same species of grass seems to
be greater). The Shannon-Weiner index, calculated from the data collected
in post-monsoon for the grassy plains, was 2.52, probably due to decrease
Chapter 4 EIA Study of Navi Mumbai International Airport Sheet 281 of 416
CESE, IIT Mumbai CIDCO
in density as well as variety of species and the combined effect was
decreased chances of encountering same species as the earlier one.
The mean dry weight per square meter has been 69.25 + 7.11 g in pre-
monsoon while in monsoon it was 64.53 + 5.81g. The marginal decline in
dry organic weight is due to the fact that the younger, less fibrous parts
abounded in the plant material collected in monsoon. The dry weight of
biomass per square meter, collected from grassy plain, during post-
monsoon was 74.16 + 9.03 g indicating that the primary production reaches
its maximum in this season though the consumption is not remarkable and
that the intense radiation causes oxidation of the organic substances so that
the standing crop biomass declines in pre-monsoon season.
For the manmade groves and roadside plants the general diversity index
has been 3.9 and 3.65 in pre-monsoon and monsoon respectively. The fall
in the index value indicates an increase in diversity or lesser chances that
the next species encountered are the same as the earlier one. The reason
for this change can be just that the transect sites were not exactly the same
and the perennials encountered might have been somewhat different. The
total number of species encountered is much greater than in the other
habitats in the area but are sparsely growing with lEast density.
A total of 94 species of flowering plants have been found along 87 transects
in pre-monsoon season with the total number of plants as 923. In monsoon
season though, there were 130 species with a total of 1542 plants
encountered along 87 transects.
Shannon and Weiner diversity index calculated by using equation given
below
S-/in N,
where S is the number of species
N is the total number of individuals of these species encountered along the
transects
Chapter 4 EIA Study of Navi Mumbai International Airport Sheet 282 of 416
CESE, IIT Mumbai CIDCO
S
Hs = - (Pi) (ln Pi),
i =1
where, Hs is Diversity index of S species or kinds, S is the number of
species in the sample,
Pi is relative abundance of ith species or kind’s measures (Pi= ni/N), N is
the total number of individuals of all kinds, ni is the number of individuals of
ith species and ln – natural log
The species diversity index (calculated as S-/in N, where S is the number of
species while N is the total number of individuals of these species
encountered along the transects)
The species diversity index has been 13.6 in pre-monsoon and 17.71 in
monsoon. The Shannon-Weiner index of general diversity has been 0.74 in
the pre-monsoon season while in monsoon it was 4.37. The greater species
diversity and the smaller Shannon index value indicate low density of plants
and localized distribution of plants or presence of microclimates or
fragmented habitats. In fact all of this holds true for the area of the project
site.
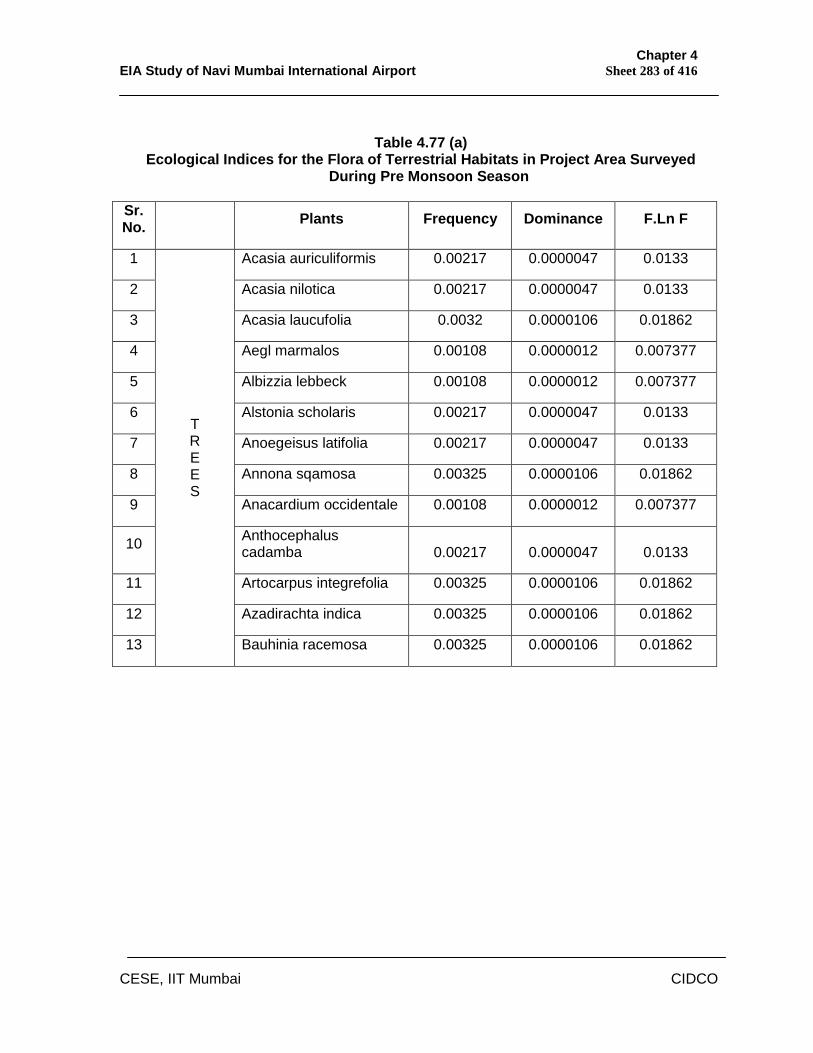
Chapter 4 EIA Study of Navi Mumbai International Airport Sheet 283 of 416
CESE, IIT Mumbai CIDCO
Table 4.77 (a)
Ecological Indices for the Flora of Terrestrial Habitats in Project Area Surveyed During Pre Monsoon Season
Sr. No. Plants Frequency Dominance F.Ln F
1 Acasia auriculiformis 0.00217 0.0000047 0.0133
2 Acasia nilotica 0.00217 0.0000047 0.0133
3 Acasia laucufolia 0.0032 0.0000106 0.01862
4 Aegl marmalos 0.00108 0.0000012 0.007377
5 Albizzia lebbeck 0.00108 0.0000012 0.007377
6 Alstonia scholaris 0.00217 0.0000047 0.0133
7 Anoegeisus latifolia 0.00217 0.0000047 0.0133
8 Annona sqamosa 0.00325 0.0000106 0.01862
9 Anacardium occidentale 0.00108 0.0000012 0.007377
10 Anthocephalus cadamba 0.00217 0.0000047 0.0133
11 Artocarpus integrefolia 0.00325 0.0000106 0.01862
12 Azadirachta indica 0.00325 0.0000106 0.01862
13
T R E E S
Bauhinia racemosa 0.00325 0.0000106 0.01862
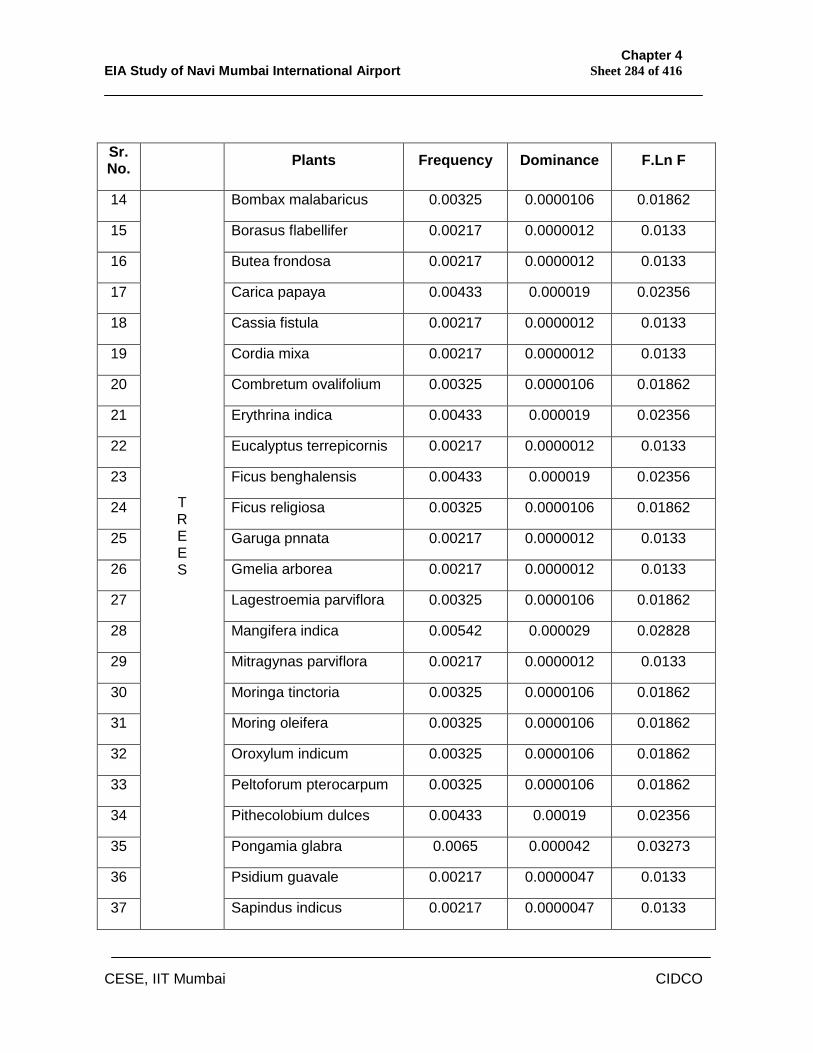
Chapter 4 EIA Study of Navi Mumbai International Airport Sheet 284 of 416
CESE, IIT Mumbai CIDCO
Sr. No. Plants Frequency Dominance F.Ln F
14 Bombax malabaricus 0.00325 0.0000106 0.01862
15 Borasus flabellifer 0.00217 0.0000012 0.0133
16 Butea frondosa 0.00217 0.0000012 0.0133
17 Carica papaya 0.00433 0.000019 0.02356
18 Cassia fistula 0.00217 0.0000012 0.0133
19 Cordia mixa 0.00217 0.0000012 0.0133
20 Combretum ovalifolium 0.00325 0.0000106 0.01862
21 Erythrina indica 0.00433 0.000019 0.02356
22 Eucalyptus terrepicornis 0.00217 0.0000012 0.0133
23 Ficus benghalensis 0.00433 0.000019 0.02356
24 Ficus religiosa 0.00325 0.0000106 0.01862
25 Garuga pnnata 0.00217 0.0000012 0.0133
26 Gmelia arborea 0.00217 0.0000012 0.0133
27 Lagestroemia parviflora 0.00325 0.0000106 0.01862
28 Mangifera indica 0.00542 0.000029 0.02828
29 Mitragynas parviflora 0.00217 0.0000012 0.0133
30 Moringa tinctoria 0.00325 0.0000106 0.01862
31 Moring oleifera 0.00325 0.0000106 0.01862
32 Oroxylum indicum 0.00325 0.0000106 0.01862
33 Peltoforum pterocarpum 0.00325 0.0000106 0.01862
34 Pithecolobium dulces 0.00433 0.00019 0.02356
35 Pongamia glabra 0.0065 0.000042 0.03273
36 Psidium guavale 0.00217 0.0000047 0.0133
37
T R E E S
Sapindus indicus 0.00217 0.0000047 0.0133
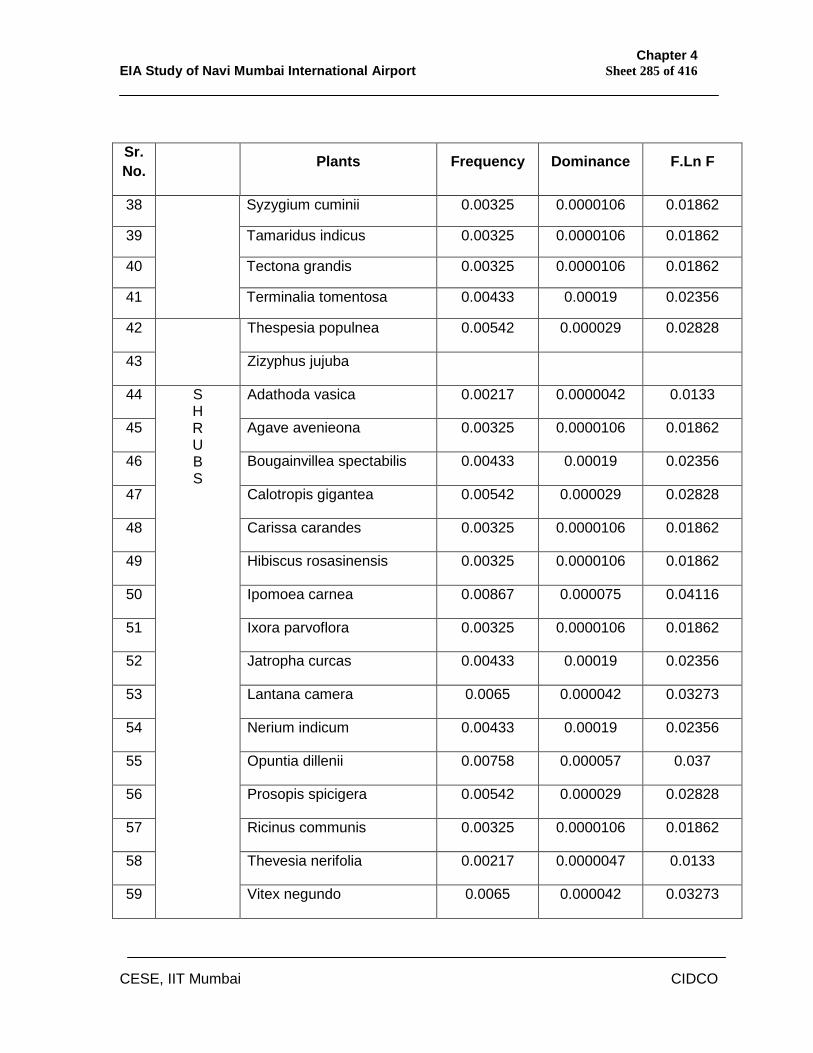
Chapter 4 EIA Study of Navi Mumbai International Airport Sheet 285 of 416
CESE, IIT Mumbai CIDCO
Sr. No. Plants Frequency Dominance F.Ln F
38 Syzygium cuminii 0.00325 0.0000106 0.01862
39 Tamaridus indicus 0.00325 0.0000106 0.01862
40 Tectona grandis 0.00325 0.0000106 0.01862
41
Terminalia tomentosa 0.00433 0.00019 0.02356
42 Thespesia populnea 0.00542 0.000029 0.02828
43
Zizyphus jujuba
44 Adathoda vasica 0.00217 0.0000042 0.0133
45 Agave avenieona 0.00325 0.0000106 0.01862
46 Bougainvillea spectabilis 0.00433 0.00019 0.02356
47 Calotropis gigantea 0.00542 0.000029 0.02828
48 Carissa carandes 0.00325 0.0000106 0.01862
49 Hibiscus rosasinensis 0.00325 0.0000106 0.01862
50 Ipomoea carnea 0.00867 0.000075 0.04116
51 Ixora parvoflora 0.00325 0.0000106 0.01862
52 Jatropha curcas 0.00433 0.00019 0.02356
53 Lantana camera 0.0065 0.000042 0.03273
54 Nerium indicum 0.00433 0.00019 0.02356
55 Opuntia dillenii 0.00758 0.000057 0.037
56 Prosopis spicigera 0.00542 0.000029 0.02828
57 Ricinus communis 0.00325 0.0000106 0.01862
58 Thevesia nerifolia 0.00217 0.0000047 0.0133
59
S H R U B S
Vitex negundo 0.0065 0.000042 0.03273
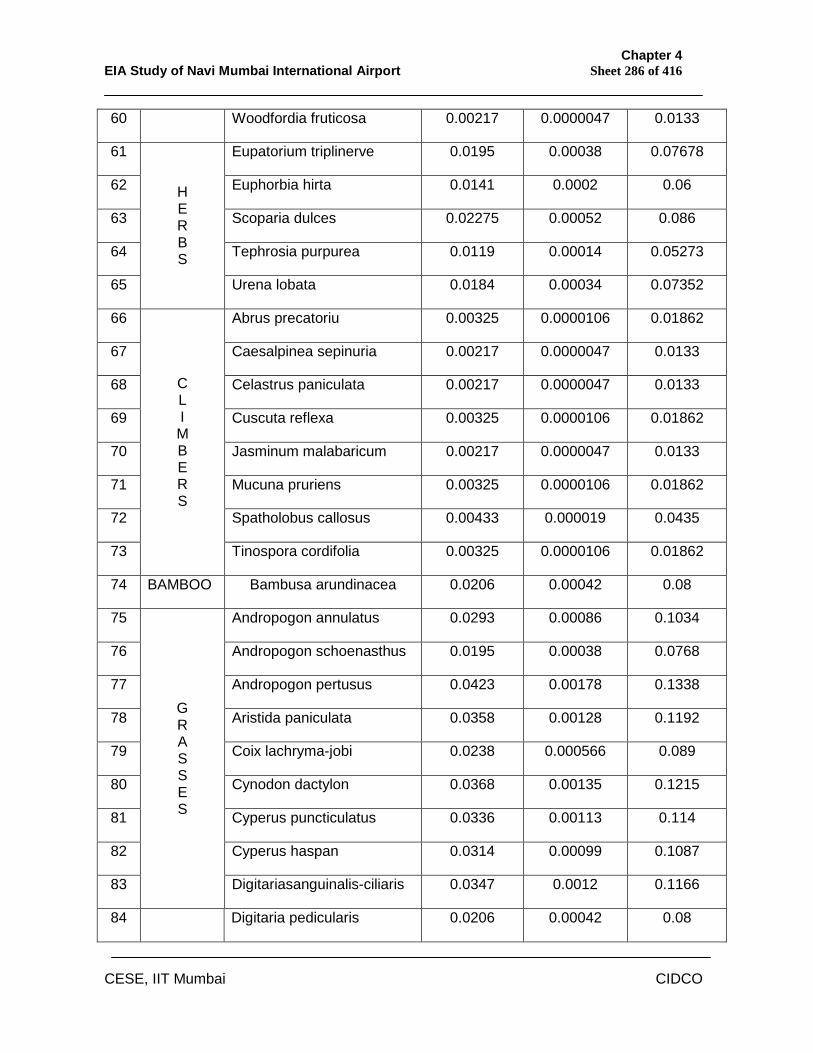
Chapter 4 EIA Study of Navi Mumbai International Airport Sheet 286 of 416
CESE, IIT Mumbai CIDCO
60 Woodfordia fruticosa 0.00217 0.0000047 0.0133
61 Eupatorium triplinerve 0.0195 0.00038 0.07678
62 Euphorbia hirta 0.0141 0.0002 0.06
63 Scoparia dulces 0.02275 0.00052 0.086
64 Tephrosia purpurea 0.0119 0.00014 0.05273
65
H E R B S
Urena lobata 0.0184 0.00034 0.07352
66 Abrus precatoriu 0.00325 0.0000106 0.01862
67 Caesalpinea sepinuria 0.00217 0.0000047 0.0133
68 Celastrus paniculata 0.00217 0.0000047 0.0133
69 Cuscuta reflexa 0.00325 0.0000106 0.01862
70 Jasminum malabaricum 0.00217 0.0000047 0.0133
71 Mucuna pruriens 0.00325 0.0000106 0.01862
72 Spatholobus callosus 0.00433 0.000019 0.0435
73
C L I M B E R S
Tinospora cordifolia 0.00325 0.0000106 0.01862
74 BAMBOO Bambusa arundinacea 0.0206 0.00042 0.08
75 Andropogon annulatus 0.0293 0.00086 0.1034
76 Andropogon schoenasthus 0.0195 0.00038 0.0768
77 Andropogon pertusus 0.0423 0.00178 0.1338
78 Aristida paniculata 0.0358 0.00128 0.1192
79 Coix lachryma-jobi 0.0238 0.000566 0.089
80 Cynodon dactylon 0.0368 0.00135 0.1215
81 Cyperus puncticulatus 0.0336 0.00113 0.114
82 Cyperus haspan 0.0314 0.00099 0.1087
83
G R A S S E S
Digitariasanguinalis-ciliaris 0.0347 0.0012 0.1166
84 Digitaria pedicularis 0.0206 0.00042 0.08
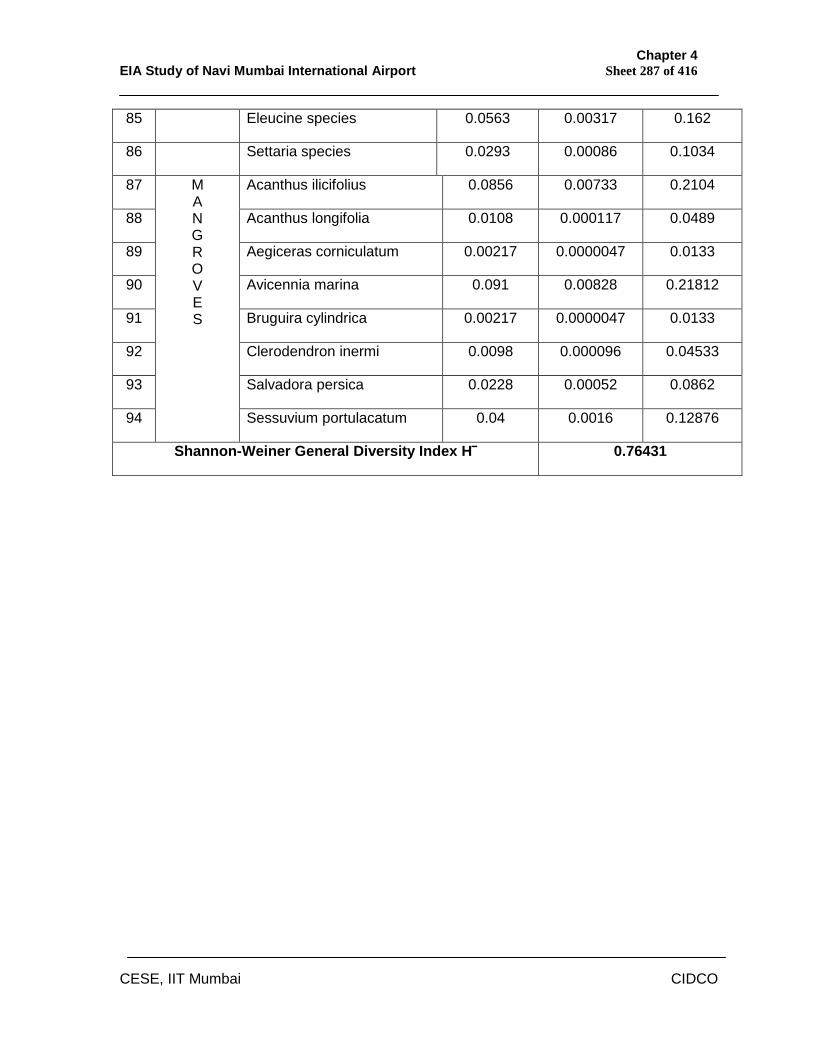
Chapter 4 EIA Study of Navi Mumbai International Airport Sheet 287 of 416
CESE, IIT Mumbai CIDCO
85 Eleucine species 0.0563 0.00317 0.162
86 Settaria species 0.0293 0.00086 0.1034
87 Acanthus ilicifolius 0.0856 0.00733 0.2104
88 Acanthus longifolia 0.0108 0.000117 0.0489
89 Aegiceras corniculatum 0.00217 0.0000047 0.0133
90 Avicennia marina 0.091 0.00828 0.21812
91 Bruguira cylindrica 0.00217 0.0000047 0.0133
92 Clerodendron inermi 0.0098 0.000096 0.04533
93 Salvadora persica 0.0228 0.00052 0.0862
94
M A N G R O V E S
Sessuvium portulacatum 0.04 0.0016 0.12876
Shannon-Weiner General Diversity Index H‾ 0.76431
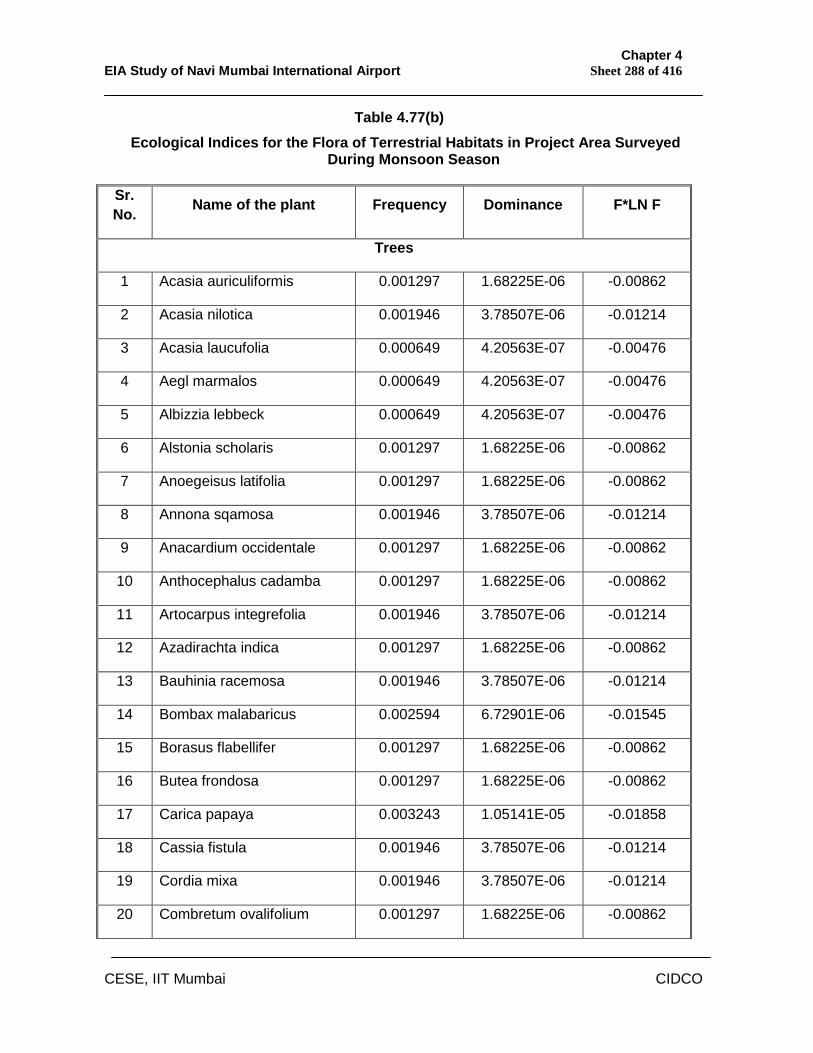
Chapter 4 EIA Study of Navi Mumbai International Airport Sheet 288 of 416
CESE, IIT Mumbai CIDCO
Table 4.77(b) Ecological Indices for the Flora of Terrestrial Habitats in Project Area Surveyed
During Monsoon Season
Sr. No. Name of the plant Frequency Dominance F*LN F
Trees
1 Acasia auriculiformis 0.001297 1.68225E-06 -0.00862
2 Acasia nilotica 0.001946 3.78507E-06 -0.01214
3 Acasia laucufolia 0.000649 4.20563E-07 -0.00476
4 Aegl marmalos 0.000649 4.20563E-07 -0.00476
5 Albizzia lebbeck 0.000649 4.20563E-07 -0.00476
6 Alstonia scholaris 0.001297 1.68225E-06 -0.00862
7 Anoegeisus latifolia 0.001297 1.68225E-06 -0.00862
8 Annona sqamosa 0.001946 3.78507E-06 -0.01214
9 Anacardium occidentale 0.001297 1.68225E-06 -0.00862
10 Anthocephalus cadamba 0.001297 1.68225E-06 -0.00862
11 Artocarpus integrefolia 0.001946 3.78507E-06 -0.01214
12 Azadirachta indica 0.001297 1.68225E-06 -0.00862
13 Bauhinia racemosa 0.001946 3.78507E-06 -0.01214
14 Bombax malabaricus 0.002594 6.72901E-06 -0.01545
15 Borasus flabellifer 0.001297 1.68225E-06 -0.00862
16 Butea frondosa 0.001297 1.68225E-06 -0.00862
17 Carica papaya 0.003243 1.05141E-05 -0.01858
18 Cassia fistula 0.001946 3.78507E-06 -0.01214
19 Cordia mixa 0.001946 3.78507E-06 -0.01214
20 Combretum ovalifolium 0.001297 1.68225E-06 -0.00862
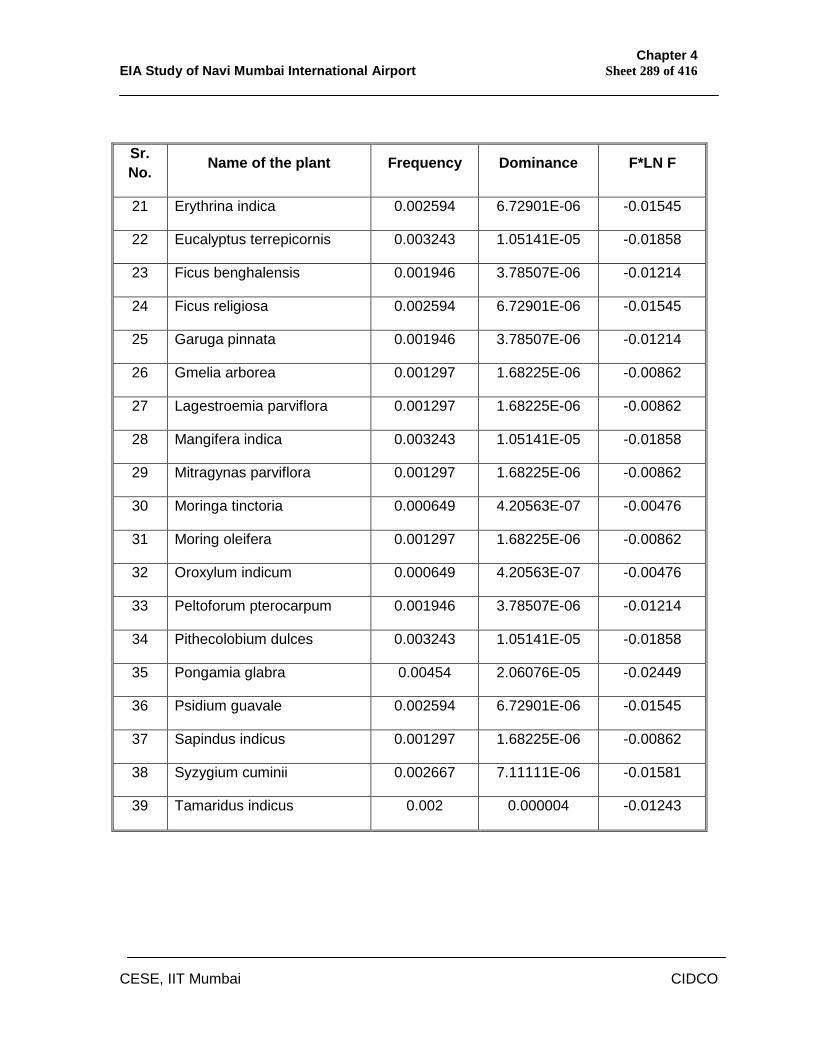
Chapter 4 EIA Study of Navi Mumbai International Airport Sheet 289 of 416
CESE, IIT Mumbai CIDCO
Sr. No. Name of the plant Frequency Dominance F*LN F
21 Erythrina indica 0.002594 6.72901E-06 -0.01545
22 Eucalyptus terrepicornis 0.003243 1.05141E-05 -0.01858
23 Ficus benghalensis 0.001946 3.78507E-06 -0.01214
24 Ficus religiosa 0.002594 6.72901E-06 -0.01545
25 Garuga pinnata 0.001946 3.78507E-06 -0.01214
26 Gmelia arborea 0.001297 1.68225E-06 -0.00862
27 Lagestroemia parviflora 0.001297 1.68225E-06 -0.00862
28 Mangifera indica 0.003243 1.05141E-05 -0.01858
29 Mitragynas parviflora 0.001297 1.68225E-06 -0.00862
30 Moringa tinctoria 0.000649 4.20563E-07 -0.00476
31 Moring oleifera 0.001297 1.68225E-06 -0.00862
32 Oroxylum indicum 0.000649 4.20563E-07 -0.00476
33 Peltoforum pterocarpum 0.001946 3.78507E-06 -0.01214
34 Pithecolobium dulces 0.003243 1.05141E-05 -0.01858
35 Pongamia glabra 0.00454 2.06076E-05 -0.02449
36 Psidium guavale 0.002594 6.72901E-06 -0.01545
37 Sapindus indicus 0.001297 1.68225E-06 -0.00862
38 Syzygium cuminii 0.002667 7.11111E-06 -0.01581
39 Tamaridus indicus 0.002 0.000004 -0.01243
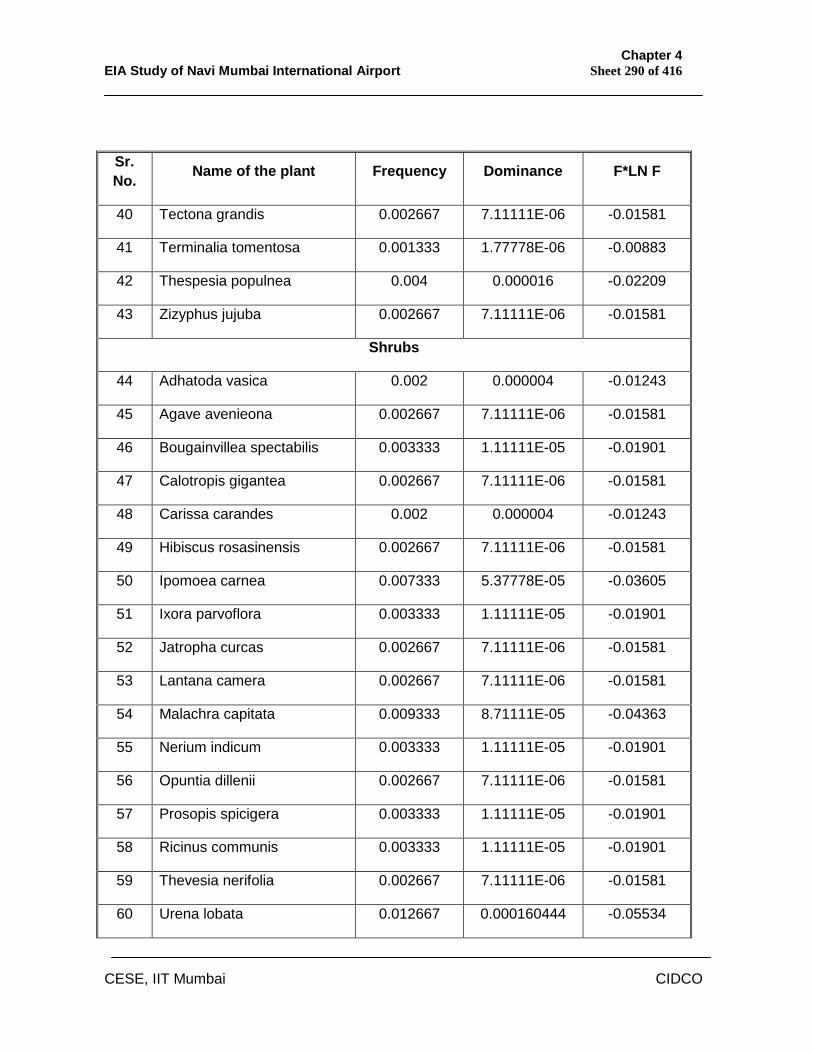
Chapter 4 EIA Study of Navi Mumbai International Airport Sheet 290 of 416
CESE, IIT Mumbai CIDCO
Sr. No. Name of the plant Frequency Dominance F*LN F
40 Tectona grandis 0.002667 7.11111E-06 -0.01581
41 Terminalia tomentosa 0.001333 1.77778E-06 -0.00883
42 Thespesia populnea 0.004 0.000016 -0.02209
43 Zizyphus jujuba 0.002667 7.11111E-06 -0.01581
Shrubs
44 Adhatoda vasica 0.002 0.000004 -0.01243
45 Agave avenieona 0.002667 7.11111E-06 -0.01581
46 Bougainvillea spectabilis 0.003333 1.11111E-05 -0.01901
47 Calotropis gigantea 0.002667 7.11111E-06 -0.01581
48 Carissa carandes 0.002 0.000004 -0.01243
49 Hibiscus rosasinensis 0.002667 7.11111E-06 -0.01581
50 Ipomoea carnea 0.007333 5.37778E-05 -0.03605
51 Ixora parvoflora 0.003333 1.11111E-05 -0.01901
52 Jatropha curcas 0.002667 7.11111E-06 -0.01581
53 Lantana camera 0.002667 7.11111E-06 -0.01581
54 Malachra capitata 0.009333 8.71111E-05 -0.04363
55 Nerium indicum 0.003333 1.11111E-05 -0.01901
56 Opuntia dillenii 0.002667 7.11111E-06 -0.01581
57 Prosopis spicigera 0.003333 1.11111E-05 -0.01901
58 Ricinus communis 0.003333 1.11111E-05 -0.01901
59 Thevesia nerifolia 0.002667 7.11111E-06 -0.01581
60 Urena lobata 0.012667 0.000160444 -0.05534
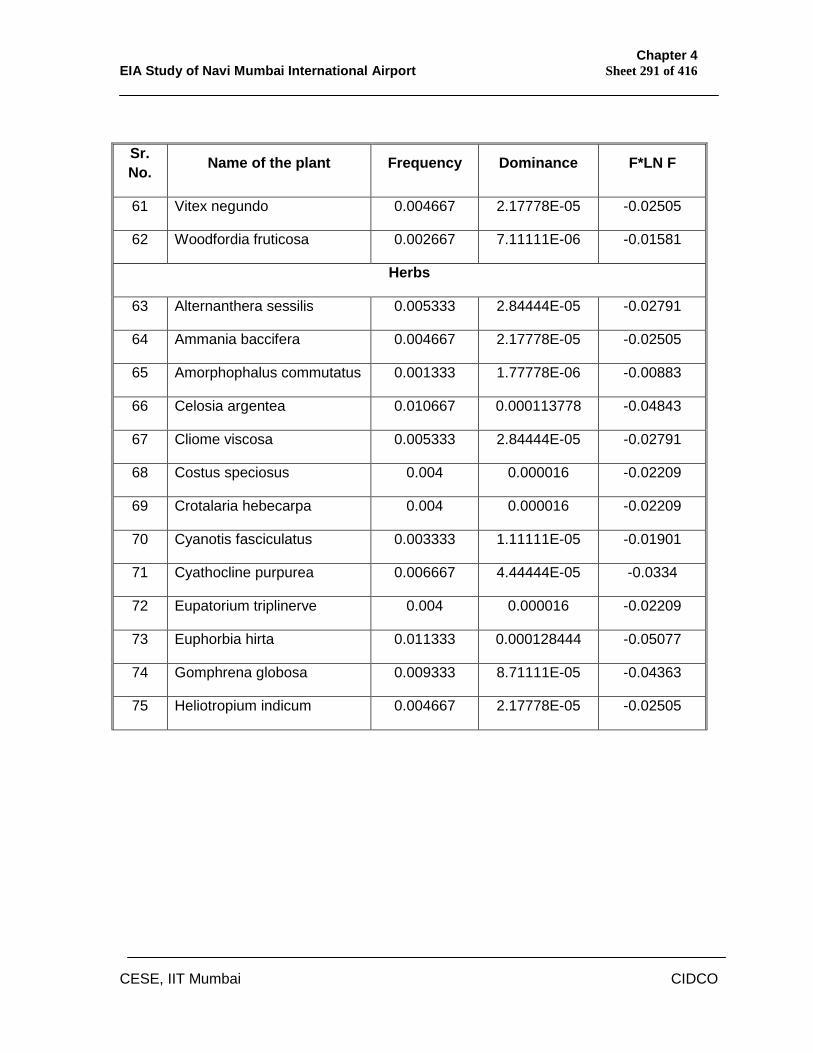
Chapter 4 EIA Study of Navi Mumbai International Airport Sheet 291 of 416
CESE, IIT Mumbai CIDCO
Sr. No. Name of the plant Frequency Dominance F*LN F
61 Vitex negundo 0.004667 2.17778E-05 -0.02505
62 Woodfordia fruticosa 0.002667 7.11111E-06 -0.01581
Herbs
63 Alternanthera sessilis 0.005333 2.84444E-05 -0.02791
64 Ammania baccifera 0.004667 2.17778E-05 -0.02505
65 Amorphophalus commutatus 0.001333 1.77778E-06 -0.00883
66 Celosia argentea 0.010667 0.000113778 -0.04843
67 Cliome viscosa 0.005333 2.84444E-05 -0.02791
68 Costus speciosus 0.004 0.000016 -0.02209
69 Crotalaria hebecarpa 0.004 0.000016 -0.02209
70 Cyanotis fasciculatus 0.003333 1.11111E-05 -0.01901
71 Cyathocline purpurea 0.006667 4.44444E-05 -0.0334
72 Eupatorium triplinerve 0.004 0.000016 -0.02209
73 Euphorbia hirta 0.011333 0.000128444 -0.05077
74 Gomphrena globosa 0.009333 8.71111E-05 -0.04363
75 Heliotropium indicum 0.004667 2.17778E-05 -0.02505
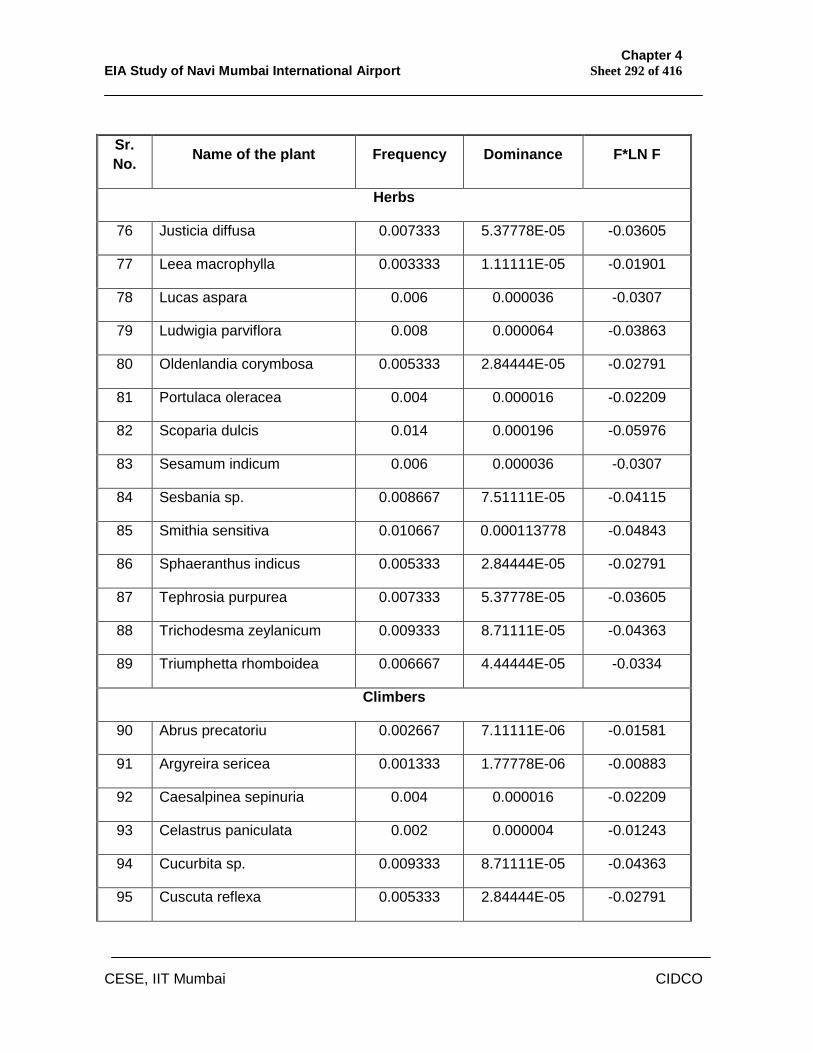
Chapter 4 EIA Study of Navi Mumbai International Airport Sheet 292 of 416
CESE, IIT Mumbai CIDCO
Sr. No. Name of the plant Frequency Dominance F*LN F
Herbs
76 Justicia diffusa 0.007333 5.37778E-05 -0.03605
77 Leea macrophylla 0.003333 1.11111E-05 -0.01901
78 Lucas aspara 0.006 0.000036 -0.0307
79 Ludwigia parviflora 0.008 0.000064 -0.03863
80 Oldenlandia corymbosa 0.005333 2.84444E-05 -0.02791
81 Portulaca oleracea 0.004 0.000016 -0.02209
82 Scoparia dulcis 0.014 0.000196 -0.05976
83 Sesamum indicum 0.006 0.000036 -0.0307
84 Sesbania sp. 0.008667 7.51111E-05 -0.04115
85 Smithia sensitiva 0.010667 0.000113778 -0.04843
86 Sphaeranthus indicus 0.005333 2.84444E-05 -0.02791
87 Tephrosia purpurea 0.007333 5.37778E-05 -0.03605
88 Trichodesma zeylanicum 0.009333 8.71111E-05 -0.04363
89 Triumphetta rhomboidea 0.006667 4.44444E-05 -0.0334
Climbers
90 Abrus precatoriu 0.002667 7.11111E-06 -0.01581
91 Argyreira sericea 0.001333 1.77778E-06 -0.00883
92 Caesalpinea sepinuria 0.004 0.000016 -0.02209
93 Celastrus paniculata 0.002 0.000004 -0.01243
94 Cucurbita sp. 0.009333 8.71111E-05 -0.04363
95 Cuscuta reflexa 0.005333 2.84444E-05 -0.02791
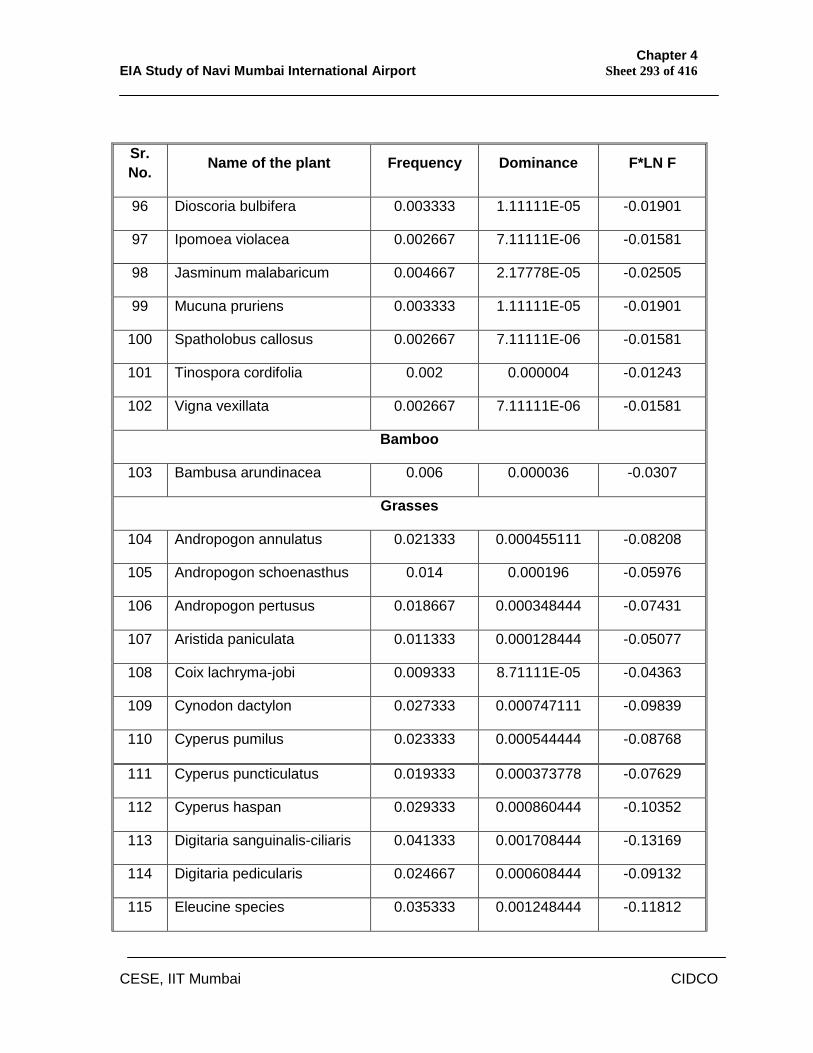
Chapter 4 EIA Study of Navi Mumbai International Airport Sheet 293 of 416
CESE, IIT Mumbai CIDCO
Sr. No. Name of the plant Frequency Dominance F*LN F
96 Dioscoria bulbifera 0.003333 1.11111E-05 -0.01901
97 Ipomoea violacea 0.002667 7.11111E-06 -0.01581
98 Jasminum malabaricum 0.004667 2.17778E-05 -0.02505
99 Mucuna pruriens 0.003333 1.11111E-05 -0.01901
100 Spatholobus callosus 0.002667 7.11111E-06 -0.01581
101 Tinospora cordifolia 0.002 0.000004 -0.01243
102 Vigna vexillata 0.002667 7.11111E-06 -0.01581
Bamboo
103 Bambusa arundinacea 0.006 0.000036 -0.0307
Grasses
104 Andropogon annulatus 0.021333 0.000455111 -0.08208
105 Andropogon schoenasthus 0.014 0.000196 -0.05976
106 Andropogon pertusus 0.018667 0.000348444 -0.07431
107 Aristida paniculata 0.011333 0.000128444 -0.05077
108 Coix lachryma-jobi 0.009333 8.71111E-05 -0.04363
109 Cynodon dactylon 0.027333 0.000747111 -0.09839
110 Cyperus pumilus 0.023333 0.000544444 -0.08768
111 Cyperus puncticulatus 0.019333 0.000373778 -0.07629
112 Cyperus haspan 0.029333 0.000860444 -0.10352
113 Digitaria sanguinalis-ciliaris 0.041333 0.001708444 -0.13169
114 Digitaria pedicularis 0.024667 0.000608444 -0.09132
115 Eleucine species 0.035333 0.001248444 -0.11812
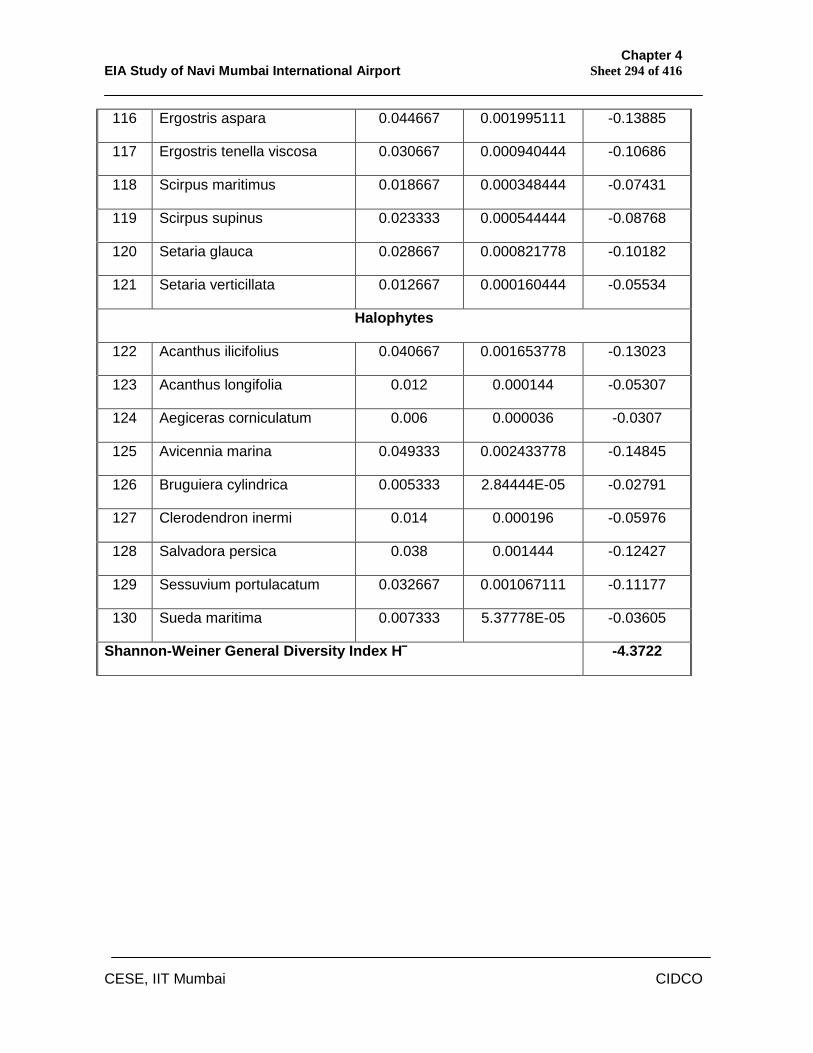
Chapter 4 EIA Study of Navi Mumbai International Airport Sheet 294 of 416
CESE, IIT Mumbai CIDCO
116 Ergostris aspara 0.044667 0.001995111 -0.13885
117 Ergostris tenella viscosa 0.030667 0.000940444 -0.10686
118 Scirpus maritimus 0.018667 0.000348444 -0.07431
119 Scirpus supinus 0.023333 0.000544444 -0.08768
120 Setaria glauca 0.028667 0.000821778 -0.10182
121 Setaria verticillata 0.012667 0.000160444 -0.05534
Halophytes
122 Acanthus ilicifolius 0.040667 0.001653778 -0.13023
123 Acanthus longifolia 0.012 0.000144 -0.05307
124 Aegiceras corniculatum 0.006 0.000036 -0.0307
125 Avicennia marina 0.049333 0.002433778 -0.14845
126 Bruguiera cylindrica 0.005333 2.84444E-05 -0.02791
127 Clerodendron inermi 0.014 0.000196 -0.05976
128 Salvadora persica 0.038 0.001444 -0.12427
129 Sessuvium portulacatum 0.032667 0.001067111 -0.11177
130 Sueda maritima 0.007333 5.37778E-05 -0.03605
Shannon-Weiner General Diversity Index H‾ -4.3722
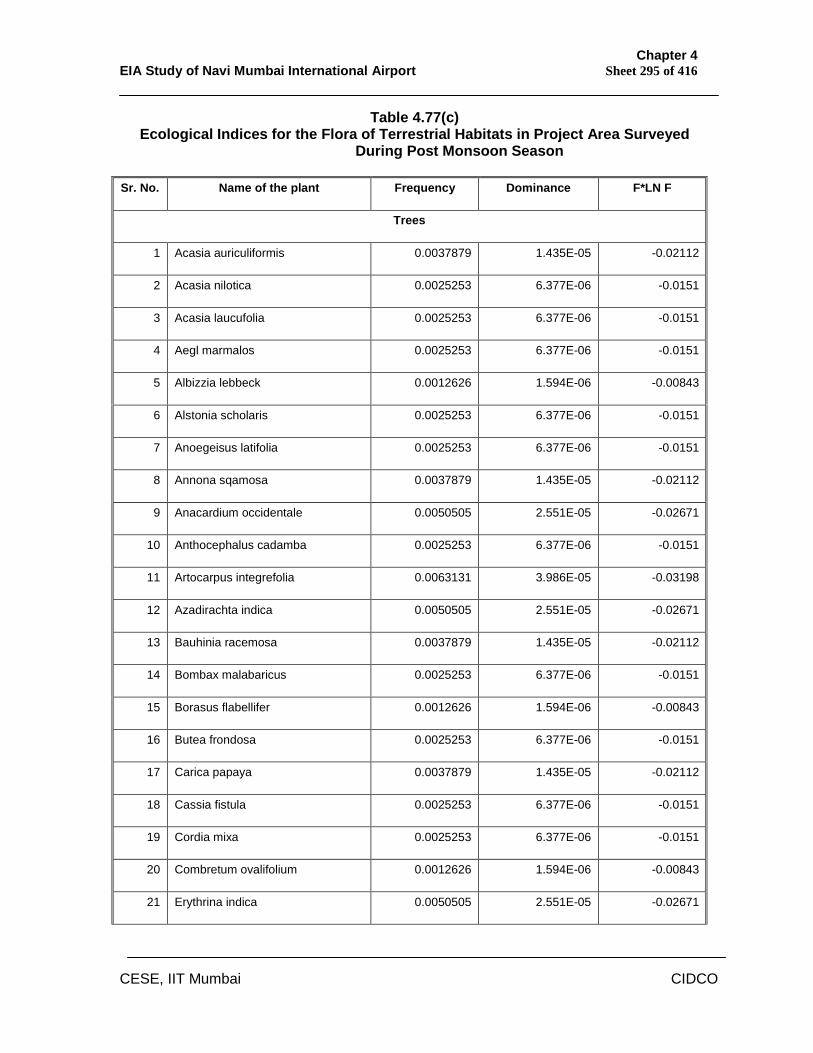
Chapter 4 EIA Study of Navi Mumbai International Airport Sheet 295 of 416
CESE, IIT Mumbai CIDCO
Table 4.77(c) Ecological Indices for the Flora of Terrestrial Habitats in Project Area Surveyed
During Post Monsoon Season Sr. No. Name of the plant Frequency Dominance F*LN F
Trees
1 Acasia auriculiformis 0.0037879 1.435E-05 -0.02112
2 Acasia nilotica 0.0025253 6.377E-06 -0.0151
3 Acasia laucufolia 0.0025253 6.377E-06 -0.0151
4 Aegl marmalos 0.0025253 6.377E-06 -0.0151
5 Albizzia lebbeck 0.0012626 1.594E-06 -0.00843
6 Alstonia scholaris 0.0025253 6.377E-06 -0.0151
7 Anoegeisus latifolia 0.0025253 6.377E-06 -0.0151
8 Annona sqamosa 0.0037879 1.435E-05 -0.02112
9 Anacardium occidentale 0.0050505 2.551E-05 -0.02671
10 Anthocephalus cadamba 0.0025253 6.377E-06 -0.0151
11 Artocarpus integrefolia 0.0063131 3.986E-05 -0.03198
12 Azadirachta indica 0.0050505 2.551E-05 -0.02671
13 Bauhinia racemosa 0.0037879 1.435E-05 -0.02112
14 Bombax malabaricus 0.0025253 6.377E-06 -0.0151
15 Borasus flabellifer 0.0012626 1.594E-06 -0.00843
16 Butea frondosa 0.0025253 6.377E-06 -0.0151
17 Carica papaya 0.0037879 1.435E-05 -0.02112
18 Cassia fistula 0.0025253 6.377E-06 -0.0151
19 Cordia mixa 0.0025253 6.377E-06 -0.0151
20 Combretum ovalifolium 0.0012626 1.594E-06 -0.00843
21 Erythrina indica 0.0050505 2.551E-05 -0.02671
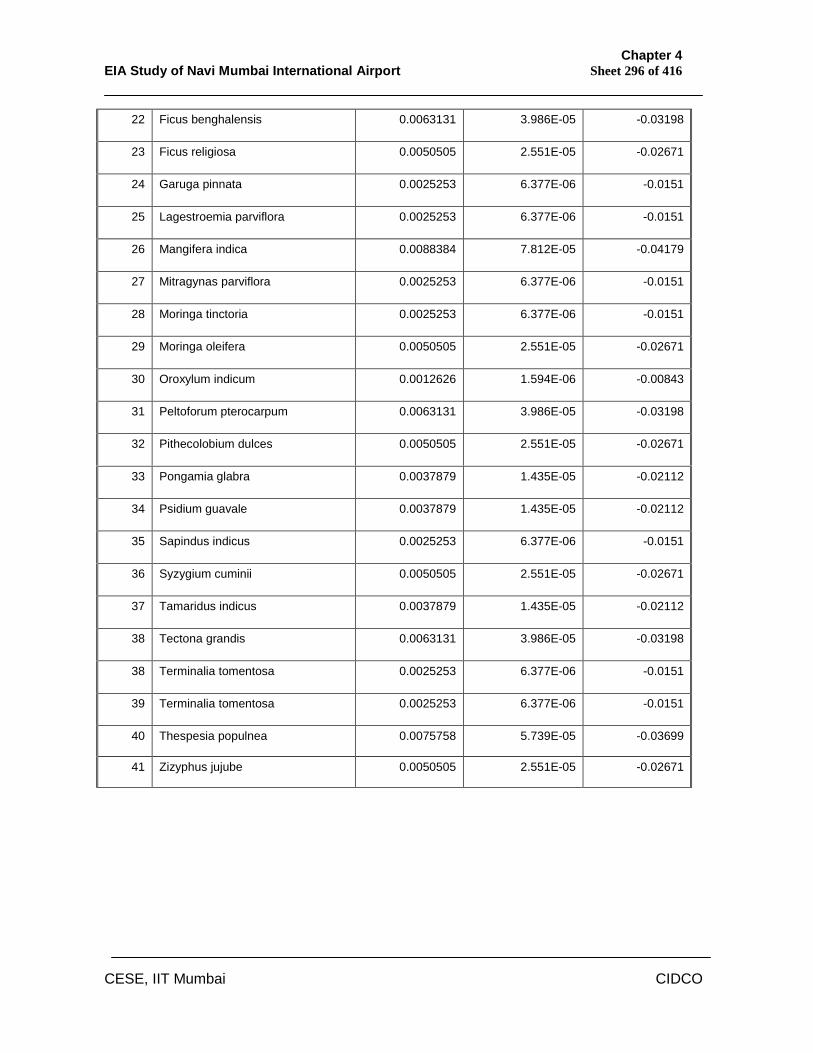
Chapter 4 EIA Study of Navi Mumbai International Airport Sheet 296 of 416
CESE, IIT Mumbai CIDCO
22 Ficus benghalensis 0.0063131 3.986E-05 -0.03198
23 Ficus religiosa 0.0050505 2.551E-05 -0.02671
24 Garuga pinnata 0.0025253 6.377E-06 -0.0151
25 Lagestroemia parviflora 0.0025253 6.377E-06 -0.0151
26 Mangifera indica 0.0088384 7.812E-05 -0.04179
27 Mitragynas parviflora 0.0025253 6.377E-06 -0.0151
28 Moringa tinctoria 0.0025253 6.377E-06 -0.0151
29 Moringa oleifera 0.0050505 2.551E-05 -0.02671
30 Oroxylum indicum 0.0012626 1.594E-06 -0.00843
31 Peltoforum pterocarpum 0.0063131 3.986E-05 -0.03198
32 Pithecolobium dulces 0.0050505 2.551E-05 -0.02671
33 Pongamia glabra 0.0037879 1.435E-05 -0.02112
34 Psidium guavale 0.0037879 1.435E-05 -0.02112
35 Sapindus indicus 0.0025253 6.377E-06 -0.0151
36 Syzygium cuminii 0.0050505 2.551E-05 -0.02671
37 Tamaridus indicus 0.0037879 1.435E-05 -0.02112
38 Tectona grandis 0.0063131 3.986E-05 -0.03198
38 Terminalia tomentosa 0.0025253 6.377E-06 -0.0151
39 Terminalia tomentosa 0.0025253 6.377E-06 -0.0151
40 Thespesia populnea 0.0075758 5.739E-05 -0.03699
41 Zizyphus jujube 0.0050505 2.551E-05 -0.02671
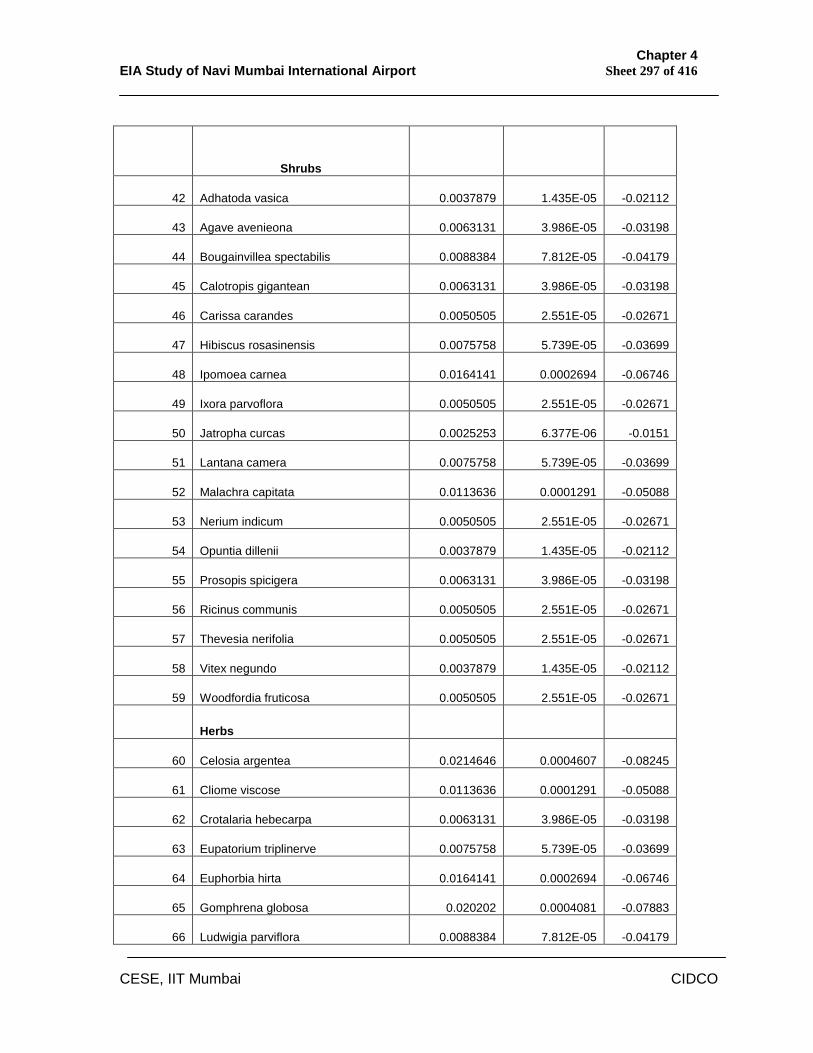
Chapter 4 EIA Study of Navi Mumbai International Airport Sheet 297 of 416
CESE, IIT Mumbai CIDCO
Shrubs
42 Adhatoda vasica 0.0037879 1.435E-05 -0.02112
43 Agave avenieona 0.0063131 3.986E-05 -0.03198
44 Bougainvillea spectabilis 0.0088384 7.812E-05 -0.04179
45 Calotropis gigantean 0.0063131 3.986E-05 -0.03198
46 Carissa carandes 0.0050505 2.551E-05 -0.02671
47 Hibiscus rosasinensis 0.0075758 5.739E-05 -0.03699
48 Ipomoea carnea 0.0164141 0.0002694 -0.06746
49 Ixora parvoflora 0.0050505 2.551E-05 -0.02671
50 Jatropha curcas 0.0025253 6.377E-06 -0.0151
51 Lantana camera 0.0075758 5.739E-05 -0.03699
52 Malachra capitata 0.0113636 0.0001291 -0.05088
53 Nerium indicum 0.0050505 2.551E-05 -0.02671
54 Opuntia dillenii 0.0037879 1.435E-05 -0.02112
55 Prosopis spicigera 0.0063131 3.986E-05 -0.03198
56 Ricinus communis 0.0050505 2.551E-05 -0.02671
57 Thevesia nerifolia 0.0050505 2.551E-05 -0.02671
58 Vitex negundo 0.0037879 1.435E-05 -0.02112
59 Woodfordia fruticosa 0.0050505 2.551E-05 -0.02671 Herbs
60 Celosia argentea 0.0214646 0.0004607 -0.08245
61 Cliome viscose 0.0113636 0.0001291 -0.05088
62 Crotalaria hebecarpa 0.0063131 3.986E-05 -0.03198
63 Eupatorium triplinerve 0.0075758 5.739E-05 -0.03699
64 Euphorbia hirta 0.0164141 0.0002694 -0.06746
65 Gomphrena globosa 0.020202 0.0004081 -0.07883
66 Ludwigia parviflora 0.0088384 7.812E-05 -0.04179
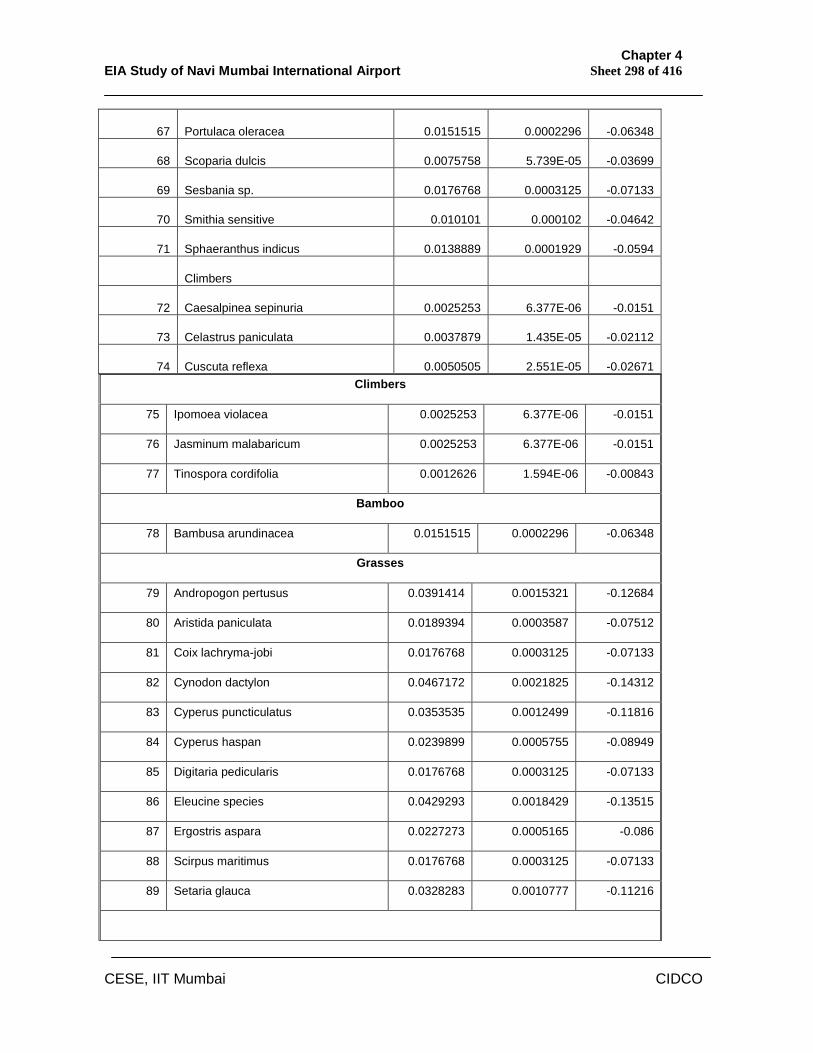
Chapter 4 EIA Study of Navi Mumbai International Airport Sheet 298 of 416
CESE, IIT Mumbai CIDCO
67 Portulaca oleracea 0.0151515 0.0002296 -0.06348
68 Scoparia dulcis 0.0075758 5.739E-05 -0.03699
69 Sesbania sp. 0.0176768 0.0003125 -0.07133
70 Smithia sensitive 0.010101 0.000102 -0.04642
71 Sphaeranthus indicus 0.0138889 0.0001929 -0.0594
Climbers
72 Caesalpinea sepinuria 0.0025253 6.377E-06 -0.0151
73 Celastrus paniculata 0.0037879 1.435E-05 -0.02112
74 Cuscuta reflexa 0.0050505 2.551E-05 -0.02671 Climbers
75 Ipomoea violacea 0.0025253 6.377E-06 -0.0151
76 Jasminum malabaricum 0.0025253 6.377E-06 -0.0151
77 Tinospora cordifolia 0.0012626 1.594E-06 -0.00843
Bamboo
78 Bambusa arundinacea 0.0151515 0.0002296 -0.06348
Grasses
79 Andropogon pertusus 0.0391414 0.0015321 -0.12684
80 Aristida paniculata 0.0189394 0.0003587 -0.07512
81 Coix lachryma-jobi 0.0176768 0.0003125 -0.07133
82 Cynodon dactylon 0.0467172 0.0021825 -0.14312
83 Cyperus puncticulatus 0.0353535 0.0012499 -0.11816
84 Cyperus haspan 0.0239899 0.0005755 -0.08949
85 Digitaria pedicularis 0.0176768 0.0003125 -0.07133
86 Eleucine species 0.0429293 0.0018429 -0.13515
87 Ergostris aspara 0.0227273 0.0005165 -0.086
88 Scirpus maritimus 0.0176768 0.0003125 -0.07133
89 Setaria glauca 0.0328283 0.0010777 -0.11216
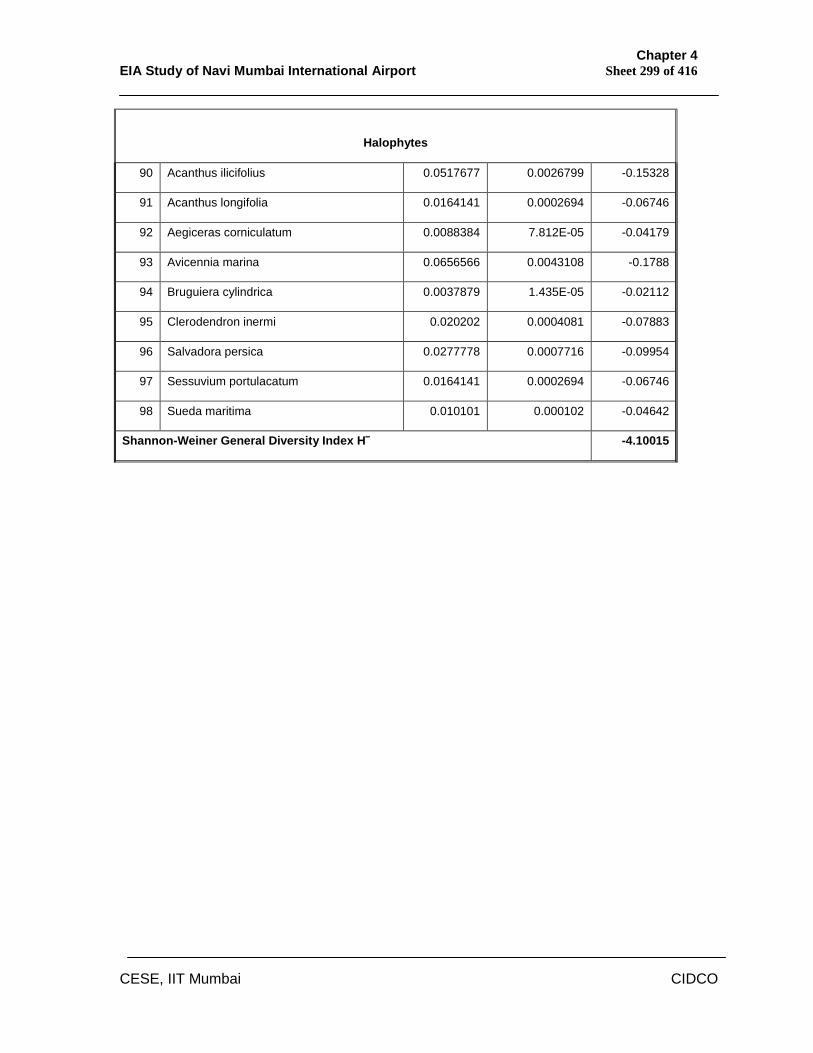
Chapter 4 EIA Study of Navi Mumbai International Airport Sheet 299 of 416
CESE, IIT Mumbai CIDCO
Halophytes
90 Acanthus ilicifolius 0.0517677 0.0026799 -0.15328
91 Acanthus longifolia 0.0164141 0.0002694 -0.06746
92 Aegiceras corniculatum 0.0088384 7.812E-05 -0.04179
93 Avicennia marina 0.0656566 0.0043108 -0.1788
94 Bruguiera cylindrica 0.0037879 1.435E-05 -0.02112
95 Clerodendron inermi 0.020202 0.0004081 -0.07883
96 Salvadora persica 0.0277778 0.0007716 -0.09954
97 Sessuvium portulacatum 0.0164141 0.0002694 -0.06746
98 Sueda maritima 0.010101 0.000102 -0.04642
Shannon-Weiner General Diversity Index H‾ -4.10015
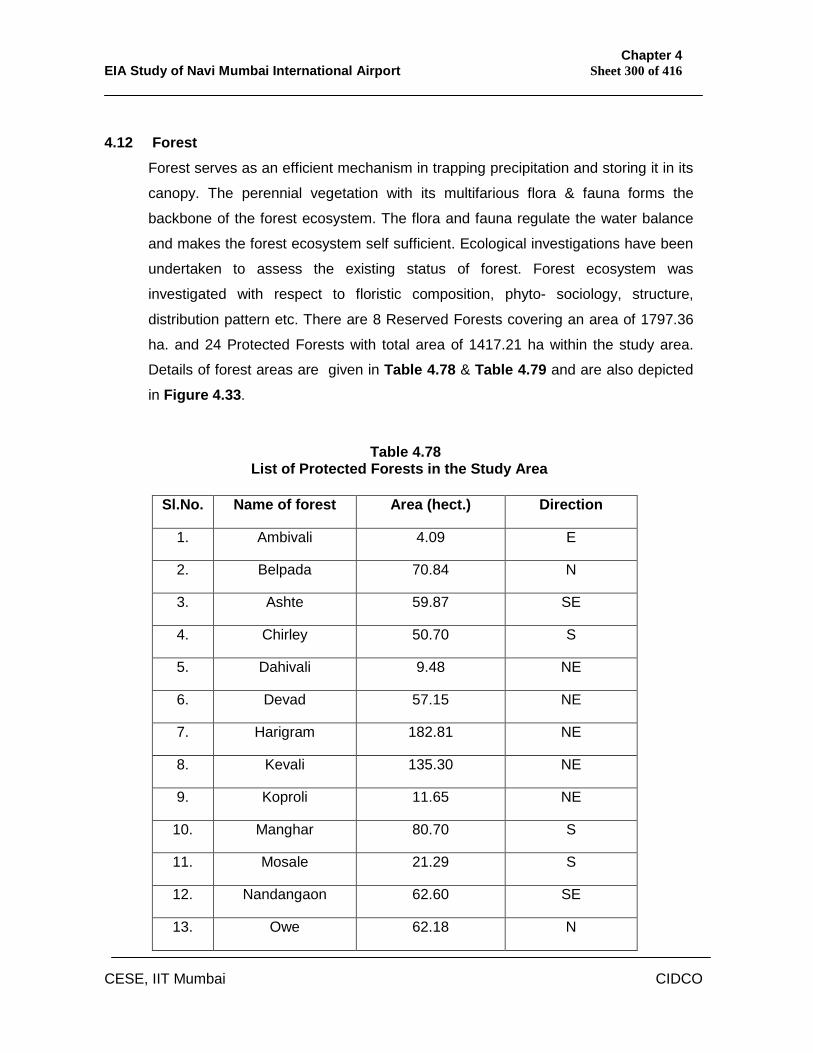
Chapter 4 EIA Study of Navi Mumbai International Airport Sheet 300 of 416
CESE, IIT Mumbai CIDCO
4.12 Forest
Forest serves as an efficient mechanism in trapping precipitation and storing it in its
canopy. The perennial vegetation with its multifarious flora & fauna forms the
backbone of the forest ecosystem. The flora and fauna regulate the water balance
and makes the forest ecosystem self sufficient. Ecological investigations have been
undertaken to assess the existing status of forest. Forest ecosystem was
investigated with respect to floristic composition, phyto- sociology, structure,
distribution pattern etc. There are 8 Reserved Forests covering an area of 1797.36
ha. and 24 Protected Forests with total area of 1417.21 ha within the study area.
Details of forest areas are given in Table 4.78 & Table 4.79 and are also depicted
in Figure 4.33.
Table 4.78 List of Protected Forests in the Study Area
Sl.No. Name of forest Area (hect.) Direction
1. Ambivali 4.09 E
2. Belpada 70.84 N
3. Ashte 59.87 SE
4. Chirley 50.70 S
5. Dahivali 9.48 NE
6. Devad 57.15 NE
7. Harigram 182.81 NE
8. Kevali 135.30 NE
9. Koproli 11.65 NE
10. Manghar 80.70 S
11. Mosale 21.29 S
12. Nandangaon 62.60 SE
13. Owe 62.18 N
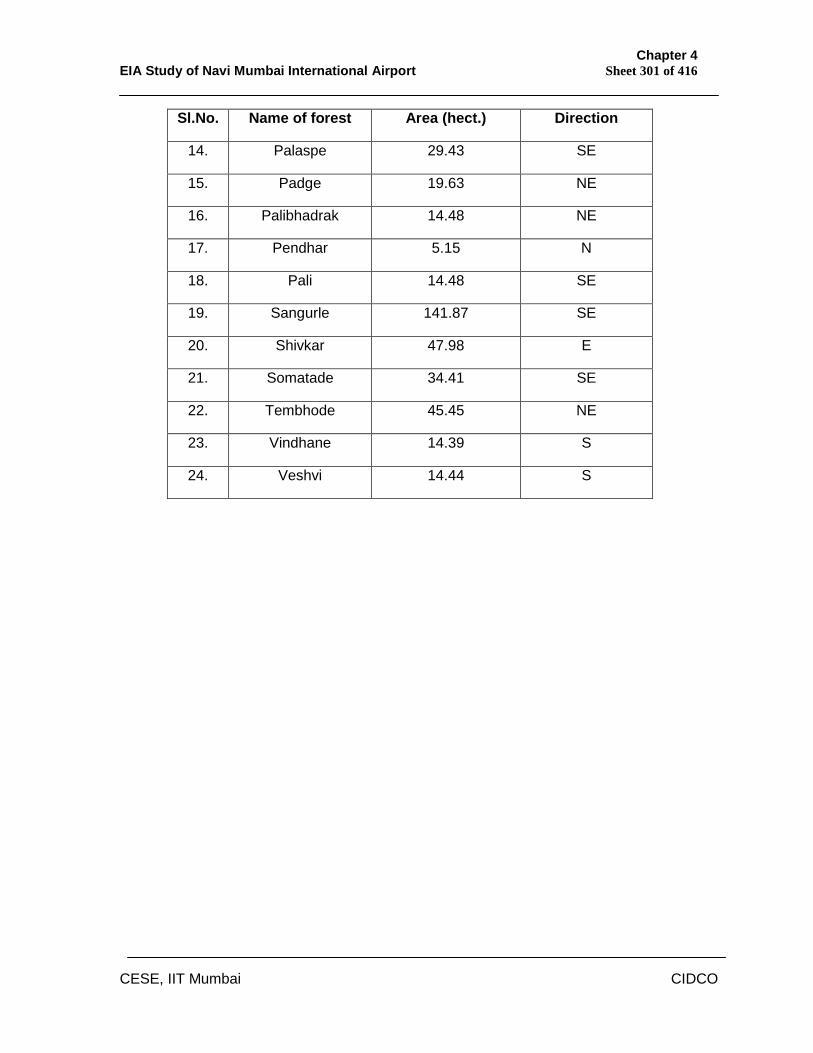
Chapter 4 EIA Study of Navi Mumbai International Airport Sheet 301 of 416
CESE, IIT Mumbai CIDCO
Sl.No. Name of forest Area (hect.) Direction
14. Palaspe 29.43 SE
15. Padge 19.63 NE
16. Palibhadrak 14.48 NE
17. Pendhar 5.15 N
18. Pali 14.48 SE
19. Sangurle 141.87 SE
20. Shivkar 47.98 E
21. Somatade 34.41 SE
22. Tembhode 45.45 NE
23. Vindhane 14.39 S
24. Veshvi 14.44 S
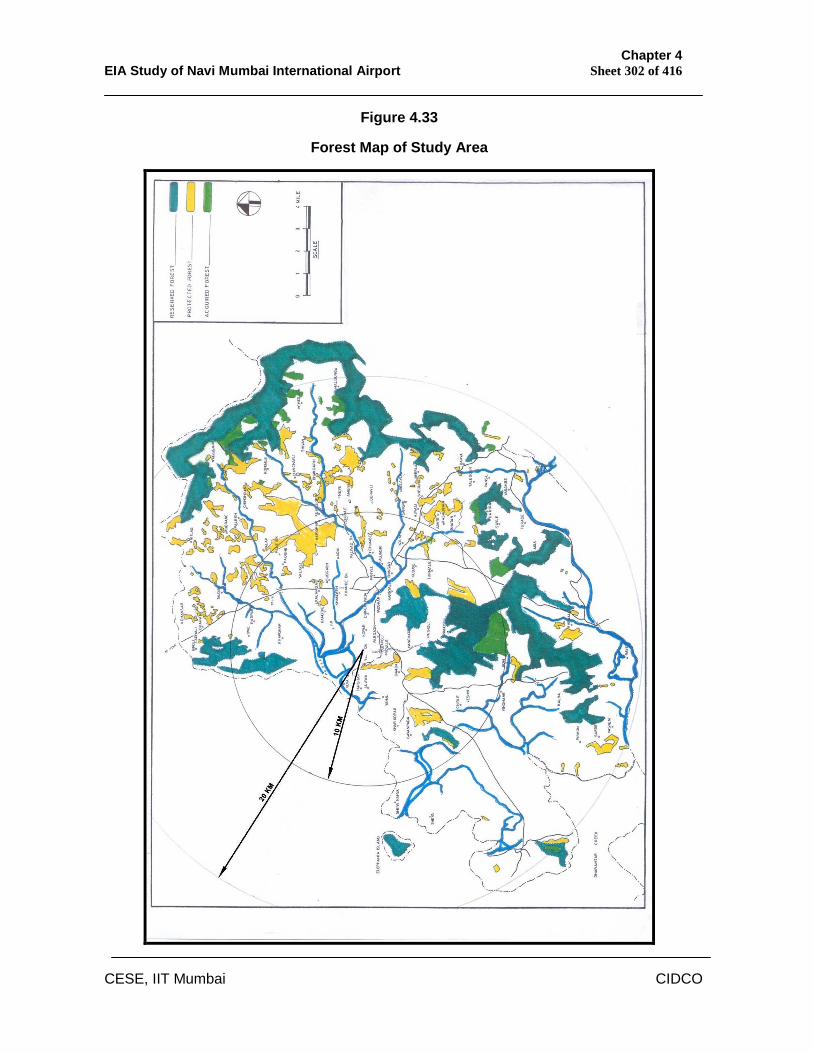
Chapter 4 EIA Study of Navi Mumbai International Airport Sheet 302 of 416
CESE, IIT Mumbai CIDCO
Figure 4.33
Forest Map of Study Area
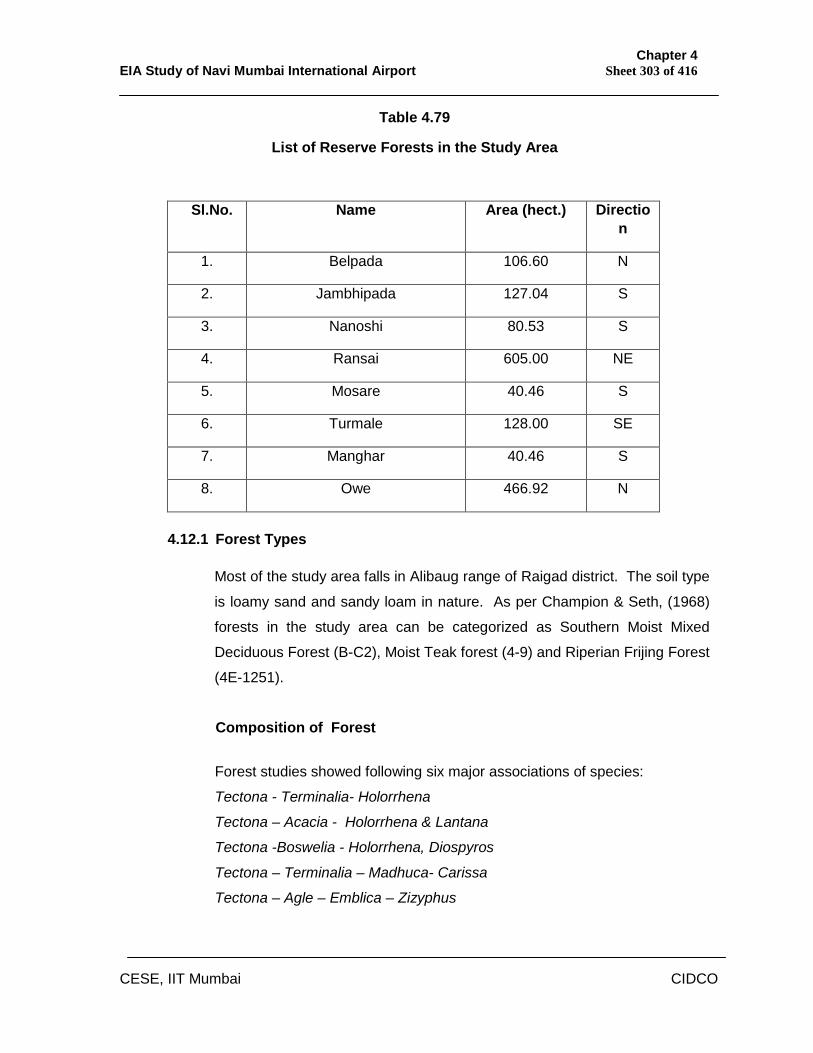
Chapter 4 EIA Study of Navi Mumbai International Airport Sheet 303 of 416
CESE, IIT Mumbai CIDCO
Table 4.79
List of Reserve Forests in the Study Area
Sl.No. Name Area (hect.) Direction
1. Belpada 106.60 N
2. Jambhipada 127.04 S
3. Nanoshi 80.53 S
4. Ransai 605.00 NE
5. Mosare 40.46 S
6. Turmale 128.00 SE
7. Manghar 40.46 S
8. Owe 466.92 N
4.12.1 Forest Types
Most of the study area falls in Alibaug range of Raigad district. The soil type
is loamy sand and sandy loam in nature. As per Champion & Seth, (1968)
forests in the study area can be categorized as Southern Moist Mixed
Deciduous Forest (B-C2), Moist Teak forest (4-9) and Riperian Frijing Forest
(4E-1251).
Composition of Forest
Forest studies showed following six major associations of species:
Tectona - Terminalia- Holorrhena
Tectona – Acacia - Holorrhena & Lantana
Tectona -Boswelia - Holorrhena, Diospyros
Tectona – Terminalia – Madhuca- Carissa
Tectona – Agle – Emblica – Zizyphus
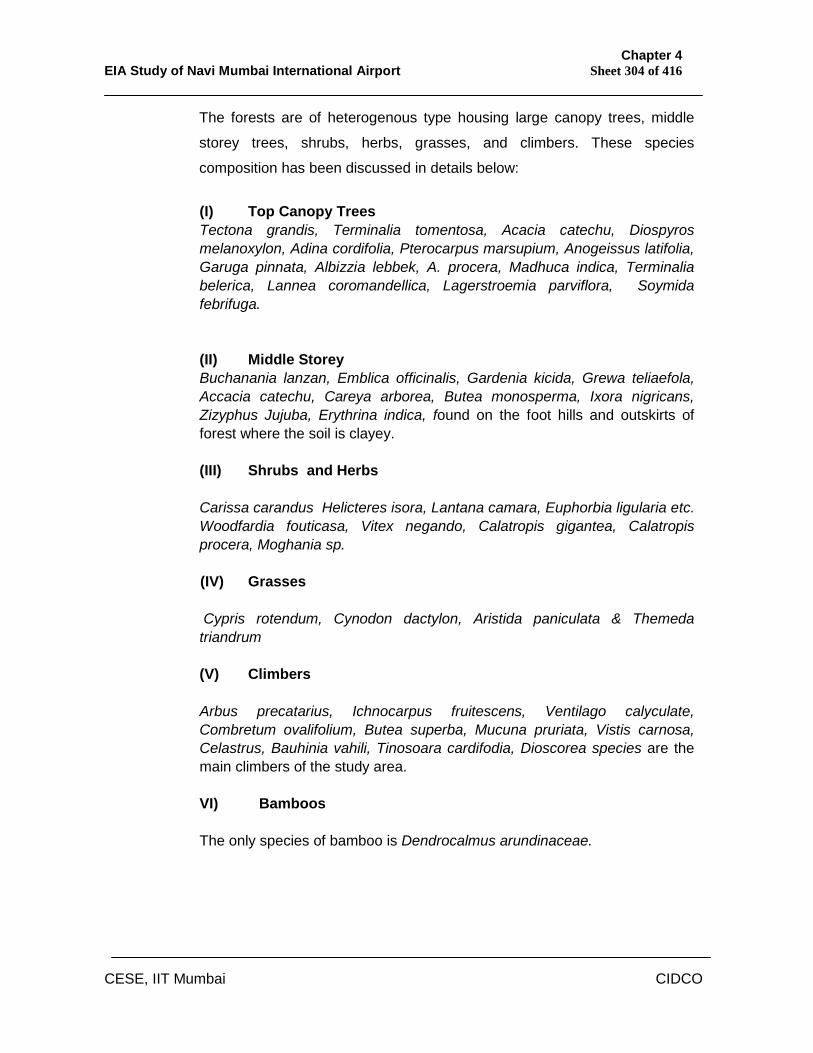
Chapter 4 EIA Study of Navi Mumbai International Airport Sheet 304 of 416
CESE, IIT Mumbai CIDCO
The forests are of heterogenous type housing large canopy trees, middle
storey trees, shrubs, herbs, grasses, and climbers. These species
composition has been discussed in details below:
(I) Top Canopy Trees Tectona grandis, Terminalia tomentosa, Acacia catechu, Diospyros melanoxylon, Adina cordifolia, Pterocarpus marsupium, Anogeissus latifolia, Garuga pinnata, Albizzia lebbek, A. procera, Madhuca indica, Terminalia belerica, Lannea coromandellica, Lagerstroemia parviflora, Soymida febrifuga.
(II) Middle Storey Buchanania lanzan, Emblica officinalis, Gardenia kicida, Grewa teliaefola, Accacia catechu, Careya arborea, Butea monosperma, Ixora nigricans, Zizyphus Jujuba, Erythrina indica, found on the foot hills and outskirts of forest where the soil is clayey.
(III) Shrubs and Herbs
Carissa carandus Helicteres isora, Lantana camara, Euphorbia ligularia etc. Woodfardia fouticasa, Vitex negando, Calatropis gigantea, Calatropis procera, Moghania sp.
(IV) Grasses
Cypris rotendum, Cynodon dactylon, Aristida paniculata & Themeda triandrum
(V) Climbers
Arbus precatarius, Ichnocarpus fruitescens, Ventilago calyculate, Combretum ovalifolium, Butea superba, Mucuna pruriata, Vistis carnosa, Celastrus, Bauhinia vahili, Tinosoara cardifodia, Dioscorea species are the main climbers of the study area.
VI) Bamboos
The only species of bamboo is Dendrocalmus arundinaceae.
Chapter 4 EIA Study of Navi Mumbai International Airport Sheet 305 of 416
CESE, IIT Mumbai CIDCO
4.13 Acquatic Ecosystem
Acquatic Ecosystem is represented by the river Gadhi, Ulwe and Panvel Creek. In
order to assess the water quality based on the phytoplankton, zooplankton and
benthos samples were collected from the above mentioned water bodies within the
study area.
4.13.1 Phytoplankton The totals of 24 species were encountered in the pre-monsoon season, though in
monsoon only 12 species were observed. A total of 24 species were encountered in
the pre-monsoon season, of which a maximum 9 species were found at W13 and
W21 followed by 8 species at W 8 and W 9 stations whereas 7 species were
encountered at W 3 and W 16 and 6 species were observed at W 14 and W 15.
Rhizosolenia species were the commonest being encountered at 20 stations,
Skeletonema species were next being found at 19 out of 21 stations. Pleurosigma
species could be seen at 14 stations. Chaetoceros species, Ditilum breghturelli,
Guinardia flacida and Volvox species was each encountered at only one station
while the unidentified box like centric diatoms and Coccosphere species were also
noticed at one station each. Tables 4.80(a) to 4.80(c) depict the species of
phytoplankton encountered at various stations along the Gadhi River, Ulwe River
and Panvel Creek in the project area during pre monsoon, monsoon and post
monsoon season.
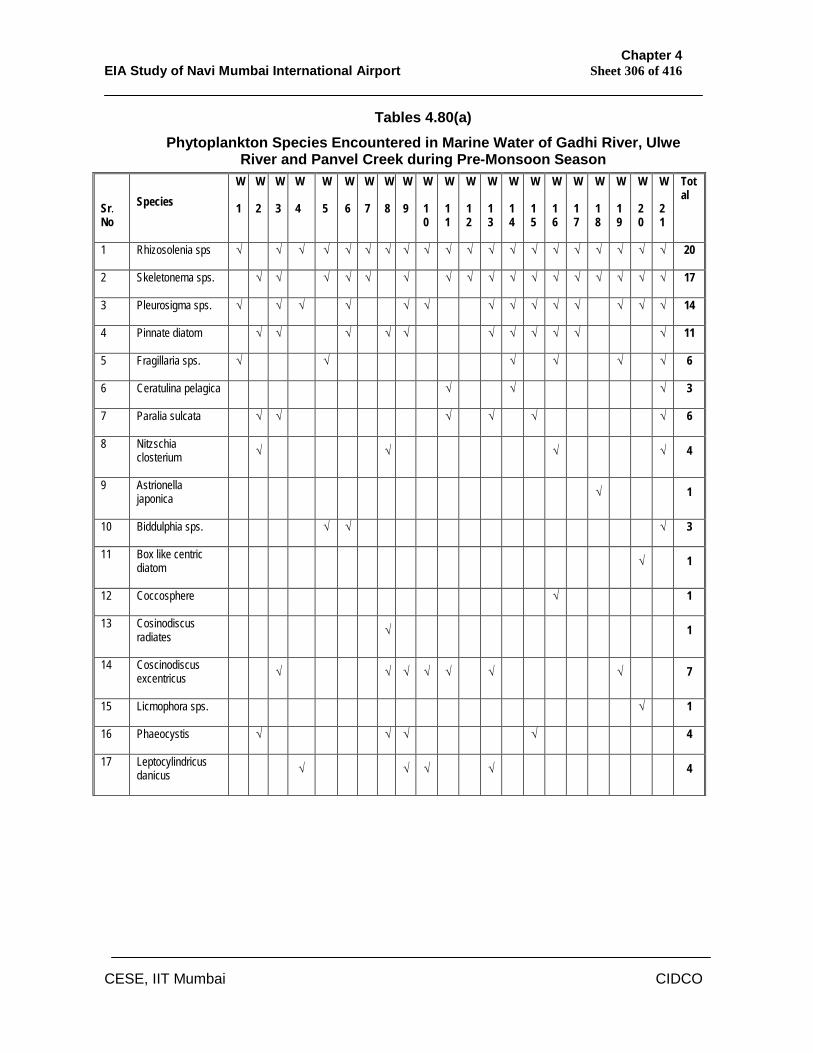
Chapter 4 EIA Study of Navi Mumbai International Airport Sheet 306 of 416
CESE, IIT Mumbai CIDCO
Tables 4.80(a) Phytoplankton Species Encountered in Marine Water of Gadhi River, Ulwe
River and Panvel Creek during Pre-Monsoon Season
Sr. No
Species W
1
W
2
W
3
W
4
W
5
W
6
W
7
W
8
W
9
W
10
W
11
W
12
W
13
W
14
W
15
W
16
W
17
W
18
W
19
W
20
W
21
Total
1 Rhizosolenia sps √ √ √ √ √ √ √ √ √ √ √ √ √ √ √ √ √ √ √ √ 20
2 Skeletonema sps. √ √ √ √ √ √ √ √ √ √ √ √ √ √ √ √ √ 17
3 Pleurosigma sps. √ √ √ √ √ √ √ √ √ √ √ √ √ √ 14
4 Pinnate diatom √ √ √ √ √ √ √ √ √ √ √ 11
5 Fragillaria sps. √ √ √ √ √ √ 6
6 Ceratulina pelagica √ √ √ 3
7 Paralia sulcata √ √ √ √ √ √ 6
8 Nitzschia closterium √ √ √ √ 4
9 Astrionella japonica √ 1
10 Biddulphia sps. √ √ √ 3
11 Box like centric diatom √ 1
12 Coccosphere √ 1
13 Cosinodiscus radiates √ 1
14 Coscinodiscus excentricus √ √ √ √ √ √ √ 7
15 Licmophora sps. √ 1
16 Phaeocystis √ √ √ √ 4
17 Leptocylindricus danicus √ √ √ √ 4
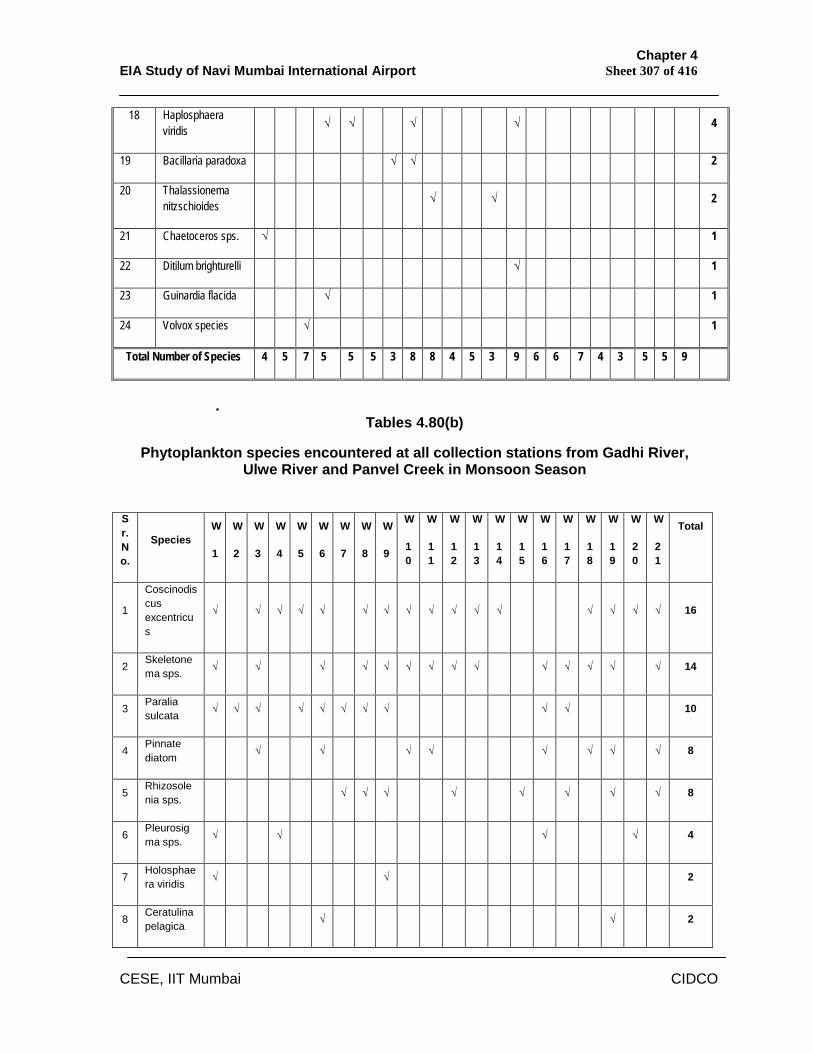
Chapter 4 EIA Study of Navi Mumbai International Airport Sheet 307 of 416
CESE, IIT Mumbai CIDCO
.
Tables 4.80(b)
Phytoplankton species encountered at all collection stations from Gadhi River, Ulwe River and Panvel Creek in Monsoon Season
18 Haplosphaera viridis √ √ √ √ 4
19 Bacillaria paradoxa √ √ 2
20 Thalassionema nitzschioides √ √ 2
21 Chaetoceros sps. √ 1
22 Ditilum brighturelli √ 1
23 Guinardia flacida √ 1
24 Volvox species √ 1
Total Number of Species 4 5 7 5 5 5 3 8 8 4 5 3 9 6 6 7 4 3 5 5 9
Sr. No.
Species W
1
W
2
W
3
W
4
W
5
W
6
W
7
W
8
W
9
W
10
W
11
W
12
W
13
W
14
W
15
W
16
W
17
W
18
W
19
W
20
W
21
Total
1
Coscinodiscus excentricus
√ √ √ √ √ √ √ √ √ √ √ √ √ √ √ √ 16
2 Skeletonema sps. √ √ √ √ √ √ √ √ √ √ √ √ √ √ 14
3 Paralia sulcata √ √ √ √ √ √ √ √ √ √ 10
4 Pinnate diatom
√ √ √ √ √ √ √ √ 8
5 Rhizosolenia sps. √ √ √ √ √ √ √ √ 8
6 Pleurosigma sps. √ √ √ √ 4
7 Holosphaera viridis √ √ 2
8 Ceratulina pelagica √ √ 2
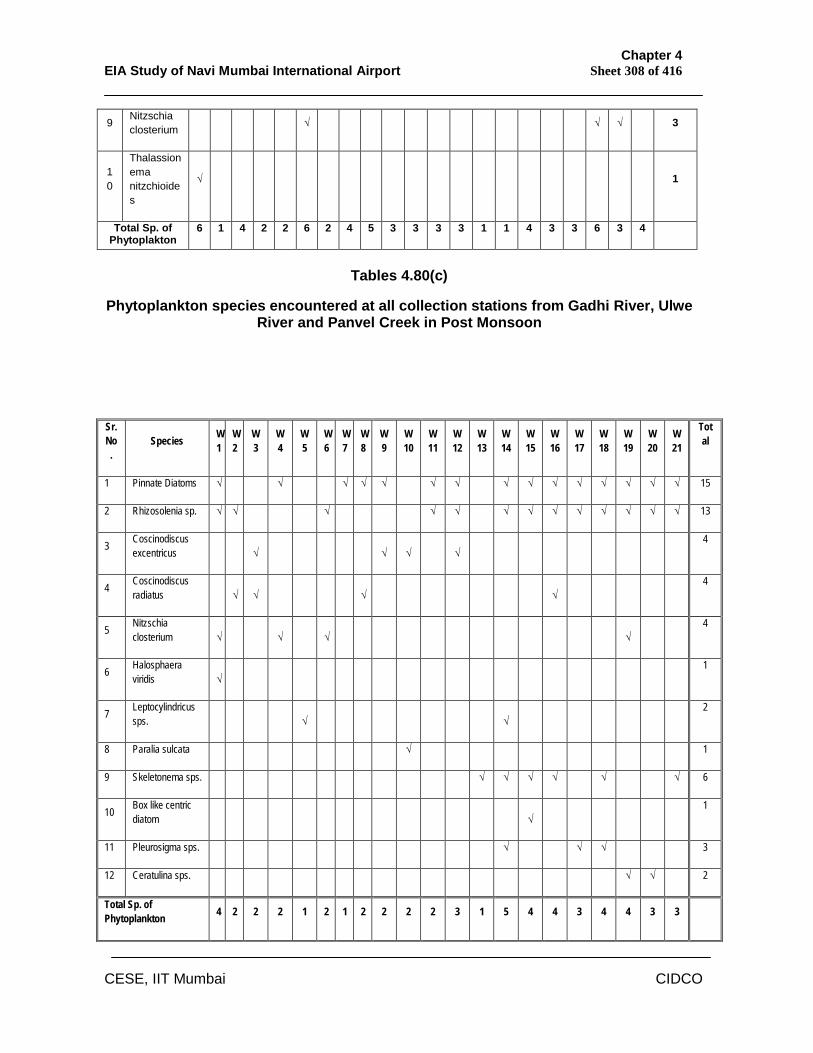
Chapter 4 EIA Study of Navi Mumbai International Airport Sheet 308 of 416
CESE, IIT Mumbai CIDCO
Tables 4.80(c)
Phytoplankton species encountered at all collection stations from Gadhi River, Ulwe River and Panvel Creek in Post Monsoon
9 Nitzschia closterium √ √ √ 3
10
Thalassionema nitzchioides
√ 1
Total Sp. of Phytoplakton
6 1 4 2 2 6 2 4 5 3 3 3 3 1 1 4 3 3 6 3 4
Sr. No.
Species W1
W2
W3
W4
W5
W6
W7
W8
W9
W10
W11
W12
W13
W14
W15
W16
W17
W18
W19
W20
W21
Total
1 Pinnate Diatoms √ √ √ √ √ √ √ √ √ √ √ √ √ √ √ 15
2 Rhizosolenia sp. √ √ √ √ √ √ √ √ √ √ √ √ √ 13
3 Coscinodiscus excentricus √ √ √ √
4
4 Coscinodiscus radiatus √ √ √ √
4
5 Nitzschia closterium √ √ √ √
4
6 Halosphaera viridis √
1
7 Leptocylindricus sps. √ √
2
8 Paralia sulcata √ 1
9 Skeletonema sps. √ √ √ √ √ √ 6
10 Box like centric diatom √
1
11 Pleurosigma sps. √ √ √ 3
12 Ceratulina sps. √ √ 2
Total Sp. of Phytoplankton 4 2 2 2 1 2 1 2 2 2 2 3 1 5 4 4 3 4 4 3 3
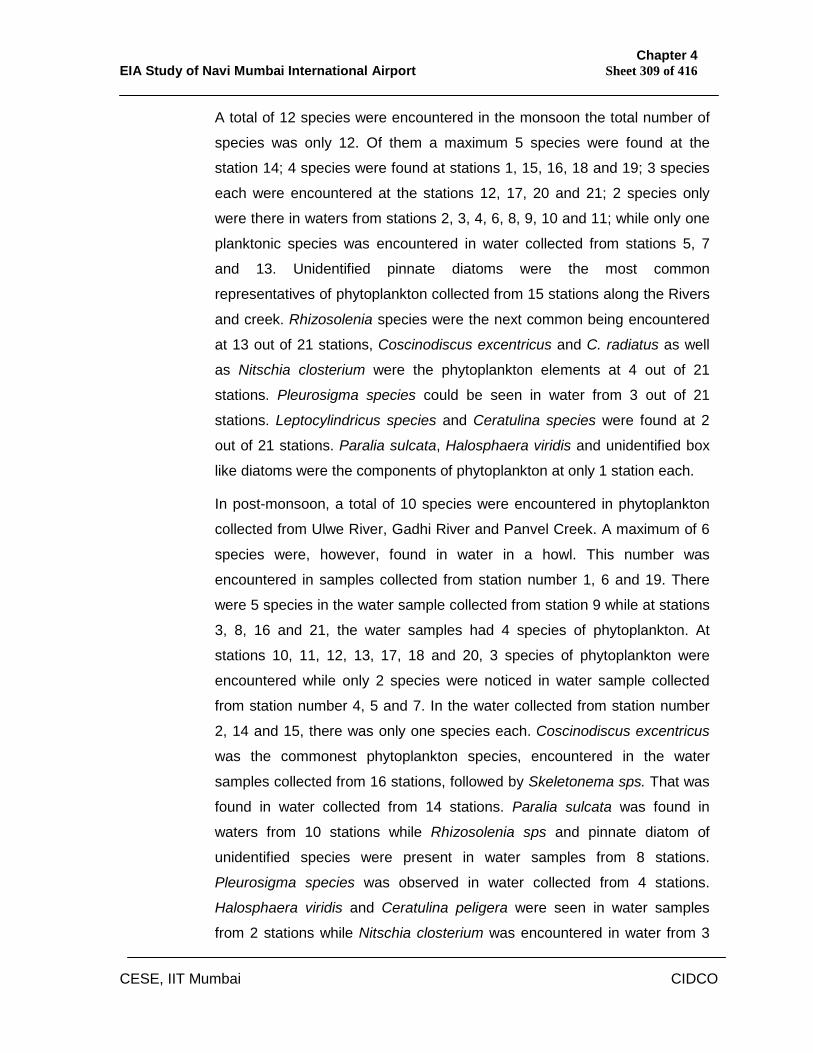
Chapter 4 EIA Study of Navi Mumbai International Airport Sheet 309 of 416
CESE, IIT Mumbai CIDCO
A total of 12 species were encountered in the monsoon the total number of
species was only 12. Of them a maximum 5 species were found at the
station 14; 4 species were found at stations 1, 15, 16, 18 and 19; 3 species
each were encountered at the stations 12, 17, 20 and 21; 2 species only
were there in waters from stations 2, 3, 4, 6, 8, 9, 10 and 11; while only one
planktonic species was encountered in water collected from stations 5, 7
and 13. Unidentified pinnate diatoms were the most common
representatives of phytoplankton collected from 15 stations along the Rivers
and creek. Rhizosolenia species were the next common being encountered
at 13 out of 21 stations, Coscinodiscus excentricus and C. radiatus as well
as Nitschia closterium were the phytoplankton elements at 4 out of 21
stations. Pleurosigma species could be seen in water from 3 out of 21
stations. Leptocylindricus species and Ceratulina species were found at 2
out of 21 stations. Paralia sulcata, Halosphaera viridis and unidentified box
like diatoms were the components of phytoplankton at only 1 station each.
In post-monsoon, a total of 10 species were encountered in phytoplankton
collected from Ulwe River, Gadhi River and Panvel Creek. A maximum of 6
species were, however, found in water in a howl. This number was
encountered in samples collected from station number 1, 6 and 19. There
were 5 species in the water sample collected from station 9 while at stations
3, 8, 16 and 21, the water samples had 4 species of phytoplankton. At
stations 10, 11, 12, 13, 17, 18 and 20, 3 species of phytoplankton were
encountered while only 2 species were noticed in water sample collected
from station number 4, 5 and 7. In the water collected from station number
2, 14 and 15, there was only one species each. Coscinodiscus excentricus
was the commonest phytoplankton species, encountered in the water
samples collected from 16 stations, followed by Skeletonema sps. That was
found in water collected from 14 stations. Paralia sulcata was found in
waters from 10 stations while Rhizosolenia sps and pinnate diatom of
unidentified species were present in water samples from 8 stations.
Pleurosigma species was observed in water collected from 4 stations.
Halosphaera viridis and Ceratulina peligera were seen in water samples
from 2 stations while Nitschia closterium was encountered in water from 3
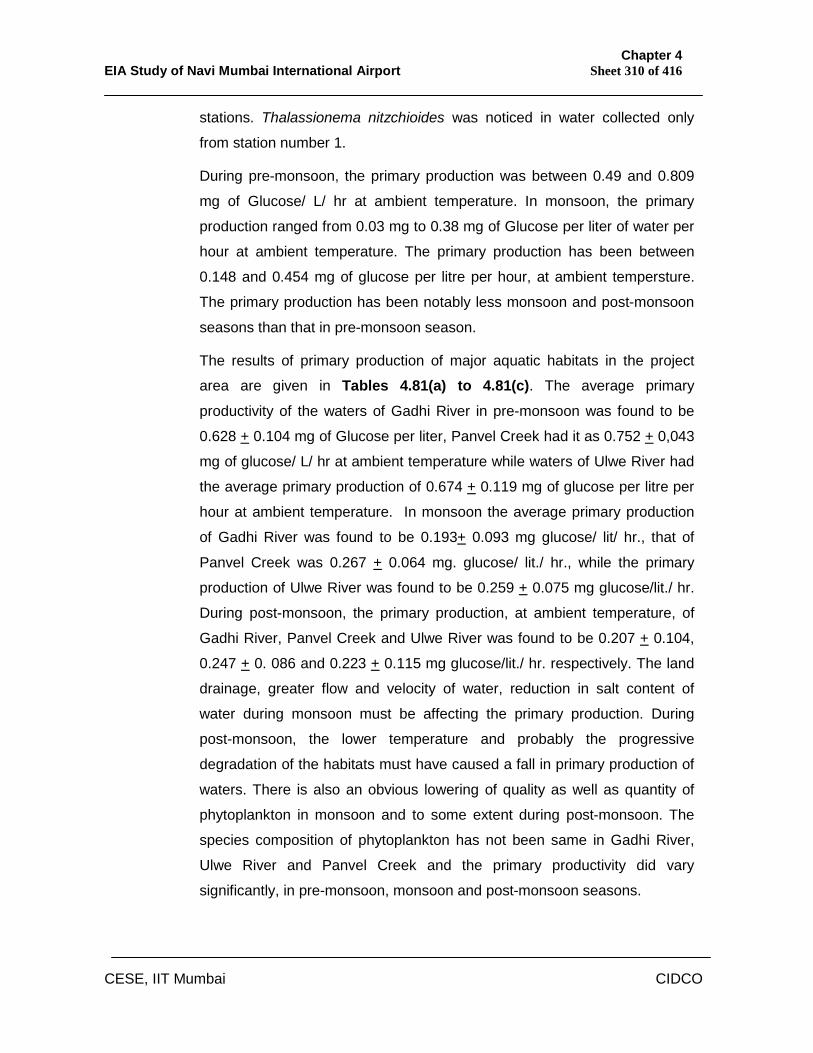
Chapter 4 EIA Study of Navi Mumbai International Airport Sheet 310 of 416
CESE, IIT Mumbai CIDCO
stations. Thalassionema nitzchioides was noticed in water collected only
from station number 1.
During pre-monsoon, the primary production was between 0.49 and 0.809
mg of Glucose/ L/ hr at ambient temperature. In monsoon, the primary
production ranged from 0.03 mg to 0.38 mg of Glucose per liter of water per
hour at ambient temperature. The primary production has been between
0.148 and 0.454 mg of glucose per litre per hour, at ambient tempersture.
The primary production has been notably less monsoon and post-monsoon
seasons than that in pre-monsoon season.
The results of primary production of major aquatic habitats in the project
area are given in Tables 4.81(a) to 4.81(c). The average primary
productivity of the waters of Gadhi River in pre-monsoon was found to be
0.628 + 0.104 mg of Glucose per liter, Panvel Creek had it as 0.752 + 0,043
mg of glucose/ L/ hr at ambient temperature while waters of Ulwe River had
the average primary production of 0.674 + 0.119 mg of glucose per litre per
hour at ambient temperature. In monsoon the average primary production
of Gadhi River was found to be 0.193+ 0.093 mg glucose/ lit/ hr., that of
Panvel Creek was 0.267 + 0.064 mg. glucose/ lit./ hr., while the primary
production of Ulwe River was found to be 0.259 + 0.075 mg glucose/lit./ hr.
During post-monsoon, the primary production, at ambient temperature, of
Gadhi River, Panvel Creek and Ulwe River was found to be 0.207 + 0.104,
0.247 + 0. 086 and 0.223 + 0.115 mg glucose/lit./ hr. respectively. The land
drainage, greater flow and velocity of water, reduction in salt content of
water during monsoon must be affecting the primary production. During
post-monsoon, the lower temperature and probably the progressive
degradation of the habitats must have caused a fall in primary production of
waters. There is also an obvious lowering of quality as well as quantity of
phytoplankton in monsoon and to some extent during post-monsoon. The
species composition of phytoplankton has not been same in Gadhi River,
Ulwe River and Panvel Creek and the primary productivity did vary
significantly, in pre-monsoon, monsoon and post-monsoon seasons.
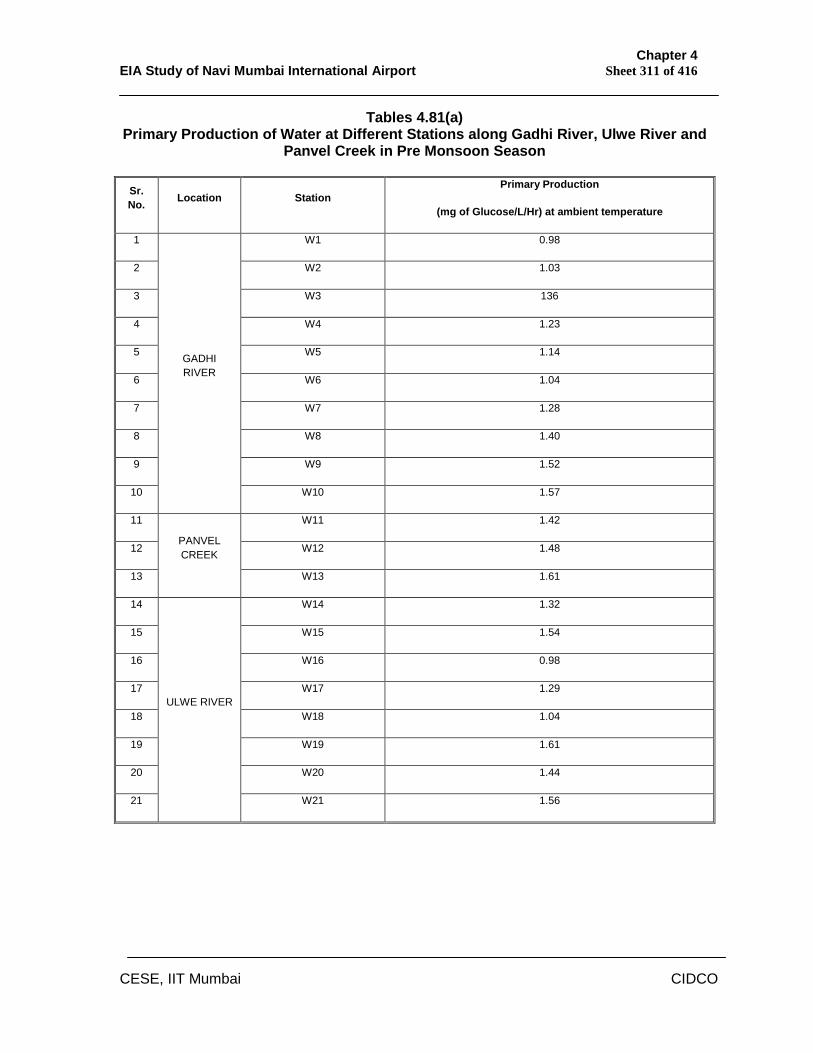
Chapter 4 EIA Study of Navi Mumbai International Airport Sheet 311 of 416
CESE, IIT Mumbai CIDCO
Tables 4.81(a) Primary Production of Water at Different Stations along Gadhi River, Ulwe River and
Panvel Creek in Pre Monsoon Season
Sr. No. Location Station
Primary Production
(mg of Glucose/L/Hr) at ambient temperature
1 W1 0.98
2 W2 1.03
3 W3 136
4 W4 1.23
5 W5 1.14
6 W6 1.04
7 W7 1.28
8 W8 1.40
9 W9 1.52
10
GADHI RIVER
W10 1.57
11 W11 1.42
12 W12 1.48
13
PANVEL CREEK
W13 1.61
14 W14 1.32
15 W15 1.54
16 W16 0.98
17 W17 1.29
18 W18 1.04
19 W19 1.61
20 W20 1.44
21
ULWE RIVER
W21 1.56
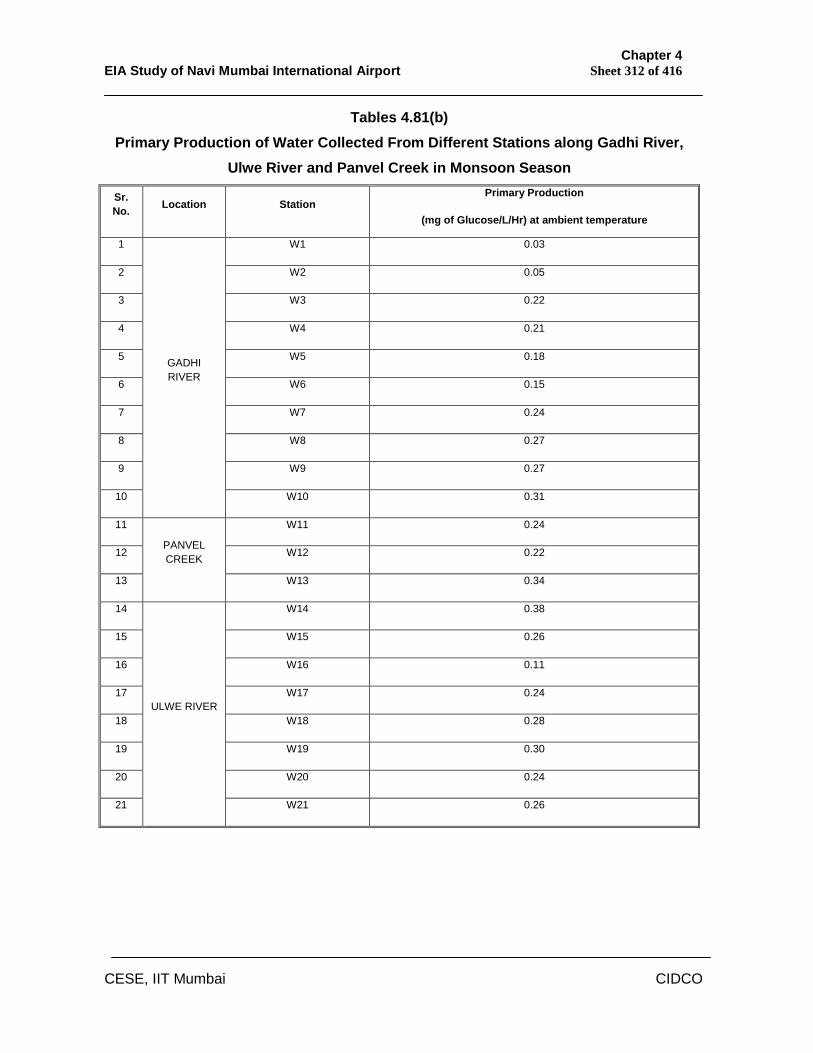
Chapter 4 EIA Study of Navi Mumbai International Airport Sheet 312 of 416
CESE, IIT Mumbai CIDCO
Tables 4.81(b) Primary Production of Water Collected From Different Stations along Gadhi River,
Ulwe River and Panvel Creek in Monsoon Season
Sr. No. Location Station
Primary Production
(mg of Glucose/L/Hr) at ambient temperature
1 W1 0.03
2 W2 0.05
3 W3 0.22
4 W4 0.21
5 W5 0.18
6 W6 0.15
7 W7 0.24
8 W8 0.27
9 W9 0.27
10
GADHI RIVER
W10 0.31
11 W11 0.24
12 W12 0.22
13
PANVEL CREEK
W13 0.34
14 W14 0.38
15 W15 0.26
16 W16 0.11
17 W17 0.24
18 W18 0.28
19 W19 0.30
20 W20 0.24
21
ULWE RIVER
W21 0.26
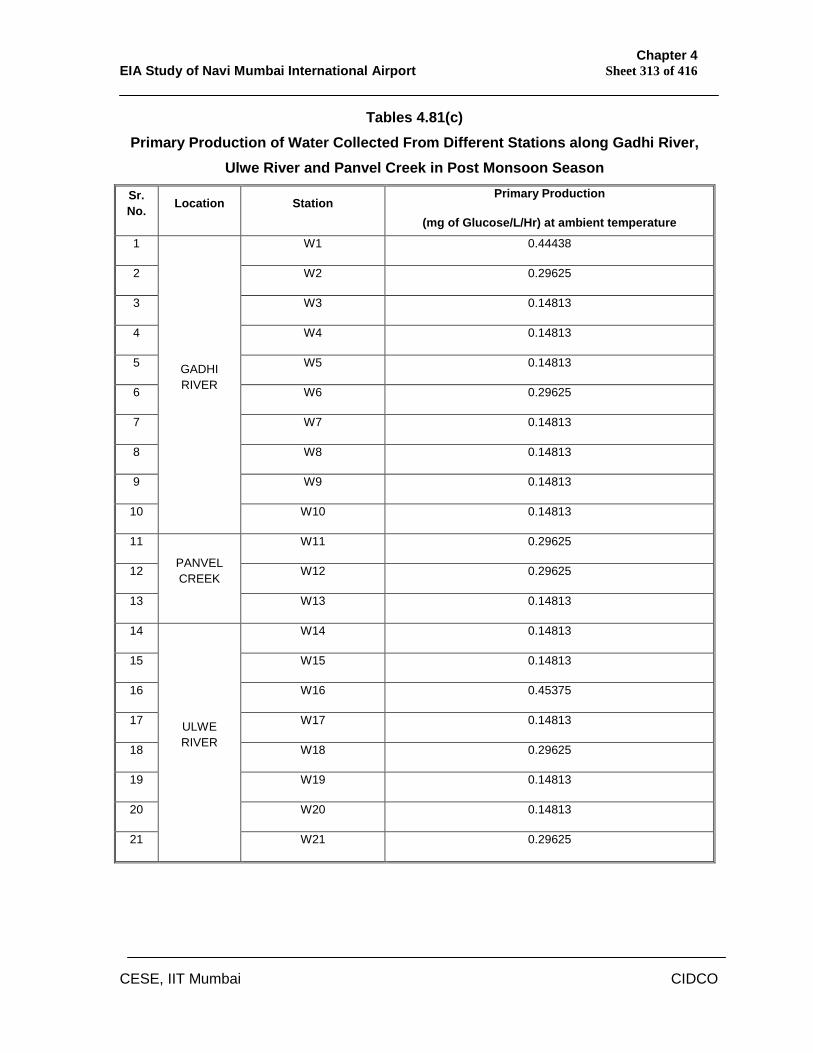
Chapter 4 EIA Study of Navi Mumbai International Airport Sheet 313 of 416
CESE, IIT Mumbai CIDCO
Tables 4.81(c) Primary Production of Water Collected From Different Stations along Gadhi River,
Ulwe River and Panvel Creek in Post Monsoon Season
Sr. No. Location Station
Primary Production
(mg of Glucose/L/Hr) at ambient temperature
1 W1 0.44438
2 W2 0.29625
3 W3 0.14813
4 W4 0.14813
5 W5 0.14813
6 W6 0.29625
7 W7 0.14813
8 W8 0.14813
9 W9 0.14813
10
GADHI RIVER
W10 0.14813
11 W11 0.29625
12 W12 0.29625
13
PANVEL CREEK
W13 0.14813
14 W14 0.14813
15 W15 0.14813
16 W16 0.45375
17 W17 0.14813
18 W18 0.29625
19 W19 0.14813
20 W20 0.14813
21
ULWE RIVER
W21 0.29625
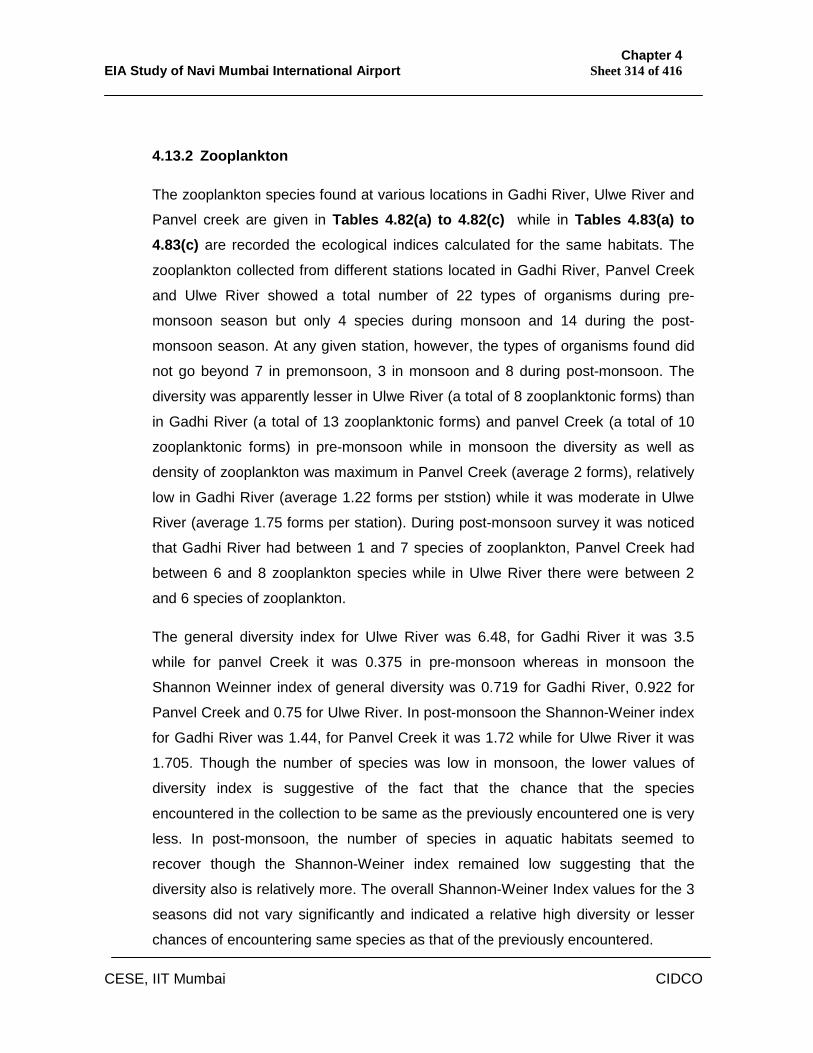
Chapter 4 EIA Study of Navi Mumbai International Airport Sheet 314 of 416
CESE, IIT Mumbai CIDCO
4.13.2 Zooplankton
The zooplankton species found at various locations in Gadhi River, Ulwe River and
Panvel creek are given in Tables 4.82(a) to 4.82(c) while in Tables 4.83(a) to 4.83(c) are recorded the ecological indices calculated for the same habitats. The
zooplankton collected from different stations located in Gadhi River, Panvel Creek
and Ulwe River showed a total number of 22 types of organisms during pre-
monsoon season but only 4 species during monsoon and 14 during the post-
monsoon season. At any given station, however, the types of organisms found did
not go beyond 7 in premonsoon, 3 in monsoon and 8 during post-monsoon. The
diversity was apparently lesser in Ulwe River (a total of 8 zooplanktonic forms) than
in Gadhi River (a total of 13 zooplanktonic forms) and panvel Creek (a total of 10
zooplanktonic forms) in pre-monsoon while in monsoon the diversity as well as
density of zooplankton was maximum in Panvel Creek (average 2 forms), relatively
low in Gadhi River (average 1.22 forms per ststion) while it was moderate in Ulwe
River (average 1.75 forms per station). During post-monsoon survey it was noticed
that Gadhi River had between 1 and 7 species of zooplankton, Panvel Creek had
between 6 and 8 zooplankton species while in Ulwe River there were between 2
and 6 species of zooplankton.
The general diversity index for Ulwe River was 6.48, for Gadhi River it was 3.5
while for panvel Creek it was 0.375 in pre-monsoon whereas in monsoon the
Shannon Weinner index of general diversity was 0.719 for Gadhi River, 0.922 for
Panvel Creek and 0.75 for Ulwe River. In post-monsoon the Shannon-Weiner index
for Gadhi River was 1.44, for Panvel Creek it was 1.72 while for Ulwe River it was
1.705. Though the number of species was low in monsoon, the lower values of
diversity index is suggestive of the fact that the chance that the species
encountered in the collection to be same as the previously encountered one is very
less. In post-monsoon, the number of species in aquatic habitats seemed to
recover though the Shannon-Weiner index remained low suggesting that the
diversity also is relatively more. The overall Shannon-Weiner Index values for the 3
seasons did not vary significantly and indicated a relative high diversity or lesser
chances of encountering same species as that of the previously encountered.
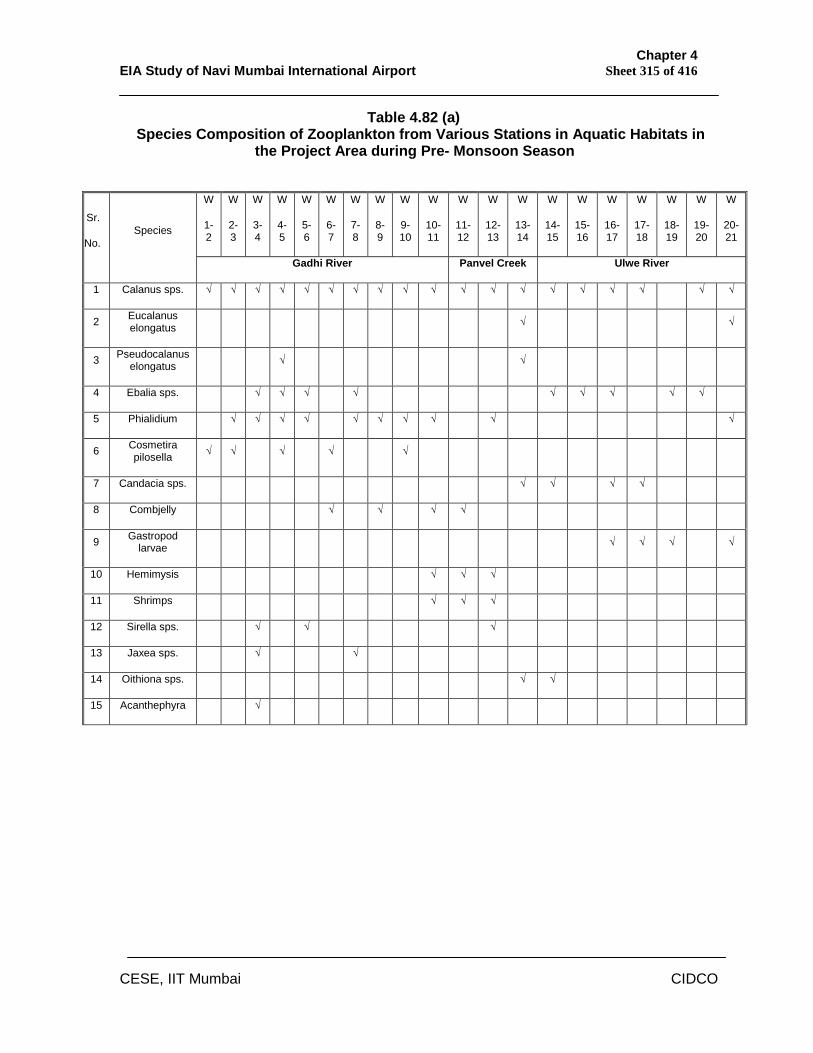
Chapter 4 EIA Study of Navi Mumbai International Airport Sheet 315 of 416
CESE, IIT Mumbai CIDCO
Table 4.82 (a) Species Composition of Zooplankton from Various Stations in Aquatic Habitats in
the Project Area during Pre- Monsoon Season
W
1-2
W
2-3
W
3-4
W
4-5
W
5-6
W
6-7
W
7-8
W
8-9
W
9-10
W
10-11
W
11-12
W
12-13
W
13-14
W
14-15
W
15-16
W
16-17
W
17-18
W
18-19
W
19-20
W
20-21
Sr.
No. Species
Gadhi River Panvel Creek Ulwe River
1 Calanus sps. √ √ √ √ √ √ √ √ √ √ √ √ √ √ √ √ √ √ √
2 Eucalanus elongatus √ √
3 Pseudocalanus elongatus √ √
4 Ebalia sps. √ √ √ √ √ √ √ √ √
5 Phialidium √ √ √ √ √ √ √ √ √ √
6 Cosmetira pilosella √ √ √ √ √
7 Candacia sps. √ √ √ √
8 Combjelly √ √ √ √
9 Gastropod larvae √ √ √ √
10 Hemimysis √ √ √
11 Shrimps √ √ √
12 Sirella sps. √ √ √
13 Jaxea sps. √ √
14 Oithiona sps. √ √
15 Acanthephyra √
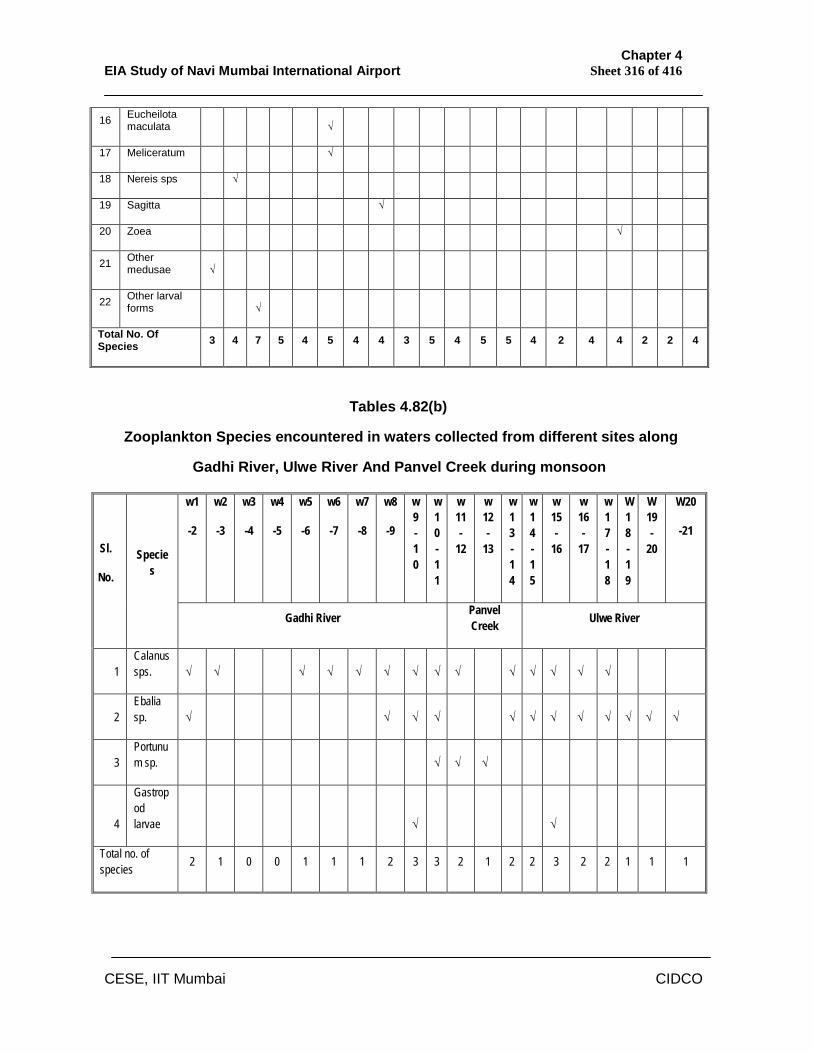
Chapter 4 EIA Study of Navi Mumbai International Airport Sheet 316 of 416
CESE, IIT Mumbai CIDCO
Tables 4.82(b)
Zooplankton Species encountered in waters collected from different sites along
Gadhi River, Ulwe River And Panvel Creek during monsoon
16 Eucheilota maculata √
17 Meliceratum √
18 Nereis sps √
19 Sagitta √
20 Zoea √
21 Other medusae √
22 Other larval forms √
Total No. Of Species 3 4 7 5 4 5 4 4 3 5 4 5 5 4 2 4 4 2 2 4
w1
-2
w2
-3
w3
-4
w4
-5
w5
-6
w6
-7
w7
-8
w8
-9
w9-10
w10-11
w11-
12
w12-
13
w13-14
w14-15
w15-
16
w16-
17
w17-18
W18-19
W19-
20
W20
-21 Sl.
No.
Species
Gadhi River Panvel Creek Ulwe River
1 Calanus sps. √ √ √ √ √ √ √ √ √ √ √ √ √ √
2 Ebalia sp. √ √ √ √ √ √ √ √ √ √ √ √
3 Portunum sp. √ √ √
4
Gastropod larvae √ √
Total no. of species 2 1 0 0 1 1 1 2 3 3 2 1 2 2 3 2 2 1 1 1
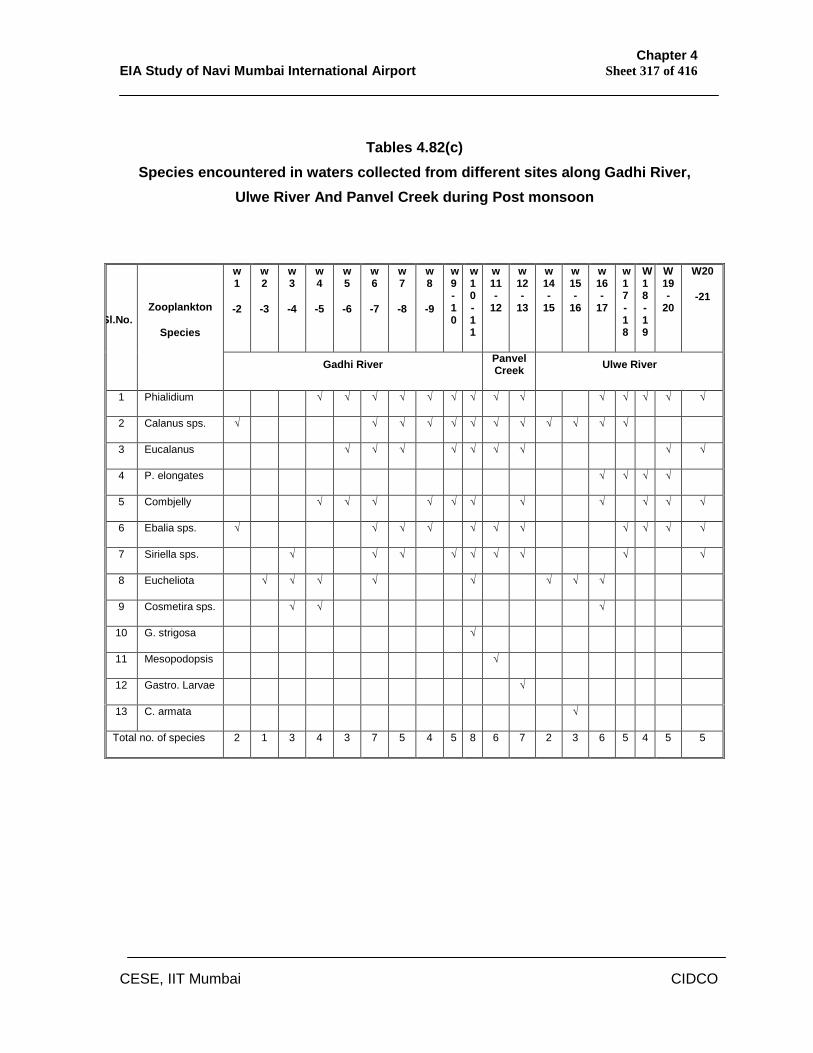
Chapter 4 EIA Study of Navi Mumbai International Airport Sheet 317 of 416
CESE, IIT Mumbai CIDCO
Tables 4.82(c) Species encountered in waters collected from different sites along Gadhi River,
Ulwe River And Panvel Creek during Post monsoon
w1
-2
w2
-3
w3
-4
w4
-5
w5
-6
w6
-7
w7
-8
w8
-9
w9-10
w10-11
w11-
12
w12-
13
w14-
15
w15-
16
w16-
17
w17-18
W18-19
W19-
20
W20
-21
Sl.No. Zooplankton
Species
Gadhi River Panvel Creek Ulwe River
1 Phialidium √ √ √ √ √ √ √ √ √ √ √ √ √ √
2 Calanus sps. √ √ √ √ √ √ √ √ √ √ √ √
3 Eucalanus √ √ √ √ √ √ √ √ √
4 P. elongates √ √ √ √
5 Combjelly √ √ √ √ √ √ √ √ √ √ √
6 Ebalia sps. √ √ √ √ √ √ √ √ √ √ √
7 Siriella sps. √ √ √ √ √ √ √ √ √
8 Eucheliota √ √ √ √ √ √ √ √
9 Cosmetira sps. √ √ √
10 G. strigosa √
11 Mesopodopsis √
12 Gastro. Larvae √
13 C. armata √
Total no. of species 2 1 3 4 3 7 5 4 5 8 6 7 2 3 6 5 4 5 5
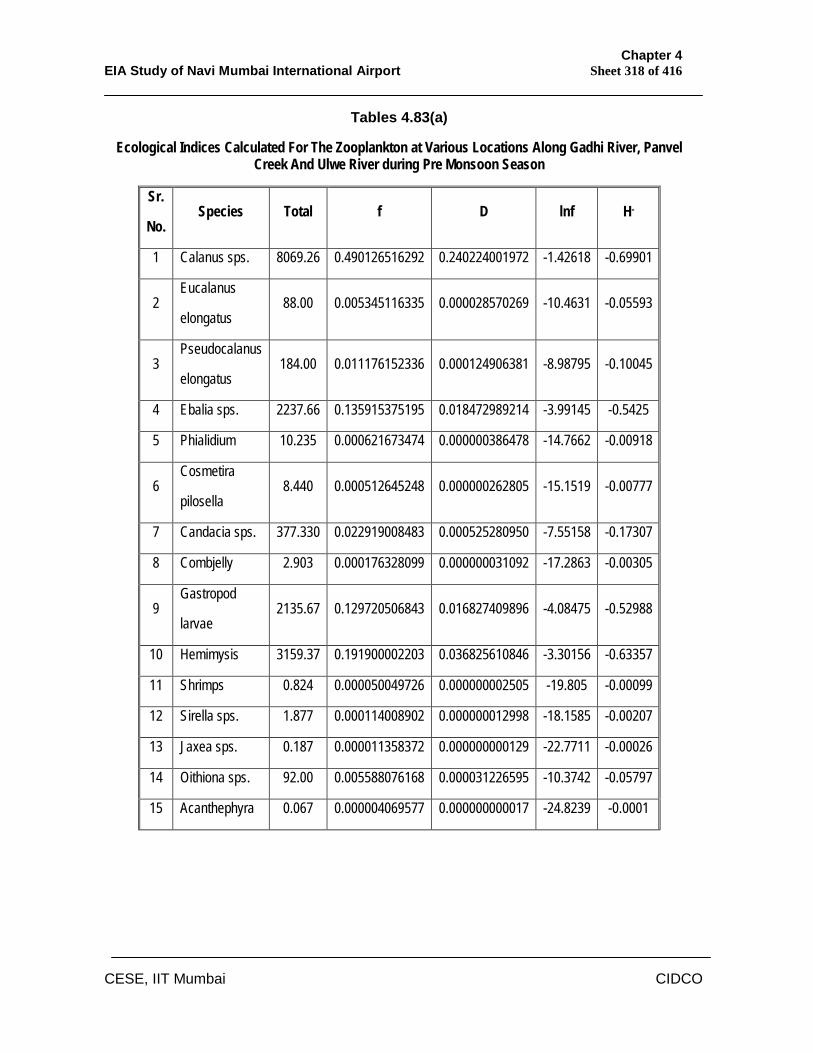
Chapter 4 EIA Study of Navi Mumbai International Airport Sheet 318 of 416
CESE, IIT Mumbai CIDCO
Tables 4.83(a)
Ecological Indices Calculated For The Zooplankton at Various Locations Along Gadhi River, Panvel Creek And Ulwe River during Pre Monsoon Season
Sr.
No. Species Total f D lnf H-
1 Calanus sps. 8069.26 0.490126516292 0.240224001972 -1.42618 -0.69901
2 Eucalanus
elongatus 88.00 0.005345116335 0.000028570269 -10.4631 -0.05593
3 Pseudocalanus
elongatus 184.00 0.011176152336 0.000124906381 -8.98795 -0.10045
4 Ebalia sps. 2237.66 0.135915375195 0.018472989214 -3.99145 -0.5425
5 Phialidium 10.235 0.000621673474 0.000000386478 -14.7662 -0.00918
6 Cosmetira
pilosella 8.440 0.000512645248 0.000000262805 -15.1519 -0.00777
7 Candacia sps. 377.330 0.022919008483 0.000525280950 -7.55158 -0.17307
8 Combjelly 2.903 0.000176328099 0.000000031092 -17.2863 -0.00305
9 Gastropod
larvae 2135.67 0.129720506843 0.016827409896 -4.08475 -0.52988
10 Hemimysis 3159.37 0.191900002203 0.036825610846 -3.30156 -0.63357
11 Shrimps 0.824 0.000050049726 0.000000002505 -19.805 -0.00099
12 Sirella sps. 1.877 0.000114008902 0.000000012998 -18.1585 -0.00207
13 Jaxea sps. 0.187 0.000011358372 0.000000000129 -22.7711 -0.00026
14 Oithiona sps. 92.00 0.005588076168 0.000031226595 -10.3742 -0.05797
15 Acanthephyra 0.067 0.000004069577 0.000000000017 -24.8239 -0.0001
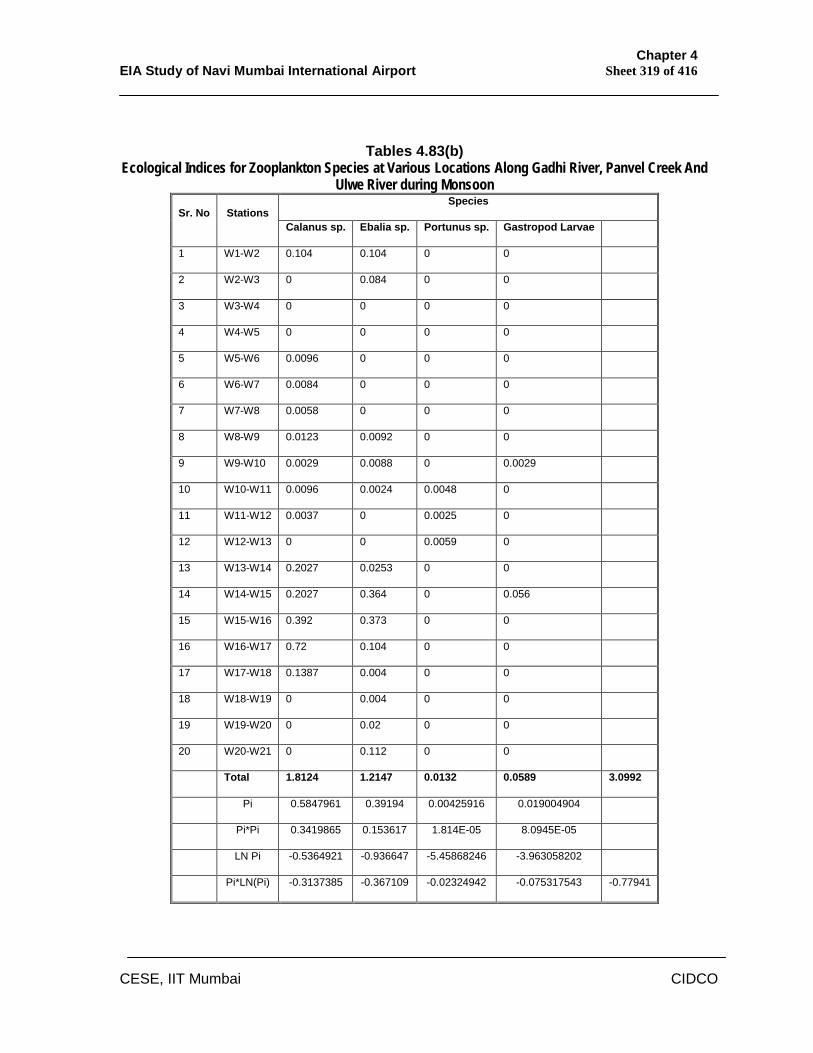
Chapter 4 EIA Study of Navi Mumbai International Airport Sheet 319 of 416
CESE, IIT Mumbai CIDCO
Tables 4.83(b) Ecological Indices for Zooplankton Species at Various Locations Along Gadhi River, Panvel Creek And
Ulwe River during Monsoon Species
Sr. No Stations Calanus sp. Ebalia sp. Portunus sp. Gastropod Larvae
1 W1-W2 0.104 0.104 0 0
2 W2-W3 0 0.084 0 0
3 W3-W4 0 0 0 0
4 W4-W5 0 0 0 0
5 W5-W6 0.0096 0 0 0
6 W6-W7 0.0084 0 0 0
7 W7-W8 0.0058 0 0 0
8 W8-W9 0.0123 0.0092 0 0
9 W9-W10 0.0029 0.0088 0 0.0029
10 W10-W11 0.0096 0.0024 0.0048 0
11 W11-W12 0.0037 0 0.0025 0
12 W12-W13 0 0 0.0059 0
13 W13-W14 0.2027 0.0253 0 0
14 W14-W15 0.2027 0.364 0 0.056
15 W15-W16 0.392 0.373 0 0
16 W16-W17 0.72 0.104 0 0
17 W17-W18 0.1387 0.004 0 0
18 W18-W19 0 0.004 0 0
19 W19-W20 0 0.02 0 0
20 W20-W21 0 0.112 0 0
Total 1.8124 1.2147 0.0132 0.0589 3.0992
Pi 0.5847961 0.39194 0.00425916 0.019004904
Pi*Pi 0.3419865 0.153617 1.814E-05 8.0945E-05
LN Pi -0.5364921 -0.936647 -5.45868246 -3.963058202
Pi*LN(Pi) -0.3137385 -0.367109 -0.02324942 -0.075317543 -0.77941
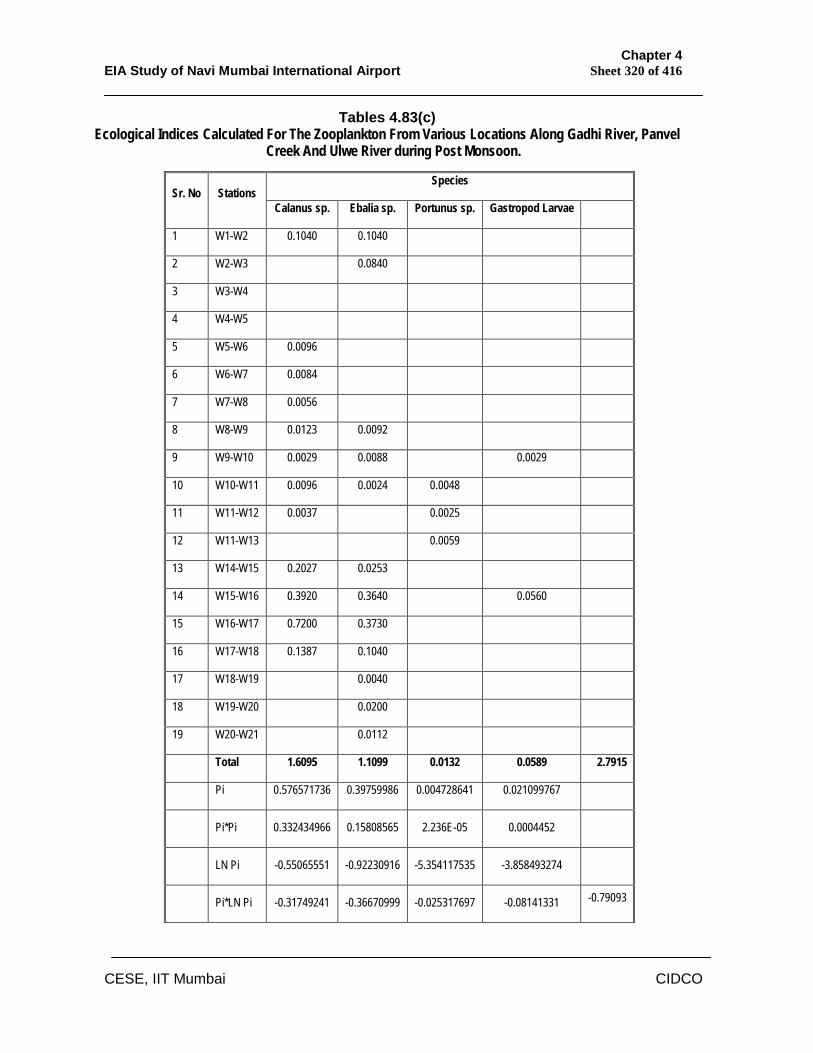
Chapter 4 EIA Study of Navi Mumbai International Airport Sheet 320 of 416
CESE, IIT Mumbai CIDCO
Tables 4.83(c) Ecological Indices Calculated For The Zooplankton From Various Locations Along Gadhi River, Panvel
Creek And Ulwe River during Post Monsoon.
Species Sr. No Stations
Calanus sp. Ebalia sp. Portunus sp. Gastropod Larvae
1 W1-W2 0.1040 0.1040
2 W2-W3 0.0840
3 W3-W4
4 W4-W5
5 W5-W6 0.0096
6 W6-W7 0.0084
7 W7-W8 0.0056
8 W8-W9 0.0123 0.0092
9 W9-W10 0.0029 0.0088 0.0029
10 W10-W11 0.0096 0.0024 0.0048
11 W11-W12 0.0037 0.0025
12 W11-W13 0.0059
13 W14-W15 0.2027 0.0253
14 W15-W16 0.3920 0.3640 0.0560
15 W16-W17 0.7200 0.3730
16 W17-W18 0.1387 0.1040
17 W18-W19 0.0040
18 W19-W20 0.0200
19 W20-W21 0.0112
Total 1.6095 1.1099 0.0132 0.0589 2.7915
Pi 0.576571736 0.39759986 0.004728641 0.021099767
Pi*Pi 0.332434966 0.15808565 2.236E-05 0.0004452
LN Pi -0.55065551 -0.92230916 -5.354117535 -3.858493274
Pi*LN Pi -0.31749241 -0.36670999 -0.025317697 -0.08141331 -0.79093
Chapter 4 EIA Study of Navi Mumbai International Airport Sheet 321 of 416
CESE, IIT Mumbai CIDCO
The dry organic weight of the zooplankton collected from Gadhi River,
Panvel Creek and Ulwe River in different seasons has been presented in
Tables 4.84(a) to 4.84(c). As seen from it, in pre-monsoon, the minimum
standing crop biomass in the form of dry organic weight of zooplankton has
been 0.107 g/m3 of water while the maximum biomass was 15.86 g/m3 of
water. The lowest dry organic weight of zooplankton in monsoon was 0.046
g/m3 and the highest was 1.008 g/m3 of water. In post monsoon, the
minimum dry organic weight of zooplankton was 11.467 g/cu.m while the
maximum was 41.6 g/cu.m. During pre-monsoon the average biomass of
zooplankton from waters of Gadhi River was 5.98 + 4.0 g/m3, that of Panvel
Creek was 9.03 + 6.05 g/m3 while for the waters of Ulwe River it was only
1.59 + 1.47 g/m3. In monsoon, though the standing crop biomass,
expressed as dry organic weight in grams per cubic meter, was 0.17 for
Gadhi River, 0.24 for Panvel Creek and 0.35 for Ulwe River. In post-
monsoon, the dry organic weight of zooplankton from Gadhi River was
23.43 + 5.0 g/ m3, for Panvel Creek it was 31.82 + 8.62 g/ m3 and for Ulwe
River, it was 21.16 + 6.62 g/ m3. The mean standing crop biomass for all
these water bodies taken together was 4.899 + 4.41 g/m3 in pre-monsoon
and 0.245+ 0.233 g/m3 in monsoon and 23.95 + 6.99 g/m3 in post-monsoon
season.
In pre-monsoon the variety of zooplankton was much greater though the dry
organic weight it contributed was relatively low. During monsoon the variety,
density as well as the dry organic weight of zooplankton was the lEast. In
post-monsoon, the variety of organisms in zooplankton was moderate but
the density and dry organic weight was significantly higher. This is probably
due to better availability of mineral nutrients during post-monsoon owing to
land drainage as well as greater turbulence causing retrieval of nutrients
from the sediments (out welling and upwelling) all through monsoon,
showing the effect in post-monsoon.
Tables 4.84(a)
Dry Organic Weight of the Zooplankton Collected From Various Stations along Gadhi River, Panvel Creek and Ulwe River During Pre Monsoon Season
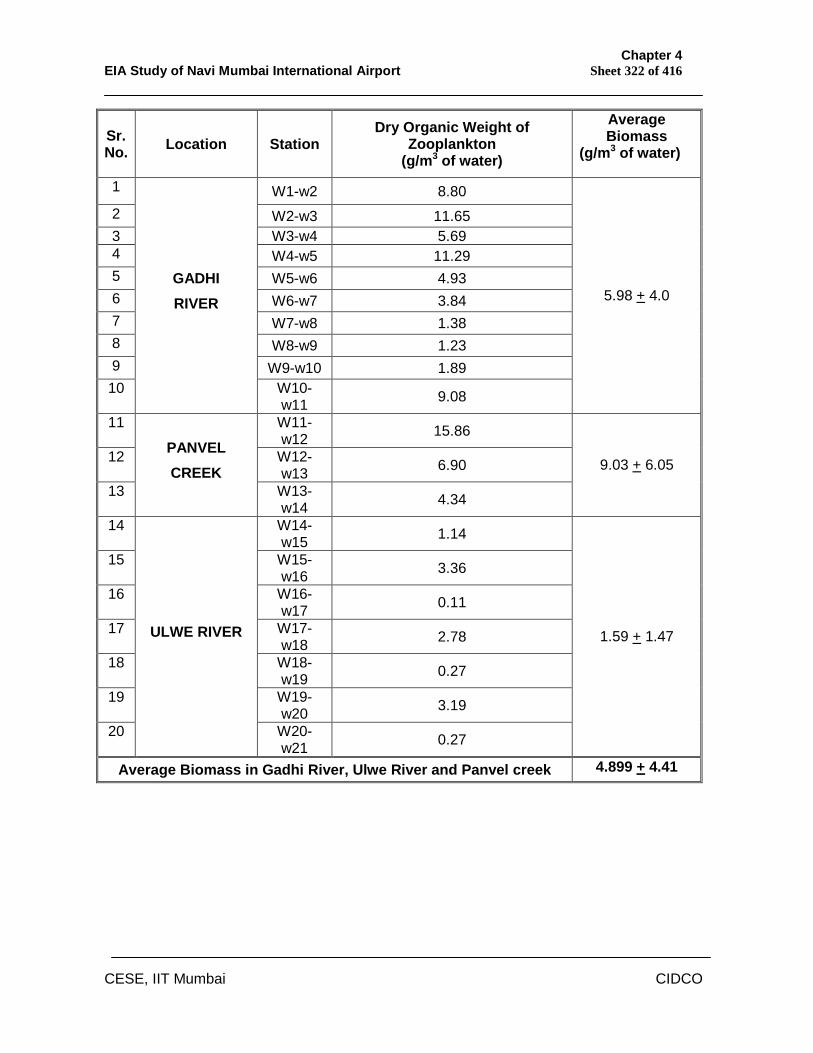
Chapter 4 EIA Study of Navi Mumbai International Airport Sheet 322 of 416
CESE, IIT Mumbai CIDCO
Sr. No. Location Station
Dry Organic Weight of Zooplankton
(g/m3 of water)
Average Biomass
(g/m3 of water)
1 W1-w2 8.80 2 W2-w3 11.65 3 W3-w4 5.69 4 W4-w5 11.29 5 W5-w6 4.93 6 W6-w7 3.84 7 W7-w8 1.38 8 W8-w9 1.23 9 W9-w10 1.89 10
GADHI RIVER
W10-w11 9.08
5.98 + 4.0
11 W11-w12 15.86
12 W12-w13 6.90
13
PANVEL CREEK
W13-w14 4.34
9.03 + 6.05
14 W14-w15 1.14
15 W15-w16 3.36
16 W16-w17 0.11
17 W17-w18 2.78
18 W18-w19 0.27
19 W19-w20 3.19
20
ULWE RIVER
W20-w21 0.27
1.59 + 1.47
Average Biomass in Gadhi River, Ulwe River and Panvel creek 4.899 + 4.41
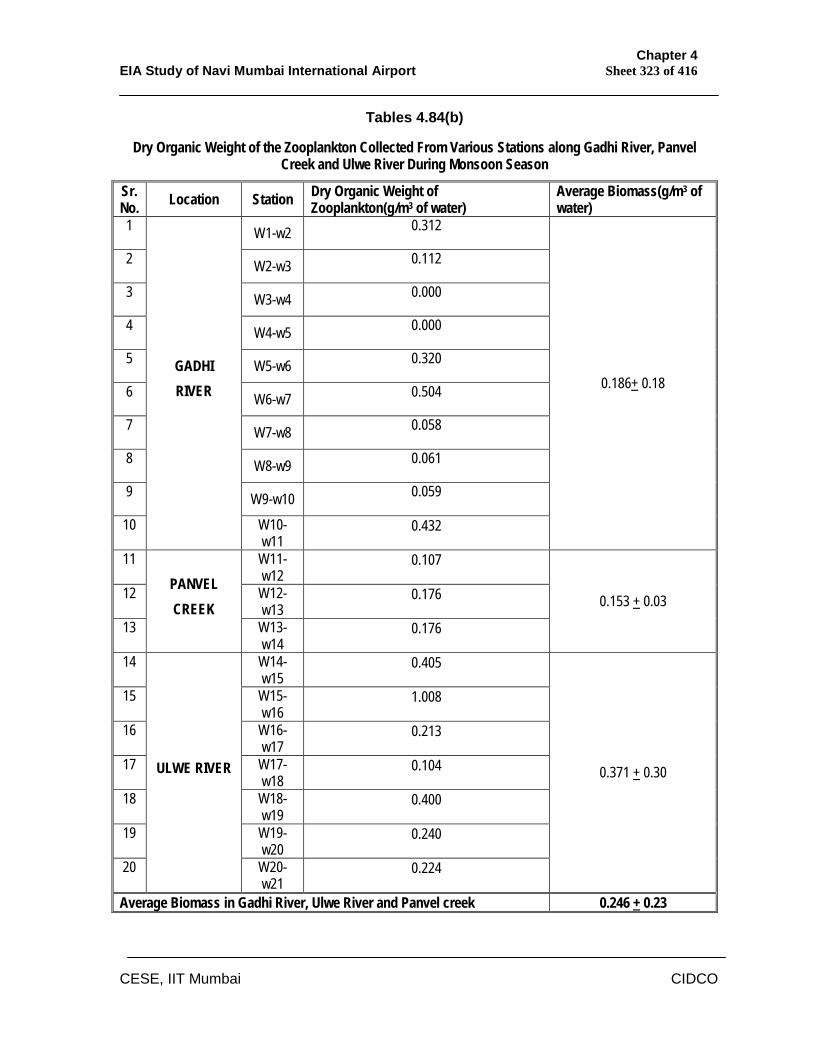
Chapter 4 EIA Study of Navi Mumbai International Airport Sheet 323 of 416
CESE, IIT Mumbai CIDCO
Tables 4.84(b)
Dry Organic Weight of the Zooplankton Collected From Various Stations along Gadhi River, Panvel Creek and Ulwe River During Monsoon Season
Sr. No. Location Station Dry Organic Weight of
Zooplankton(g/m3 of water) Average Biomass(g/m3 of water)
1 W1-w2 0.312
2 W2-w3 0.112
3 W3-w4 0.000
4 W4-w5 0.000
5 W5-w6 0.320
6 W6-w7 0.504
7 W7-w8 0.058
8 W8-w9 0.061
9 W9-w10 0.059
10
GADHI RIVER
W10-w11
0.432
0.186+ 0.18
11 W11-w12
0.107
12 W12-w13
0.176
13
PANVEL CREEK
W13-w14
0.176
0.153 + 0.03
14 W14-w15
0.405
15 W15-w16
1.008
16 W16-w17
0.213
17 W17-w18
0.104
18 W18-w19
0.400
19 W19-w20
0.240
20
ULWE RIVER
W20-w21
0.224
0.371 + 0.30
Average Biomass in Gadhi River, Ulwe River and Panvel creek 0.246 + 0.23
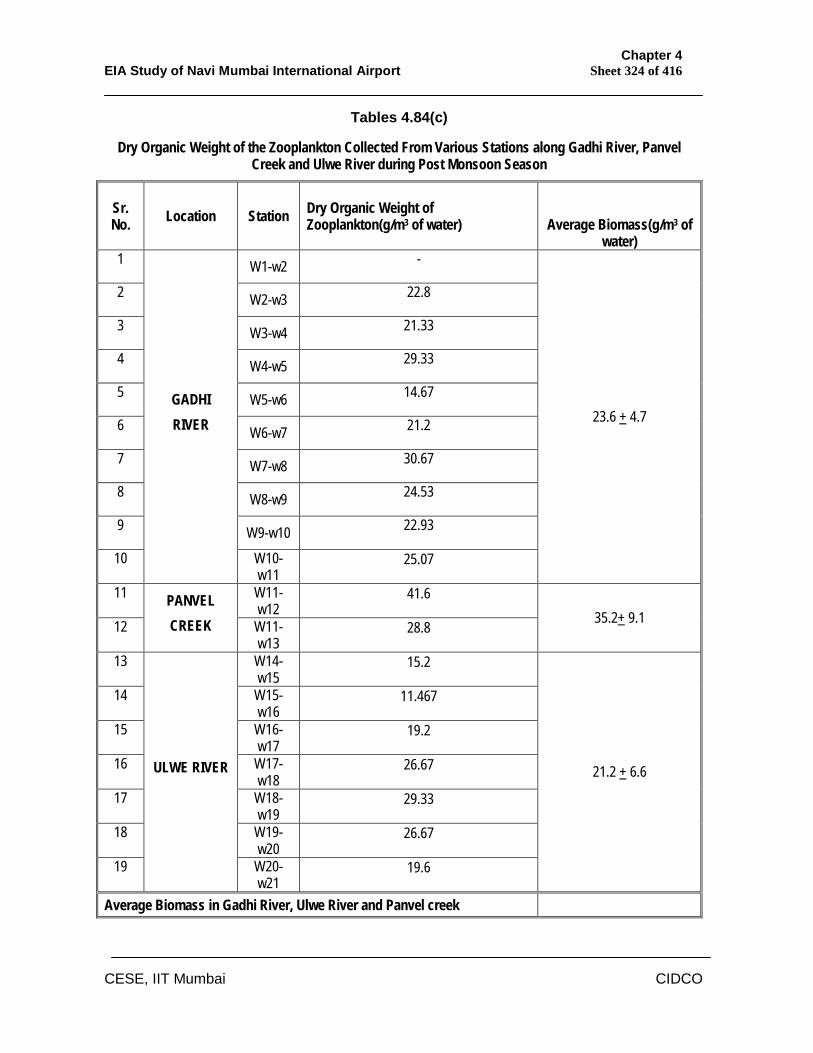
Chapter 4 EIA Study of Navi Mumbai International Airport Sheet 324 of 416
CESE, IIT Mumbai CIDCO
Tables 4.84(c)
Dry Organic Weight of the Zooplankton Collected From Various Stations along Gadhi River, Panvel Creek and Ulwe River during Post Monsoon Season
Sr. No. Location Station Dry Organic Weight of
Zooplankton(g/m3 of water)
Average Biomass(g/m3 of water)
1 W1-w2 -
2 W2-w3 22.8
3 W3-w4 21.33
4 W4-w5 29.33
5 W5-w6 14.67
6 W6-w7 21.2
7 W7-w8 30.67
8 W8-w9 24.53
9 W9-w10 22.93
10
GADHI RIVER
W10-w11
25.07
23.6 + 4.7
11 W11-w12
41.6
12
PANVEL CREEK W11-
w13 28.8 35.2+ 9.1
13 W14-w15
15.2
14 W15-w16
11.467
15 W16-w17
19.2
16 W17-w18
26.67
17 W18-w19
29.33
18 W19-w20
26.67
19
ULWE RIVER
W20-w21
19.6
21.2 + 6.6
Average Biomass in Gadhi River, Ulwe River and Panvel creek
Chapter 4 EIA Study of Navi Mumbai International Airport Sheet 325 of 416
CESE, IIT Mumbai CIDCO
4.13.3 Benthos The sediment samples collected at various locations along Gadhi River, Ulwe River
and Panvel creek were analysed for benthic forms during pre monsoon, monsoon
and post monsoon season and results are given in Tables 4.85(a) to 4.85(c). The
results showed a total of eight varieties of sedimentary organisms, though at a given
station not more than 5 of them were found in the sediments. During monsoon a
total of only 6 species with not more than 3 in the sediments collected from any
given station were encountered. In post-monsoon, there were a total of 12 species
of foraminiferans encountered in the sediments with not more than 5 at a given
station. The minimum number of forms was just one in pre-monsoon but during
monsoon at 5 collection stations either no sediment could be collected or no
organisms were found in the sediments due to greater rate of flow of the water. Even
during post-monsoon, the first two stations along Gadhi River did not yield any
sediment while at 5 stations there was only one benthic foraminiferan species in the
sediments. Sediments from 7 stations had 2 species of foraminiferans while 3
species were found in sediments of 3 stations and 4 species in the sediments of 2
stations. The sediments collected in post-monsoon from Gadhi River showed 0 to 5
forms, from Panvel Creek, 2 forms and from Ulwe River 1 to 3 forms. As was noticed
earlier with phytoplankton and zooplankton, the diversity of benthic organisms was
poorer in Ulwe River, as compared to that of Gadhi River and Panvel Creek in all
seasons. The dredging of sand seems to have affected the diversity of the benthic
forms the most.
The organic matter in the sediments expressed as grams per 100 grams of dry
sediments collected from Gadhi River, Panvel Creek and Ulwe River, in three
seasons is seen in Tables 4.86(a) to 4.86(c). In pre-monsoon season, the
Sediments from Gadhi River had an average of 1.6226 + 0.38 g%. Panvel Creek
had 3.1+ 0.38 g% of organic content while Ulwe River sediments exhibited the
lEast amount of organic matter being 1.314 + 0.905 g%. In monsoon, the
sediments collected from Gadhi River had an average of 5.083 + 0.941 g% Panvel
Creek had an average of 4.54 + 1.787 g% while Ulwe River sediments showed
5.082 + 0.455 g% of the organic material. During post-monsoon, the sediments
from stations along Gadhi River had an average of 3.83 + 1.49 g%, Panvel Creek
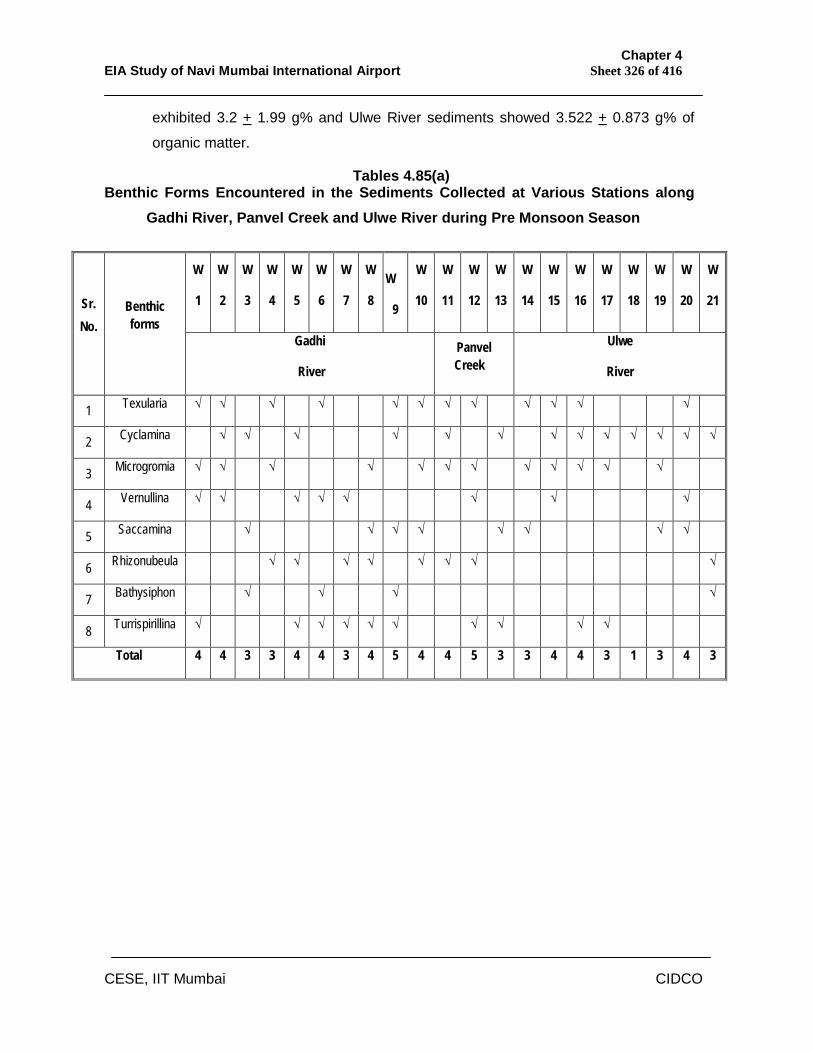
Chapter 4 EIA Study of Navi Mumbai International Airport Sheet 326 of 416
CESE, IIT Mumbai CIDCO
exhibited 3.2 + 1.99 g% and Ulwe River sediments showed 3.522 + 0.873 g% of
organic matter.
Tables 4.85(a) Benthic Forms Encountered in the Sediments Collected at Various Stations along
Gadhi River, Panvel Creek and Ulwe River during Pre Monsoon Season
W
1
W
2
W
3
W
4
W
5
W
6
W
7
W
8
W
9
W
10
W
11
W
12
W
13
W
14
W
15
W
16
W
17
W
18
W
19
W
20
W
21 Sr. No.
Benthic forms
Gadhi
River
Panvel Creek
Ulwe
River
1 Texularia √ √ √ √ √ √ √ √ √ √ √ √
2 Cyclamina √ √ √ √ √ √ √ √ √ √ √ √ √
3 Microgromia √ √ √ √ √ √ √ √ √ √ √ √
4 Vernullina √ √ √ √ √ √ √ √
5 Saccamina √ √ √ √ √ √ √ √
6 Rhizonubeula √ √ √ √ √ √ √ √
7 Bathysiphon √ √ √ √
8 Turrispirillina √ √ √ √ √ √ √ √ √ √
Total 4 4 3 3 4 4 3 4 5 4 4 5 3 3 4 4 3 1 3 4 3
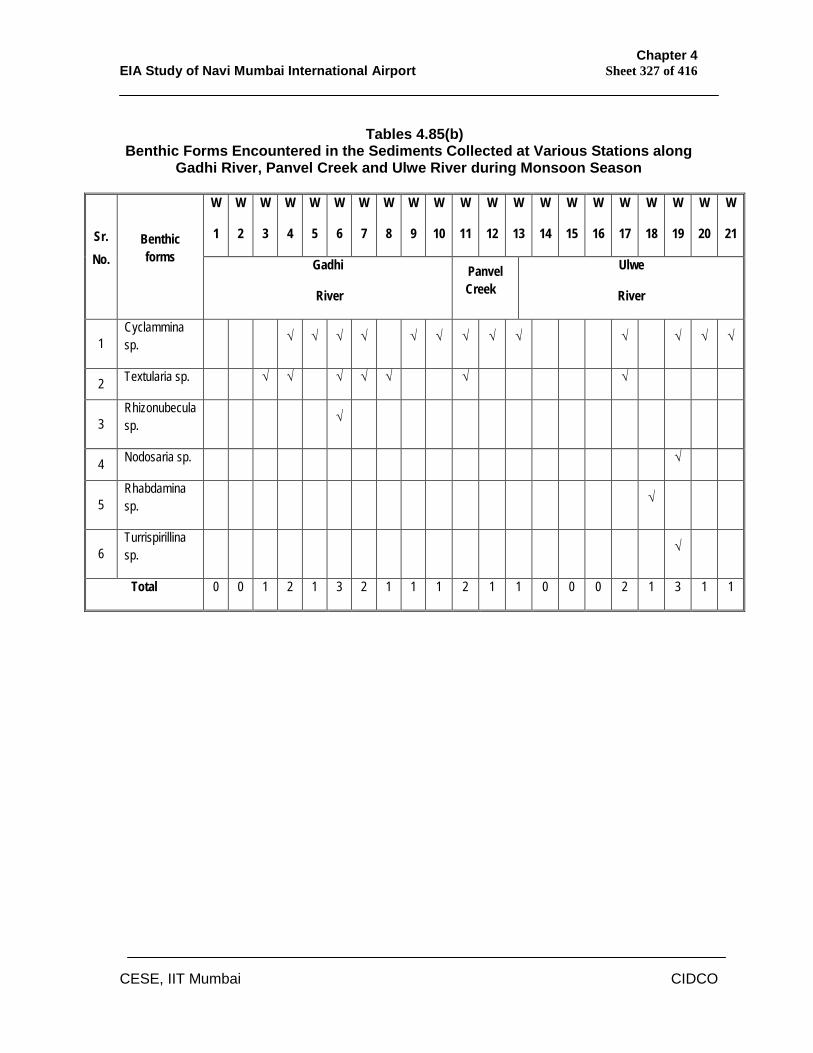
Chapter 4 EIA Study of Navi Mumbai International Airport Sheet 327 of 416
CESE, IIT Mumbai CIDCO
Tables 4.85(b)
Benthic Forms Encountered in the Sediments Collected at Various Stations along Gadhi River, Panvel Creek and Ulwe River during Monsoon Season
W
1
W
2
W
3
W
4
W
5
W
6
W
7
W
8
W
9
W
10
W
11
W
12
W
13
W
14
W
15
W
16
W
17
W
18
W
19
W
20
W
21 Sr. No.
Benthic forms Gadhi
River
Panvel Creek
Ulwe
River
1 Cyclammina sp. √ √ √ √ √ √ √ √ √ √ √ √ √
2 Textularia sp. √ √ √ √ √ √ √
3 Rhizonubecula sp. √
4 Nodosaria sp. √
5 Rhabdamina sp. √
6 Turrispirillina sp. √
Total 0 0 1 2 1 3 2 1 1 1 2 1 1 0 0 0 2 1 3 1 1
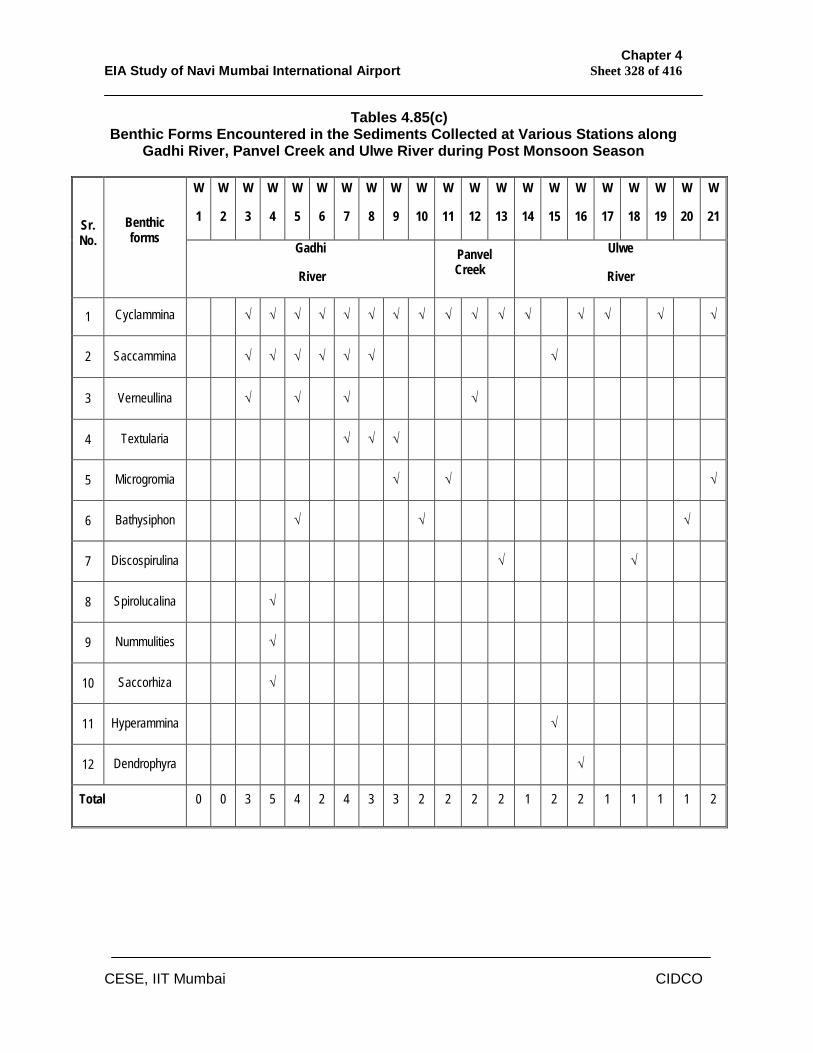
Chapter 4 EIA Study of Navi Mumbai International Airport Sheet 328 of 416
CESE, IIT Mumbai CIDCO
Tables 4.85(c) Benthic Forms Encountered in the Sediments Collected at Various Stations along
Gadhi River, Panvel Creek and Ulwe River during Post Monsoon Season
W
1
W
2
W
3
W
4
W
5
W
6
W
7
W
8
W
9
W
10
W
11
W
12
W
13
W
14
W
15
W
16
W
17
W
18
W
19
W
20
W
21 Sr. No.
Benthic forms
Gadhi
River Panvel Creek
Ulwe
River
1 Cyclammina √ √ √ √ √ √ √ √ √ √ √ √ √ √ √ √
2 Saccammina √ √ √ √ √ √ √
3 Verneullina √ √ √ √
4 Textularia √ √ √
5 Microgromia √ √ √
6 Bathysiphon √ √ √
7 Discospirulina √ √
8 Spirolucalina √
9 Nummulities √
10 Saccorhiza √
11 Hyperammina √
12 Dendrophyra √
Total 0 0 3 5 4 2 4 3 3 2 2 2 2 1 2 2 1 1 1 1 2
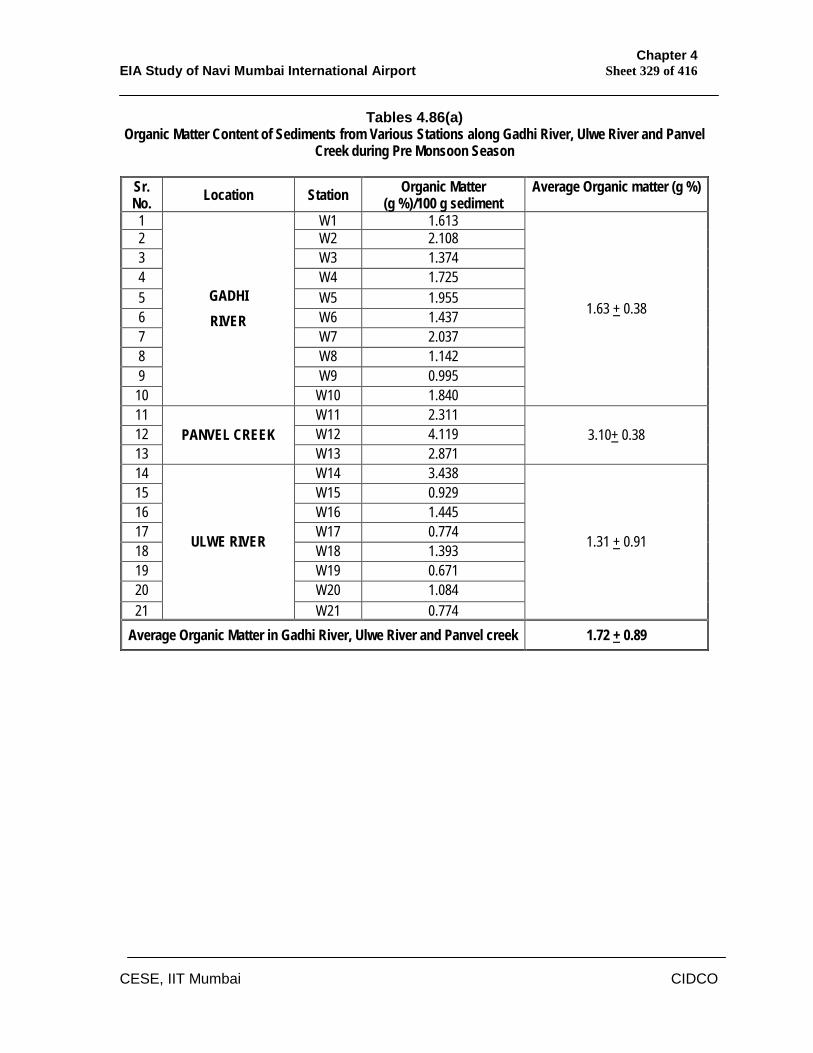
Chapter 4 EIA Study of Navi Mumbai International Airport Sheet 329 of 416
CESE, IIT Mumbai CIDCO
Tables 4.86(a) Organic Matter Content of Sediments from Various Stations along Gadhi River, Ulwe River and Panvel
Creek during Pre Monsoon Season
Sr. No. Location Station Organic Matter
(g %)/100 g sediment Average Organic matter (g %)
1 W1 1.613 2 W2 2.108 3 W3 1.374 4 W4 1.725 5 W5 1.955 6 W6 1.437 7 W7 2.037 8 W8 1.142 9 W9 0.995
10
GADHI RIVER
W10 1.840
1.63 + 0.38
11 W11 2.311 12 W12 4.119 13
PANVEL CREEK W13 2.871
3.10+ 0.38
14 W14 3.438 15 W15 0.929 16 W16 1.445 17 W17 0.774 18 W18 1.393 19 W19 0.671 20 W20 1.084 21
ULWE RIVER
W21 0.774
1.31 + 0.91
Average Organic Matter in Gadhi River, Ulwe River and Panvel creek 1.72 + 0.89
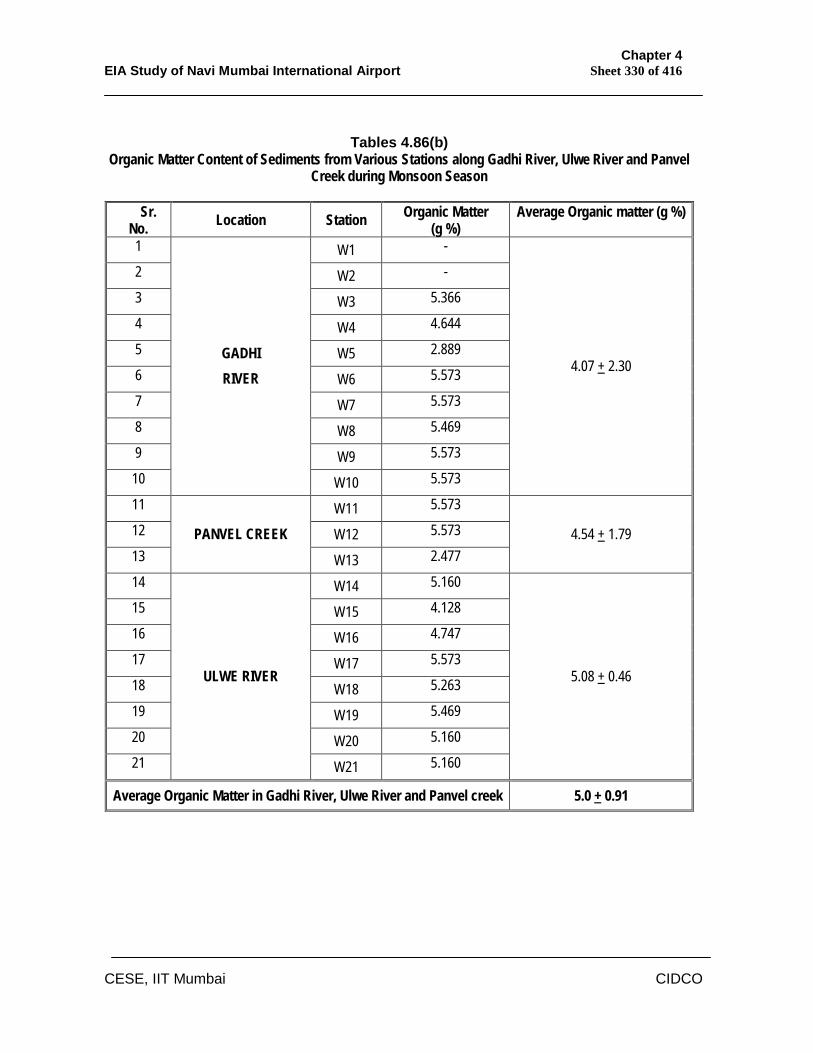
Chapter 4 EIA Study of Navi Mumbai International Airport Sheet 330 of 416
CESE, IIT Mumbai CIDCO
Tables 4.86(b)
Organic Matter Content of Sediments from Various Stations along Gadhi River, Ulwe River and Panvel Creek during Monsoon Season
Sr.
No. Location Station Organic Matter (g %)
Average Organic matter (g %)
1 W1 -
2 W2 -
3 W3 5.366
4 W4 4.644
5 W5 2.889
6 W6 5.573
7 W7 5.573
8 W8 5.469
9 W9 5.573
10
GADHI RIVER
W10 5.573
4.07 + 2.30
11 W11 5.573
12 W12 5.573
13 PANVEL CREEK
W13 2.477 4.54 + 1.79
14 W14 5.160
15 W15 4.128
16 W16 4.747
17 W17 5.573
18 W18 5.263
19 W19 5.469
20 W20 5.160
21
ULWE RIVER
W21 5.160
5.08 + 0.46
Average Organic Matter in Gadhi River, Ulwe River and Panvel creek 5.0 + 0.91
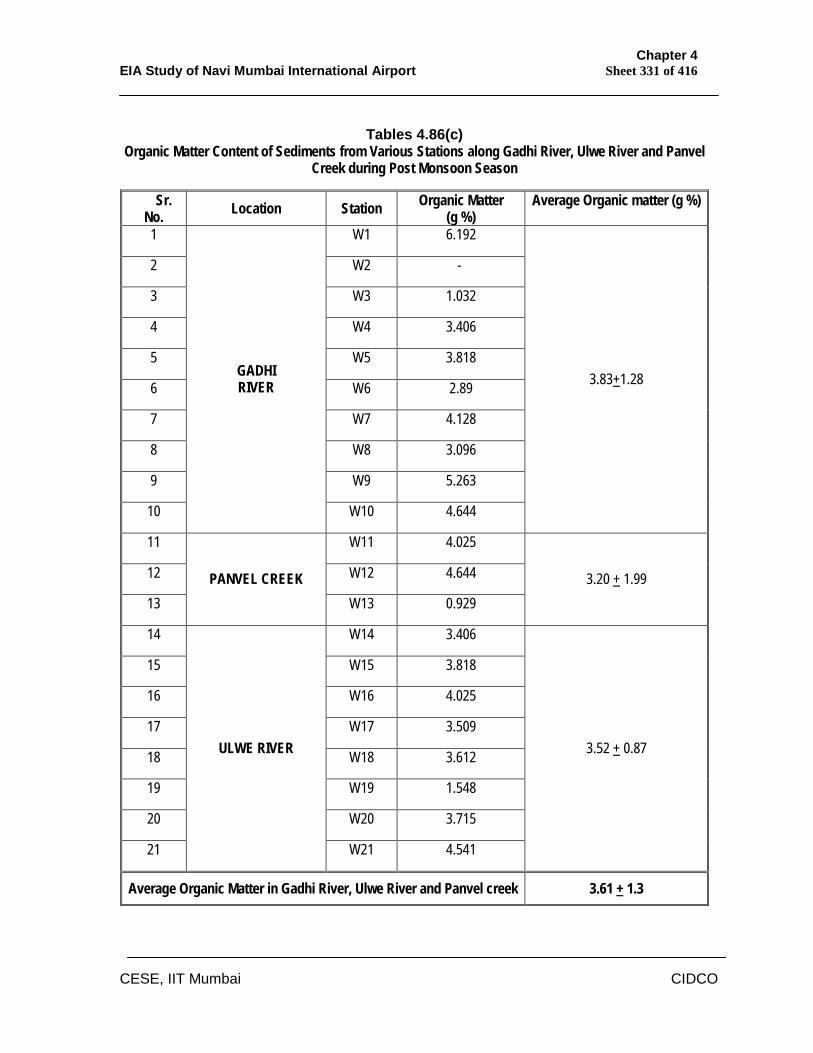
Chapter 4 EIA Study of Navi Mumbai International Airport Sheet 331 of 416
CESE, IIT Mumbai CIDCO
Tables 4.86(c)
Organic Matter Content of Sediments from Various Stations along Gadhi River, Ulwe River and Panvel Creek during Post Monsoon Season
Sr. No. Location Station Organic Matter
(g %) Average Organic matter (g %)
1 W1 6.192
2 W2 -
3 W3 1.032
4 W4 3.406
5 W5 3.818
6 W6 2.89
7 W7 4.128
8 W8 3.096
9 W9 5.263
10
GADHI RIVER
W10 4.644
3.83+1.28
11 W11 4.025
12 W12 4.644
13 PANVEL CREEK
W13 0.929 3.20 + 1.99
14 W14 3.406
15 W15 3.818
16 W16 4.025
17 W17 3.509
18 W18 3.612
19 W19 1.548
20 W20 3.715
21
ULWE RIVER
W21 4.541
3.52 + 0.87
Average Organic Matter in Gadhi River, Ulwe River and Panvel creek 3.61 + 1.3
Chapter 4 EIA Study of Navi Mumbai International Airport Sheet 332 of 416
CESE, IIT Mumbai CIDCO
The average organic contents of all these habitats in pre-monsoon,
monsoon and post monsoon seasons have been 1.716 + 0.89 g%, 5.02 +
0.91 g%, and 3.61 + 1.3 g% respectively. The land drainage has been, in all
probabilities, has been bringing in the organic matter, which enriches the
sediment in organic matter during monsoon and the low temperature during
post-monsoon must not be able to oxidise this organic material though in
pre-monsoon that follows, has significantly higher temperature so that the
organic contents of the sediment is lEast in this season.
4.13.4 Water Quality Status of Major aquatic Habitat in the Project Area
The physico-chemical characteristics of the water of Gadhi River, Ulwe
River and Panvel creek are given in the Tables 4.87 (a) to 4.87 (e). The
results indicate that the pH of water of Gadhi River, Ulwe River and Panvel
creek was in the range 7.4-7.8, 7.8, 7.8-8.0 respectively during pre monsoon
season. The observed pH values are favorable to maintain a healthy aquatic
community. The total suspended solids were ranged similar in all the water
bodies except at W10 location in the Gadhi River, this could be due to
mixing of waste water at this location. The total dissolved solids of water of
Gadhi River, Ulwe River and Panvel creek was in the range 34800- 41410,
39760, 40240- 428 respectively during study period. The total dissolved
solids are maximum in the waters of Panvel creek. The salinity was more in
Panvel creek and Ulwe River. Salinity in Ulwe River is more due to less
dilution of tidal water with fresh water during pre monsoon season. The oil
and grease contents were in the range 5-17 ppm, 10 ppm, 9-16 ppm in the
waters of Gadhi River, Ulwe River and Panvel creek respectively.
The nutrient contents like nitrite and nitrate nitrogen, phosphate phosphorus
and silicates are also more in Panvel Creek and lEast in the waters of Ulwe
River. The dissolved oxygen in Panvel Creek has also been more than in
the Rivers, probably due to the better mixing with seawater. The DO level
and nutrient in Panvel creek supported the zooplankton growth. The value of
BOD of marine water in the Gadhi River and Panvel creek was in the range
of 0.8-21.6 mg/L and 2.4-2.8 mg/L respectively and in the Ulwe River it was
1.2 mg/L during the study period. BOD values were slightly high in the
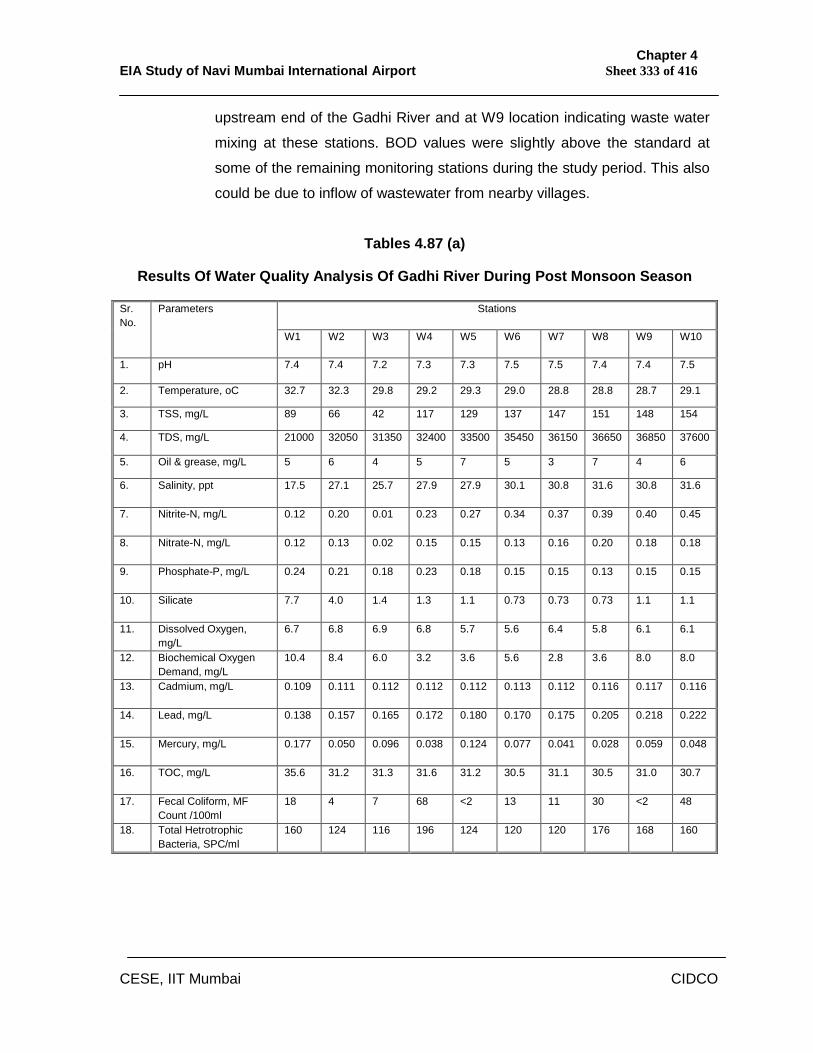
Chapter 4 EIA Study of Navi Mumbai International Airport Sheet 333 of 416
CESE, IIT Mumbai CIDCO
upstream end of the Gadhi River and at W9 location indicating waste water
mixing at these stations. BOD values were slightly above the standard at
some of the remaining monitoring stations during the study period. This also
could be due to inflow of wastewater from nearby villages.
Tables 4.87 (a)
Results Of Water Quality Analysis Of Gadhi River During Post Monsoon Season
Stations Sr. No.
Parameters
W1 W2 W3 W4 W5 W6 W7 W8 W9 W10
1. pH 7.4 7.4 7.2 7.3 7.3 7.5 7.5 7.4 7.4 7.5
2. Temperature, oC 32.7 32.3 29.8 29.2 29.3 29.0 28.8 28.8 28.7 29.1
3. TSS, mg/L 89 66 42 117 129 137 147 151 148 154
4. TDS, mg/L 21000 32050 31350 32400 33500 35450 36150 36650 36850 37600
5. Oil & grease, mg/L 5 6 4 5 7 5 3 7 4 6
6. Salinity, ppt 17.5 27.1 25.7 27.9 27.9 30.1 30.8 31.6 30.8 31.6
7. Nitrite-N, mg/L 0.12 0.20 0.01 0.23 0.27 0.34 0.37 0.39 0.40 0.45
8. Nitrate-N, mg/L 0.12 0.13 0.02 0.15 0.15 0.13 0.16 0.20 0.18 0.18
9. Phosphate-P, mg/L 0.24 0.21 0.18 0.23 0.18 0.15 0.15 0.13 0.15 0.15
10. Silicate 7.7 4.0 1.4 1.3 1.1 0.73 0.73 0.73 1.1 1.1
11. Dissolved Oxygen, mg/L
6.7 6.8 6.9 6.8 5.7 5.6 6.4 5.8 6.1 6.1
12. Biochemical Oxygen Demand, mg/L
10.4 8.4 6.0 3.2 3.6 5.6 2.8 3.6 8.0 8.0
13. Cadmium, mg/L 0.109 0.111 0.112 0.112 0.112 0.113 0.112 0.116 0.117 0.116
14. Lead, mg/L 0.138 0.157 0.165 0.172 0.180 0.170 0.175 0.205 0.218 0.222
15. Mercury, mg/L 0.177 0.050 0.096 0.038 0.124 0.077 0.041 0.028 0.059 0.048
16. TOC, mg/L 35.6 31.2 31.3 31.6 31.2 30.5 31.1 30.5 31.0 30.7
17. Fecal Coliform, MF Count /100ml
18 4 7 68 <2 13 11 30 <2 48
18. Total Hetrotrophic Bacteria, SPC/ml
160 124 116 196 124 120 120 176 168 160
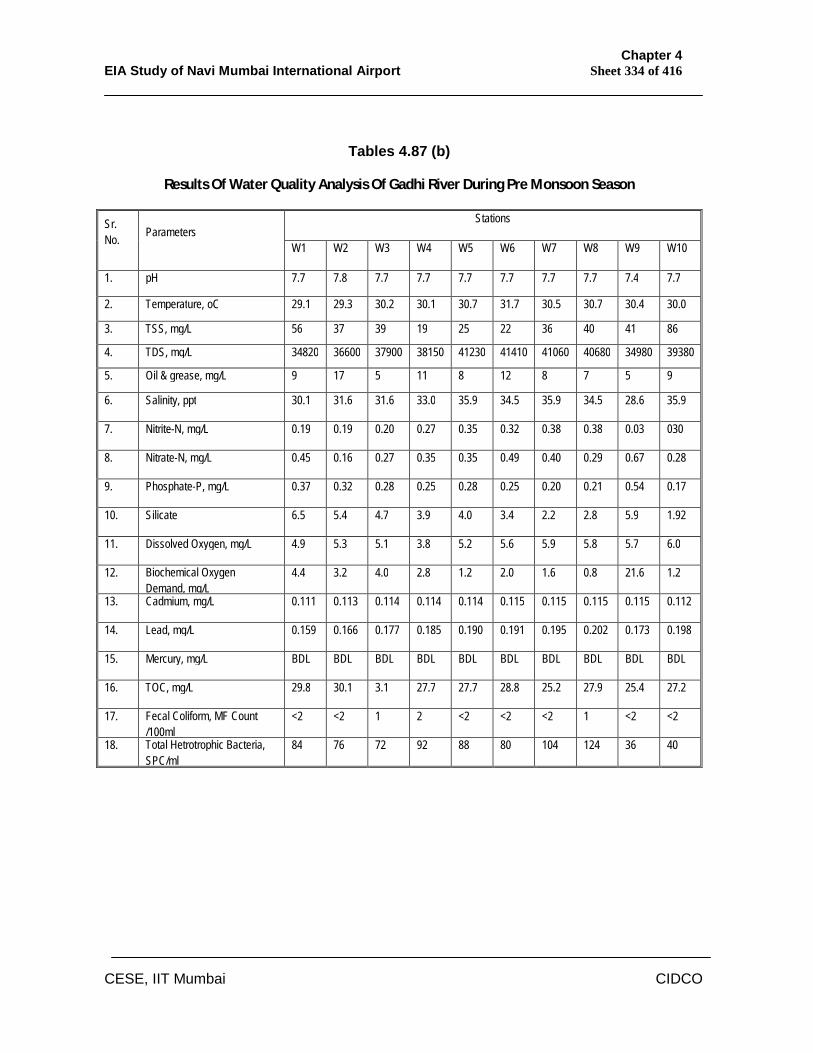
Chapter 4 EIA Study of Navi Mumbai International Airport Sheet 334 of 416
CESE, IIT Mumbai CIDCO
Tables 4.87 (b)
Results Of Water Quality Analysis Of Gadhi River During Pre Monsoon Season
Stations Sr. No. Parameters
W1 W2 W3 W4 W5 W6 W7 W8 W9 W10
1. pH 7.7 7.8 7.7 7.7 7.7 7.7 7.7 7.7 7.4 7.7
2. Temperature, oC 29.1 29.3 30.2 30.1 30.7 31.7 30.5 30.7 30.4 30.0
3. TSS, mg/L 56 37 39 19 25 22 36 40 41 86
4. TDS, mg/L 34820 36600 37900 38150 41230 41410 41060 40680 34980 39380
5. Oil & grease, mg/L 9 17 5 11 8 12 8 7 5 9
6. Salinity, ppt 30.1 31.6 31.6 33.0 35.9 34.5 35.9 34.5 28.6 35.9
7. Nitrite-N, mg/L 0.19 0.19 0.20 0.27 0.35 0.32 0.38 0.38 0.03 030
8. Nitrate-N, mg/L 0.45 0.16 0.27 0.35 0.35 0.49 0.40 0.29 0.67 0.28
9. Phosphate-P, mg/L 0.37 0.32 0.28 0.25 0.28 0.25 0.20 0.21 0.54 0.17
10. Silicate 6.5 5.4 4.7 3.9 4.0 3.4 2.2 2.8 5.9 1.92
11. Dissolved Oxygen, mg/L 4.9 5.3 5.1 3.8 5.2 5.6 5.9 5.8 5.7 6.0
12. Biochemical Oxygen Demand, mg/L
4.4 3.2 4.0 2.8 1.2 2.0 1.6 0.8 21.6 1.2
13. Cadmium, mg/L 0.111 0.113 0.114 0.114 0.114 0.115 0.115 0.115 0.115 0.112
14. Lead, mg/L 0.159 0.166 0.177 0.185 0.190 0.191 0.195 0.202 0.173 0.198
15. Mercury, mg/L BDL BDL BDL BDL BDL BDL BDL BDL BDL BDL
16. TOC, mg/L 29.8 30.1 3.1 27.7 27.7 28.8 25.2 27.9 25.4 27.2
17. Fecal Coliform, MF Count /100ml
<2 <2 1 2 <2 <2 <2 1 <2 <2
18. Total Hetrotrophic Bacteria, SPC/ml
84 76 72 92 88 80 104 124 36 40
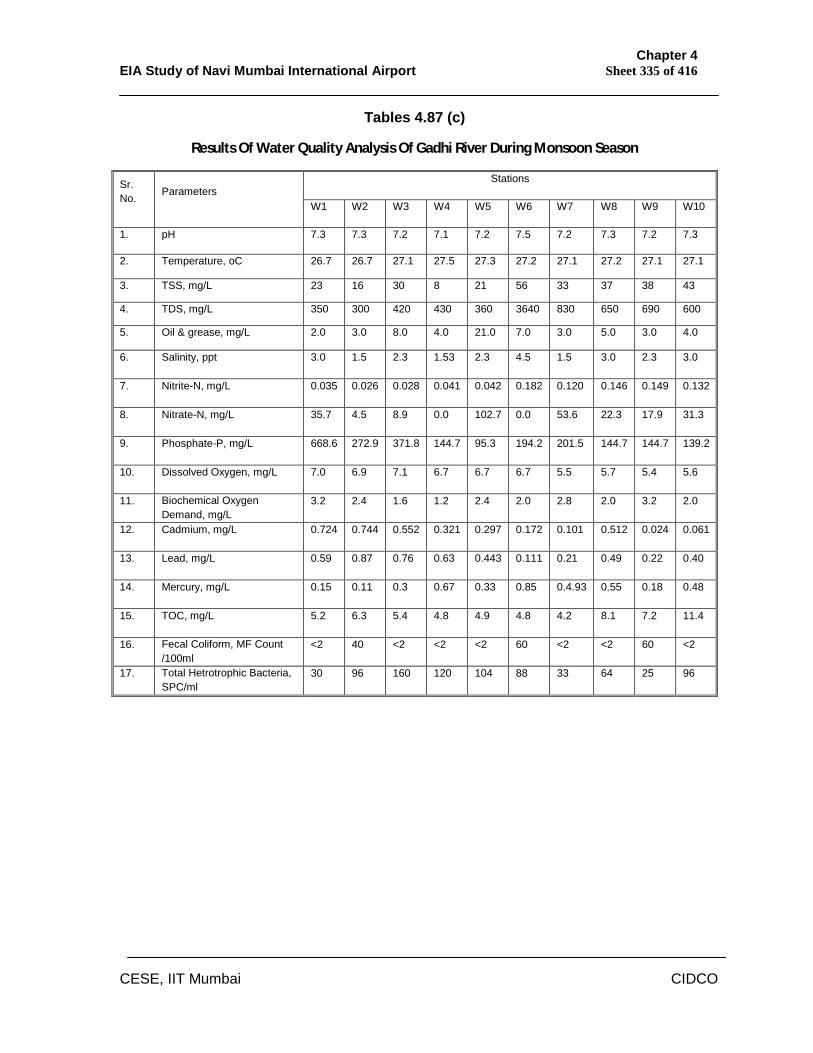
Chapter 4 EIA Study of Navi Mumbai International Airport Sheet 335 of 416
CESE, IIT Mumbai CIDCO
Tables 4.87 (c)
Results Of Water Quality Analysis Of Gadhi River During Monsoon Season
Stations Sr. No. Parameters
W1 W2 W3 W4 W5 W6 W7 W8 W9 W10
1. pH 7.3 7.3 7.2 7.1 7.2 7.5 7.2 7.3 7.2 7.3
2. Temperature, oC 26.7 26.7 27.1 27.5 27.3 27.2 27.1 27.2 27.1 27.1
3. TSS, mg/L 23 16 30 8 21 56 33 37 38 43
4. TDS, mg/L 350 300 420 430 360 3640 830 650 690 600
5. Oil & grease, mg/L 2.0 3.0 8.0 4.0 21.0 7.0 3.0 5.0 3.0 4.0
6. Salinity, ppt 3.0 1.5 2.3 1.53 2.3 4.5 1.5 3.0 2.3 3.0
7. Nitrite-N, mg/L 0.035 0.026 0.028 0.041 0.042 0.182 0.120 0.146 0.149 0.132
8. Nitrate-N, mg/L 35.7 4.5 8.9 0.0 102.7 0.0 53.6 22.3 17.9 31.3
9. Phosphate-P, mg/L 668.6 272.9 371.8 144.7 95.3 194.2 201.5 144.7 144.7 139.2
10. Dissolved Oxygen, mg/L 7.0 6.9 7.1 6.7 6.7 6.7 5.5 5.7 5.4 5.6
11. Biochemical Oxygen Demand, mg/L
3.2 2.4 1.6 1.2 2.4 2.0 2.8 2.0 3.2 2.0
12. Cadmium, mg/L 0.724 0.744 0.552 0.321 0.297 0.172 0.101 0.512 0.024 0.061
13. Lead, mg/L 0.59 0.87 0.76 0.63 0.443 0.111 0.21 0.49 0.22 0.40
14. Mercury, mg/L 0.15 0.11 0.3 0.67 0.33 0.85 0.4.93 0.55 0.18 0.48
15. TOC, mg/L 5.2 6.3 5.4 4.8 4.9 4.8 4.2 8.1 7.2 11.4
16. Fecal Coliform, MF Count /100ml
<2 40 <2 <2 <2 60 <2 <2 60 <2
17. Total Hetrotrophic Bacteria, SPC/ml
30 96 160 120 104 88 33 64 25 96
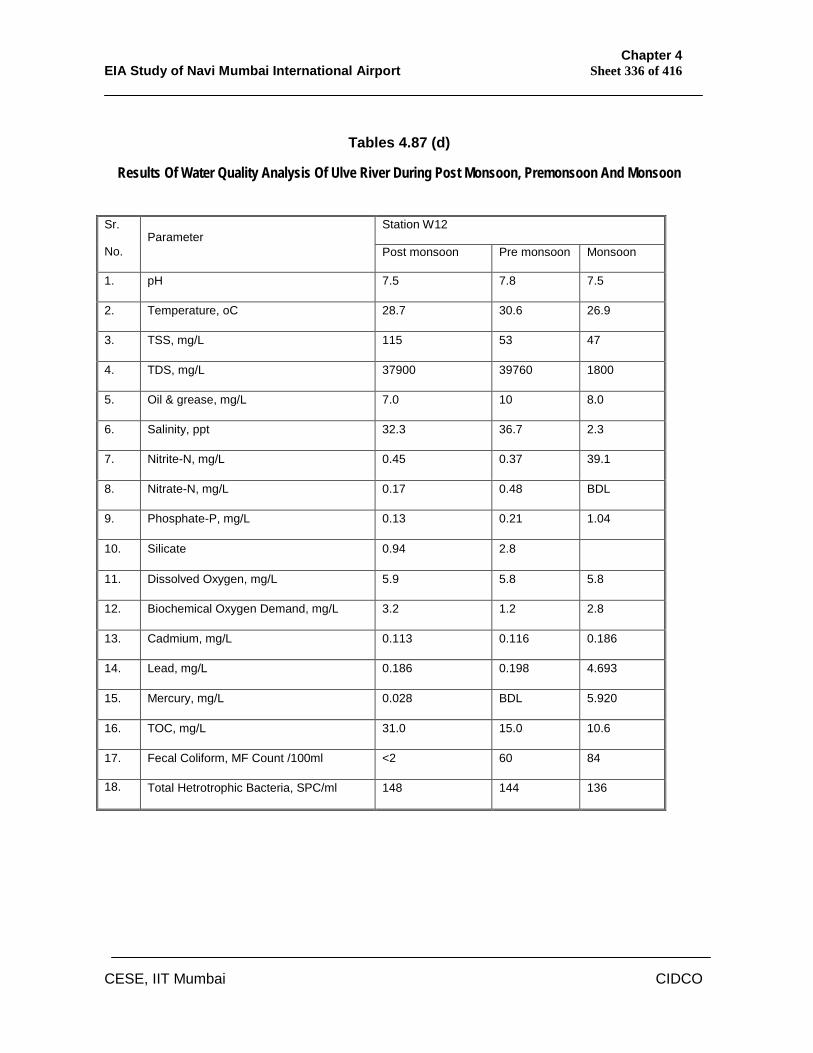
Chapter 4 EIA Study of Navi Mumbai International Airport Sheet 336 of 416
CESE, IIT Mumbai CIDCO
Tables 4.87 (d)
Results Of Water Quality Analysis Of Ulve River During Post Monsoon, Premonsoon And Monsoon
Station W12 Sr.
No. Parameter
Post monsoon Pre monsoon Monsoon
1. pH 7.5 7.8 7.5
2. Temperature, oC 28.7 30.6 26.9
3. TSS, mg/L 115 53 47
4. TDS, mg/L 37900 39760 1800
5. Oil & grease, mg/L 7.0 10 8.0
6. Salinity, ppt 32.3 36.7 2.3
7. Nitrite-N, mg/L 0.45 0.37 39.1
8. Nitrate-N, mg/L 0.17 0.48 BDL
9. Phosphate-P, mg/L 0.13 0.21 1.04
10. Silicate 0.94 2.8
11. Dissolved Oxygen, mg/L 5.9 5.8 5.8
12. Biochemical Oxygen Demand, mg/L 3.2 1.2 2.8
13. Cadmium, mg/L 0.113 0.116 0.186
14. Lead, mg/L 0.186 0.198 4.693
15. Mercury, mg/L 0.028 BDL 5.920
16. TOC, mg/L 31.0 15.0 10.6
17. Fecal Coliform, MF Count /100ml <2 60 84
18.
Total Hetrotrophic Bacteria, SPC/ml 148 144 136
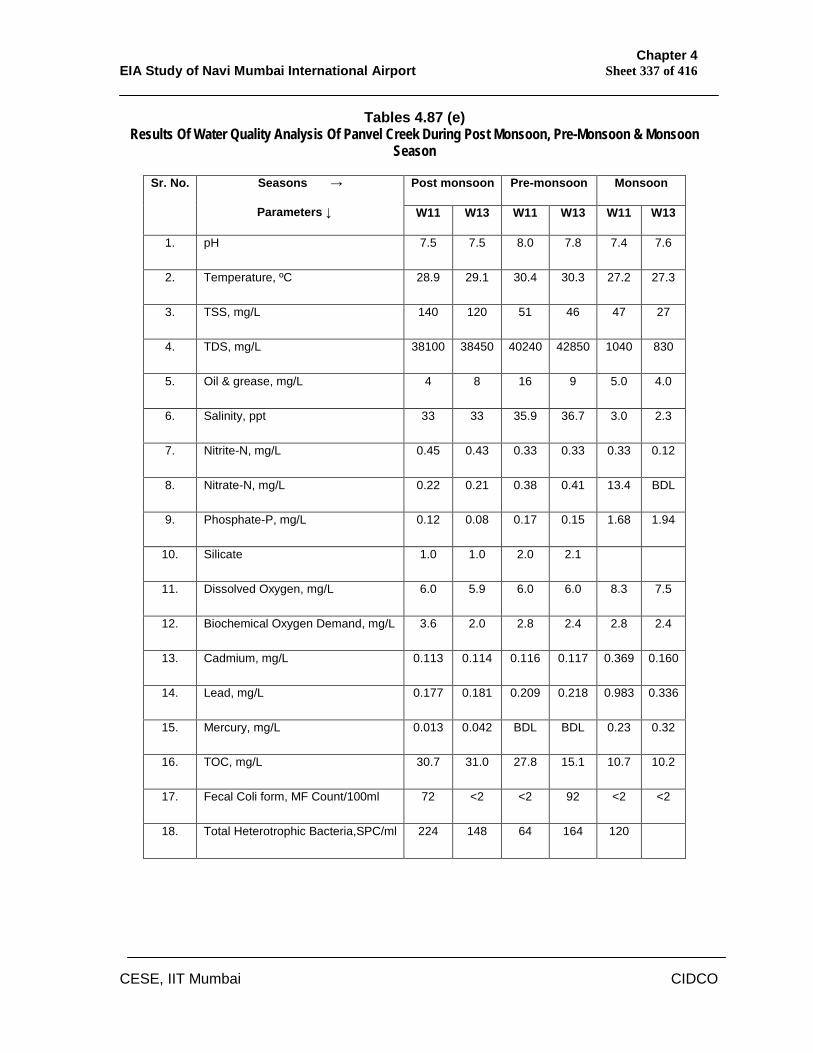
Chapter 4 EIA Study of Navi Mumbai International Airport Sheet 337 of 416
CESE, IIT Mumbai CIDCO
Tables 4.87 (e) Results Of Water Quality Analysis Of Panvel Creek During Post Monsoon, Pre-Monsoon & Monsoon
Season
Post monsoon Pre-monsoon Monsoon Sr. No. Seasons →
Parameters ↓ W11 W13 W11 W13 W11 W13
1. pH 7.5 7.5 8.0 7.8 7.4 7.6
2. Temperature, ºC 28.9 29.1 30.4 30.3 27.2 27.3
3. TSS, mg/L 140 120 51 46 47 27
4. TDS, mg/L 38100 38450 40240 42850 1040 830
5. Oil & grease, mg/L 4 8 16 9 5.0 4.0
6. Salinity, ppt 33 33 35.9 36.7 3.0 2.3
7. Nitrite-N, mg/L 0.45 0.43 0.33 0.33 0.33 0.12
8. Nitrate-N, mg/L 0.22 0.21 0.38 0.41 13.4 BDL
9. Phosphate-P, mg/L 0.12 0.08 0.17 0.15 1.68 1.94
10. Silicate 1.0 1.0 2.0 2.1
11. Dissolved Oxygen, mg/L 6.0 5.9 6.0 6.0 8.3 7.5
12. Biochemical Oxygen Demand, mg/L 3.6 2.0 2.8 2.4 2.8 2.4
13. Cadmium, mg/L 0.113 0.114 0.116 0.117 0.369 0.160
14. Lead, mg/L 0.177 0.181 0.209 0.218 0.983 0.336
15. Mercury, mg/L 0.013 0.042 BDL BDL 0.23 0.32
16. TOC, mg/L 30.7 31.0 27.8 15.1 10.7 10.2
17. Fecal Coli form, MF Count/100ml 72 <2 <2 92 <2 <2
18. Total Heterotrophic Bacteria,SPC/ml 224 148 64 164 120
Chapter 4 EIA Study of Navi Mumbai International Airport Sheet 338 of 416
CESE, IIT Mumbai CIDCO
The TOC concentration of marine water in the Gadhi River and Panvel
creek was in the range of 3.1-30.1mg/L and 15.1-27.8 mg/L respectively and
in the Ulwe River it was 15.0 mg/L during the study period. The TOC content
in water of the Gadhi River is high, sources of TOC in the marine water body
can also be decaying of natural organic matter as well as wastewater
containing detergents, pesticides, herbicides etc.
The heavy metal pollutants in the River as well as creek waters has been
quite in the safer range not large enough to adversely affect the life. The
total heterotrophic bacterial count was, however high in the water of Panvel
Creek as compared to the waters of Gadhi River, though the count was
intermediate in the waters of Ulwe River. The fecal coliform count per 100
ml of water has, however been quite high in the water of Panvel Creek
indicating sewage pollution though in both Rivers the count is very low.
The value of fecal coliform in the Gadhi River and Panvel creek was in the
range of 1- 2 MF Count /100ml and 92 MF Count /100ml respectively and in
the Ulwe River it was 60 MF Count /100ml during the study period. The
presence of fecal coliform in Ulwe River and Panvel creek indicate
contamination of marine water with sanitary waste or fecal matter.
4.14 Traffic & Transportation Study
4.14.1 Land Side Access
The proposed airport site is located at latitude 18o 59’ 33” North and
longitude 73o 04' 18” The catchment area of the proposed airport covers a
large part of Mumbai Metropolitan Region, which includes Kalyan,
Dombivali, Ulhasnagar, Khopoli, Pen, Alibaug and part of South Mumbai,
besides Navi Mumbai. The location and catchment area of the proposed
airport in Navi Mumbai is shown in Fig 4.34 It is this catchment which is
going to generate and attract traffic to Navi Mumbai airport. The
attractiveness of an airport depends upon the time of access by surface
transport to airport. For the short haul, trips might be as short as 45 to 60
Chapter 4 EIA Study of Navi Mumbai International Airport Sheet 339 of 416
CESE, IIT Mumbai CIDCO
minutes while more than 60 minutes is acceptable for international trips. The
adequacy of accessibility to Navi Mumbai airport needs to be assessed for
the entire horizon period by carrying out a traffic & transportation study and
the same is analysed and described in this chapter.
4.14.2 Site accessibility
Very few airports in the world have accessibility by all modes of transport i.e.
air, water and road and Navi Mumbai airport would be one among them.
The airport site is presently connected by commuter rail, National, State
highways and city roads and proposed to be connected in future by water
transport, sea link and commuter ring railway. Besides above site is also
connected to Jawaharlal Nehru Port (JNPT), Mumbai Port Trust (MbPT).
The following Table 4.88 shows direct connectivity to catchment area and
the rest of the country.
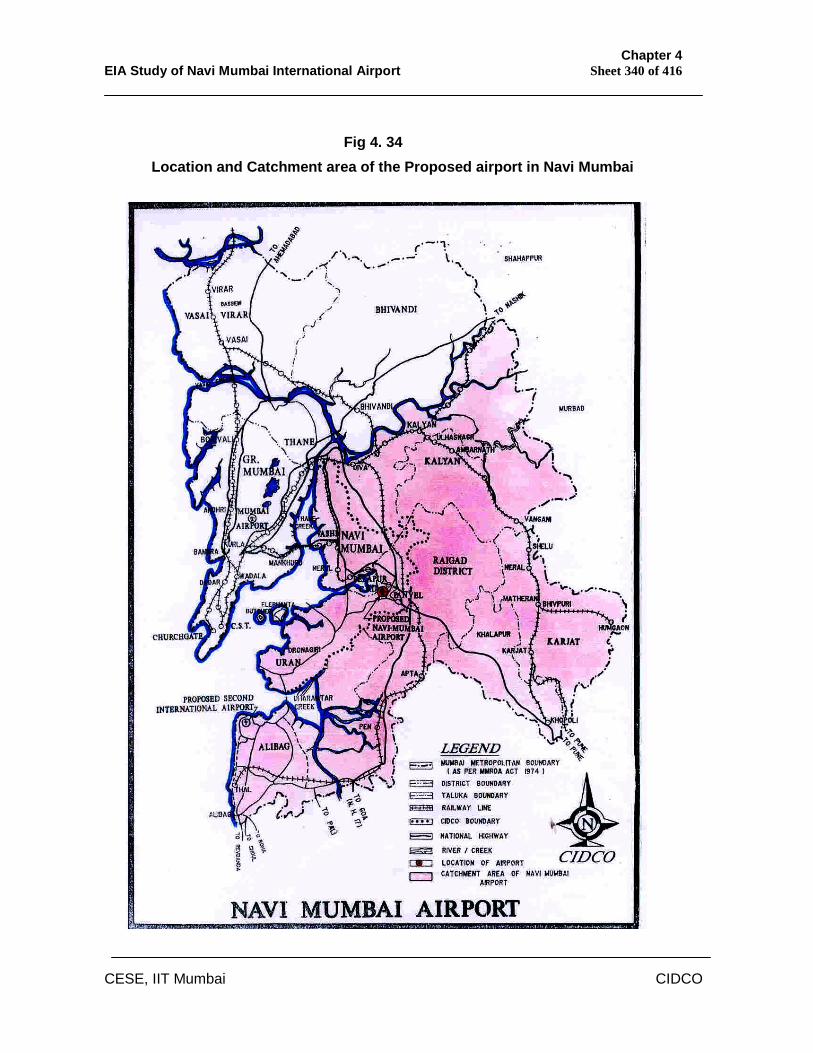
Chapter 4 EIA Study of Navi Mumbai International Airport Sheet 340 of 416
CESE, IIT Mumbai CIDCO
Fig 4. 34
Location and Catchment area of the Proposed airport in Navi Mumbai
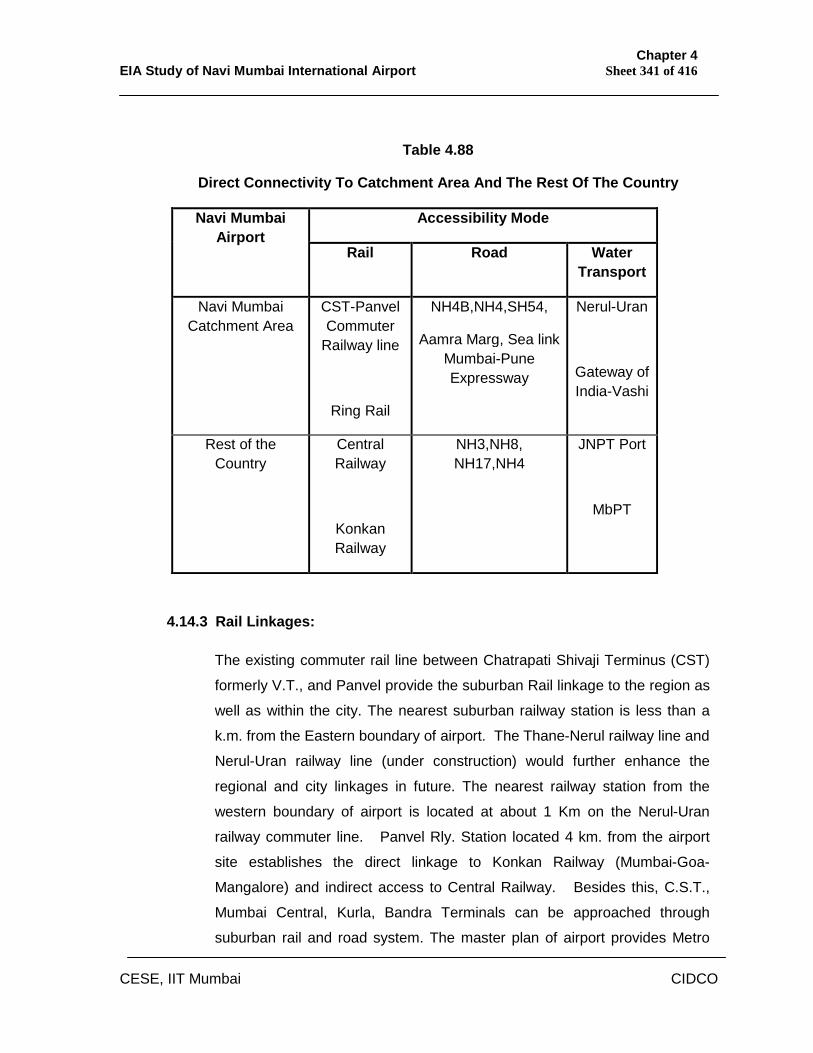
Chapter 4 EIA Study of Navi Mumbai International Airport Sheet 341 of 416
CESE, IIT Mumbai CIDCO
Table 4.88
Direct Connectivity To Catchment Area And The Rest Of The Country
4.14.3 Rail Linkages:
The existing commuter rail line between Chatrapati Shivaji Terminus (CST)
formerly V.T., and Panvel provide the suburban Rail linkage to the region as
well as within the city. The nearest suburban railway station is less than a
k.m. from the Eastern boundary of airport. The Thane-Nerul railway line and
Nerul-Uran railway line (under construction) would further enhance the
regional and city linkages in future. The nearest railway station from the
western boundary of airport is located at about 1 Km on the Nerul-Uran
railway commuter line. Panvel Rly. Station located 4 km. from the airport
site establishes the direct linkage to Konkan Railway (Mumbai-Goa-
Mangalore) and indirect access to Central Railway. Besides this, C.S.T.,
Mumbai Central, Kurla, Bandra Terminals can be approached through
suburban rail and road system. The master plan of airport provides Metro
Accessibility Mode Navi Mumbai Airport
Rail Road Water Transport
Navi Mumbai Catchment Area
CST-Panvel Commuter
Railway line
Ring Rail
NH4B,NH4,SH54,
Aamra Marg, Sea link Mumbai-Pune Expressway
Nerul-Uran
Gateway of India-Vashi
Rest of the Country
Central Railway
Konkan Railway
NH3,NH8, NH17,NH4
JNPT Port
MbPT
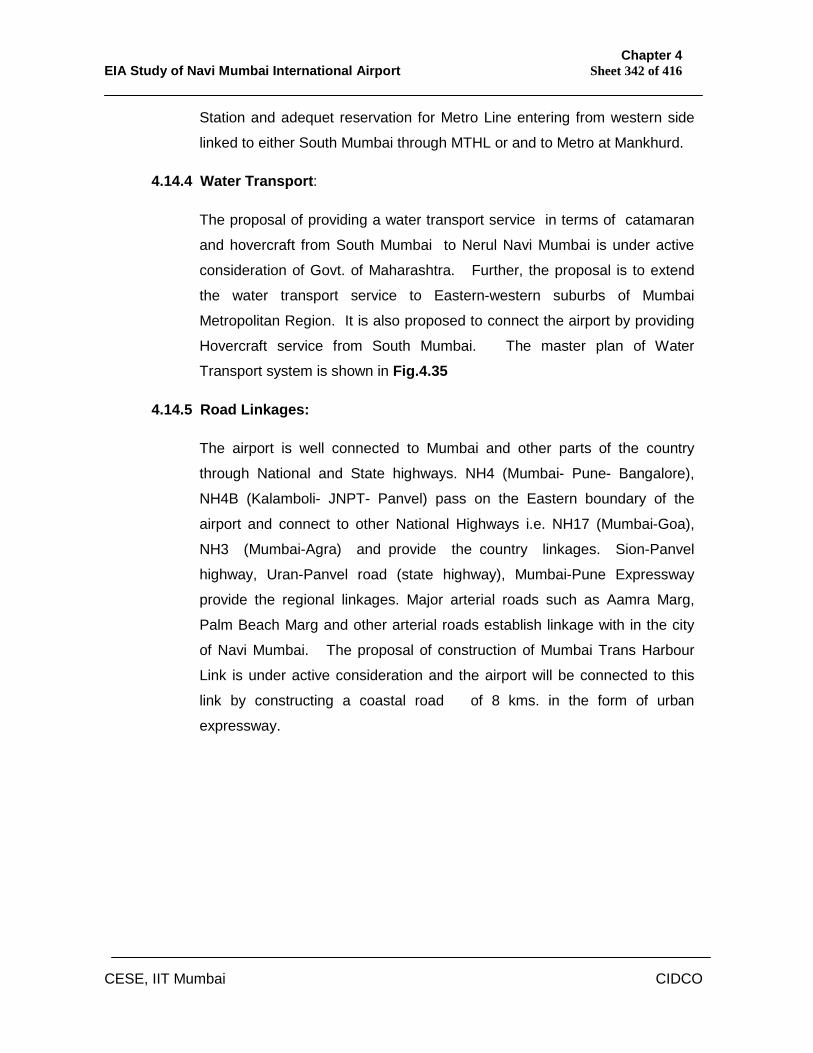
Chapter 4 EIA Study of Navi Mumbai International Airport Sheet 342 of 416
CESE, IIT Mumbai CIDCO
Station and adequet reservation for Metro Line entering from western side
linked to either South Mumbai through MTHL or and to Metro at Mankhurd.
4.14.4 Water Transport:
The proposal of providing a water transport service in terms of catamaran
and hovercraft from South Mumbai to Nerul Navi Mumbai is under active
consideration of Govt. of Maharashtra. Further, the proposal is to extend
the water transport service to Eastern-western suburbs of Mumbai
Metropolitan Region. It is also proposed to connect the airport by providing
Hovercraft service from South Mumbai. The master plan of Water
Transport system is shown in Fig.4.35
4.14.5 Road Linkages:
The airport is well connected to Mumbai and other parts of the country
through National and State highways. NH4 (Mumbai- Pune- Bangalore),
NH4B (Kalamboli- JNPT- Panvel) pass on the Eastern boundary of the
airport and connect to other National Highways i.e. NH17 (Mumbai-Goa),
NH3 (Mumbai-Agra) and provide the country linkages. Sion-Panvel
highway, Uran-Panvel road (state highway), Mumbai-Pune Expressway
provide the regional linkages. Major arterial roads such as Aamra Marg,
Palm Beach Marg and other arterial roads establish linkage with in the city
of Navi Mumbai. The proposal of construction of Mumbai Trans Harbour
Link is under active consideration and the airport will be connected to this
link by constructing a coastal road of 8 kms. in the form of urban
expressway.
Chapter 4 EIA Study of Navi Mumbai International Airport Sheet 343 of 416
CESE, IIT Mumbai CIDCO
Fig.4.35
Master Plan Of Water Transport System
Chapter 4 EIA Study of Navi Mumbai International Airport Sheet 344 of 416
CESE, IIT Mumbai CIDCO
4.14.6 Mode Share
Worldwide experience speaks that airport users mostly use automobiles to
reach the airport. The automobile mode could be either by personalised or
private taxi. The automobile mode dominates for the airport of size 5 to 8
MPPA. There after the airport users shift to public transport in form of bus
and commuter rail. Navi Mumbai Airport is being design for the 60 MPPA. It
is assumed that 60% of airport users would be automobile base (car + taxi)
and remaining 40% would use the other modes transport i.e. commuter rail
(15%), Bus (5%), Auto (10%) and water transport (10%). The cargo traffic
generated would be entirely dispersed through roads.
As the majority of airport users are automobile based, it becomes apparent
to examine the land access modes of Navi Mumbai Airport. The important
linkages ( Fig 4.36), which are identified to test the adequacy, are
enumerated below.
i) National Highway 4B
The National highway 4B connects the NH4 and Jawaharlal Nehru Port. It
has two links i.e. Northern link connecting NH4 at Kalamboli to cater to the
Mumbai bound traffic and Southern link to Pune bound traffic. These two
links also act as western bypass to Panvel Town. NH4B has a right of way
of 60 m and the existing carriageway is of four lane width with paved
shoulder of 2.5 m. on both sides. National Highway Authority of India is
proposing to widen the road to six lanes. This road is proposed to be
widened ultimately to eight lanes. Thus the road will have eight lanes with
carrying capacity of 7200 PCU per hour.
ii) State Highway No.54
State Highway 54 connects Uran with Panvel town and runs on the
Southern boundary of Airport. This road would provide accessibility to
airport from Southern side for activities planned near second run way. The
road has the connectivity to NH4, NH4B and Aamra Marg. The existing
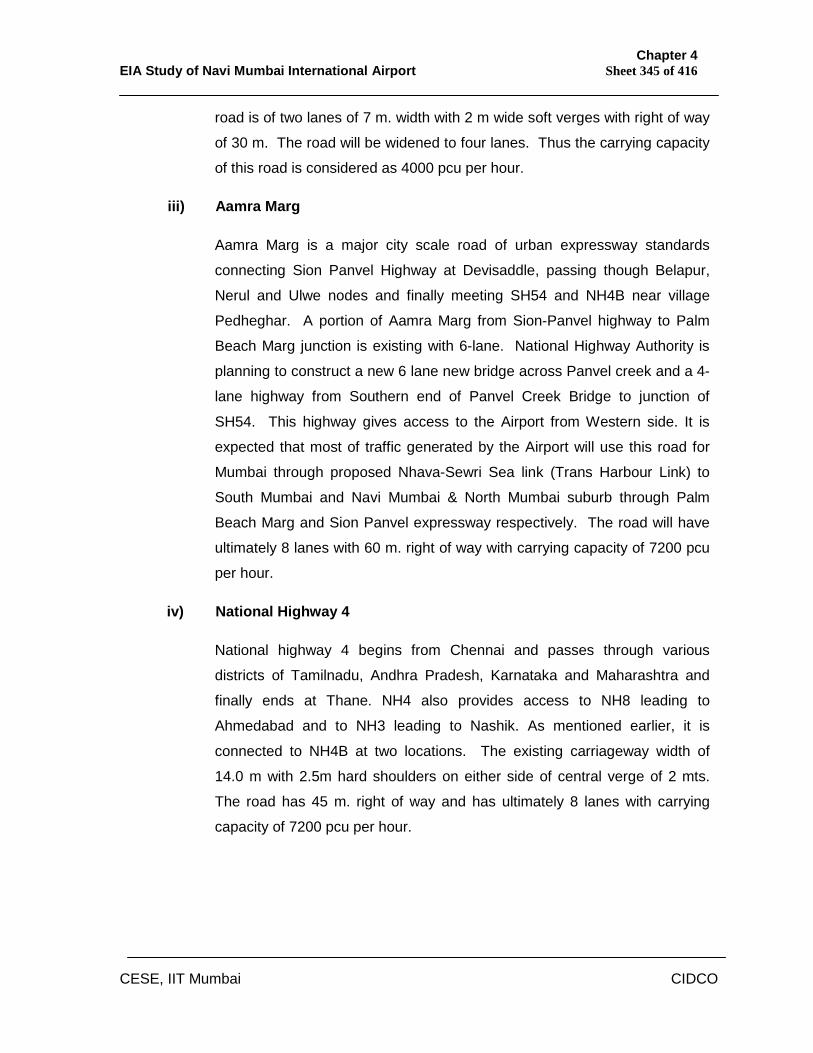
Chapter 4 EIA Study of Navi Mumbai International Airport Sheet 345 of 416
CESE, IIT Mumbai CIDCO
road is of two lanes of 7 m. width with 2 m wide soft verges with right of way
of 30 m. The road will be widened to four lanes. Thus the carrying capacity
of this road is considered as 4000 pcu per hour.
iii) Aamra Marg
Aamra Marg is a major city scale road of urban expressway standards
connecting Sion Panvel Highway at Devisaddle, passing though Belapur,
Nerul and Ulwe nodes and finally meeting SH54 and NH4B near village
Pedheghar. A portion of Aamra Marg from Sion-Panvel highway to Palm
Beach Marg junction is existing with 6-lane. National Highway Authority is
planning to construct a new 6 lane new bridge across Panvel creek and a 4-
lane highway from Southern end of Panvel Creek Bridge to junction of
SH54. This highway gives access to the Airport from Western side. It is
expected that most of traffic generated by the Airport will use this road for
Mumbai through proposed Nhava-Sewri Sea link (Trans Harbour Link) to
South Mumbai and Navi Mumbai & North Mumbai suburb through Palm
Beach Marg and Sion Panvel expressway respectively. The road will have
ultimately 8 lanes with 60 m. right of way with carrying capacity of 7200 pcu
per hour.
iv) National Highway 4
National highway 4 begins from Chennai and passes through various
districts of Tamilnadu, Andhra Pradesh, Karnataka and Maharashtra and
finally ends at Thane. NH4 also provides access to NH8 leading to
Ahmedabad and to NH3 leading to Nashik. As mentioned earlier, it is
connected to NH4B at two locations. The existing carriageway width of
14.0 m with 2.5m hard shoulders on either side of central verge of 2 mts.
The road has 45 m. right of way and has ultimately 8 lanes with carrying
capacity of 7200 pcu per hour.
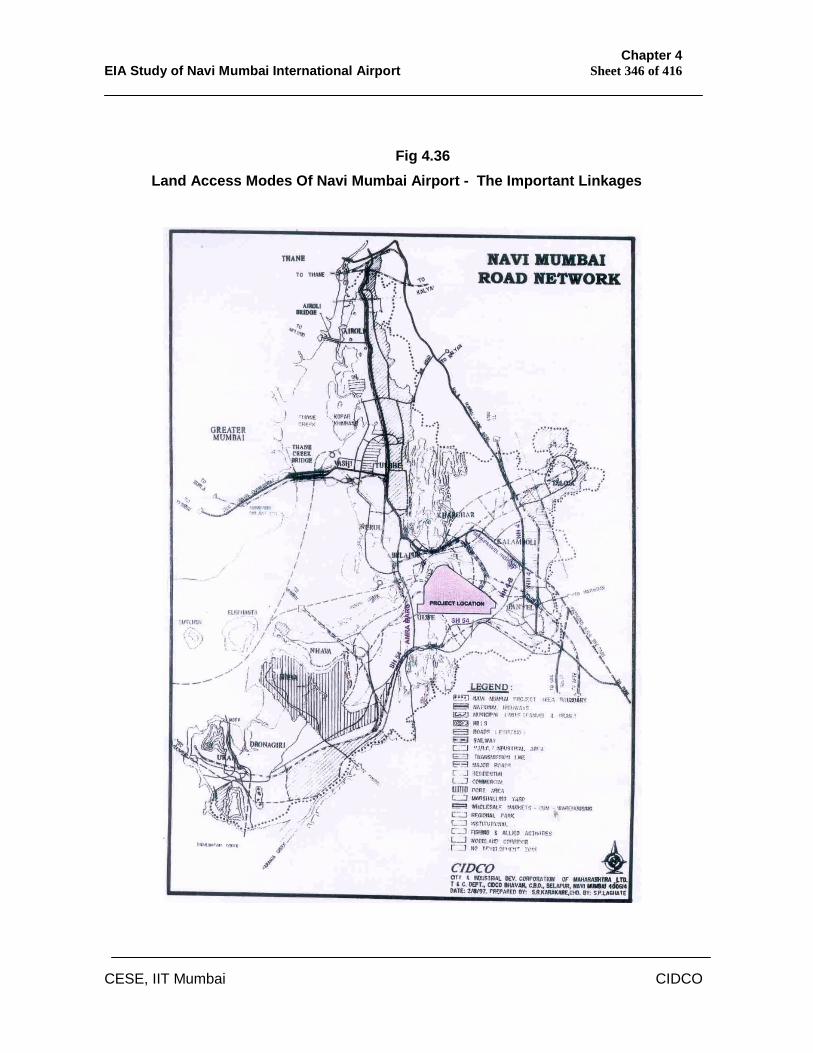
Chapter 4 EIA Study of Navi Mumbai International Airport Sheet 346 of 416
CESE, IIT Mumbai CIDCO
Fig 4.36 Land Access Modes Of Navi Mumbai Airport - The Important Linkages
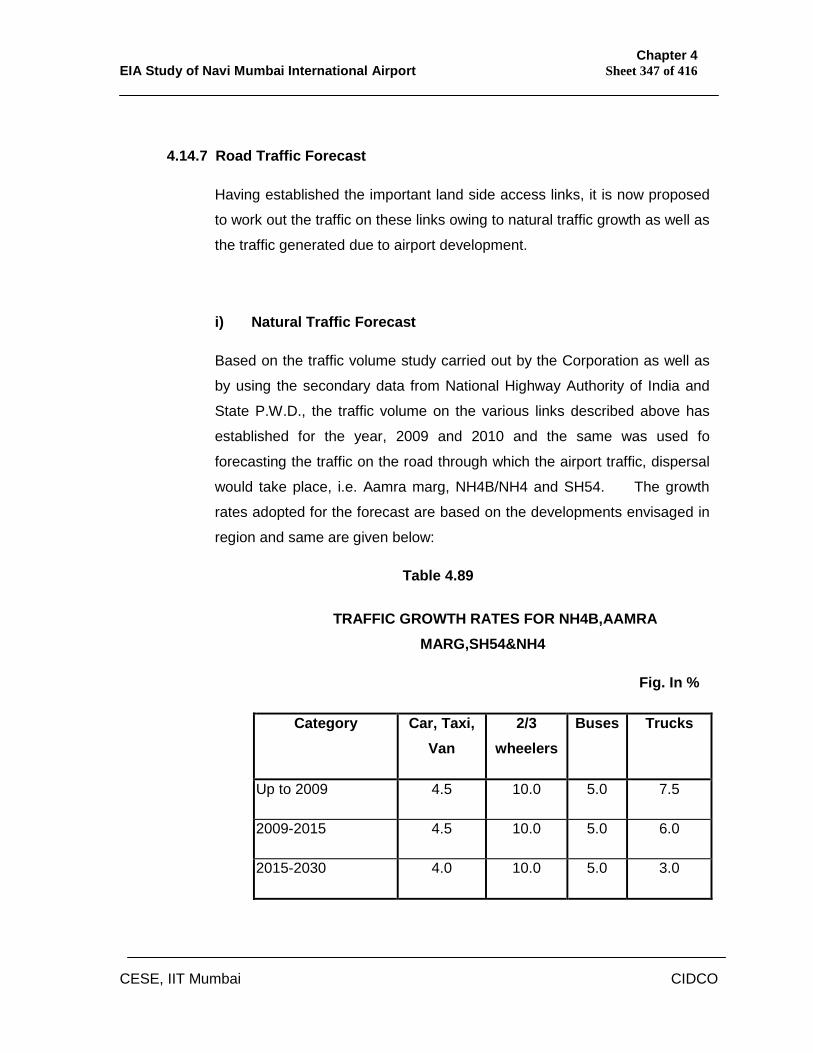
Chapter 4 EIA Study of Navi Mumbai International Airport Sheet 347 of 416
CESE, IIT Mumbai CIDCO
4.14.7 Road Traffic Forecast
Having established the important land side access links, it is now proposed
to work out the traffic on these links owing to natural traffic growth as well as
the traffic generated due to airport development.
i) Natural Traffic Forecast
Based on the traffic volume study carried out by the Corporation as well as
by using the secondary data from National Highway Authority of India and
State P.W.D., the traffic volume on the various links described above has
established for the year, 2009 and 2010 and the same was used fo
forecasting the traffic on the road through which the airport traffic, dispersal
would take place, i.e. Aamra marg, NH4B/NH4 and SH54. The growth
rates adopted for the forecast are based on the developments envisaged in
region and same are given below:
Table 4.89
TRAFFIC GROWTH RATES FOR NH4B,AAMRA MARG,SH54&NH4
Fig. In %
Category Car, Taxi, Van
2/3 wheelers
Buses Trucks
Up to 2009 4.5 10.0 5.0 7.5
2009-2015 4.5 10.0 5.0 6.0
2015-2030 4.0 10.0 5.0 3.0
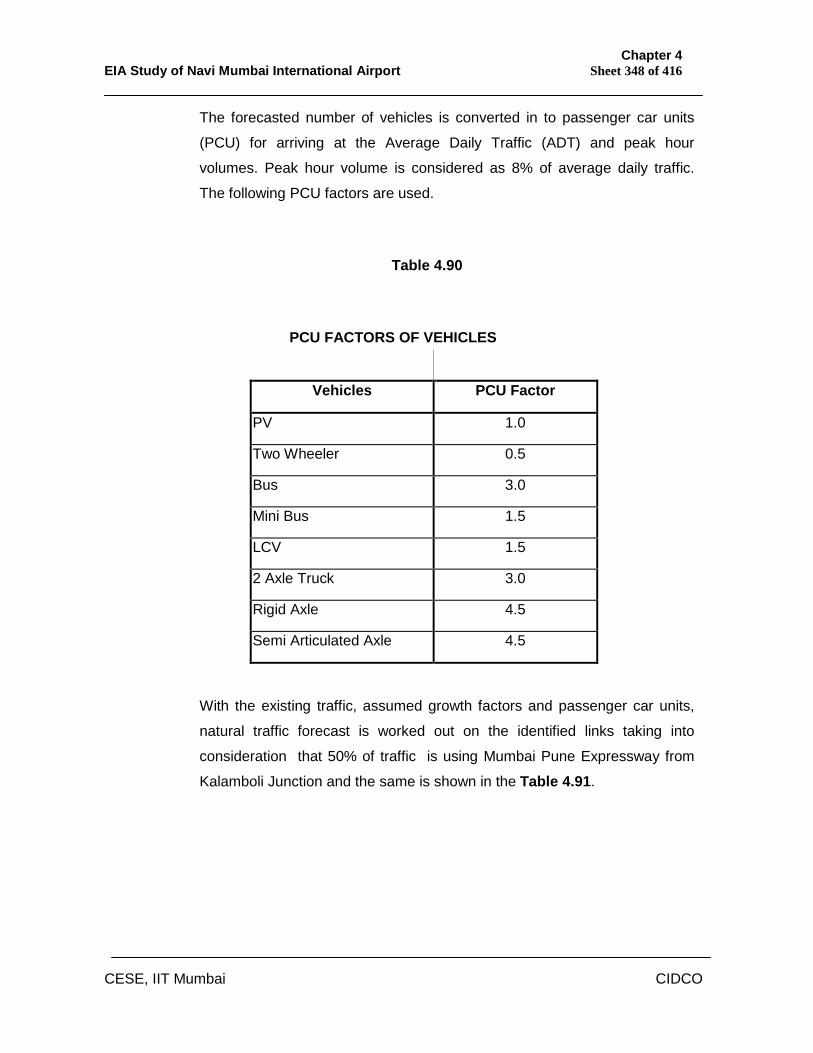
Chapter 4 EIA Study of Navi Mumbai International Airport Sheet 348 of 416
CESE, IIT Mumbai CIDCO
The forecasted number of vehicles is converted in to passenger car units
(PCU) for arriving at the Average Daily Traffic (ADT) and peak hour
volumes. Peak hour volume is considered as 8% of average daily traffic.
The following PCU factors are used.
Table 4.90
PCU FACTORS OF VEHICLES
Vehicles PCU Factor
PV 1.0
Two Wheeler 0.5
Bus 3.0
Mini Bus 1.5
LCV 1.5
2 Axle Truck 3.0
Rigid Axle 4.5
Semi Articulated Axle 4.5
With the existing traffic, assumed growth factors and passenger car units,
natural traffic forecast is worked out on the identified links taking into
consideration that 50% of traffic is using Mumbai Pune Expressway from
Kalamboli Junction and the same is shown in the Table 4.91.
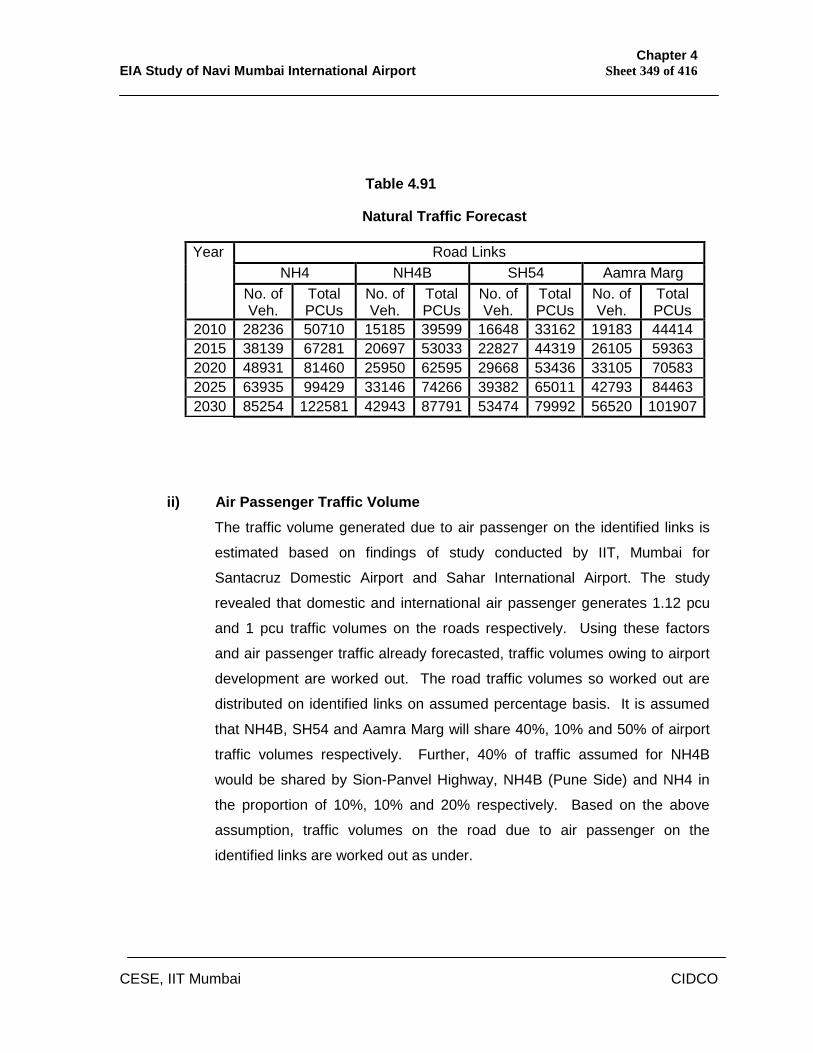
Chapter 4 EIA Study of Navi Mumbai International Airport Sheet 349 of 416
CESE, IIT Mumbai CIDCO
Table 4.91
Natural Traffic Forecast
Road Links NH4 NH4B SH54 Aamra Marg
Year
No. of Veh.
Total PCUs
No. of Veh.
Total PCUs
No. of Veh.
Total PCUs
No. of Veh.
Total PCUs
2010 28236 50710 15185 39599 16648 33162 19183 44414 2015 38139 67281 20697 53033 22827 44319 26105 59363 2020 48931 81460 25950 62595 29668 53436 33105 70583 2025 63935 99429 33146 74266 39382 65011 42793 84463 2030 85254 122581 42943 87791 53474 79992 56520 101907
ii) Air Passenger Traffic Volume
The traffic volume generated due to air passenger on the identified links is
estimated based on findings of study conducted by IIT, Mumbai for
Santacruz Domestic Airport and Sahar International Airport. The study
revealed that domestic and international air passenger generates 1.12 pcu
and 1 pcu traffic volumes on the roads respectively. Using these factors
and air passenger traffic already forecasted, traffic volumes owing to airport
development are worked out. The road traffic volumes so worked out are
distributed on identified links on assumed percentage basis. It is assumed
that NH4B, SH54 and Aamra Marg will share 40%, 10% and 50% of airport
traffic volumes respectively. Further, 40% of traffic assumed for NH4B
would be shared by Sion-Panvel Highway, NH4B (Pune Side) and NH4 in
the proportion of 10%, 10% and 20% respectively. Based on the above
assumption, traffic volumes on the road due to air passenger on the
identified links are worked out as under.
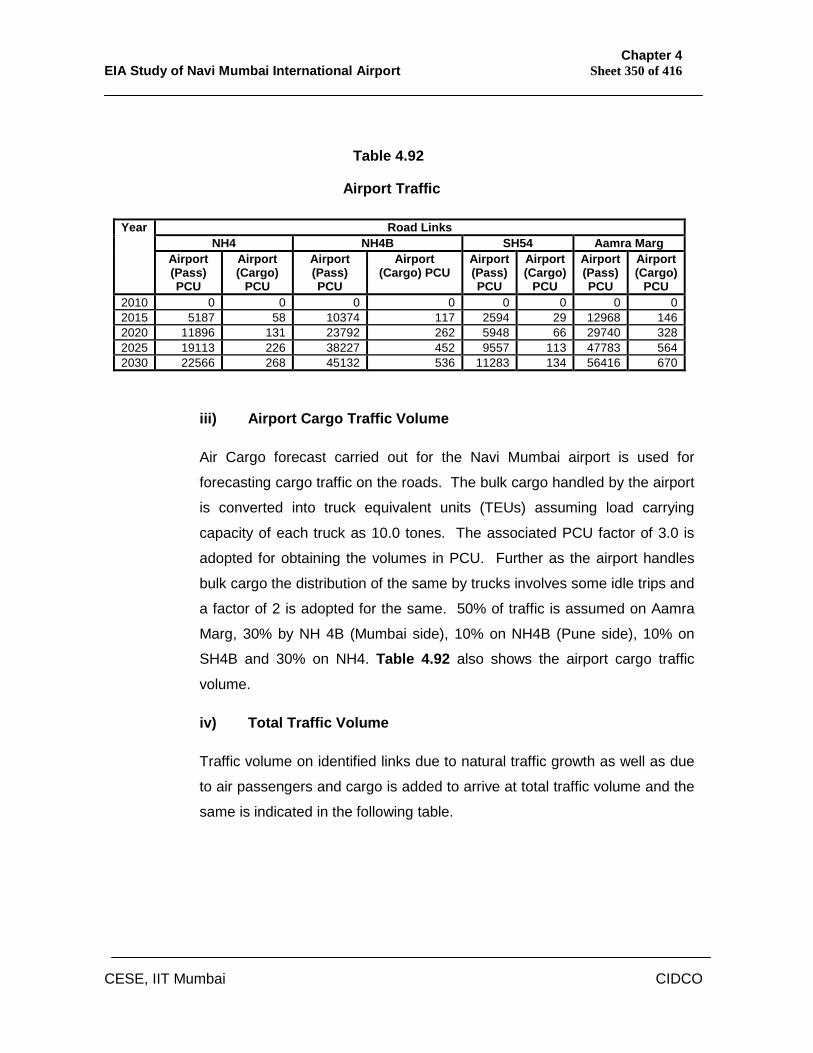
Chapter 4 EIA Study of Navi Mumbai International Airport Sheet 350 of 416
CESE, IIT Mumbai CIDCO
Table 4.92
Airport Traffic
Road Links NH4 NH4B SH54 Aamra Marg
Year
Airport (Pass) PCU
Airport (Cargo)
PCU
Airport (Pass) PCU
Airport (Cargo) PCU
Airport (Pass) PCU
Airport (Cargo)
PCU
Airport (Pass) PCU
Airport (Cargo)
PCU 2010 0 0 0 0 0 0 0 0 2015 5187 58 10374 117 2594 29 12968 146 2020 11896 131 23792 262 5948 66 29740 328 2025 19113 226 38227 452 9557 113 47783 564 2030 22566 268 45132 536 11283 134 56416 670
iii) Airport Cargo Traffic Volume
Air Cargo forecast carried out for the Navi Mumbai airport is used for
forecasting cargo traffic on the roads. The bulk cargo handled by the airport
is converted into truck equivalent units (TEUs) assuming load carrying
capacity of each truck as 10.0 tones. The associated PCU factor of 3.0 is
adopted for obtaining the volumes in PCU. Further as the airport handles
bulk cargo the distribution of the same by trucks involves some idle trips and
a factor of 2 is adopted for the same. 50% of traffic is assumed on Aamra
Marg, 30% by NH 4B (Mumbai side), 10% on NH4B (Pune side), 10% on
SH4B and 30% on NH4. Table 4.92 also shows the airport cargo traffic
volume.
iv) Total Traffic Volume
Traffic volume on identified links due to natural traffic growth as well as due
to air passengers and cargo is added to arrive at total traffic volume and the
same is indicated in the following table.
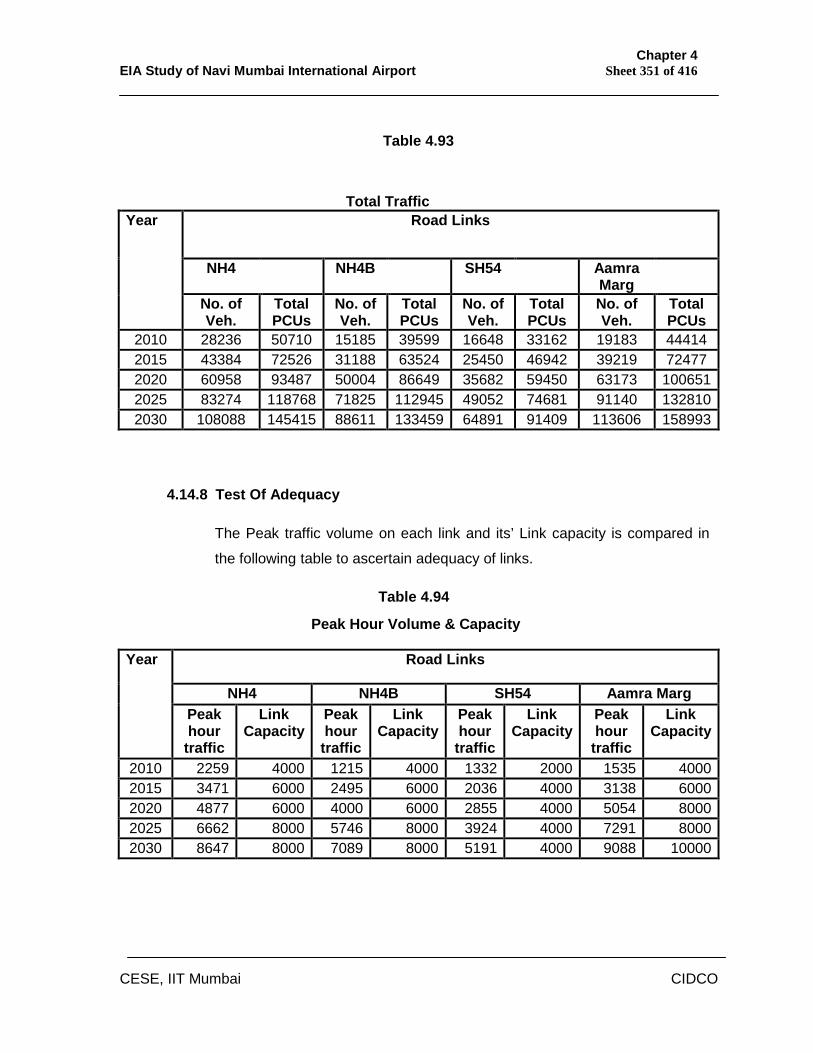
Chapter 4 EIA Study of Navi Mumbai International Airport Sheet 351 of 416
CESE, IIT Mumbai CIDCO
Table 4.93
Total Traffic Year Road Links
NH4 NH4B SH54 Aamra Marg
No. of Veh.
Total PCUs
No. of Veh.
Total PCUs
No. of Veh.
Total PCUs
No. of Veh.
Total PCUs
2010 28236 50710 15185 39599 16648 33162 19183 44414 2015 43384 72526 31188 63524 25450 46942 39219 72477 2020 60958 93487 50004 86649 35682 59450 63173 100651 2025 83274 118768 71825 112945 49052 74681 91140 132810 2030 108088 145415 88611 133459 64891 91409 113606 158993
4.14.8 Test Of Adequacy
The Peak traffic volume on each link and its’ Link capacity is compared in
the following table to ascertain adequacy of links.
Table 4.94
Peak Hour Volume & Capacity
Road Links
NH4 NH4B SH54 Aamra Marg
Year
Peak hour
traffic
Link Capacity
Peak hour
traffic
Link Capacity
Peak hour
traffic
Link Capacity
Peak hour
traffic
Link Capacity
2010 2259 4000 1215 4000 1332 2000 1535 4000 2015 3471 6000 2495 6000 2036 4000 3138 6000 2020 4877 6000 4000 6000 2855 4000 5054 8000 2025 6662 8000 5746 8000 3924 4000 7291 8000 2030 8647 8000 7089 8000 5191 4000 9088 10000
Chapter 4 EIA Study of Navi Mumbai International Airport Sheet 352 of 416
CESE, IIT Mumbai CIDCO
With commissioning of airport all the links identified with proposed
improvement proposal will be operating at desired level of service B with
speed of 60 KMPH upto 2025 except Amra marg. Thereafter operating
characteristics would reduce the level of service C with speed of 40 KMPH
necessitating addition of two more lanes to the identified links to bring the
level of service back to B. Thus the Traffic and Transportation study revels
that road network around the airport is is adequate to handle increase in
traffic due the airport.
It is evident that the existing and proposed accessibility in terms of proposed
Metro and high speed water transport system will make up the availability of
efficient and comprehensive transport system to the Navi Mumbai airport.
4.14.9 Intersection Analysis
The primary road network providing access to airport is analysed in the
above section in detail to assess its adequacy in meeting the travel demand
generated from the air traffic and natural traffic. It is now propose to analise
the major junctions in and around airport to assess its adequacy in meeting
the traffic demand generated due to airport development. Accordingly seven
intersections are considered for the analysis of traffic assessments based on
its importance in distributing the traffic at city level, nearness to airport,
importance of roads etc. The selected seven intersections are as follows.
I. Belapur intersection.
II. Kalamboli intersection.
III. D.Y.Patil intersection
IV. Panvel intersection
V. Uran intersection
VI. Taloja intersection.
VII. Sanpada Intersection.
TransCad is used for the geocoding and mapping of the Study area. For
providing a GIS platform, all study area was coded in TransCAD. All seven
intersections are coded in point geographic file as well as Major roads and
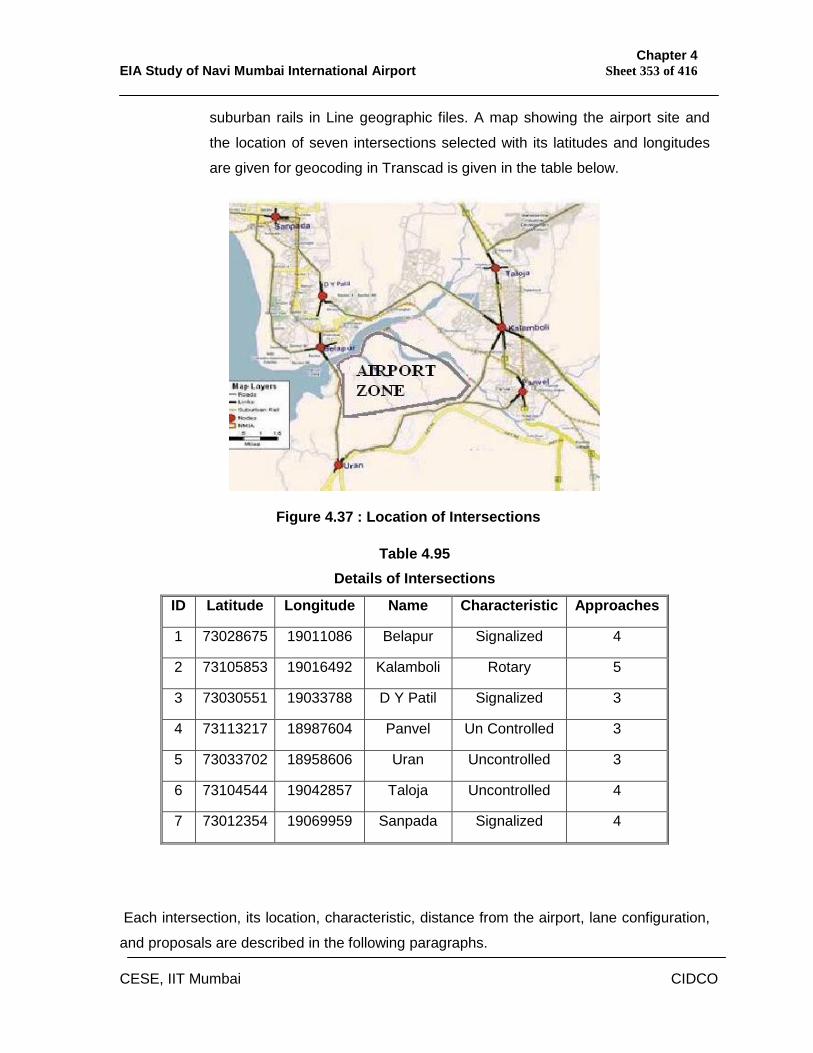
Chapter 4 EIA Study of Navi Mumbai International Airport Sheet 353 of 416
CESE, IIT Mumbai CIDCO
suburban rails in Line geographic files. A map showing the airport site and
the location of seven intersections selected with its latitudes and longitudes
are given for geocoding in Transcad is given in the table below.
Figure 4.37 : Location of Intersections
Table 4.95 Details of Intersections
ID Latitude Longitude Name Characteristic Approaches
1 73028675 19011086 Belapur Signalized 4
2 73105853 19016492 Kalamboli Rotary 5
3 73030551 19033788 D Y Patil Signalized 3
4 73113217 18987604 Panvel Un Controlled 3
5 73033702 18958606 Uran Uncontrolled 3
6 73104544 19042857 Taloja Uncontrolled 4
7 73012354 19069959 Sanpada Signalized 4
Each intersection, its location, characteristic, distance from the airport, lane configuration,
and proposals are described in the following paragraphs.
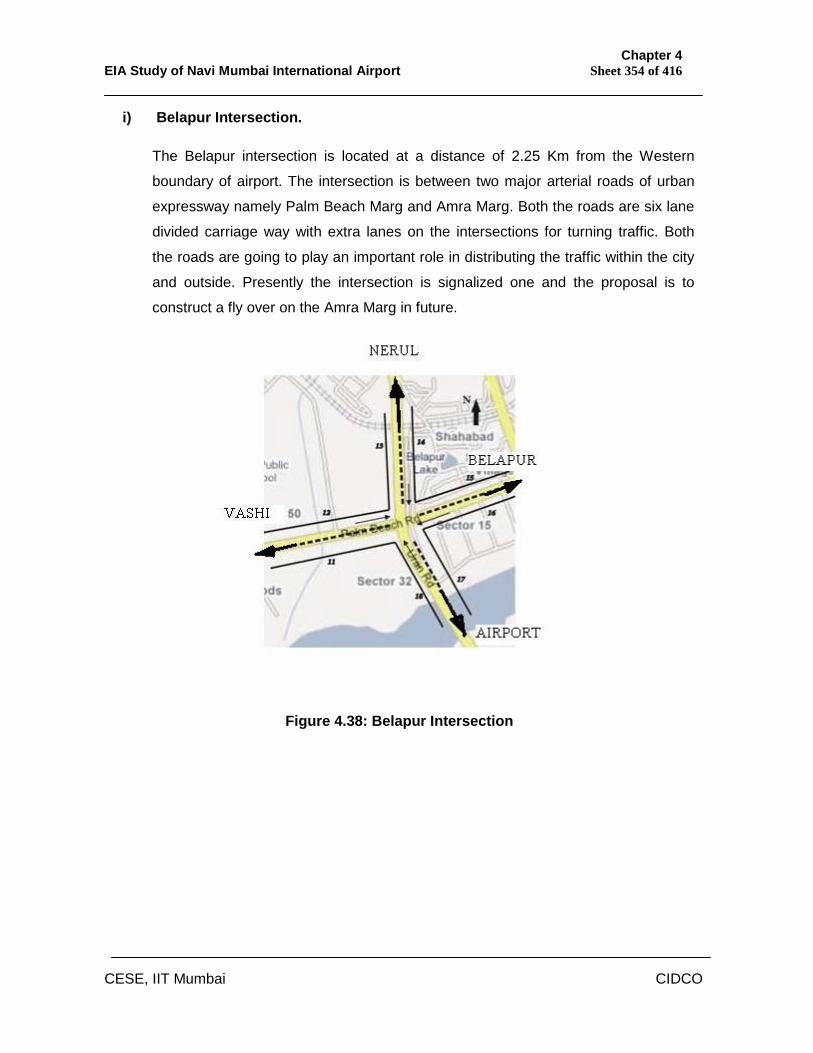
Chapter 4 EIA Study of Navi Mumbai International Airport Sheet 354 of 416
CESE, IIT Mumbai CIDCO
i) Belapur Intersection.
The Belapur intersection is located at a distance of 2.25 Km from the Western
boundary of airport. The intersection is between two major arterial roads of urban
expressway namely Palm Beach Marg and Amra Marg. Both the roads are six lane
divided carriage way with extra lanes on the intersections for turning traffic. Both
the roads are going to play an important role in distributing the traffic within the city
and outside. Presently the intersection is signalized one and the proposal is to
construct a fly over on the Amra Marg in future.
Figure 4.38: Belapur Intersection
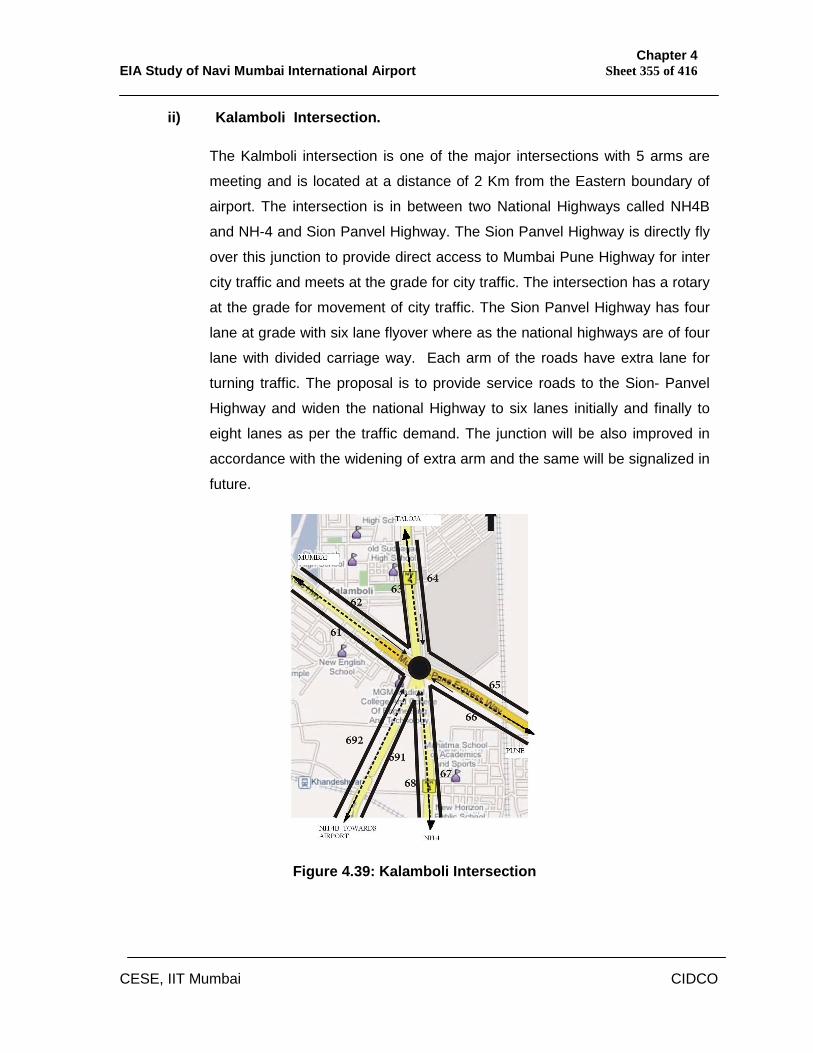
Chapter 4 EIA Study of Navi Mumbai International Airport Sheet 355 of 416
CESE, IIT Mumbai CIDCO
ii) Kalamboli Intersection.
The Kalmboli intersection is one of the major intersections with 5 arms are
meeting and is located at a distance of 2 Km from the Eastern boundary of
airport. The intersection is in between two National Highways called NH4B
and NH-4 and Sion Panvel Highway. The Sion Panvel Highway is directly fly
over this junction to provide direct access to Mumbai Pune Highway for inter
city traffic and meets at the grade for city traffic. The intersection has a rotary
at the grade for movement of city traffic. The Sion Panvel Highway has four
lane at grade with six lane flyover where as the national highways are of four
lane with divided carriage way. Each arm of the roads have extra lane for
turning traffic. The proposal is to provide service roads to the Sion- Panvel
Highway and widen the national Highway to six lanes initially and finally to
eight lanes as per the traffic demand. The junction will be also improved in
accordance with the widening of extra arm and the same will be signalized in
future.
Figure 4.39: Kalamboli Intersection
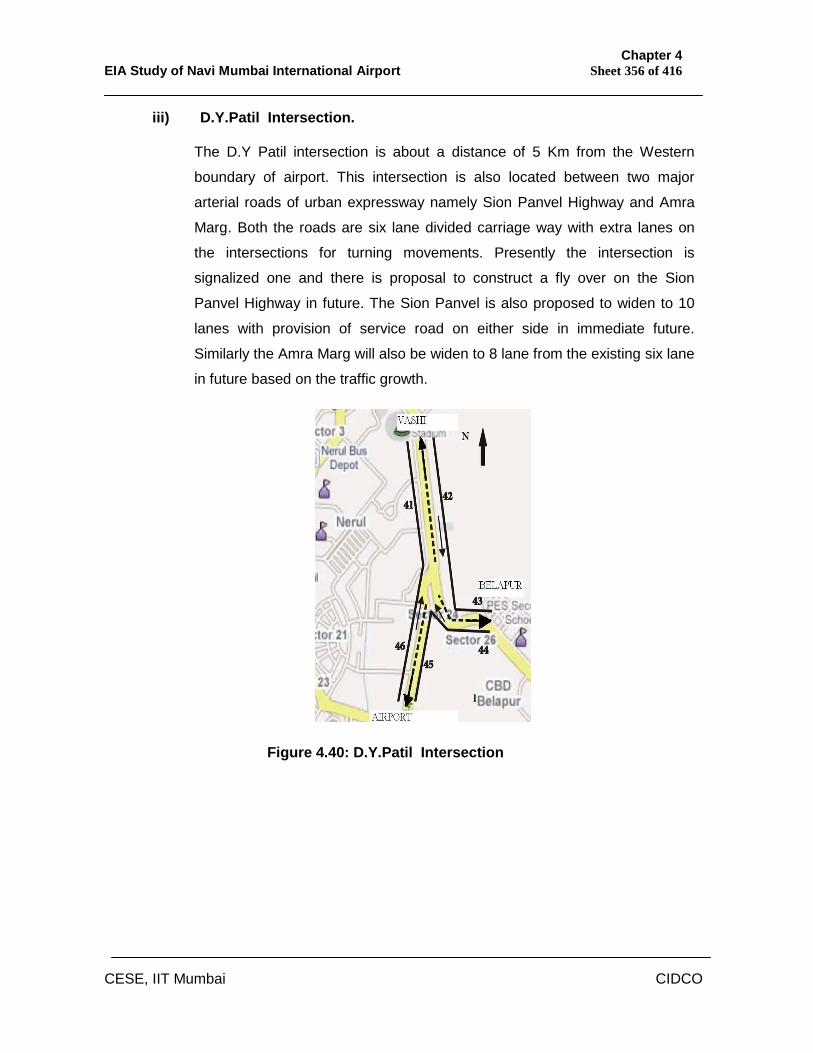
Chapter 4 EIA Study of Navi Mumbai International Airport Sheet 356 of 416
CESE, IIT Mumbai CIDCO
iii) D.Y.Patil Intersection.
The D.Y Patil intersection is about a distance of 5 Km from the Western
boundary of airport. This intersection is also located between two major
arterial roads of urban expressway namely Sion Panvel Highway and Amra
Marg. Both the roads are six lane divided carriage way with extra lanes on
the intersections for turning movements. Presently the intersection is
signalized one and there is proposal to construct a fly over on the Sion
Panvel Highway in future. The Sion Panvel is also proposed to widen to 10
lanes with provision of service road on either side in immediate future.
Similarly the Amra Marg will also be widen to 8 lane from the existing six lane
in future based on the traffic growth.
Figure 4.40: D.Y.Patil Intersection
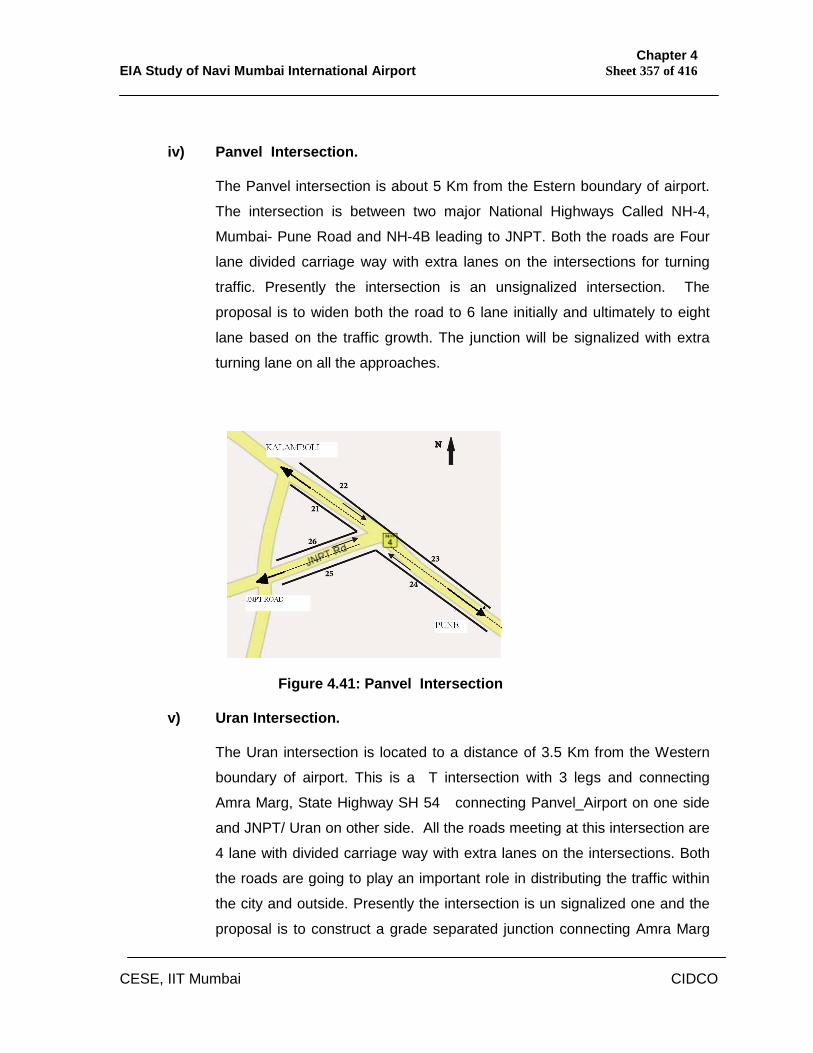
Chapter 4 EIA Study of Navi Mumbai International Airport Sheet 357 of 416
CESE, IIT Mumbai CIDCO
iv) Panvel Intersection.
The Panvel intersection is about 5 Km from the Estern boundary of airport.
The intersection is between two major National Highways Called NH-4,
Mumbai- Pune Road and NH-4B leading to JNPT. Both the roads are Four
lane divided carriage way with extra lanes on the intersections for turning
traffic. Presently the intersection is an unsignalized intersection. The
proposal is to widen both the road to 6 lane initially and ultimately to eight
lane based on the traffic growth. The junction will be signalized with extra
turning lane on all the approaches.
Figure 4.41: Panvel Intersection
v) Uran Intersection.
The Uran intersection is located to a distance of 3.5 Km from the Western
boundary of airport. This is a T intersection with 3 legs and connecting
Amra Marg, State Highway SH 54 connecting Panvel_Airport on one side
and JNPT/ Uran on other side. All the roads meeting at this intersection are
4 lane with divided carriage way with extra lanes on the intersections. Both
the roads are going to play an important role in distributing the traffic within
the city and outside. Presently the intersection is un signalized one and the
proposal is to construct a grade separated junction connecting Amra Marg
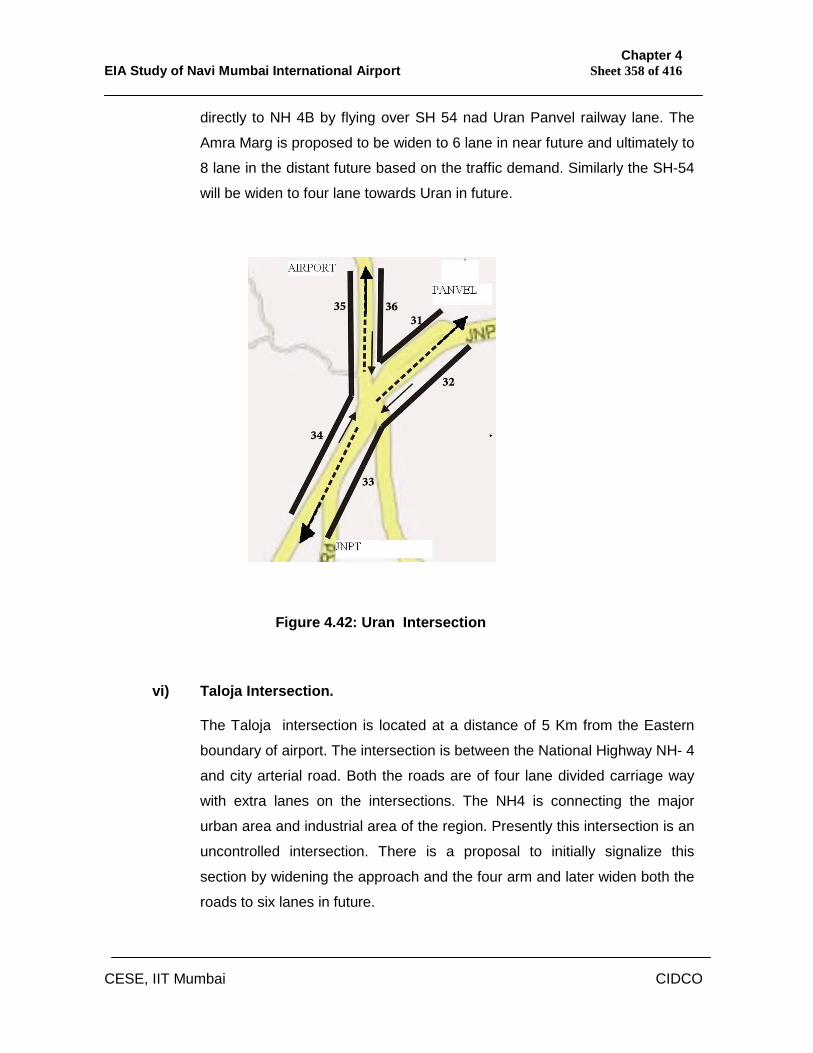
Chapter 4 EIA Study of Navi Mumbai International Airport Sheet 358 of 416
CESE, IIT Mumbai CIDCO
directly to NH 4B by flying over SH 54 nad Uran Panvel railway lane. The
Amra Marg is proposed to be widen to 6 lane in near future and ultimately to
8 lane in the distant future based on the traffic demand. Similarly the SH-54
will be widen to four lane towards Uran in future.
Figure 4.42: Uran Intersection
vi) Taloja Intersection.
The Taloja intersection is located at a distance of 5 Km from the Eastern
boundary of airport. The intersection is between the National Highway NH- 4
and city arterial road. Both the roads are of four lane divided carriage way
with extra lanes on the intersections. The NH4 is connecting the major
urban area and industrial area of the region. Presently this intersection is an
uncontrolled intersection. There is a proposal to initially signalize this
section by widening the approach and the four arm and later widen both the
roads to six lanes in future.
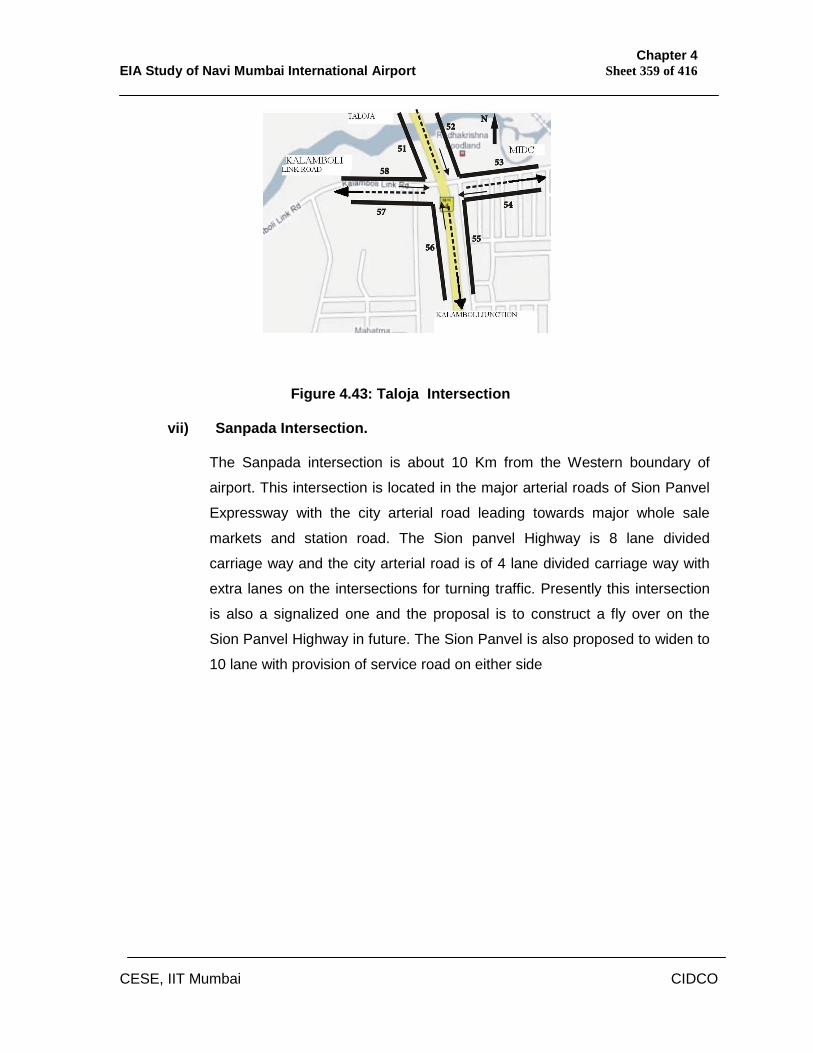
Chapter 4 EIA Study of Navi Mumbai International Airport Sheet 359 of 416
CESE, IIT Mumbai CIDCO
Figure 4.43: Taloja Intersection
vii) Sanpada Intersection.
The Sanpada intersection is about 10 Km from the Western boundary of
airport. This intersection is located in the major arterial roads of Sion Panvel
Expressway with the city arterial road leading towards major whole sale
markets and station road. The Sion panvel Highway is 8 lane divided
carriage way and the city arterial road is of 4 lane divided carriage way with
extra lanes on the intersections for turning traffic. Presently this intersection
is also a signalized one and the proposal is to construct a fly over on the
Sion Panvel Highway in future. The Sion Panvel is also proposed to widen to
10 lane with provision of service road on either side
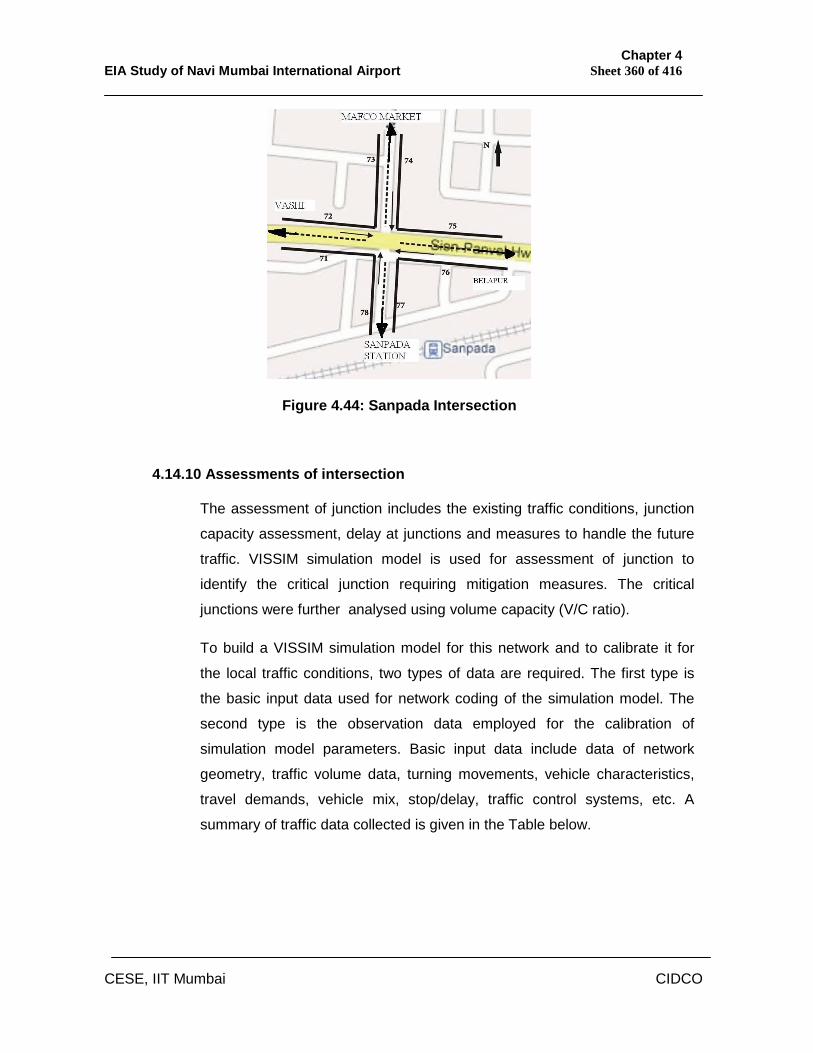
Chapter 4 EIA Study of Navi Mumbai International Airport Sheet 360 of 416
CESE, IIT Mumbai CIDCO
Figure 4.44: Sanpada Intersection
4.14.10 Assessments of intersection
The assessment of junction includes the existing traffic conditions, junction
capacity assessment, delay at junctions and measures to handle the future
traffic. VISSIM simulation model is used for assessment of junction to
identify the critical junction requiring mitigation measures. The critical
junctions were further analysed using volume capacity (V/C ratio).
To build a VISSIM simulation model for this network and to calibrate it for
the local traffic conditions, two types of data are required. The first type is
the basic input data used for network coding of the simulation model. The
second type is the observation data employed for the calibration of
simulation model parameters. Basic input data include data of network
geometry, traffic volume data, turning movements, vehicle characteristics,
travel demands, vehicle mix, stop/delay, traffic control systems, etc. A
summary of traffic data collected is given in the Table below.
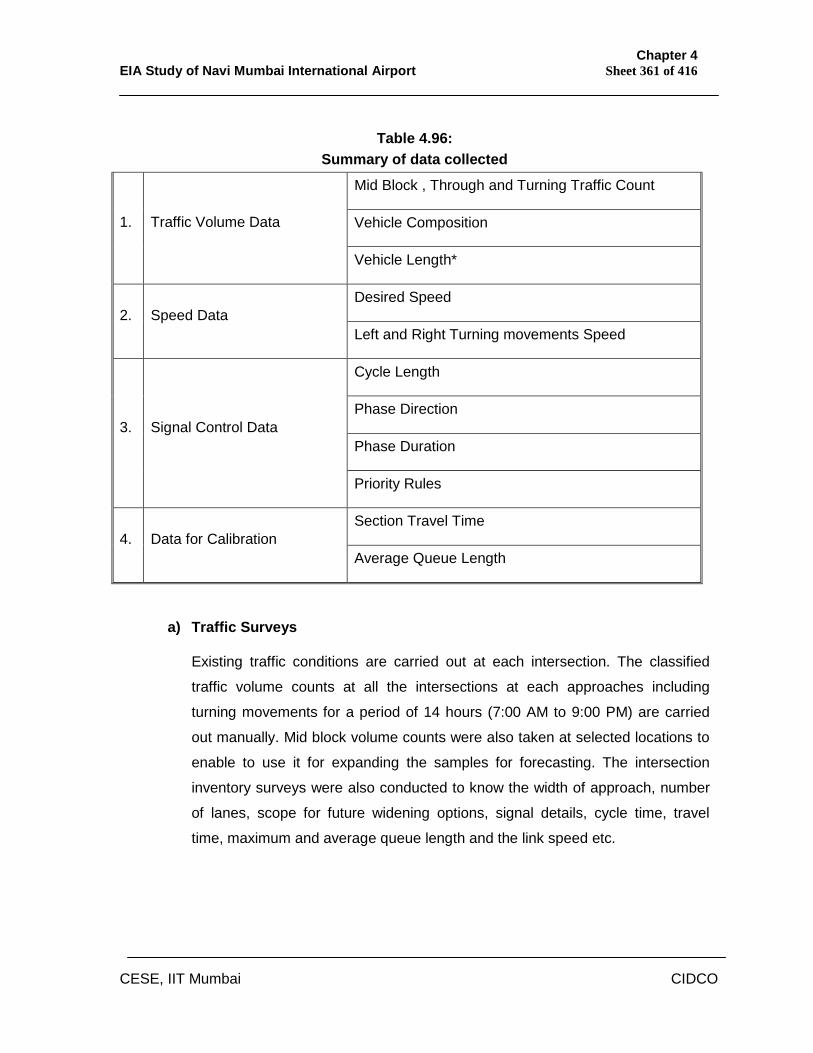
Chapter 4 EIA Study of Navi Mumbai International Airport Sheet 361 of 416
CESE, IIT Mumbai CIDCO
Table 4.96:
Summary of data collected
Mid Block , Through and Turning Traffic Count
Vehicle Composition 1. Traffic Volume Data
Vehicle Length*
Desired Speed 2. Speed Data
Left and Right Turning movements Speed
Cycle Length
Phase Direction
Phase Duration 3. Signal Control Data
Priority Rules
Section Travel Time 4. Data for Calibration
Average Queue Length
a) Traffic Surveys
Existing traffic conditions are carried out at each intersection. The classified
traffic volume counts at all the intersections at each approaches including
turning movements for a period of 14 hours (7:00 AM to 9:00 PM) are carried
out manually. Mid block volume counts were also taken at selected locations to
enable to use it for expanding the samples for forecasting. The intersection
inventory surveys were also conducted to know the width of approach, number
of lanes, scope for future widening options, signal details, cycle time, travel
time, maximum and average queue length and the link speed etc.
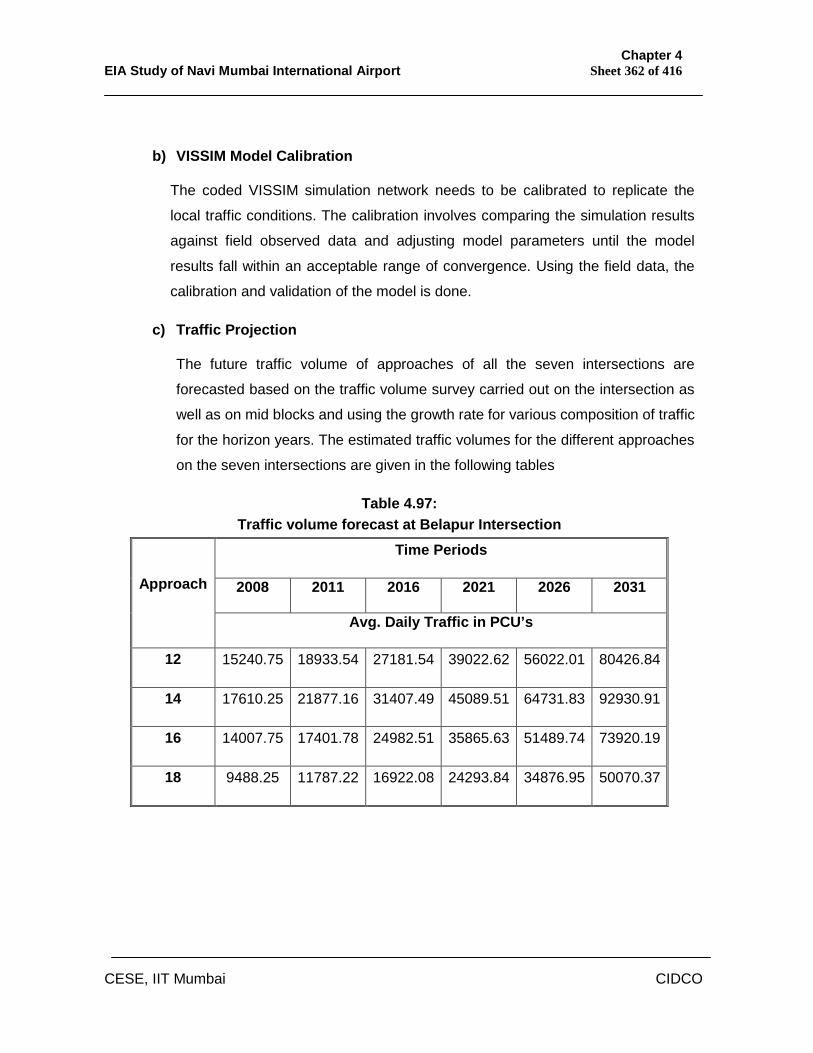
Chapter 4 EIA Study of Navi Mumbai International Airport Sheet 362 of 416
CESE, IIT Mumbai CIDCO
b) VISSIM Model Calibration
The coded VISSIM simulation network needs to be calibrated to replicate the
local traffic conditions. The calibration involves comparing the simulation results
against field observed data and adjusting model parameters until the model
results fall within an acceptable range of convergence. Using the field data, the
calibration and validation of the model is done.
c) Traffic Projection
The future traffic volume of approaches of all the seven intersections are
forecasted based on the traffic volume survey carried out on the intersection as
well as on mid blocks and using the growth rate for various composition of traffic
for the horizon years. The estimated traffic volumes for the different approaches
on the seven intersections are given in the following tables
Table 4.97: Traffic volume forecast at Belapur Intersection
Time Periods
2008 2011 2016 2021 2026 2031 Approach
Avg. Daily Traffic in PCU’s
12 15240.75 18933.54 27181.54 39022.62 56022.01 80426.84
14 17610.25 21877.16 31407.49 45089.51 64731.83 92930.91
16 14007.75 17401.78 24982.51 35865.63 51489.74 73920.19
18 9488.25 11787.22 16922.08 24293.84 34876.95 50070.37
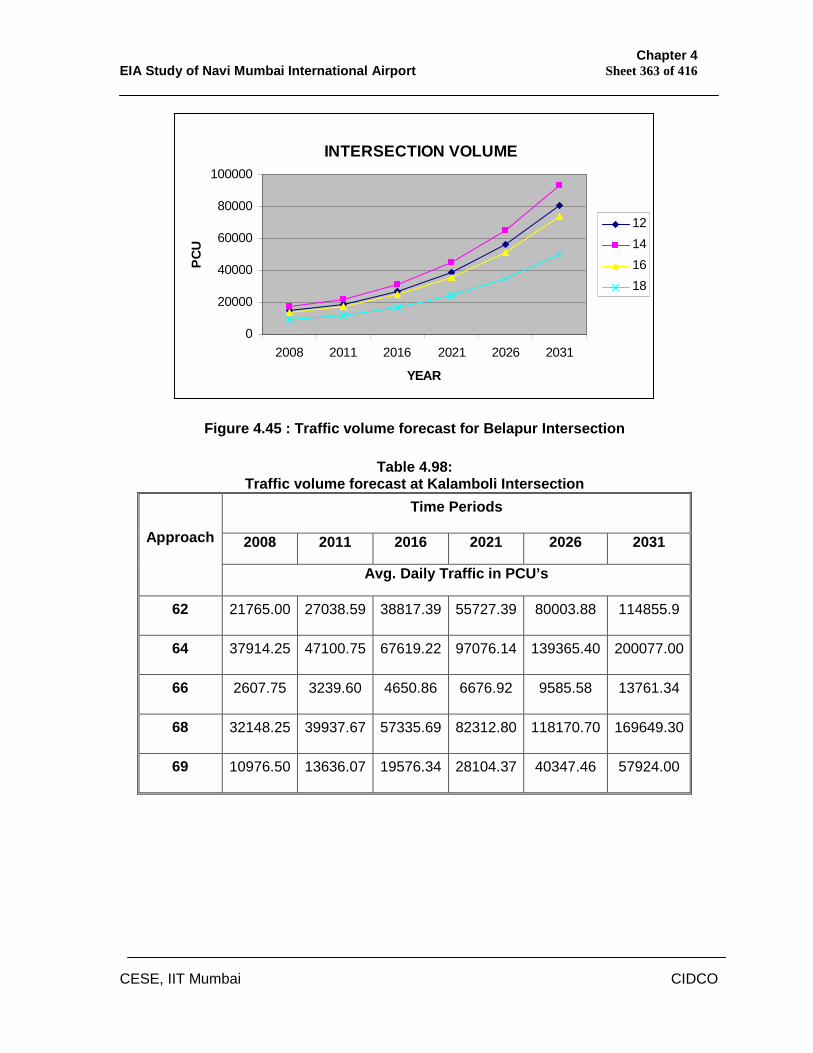
Chapter 4 EIA Study of Navi Mumbai International Airport Sheet 363 of 416
CESE, IIT Mumbai CIDCO
INTERSECTION VOLUME
0
20000
40000
60000
80000
100000
2008 2011 2016 2021 2026 2031
YEAR
PCU
12141618
Figure 4.45 : Traffic volume forecast for Belapur Intersection
Table 4.98: Traffic volume forecast at Kalamboli Intersection
Time Periods
2008 2011 2016 2021 2026 2031 Approach
Avg. Daily Traffic in PCU’s
62 21765.00 27038.59 38817.39 55727.39 80003.88 114855.9
64 37914.25 47100.75 67619.22 97076.14 139365.40 200077.00
66 2607.75 3239.60 4650.86 6676.92 9585.58 13761.34
68 32148.25 39937.67 57335.69 82312.80 118170.70 169649.30
69 10976.50 13636.07 19576.34 28104.37 40347.46 57924.00
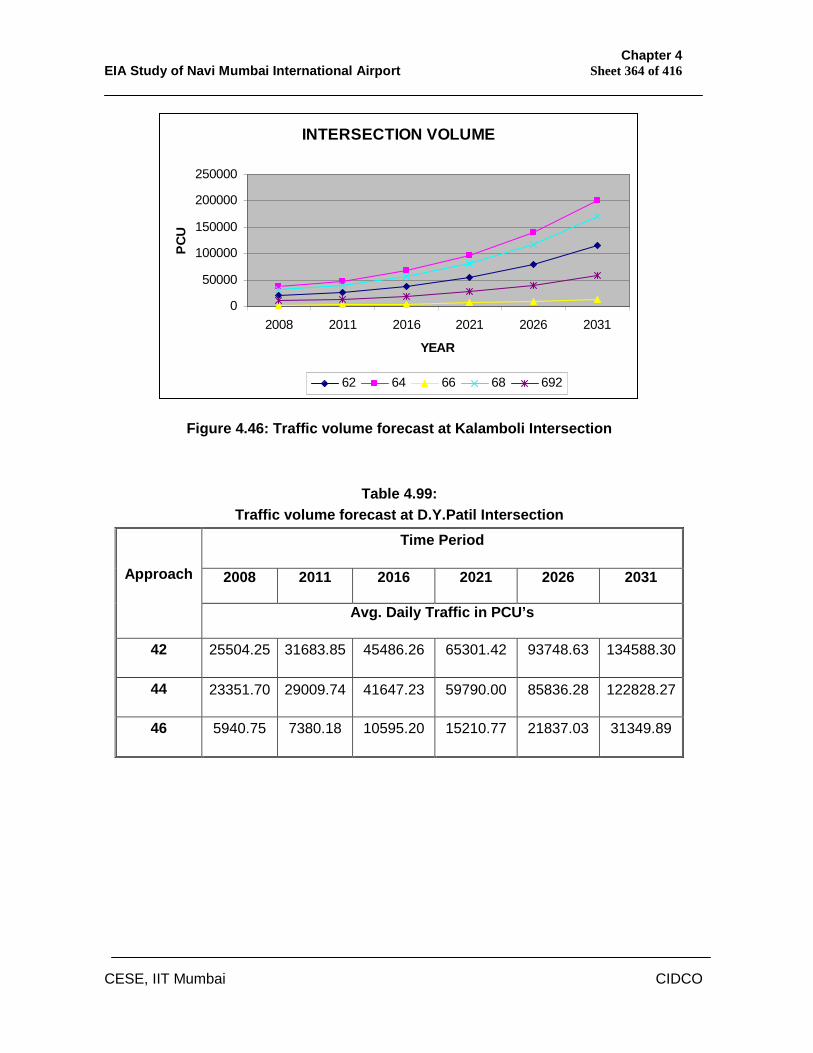
Chapter 4 EIA Study of Navi Mumbai International Airport Sheet 364 of 416
CESE, IIT Mumbai CIDCO
INTERSECTION VOLUME
0
50000
100000
150000
200000
250000
2008 2011 2016 2021 2026 2031
YEAR
PCU
62 64 66 68 692
Figure 4.46: Traffic volume forecast at Kalamboli Intersection
Table 4.99: Traffic volume forecast at D.Y.Patil Intersection
Time Period
2008 2011 2016 2021 2026 2031 Approach
Avg. Daily Traffic in PCU’s
42 25504.25 31683.85 45486.26 65301.42 93748.63 134588.30
44 23351.70 29009.74 41647.23 59790.00 85836.28 122828.27
46 5940.75 7380.18 10595.20 15210.77 21837.03 31349.89
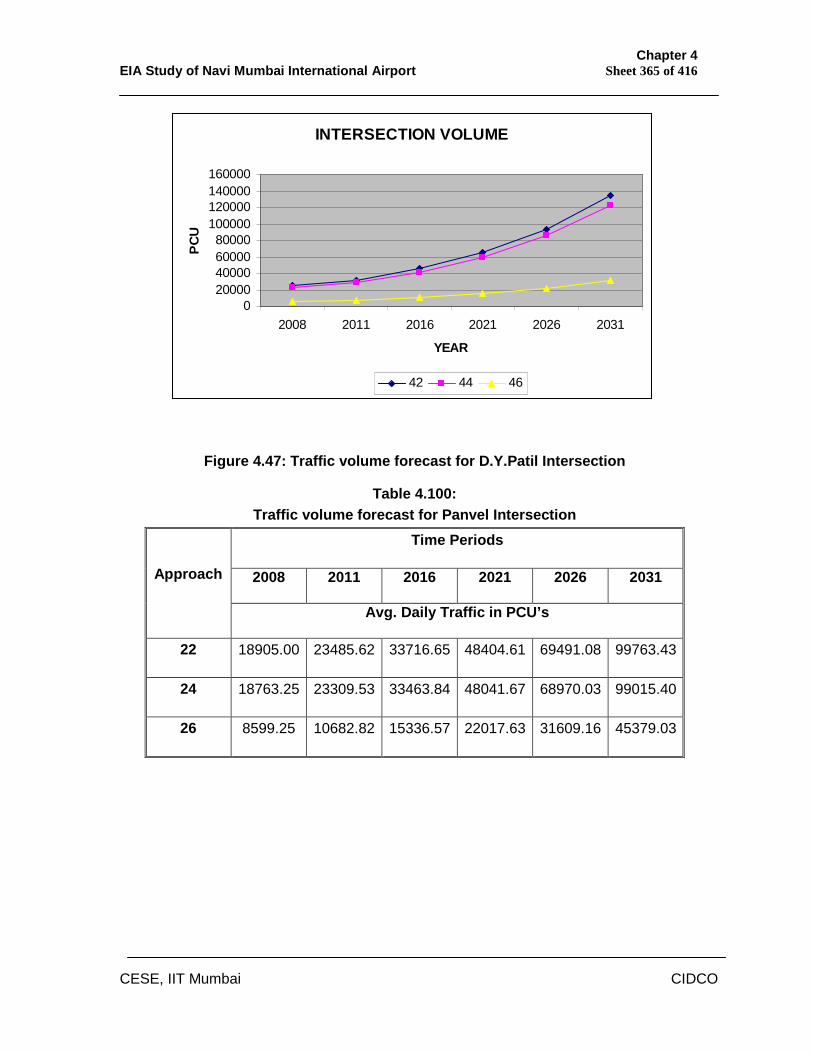
Chapter 4 EIA Study of Navi Mumbai International Airport Sheet 365 of 416
CESE, IIT Mumbai CIDCO
INTERSECTION VOLUME
020000400006000080000
100000120000140000160000
2008 2011 2016 2021 2026 2031
YEAR
PCU
42 44 46
Figure 4.47: Traffic volume forecast for D.Y.Patil Intersection
Table 4.100: Traffic volume forecast for Panvel Intersection
Time Periods
2008 2011 2016 2021 2026 2031 Approach
Avg. Daily Traffic in PCU’s
22 18905.00 23485.62 33716.65 48404.61 69491.08 99763.43
24 18763.25 23309.53 33463.84 48041.67 68970.03 99015.40
26 8599.25 10682.82 15336.57 22017.63 31609.16 45379.03
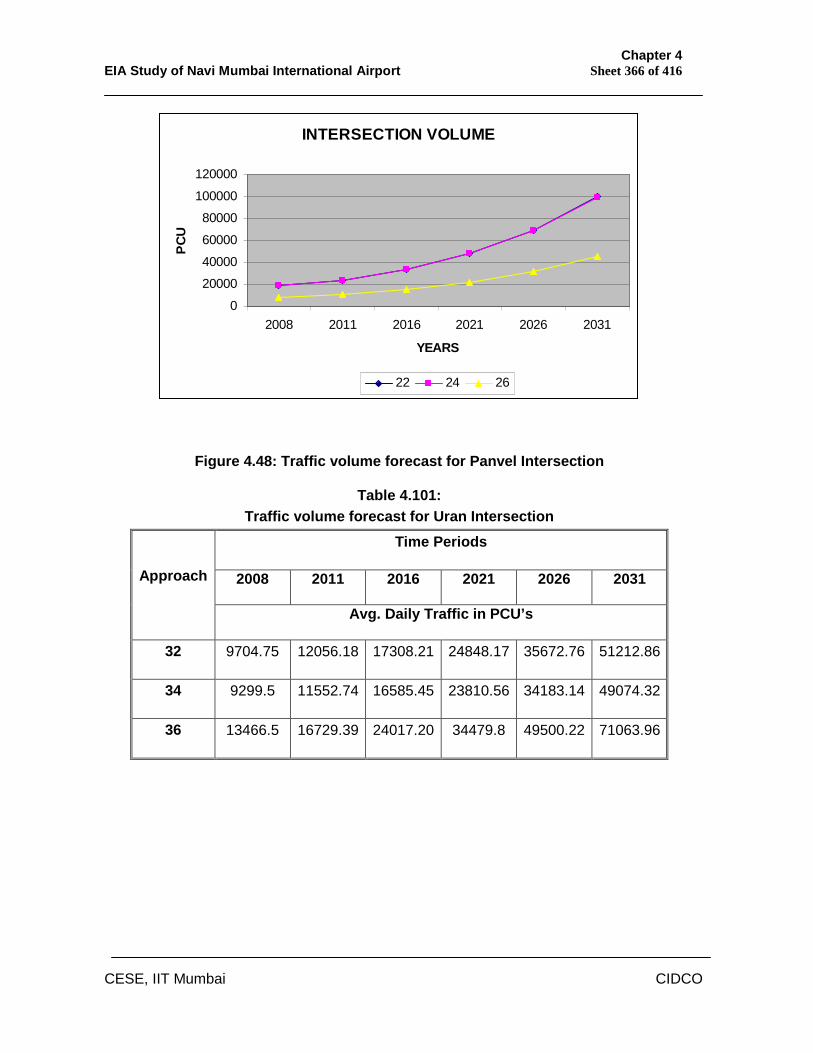
Chapter 4 EIA Study of Navi Mumbai International Airport Sheet 366 of 416
CESE, IIT Mumbai CIDCO
INTERSECTION VOLUME
0
20000
40000
60000
80000
100000
120000
2008 2011 2016 2021 2026 2031
YEARS
PCU
22 24 26
Figure 4.48: Traffic volume forecast for Panvel Intersection
Table 4.101: Traffic volume forecast for Uran Intersection
Time Periods
2008 2011 2016 2021 2026 2031 Approach
Avg. Daily Traffic in PCU’s
32 9704.75 12056.18 17308.21 24848.17 35672.76 51212.86
34 9299.5 11552.74 16585.45 23810.56 34183.14 49074.32
36 13466.5 16729.39 24017.20 34479.8 49500.22 71063.96
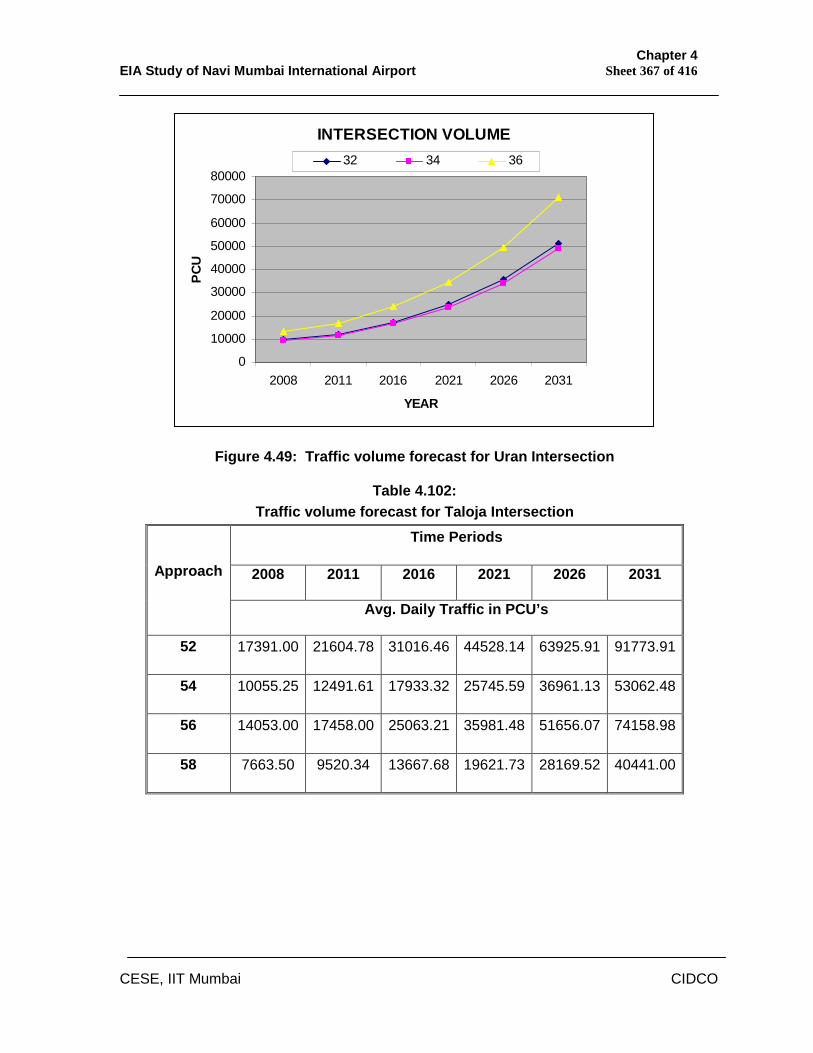
Chapter 4 EIA Study of Navi Mumbai International Airport Sheet 367 of 416
CESE, IIT Mumbai CIDCO
INTERSECTION VOLUME
0
10000
20000
30000
40000
50000
60000
70000
80000
2008 2011 2016 2021 2026 2031
YEAR
PCU
32 34 36
Figure 4.49: Traffic volume forecast for Uran Intersection
Table 4.102: Traffic volume forecast for Taloja Intersection
Time Periods
2008 2011 2016 2021 2026 2031 Approach
Avg. Daily Traffic in PCU’s
52 17391.00 21604.78 31016.46 44528.14 63925.91 91773.91
54 10055.25 12491.61 17933.32 25745.59 36961.13 53062.48
56 14053.00 17458.00 25063.21 35981.48 51656.07 74158.98
58 7663.50 9520.34 13667.68 19621.73 28169.52 40441.00
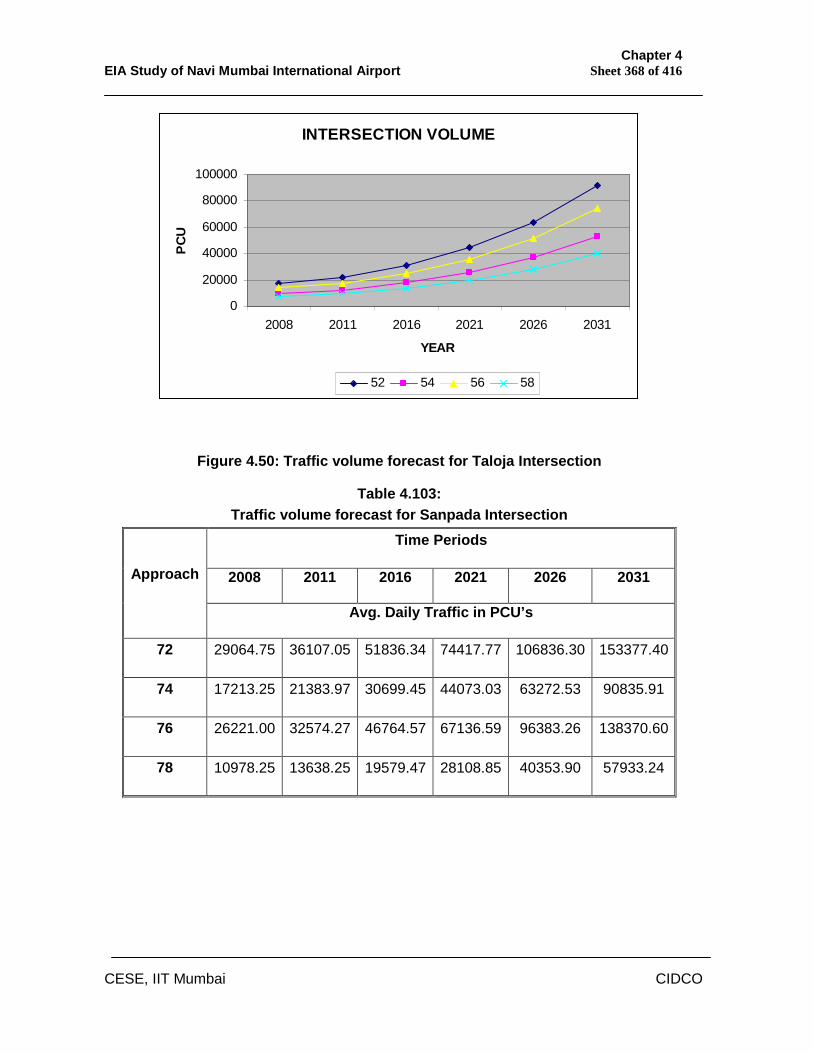
Chapter 4 EIA Study of Navi Mumbai International Airport Sheet 368 of 416
CESE, IIT Mumbai CIDCO
INTERSECTION VOLUME
0
20000
40000
60000
80000
100000
2008 2011 2016 2021 2026 2031
YEAR
PCU
52 54 56 58
Figure 4.50: Traffic volume forecast for Taloja Intersection
Table 4.103: Traffic volume forecast for Sanpada Intersection
Time Periods
2008 2011 2016 2021 2026 2031 Approach
Avg. Daily Traffic in PCU’s
72 29064.75 36107.05 51836.34 74417.77 106836.30 153377.40
74 17213.25 21383.97 30699.45 44073.03 63272.53 90835.91
76 26221.00 32574.27 46764.57 67136.59 96383.26 138370.60
78 10978.25 13638.25 19579.47 28108.85 40353.90 57933.24
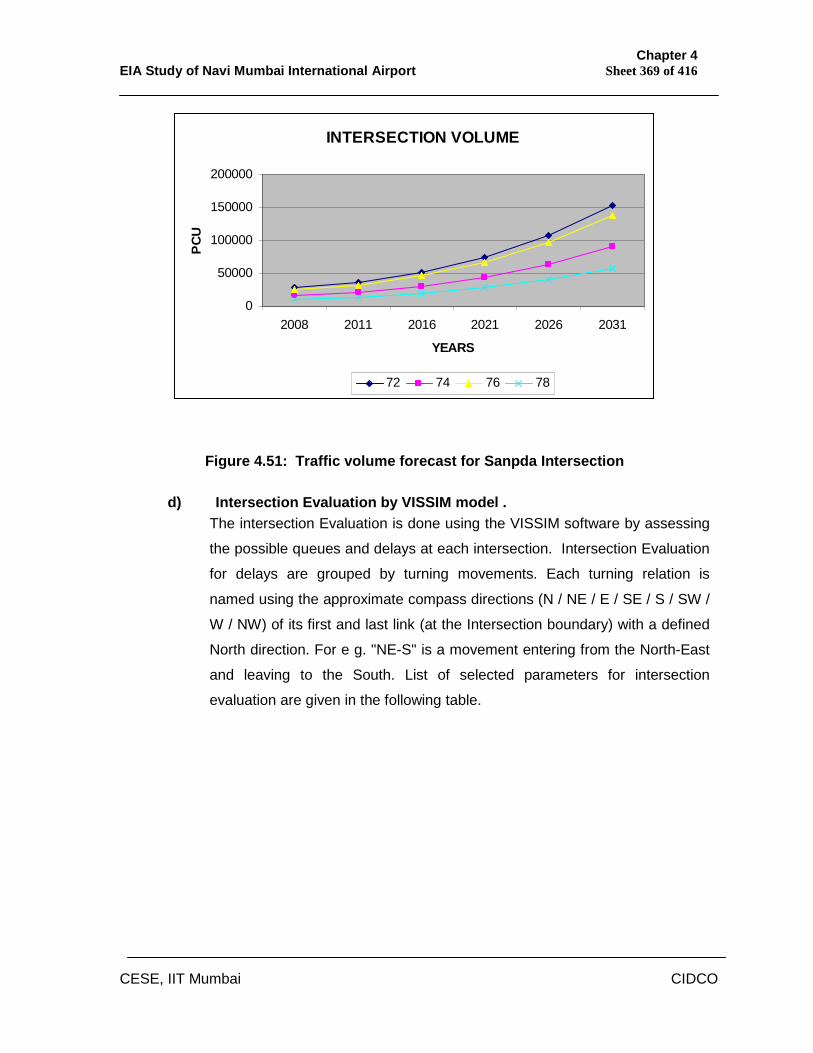
Chapter 4 EIA Study of Navi Mumbai International Airport Sheet 369 of 416
CESE, IIT Mumbai CIDCO
INTERSECTION VOLUME
0
50000
100000
150000
200000
2008 2011 2016 2021 2026 2031
YEARS
PCU
72 74 76 78
Figure 4.51: Traffic volume forecast for Sanpda Intersection
d) Intersection Evaluation by VISSIM model . The intersection Evaluation is done using the VISSIM software by assessing
the possible queues and delays at each intersection. Intersection Evaluation
for delays are grouped by turning movements. Each turning relation is
named using the approximate compass directions (N / NE / E / SE / S / SW /
W / NW) of its first and last link (at the Intersection boundary) with a defined
North direction. For e g. "NE-S" is a movement entering from the North-East
and leaving to the South. List of selected parameters for intersection
evaluation are given in the following table.
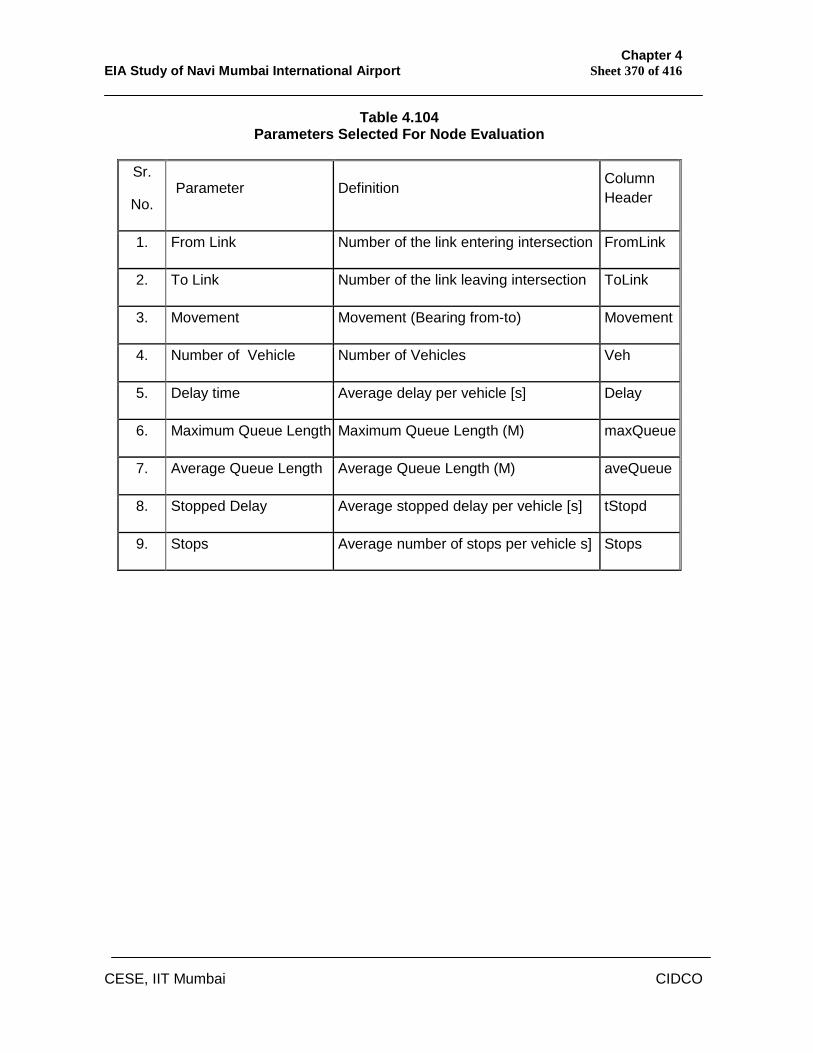
Chapter 4 EIA Study of Navi Mumbai International Airport Sheet 370 of 416
CESE, IIT Mumbai CIDCO
Table 4.104 Parameters Selected For Node Evaluation
Sr.
No. Parameter Definition Column
Header
1. From Link Number of the link entering intersection FromLink
2. To Link Number of the link leaving intersection ToLink
3. Movement Movement (Bearing from-to) Movement
4. Number of Vehicle Number of Vehicles Veh
5. Delay time Average delay per vehicle [s] Delay
6. Maximum Queue Length Maximum Queue Length (M) maxQueue
7. Average Queue Length Average Queue Length (M) aveQueue
8. Stopped Delay Average stopped delay per vehicle [s] tStopd
9. Stops Average number of stops per vehicle s] Stops
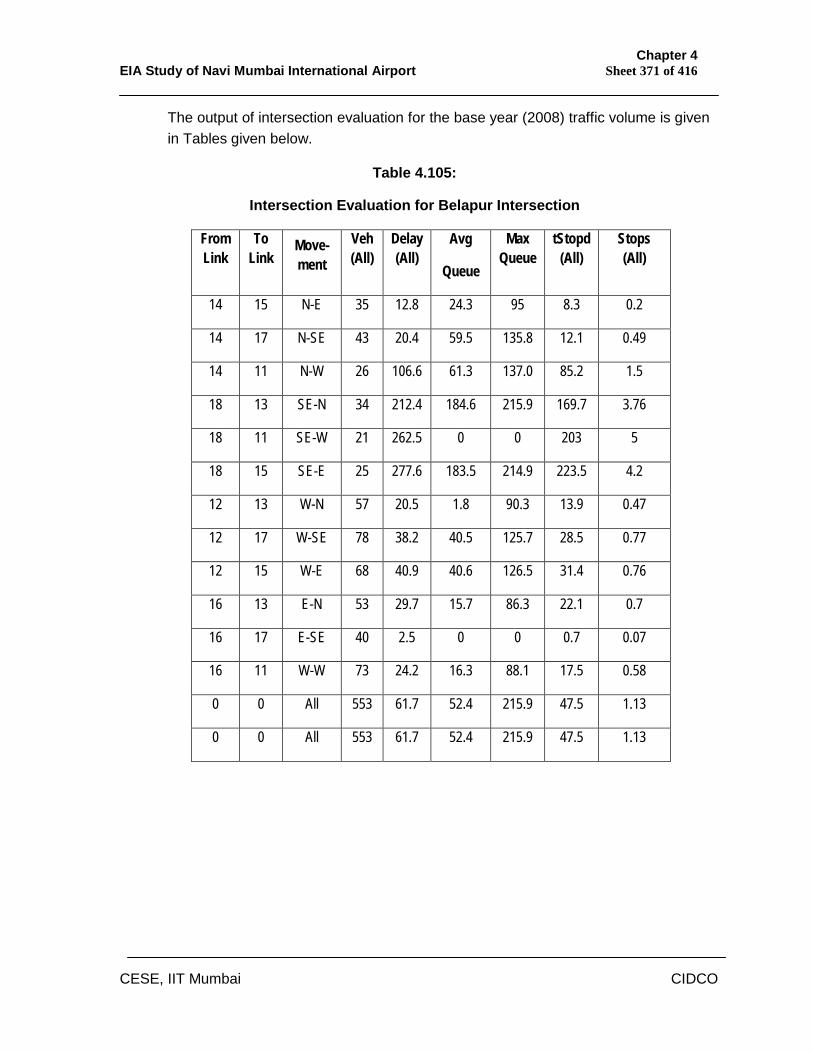
Chapter 4 EIA Study of Navi Mumbai International Airport Sheet 371 of 416
CESE, IIT Mumbai CIDCO
The output of intersection evaluation for the base year (2008) traffic volume is given in Tables given below.
Table 4.105:
Intersection Evaluation for Belapur Intersection
From Link
To Link
Move-ment
Veh (All)
Delay (All)
Avg
Queue
Max Queue
tStopd (All)
Stops (All)
14 15 N-E 35 12.8 24.3 95 8.3 0.2
14 17 N-SE 43 20.4 59.5 135.8 12.1 0.49
14 11 N-W 26 106.6 61.3 137.0 85.2 1.5
18 13 SE-N 34 212.4 184.6 215.9 169.7 3.76
18 11 SE-W 21 262.5 0 0 203 5
18 15 SE-E 25 277.6 183.5 214.9 223.5 4.2
12 13 W-N 57 20.5 1.8 90.3 13.9 0.47
12 17 W-SE 78 38.2 40.5 125.7 28.5 0.77
12 15 W-E 68 40.9 40.6 126.5 31.4 0.76
16 13 E-N 53 29.7 15.7 86.3 22.1 0.7
16 17 E-SE 40 2.5 0 0 0.7 0.07
16 11 W-W 73 24.2 16.3 88.1 17.5 0.58
0 0 All 553 61.7 52.4 215.9 47.5 1.13
0 0 All 553 61.7 52.4 215.9 47.5 1.13
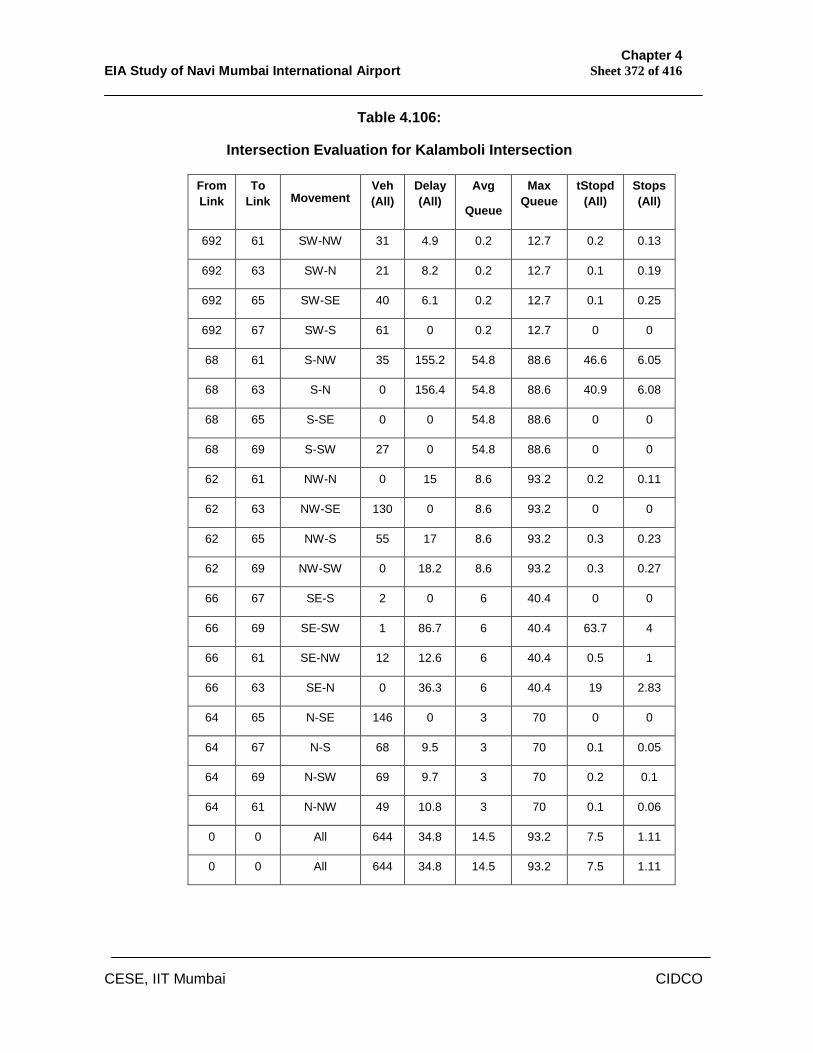
Chapter 4 EIA Study of Navi Mumbai International Airport Sheet 372 of 416
CESE, IIT Mumbai CIDCO
Table 4.106:
Intersection Evaluation for Kalamboli Intersection
From Link
To Link Movement
Veh (All)
Delay (All)
Avg
Queue
Max Queue
tStopd (All)
Stops (All)
692 61 SW-NW 31 4.9 0.2 12.7 0.2 0.13
692 63 SW-N 21 8.2 0.2 12.7 0.1 0.19
692 65 SW-SE 40 6.1 0.2 12.7 0.1 0.25
692 67 SW-S 61 0 0.2 12.7 0 0
68 61 S-NW 35 155.2 54.8 88.6 46.6 6.05
68 63 S-N 0 156.4 54.8 88.6 40.9 6.08
68 65 S-SE 0 0 54.8 88.6 0 0
68 69 S-SW 27 0 54.8 88.6 0 0
62 61 NW-N 0 15 8.6 93.2 0.2 0.11
62 63 NW-SE 130 0 8.6 93.2 0 0
62 65 NW-S 55 17 8.6 93.2 0.3 0.23
62 69 NW-SW 0 18.2 8.6 93.2 0.3 0.27
66 67 SE-S 2 0 6 40.4 0 0
66 69 SE-SW 1 86.7 6 40.4 63.7 4
66 61 SE-NW 12 12.6 6 40.4 0.5 1
66 63 SE-N 0 36.3 6 40.4 19 2.83
64 65 N-SE 146 0 3 70 0 0
64 67 N-S 68 9.5 3 70 0.1 0.05
64 69 N-SW 69 9.7 3 70 0.2 0.1
64 61 N-NW 49 10.8 3 70 0.1 0.06
0 0 All 644 34.8 14.5 93.2 7.5 1.11
0 0 All 644 34.8 14.5 93.2 7.5 1.11
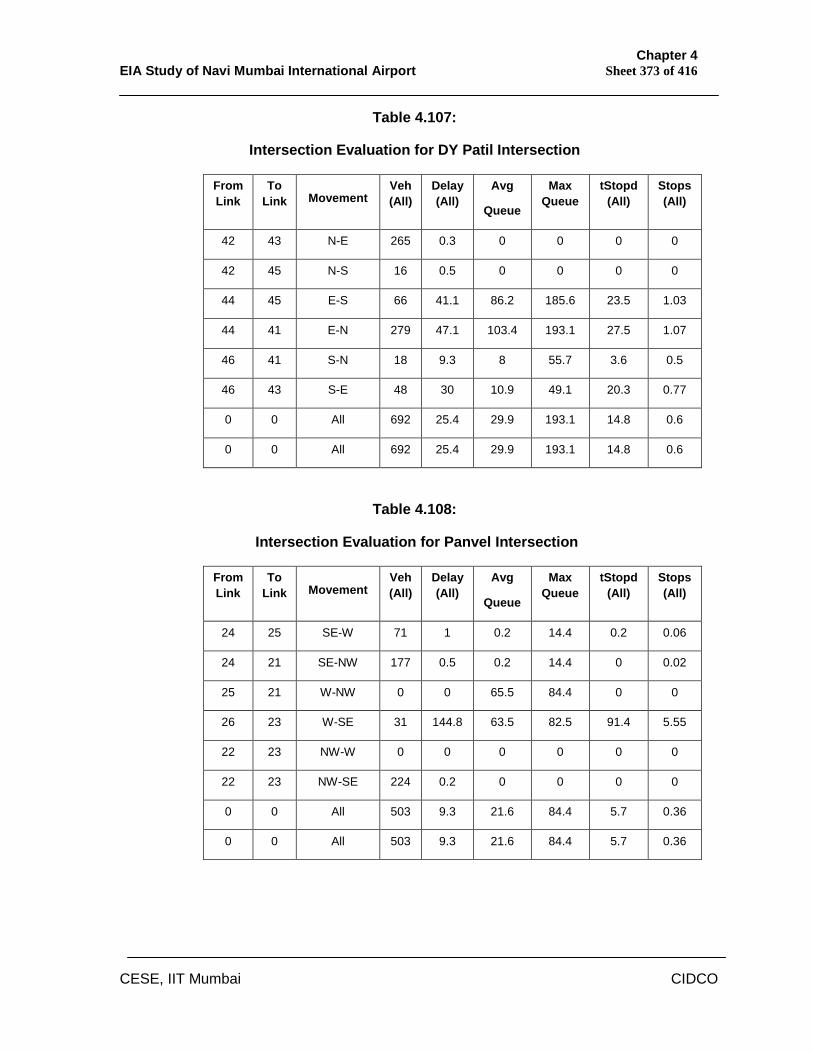
Chapter 4 EIA Study of Navi Mumbai International Airport Sheet 373 of 416
CESE, IIT Mumbai CIDCO
Table 4.107:
Intersection Evaluation for DY Patil Intersection
From Link
To Link Movement
Veh (All)
Delay (All)
Avg
Queue
Max Queue
tStopd (All)
Stops (All)
42 43 N-E 265 0.3 0 0 0 0
42 45 N-S 16 0.5 0 0 0 0
44 45 E-S 66 41.1 86.2 185.6 23.5 1.03
44 41 E-N 279 47.1 103.4 193.1 27.5 1.07
46 41 S-N 18 9.3 8 55.7 3.6 0.5
46 43 S-E 48 30 10.9 49.1 20.3 0.77
0 0 All 692 25.4 29.9 193.1 14.8 0.6
0 0 All 692 25.4 29.9 193.1 14.8 0.6
Table 4.108:
Intersection Evaluation for Panvel Intersection
From Link
To Link Movement
Veh (All)
Delay (All)
Avg
Queue
Max Queue
tStopd (All)
Stops (All)
24 25 SE-W 71 1 0.2 14.4 0.2 0.06
24 21 SE-NW 177 0.5 0.2 14.4 0 0.02
25 21 W-NW 0 0 65.5 84.4 0 0
26 23 W-SE 31 144.8 63.5 82.5 91.4 5.55
22 23 NW-W 0 0 0 0 0 0
22 23 NW-SE 224 0.2 0 0 0 0
0 0 All 503 9.3 21.6 84.4 5.7 0.36
0 0 All 503 9.3 21.6 84.4 5.7 0.36
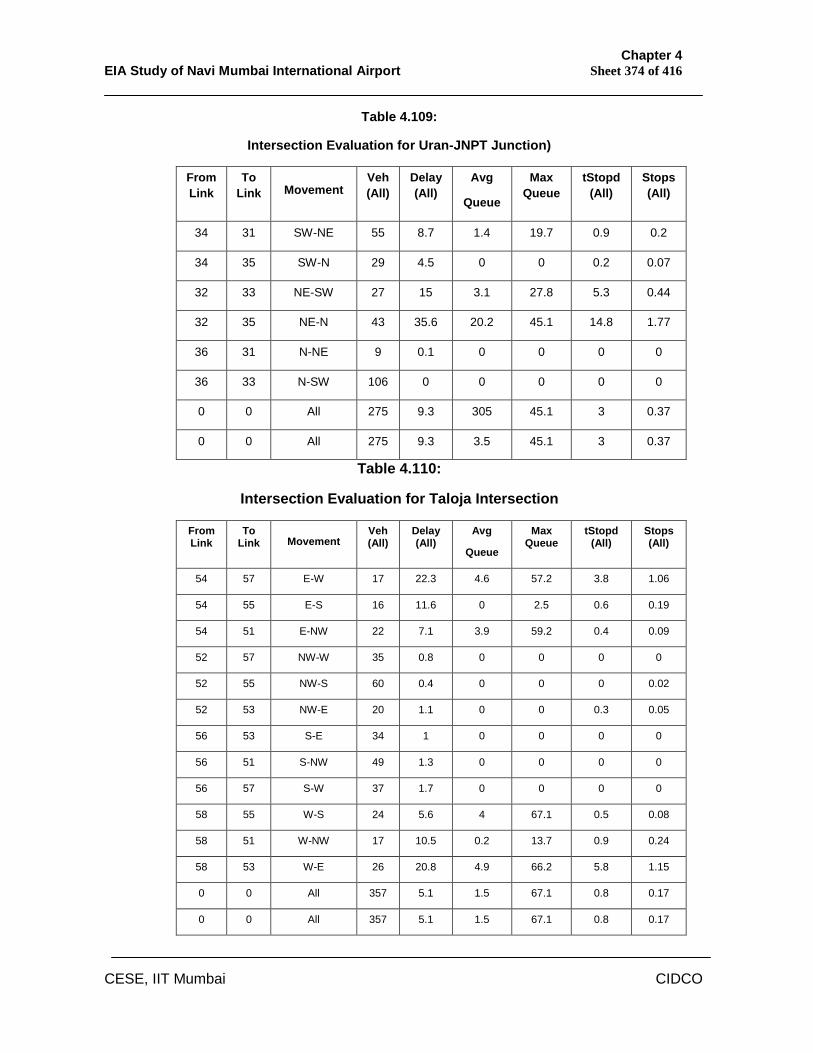
Chapter 4 EIA Study of Navi Mumbai International Airport Sheet 374 of 416
CESE, IIT Mumbai CIDCO
Table 4.109:
Intersection Evaluation for Uran-JNPT Junction)
From Link
To Link Movement
Veh (All)
Delay (All)
Avg
Queue
Max Queue
tStopd (All)
Stops (All)
34 31 SW-NE 55 8.7 1.4 19.7 0.9 0.2
34 35 SW-N 29 4.5 0 0 0.2 0.07
32 33 NE-SW 27 15 3.1 27.8 5.3 0.44
32 35 NE-N 43 35.6 20.2 45.1 14.8 1.77
36 31 N-NE 9 0.1 0 0 0 0
36 33 N-SW 106 0 0 0 0 0
0 0 All 275 9.3 305 45.1 3 0.37
0 0 All 275 9.3 3.5 45.1 3 0.37
Table 4.110:
Intersection Evaluation for Taloja Intersection
From Link
To Link Movement
Veh (All)
Delay (All)
Avg
Queue
Max Queue
tStopd (All)
Stops (All)
54 57 E-W 17 22.3 4.6 57.2 3.8 1.06
54 55 E-S 16 11.6 0 2.5 0.6 0.19
54 51 E-NW 22 7.1 3.9 59.2 0.4 0.09
52 57 NW-W 35 0.8 0 0 0 0
52 55 NW-S 60 0.4 0 0 0 0.02
52 53 NW-E 20 1.1 0 0 0.3 0.05
56 53 S-E 34 1 0 0 0 0
56 51 S-NW 49 1.3 0 0 0 0
56 57 S-W 37 1.7 0 0 0 0
58 55 W-S 24 5.6 4 67.1 0.5 0.08
58 51 W-NW 17 10.5 0.2 13.7 0.9 0.24
58 53 W-E 26 20.8 4.9 66.2 5.8 1.15
0 0 All 357 5.1 1.5 67.1 0.8 0.17
0 0 All 357 5.1 1.5 67.1 0.8 0.17
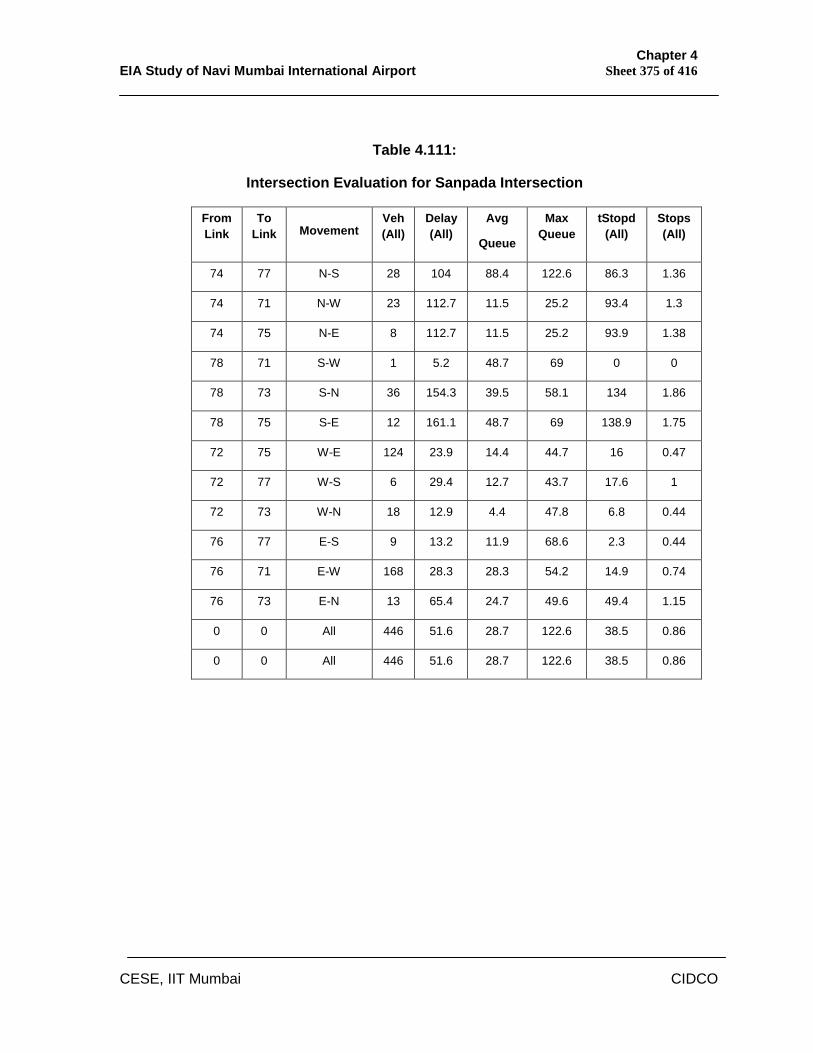
Chapter 4 EIA Study of Navi Mumbai International Airport Sheet 375 of 416
CESE, IIT Mumbai CIDCO
Table 4.111:
Intersection Evaluation for Sanpada Intersection
From Link
To Link Movement
Veh (All)
Delay (All)
Avg
Queue
Max Queue
tStopd (All)
Stops (All)
74 77 N-S 28 104 88.4 122.6 86.3 1.36
74 71 N-W 23 112.7 11.5 25.2 93.4 1.3
74 75 N-E 8 112.7 11.5 25.2 93.9 1.38
78 71 S-W 1 5.2 48.7 69 0 0
78 73 S-N 36 154.3 39.5 58.1 134 1.86
78 75 S-E 12 161.1 48.7 69 138.9 1.75
72 75 W-E 124 23.9 14.4 44.7 16 0.47
72 77 W-S 6 29.4 12.7 43.7 17.6 1
72 73 W-N 18 12.9 4.4 47.8 6.8 0.44
76 77 E-S 9 13.2 11.9 68.6 2.3 0.44
76 71 E-W 168 28.3 28.3 54.2 14.9 0.74
76 73 E-N 13 65.4 24.7 49.6 49.4 1.15
0 0 All 446 51.6 28.7 122.6 38.5 0.86
0 0 All 446 51.6 28.7 122.6 38.5 0.86
Chapter 4 EIA Study of Navi Mumbai International Airport Sheet 376 of 416
CESE, IIT Mumbai CIDCO
The result of intersection analysis using the VISSIM model identify the four
intersections ie Belapur, Kalamboli, D.Y.Patil, Sanpada and experiencing
traffic delays, queue length with the existing traffic and the same is
expected to increase in future. Keeping this in view these junctions were
further analysed using volume and capacity (V/C) analysis with future
proposals of intersection improvements, signalization, provision of flyovers
and grade separators.
4.14.11 Intersection Evaluation by V/C Ratio
The ratio of traffic volume to capacity (v/c ratio) used as a standard to
measure performance of transportation operations. The measure applied to
highway segments, intersections, and/or a series of intersections. The level
of service (LOS) is a qualitative indicator for the operational condition of
different traffic stream and V/C ratio is an indirect indicator for representing
the LOS. Six level of service has been designed commonly from A to F with
respect to various traffic conditions. In which LOS A represents the free flow
condition and F represent the force flow with jam conditions. In urban area
LOS C is acceptable however in case it goes beyond this then suitable
mitigation measures needs to be adopted for reducing the congestion at
approach roads and at the junctions. Mitigation is normally required for any
intersection with a projected V/C ratio of greater than 0.85, and the
mitigation strategy should reduce the V/C ratio to 0.85 or lower.
The Volume to Capacity (V/C) ratio’s at three critical intersections falling
within 5km of airport boundary ie Belapur, Kalamboli, and D.Y.Patil has
been calculated for existing, projected traffic with the existing configuration
of intersections, proposals of intersection improvements, signalization,
provision of flyovers and grade separators respectively during the horizon
year for the various arms of the intersection as and the same is shown in
the following tables.
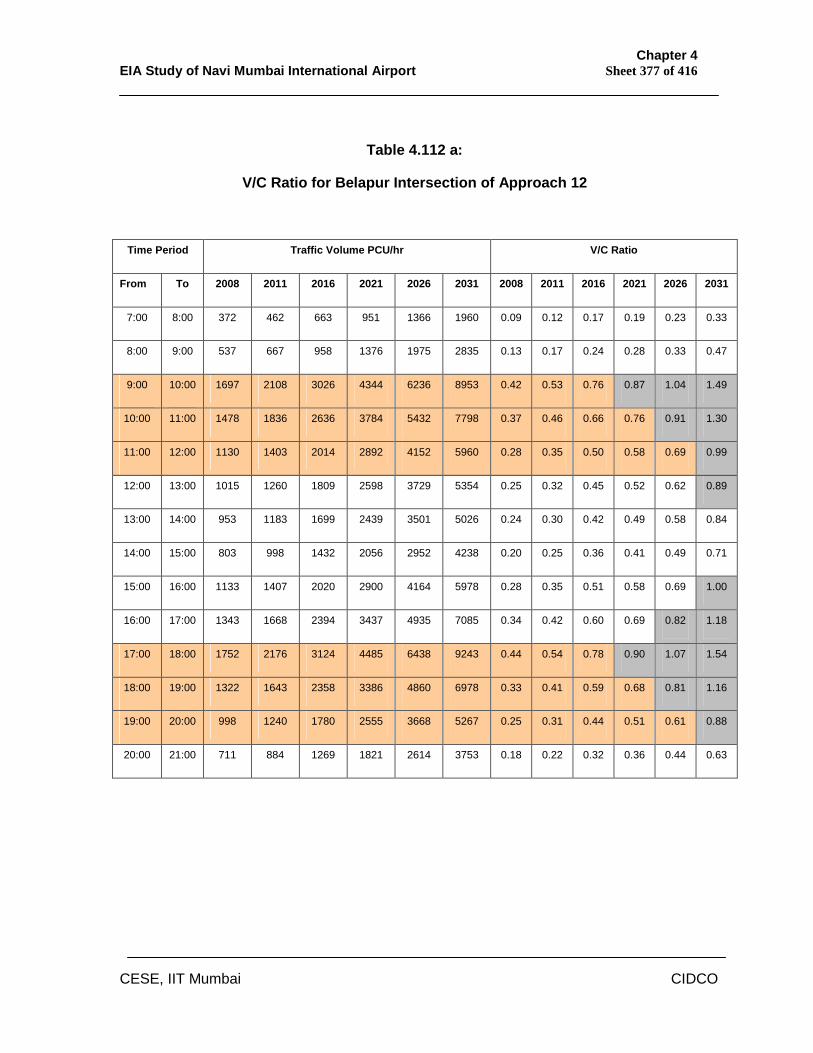
Chapter 4 EIA Study of Navi Mumbai International Airport Sheet 377 of 416
CESE, IIT Mumbai CIDCO
Table 4.112 a:
V/C Ratio for Belapur Intersection of Approach 12
Time Period Traffic Volume PCU/hr V/C Ratio
From To 2008 2011 2016 2021 2026 2031 2008 2011 2016 2021 2026 2031
7:00 8:00 372 462 663 951 1366 1960 0.09 0.12 0.17 0.19 0.23 0.33
8:00 9:00 537 667 958 1376 1975 2835 0.13 0.17 0.24 0.28 0.33 0.47
9:00 10:00 1697 2108 3026 4344 6236 8953 0.42 0.53 0.76 0.87 1.04 1.49
10:00 11:00 1478 1836 2636 3784 5432 7798 0.37 0.46 0.66 0.76 0.91 1.30
11:00 12:00 1130 1403 2014 2892 4152 5960 0.28 0.35 0.50 0.58 0.69 0.99
12:00 13:00 1015 1260 1809 2598 3729 5354 0.25 0.32 0.45 0.52 0.62 0.89
13:00 14:00 953 1183 1699 2439 3501 5026 0.24 0.30 0.42 0.49 0.58 0.84
14:00 15:00 803 998 1432 2056 2952 4238 0.20 0.25 0.36 0.41 0.49 0.71
15:00 16:00 1133 1407 2020 2900 4164 5978 0.28 0.35 0.51 0.58 0.69 1.00
16:00 17:00 1343 1668 2394 3437 4935 7085 0.34 0.42 0.60 0.69 0.82 1.18
17:00 18:00 1752 2176 3124 4485 6438 9243 0.44 0.54 0.78 0.90 1.07 1.54
18:00 19:00 1322 1643 2358 3386 4860 6978 0.33 0.41 0.59 0.68 0.81 1.16
19:00 20:00 998 1240 1780 2555 3668 5267 0.25 0.31 0.44 0.51 0.61 0.88
20:00 21:00 711 884 1269 1821 2614 3753 0.18 0.22 0.32 0.36 0.44 0.63
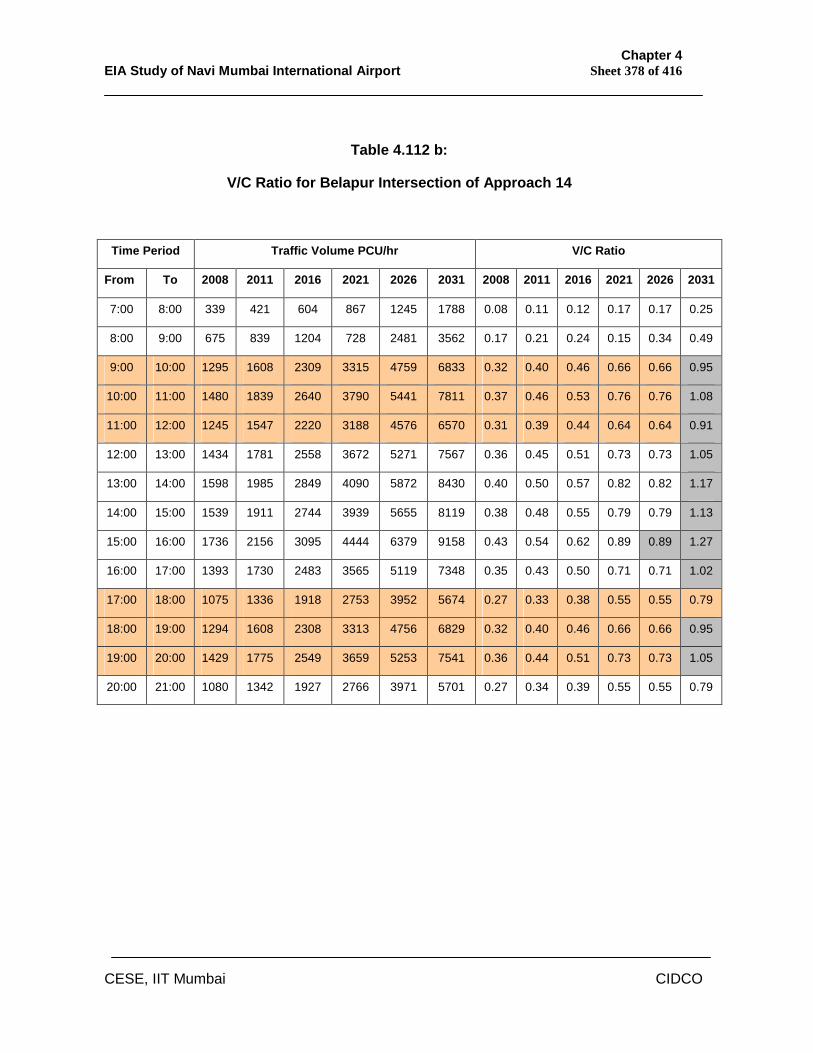
Chapter 4 EIA Study of Navi Mumbai International Airport Sheet 378 of 416
CESE, IIT Mumbai CIDCO
Table 4.112 b:
V/C Ratio for Belapur Intersection of Approach 14
Time Period Traffic Volume PCU/hr V/C Ratio
From To 2008 2011 2016 2021 2026 2031 2008 2011 2016 2021 2026 2031
7:00 8:00 339 421 604 867 1245 1788 0.08 0.11 0.12 0.17 0.17 0.25
8:00 9:00 675 839 1204 728 2481 3562 0.17 0.21 0.24 0.15 0.34 0.49
9:00 10:00 1295 1608 2309 3315 4759 6833 0.32 0.40 0.46 0.66 0.66 0.95
10:00 11:00 1480 1839 2640 3790 5441 7811 0.37 0.46 0.53 0.76 0.76 1.08
11:00 12:00 1245 1547 2220 3188 4576 6570 0.31 0.39 0.44 0.64 0.64 0.91
12:00 13:00 1434 1781 2558 3672 5271 7567 0.36 0.45 0.51 0.73 0.73 1.05
13:00 14:00 1598 1985 2849 4090 5872 8430 0.40 0.50 0.57 0.82 0.82 1.17
14:00 15:00 1539 1911 2744 3939 5655 8119 0.38 0.48 0.55 0.79 0.79 1.13
15:00 16:00 1736 2156 3095 4444 6379 9158 0.43 0.54 0.62 0.89 0.89 1.27
16:00 17:00 1393 1730 2483 3565 5119 7348 0.35 0.43 0.50 0.71 0.71 1.02
17:00 18:00 1075 1336 1918 2753 3952 5674 0.27 0.33 0.38 0.55 0.55 0.79
18:00 19:00 1294 1608 2308 3313 4756 6829 0.32 0.40 0.46 0.66 0.66 0.95
19:00 20:00 1429 1775 2549 3659 5253 7541 0.36 0.44 0.51 0.73 0.73 1.05
20:00 21:00 1080 1342 1927 2766 3971 5701 0.27 0.34 0.39 0.55 0.55 0.79

Chapter 4 EIA Study of Navi Mumbai International Airport Sheet 379 of 416
CESE, IIT Mumbai CIDCO
Table 4.112 c:
V/C Ratio for Belapur Intersection of Approach 16
Time Period Traffic Volume PCU/hr V/C Ratio
From To 2008 2011 2016 2021 2026 2031 2008 2011 2016 2021 2026 2031
7:00 8:00 306 380 546 784 1126 1616 0.10 0.13 0.15 0.16 0.23 0.34
8:00 9:00 611 759 1090 1565 2247 3226 0.20 0.25 0.30 0.33 0.47 0.67
9:00 10:00 696 864 1240 1781 2557 3670 0.23 0.29 0.34 0.37 0.53 0.76
10:00 11:00 821 1019 1463 2101 3016 4330 0.27 0.34 0.41 0.44 0.63 0.90
11:00 12:00 968 1203 1726 2478 3558 5108 0.32 0.40 0.48 0.52 0.74 1.06
12:00 13:00 984 1222 1754 2518 3615 5190 0.33 0.41 0.49 0.52 0.75 1.08
13:00 14:00 638 1165 1672 2401 3447 4949 0.21 0.39 0.46 0.50 0.72 1.03
14:00 15:00 845 1050 1507 2164 3106 4459 0.28 0.35 0.42 0.45 0.65 0.93
15:00 16:00 803 998 1433 2057 2953 4239 0.27 0.33 0.40 0.43 0.62 0.88
16:00 17:00 1070 1329 1908 2740 3933 5646 0.36 0.44 0.53 0.57 0.82 1.18
17:00 18:00 1291 1603 2302 3305 4745 6811 0.43 0.53 0.64 0.69 0.99 1.42
18:00 19:00 1727 2145 3079 4421 6346 9111 0.58 0.71 0.86 0.92 1.32 1.90
19:00 20:00 1747 2170 3116 4473 6422 9219 0.58 0.72 0.87 0.93 1.34 1.92
20:00 21:00 1203 1494 2145 3079 4420 6346 0.40 0.50 0.60 0.64 0.92 1.32
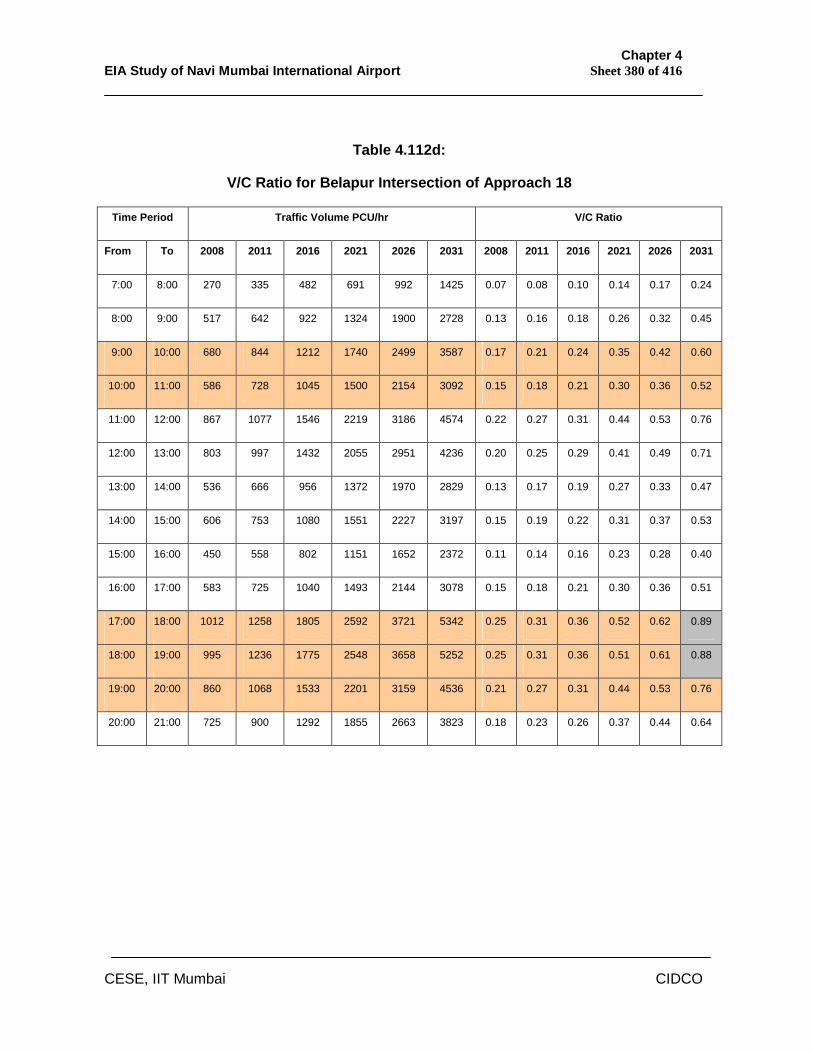
Chapter 4 EIA Study of Navi Mumbai International Airport Sheet 380 of 416
CESE, IIT Mumbai CIDCO
Table 4.112d:
V/C Ratio for Belapur Intersection of Approach 18
Time Period Traffic Volume PCU/hr V/C Ratio
From To 2008 2011 2016 2021 2026 2031 2008 2011 2016 2021 2026 2031
7:00 8:00 270 335 482 691 992 1425 0.07 0.08 0.10 0.14 0.17 0.24
8:00 9:00 517 642 922 1324 1900 2728 0.13 0.16 0.18 0.26 0.32 0.45
9:00 10:00 680 844 1212 1740 2499 3587 0.17 0.21 0.24 0.35 0.42 0.60
10:00 11:00 586 728 1045 1500 2154 3092 0.15 0.18 0.21 0.30 0.36 0.52
11:00 12:00 867 1077 1546 2219 3186 4574 0.22 0.27 0.31 0.44 0.53 0.76
12:00 13:00 803 997 1432 2055 2951 4236 0.20 0.25 0.29 0.41 0.49 0.71
13:00 14:00 536 666 956 1372 1970 2829 0.13 0.17 0.19 0.27 0.33 0.47
14:00 15:00 606 753 1080 1551 2227 3197 0.15 0.19 0.22 0.31 0.37 0.53
15:00 16:00 450 558 802 1151 1652 2372 0.11 0.14 0.16 0.23 0.28 0.40
16:00 17:00 583 725 1040 1493 2144 3078 0.15 0.18 0.21 0.30 0.36 0.51
17:00 18:00 1012 1258 1805 2592 3721 5342 0.25 0.31 0.36 0.52 0.62 0.89
18:00 19:00 995 1236 1775 2548 3658 5252 0.25 0.31 0.36 0.51 0.61 0.88
19:00 20:00 860 1068 1533 2201 3159 4536 0.21 0.27 0.31 0.44 0.53 0.76
20:00 21:00 725 900 1292 1855 2663 3823 0.18 0.23 0.26 0.37 0.44 0.64
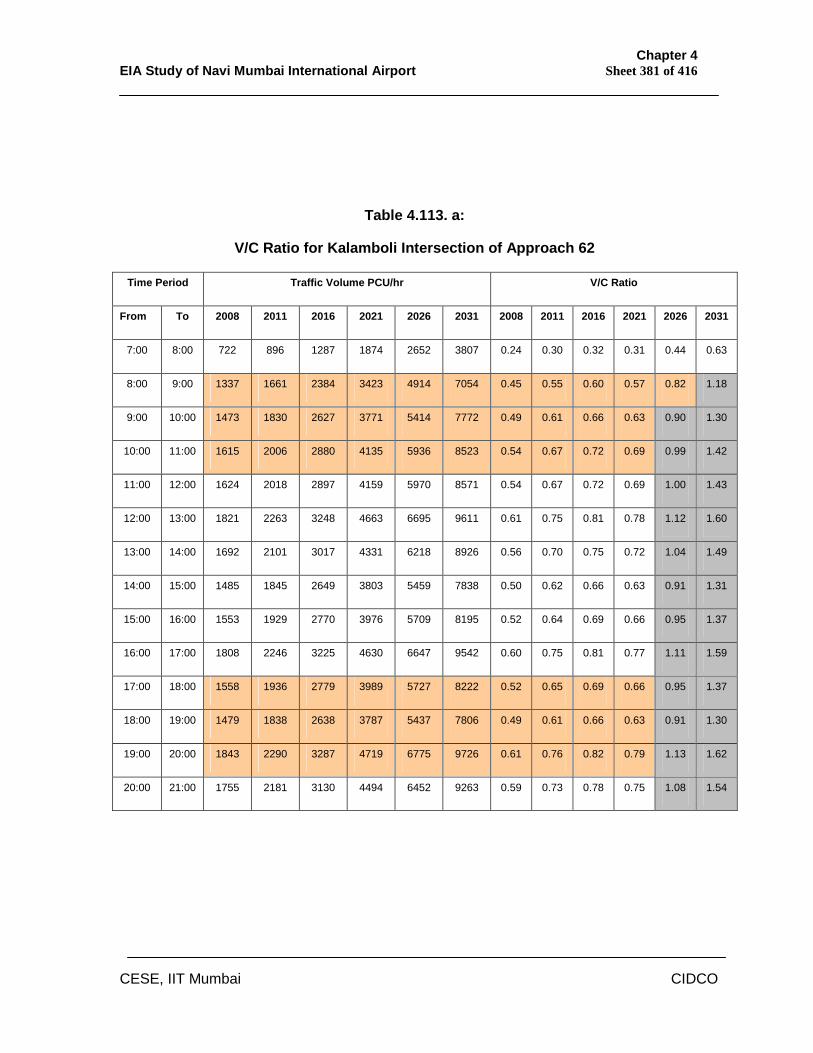
Chapter 4 EIA Study of Navi Mumbai International Airport Sheet 381 of 416
CESE, IIT Mumbai CIDCO
Table 4.113. a:
V/C Ratio for Kalamboli Intersection of Approach 62
Time Period Traffic Volume PCU/hr V/C Ratio
From To 2008 2011 2016 2021 2026 2031 2008 2011 2016 2021 2026 2031
7:00 8:00 722 896 1287 1874 2652 3807 0.24 0.30 0.32 0.31 0.44 0.63
8:00 9:00 1337 1661 2384 3423 4914 7054 0.45 0.55 0.60 0.57 0.82 1.18
9:00 10:00 1473 1830 2627 3771 5414 7772 0.49 0.61 0.66 0.63 0.90 1.30
10:00 11:00 1615 2006 2880 4135 5936 8523 0.54 0.67 0.72 0.69 0.99 1.42
11:00 12:00 1624 2018 2897 4159 5970 8571 0.54 0.67 0.72 0.69 1.00 1.43
12:00 13:00 1821 2263 3248 4663 6695 9611 0.61 0.75 0.81 0.78 1.12 1.60
13:00 14:00 1692 2101 3017 4331 6218 8926 0.56 0.70 0.75 0.72 1.04 1.49
14:00 15:00 1485 1845 2649 3803 5459 7838 0.50 0.62 0.66 0.63 0.91 1.31
15:00 16:00 1553 1929 2770 3976 5709 8195 0.52 0.64 0.69 0.66 0.95 1.37
16:00 17:00 1808 2246 3225 4630 6647 9542 0.60 0.75 0.81 0.77 1.11 1.59
17:00 18:00 1558 1936 2779 3989 5727 8222 0.52 0.65 0.69 0.66 0.95 1.37
18:00 19:00 1479 1838 2638 3787 5437 7806 0.49 0.61 0.66 0.63 0.91 1.30
19:00 20:00 1843 2290 3287 4719 6775 9726 0.61 0.76 0.82 0.79 1.13 1.62
20:00 21:00 1755 2181 3130 4494 6452 9263 0.59 0.73 0.78 0.75 1.08 1.54
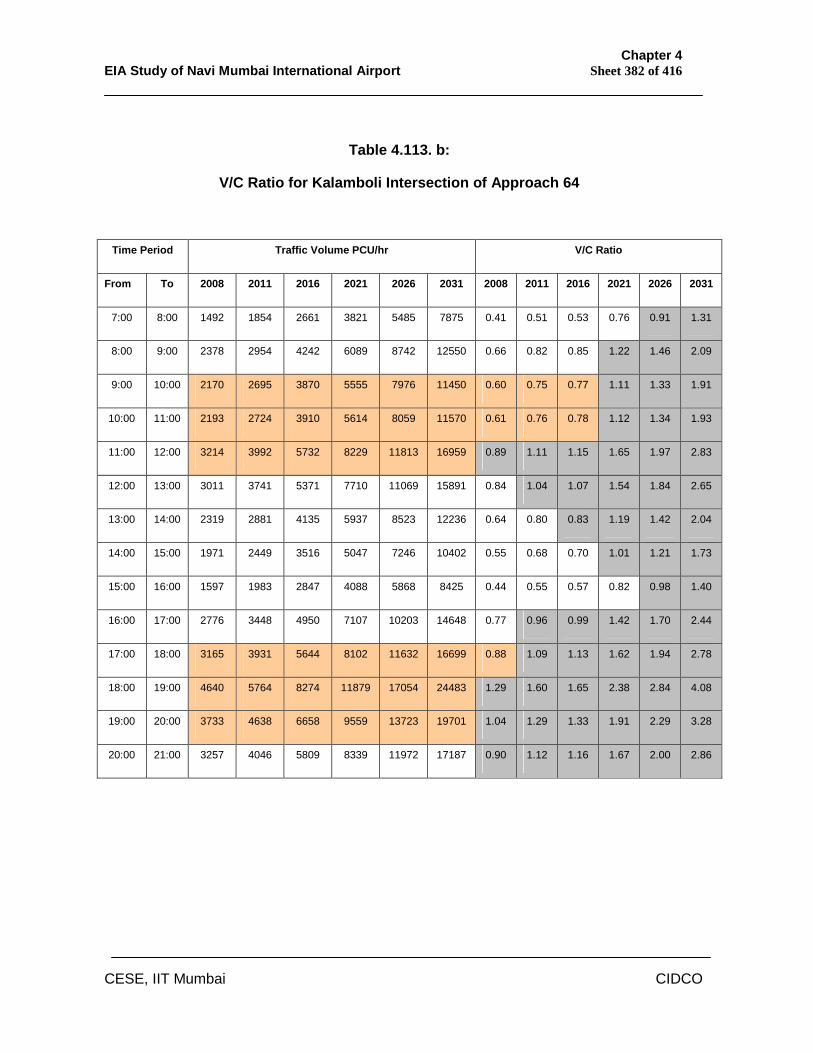
Chapter 4 EIA Study of Navi Mumbai International Airport Sheet 382 of 416
CESE, IIT Mumbai CIDCO
Table 4.113. b:
V/C Ratio for Kalamboli Intersection of Approach 64
Time Period Traffic Volume PCU/hr V/C Ratio
From To 2008 2011 2016 2021 2026 2031 2008 2011 2016 2021 2026 2031
7:00 8:00 1492 1854 2661 3821 5485 7875 0.41 0.51 0.53 0.76 0.91 1.31
8:00 9:00 2378 2954 4242 6089 8742 12550 0.66 0.82 0.85 1.22 1.46 2.09
9:00 10:00 2170 2695 3870 5555 7976 11450 0.60 0.75 0.77 1.11 1.33 1.91
10:00 11:00 2193 2724 3910 5614 8059 11570 0.61 0.76 0.78 1.12 1.34 1.93
11:00 12:00 3214 3992 5732 8229 11813 16959 0.89 1.11 1.15 1.65 1.97 2.83
12:00 13:00 3011 3741 5371 7710 11069 15891 0.84 1.04 1.07 1.54 1.84 2.65
13:00 14:00 2319 2881 4135 5937 8523 12236 0.64 0.80 0.83 1.19 1.42 2.04
14:00 15:00 1971 2449 3516 5047 7246 10402 0.55 0.68 0.70 1.01 1.21 1.73
15:00 16:00 1597 1983 2847 4088 5868 8425 0.44 0.55 0.57 0.82 0.98 1.40
16:00 17:00 2776 3448 4950 7107 10203 14648 0.77 0.96 0.99 1.42 1.70 2.44
17:00 18:00 3165 3931 5644 8102 11632 16699 0.88 1.09 1.13 1.62 1.94 2.78
18:00 19:00 4640 5764 8274 11879 17054 24483 1.29 1.60 1.65 2.38 2.84 4.08
19:00 20:00 3733 4638 6658 9559 13723 19701 1.04 1.29 1.33 1.91 2.29 3.28
20:00 21:00 3257 4046 5809 8339 11972 17187 0.90 1.12 1.16 1.67 2.00 2.86
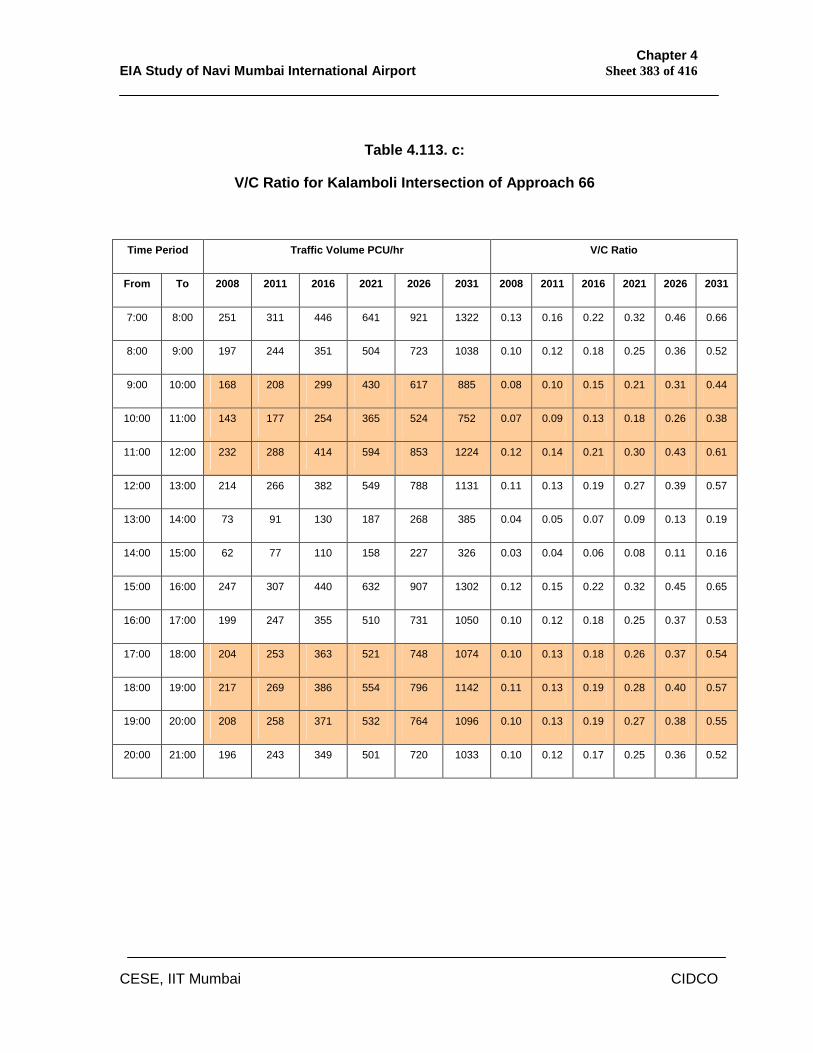
Chapter 4 EIA Study of Navi Mumbai International Airport Sheet 383 of 416
CESE, IIT Mumbai CIDCO
Table 4.113. c:
V/C Ratio for Kalamboli Intersection of Approach 66
Time Period Traffic Volume PCU/hr V/C Ratio
From To 2008 2011 2016 2021 2026 2031 2008 2011 2016 2021 2026 2031
7:00 8:00 251 311 446 641 921 1322 0.13 0.16 0.22 0.32 0.46 0.66
8:00 9:00 197 244 351 504 723 1038 0.10 0.12 0.18 0.25 0.36 0.52
9:00 10:00 168 208 299 430 617 885 0.08 0.10 0.15 0.21 0.31 0.44
10:00 11:00 143 177 254 365 524 752 0.07 0.09 0.13 0.18 0.26 0.38
11:00 12:00 232 288 414 594 853 1224 0.12 0.14 0.21 0.30 0.43 0.61
12:00 13:00 214 266 382 549 788 1131 0.11 0.13 0.19 0.27 0.39 0.57
13:00 14:00 73 91 130 187 268 385 0.04 0.05 0.07 0.09 0.13 0.19
14:00 15:00 62 77 110 158 227 326 0.03 0.04 0.06 0.08 0.11 0.16
15:00 16:00 247 307 440 632 907 1302 0.12 0.15 0.22 0.32 0.45 0.65
16:00 17:00 199 247 355 510 731 1050 0.10 0.12 0.18 0.25 0.37 0.53
17:00 18:00 204 253 363 521 748 1074 0.10 0.13 0.18 0.26 0.37 0.54
18:00 19:00 217 269 386 554 796 1142 0.11 0.13 0.19 0.28 0.40 0.57
19:00 20:00 208 258 371 532 764 1096 0.10 0.13 0.19 0.27 0.38 0.55
20:00 21:00 196 243 349 501 720 1033 0.10 0.12 0.17 0.25 0.36 0.52
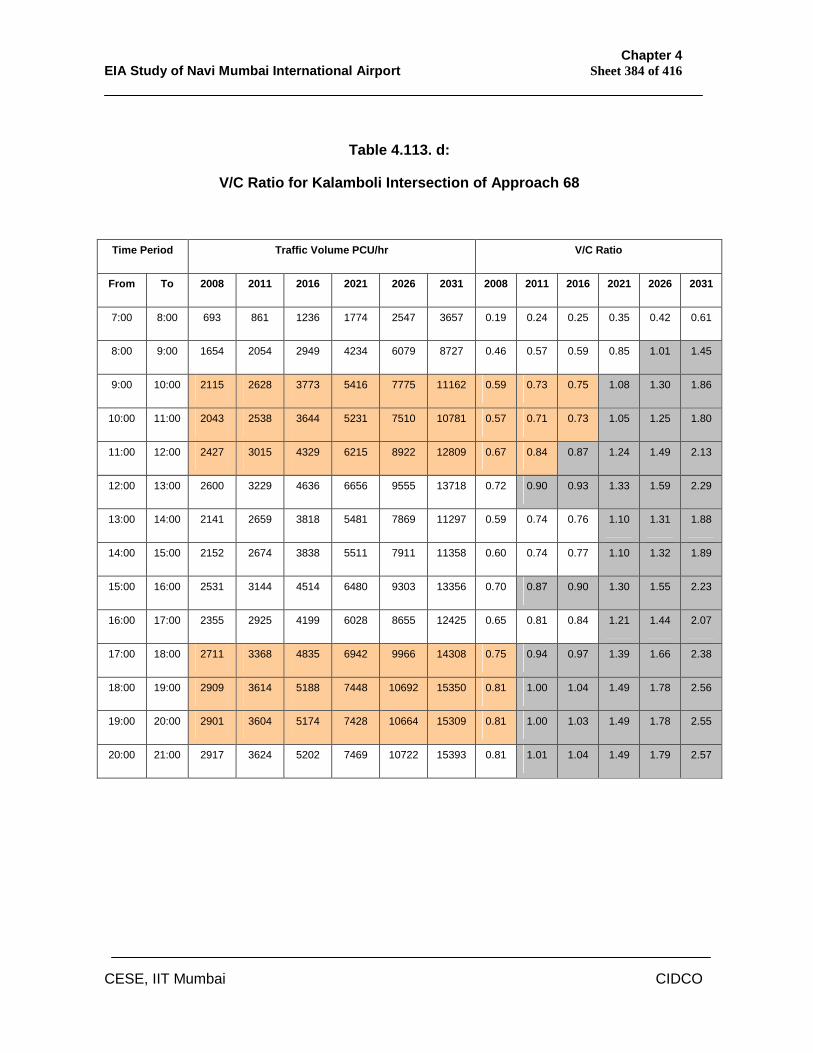
Chapter 4 EIA Study of Navi Mumbai International Airport Sheet 384 of 416
CESE, IIT Mumbai CIDCO
Table 4.113. d:
V/C Ratio for Kalamboli Intersection of Approach 68
Time Period Traffic Volume PCU/hr V/C Ratio
From To 2008 2011 2016 2021 2026 2031 2008 2011 2016 2021 2026 2031
7:00 8:00 693 861 1236 1774 2547 3657 0.19 0.24 0.25 0.35 0.42 0.61
8:00 9:00 1654 2054 2949 4234 6079 8727 0.46 0.57 0.59 0.85 1.01 1.45
9:00 10:00 2115 2628 3773 5416 7775 11162 0.59 0.73 0.75 1.08 1.30 1.86
10:00 11:00 2043 2538 3644 5231 7510 10781 0.57 0.71 0.73 1.05 1.25 1.80
11:00 12:00 2427 3015 4329 6215 8922 12809 0.67 0.84 0.87 1.24 1.49 2.13
12:00 13:00 2600 3229 4636 6656 9555 13718 0.72 0.90 0.93 1.33 1.59 2.29
13:00 14:00 2141 2659 3818 5481 7869 11297 0.59 0.74 0.76 1.10 1.31 1.88
14:00 15:00 2152 2674 3838 5511 7911 11358 0.60 0.74 0.77 1.10 1.32 1.89
15:00 16:00 2531 3144 4514 6480 9303 13356 0.70 0.87 0.90 1.30 1.55 2.23
16:00 17:00 2355 2925 4199 6028 8655 12425 0.65 0.81 0.84 1.21 1.44 2.07
17:00 18:00 2711 3368 4835 6942 9966 14308 0.75 0.94 0.97 1.39 1.66 2.38
18:00 19:00 2909 3614 5188 7448 10692 15350 0.81 1.00 1.04 1.49 1.78 2.56
19:00 20:00 2901 3604 5174 7428 10664 15309 0.81 1.00 1.03 1.49 1.78 2.55
20:00 21:00 2917 3624 5202 7469 10722 15393 0.81 1.01 1.04 1.49 1.79 2.57
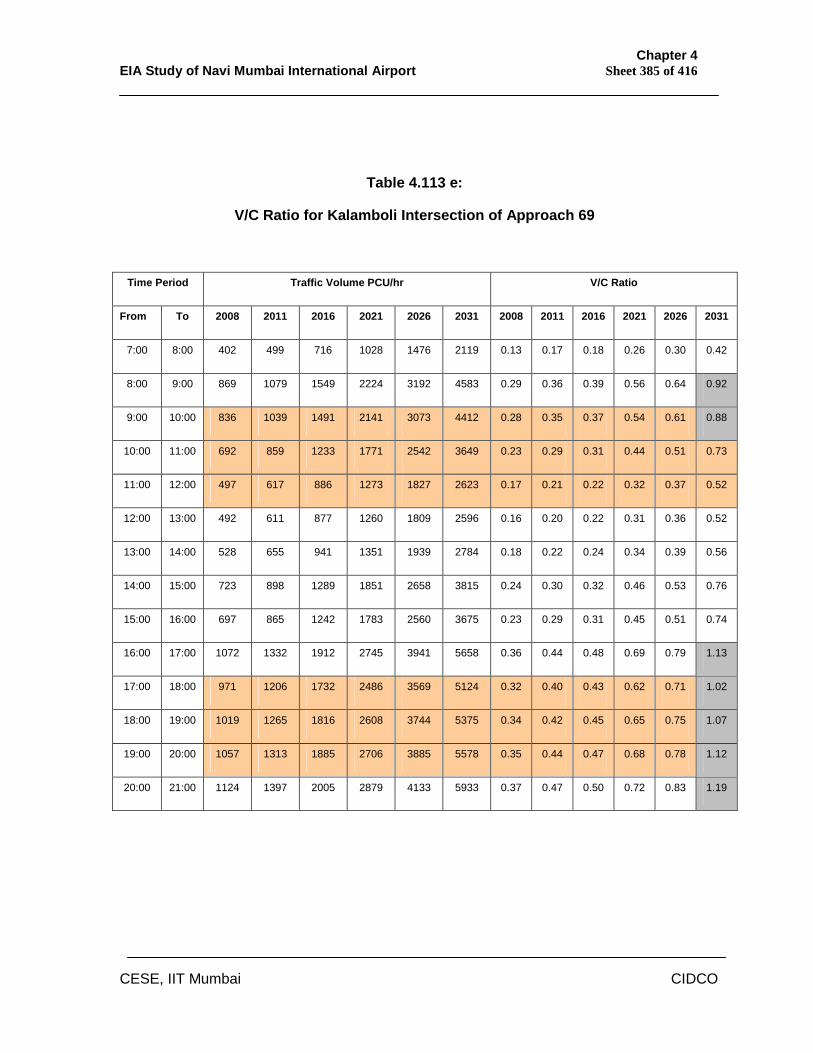
Chapter 4 EIA Study of Navi Mumbai International Airport Sheet 385 of 416
CESE, IIT Mumbai CIDCO
Table 4.113 e:
V/C Ratio for Kalamboli Intersection of Approach 69
Time Period Traffic Volume PCU/hr V/C Ratio
From To 2008 2011 2016 2021 2026 2031 2008 2011 2016 2021 2026 2031
7:00 8:00 402 499 716 1028 1476 2119 0.13 0.17 0.18 0.26 0.30 0.42
8:00 9:00 869 1079 1549 2224 3192 4583 0.29 0.36 0.39 0.56 0.64 0.92
9:00 10:00 836 1039 1491 2141 3073 4412 0.28 0.35 0.37 0.54 0.61 0.88
10:00 11:00 692 859 1233 1771 2542 3649 0.23 0.29 0.31 0.44 0.51 0.73
11:00 12:00 497 617 886 1273 1827 2623 0.17 0.21 0.22 0.32 0.37 0.52
12:00 13:00 492 611 877 1260 1809 2596 0.16 0.20 0.22 0.31 0.36 0.52
13:00 14:00 528 655 941 1351 1939 2784 0.18 0.22 0.24 0.34 0.39 0.56
14:00 15:00 723 898 1289 1851 2658 3815 0.24 0.30 0.32 0.46 0.53 0.76
15:00 16:00 697 865 1242 1783 2560 3675 0.23 0.29 0.31 0.45 0.51 0.74
16:00 17:00 1072 1332 1912 2745 3941 5658 0.36 0.44 0.48 0.69 0.79 1.13
17:00 18:00 971 1206 1732 2486 3569 5124 0.32 0.40 0.43 0.62 0.71 1.02
18:00 19:00 1019 1265 1816 2608 3744 5375 0.34 0.42 0.45 0.65 0.75 1.07
19:00 20:00 1057 1313 1885 2706 3885 5578 0.35 0.44 0.47 0.68 0.78 1.12
20:00 21:00 1124 1397 2005 2879 4133 5933 0.37 0.47 0.50 0.72 0.83 1.19
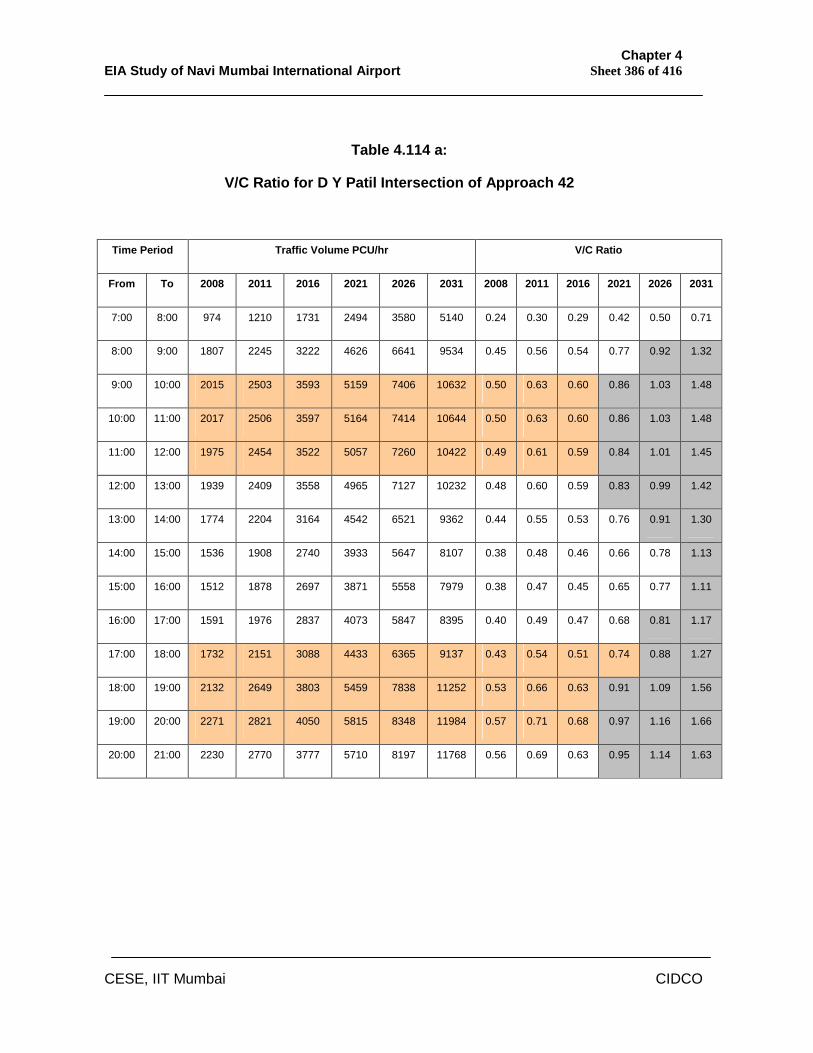
Chapter 4 EIA Study of Navi Mumbai International Airport Sheet 386 of 416
CESE, IIT Mumbai CIDCO
Table 4.114 a:
V/C Ratio for D Y Patil Intersection of Approach 42
Time Period Traffic Volume PCU/hr V/C Ratio
From To 2008 2011 2016 2021 2026 2031 2008 2011 2016 2021 2026 2031
7:00 8:00 974 1210 1731 2494 3580 5140 0.24 0.30 0.29 0.42 0.50 0.71
8:00 9:00 1807 2245 3222 4626 6641 9534 0.45 0.56 0.54 0.77 0.92 1.32
9:00 10:00 2015 2503 3593 5159 7406 10632 0.50 0.63 0.60 0.86 1.03 1.48
10:00 11:00 2017 2506 3597 5164 7414 10644 0.50 0.63 0.60 0.86 1.03 1.48
11:00 12:00 1975 2454 3522 5057 7260 10422 0.49 0.61 0.59 0.84 1.01 1.45
12:00 13:00 1939 2409 3558 4965 7127 10232 0.48 0.60 0.59 0.83 0.99 1.42
13:00 14:00 1774 2204 3164 4542 6521 9362 0.44 0.55 0.53 0.76 0.91 1.30
14:00 15:00 1536 1908 2740 3933 5647 8107 0.38 0.48 0.46 0.66 0.78 1.13
15:00 16:00 1512 1878 2697 3871 5558 7979 0.38 0.47 0.45 0.65 0.77 1.11
16:00 17:00 1591 1976 2837 4073 5847 8395 0.40 0.49 0.47 0.68 0.81 1.17
17:00 18:00 1732 2151 3088 4433 6365 9137 0.43 0.54 0.51 0.74 0.88 1.27
18:00 19:00 2132 2649 3803 5459 7838 11252 0.53 0.66 0.63 0.91 1.09 1.56
19:00 20:00 2271 2821 4050 5815 8348 11984 0.57 0.71 0.68 0.97 1.16 1.66
20:00 21:00 2230 2770 3777 5710 8197 11768 0.56 0.69 0.63 0.95 1.14 1.63
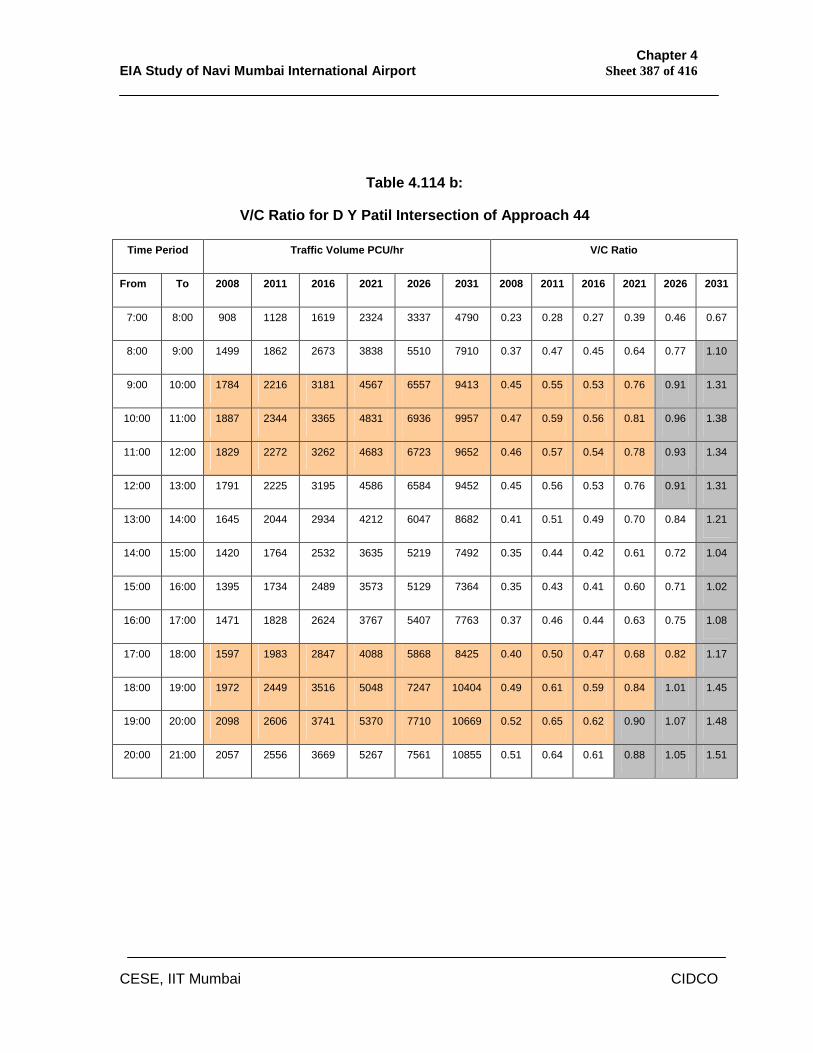
Chapter 4 EIA Study of Navi Mumbai International Airport Sheet 387 of 416
CESE, IIT Mumbai CIDCO
Table 4.114 b:
V/C Ratio for D Y Patil Intersection of Approach 44
Time Period Traffic Volume PCU/hr V/C Ratio
From To 2008 2011 2016 2021 2026 2031 2008 2011 2016 2021 2026 2031
7:00 8:00 908 1128 1619 2324 3337 4790 0.23 0.28 0.27 0.39 0.46 0.67
8:00 9:00 1499 1862 2673 3838 5510 7910 0.37 0.47 0.45 0.64 0.77 1.10
9:00 10:00 1784 2216 3181 4567 6557 9413 0.45 0.55 0.53 0.76 0.91 1.31
10:00 11:00 1887 2344 3365 4831 6936 9957 0.47 0.59 0.56 0.81 0.96 1.38
11:00 12:00 1829 2272 3262 4683 6723 9652 0.46 0.57 0.54 0.78 0.93 1.34
12:00 13:00 1791 2225 3195 4586 6584 9452 0.45 0.56 0.53 0.76 0.91 1.31
13:00 14:00 1645 2044 2934 4212 6047 8682 0.41 0.51 0.49 0.70 0.84 1.21
14:00 15:00 1420 1764 2532 3635 5219 7492 0.35 0.44 0.42 0.61 0.72 1.04
15:00 16:00 1395 1734 2489 3573 5129 7364 0.35 0.43 0.41 0.60 0.71 1.02
16:00 17:00 1471 1828 2624 3767 5407 7763 0.37 0.46 0.44 0.63 0.75 1.08
17:00 18:00 1597 1983 2847 4088 5868 8425 0.40 0.50 0.47 0.68 0.82 1.17
18:00 19:00 1972 2449 3516 5048 7247 10404 0.49 0.61 0.59 0.84 1.01 1.45
19:00 20:00 2098 2606 3741 5370 7710 10669 0.52 0.65 0.62 0.90 1.07 1.48
20:00 21:00 2057 2556 3669 5267 7561 10855 0.51 0.64 0.61 0.88 1.05 1.51
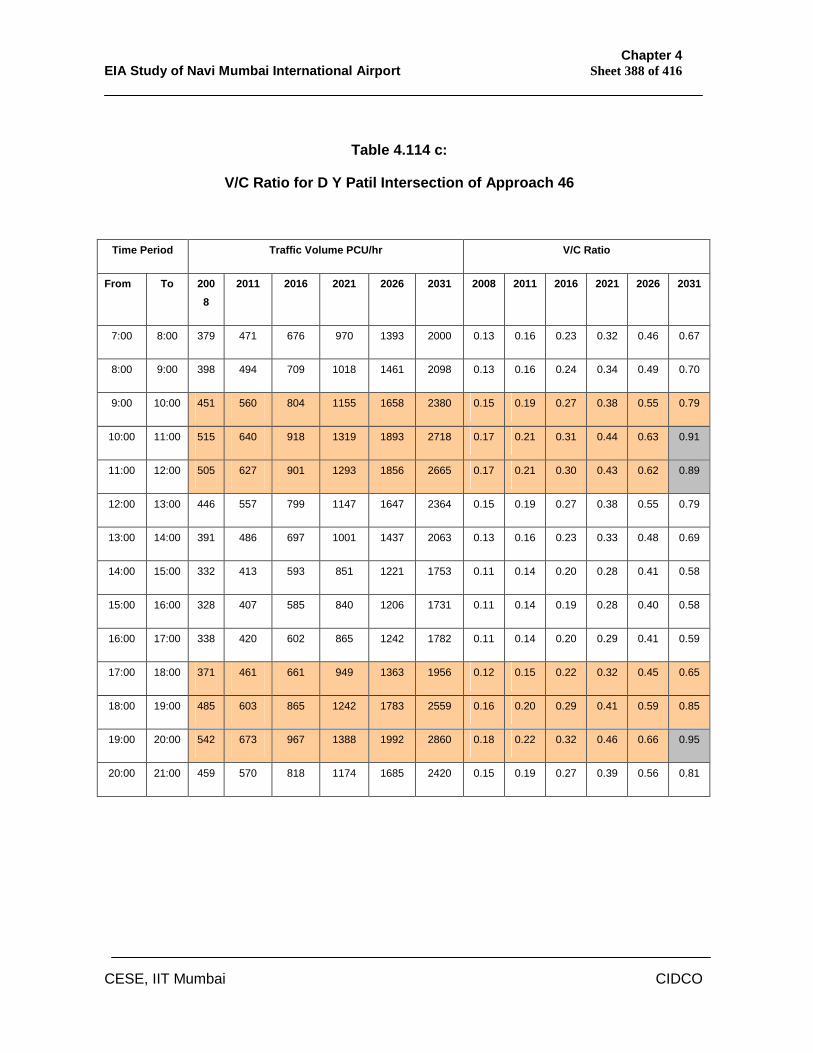
Chapter 4 EIA Study of Navi Mumbai International Airport Sheet 388 of 416
CESE, IIT Mumbai CIDCO
Table 4.114 c:
V/C Ratio for D Y Patil Intersection of Approach 46
Time Period Traffic Volume PCU/hr V/C Ratio
From To 2008
2011 2016 2021 2026 2031 2008 2011 2016 2021 2026 2031
7:00 8:00 379 471 676 970 1393 2000 0.13 0.16 0.23 0.32 0.46 0.67
8:00 9:00 398 494 709 1018 1461 2098 0.13 0.16 0.24 0.34 0.49 0.70
9:00 10:00 451 560 804 1155 1658 2380 0.15 0.19 0.27 0.38 0.55 0.79
10:00 11:00 515 640 918 1319 1893 2718 0.17 0.21 0.31 0.44 0.63 0.91
11:00 12:00 505 627 901 1293 1856 2665 0.17 0.21 0.30 0.43 0.62 0.89
12:00 13:00 446 557 799 1147 1647 2364 0.15 0.19 0.27 0.38 0.55 0.79
13:00 14:00 391 486 697 1001 1437 2063 0.13 0.16 0.23 0.33 0.48 0.69
14:00 15:00 332 413 593 851 1221 1753 0.11 0.14 0.20 0.28 0.41 0.58
15:00 16:00 328 407 585 840 1206 1731 0.11 0.14 0.19 0.28 0.40 0.58
16:00 17:00 338 420 602 865 1242 1782 0.11 0.14 0.20 0.29 0.41 0.59
17:00 18:00 371 461 661 949 1363 1956 0.12 0.15 0.22 0.32 0.45 0.65
18:00 19:00 485 603 865 1242 1783 2559 0.16 0.20 0.29 0.41 0.59 0.85
19:00 20:00 542 673 967 1388 1992 2860 0.18 0.22 0.32 0.46 0.66 0.95
20:00 21:00 459 570 818 1174 1685 2420 0.15 0.19 0.27 0.39 0.56 0.81
Chapter 4 EIA Study of Navi Mumbai International Airport Sheet 389 of 416
CESE, IIT Mumbai CIDCO
The analysis of V/C ratio for Belapur junction reveals that the level of service
goes down from C during the peak hours in 2026. Beyond this the junction
operates all the time below the level of service C. However the commissioning
of Mumbai Trans Harbour link would substantially improve the level of service
above C and there by the junction will operate smoothly. The situation at D.Y.
Patil is more or less same of Belapur junction. Kalamboli junction start
experiencing congestion corresponding to below C from 2021 and reach to
force flow with jam condition 2031 warranting second level grade separation by
2031.
4.15 Land Status & Settlement
The land requirement of airport works out to 2054 Ha. consisting of 1615 Ha. for
airport zone and remaining for the development of connectivity, construction of
interchanges, diversion and training of rivers, laying of utilities, etc. The above
land falls in the Raigad District in Taluka Panvel and Uran in Navi Mumbai.
These lands are already notified for the development of Navi Mumbai city and
airport is one of its components of infrastructure development. The entire land
required for the airport development belongs to 16 (sixteen) villages spread over
in the two Talukas mentioned above. The 2054 Ha. land consist of 1154 Ha. of
land in possession of Corporation, 443 Ha. Govt. land under transfer to CIDCO
and 457 Ha. of private land. The process for acquiring the 457 Ha. of private land
is already made by the corporation and the notification of the same would be
issued shortly. The following Table gives the village-wise land status:
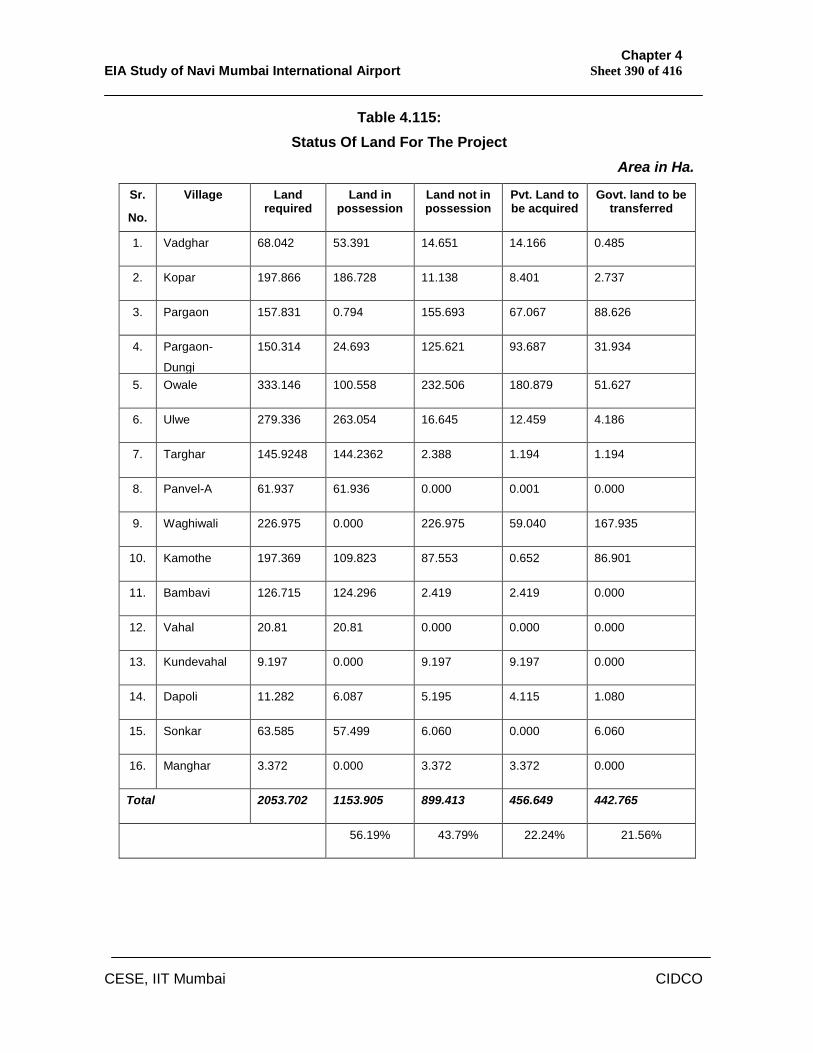
Chapter 4 EIA Study of Navi Mumbai International Airport Sheet 390 of 416
CESE, IIT Mumbai CIDCO
Table 4.115: Status Of Land For The Project
Area in Ha.
Sr.
No.
Village Land required
Land in possession
Land not in possession
Pvt. Land to be acquired
Govt. land to be transferred
1. Vadghar 68.042 53.391 14.651 14.166 0.485
2. Kopar 197.866 186.728 11.138 8.401 2.737
3. Pargaon 157.831 0.794 155.693 67.067 88.626
4. Pargaon-
Dungi
150.314 24.693 125.621 93.687 31.934
5. Owale 333.146 100.558 232.506 180.879 51.627
6. Ulwe 279.336 263.054 16.645 12.459 4.186
7. Targhar 145.9248 144.2362 2.388 1.194 1.194
8. Panvel-A 61.937 61.936 0.000 0.001 0.000
9. Waghiwali 226.975 0.000 226.975 59.040 167.935
10. Kamothe 197.369 109.823 87.553 0.652 86.901
11. Bambavi 126.715 124.296 2.419 2.419 0.000
12. Vahal 20.81 20.81 0.000 0.000 0.000
13. Kundevahal 9.197 0.000 9.197 9.197 0.000
14. Dapoli 11.282 6.087 5.195 4.115 1.080
15. Sonkar 63.585 57.499 6.060 0.000 6.060
16. Manghar 3.372 0.000 3.372 3.372 0.000
Total 2053.702 1153.905 899.413 456.649 442.765
56.19% 43.79% 22.24% 21.56%
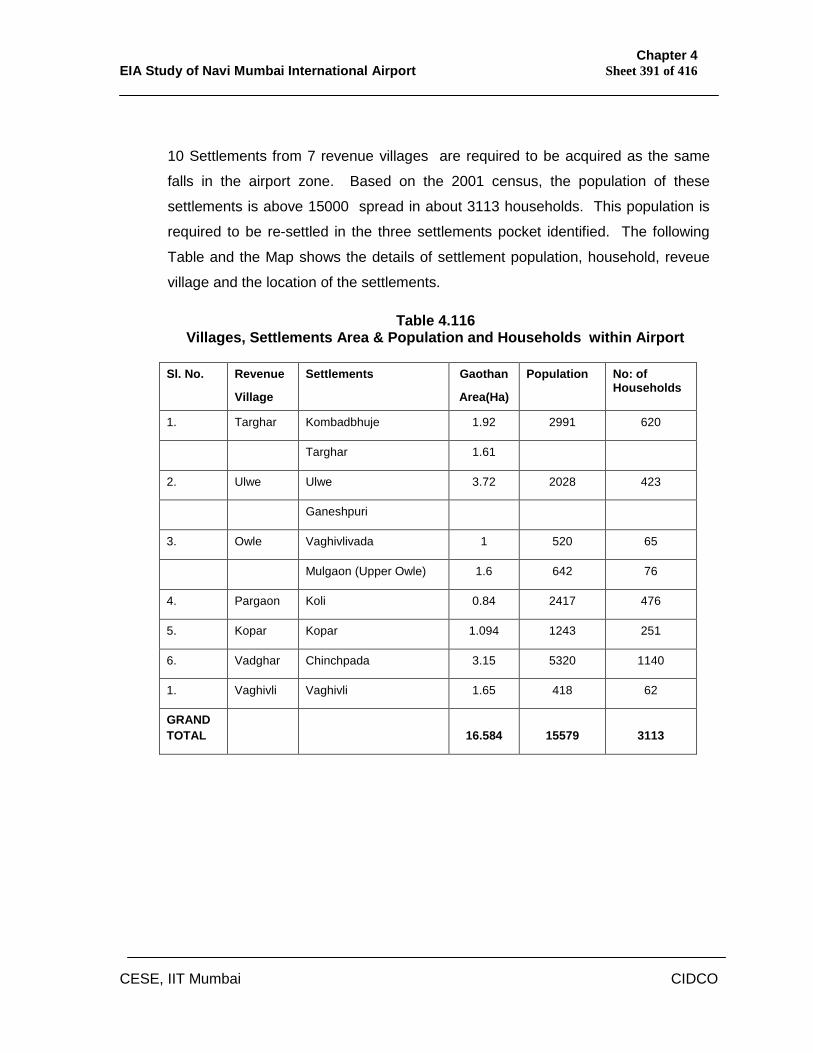
Chapter 4 EIA Study of Navi Mumbai International Airport Sheet 391 of 416
CESE, IIT Mumbai CIDCO
10 Settlements from 7 revenue villages are required to be acquired as the same
falls in the airport zone. Based on the 2001 census, the population of these
settlements is above 15000 spread in about 3113 households. This population is
required to be re-settled in the three settlements pocket identified. The following
Table and the Map shows the details of settlement population, household, reveue
village and the location of the settlements.
Table 4.116 Villages, Settlements Area & Population and Households within Airport
Sl. No. Revenue
Village
Settlements
Gaothan
Area(Ha)
Population No: of Households
1. Targhar Kombadbhuje 1.92 2991 620
Targhar 1.61
2. Ulwe Ulwe 3.72 2028 423
Ganeshpuri
3. Owle Vaghivlivada 1 520 65
Mulgaon (Upper Owle) 1.6 642 76
4. Pargaon Koli 0.84 2417 476
5. Kopar Kopar 1.094 1243 251
6. Vadghar Chinchpada 3.15 5320 1140
1. Vaghivli Vaghivli 1.65 418 62
GRAND TOTAL 16.584 15579 3113
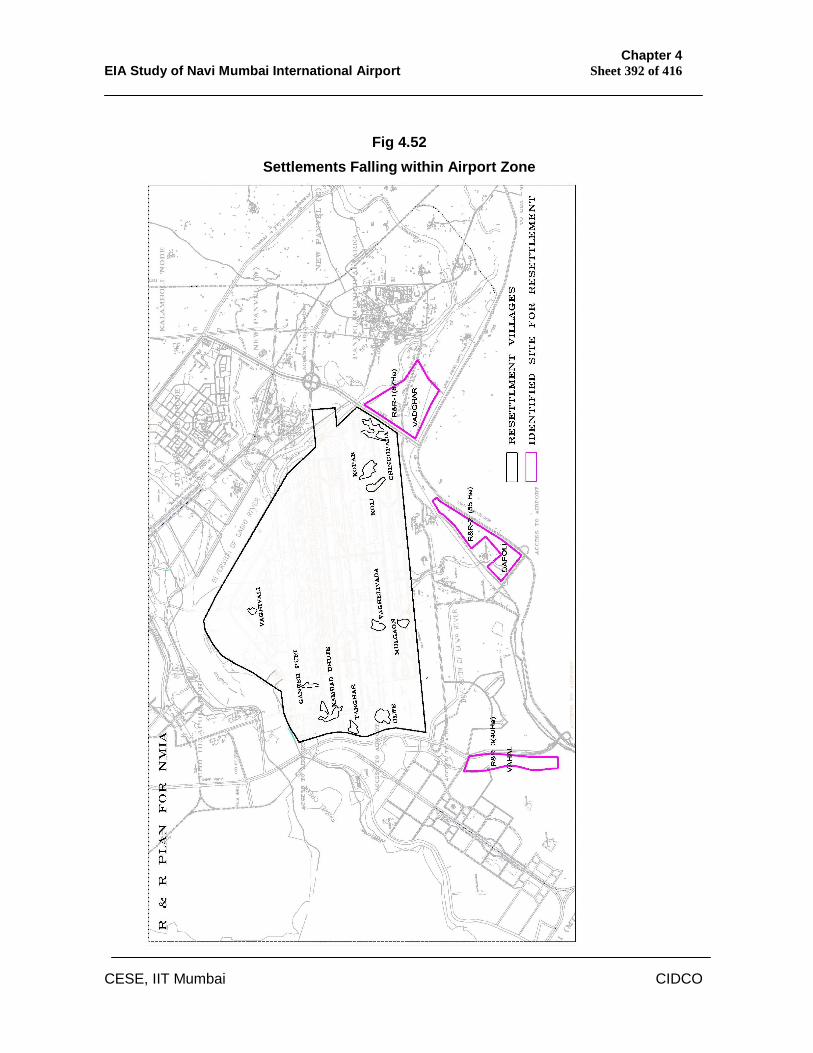
Chapter 4 EIA Study of Navi Mumbai International Airport Sheet 392 of 416
CESE, IIT Mumbai CIDCO
Fig 4.52
Settlements Falling within Airport Zone
Chapter 4 EIA Study of Navi Mumbai International Airport Sheet 393 of 416
CESE, IIT Mumbai CIDCO
4.16 Demographic Socio-Economic
The Govt. of Maharashtra recognizing the need of decongestion of city of
Mumbai decided to create a counter magnet trans-harbour and constituted
CIDCO in the year 1970, which is a State Govt eneterprise, registred under
Companies Act, 1956, and entrusted the task of development of area
notified for new town of Navi Mumbai. The proposed development of Navi
Mumbai Internatioanl Airport (NMIA) is subset of development of New Town
of Navi Mumbai.
Navi Mumbai is planned over an area of 344 SqKm for targeted populationof
20 lacs and 8 lac jobs and for the purpose land falling in 95 villages of
Thane &Raigad district was notified excepting the existing gaothans. No
displacement of settlements/gaothan was envisaged and the villages are
retained at their existing locations and surrounding area was acquired by the
Govt of Maharashtra and vested in CIDCO for development and disposal for
various activities required for city development. The existing 95 settlements
are being integrated into the city development to minimize the disparity in
the quality of physical, commercial, social infrastructure, between the urban
and rurul area.
The examination of study area covering a distance of radios 10 km. from the
airport reference point reveals that certain area such as; Sanpada, Nerul,
Belapur, Kharghar, Kalamboli, Panvel have been developed with the
physical and social infrastructures. The airport zone and the area falling on
South mainly consist of existing settlements in Panvel and UranTaluka
villages and the same are yet to be developed. Thus, the study area
consist of population of urban and rurul nature. The total population under
the study area is about 5.68 lakhs based on 2001 census consisting of
urban as 4.8 lakhs and rest rural.
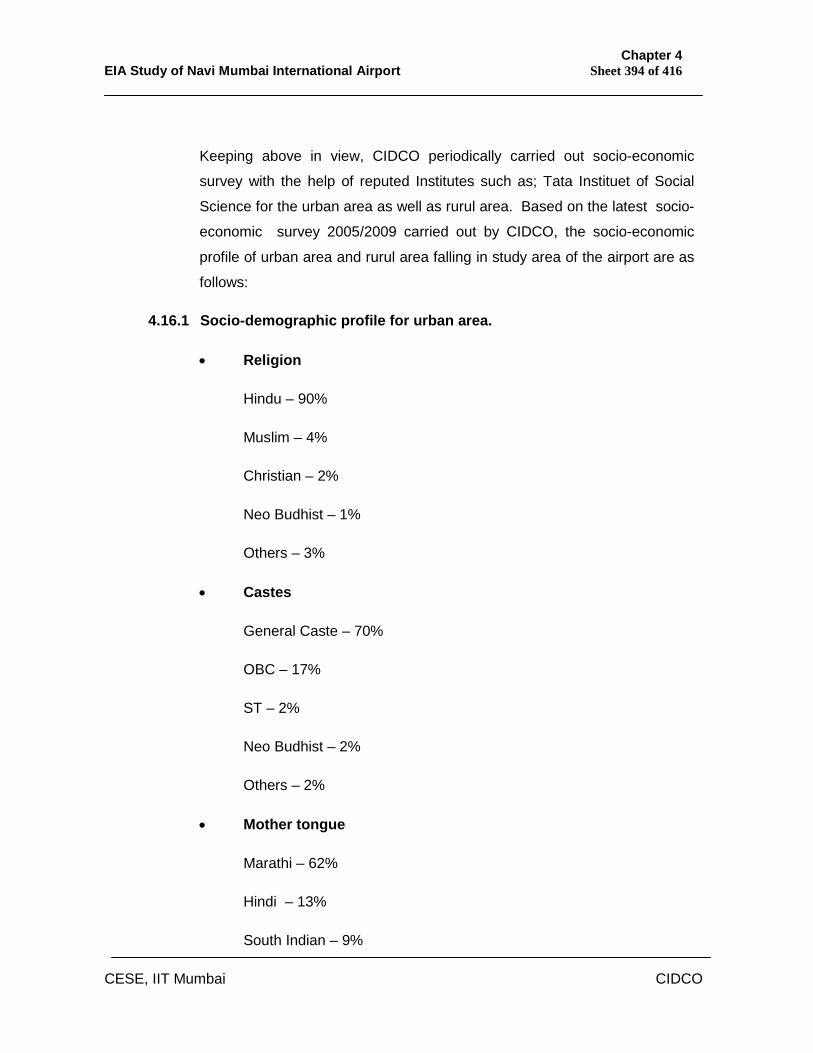
Chapter 4 EIA Study of Navi Mumbai International Airport Sheet 394 of 416
CESE, IIT Mumbai CIDCO
Keeping above in view, CIDCO periodically carried out socio-economic
survey with the help of reputed Institutes such as; Tata Instituet of Social
Science for the urban area as well as rurul area. Based on the latest socio-
economic survey 2005/2009 carried out by CIDCO, the socio-economic
profile of urban area and rurul area falling in study area of the airport are as
follows:
4.16.1 Socio-demographic profile for urban area.
Religion
Hindu – 90%
Muslim – 4%
Christian – 2%
Neo Budhist – 1%
Others – 3%
Castes
General Caste – 70%
OBC – 17%
ST – 2%
Neo Budhist – 2%
Others – 2%
Mother tongue
Marathi – 62%
Hindi – 13%
South Indian – 9%
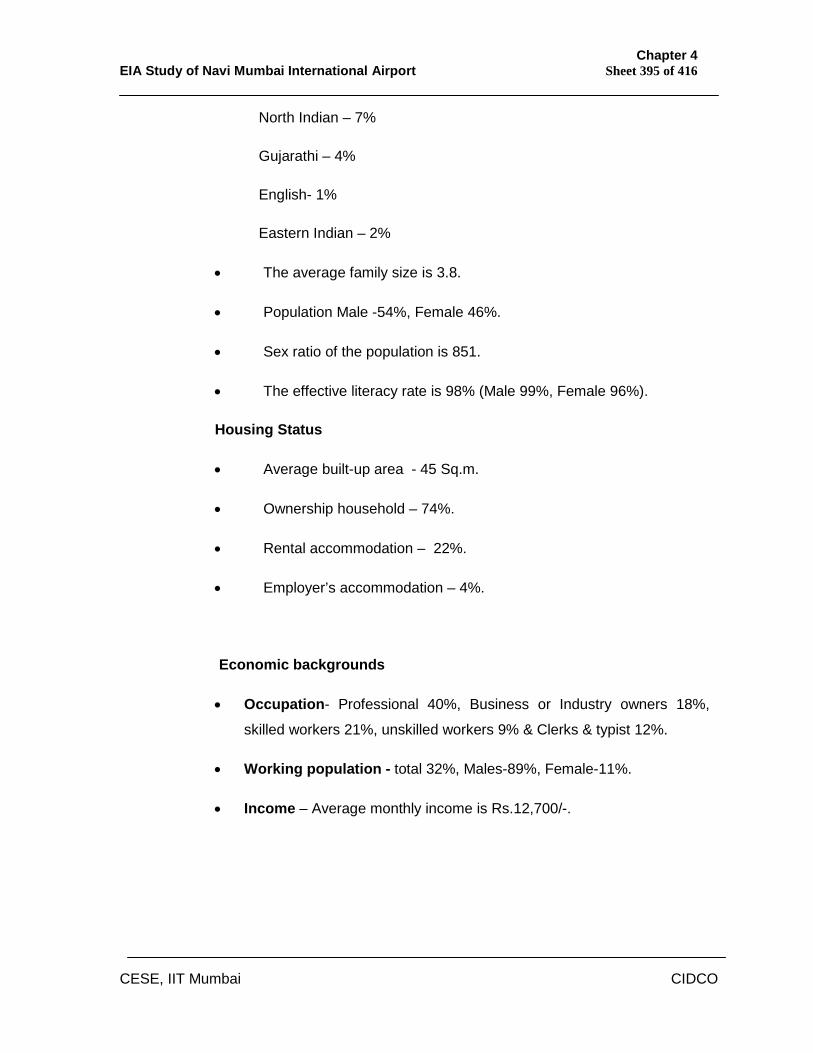
Chapter 4 EIA Study of Navi Mumbai International Airport Sheet 395 of 416
CESE, IIT Mumbai CIDCO
North Indian – 7%
Gujarathi – 4%
English- 1%
Eastern Indian – 2%
The average family size is 3.8.
Population Male -54%, Female 46%.
Sex ratio of the population is 851.
The effective literacy rate is 98% (Male 99%, Female 96%).
Housing Status
Average built-up area - 45 Sq.m.
Ownership household – 74%.
Rental accommodation – 22%.
Employer’s accommodation – 4%.
Economic backgrounds
Occupation- Professional 40%, Business or Industry owners 18%,
skilled workers 21%, unskilled workers 9% & Clerks & typist 12%.
Working population - total 32%, Males-89%, Female-11%.
Income – Average monthly income is Rs.12,700/-.
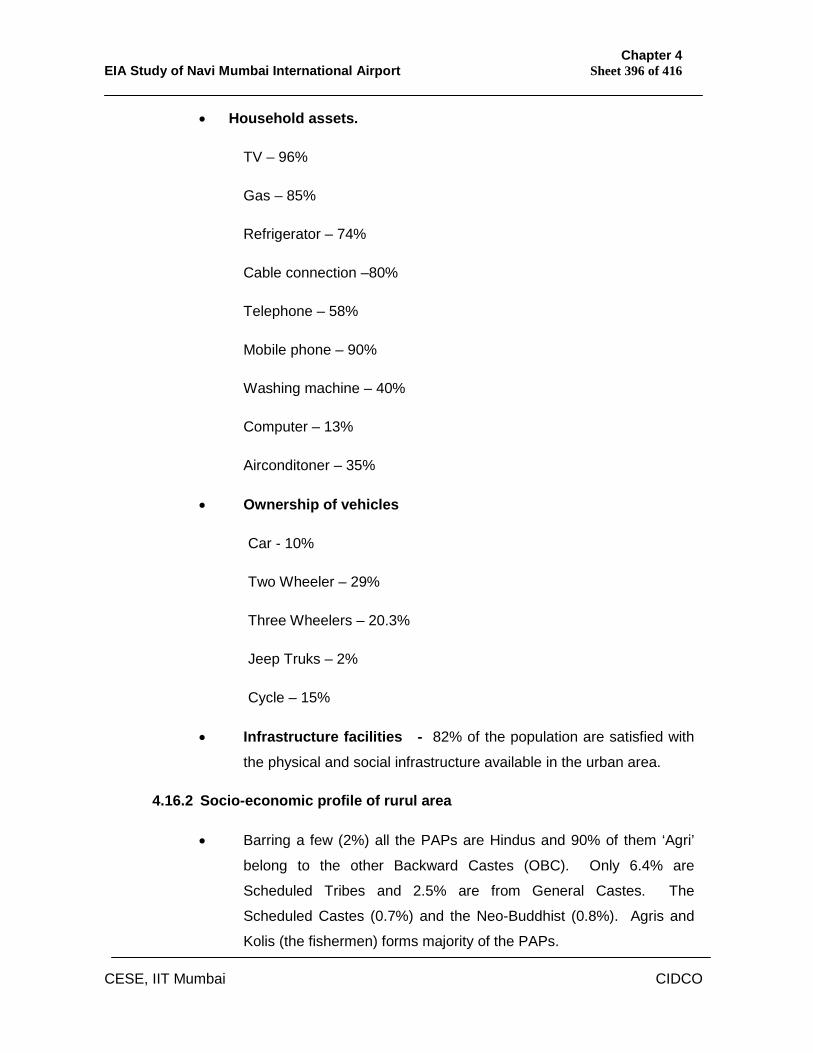
Chapter 4 EIA Study of Navi Mumbai International Airport Sheet 396 of 416
CESE, IIT Mumbai CIDCO
Household assets.
TV – 96%
Gas – 85%
Refrigerator – 74%
Cable connection –80%
Telephone – 58%
Mobile phone – 90%
Washing machine – 40%
Computer – 13%
Airconditoner – 35%
Ownership of vehicles
Car - 10%
Two Wheeler – 29%
Three Wheelers – 20.3%
Jeep Truks – 2%
Cycle – 15%
Infrastructure facilities - 82% of the population are satisfied with
the physical and social infrastructure available in the urban area.
4.16.2 Socio-economic profile of rurul area
Barring a few (2%) all the PAPs are Hindus and 90% of them ‘Agri’
belong to the other Backward Castes (OBC). Only 6.4% are
Scheduled Tribes and 2.5% are from General Castes. The
Scheduled Castes (0.7%) and the Neo-Buddhist (0.8%). Agris and
Kolis (the fishermen) forms majority of the PAPs.
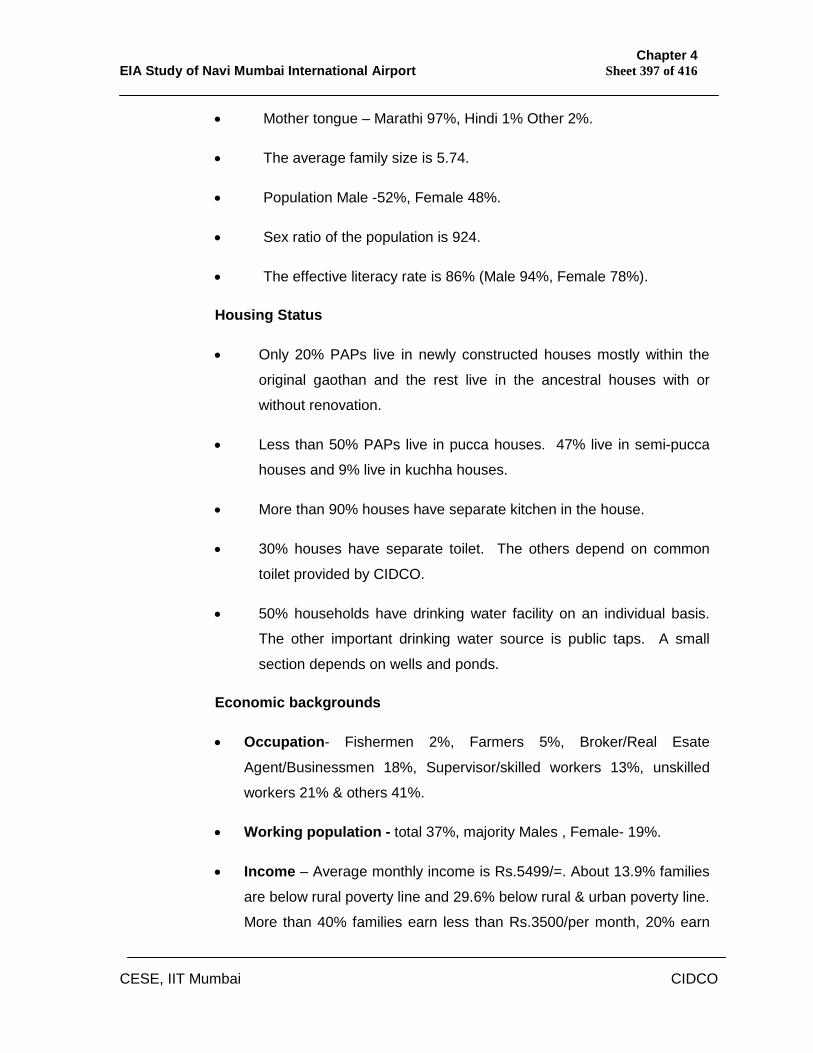
Chapter 4 EIA Study of Navi Mumbai International Airport Sheet 397 of 416
CESE, IIT Mumbai CIDCO
Mother tongue – Marathi 97%, Hindi 1% Other 2%.
The average family size is 5.74.
Population Male -52%, Female 48%.
Sex ratio of the population is 924.
The effective literacy rate is 86% (Male 94%, Female 78%).
Housing Status
Only 20% PAPs live in newly constructed houses mostly within the
original gaothan and the rest live in the ancestral houses with or
without renovation.
Less than 50% PAPs live in pucca houses. 47% live in semi-pucca
houses and 9% live in kuchha houses.
More than 90% houses have separate kitchen in the house.
30% houses have separate toilet. The others depend on common
toilet provided by CIDCO.
50% households have drinking water facility on an individual basis.
The other important drinking water source is public taps. A small
section depends on wells and ponds.
Economic backgrounds
Occupation- Fishermen 2%, Farmers 5%, Broker/Real Esate
Agent/Businessmen 18%, Supervisor/skilled workers 13%, unskilled
workers 21% & others 41%.
Working population - total 37%, majority Males , Female- 19%.
Income – Average monthly income is Rs.5499/=. About 13.9% families
are below rural poverty line and 29.6% below rural & urban poverty line.
More than 40% families earn less than Rs.3500/per month, 20% earn
Chapter 4 EIA Study of Navi Mumbai International Airport Sheet 398 of 416
CESE, IIT Mumbai CIDCO
between Rs.3500 – 5000/per month only 25% families have their
monthly income above Rs.5000/per month.
Household assets.
- TV – 96%
- Gas – 70%
- Refrigerator – 71%
- Cable connection – 56%
- Telephone – 21%
- Mobile phone – 90%
- Washing machine – 24%
- Computer – 8.4%
Ownership of vehicles – A good majority (44.6%) of PAPs have two
wheelers like motorcycle/scooter/moped. Nearly 15% have
autorickshaws. About 10% have car/jeep & about 3% have
truck/tractor/tempo. 2.3% have boat.
Infrastructure facilities – All the villages, falling within the NMIA
project area, have asphalted approach road. The roads/pathways
within the villages are WBM standard/concrete. Water and electricity
is available in all villages. All 10 settlements have primary school and
2 settlements have secondary school also. Religious places are
exisiting in all villages. Community centre constructed with grant by
CIDCO are existing in 4 villages. There are primary health centres in
2 settlements.
The villages are encircled by nodal development and the PAPs are
deriving benefits of educational, instituitional and health facilities
available in surrounding developed nodes.
Chapter 4 EIA Study of Navi Mumbai International Airport Sheet 399 of 416
CESE, IIT Mumbai CIDCO
4.17 Land Use Pattern
4.17.1 Study Area
The study area covering a radious of 10 kms. from airport reference point has
been considered for the land cover analysis on latest satalite imagery for the
land use. The latest satalite imagery of 2009 from Google is used for the
analysis. The raw image was geo reference in WGS 84 co-ordinate with
UTM datum and brought to Autocad format. The raw image is shown in
Fig.4.53.
The total study area works out to 31429 Ha. falling under three Taluka, i.e.
Uran & Panvel of Dist. Raigad and Thane Dist. The above area goes beyond
the jurisdiction of Navi Mumabi, however, falls in the urbanizable area of
Mumbai Metropolitcan Region. The various possible land use is examined on
the plan and categories as Urban, Hills, Creeks & Rivers, Mud flats,
Mangroves, Quarries and urbanisable area (rural) and industrial area. The
land cover analysis is shown on Fig. 4.54.
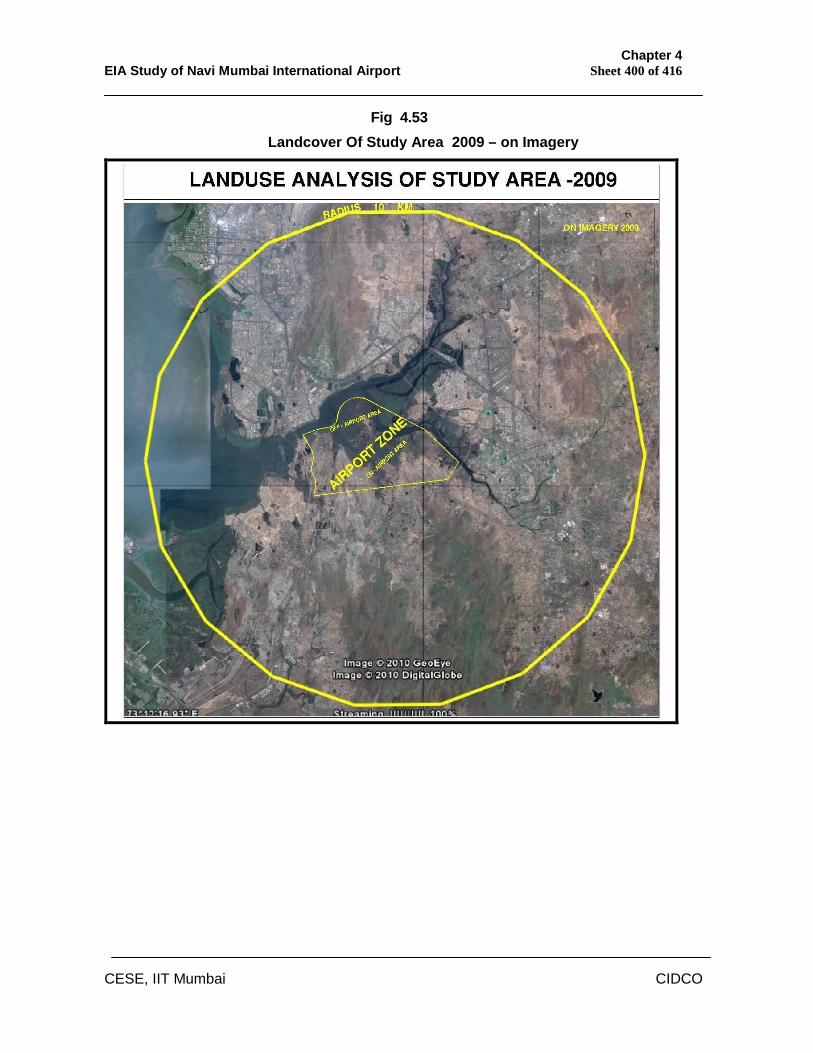
Chapter 4 EIA Study of Navi Mumbai International Airport Sheet 400 of 416
CESE, IIT Mumbai CIDCO
Fig 4.53 Landcover Of Study Area 2009 – on Imagery
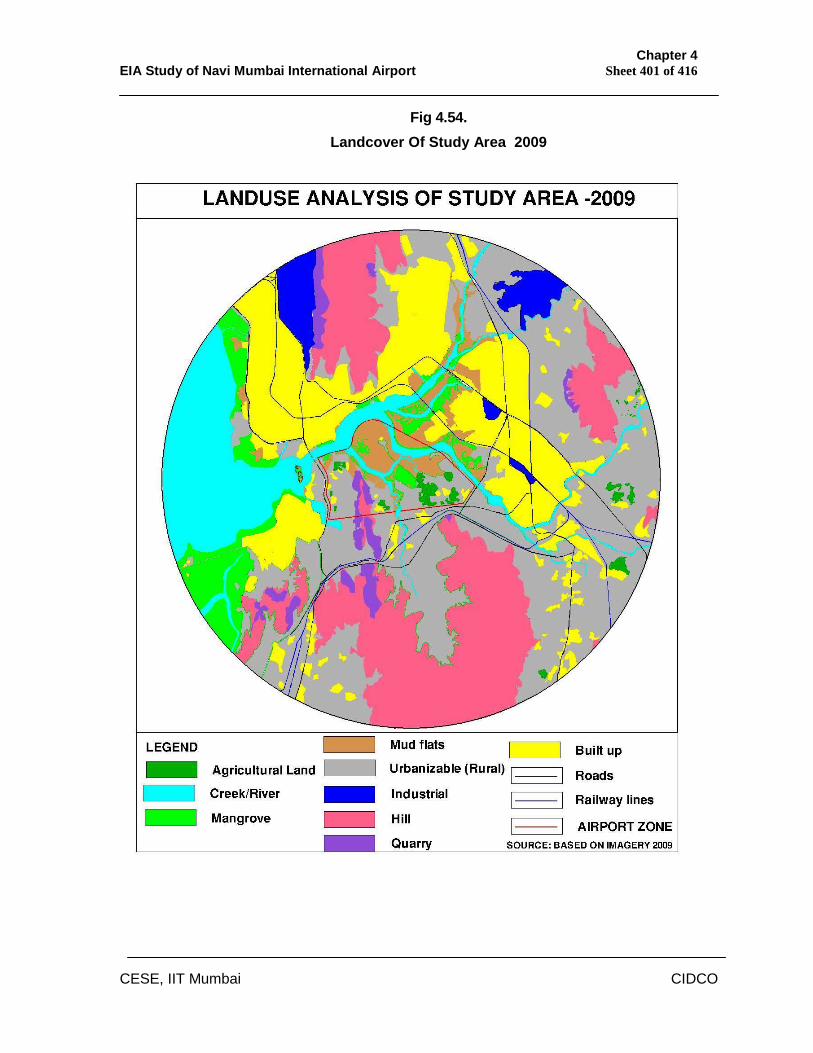
Chapter 4 EIA Study of Navi Mumbai International Airport Sheet 401 of 416
CESE, IIT Mumbai CIDCO
Fig 4.54. Landcover Of Study Area 2009
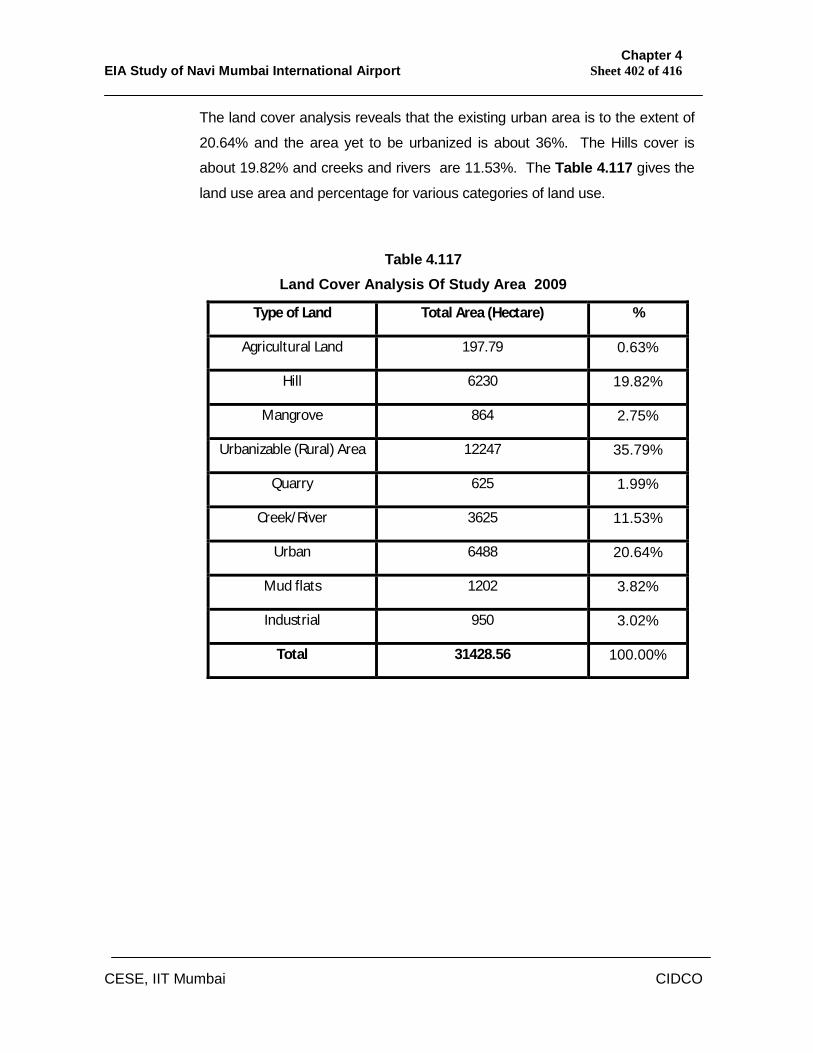
Chapter 4 EIA Study of Navi Mumbai International Airport Sheet 402 of 416
CESE, IIT Mumbai CIDCO
The land cover analysis reveals that the existing urban area is to the extent of
20.64% and the area yet to be urbanized is about 36%. The Hills cover is
about 19.82% and creeks and rivers are 11.53%. The Table 4.117 gives the
land use area and percentage for various categories of land use.
Table 4.117 Land Cover Analysis Of Study Area 2009
Type of Land Total Area (Hectare) %
Agricultural Land 197.79 0.63%
Hill 6230 19.82%
Mangrove 864 2.75%
Urbanizable (Rural) Area 12247 35.79%
Quarry 625 1.99%
Creek/River 3625 11.53%
Urban 6488 20.64%
Mud flats 1202 3.82%
Industrial 950 3.02%
Total 31428.56 100.00%
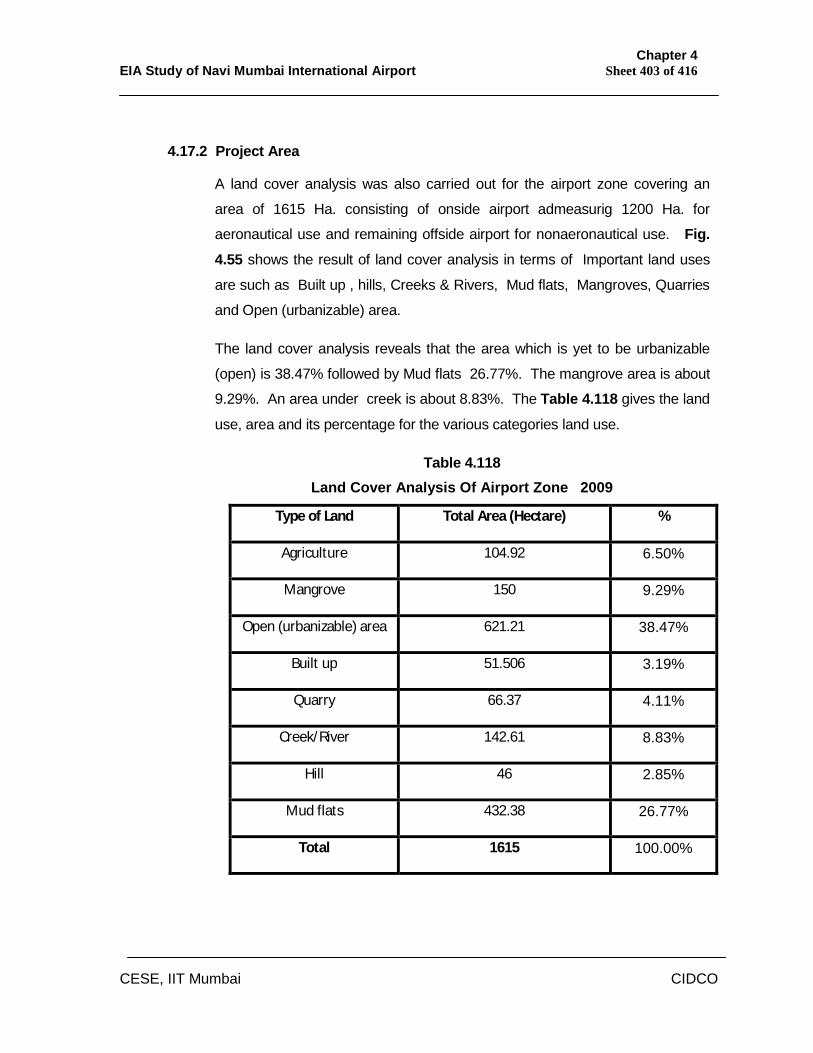
Chapter 4 EIA Study of Navi Mumbai International Airport Sheet 403 of 416
CESE, IIT Mumbai CIDCO
4.17.2 Project Area
A land cover analysis was also carried out for the airport zone covering an
area of 1615 Ha. consisting of onside airport admeasurig 1200 Ha. for
aeronautical use and remaining offside airport for nonaeronautical use. Fig. 4.55 shows the result of land cover analysis in terms of Important land uses
are such as Built up , hills, Creeks & Rivers, Mud flats, Mangroves, Quarries
and Open (urbanizable) area.
The land cover analysis reveals that the area which is yet to be urbanizable
(open) is 38.47% followed by Mud flats 26.77%. The mangrove area is about
9.29%. An area under creek is about 8.83%. The Table 4.118 gives the land
use, area and its percentage for the various categories land use.
Table 4.118 Land Cover Analysis Of Airport Zone 2009
Type of Land Total Area (Hectare) %
Agriculture 104.92 6.50%
Mangrove 150 9.29%
Open (urbanizable) area 621.21 38.47%
Built up 51.506 3.19%
Quarry 66.37 4.11%
Creek/River 142.61 8.83%
Hill 46 2.85%
Mud flats 432.38 26.77%
Total 1615 100.00%
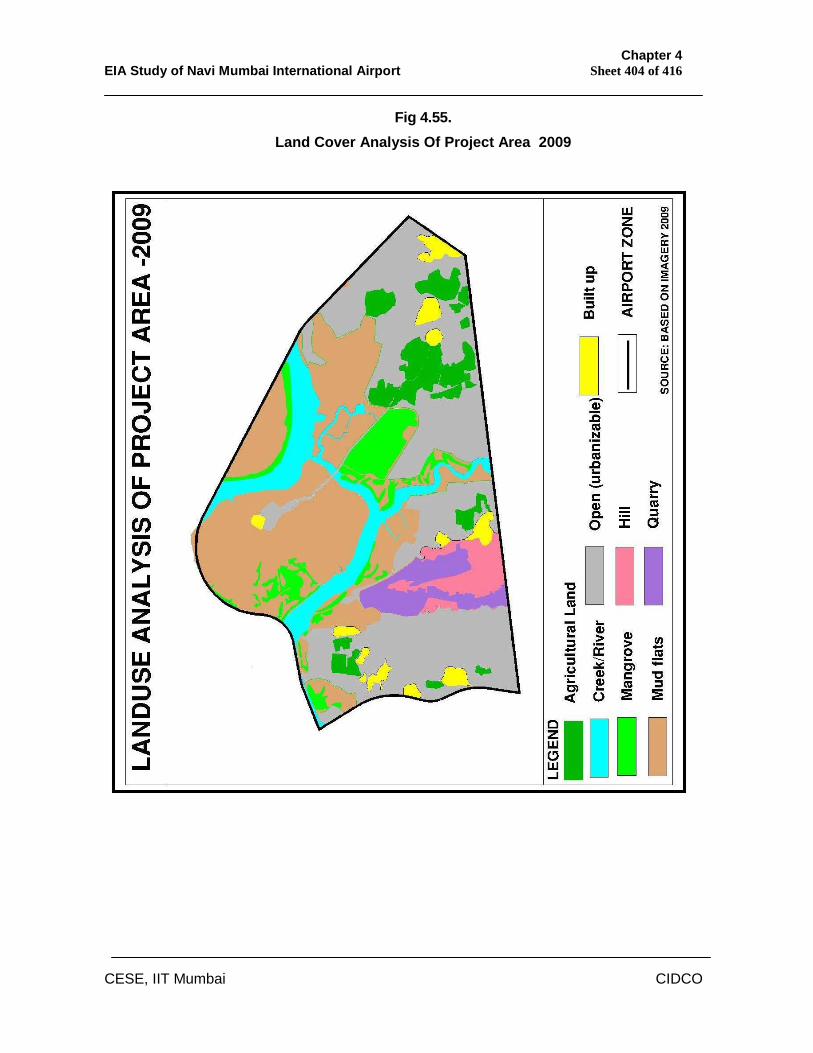
Chapter 4 EIA Study of Navi Mumbai International Airport Sheet 404 of 416
CESE, IIT Mumbai CIDCO
Fig 4.55. Land Cover Analysis Of Project Area 2009
Chapter 4 EIA Study of Navi Mumbai International Airport Sheet 405 of 416
CESE, IIT Mumbai CIDCO
4.18 Places of Ecological, Historical & Cultural Importance: The study area around proposed airport falling between the 10 kms. and 20
kms. known as fringe area described in Chapter-1 is studied to understand
the places of historic importance, aesthetic, cultural including sensitive area
and the same is narrated below:
4.18.1 The Elephanta Caves
The Elephanta Caves (180 56’ 20” N; 720 55’ 50” E), taluka Uran, district
Raigad is about 13.5 km form proposed project site and falls outside of core
area. It is located on island hills about 11 km North-East of the Apollo
Bandar, Mumbai and 7 km from the shore of the mainland, approximately
covering an area of 7 km in circumference. The island is named after a
colossal elephant found in the island, which is popularly known as
‘Gharapuri’. At present, the statue of elephant is housed at Jijamata Garden
in Mumbai. In ancient period, the place is variously identified as Puri which is
mentioned in the Aihole inscription of Pulakesin II. It seems, different
dynasties held their sway over this island, namely, the Konkan-Mauryas,
Trikutakas, Chalukyas of Badami, Silaharas, Rashtrakutas, Kalyani
Chalukyas, Yadavas of Deogiri, Muslim rulers of Ahmedabad and then by the
Portuguese. The Marathas also had this island under their control and from
them it passed into the control of the British.
There are seven cave excavations in the Elephanta group and these are
datable from circa 6th – 7th centuries A.D. Among the cave excavations, the
Cave 1 is the most impressive which represents the evolved Brahmanical
rock-cut architecture. The cave is also famous for the exquisite and vibrant
sculptures. On plan it almost resembles the Dumar Lena (Cave 29) of
Ellora. The cave has a main entrance on the North with two other openings
on the East and west respectively and a central hall with six rows of pillared
columns, six in each row except on the western corner, where a shrine of
lingam is provided.
Chapter 4 EIA Study of Navi Mumbai International Airport Sheet 406 of 416
CESE, IIT Mumbai CIDCO
On plan, there are three large square recesses divided off by pilasters each
of them bearing a gigantic image of a dvarapala. The panel on the East has
a figure of ardhanarisvara, a form of Siva with the combined energies of
male and female; and on the west figures of Siva and Parvati playing
chausar is carved. The central recess holds the most famous and
remarkable sculpture of this period known as the Mahesa-murti. It is a
colossal bust of the three forms of Siva, the aghora, turbulent and fearsome;
tatpurusha, benign and meditative and vamadeva, mild pleasing and
lovable. The other notable panels in the main cave are Andhakasuravada
murti; cosmic dance of Nataraja; Kalyanasundara murti; Gangadhara murti;
Ravana shaking Kailasa and Siva as Lakulisa. A panel depicting
Saptamatrikas near the Eastern opening is also remarkable.
The above site falls in the landing and take off funnel of Navi Mumbai
Interntional Airport. As the location from the airport site is about 13.5 kms.
where the position of aircraft during take off/landing/missed
approach/circling, will be more than 700 mts.
4.18.2 Karnala Bird Sanctuary
The sanctuary (18o 53' N and 70o 07' E) is situated along the Mumbai-Goa-
Konkan National Highway No.17 and 12.5 km from Panvel i.e. proposed
project site and falls outside of core area . Karnala Bird Sanctuary is located
in Panvel Taluka of Raigad District. The sanctuary is quite small with an
area of 4.27 Sq.kms. The sanctuary is very rich in avifauna and harbours
147 species of resident and 37 species of migratory birds who visit the
sanctuary during winters. Two rare birds i.e. Ashy Minimet and Spotted
heart woodpeckers have been sighted here.
Chapter 4 EIA Study of Navi Mumbai International Airport Sheet 407 of 416
CESE, IIT Mumbai CIDCO
Vegetation typifies moist deciduous forest and is characterised by species
such as Koshimb, mango, nana, kulu, kalam, asana, umbar and teak in the top
canopy. The ecological conditions of the tract favour a large variety of bird
population. The forests are also ideal as a harbourage to wild animals. A
casual walk through the forests is an unfailing source of joy, with the list of
bird-song ringing in the air. The sanctuary abounds in bird life and during the
migrating season from October to April as many as 140 species of birds have
been recorded. Karnala has two distinct seasons from the point of view of the
bird-watcher. At the onset of rains, one can see the paradise flycatcher with its
fairy-like white streamers, the shama or the magpie robin and the malabar
whistling thrush which are some of the most melodious avian songsters.
A variety of other birds is also seen nesting in the forest. The racket-tailed
drongo also nests here. Its skill in the air and felicity to mimic the call of other
birds make it a great favourite amongst the bird-watchers. The golden backed
woodpecker and the heart-spotted woodpecker are rather uncommon. In
winter, the migrants take over and the pattern of bird life changes. The
migrants include a variety of birds such as the blackbird, the blue-headed rock-
thrush, the bluethroat, the red brEasted flycatcher, the ashy minivet, the black
headed cuckoo-shrike and a host of others. Though Karnala is principally a
bird sanctuary, many other interesting forms wildlife like wild boar, the four-
horned antelope, the muntjak and the common langur also occur here.
The above site falls on South of airport area away from landing and take off
funnel of Navi Mumbai Interntional Airport. As the location from the airport
site is about 12.5 kms. where the position of aircraft during missed approach
and circling, will be more than 750 mts.
Chapter 4 EIA Study of Navi Mumbai International Airport Sheet 408 of 416
CESE, IIT Mumbai CIDCO
4.18.3 Matheran Eco-sensitive Zone
The Matheran Eco-sensitive Zone covers an area of 251.56 sq. kms. With a
buffer zone of 200 mts. of Matheran Municipal Council and its environs.
The boundary of eco-sensitive zone is located at about 11 km East of
proposed project site and falls outside of core area. Geographically
Matheran plateau lies between 18° 55’N Latitude and 73° 51’E Longitude
and it is to the west of main range of Western Ghats. Bio-geographically, the
region is important on account of being an outlier of the main Western Ghats
mountain chain and in effect sheltering a pocket of evergreen forest.
Surrounded by hill and dale topography Matheran presents a dynamic
landscape. The deep ravines around it are covered by dense forests and the
top of hill is a large plateau. Its general height above M.S.L. is 759m and the
highest point on it is at 803.45m. The laterite, which forms the upper strata
of the plateau, appears as a purplish red rock variegated with different
colours. Fragmented laterite cap is found in addition to the thick laterite clay
deposits. The major threat today Matheran is facing are the landslides due
to heavy rainfall and the weathered rock pattern itself. It is very rich on
accounts of biodiversity as it supports evergreen forest of Memecylon-
Syzigium-Actinodaphne type (Puri et al., 1983). Various tree species
commonly seen on the plateau are Olea dioica, Mangifera indica, Eugenia
jambolana, Ficus glomerata, Heterophragma roxburghii, Bridelia retusa and
Memecylon umbellatum. Predominant tree species on the slopes are
Terminalia tomentosa, Lagerstroemia parviflora, Adina cordifolia, Garuga
pinnata, Dillenia pentagyna, Pongamia glabra, Schleichera trijuga and
Bombax malabarica. It is also a home to endangered endemic mammal
species such as Ratufa indica elphinstonii (Giant squirrel).
The above site falls in the fringe of landing and take off funnel of Navi
Mumbai Interntional Airport. As the location from the airport site is about 11
kms. where the position of aircraft during take off/landing/missed
approach/circling, will be more than 500 mts.
Chapter 4 EIA Study of Navi Mumbai International Airport Sheet 409 of 416
CESE, IIT Mumbai CIDCO
4.19 Costal Regulation Zone
As described above, the training of Gadhi river and diversion of Ulwe river is
essential for making available land for airport zone admeasuring 1615 Ha.
The training of Gadhi and diversion of Ulwe rivers results in re-alignment of
CRZ belt along the above two rivers, warranting minor changes in approved
coastal zone management plan of Navi Mumbai.
The Coastal Zone Management Plan of Navi Mumbai was accorded
approval by MoEF vide letter No.-J-17011/8/95/1A-III dtd.27.09.1996. One
of the condition of above approval was the delination of high tide and low
tide line by Chief Hydrographer, Govt. of India, and, thereafter, the revised
CZMP Plan to be submitted to the Committee constituted under the Chief
Secretary, Govt. of Maharasthra for its approval. The high tide line of Navi
Mumbai was delinated by the Chief Hydrographer, Govt. of India, and
revised CZMP Plan was submitted to the above Committee who in turns
approve the same and submitted to MoEF vide letter
No.CZ/TPV/4396/12/CR-263/96/UD-11 dtd. 25th November, 1998. The
MoEF vide letter No.-J-17011/8/95/1A-III dtd.1st January, 2009
authenticated the CZMP Plan of Navi Mumbai.
The minor changes in approved CZMP Plan of Navi Mumbai is worked out
keeping the required distance in accordance with the provision of CRZ
Notification, 1991 on either side of trained/diverted portion of Gadhi and
Ulwe rivers. The following plans giving the above details are prepared and
described below:
Fig.4.56 and Fig.4.57 are the copy of approved Navi Mumbai Coastal Zone
Management Plan vide above letters pertaining to the airport zone under
consideration. The above plans shows the high tide line and low tide line
delineated by the Chief Hydrographer, Govt. of India as well as the
approved CRZ-II belt along the shore of Panvel & Taloja creeks.
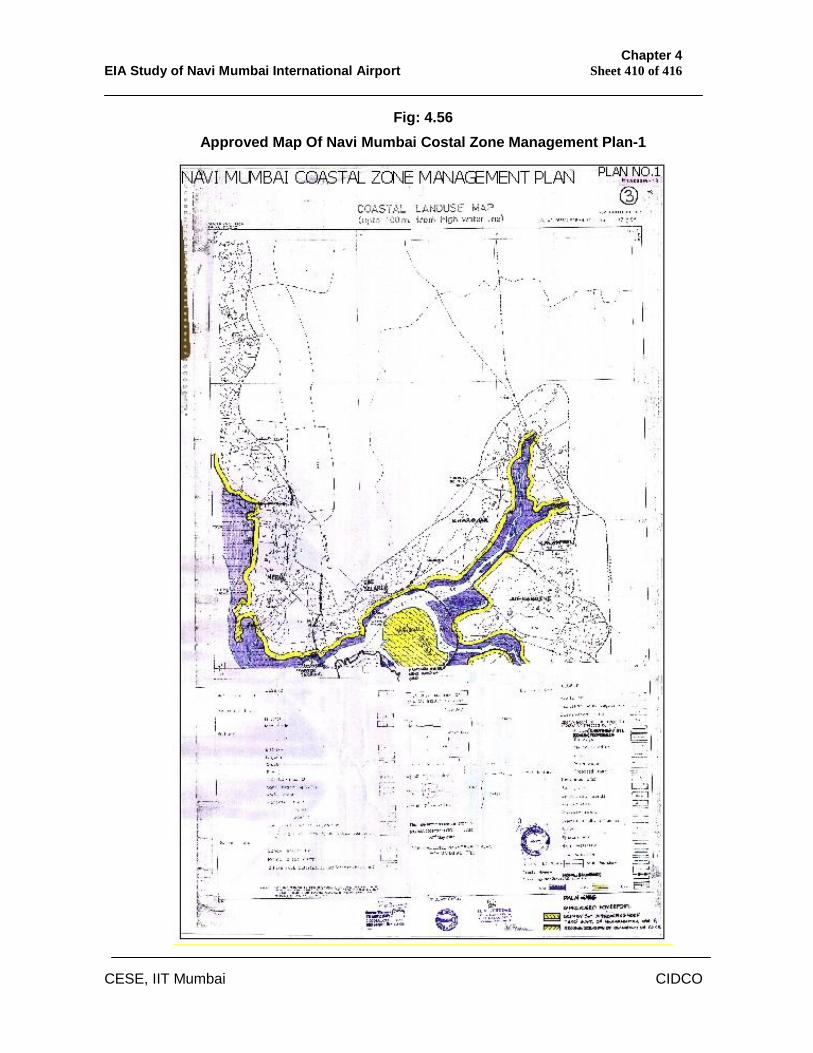
Chapter 4 EIA Study of Navi Mumbai International Airport Sheet 410 of 416
CESE, IIT Mumbai CIDCO
Fig: 4.56 Approved Map Of Navi Mumbai Costal Zone Management Plan-1
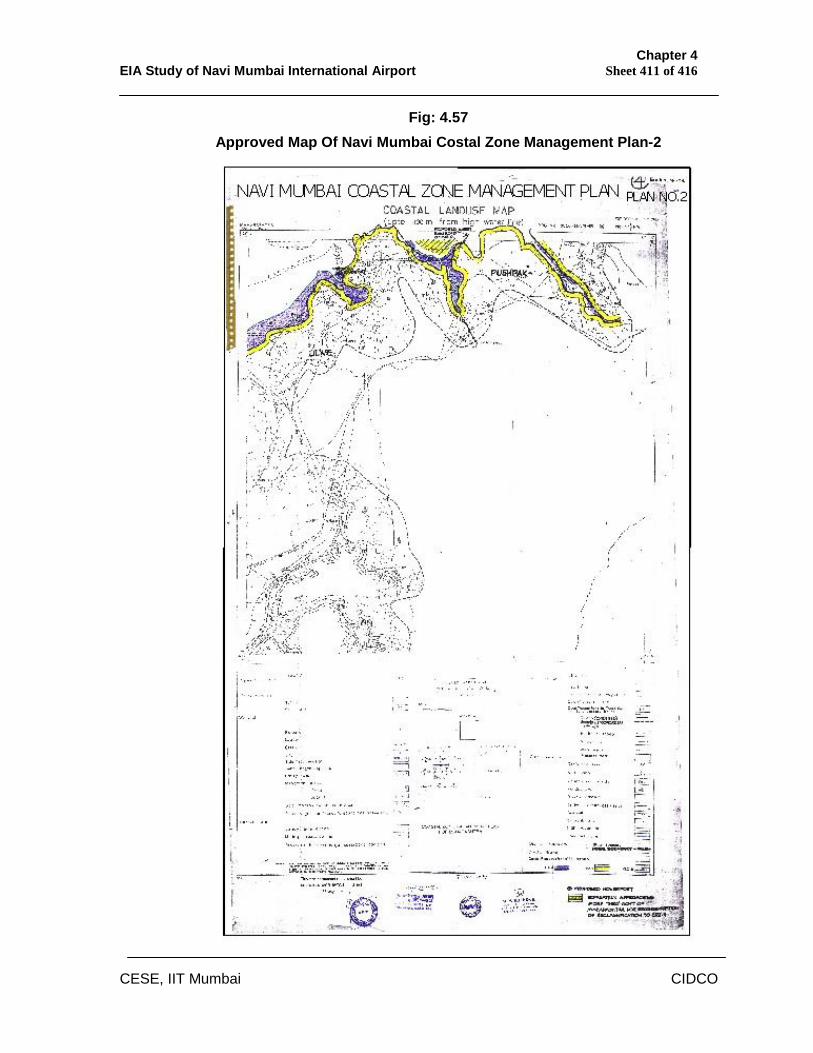
Chapter 4 EIA Study of Navi Mumbai International Airport Sheet 411 of 416
CESE, IIT Mumbai CIDCO
Fig: 4.57 Approved Map Of Navi Mumbai Costal Zone Management Plan-2
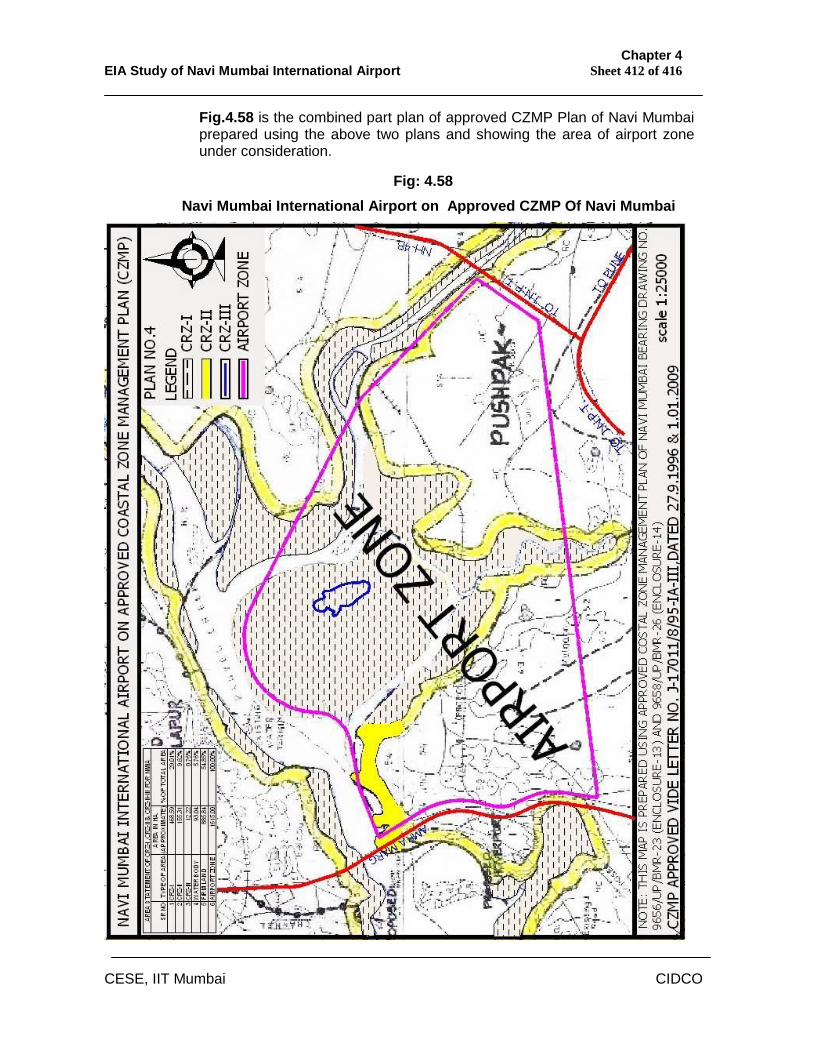
Chapter 4 EIA Study of Navi Mumbai International Airport Sheet 412 of 416
CESE, IIT Mumbai CIDCO
Fig.4.58 is the combined part plan of approved CZMP Plan of Navi Mumbai prepared using the above two plans and showing the area of airport zone under consideration.
Fig: 4.58 Navi Mumbai International Airport on Approved CZMP Of Navi Mumbai
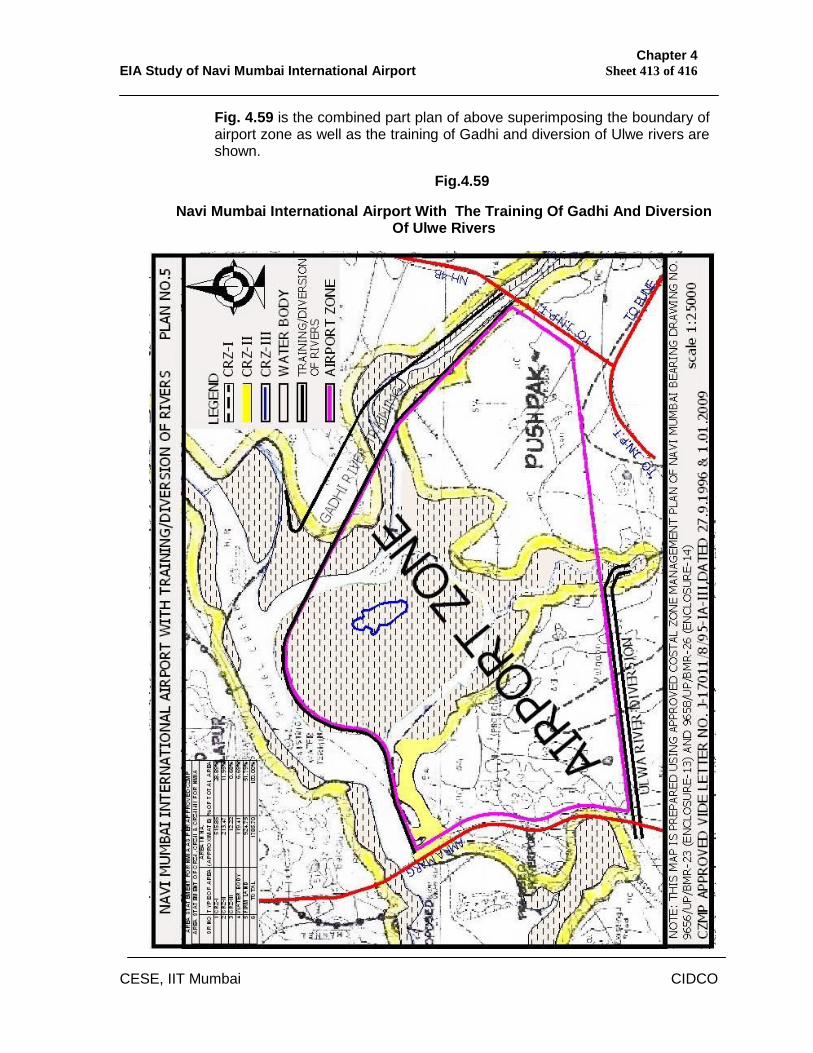
Chapter 4 EIA Study of Navi Mumbai International Airport Sheet 413 of 416
CESE, IIT Mumbai CIDCO
Fig. 4.59 is the combined part plan of above superimposing the boundary of airport zone as well as the training of Gadhi and diversion of Ulwe rivers are shown.
Fig.4.59
Navi Mumbai International Airport With The Training Of Gadhi And Diversion Of Ulwe Rivers
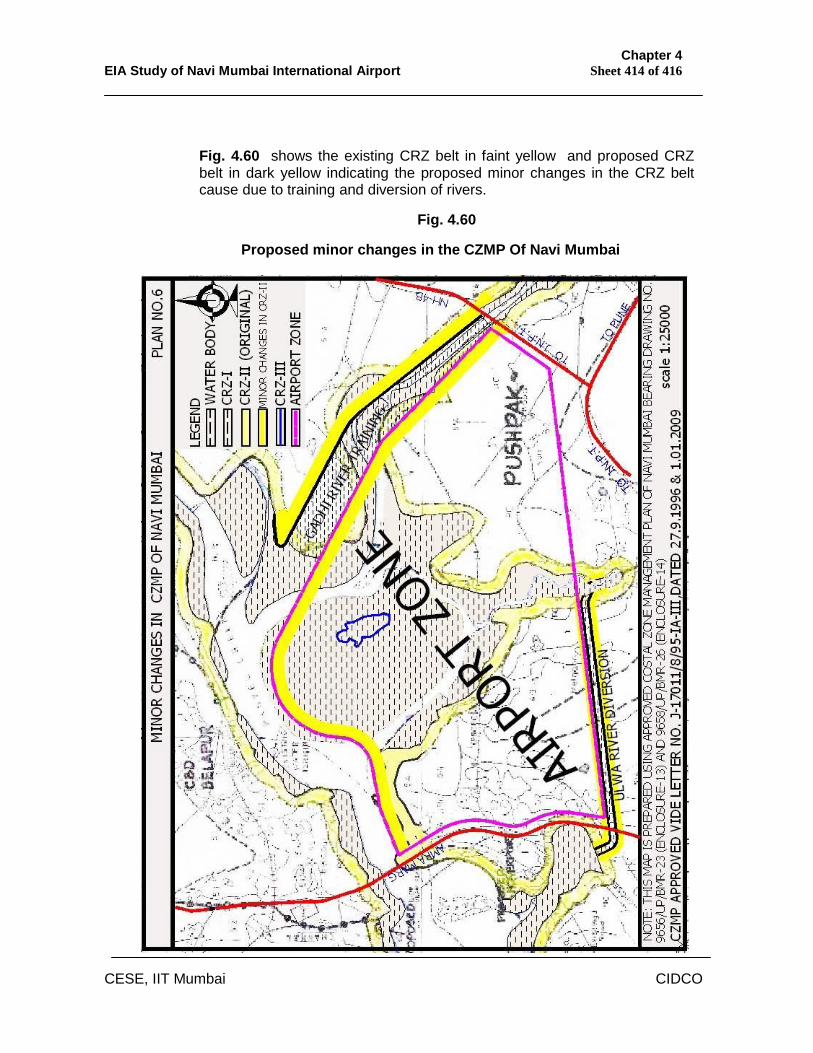
Chapter 4 EIA Study of Navi Mumbai International Airport Sheet 414 of 416
CESE, IIT Mumbai CIDCO
Fig. 4.60 shows the existing CRZ belt in faint yellow and proposed CRZ belt in dark yellow indicating the proposed minor changes in the CRZ belt cause due to training and diversion of rivers.
Fig. 4.60
Proposed minor changes in the CZMP Of Navi Mumbai
Chapter 4 EIA Study of Navi Mumbai International Airport Sheet 415 of 416
CESE, IIT Mumbai CIDCO
With the above plans and enabling provision in the amended CRZ
Regulation dtd. 15th May, 2009 the proposal for CRZ clearance was
submitted to Maharashtra Coastal Zone Management Authority in July,
2009. The above proposal was considered in the 54th Meeting of
Maharashtra Coastal Zone Authority held on 16th July, 2009 and
recommended to MoEF with following conditions:
i) CIDCO should carry out comprehensive environmental impact assessment
study of the area as per the ToRs to be approved by MoEF as mentioned in
Environmental Impact Assessment Notification of MoEF dated 14.09.2006
and copy of the same should be submitted to MoEF and MCZMA in print as
well as electronic format.
ii) CIDCO should prepare and submit detailed plan of diversion of two rivers
with the help of experts in the field. It may consult Water Resources
Department for the same. CIDCO should ensure that training, if approved by
MoEF, should be with smooth curves and at no point curve should be of 90º
to maintain the steady flow of water of the river originating from Matheran
hills. Impact assessment of the training on flora, fauna, socio economic
pattern, nearby human habitation and port areas should be a part of EIA
especially flooding in nearby areas.
iii) Details of the source of soil and other material to be used for reclamation of
water body, mangroves and other CRZ areas should be submitted. Authority
also desired that impact of cutting/razing of mountain in the CRZ area
should be studied with respect to coastal protection to the nearby habitats,
change in the tidal wave pattern, loss of habitats to various organisms,
compensatory plantation, rainfall pattern etc.
iv) Proper environmental management plan and disaster management plan
should be prepared and submitted.
v) Submission of working compensatory mangroves afforestation plan,
prepared with the help of experts in the field along with time-bound PERT
chart. Local mangroves species should be conserved and CIDCO should
open dedicated Environment Management Cell with experts from all fields. It
is also required that compensatory plantation should be completed prior to
Chapter 4 EIA Study of Navi Mumbai International Airport Sheet 416 of 416
CESE, IIT Mumbai CIDCO
the commencement of the project and report of the same should be
submitted to MCZMA and MoEF.
vi) Around 700 to 800 families which are living on island are required to be
relocated. CIDCO should ensure their proper rehabilitation and also ensure
that their livelihood should not get affected. Comprehensive plan for the
same shall be submitted.
vii) Authority also noted that their will be change in the approved CZMP of Navi
Mumbai due to proposed activity. CIDCO should submit the details of
impact of change in CZMP on nearby developable area as well as on JNPT
and other installations.
viii) Mangrove cutting in coastal areas of Maharashtra is a prohibited activity and
reclamation of land is not permissible as per CRZ Notification. CIDCO
needs to obtain prior permission of Hon. High Court with respect to its order
given in case of Writ Petition No. 3246/2004 and 87/2006 before
commencement of any work related to airport on ground.
ix) CIDCO should carry out the detailed study on impact of fishing and
livelihood of people depending upon the coastal area under consideration.
CIDCO should also take efforts to maintain the traditional livelihood and
socio-economic status of community supposed to be affected by the project
directly or indirectly.
x) Existing species of mangroves, other flora, fauna and aquatic species with
its environmental and socio-economic value should be properly documented
with the help of expert institute in the field.
xi) Measures for anticipated impacts of climate change and sea level rise on
proposed airport area and nearby area should be studied. Details of soil
characteristics, geology, impact of the proposed activity on transportation
and traffic management in Navi Mumbai area should be submitted.
xii) Total station Map of Airport as well as peripheral area of at lEast 5Km range
showing contours, drainage patterns, habitations, existing land-use, roads
etc. should be submitted to MCZMA and MoEF.