Embed Size (px)
Citation preview
...,.
. . . NATIONAL CENTER Series 10 . .
For HEALTH STATISTICS Number 14
VITAL and HEALTH STATISTICS
DATA FROM Tll E NATIONAL HEALTH SURVEY .
Illness, Disability,
andHospitalization
AmongVeterans United States =July 1957-June 1961
Selected statistics relating to disability days, the prevalence of chronic conditions, limitations affecting activity and mobility, hearing impairments, edentu Ious persons, hospital discharges, and days of hospitalization, by veteran status, age, fami iy income, and work status. Based on data COIIected in household interviews during the period July 1957-June 1961.
Washington, D.C. March 1965
U.S. DEPARTMENT OF
HEALTH, EDUCATION , AND WELFARE Public Health Service
Anthony J. Celebrezze Luther L. Terry
Secretary Surgean General
!“.
Public Health Service Publication No. 1000-Series 1O-NO.14
For sale by the Superintendent of Documents, U.S. Govemrnent Printing Office Washington, D.C., 20402- Prim M cents
NATIONAL CENTER FOR HEALTH STATISTICS
FORREST E. LINDER, PH. D., ~i?’tCtOf
THEODORE D. WOOLSEY, ~eptity Director
O. K. SAGEN, PH. D., ~~fi.rtanf Director
WALT R. SIMMOXS, .M.A., Statistical Advixor
.\LICE M WATERHOUSE, M. D.,Medical ~dvi~or
JAMES E. KELLY, D.D.S., Dental Advi~or
LOUIS R. STOLCIS, M..%, ~xccutive O#cPr
DIVISION OF HEALTH INTERVIEW STATISTICS
PHILIP S. LAWRENCE,SC, D., Chief
ELIJAHL. WIiITE, A$istant Chief
COOPERATION OF THE BUREAU OF THE CENSUS
Under the legislation establishing the National Health Survey, the Public Health Service is authorized to use, insofar as possible, the services or facilities of other Federal, State, or private agencies.
In accordance with specifications established by the National Health Survey, the Bureau of the Census, under a contractual arrangement, participates in most aspects of survey planning, selects the sample, collects the data, and carries out certain parts of the statistical processing,
Public Health Service Publication No. 1000-Series 1O-NO. 14
Lihry c)f Congress Cord N[tnthr 65-60030
----------------------------------------------------------
--------------------------------------------------------
----------------------------------------------------------------------------------
----------------------------------------------
------------------------------------------------------------------------------
--------------------------------------
CONTENTS
Introduction
Source of Data --------------------------------------------------------
I. Population Table
10 Average population used in obtaining rates shown inthis publication, by
2.
3.
4.
5,
veteran status and age: United States, July 1957-June 1961-----------Usually working populiation used in obtaining rates shown inthispublication, by veteran status and age: United States, July 1957-June 1961--Average population used in obtaining rates shown inthis publication, by veteran status and family income: United States, July 1957-June 1961--AveragePopulation used in obtaining ratesformenwith hearing aidsand impaired hearing shown in this publication, by veteran status and age: United States, July 1958-June 1959---------------------------------Average population used in obtaining rates formen who had lost allof their teeth shown in this publication, by veteran status, family income, and age: United States, July 1957-June 1958-------------------------
IL Disability Days ---------------------------------------------------Days of Restricted Activity bays of Bed Disability Days of Work Loss
Table 6. Average annual number and rate per person per year ofdaysof
restricted activity, bed disability, and work loss, by veteran status and age: United States, July 1957-June 1961-------------------------
HI. Chronic Illness and Long-Term Disability Men With One or More Chronic Conditions Prevalence of Selected Chronic Conditions Chronically Limited in Ability to Work ----------------------------Chronic Mobility Limitation
Page
1
1
2
3
3
4
4
5
6 6 6 6
7
8 8 8 9 9
-------------------------------------------------------
--------
----------- --------- ------- ------- -----
-----------------------------------------------------
--------------------------------------
---------------------------------
-------
-------------------------------------------------------
CONTENTS—Con.
Page
Table 7. Average annual number of men and percent of total population with one
or more chronic conditions under medical care, with one or more days of bed disability, by veteran status and age: United States, July 1957. June 1961
8. Average prevalence and rate per 1,000 population of selected medically attended chronic conditions, by veteran status, age, andcondition group: United States, July 1957-June 1961---------------------------------
9. Average annual number and percent of usually working veterans and nonveterans who are limited in their ability to work, by veteran status and age: United States, July 1957-June 1961-------------------------
10. Average annual number and percent of men with mobility limitations, by veteran status and age: United States, July 1957-June 1961-
IV. Hearing Impairments and Aids --------------------------------------Table
11. Average annual number and rate of men per 1,000 population with hearing aids and impaired hearing, by veteran status andage: United States, July 1958-June 1959
V. Loss of Teeth Table
12. Average annual number and rate per 100 population ofmen who had lost all of their teeth, by veteran status and age: United States, July 1957-June l958--------------------------------------------------
13. Average annual number and rate per 100 population ofmen who had lost allof their teeth, byveteran status, family income, and age: United States, July 1957-June l958---------------------------------------
VI. Hospital Discharges From Short-Stay Hospitals Hospital Daysand Average Length ofHospital Stay-
Table 14. Average annual number of discharges and number of discharges per
1,000 men per year, by veteran status, hospital ownership, and age: short-stay hospitals, United States, July 1957-June 1961-------------
15. Average annual number and percent distribution of discharges, by hospital ownership according to veteran status and family income: short-stay hospitals, United States, July 1957-June 1961-------------
16. Average annual number of hospital days and average length ofstay, by veteran status, hospital ownership, and age: short-stay hospitals, United States, July 1957-June 1961
17. Average annual number and percent distribution of discharges, by length-of-stay intervals according to hospital ownership and veteran status: short-stay hospitals, United States, July 1957-June 1961
18. Effect of dia~osis indeterminingwhether veterans utilizenon-Veterans Administration hospitals: short-stay hospitals, United States, July1957-June 1961
11
12
14
14
15
15
16
16
17
18 19
21
22
23
24
25
---------------------------------------------------------------------------
---------------------------------------------------------------------
---------------------------------------------------------------------
-----------------------------------------------------
---------------------------------
------------------------------------------------------------------
----------------------------------------------------------------------------
--------------------------------------------
CONTENTS—Con.
Page
Appendix I. Technical Notes on MethodsBackground of ~is Re~rtStatistical Design of the Health Interview SurveyGeneral QualificationsReliability of EstimatesGuide to Use of Relative Standard Error Charts
Appendix II. Definitions of Certain Terms Used in This ReportTermsRelating to DisabilityTermsRelating to ChronicConditionsClassification of Impairments (X-Code)-------------------------------TermsRelating to Long-Term DisabilityTerms Relating to HospitalizationTerms Relating to Special Aids --------------------------------------Dental TermsDemographic, Social, Economic, and OtierTerms
Appendix III. Questionnaire
26 26 26 27 27 29
36 36 36 37 38 38 39 39 39
41
------------------------ ---
------------------
----------------------------
------------------
SYMBOLS
Data not available
Category not applicable . . .
Quantity zero -
Quantity moretban Obutless than O.05----- 0.0
Figure doesnot meet standards of reliabilityor precision *
ILLNESS, DISABILITY, AND HOSPITALIZATION€AMONG VETERANS€
Robert R. Fuchsberg, Division of Health Interview Statistics€
INTRODUCTION
Many organizations both governmental and nongovernmental are concerned with the problems of veterans. These organizations provide financial aid, insurance, loans, workshops, job placement, individual and family counseling, medical care, hospital services, health appliances, and transportation equipment to selected groups of the veteran population. Current statistics describing the health, disability, medical, and hospital care status of the veteran population may provide these organizations and the general population with a better understanding of the health problems and medical needs of this group.
All data in this report exclude women. In this report, the veteran is defined as the wan who has served in the Armed Forces of the United States during a war (including the Korean conflict). Men who have served in the U.S. Armed Forces during peacetime only are included in the nonveteran category. Current members of the Armed Forces and persons in institutions other than short-stay hospitals are also excluded from the data. There-fore, veterans in nursing homes or other institutions are not represented in either the health characteristics or in the population data upon which rates are based.
SOURCE OF DATA
The information contained in this report was obtained from nationwide household interviews conducted by the Health Interview Survey, National Center for Health Statistics. The data in this re-port represent annual averages and annual rates
which are, for the most part, based on 4 years of data collection covering the period July 1957-June 1961 and are estimated from information obtained from about 485,000 persons in 149,000 households. Data in Section IV on hearing impairments and aids and data in Section V on loss of teeth are based on information obtained from interviews conducted during a 12-month period. Section IV data were obtained during the period July 1958-June 1959 when interviews were conducted in 37,000 households including about 120,000 persons. Data in Section V were obtained during July 1957-June 1958 from information obtained in 36,000 households including 115,000 persons.
From a wide range of topics included in the basic survey, certain health topics were selected for presentation in this report because of their importance in describing the health characteristics of veterans. In selecting these topics, the criteria for selection included the reliability and completeness of household interview data plus the need for information to determine both the health status of veterans and their use of short-stay hospitals. The reader should bear in mind when using these data that the Health Interview Survey covers the health and hospital experiences of persons living in the household at time of inter-view. The hospital experience of persons who died prior to the date of interview, but who were hospitalized during the previous year, is excluded from the data by this procedure. Because of the higher mortality rate, this limitation particularly affects the data for the older age groups.
This report is divided into six sections:
(1) population, (2) disability days, (3) chronic illness and long-term disability, (4) hearing
impairments and aids, (5) loss of teeth, and (6) hospital discharges from short-stay hospitals.
A description of the design of the Survey, the methods used in estimation, and the general qualifications of the data obtained from the Survey is presented in Appendix I. Since the estimates shown in this report are based on a sample of the population rather than on the entire population, they are subject to sampling errors. Therefore, particular attention should be paid to the section entitled, “Reliability of Estimates. ” Sampling errors for most of the estimates are of relatively low magnitude. However, where an estimated number or the numerator or the denominator of a rate or percentage is small, the sampling error may be high. Charts of relative sampling errors and instructions for their use are shown in Appendix I.
Definitions of certain terms used in this re-
port are shown in Appendix II. Since many of the terms have specialized meanings, it is suggested that the reader familiarize himself with these definitions. A facsimile of the Health Interview Survey Questionnaire used during the period July 1957 -June 1958, plus a question dealing with special aids (including hearing aids) which was used during July 1958-June 1959, are illustrated in Appendix III.
1. POPULATION
The distribution of the veteran population by age group varies significantly from that of the nonveteran population. These differences are due to the large number of men 18-35 years of age recruited or drafted into the military services during wartime.
Persons who served in the Armed Forces during wartime only represent a major part of the veteran population. Because of the wide fluctuations in the size of the military population through-
out the years, the veteran and nonveteran population have peculiarly skewed age distributions which make comparisons difficult. Figure 1 shows the veteran population composed almost exclusively of veterans of the Korean conflict (per-sons under 35 years of age), World War H veterans (persons 35-59 years), and World War I veterans (persons 60 years and older). The peaks approxi-
PERCENTOF MALEPOPULATION
20 30 40 50 60 70 8C
AGE
Figure 1. Proportion of veterans and nonveterar, s
in the male population, by age,
mate the average age of the veterans of each of these wars.
Because of this problem of differing age com. position of the veteran and nonveteran population, most of the tables included in this report present age-specific rates, with age-adjusted rates for the total group. Each age-adjusted rate may be identified in the tables since these are underlined. These rates have been adjusted to the age distri bution of the male civilian, noninstitutional popu.. lation of the United States 20 years of age and over shown in the following tables.
Another factor which should be considered in comparing the veteran with the nonveteran popu-. lation is the basis for selection of members of the Armed Forces. Each male who attempts to enlist or who is drafted for service in the Armed Force:: is given a comprehensive health examination prior to his induction. He is accepted for military serv. ice only if he meets certain standards of health Therefore, the veteran population which is drawn from the military services was preselected on tht
------ ------
basis of physical and mental tests. An offsetting factor is the military service during wartime which imposes physical and mental stresses that may have adverse effects on the health of members of the Armed Forces and be reflected later in the health status of the veteran population.
In this report, the veteran and the nonveteran are compared as to health status and the use of health facilities but it ‘should be borne in mind that during the time when the country was at war, a segment of the adult male population was selected for military service on the basis of age, health, and other specific characteristics. Those who
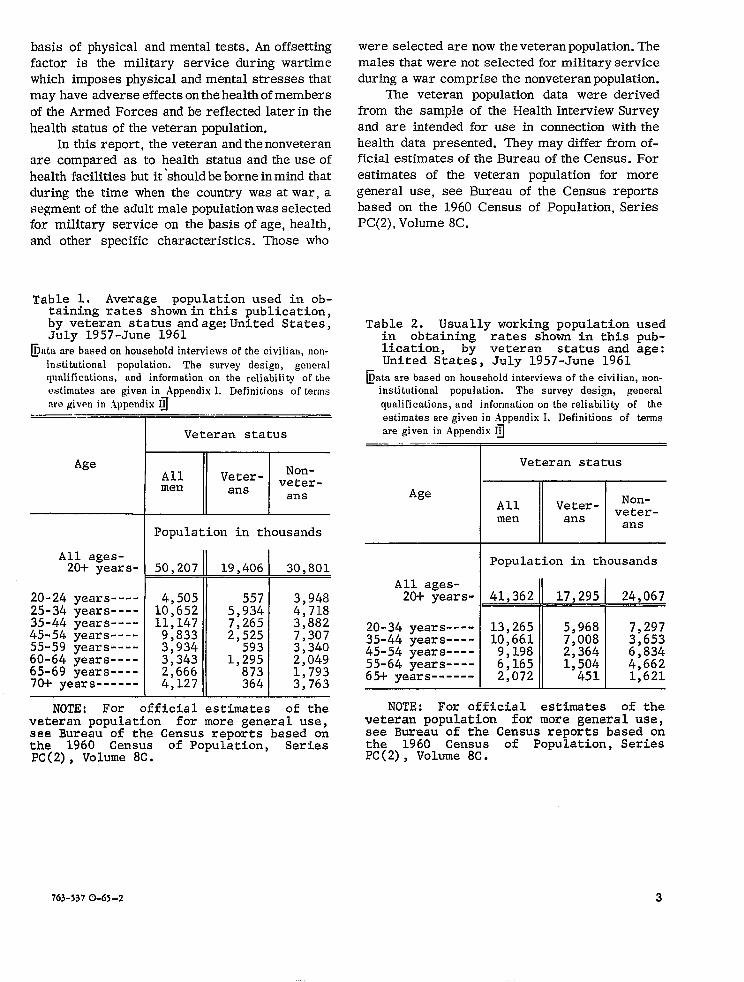
Table 1. Average population used in obtai.ni,ng rates shown in this publication, by veteran status and age United States, July 1957-June 1961
~,,ta are based on household interviews of the civilian, non-institutional population. The survey design, general qualifications, and information on the reliability of the
estimutes are given in Appendix I. Definitions of terms we given in .ippendix 1~
Veteran status
Age II I
All Veter- &;men ans ans
Population in thousands
All ages-20+ yeara- mdlJ2@L30,801
20-24 years---- 4,505 557 3,948 25-34 years---- 10,652 5,934 4,718 35-44 years---- 11,147 7,265 3,882 4$-54 years---- 9,833 2,525 7,307 55-59 years---- 3,934 593 3,340 60-64 years---- 3,343 1,295 2,049 ;16;e9y;rs---- 2,666 873 1,793I4,127 364 3,763
NOTE: For offi.ci,al estimates of the veteran population for more general use, see Bureau of the Census reports based on the 1960 Census of Population, Series Pc(2), Volume 8C.
763+7 0-65-2
were selected are now theveteranpopulation. ‘The males that were not selected for militaryservice during a war comprise the nonveteran population.
The veteran population data were derived from the sample of the Health Interview Survey and are intended for use in connection with the health data presented. l%eymay differ from officialestimates of the Bureau of the Census. For estimates of the veteran population for more general use, see Bureau of the Census reports based on the 1960 Census of Population, Series PC(2), Volume 8C.
Table 2. Usually working population used in obtaining rates shown in this publication, by veteran status and age: United States, July 1957-June 1961 .
Data are based on household interviews of the civilian, non-institutional population. The survey design, general qualifications, and information on the reliability of the estimates are given in Appendix I. Definitions of terms are given in Appendix I~
— . —.
Veteran status
Age All Veter- v;~; men ans ans
Population in thousands
All ages-20+ years- Wdx22E 24.067
20-34 years---- 13,265 5,968 7,297 35-44 years---- 10,661 7,008 3,653 45-54 years---- 9,198 2,364 6,834
6,16555-64 years---- T 1,504 4,662 65+ years 2,072 451 1,621
NOTE: For offi.ci.al estimates of the veteran population for more general use, see Bureau of the Census reDorts based on the 1960 Census of Population, Series Pc(2), Volume 8c.
3
--------
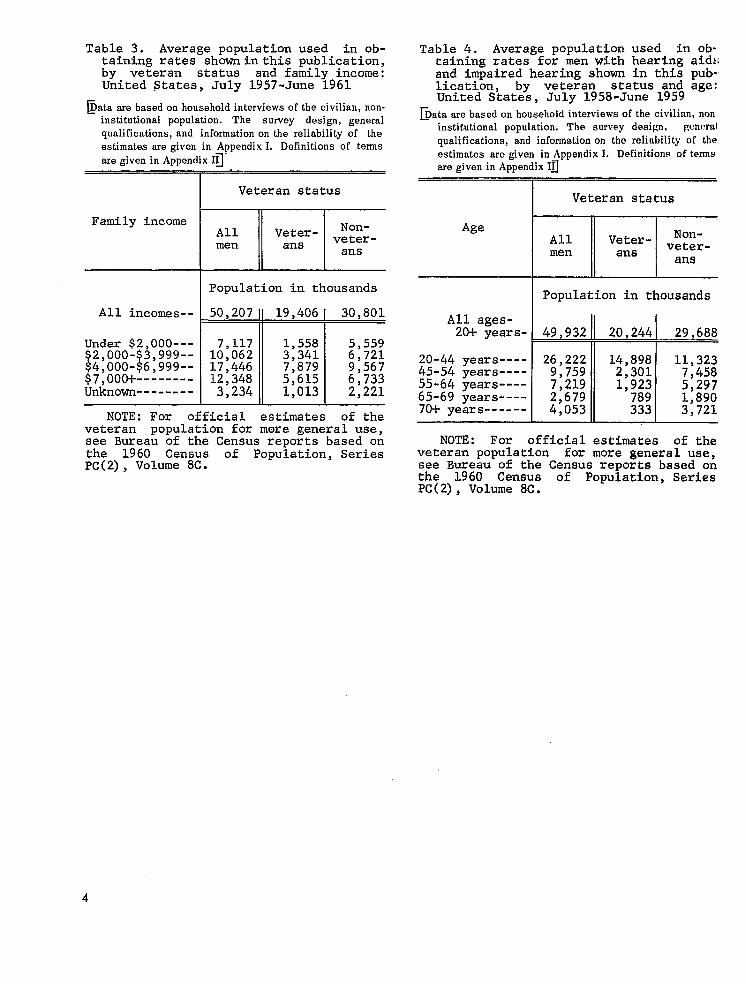
Table 3. Average population used in obtaining rates shownin this publication,by veteran status and family income:United States, July 1957-June 1961
Data are based on household interviews of the civilian, norlinstitutional population. The survey design, general qualifications, and information on the reliability of the estimates are given in Appendix I. Definitions of terms are given in Appendix In”
I
I Veteran status
I Population in thousandsAll incomes-- 50,20711 19,406I 30,801
IUnder $2,000--- 73117 1,558 5,559$2,000-$3,999-- 10,062 ;,;3; ;,;:;$4,000-$6,999-- 17,446$7,000+-------- 12,348 5;615 6;733Unknown 3,234 1,013 2,221
1 11 I
NOTE: For official estimates of theveteran population for more general use,see Bureau of the Census reports based onthe 1960 Census of Population, SeriesPC(2), Volume 8C.
Table 4. Average population used in obtaining rates for men with hearing aid::and im~aired hearing shown in this publicati&, by vete?an status and ige:United States, July 1958-June 1959
~ata are based on household interviews of the civilian, non institutional population. The survey design, ~cneral qualifications, and information on the reliability of the estimates are given in Appendix I. Definitions of terms are given in Appendix ID
I
I Veteran status
‘gem Population in thousandsI
All ages-20+ years- 49,932 20,244 29,688
20-44 years---- 26,222 14,898 1;,;;; 45-54 years---- 9,759 2,301 55-64 yeats---- 7,219 1,923 ;;;;; 65-69 years---- 2,679 789 70+ years------ 4,053 333 3;721
NOTE: For official estimates of theveteran population for more general use,see Bureau of the Census reports based onthe 1960 Census of Population, SeriesPC(2), Volume 8C.
---- ----
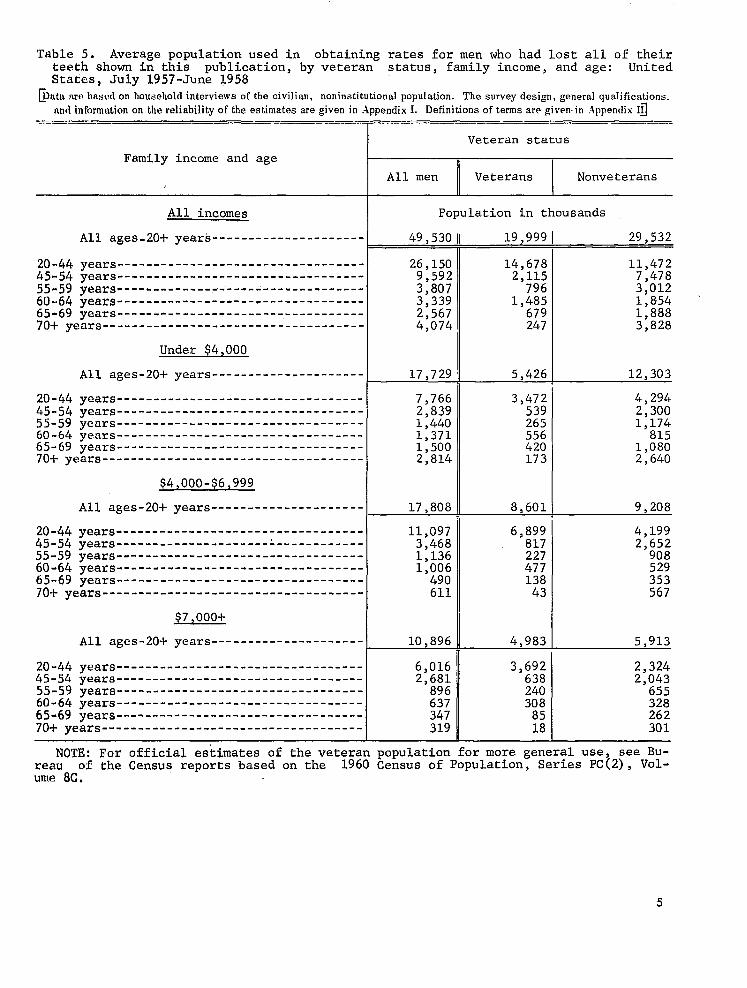
Table 5. Average population used in obtaining rates for men who had lost all of theirteeth shown in this publication, by veteran status, family income, and age: UnitedStates, July 1957-June 1958
@mw am based on household interviews of the civilian, noninstitutional population. The survey design, general qualifications.
nndinformutionon the reliability of the estimates are given in .Appendix I. Definitions oftermsaregiven. in .Appendix Ifl =. —.———-—.—. —..—.—.. -—— ——. -
Veteran status
Family income and age
All men Veterans Nonveterans
All incomes Population in thousands
All ages-20+ years--------------------- 49,530 19,999 29,532
20-44 years---------------------------------- 26,150 14>678 11,472 45-54 years---------------------------------- 9,592 2,115 7,478 55-59 years---------------------------------- 3,807 796 3,012 60-64 years -----.-------------.-------------. 3,339 1,::; 1.854 65-69 years---------------------------------- 2,567 1;888 70+ years------------------------------------ 4,074 247 3,828
Under $4,000
All ages-20+ years--------------------- 17,729 5,426 12,303
years---------------------------------- 7,766 3,472 4,294 years---------------------------------- 2,839 539 2,300 veals---------------------------------- 1,440 265 1,174
60-64 bears---------------------------------- 1,371 556 65-69 years---------------------------------- 1,500 420 1,080 70+ years------------------------------------ 2,814 173 2,640
$4,000-$6,999
years--------------------- 17,808 8,601 9,208
20-44 years---------------------------------- 11,097 6,899 4,199 45-54 years---------------------------------- 3,468 817 2,652 55-59 years---------------------------------- 1,136 227 908 60-64 years---------------------------------- 1>006 477 529 65-69 years---------------------------------- 490 138 353 70+ years------------------------------------ 611 43 567
All ages-20-!-
All ages-20+ years--------------------- 10,896 4,983 5,913
20-44 years---------------------------------- 6,016 3,692 2,324 45-54 years---------------------------------- 2,681 638 2,043 55-59 veals---------------------------------- 896 240 655 60-64 ~ears---------------------------------- 637 308 328 65-69 years ---------.--.------------- 347 85 262 70+ years------------------------------------ 319 18 301
NOTE: For official estimates of the veteran population for more general use, see Bureau of the Census reports based on the 1960 Census of Population, Series PC(2), Volume 8C.
815
Il. DISABILITY DAYS
Illness or injury may result in one or several of the following types of short-term disability: the condition may cause a person to restrict his usual activities; the condition may be serious enough to cause the person to stay in bed; and, if the restriction of activities occurs on a day when the person would have been working, time loss from work will result. Days of restricted activity, days in bed, and days lost from work are all considered to be measures of disability. However, because the same disability day may be counted in each of several of these measures of disability, they are not additive.
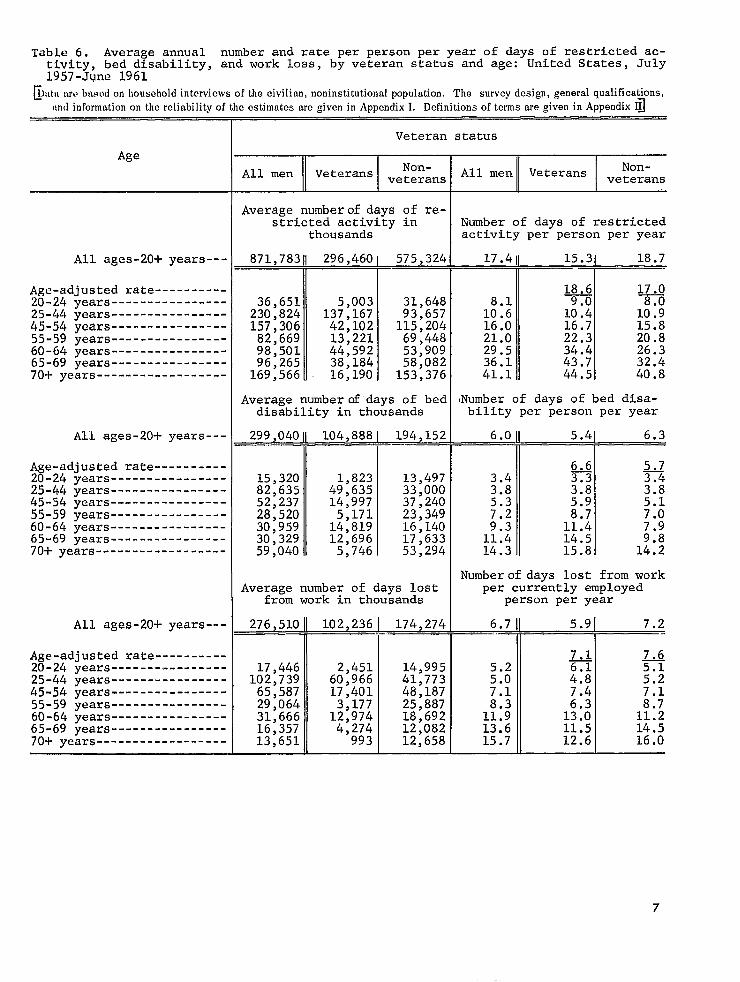
Although the disability rates for veterans are generally higher than for nonveterans within the age-specific groups, the nonveteran disability rates for the all ages group are consistently higher than the rates for veterans. This is due to the difference in the age composition of the veteran and nonveteran population since age adjustment causes a reversal of the rate pattern in the all ages group for both days of restricted activity and days of bed disability. Age adjustment also brings the work-loss rate for veterans to within one-half day of the rate for nonveterans.
Days of Restricted Activity
‘I’he temporary disability caused by illness or injury resulted in an annual average of 17.4 days of activity restriction for each male in the population 20 years of age and older based on data collected during the 4-year period July 1957-June 1961. Veterans averaged 15.3 days of restricted activity per year while nonveterans averaged 18.7 days. This rate variation was due to the difference in the age composition of the veteran and nonveteran population. When these data were adjusted for age, there was a reversal in the pattern and the rate for veterans became 18.6 days compared with 17.0 days of restricted activity for nonveterans (table 6).
In table 6 the number and rate of restricted-activity days by age group and veteran status are shown. The rates of restricted-activity days consistently increased with age from a rate of 8.1 days per year for men 20-24 years of age to 41.1 days for men 70 years and older. Both veteran and non-
veteran rates are similarly related to age but in each age group except for the 25-44 group, the restricted-activity rates were higher for veterans than for nonveterans.
Days of Bed Disability
Men 20 years of age and older averaged 6.0 days of bed disability per year; that is, 6.0 days on which they were kept in bed either all or most of the day because of illness or injury. As was the case with days of restricted activity, the nonveterans had a higher rate of bed disability (6.3) than the veterans (5.4). When these rates were adjusted for the age difference in the two population groups, again there was a reversal and the rate for veterans became 6.6 days compared with 5.7 days for nonveterans (table 6).
Within age groups, the rates of bed disability ranged from 3.4 bed days for men 20-24 years of age to 14.3 days for those 70 years of age and over. The rates were the same for veterans and nonveterans under 45 years of age, but in each of the age groups over 45, the veteran group re-ported higher rates of bed disability than the nonveteran group.
Days of Work Loss
The last of these disability measures, days of work loss, combines a measurement of the disabling effects of illness and injury with a measurement of economic impact in terms of days lost from work by currently employed persons. Currently employed men (20 years of age and older) lost 6.7 days from work per year due to illness or injury during the 4-year period July 1957-June 1961. Veterans averaged about 1 day less of work loss than nonveterans but when these rates were age adjusted, the rate for veterans (7, 1) was one-half of a day less than the rate for nonveterans . (7.6). In several of the age groups veterans had a higher rate of days lost from work than non-veterans. In the age groups 20-24 and 60-64 years, veterans reported higher rates of work loss than nonveterans. In the 55-59, 65-69, and the 70 years and over groups the work-loss rate for nonveterans was higher, Rates for each of the other age groups were about the same for the veteran and the nonveteran population (table 6).
----------------------------------------------------------------------------------------------------------
------------------
----------------------------------------------------------------------------------------------------------
------------------
----------------------------------------------------------------------------------------------------------
------------------
Table 6. Average annual number and rate per person per year of days of restricted activity, bed disability, and work loss, by veteran status and age: United States, July1957-June 1961
hr~ewiews@ItiLMO bnsed on household of the civilian, noninstitutional population. The survey design, general qualifications, mrd information on the reliability of the estimates are given in Appendix I. Definitions of terms are given in Appendix Id
Veteran status
Age
All ages-20+ years---
Age-adjusted rate20-24 years25-44 years45-54 years55-59 years60-64 years65-69 years70+ years
All ages-20+ years---
Age-adjusted rate20-24 years25-44 years45-54 years55-59 years60-64 years65-69 years70+ years
All ages-20+ years---
Age-adjusted rate20-24 years25-44 years45-54 years55-59 years60-64 years65-69 years70+ years
Non-All men IIVeterans veterans
Average numberof days of restricted activity in
thousands
871,783 1 296,460 575,324
36,651 5,003 31,648 230,824 137,167 93;657 1;; ,::: 42,102 115,204
13,221 69,448 98:501 44,592 53.909 96,265 38,184 58;082 169,566 16,190 153,376
Average numberof days of beddisability in thousands
299,040 104,888 194,152—— .— .——
15,320 1,823 13,49782,635 49,635 33,00052,237 14,997 37,24028,520 5,171 23,34930,959 14,819 16>14030,329 12,696 17,63359,040 5,746 53>294
Average number of lys lostfr~m work in thousands
276,510 102.236 174,274
17,446 2,451 14,995 102,739 60,966 41,773 65,587 17,401 48,187 29,064 3,177 25,887 31,666 12,974 18,692 16,357 4,;;; 12,082 13,651 12,658
Noni-l men Veterans I veterans ~mber of days of restrictedztivity per person per year
17.411 15.3 18.7
~ l~o 8.1
10.6 1::: 1::: 16.0 16.7 15.8
T 21.0 22.3 20.8 29;5 34.4 26.3 36.1 43.7 32.4 41.1 44.5 40.8
]mber of days of bed disability per person per year
6.0II 5.41 6.311 1
3.43.8
;:;9.3 11.411.4 14.514.3 15.8
]mberof days lost from workper currently employed
person per year
6.7 II I —~
::: 5.2 7.1 7.1
8.7 1::; 11.2 13.6 11.5 14.5 15.7 12.6 16.0
7
Ill. CHRONIC ILLNESS
AND LONG-TERM DISABILITY
Available from the data collected in the Health Interview Survey are many measures of health status which may be used to compare the veteran and the nonveteran population. Among the most significant of these measures are the rates of chronic illness and impairments and the rates of persons who are limited in their activity or mobility because of chronic illness.
Men With One or More Chronic Conditions
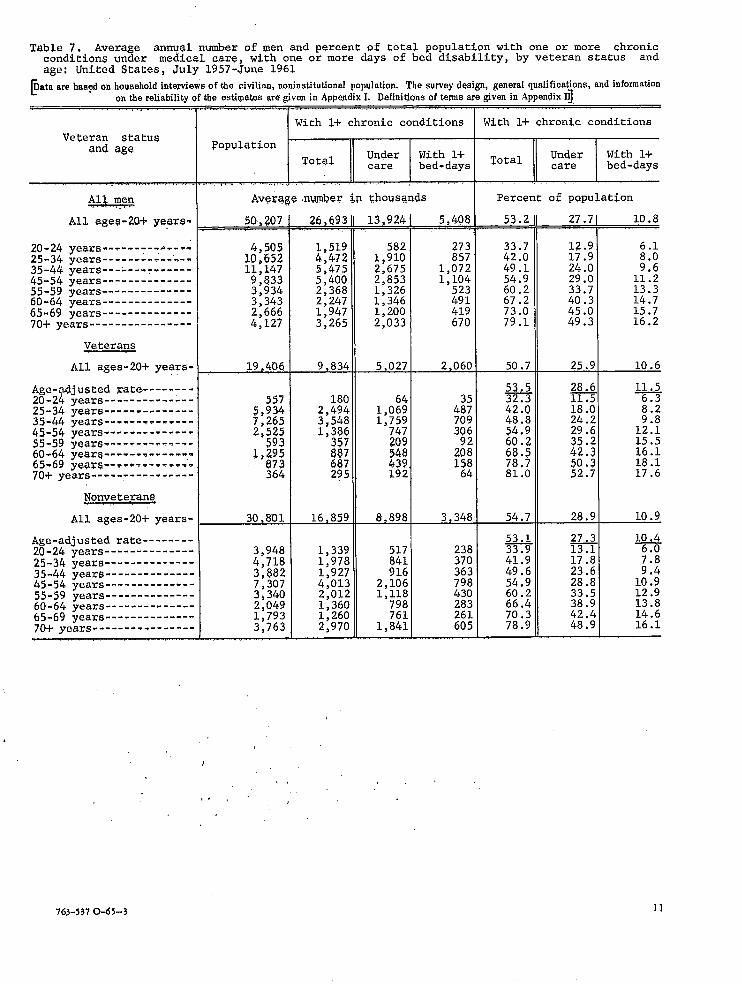
The most comprehensive of these measures of the extent of chronic illness in these population groups is the proportion of persons with one or more chronic conditions. Based on data collected during July 1957 -June 1961, excluding persons in institutions, an estimated total of 26,693,000 men 20 years of age and over in the United States had one or more chronic conditions. This total represents 53.2 percent of the adult male population. Men with at least one chronic condition include persons with life-threatening diseases such as heart disease or cancer as well as persons with minor ailments such as sinusitis or hay fever (table 7).
Among veterans, ~ ,834,000 men or 50.7 per-cent reported that they had one or more chronic conditions. In the nonveteran group, 16,859,000 or 54.7 percent had at least one chronic condition. This higher total rate for nonveterans is a function of the age distribution within the nonveteran and veteran population groups, since the age-adjusted proportion of persons with one or more chronic conditions was 53.5 percent for veterans and 53.1 for nonveterans. Although about half of the veteran and nonveteran population had one or more chronic conditions less than one-third of all veterans and also of nonveterans had one or more chronic conditions “under care.” A condition “under care” is defined as one for which the person is still ‘.’under instruction” from a physician.’ ‘Under instruction” includes one or more of the following: (1) taking certain medicine or treatment prescribed by a physician, (2) observing a certain systematic course of di;t or activity, (3) visiting the physician
regularly for checking on the condition, and (4; under instruction from the physician to return ii some particular thing happens.
Adult males (10.8 percent) had one or more chronic conditions which caused them to be con-fined to their bed for at least 1 day during the 12 months preceding the week of interview. Thus I among both veterans and nonveterans it is found that more than half of the population had chronic conditions, less than a third “had one or more chronic conditions “under care, ” and a hut 11 percent had 1 or more days of bed disability in the year due to chronic illness.
Although there is a slight variation in some of the age-specific rates of chronic illness among veterans and nonveterans, there seems to be no consistent pattern. Analysis of table 7 reveals that with the exception of persons 60 years and over, there is little or no difference within each of the age groups in the proportion of veterans and non-veterans with chronic conditions nor in the severity of those conditions as measured by the “under care” and bed-disability criteria. When
persons 60 years and over are considered as a composite age group, the percentage of veterans with chronic illness is practically the same as that for nonveterans. The apparent differences noted in table 7 for specific age groups are probably chance variations associated with small numbers of persons in the sample. The cumulative nature of chronic illness and the severity of chronic diseases among veterans and nonveterans increases with age.
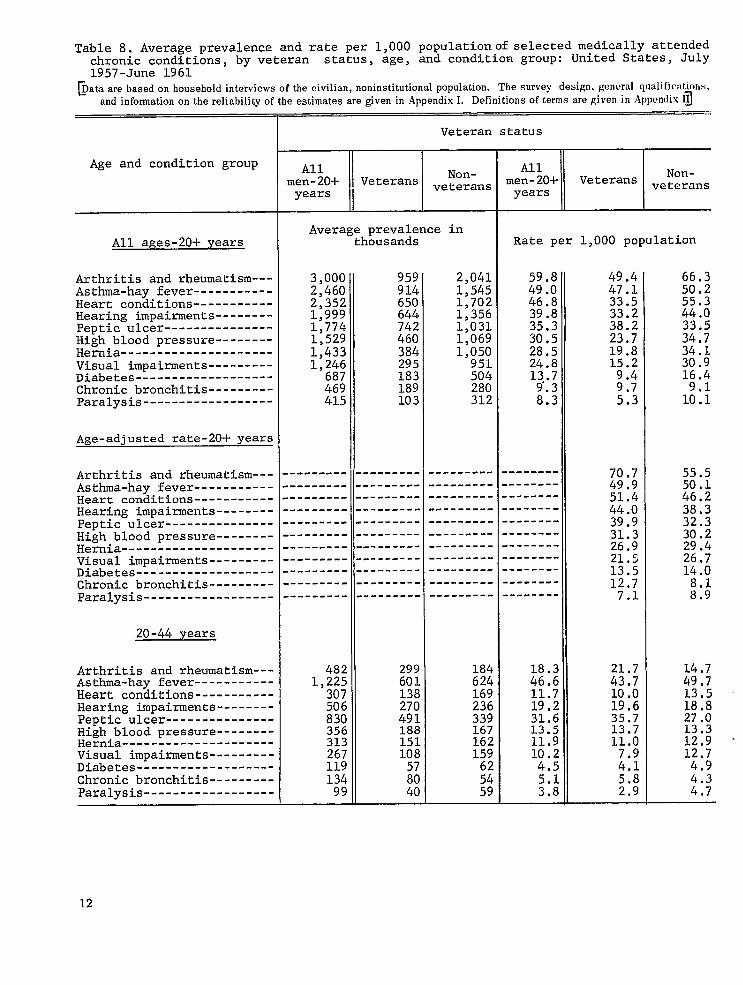
Prevalence of Selected Chronic Conditions
Data on medically attended chronic illness obtained from household interviews may differ considerably from chronic illness data obtained from medical examinations. In a medical examination illness is detected through recognized
diagnostic tests and clinically significant sympt
oms. In household interviews respondents report information received from the physician or symptoms which the y have observed. A respondent cannot be expected to report in an interview a condition of which he is unaware, but such a condition may be detectable by clinical examination. In this report, the prevalence of selected medi-
8
tally attended chronic conditions should be regarded as those that had been brought to a physician’s attention and those that respondents knew about and were willingto report in-house-hold interview. Indications are that conditions which had been checked recently or repeatedlyby a physician or which had resulted in some form of disability or physical distress were well re-ported.
The selected chronic condition groups are listed below with their equivalent International Classification Code Numbers or Supplementary Impairment Code Numbers. (See Appendix II for definition of Impairment Classifications.)
Intemzationul Chronic Condition Classification
Group Code Numbers, 1955 Revision
Heart conditions 410-443 High blood pressure 444-447 Diabetes 260 Peptic ulcer 540-542 Arthritis and rheumatism 720-727 Hernia 560-561 Asthma-hay fever 240-241 Chronic bronchitis 502
Supplementary Impairment Gvoup Impairment
Code Numbers
Visual impairments XOO-X05 Hearing impairments X06-X09 Paralysis of major extremities
and/or trunk X40-X49, X50-X59, X60-X69
Average prevalence estimates of selected medically attended chronic conditions presented in table 8 are based on data gathered during July 1957-June 1961. The rates for 9 of the 11 condition groups shown in this table are higher for
nonveterans than for veterans. The other two conditions, peptic ulcer and chronic bronchitis, are the only conditions on this list which are not closely associated with the aging process. When these rates were age adjusted, the pattern changed to one which indicates that if these two population groups had a similar age composition, the difference in the rates between veterans and non-veterans in each condition group would be greater since age adjustment increases the rates for veterans and decreases the rates for nonveterans. Within the three broad age categories shown in table 8 there are many significant differences in the prevalence rates for veterans andnonveterans. True differences may be reflected in prevalence rates but an examination of the veteran and non-veteran population (fig. 1) reveals that the age composition within these broad age groups is quite different for these two populations. This could account for much of the difference in the rates.
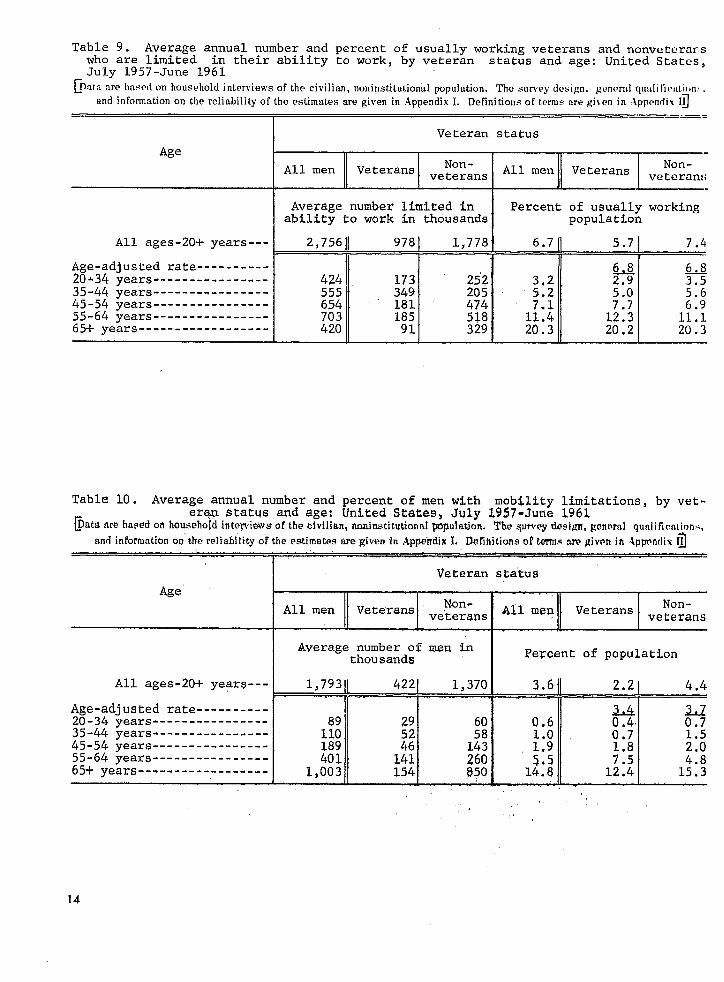
Chronically Limited in Ability to Work
Among men who reported that their usual activity was working during the 12-month period preceding the date of interview, 6.7 percent indicated that they currently were unable to work or were limited in the amount or kind of work they could do because of their chronic illness (table 9). While the age-adjusted rates for the veteran and nonveteran groups were the same, veterans had a lower unadjusted rate. The proportion of men who re~rted that they were limited in their ability to work ranged from 3.2 percent for those in the 20-34 age group to 20.3 percent in the 65 years and over age group. Within each of the age groups shown in figure 2 the proportion of veterans and nonveterans who had such limitations was about the same.
Chronic Mobility Limitation ,.
Persons with at least one chronic condition who reported any degree of limitation in their ability to perform usual activities are also classified to their limitations in mobility. Persons with mobility limitations include those confined to the
9
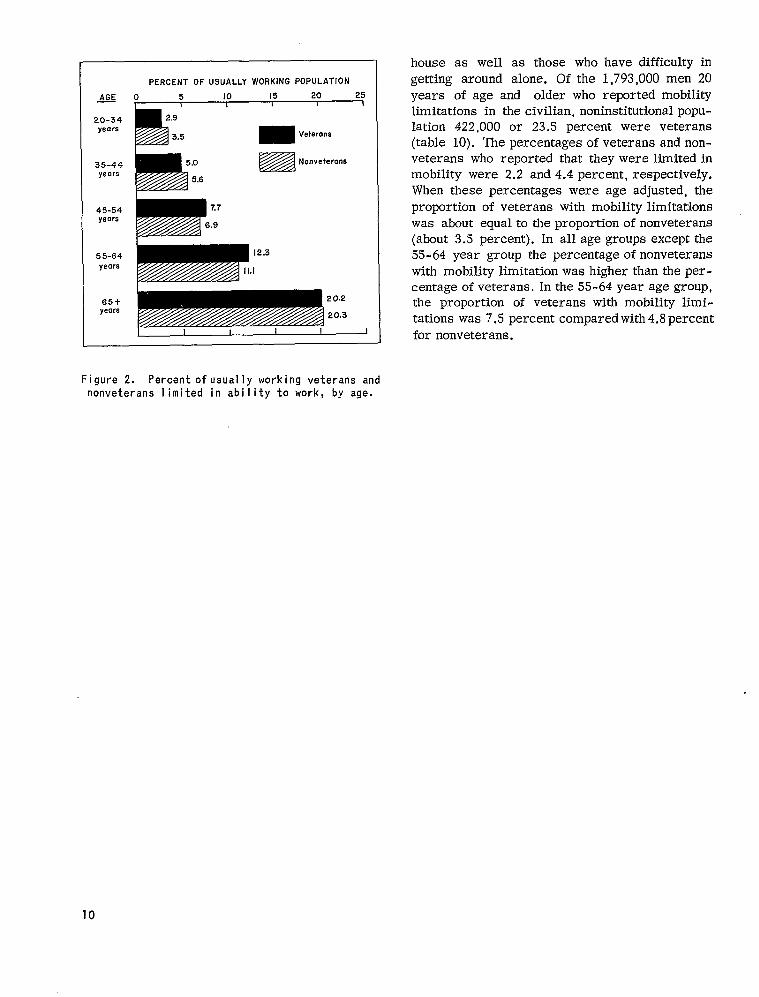
house as well as those who have difficulty in
PERCENT OF USUALLY WORKING POPULATION getting around alone. Of the 1,793,000 men 20
~ o 5 10 is 20 25 years of age and older who reported mobility , I I
limitations in the civilian, noninstitutional popu-20-34 2.9
yea rs lation 422,000 or 23.5 percent were veterans 3.5m’ m “’’’””S (table 10). ‘The percentages of veterans and non-
35-44 5.0 Nonvetemns veterans who reported that they were limited in Bzzzi
years m5.6 mobility were 2.2 and 4.4 percent, respectively. When these percentages were age adjusted, the
45-54 proportion of veterans with mobility limitations years was about equal to the proportion of nonveterans
(about 3.5 percent). In all age groups except the 55-64 55-64 year group the percentage of nonveterans yeors with mobility limitation was higher than the per
centage of veterans. In the 55-64 year age group, 65+ the proportion of veterans with mobility limi
years tations was 7.5 percent compared with 4.8 percent for nonveterans.
Figure 2. Percent of usually working veterans andnonveterans 1imited in abil ity to work, by age.
10
----------------
--------------------------------------------------------------------------------------------------
----------------------------------------------------------------
--------------
-----
----------------------------------------------------------------------------------------------------------
----------------
..... . .
Table 7. Average annual,number of men and percent of total populationwith one or more chronicconditionsunder medical care, with one or more days of bed disability,by veteran status andage: United StaCes, July 1957-June1961
@IXm Qfthe c,vi,im, noninstitutionalpopulation. ‘l%e surveydesi , general ‘ wall ““”” “- ‘-’ ‘-’---”-tmrqd m householdintmiews Hcauons,- WJ mmrrr,wwn
onthereliability Q ;he estimates we given in AppendixI. Definitions of termsa
With 1+ chronic conditions
Veteran statusand age Copulation
Under With 1+TQtd care bed-days
,., . . ...... ,... .. .
W ,,
All ages-20+ye,ars-
20-24 years 25-34 yeaxs 35-44 years ;;-;; years
years 60~64 years 65-69 years 70+ years
Veterans
All ages-20+years,.
Age-? justed ~ate
20-2 years25-34 years35-44 years45-54 years55-59 year~.t....- .....-w.60-64 yearq65-69 yeGrG--.-*-----=-V-70+ years--....--.-”
Nonvete.~s
All ages-20+years-
Age-adjustedrate20-24 years25-34 years35-44 years45-54 years55-59 years60-64 years65-69 years70-1-years
,
&9T%&.nW@er MI Chous?vuds
26,693 5,408
1,519 582 273z4,472 1,910 8575,’475 2,675 1,0725,400 2,853 1,1042,368 1,326 5232,247 1,346 4911,947 1.200 4193,265 2;033 670
19,406, 9,834 5,027 2,060
180 2,494 1,0% 4:? 3,548 1,759 709 1,386 747 306 357 209 887 548 2;: 687 439 158 29.5 192 64
30,801 16,859 8,898 3,348
3,948 1,339 517 238 4,718 1,978 841 370 3,882 1,927 916 363 7,307 4,013 2,106 798 3,340 2,012 1,118 430 2,049 1,360 798 283 1,793 1,260 761 261 3,763 2,970 1,841 605
given in Appendix@
With 1+ chronic conditions
E!EzlSz
Percent of population
53.2 27.7 10.8
33.7 12.9 42.0 17.9 ::: 49.1 24.0 9.6 54.9 29.0 11.2 60.2 33.7 13.3 67.2 40.3 14.7 73.0 45.0 15.7 79.1 49.3 16.2
50.7 25.9 10.6
~ ~ 11,5 32.3 11.5 m 42.0 18.0 8.2 48.8 24.2 54.9 29.6 1;:? 60.2 68.5
35.242.2
15.5 16.1
78,7 50.: 18.1 81.0 52.7 17.6
54.7 28.5 10.9
~ ~ ~ 33.9 13.1 41.9 17.e R 49.6 23.6 9.4 54.9 28.E 10.9 60.2 33.5 12.9 66.4 38.5 13.8 70.3 78.9
42.4 48.5
14.6 16.1
763-3370-65-3 11
----------------------
-----------------------
------------------------------
----------------------------
------------------
----------------------
-----------------------
-----------------------------
----------------------------
---------------------------
----------------------
-----------------------
-----------------------------
----------------------------
---------------------------
--------------------------------------------------
---------------------------------------
----------------------------------------------------------------------
-------------
------------------------------------------------------------------------------------------------
--------------
------------
------------
----------------------
-------
Table 8. Average prevalence and rate per 1,000 population of selected medically aCtendedchronic conditions, by veteran status, age, and condition group: United States, JUIY1957-June 1961
~at,ri are based O. household interviews of the civilian, noninstitutional population. The survey design, general qualificuticms, and information on the reliability of tbe estimates are given in .Appendix I. Definitions of terms are given in Appendix 1~
Age and condition group
All ages-20+ years
Arthritis and rheumatism---Asthma-hay feverHeart conditionsHearing impairments-------”Peptic ulcerHigh blood pressureHerniaVisual impairmentsDiabetesChronic bronchitisParalysis
Age-adjusted rate-20+ year:
Arthritis and rheumatism---Asthma-hay feverHeart conditionsHearing impairmentsPeptic ulcerHigh blood pressureHerniaVisual impairmentsDiabetesChronic bronchitisParalysis
20-44 years
Arthritis and rheumatism---Asthma-hay feverHeart conditionsHearing impairmentsPeptic ulcerHigh blood pressureHerniaVisual impairmentsDiabetesChronic bronchitisParalysis
Veteran status
Average prevalence inthousands Rate per 1,000 population
3,000 959 2,041 2,460 914 1>545 ;,;3; 650 1>702
644 1,356 1;774 742 1,031 1,529 460 1,069 1,433 384 1,050 1,246 295 951 687 183 504 469 189 280 415 103 312
59.8 49.4 66.3 49.0 47.1 50.2 46.8 33.5 55.3 39.8 33.2 44.0 35.3 38.2 33.5 30.5 23.7 34.7 28.5 19.8 34.1 24.8 15.2 30.9 13,.7 9.4 16.4 9.3 9.7 9.1 8.3 5.3 10.1
70.7 55.5 .- 49.9 50.1
- 51.4 46.2 - .- - 44.0 38.3
.- - - 39.9 32.3
.- .- - 31.3 30.2 - 26.9 29.4
.- - - 21.5 26.7
. - - 13.5 14.0 --.. - .------- 12.7 8.1
,- 7.1 8.9
482 299 184 18.3 21.7 14.7 1,225 601 624 46.6 43.7 49.7 307 138 169 11.7 10.0 13.5 506 270 236 19.2 19.6 18.8 830 491 339 31.6 35.7 27.0 356 188 167 13.5 13.7 13.3 313 151 162 11.9 11.0 12.9 267 108 159 10.2 7.9 12.7 119 57 62 4.5 4.1 4.9 134 54 5.1 ;.; 4.3 99 % 59 3.8 . 4.7
12

----------------------
--------
-----------------------------
----------------------------
---------------------------
----------------------
--------
-----------------------------
----------------------------
---------------------------
I Table 8. Average prevalence and rate per 1,000 populationof selected medically attended 1 chronic conditions,by veteran status, age, and condition group: United States, July I 1957-June 1961—Con. ; p,,:, :,,0 } 1:, scd on household interviews of the civilian, noninstitutional population. The survey design, general qualifications,
w] information cm the reliability of the estimates are given in Appenrlix I. Definitions of terms are given in Appendix Id
i-Veteran status
Age and condition group Al1 Allmen-20+ Veterans ve~;;n~ men-20+ Veterans Non-
veteransyears years
45-64 years
Arthritis and rheumatism---Asthma-hay feverHeart conditionsHearing impairmentsPeptic ulcer---------------High blood pressureHerniaVisual impairmentsDiabetesChronic bronchitisParalysis
65+ years
Arthritis and rheumatism---Asthma-hay feverHeart conditionsHearing impairmentsPeptic ulcer---------------High blood pressureHerniaVisual impairmentsDiabetesChronic bronchitisParalysis
Average prevalence inthousands Rate per 1,000 population
1,430 402 1,029 83.6 91.1 81.0 862 226 636 50.4 51.2 50.1
1,034 307 727 60.4 69.6 57.3 720 222 498 42.1 50.3 39.2 724 19~ 530 42.3 43.7 41.7 675 174 501 39.5 39.4 39.5 558 134 424 32.6 30.4 33.4 394 95 299 23.0 21.5 23.6 336 81 255 19.6 18.4 20.1 202 132 11.8 16.1 10.4 157 G 116 9.2 9.1 9.1
1,088 259 829 160.2 209.4 149.2 373 286 54.9 70.3 51.5
1,011 2:; 805 148.8 165.7 144.9 ;;: 152 621 113.8 122.9 111.8
162 32.4 46.9 29.2 498 ;; 401 73.3 79.2 72.2 562 99 463 82.7 80.0 83.3 586 92 493 86.3 74.4 88.7 232 46 187 34.2 37.2 33.7 133 38 19.6 30.7 17.1 160 23 1:; 23.6 18.6 24.5
13
----------------
Table 9. Average annual number and percent of usually working veterans and nonveterarswho are limited in their ability to work, by veteran status and age: United States,July 1957-June 1961—
[Pnta tre hasmi on household interview of the civilian, noninstitutional population, ‘I’he survey design, general qualifimiti{m: . and information on the reliability of the estimates are given in .kppenrfix I.Definitions of terms are gi, cn in .Apprndi\ Id
=
Veteran status
Age
All men Veterans Non-All men Veterans
Non-veterans veteran:;
.
Average number limited in ability to work in thousandsI Percent of usually working population
55-64 years---------------- 703 185 518 1::: 12.3 11.1
All ages-20+ years--- 2,75611 978 1,7781 6.7 5.71 7.4 ,
Age-adjusted rate---------- L 6A 20A34 years---------------- 424 173 252 3.2 2.9 :.; 35-44 years 555 349 205 5.2 45-54 years---------------- 654 181 474 H’ 2:;
65+ years------------------ 420 II
91 I
329 20.3 -L 20,320.2
Table 10. Average annual number and percent of men with mobj.litylimitations,by veterqn status and age: United States, July 1957-June 1961
Datame had on household !nte~ws of the civilian, nonkstitutimr.! population. Tf,te q.tvey deeign, gcxrcwd q..iificwions,
and information on tfre reliability OFthe estimgk are giverr in Appeklix L Definitions of terms are given in -@pendit 1]
VeCeran sta’tua
Age Non- Non-
All men Veterans ve’terans Ail men Veterans veterans
Average number of men in thousands Percent of population
I All ages-20+ yearg--- 1,793 422 1,370 3,6 2,2 4.4
Age-adjusted rate---------- ~ ~ 20-34 years---------------- Q,6 35-44 years---------------- 1?: :; !% 0:7’ 1:5 45-54 years---------------- 189 143 ::: 2.0 55-64 years----------------65+-years------------------
401 ~ 1:; 260 1,003 154 p50
J; ;:;. 12.4 12::
,,,,
,,
14
---
----------------------------------------------------------------
IV. HEARING IMPAIRMENTS
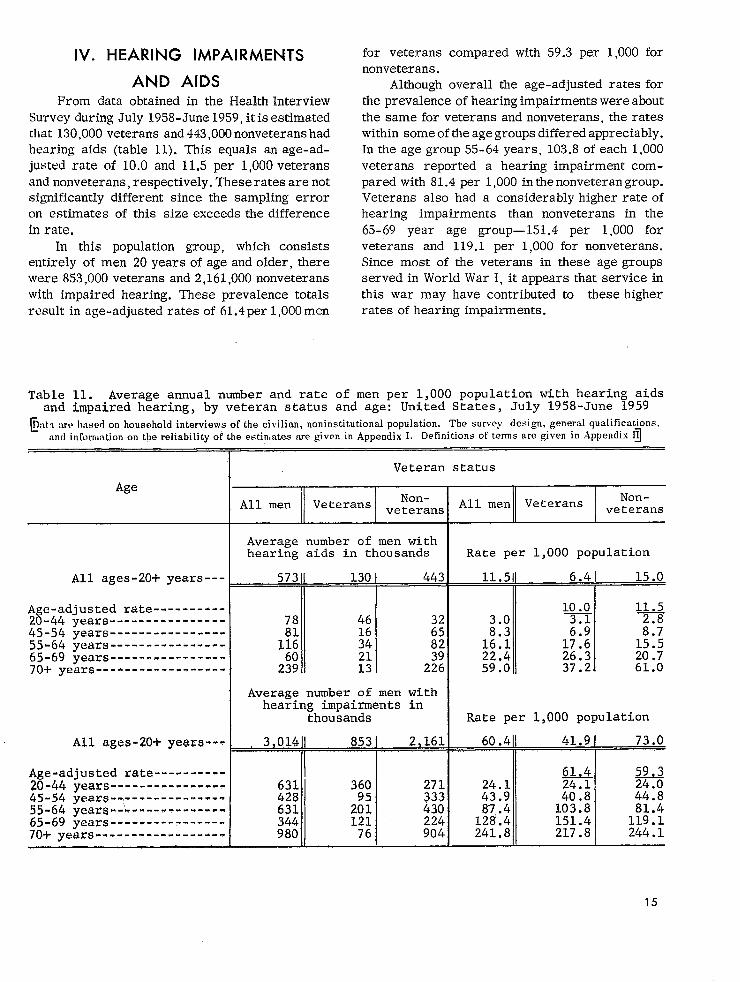
AND AIDS From data obtained in the HeaIth Interview
Survey during July 1958 -June 1959, itisestimated that 130,000 veterans and443,000 nonveteranshad hearing aids (table 11). This equals an age-adjusted rate of 10.0 and 11.5 per l, 000 veterans and nonveterans, respectively. These rates are not significantly different since the sampling error on estimates of this size exceeds the difference in rate.
In this population group, which consists entirely of men 20 years of age and older, there were 853,000 veterans and 2,161,000 nonveterans with impaired hearing. These prevalence totals result in age-adjusted rates of 61.4 per 1,000 men
for veterans compared with 59.3 per 1,000 for nonveterans.
Although overall the age-adjusted rates for the prevalence of hearing impairments were abut the same for veterans and nonveterans, the rates within some of the age groups differed appreciably. In the age group 55-64 years, 103.8 of each 1,000 veterans reported a hearing impairment compared with 81.4 per 1,000 in the nonveteran group. Veterans also had a considerably higher rate of hearing impairments than nonveterans in the 65-69 year age group— 151.4 per 1,000 for veterans and 119.1 per 1,000 for nonveterans. Since most of the veterans in these age groups served in World War I, it appears that service in this war may have contributed to these higher rates of hearing impairments.
Table 11. Average annual number and rate of men per 1,000 population with hearing aids and impaired hearing, by veteran status and age: United States, July 1958-June 1959
UNI~i,t,i hnsed on household interviews of the civilian, noninstitutional population. The survey design, general qualifications, nnrl information on the reliability oft,he
Age
All ages -20i- years
Age-adjusted rate----------20-44 years----------------45-54 years----------------55-64 years----------------65-69 years----------------70+ years------------------
All ages-201- yea?sv--~
Age-adjusted rate----------20-44 years45-54 years 55-64 years 65-69 years 70+ years---------------”-
estin[ates are given in Appendix I. Definitions of terms are given in Appendix II
Veteran status
Non- Non-All men Veterans All men Veterans
veterans veterans
Average number of men withhearing aids in thousands I Rate per 1,000 population
573 130 443 11.5 6.41 15.0
1~ 1~ 3.1 ;:7 1?:: 15.5 26.3 20.7 37.2 61.0
Average number of men withhearing impairments in
thousands Rate per 1,000 population
3,014 853I 2,1611 60.411 41.91 73.0
~ u 631 360 271 24.1 24.1 24.0 428 333 43.9 40.8 44.8 631 2:? 430 87.4 103.8 81.4
121 224 12~.4 151.4 119.1 % 76 904 241.8 217.8 244.1
------------------------------------------------------------------------------------------
------------------
V. LOSS OF TEETH
Loss of permanent teeth usually occurs as the result of two of the most common diseases which affect the American people—dental caries and periodontal disease. Nearly every person has one or both of these diseases at some time during his lifetime but tooth loss is primarily associated with lack of treatment. Since accrued tooth loss in individuals leads ultimately to edentulousness (total loss of permanent teeth), the number and distribution of edentulous persons provide an index to both the prevalence of dental disease and the extent of dental neglect in the population of the United States.
Based on data reported in household inter-views conducted during the period July 1957-June 1958, there were 9,691,000 men 20 years and older who had lost all of their natural teeth. This means that 1 out of every 5 men (20 years and older) was edentulous. The edentulous rate was twice as high for nonveterans (1 out of 4) as for veterans (1 out of 8) largely because the non-veteran population was older. When these rates were age adjusted to minimize the effect of the difference in the age composition of the veteran and nonveteran population, it was revealed that
about 1 out of 5 persons in the veteran population
as well as in the nonveteran population would be edentulous if the age distribution within these groups was the same as the distribution in the general population.
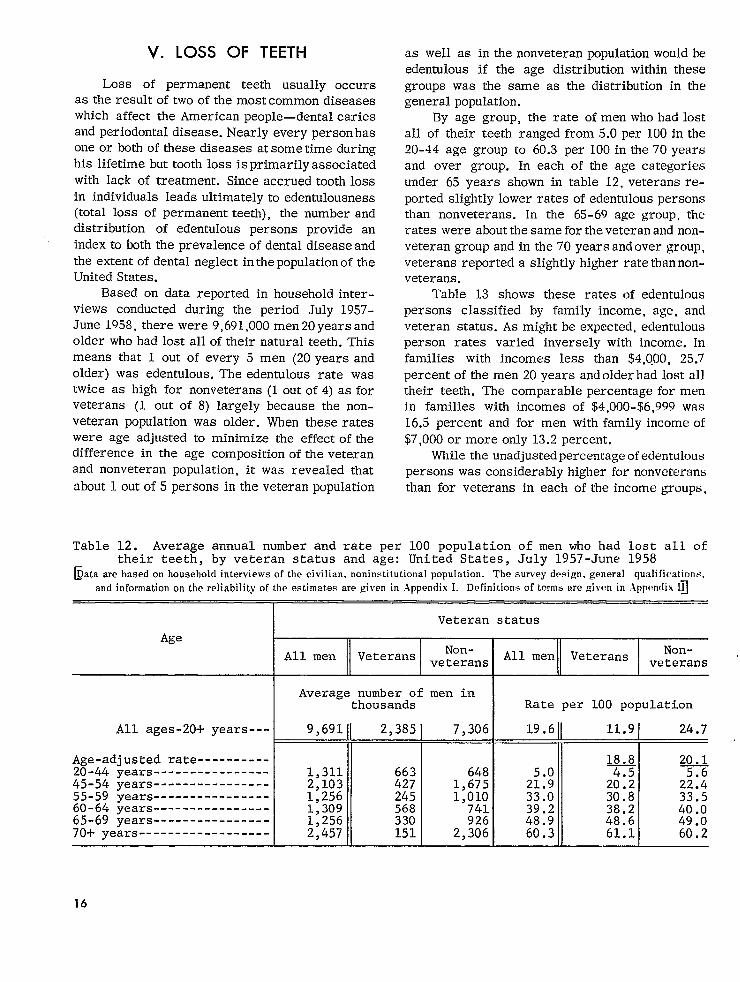
By age group, the rate of men who had lost all of their teeth ranged from 5.0 per 100 in the 20-44 age group to 60.3 per 100 in the 70 years and over group. In each of the age categories under 65 years shown in table 12, veterans re-ported slightly lower rates of edentulous persons than nonveterans. In the 65-69 age group, the rates were about the same for the veteran and non-veteran group and in the 70 years and over group, veterans reported a slightly higher rate than non-veterans.
Table 13 shows these rates of edentulous persons classified by family income, age, and veteran status. As might be expected, edentulous person rates varied inversely with income. In families with incomes less than $4,000, 25.7 percent of the men 20 years and older had lost all their teeth. The comparable percentage for men in families with incomes of $4,000-$6,999 was 16.5 percent and for men with family income of $7,000 or more only 13.2 percent.
While the unadjusted percentage of edentulous persons was considerably higher for nonveterans than for veterans in each of the income groups,
Table 12. Average annual number and rate per 100 population of men who had lost all of their teeth, by veteran status and age: United States, July 1957-June 1958
@Waare based m household interviews of the civilian, noninstitutional population. The survey design, general qualifications,
and information on the reliability of the estimates are given in .$ppendix I. Definitions of terms are Riven in Appendix Ig
Veteran status
Age Non- Non-
All men Veterans veterans All men Veterans I veterans ‘ II I
Average number of men in thousands Rate per 100 population
All ages-20+ years--- 9,691 2,385 7,306 19.6/1 11.91 24,7 II I
Age-adjusted rate I&EJ 2Q 20-44 years 1,311 663 648 5.0 4.5 5.6 45-54 years 55-59 years60-64 years 65-69 years 70+ years
2,103 1,256 1,309 1,256 2,457
427 245 568 330 151
1,675 21.9 20.2 22.4 1,010 33.0 30.8 33.5 741 39.2 38.2 40.0 926 48.9 48.6 49.0
2,306 -11--60.260.3 61.1
16
------------------
Table 13. Average annual number and rate per 100 population of men who had lost all oftheir teeth, by ve~eran status, family income, and age: United States, July 1957-June1958
[Duto we bused cm household interviews of the civilian, noninstitutional population. The survey design, general qualifications,
und in formrition onthereliability of the estimates are given in Appendix I. Definitions of terms are given in .Appendix I~ —.
Veteran status
Family income and age
All men Veterans Non- All men Veterans ve~~&s veterans
All incomesl
All ages-20i-years---
Age-adjusted rate----------20-44 years----------------45-54 years----------------55-59 years----------------60-64 years----------------65-69 years----------------70+ years------------------
Under $4,000
All ages-20+ years---
.4ge-adjustedrate----------20-44 years----------------45-54 years----------------55-59 years----------------60-64 years----------------65-69 years----------------70+ years-----------------
~4,000-$6,999
All ages-20+ years---
Age-adjusted rate----------20-44 years----------------45-54 years----------------55-59 years----------------60-64 years----------------65-69 years----------------70+ years
All ages-20+ years---
Age-adjusted rate----------20-44 years----------------45-54 years----------------55-59 years----------------60-64 years----------------65-69 years----------------70+ years------------------
Average number of men inthousands Rate per 100 population
9,691 2,385 7,306 19.6 11.9 24.7
~ 2&l 1,311 663 648 2,103 427 1,675 2::: 2;:; 2;:; 1,256 245 1,010 33.0 30.8 33.5 1,309 568 741 39.2 38.2 40.0 1,256 330 926 48.9 48.6 49.0 2,457 151 2,306 60.3 61.1 60.2
4,564 949 3,614 25.7 17.5 29.4
~ ~ 341 173 168 5.0 695 146 549 2::2 27.1 2::: 490 413 34.0 29.1 35.2 555 2;; 327 40.5 41.0 40.1 772 218 554 51.5 51.9 51.3
1,710 107 1,604 60.8 61.8 60.8
2>937 880 2,057 16.5 10.2 22.3
~ 2~ 645 331 314 819 168 651 2::: 2::: 2;:; 431 344 37.9 38.3 37.9 438 1:; 241 43.5 41.3 45.6 239 365
67*.
172 334
48.8 59.7
48.6 >’C
48.7 58.9
1,440 391 1,050 13.2 7.8 17.8
8A lJ&h 246 121 125 4.1 3.3 5.4 464 92 372 17.3 14.4 18.2 221 54 167 24.7 22.5 25.5 175 88 27.5 28.6
;,< 26.8
143 >’< 1!; ;;.; 43.9 191 $< 183 . >’; 60.8
‘Includes persons with unknown family income.
17
age adjustment brought the rates much closer together. The age-adjusted rates were about the same for veterans (20.7 percent) and for non-veterans (19.8 percent) in families with less than $4,000 annual incomes. In the $4,000-$6,999 and in the $7,000 or more income group, the age-adjusted rate of edentulous persons was much higher in the nonveteran group. The age-specific percentages of edentulous persons by age group within the family income category revealed little consistency in the rate pattern.
V1. HOSPITAL DISCHARGES
FROM SHORT-STAY HOSPITALS
Hospital discharges from short- stay hospitals in the United States averaged 5,116,000 annually based on data gathered during July 1957-June 1961 for men 20 years of age and older in the civilian, noninstitutional population. Veterans, who represented 39 percent of this population during the 4-year period, accounted for 36 percent (an annual average of 1,850,000) of these discharges. About 23 percent of the discharges of adult males were from government-owned facilities including Federal, State, and local government hospitals. Among veterans, 30 percent of the discharges were from government-owned facilities compared with only 19 percent for the nonveteran population. Because nonveterans are generally ineligible for care in most Federal hospitals, veterans accounted for 7 out of 8 of the discharges from Federal hospitals. Although only 6.9 percent of all hospitalizations of men 20 years of age and older take place in Federal facilities, 16.6 percent of the hospitalizations of veterans take place in Federal hospitals. Since 9 out of 10 hospitalizations of veterans in short - stay Federal hospitals occur in veteran hospitals, rates describing veteran short-stay hospitalizations in Federal haspitals and veteran hospitalizations in short-stay Veterans Administration facilities follow the same pattern.
The average annual total of 5,116,000 discharges equals a rate of 101.9 discharges per 1,000 men per year. Veterans averaged 95.3 discharges per 1,000 population while nonveterans averaged 106.0 discharges per 1,000. In the age
adjustment of these rates to obtain a better basis for comparison, it was found that the rate for veterans became 107.2 per 1,000 compared with 100.1 per 1,000 for nonveterans. Thus while the actual rate of discharges is lower for veterans, the age-adjusted rates indicate that the veterans would have a higher rate of discharges if the veteran population had the same age composition as the nonveteran population. This is quite apparent on examination of the age-specific rates shown in table 14. In each of the age groups except the 45-54 year group, the discharge rates for veterans exceeded the rates for nonveterans. The discharge rates for veterans increased with age from 73.5 per 1,000 for men in the 20-34 age group to 184.3 per 1,000 for men 65 years and over. The nonveteran discharge rates similarly increased with age from 70.4 per 1,000 for men in the 20-34 age group to 153.3 per 1,000 for the 65 years and over group.
Veterans accounted for 307,000 or 87 percent of the 354,000 discharges from Federal hospitals. Although the rate of hospitalization for veterans in short-stay Federal hospitals was about 15.8 discharges per 1,000 men per year, the rates ranged from 8.5 per 1,000 in the lowest age group to 63.1 per 1,000 for the 65 years and older group.
Since the bulk of the short-stay discharges from Federal hospitals were from Veterans Administration facilities, the discharge rates were quite similar. Of the 284,000 discharges from Veteran Administration hospitals, 270,000 represented discharges of veterans. Veterans utilized the Veterans Administration hospitals for about 14.6 percent of their hospitalizations in short-stay hospitals. Discharge rates for veterans in Veterans Administration hospitals ranged from 6.8 per 1,000 for men 20-34 years of age to 59,8 per 1,000 for men 65 years and over.
Non-Federal Government hospitals accounted for 806,000 or L’5.8 percent of all discharges of men 20 years and older. Both the actual and age-adjusted rates of hospitalization of veterans in State and local government hospitals were lower ‘“ than the rate for nonveterans. The lower rates for veterans discharged from non-Federal Government hospitals appear in each of the age-specific gqoups shown fn table 14.
18
The “other” hospital ownership group includes all voluntary and proprietary (nongovernmental) hospitals. Hospitalizations in these types of hospitals accounted for 77.3 percent of all of the discharges of males 20 years and over. The discharge rate for veterans in these nongovernmental hospitals was 67.1 per 1,000 compared with 86.1 per 1,000 for nonveterans. Age adjusting these rates reduced the difference but the nonveteran discharge rate in these hospitals (81.1 per 1,000) was still considerably higher than the rate for veterans (72.0 per 1,000). The rates in each of the specific age groups shown in table 14 are lower for veterans than for nonveterans.
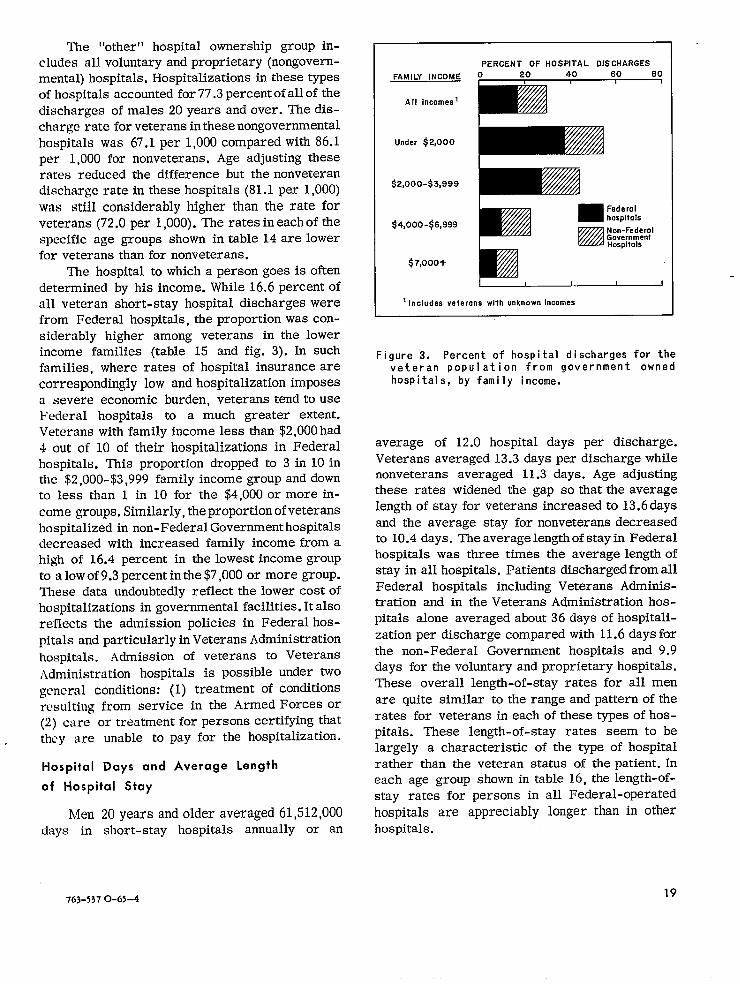
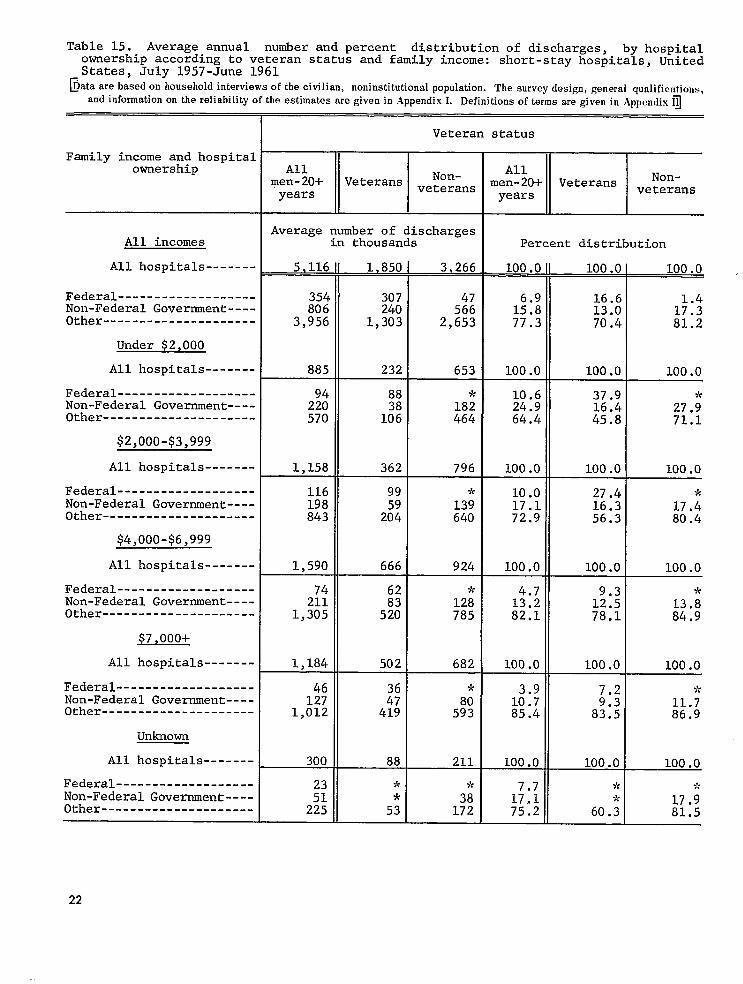
The hospital to which a person goes is often determined by his income. While 16.6 percent of all veteran short-stay hospital discharges were from Federal hospitals, the proportion was considerably higher among veterans in the lower income families (table 15 and fig. 3). In such families, where rates of hospital insurance are correspondingly low and hospitalization imposes a severe economic burden, veterans tend to use Federal hospitals to a much greater extent. Veterans with family income less than $2,000 had 4 out of 10 of their hospitalizations in Federal hospitals. This proportion dropped to 3 in 10 in the $2,000-$3,999 family income group and down to less than 1 in 10 for the $4,000 or more in-come groups. Similarly, the proportion of veterans hospitalized in non-Federal Government hospitals decreased with increased family income from a high of 16.4 percent in the lowest income group to a low of 9.3 percent in the $7,000 or more group. These data undoubtedly reflect the lower cost of hospitalizations in governmental facilities. It also reflects the admission policies in Federal hospitals and particularly in Veterans Administration hospitals. Admission of veterans to Veterans Administration hospitals is possible under two general conditions: (1) treatment of conditions resulting from service in the Armed Forces or (2) care or treatment for persons certifying that the y are unable to pay for the hospitalization.
r
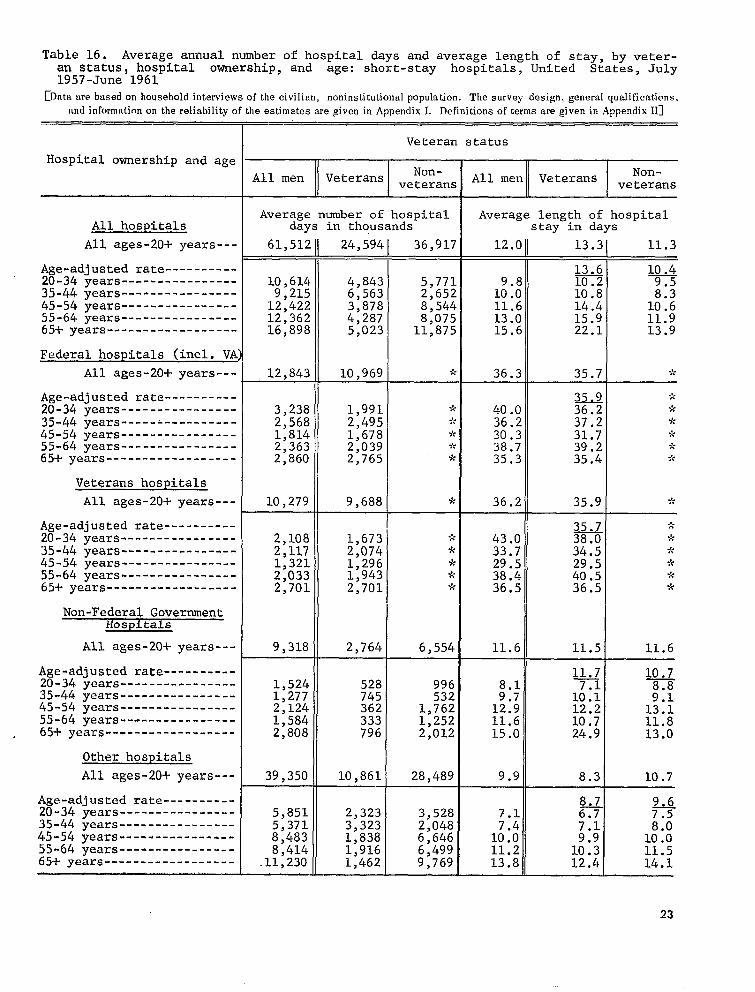
Hospital Days and Average Length
of Hospital Stay
Men 20 years and older averaged 61,512,000 days in short-stay hospitals annually or an
PERCENT OF HOSPITAL DISCHARGES
FAMILY INCOME
All incomes’ ‘r Under $2,000
$2,000-$3,999
Fed era I hospitals
$4,000-$6,999 Non-Federol Government
‘Ez2 Hospitals
$7,000+
I I I I I I I
1 Includes veterons with unknown Incomes
Figure 3, Percent of hospital discharges for the veteran population from government owned hospitals, by fami 1 y income,
average of 12.0 hospital days per discharge. Veterans averaged 13.3 days per discharge while nonveterans averaged 11.3 days. Age adjusting these rates widened the gap so that the average length of stay for veterans increased to 13,6 days and the average stay for nonveterans decreased to 10.4 days. The average length of stay in Federal hospitals was three times the average length of stay in all hospitals. Patients discharged from all Federal hospitals including Veterans Administration and in the Veterans Administration hos pitals alone averaged about 36 days of hospitalization per discharge compared with 11.6 days for the non-Federal Government hospitals and 9.9 days for the voluntary and proprietary hospitals. These overall length-of-stay rates for all men are quite similar to the range and pattern of the rates for veterans in each of these types of hospitals. These length-of-stay rates seem to be largely a characteristic of the type of hospital rather than the veteran status of the patient. In each age group shown in table 16, the length-of-stay rates for persons in all Federal-operated hospitals are appreciably longer than in other hospitals.
763-3370-65-4 19
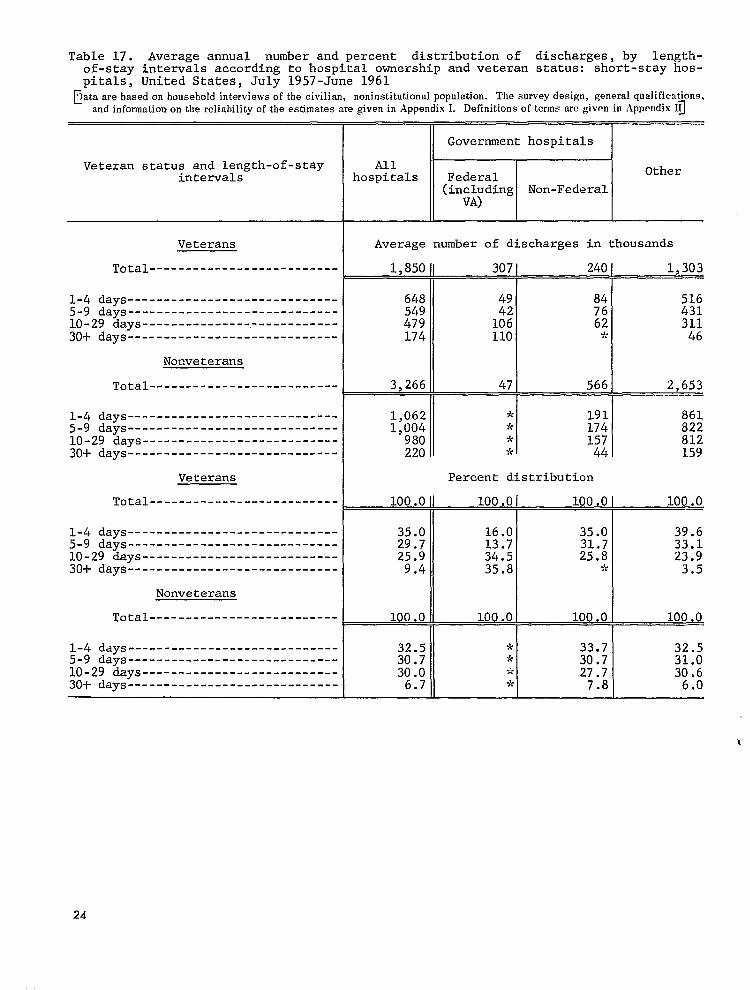
Table 17 which shows me discharges categorized by length of hospital-stay interval indicates that 35.8 percent of the veterans in Federal hospitals were hospitalized for 30 or more days, while only 3.5 percent of veterans in voluntary and proprietary hospitals were in the hospital 30 or more days. Only 6.7 percent of all nonveterans hospitalizations were 30 or more days.
There are a number of factors which might account for or at least contribute to the longer length of stay in Veterans Administration and other Federal hospitals as compared with voluntary and proprietary hospitals: (1) When the cost of hospitalization in voluntary and proprietary hospitals becomes prohibitive or insurance benefits are exhausted, patients in these hospitals may shorten their hospital stay by transferring to nursing homes or other institutions providing long-term care. (2) In Federal hospitals there is a high proportion of low income persons, a group known to have more hospital days per discharge. This may be due to reluctance to send patients home to inadequate care and food, and housing facilities which would delay their recovery. (3) Patients are more likely to use non-Federal hospitals for emergencies and short-stay treatment because of accessibility and ease of ad-
mission. Veterans Administration and other Federal facilities are utilized for conditions requiring extensive or prolonged treatment.
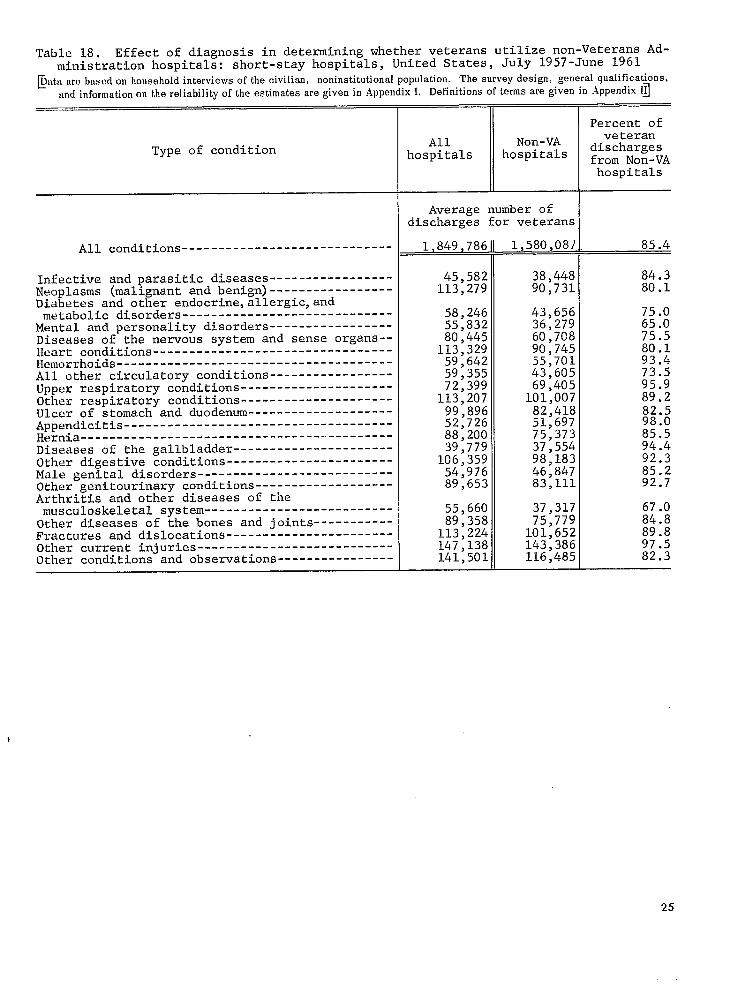
Table 18 provides some indication that Veterans Administration facilities are used more frequently than other types of hospitals for conditions that usually require long periods of treatment or care.. Since 85.4 percent of all veterans hospitalizations were in non-Veterans Administration hospitals, it is significant that this pro-portion dropped to 65.0 percent for mental and personality disorders and 67.0 percent for arthritis and other diseases of the musculoskeletal system. These and other diseases normally requiring longer periods of treatment or prolonged disability make up a large proportion of the types of conditions cared for in Veterans Administration hospitals. On the other hand, well over 90 percent of veterans with appendicitis, upper respiratory conditions, hemorrhoids, diseases of the gall-bladder, and current injuries were hospitalized in non-Veterans Administration facilities. Conditions in this latter group are generally of the type requiring comparatively short periods of hospitalization for which the hospital costs are within the economic means of the patient or in many cases are covered by hospital insurance.
20
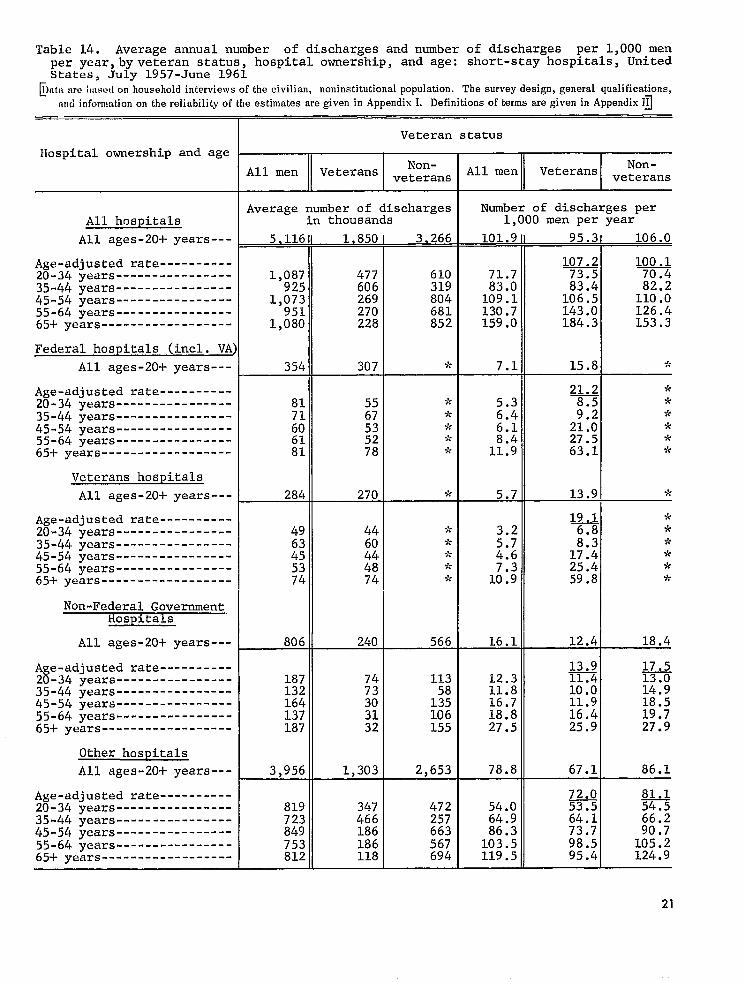
Table 14. Average annual number of discharges and number of discharges per 1,000 men per year,byveteran status, hospital ownership, and age: short-stay hospitals, United States, July 1957-June 1961
~)nt,i urc ;Ntsc.drm household interviews of the civilian, noninstitutional population. The survey design, general qualifications, nnti infcmnution on the reliability of the estimates are given in Appendix I. Definitions of terms are given in Appendix J]
Veteran status
Hospital ownership and ageNon- Non-All men Veterans All men Veteransveterans veterans
Average number of discharges Number of discharges per All hospitals in thousands 1,000 men per year
All ages-20+ years--- 5,116 1,850 3,266 101.9 95.31 106.0
Age-adjusted rate---------- 107.2 100.1 20-34 years---------------- 1,087 477 610 71.7 73.5 70.4 35-44 years---------------- 925 606 319 83.0 83.4 82.2 45-54 years---------------- 1,073 269 804 109.1 106.5 110.0 55-64 years---------------- 951 270 681 130.7 143.0 126.4 6,5+years------------------ 1,080 228 852 159.0 184.3 153.3
Federal hospitals (incl. VA T
All ages-20+ years--- 354 307 9< 7.1 15.81 $:
Age-adjusted rate----------20-34 years----------------35-44 years----------------45-54 years----------------55-64 years----------------65-1-years------------------
81 71 60 61 81
55
x 52 78
-A
*
>k *
7’<
5.3 6.4
;:: 11.9
2X 8.5
2;:: 27.5 63.1
* * * * J*. ?:
Veterans hospitals
All ages-20+ years--- 284 270 >2 5.7 13.91 ;,;
Age-adjusted rate---------- la * 20-34 years---------------- 49 44 -k 3.2 n **35-44 years---------------- 9<
45-54 years---------------- :2 :: * M 17.4 .~-
55-64 years---------------- 53 48 ?: 25.4 * 65+ years------------------ 74 74 >’r 1::? 59.8 *
Non-Federal Government,Hospitals
All ages-20+ years--- 806 240 566 16.1 12.41 18.4
A e-adjusted rate---------- ~ ~ 2f-34 years---------------- 187 74 113 12.3 11.4 13.0 35-44 years---------------- 132 73 11.8 10.0 14.9 45-54 years---------------- 164 30 1:; 16.7 11.9 18.5 55-64 years---------------- 137 31 106 18.8 16.4 19.7 65+ years------------------ 187 32 155 27.5 25.9 27.9
Other hospitals
years--- 3,956 1,303 2,653 78.8 67.11 86.1
Age-adjusted rate---------- u u 20-34 years---------------- 819 347 472 54.0 53.5 54.5 35-44 years---------------- 723 466 257 64.9 64.1 66.2 45-54 years---------------- 849 186 663 86.3 73*7 90.7 55-64 years---------------- 753 186 567 103.5 98.5 105.2 65+ years------------------ 812 118 694 119.5 95.4 124.9
All ages-20-l-
21
-------
-------------------
---------------------
-------
-------------------
---------------------
-------
-------------------
---------------------
-------
-------------------
---------------------
-------
-------------------
---------------------
-------
-------------------
---------------------
Table 15. Average annual number and percent distribution of discharges, by hospitalownership according to veteran status and family income: short-stay hospitals, UnitedStates, July 1957-June 1961
~atame based cm household interviews of the civilian, noninstitutional population. The survey design, general qualifications, and information on the reliability of the estimates are given in Appendix I. Definitions of terms are given in .Appendix 1]
Veteran status
Family income and hospital ownership All
men- 20+ Veterans Non-veterans
All men-20+ Veterans
Non-veterans years years
II I
Average number of discharges All incomes in thousands Percent distribution
All hospitals 5,116 1,850 3,266 100.0 100.0 -100 0
Federal Non-Federal Government----
354 307 806 240 5:: 12:: 16.6
13.0 1+:: Other 3,956 1,303 2,653 77.3 70.4 81.2
Under $2,000
All hospitals 885 232 653 100.0 100.0 100.0
Federal 88 10.6 37.9 Non-Federal Government---- 2% 18; 24.9 16.4 27.; Other 570 1% 464 64.4 45.8 71.1
$2,000-$3,999
All hospitals 1,158 362 796 100.0 100.0 100.0
Federal 116 99 10.0 27.4 Non-Federal Government---- 198 13: 17.1 16.3 17.: Other 843 22: 640 72.9 56.3 80.4
$4,000-$6,999
All hospitals 1,590 666 924 100.0 100.0 100.0
FederalNon-Federal Government---- 2:? X 12: 1::; 1;:; 13.:€Other 1,305 520 785 82.1 78.1 84.9€
W.@!w
All hospitals 1,184 502 682 100.0 100.0 100.0
Federal 46 * 3.9 9t
Non-Federal Government---- 127 10.7 11.7 Other 1,012 5:: 85.4 86.9
Unknown
All hospitals 300 211 100.0 100.0 100.0
Federal +: 9: >’:
Non-Federal Government---- H 38 1;;: 17.9 Other 225 172 75.2 60.; 81.5
22
----------
Table 16. Average annual number of hospital days and average length of stay, by veteran status, hospital ownership, and age: short-stay hospitals, United States, July 1957-June 1961
[Datame based on household interviews of the civilian, noninstitutional population. The survey design, general qualifications,
and inforrnmtion on the reliability of the estimates are given in Appendix I. Definition of terms are given in Appendix II]
Veteran status
Hospital ownership and ageNon- Non-All men Veterans All men Veteransveterans veterans
Average number of hospital Average length of hospitalAll hospitals days in thousands stay in days
All ages-20+ years--- 61,512 24,594 36,917 12.C 13.3 11.3
Age-adjusted rate---------- 1* ~ 20-34 years---------------- 10,614 4>843 5,771 9.: 10.2 9.5 35-44 years---------------- 9,215 6,563 2,652 10.C 10.8 45-54 years---------------- 12,422 3,878 8,544 11.6 14.4 1::; 55-64 years---------------- 12,362 4,287 8,075 13.C 15.9 11.9 65-I-years------------------ 16,898 5>023 11,875 15.f 22.1 13.9
Federal hospitals (incl. VA
All ages-20+ years--- 12,843 10,969 $< 36.2 35.7 >’:
Age-adjusted rate----------20-34 years---------------- 3,238 1,991 9< 40.0
33 36.2
* >.;
35-44 years-----’ 2,568 2,495 ;!: 36.> 37.2 -k
45-54 years---------------- 1,814 1,678 Y< 30.2 31.7 >!;
55-64 years----------------65-f-years------------------
2,363 2,860
2,039 2,765
-)< >!;
38.7 35.?
39.2 35.4
-k
>’;
Veterans hospitals
All ages-20+ years--- 10,279 9,688 9: 36.2 35.9 %-
Age-adjusted rate---------- ~ * 20-34 years---------------- 2,108 1,673 -k 43.0 38.0 >’;
35-44 years---------------- 2,117 2,074 -k 33.7 34.5 i’:
45-54 years---------------- 1,321 1,296 9< 29.5 29.5 $:
55-64 years---------------- 2,033 1,943 >,< 38.4 40.5 ;.;
65+ years------------------ 2,701 2,701 -k 36.5 36.5 7’;
Non-Federal GovernmentHospitals
All ages-20+ years--- 9,318 2,764 6,554 11.6 11.5 11.6
Age-adjusted rate----------20-34 years----------------35-44 years----------------
1,524 1,277
528 745
996 532 H
1~7
1:::
QJ
::? 45-54 years---------------- 2>124 362 1>762 12.9 12.2 13.1 55-64 years---------------- 1,584 333 1,252 11.6 10.7 11.8 65+ years------------------ 2,808 796 2,012 15.0 24.9 13.0
Other hospitals
years--- 39,350 10,861 28,489 9.9 8.3 10.7
Age-adjusted rate---------- ~ ~ 20-34 years---------------- 5,851 2,323 3,528 7.5 35-44 years----------------45-54 years----------------
5,371 8,483
3>323 1,838
2,048 6>646
;:; 10.0
;:: 1:::
55-64 years---------------- 8,414 1,916 6,499 11.2 1::; 11.5 65-I-
All ages-20-l-
years------------------ .11,230 1,462 9,769 13.8 12.4 14.1—
23
--------------------------
----------------------------------------------------------
--------------------------------------------------------
--------------------------
----------------------------------------------------------
--------------------------------------------------------
--------------------------
----------------------------------------------------------
--------------------------------------------------------
--------------------------
----------------------------------------------------------
--------------------------------------------------------
Table 17. Average annual number and percent distribution of discharges, by length-of-stay intervals according to hospital ownership and veteran status: short-stay hospitals, United States, July 1957-June 1961
interviews noninstitutional population. The survey design, general walification~,~ataarebasedonhousehold ofthecivilian,L and information ontlre reliability of the estimates are given in.Append-ix”I. Definitions of terms are given in Appendix I~
II Govement hospitals /
Veteran status and length-of-stayintervals hospitals‘“F ‘the Veterans Average number of discharges in thousands
Total 1,850 II 307/ 240 I 1,303
I I 1-4 days 648 49 84 516 5-9 days 549 42 76 431 U3-29 days 479 106 62 311 30+ days 174 110 46
Nonveterans
Total 3,266 47 566 2,653
1-4 days 5-9 days 10-29 days
1,062 1,004
980
* 191 9; 174 * 157
861 822 812
30+ days 220 i< 44 159
Veterans Percent distribution
Total 100.0 100.0 100.0 100.0
1-4 days 35.0 16.0 35.0 39.6 5-9 days 29.7 13.7 31.7 33.1 10-29 days 25.9 34.5 25.8 23.9 30+ days 9.4 35.8 * 3.5
Nonveterans
Total 100.0 100.0 100.0 100,0
1-4 days 32.5 * 33*7 32.5 *5-9 days 30.7 .:.
30.7 31.0 10-29 days 30.0 27.7 30.6
Jo.30+ days 6.7 7.8 6.0
24
-----------------------------
----------------------------------
----------------------------------------------
-----------------------------------------------------------------------
-------------------------------------------------------------------------------
--------------------------------------------------------------------------------
---------------------------------------------
----------------------------------------------
-------------------------------------
--------------------------------------------------
----------------
Table 18. Effect of diagnosis in determining whether veterans utilize non-Veterans Ad-ministration hospitals: short-stay hospitals, United States, JUIY 1957-June 1961
~ato we btwad cm household interviews of the civilian, noninstitutional population. The survey design, general qualifications,
and information on the reliability of the estimates are given in Appendix I. Definitions of terms are given in Appendix f..
Type of condition
All conditions
Infective and parasitic diseasesNeoplasms (malignant and benign)Diabetes and other endocrine, allergic, andmetabolic disorders
Mental and personality disordersDiseases of the nervous system and sense organs-Heart conditionsHemorrhoidsAll other circulatory conditionsUpper respiratory conditionsOther respiratory conditionsUlcer of stomach and duodenumAppendicitisHerniaDiseases of the gallbladderOther digestive conditionsMale genital disordersOther genitourinary conditionsArthritis and other diseases of themusculoskeletal systemOther diseases of the bones and jointsFractures and dislocationsOther current injuriesOther conditions and obse~ations
Percent ofveteran
dischargesY from Non-VAhospitals
Average number ofdischarges for veterans
1,849,786 1,580,087 85.4
45,582 38,448 84.3 113>279 90,731 80.1
58,246 ;;, ;5; 75.0 55,832 65.0 80,445 60:708 75.5
113,329 90,745 80.1 59,642 55,701 93.4 59,355 43,605 73.5 72,399 69,405 95.9
113,207 101,007 89.2 99,896 82>418 82.5 52,726 51,697 98.0 88,200 75,373 85.5 39,779 37,554 94.4
106,359 98.183 92.3 54,976 46;847 85.2 89,653 83,111 92.7
55,660 37,317 67.0 89,358 75,779 84.8
113,224 101,652 89.8 147,138 143>386 97.5 141,501 116,485 82.3
25
APPENDIX I
TECHNICAL NOTES ON METHODS
Background of This Report six households in the sample. Each week a random sample of about 120 segments is drawn. In the approxi-
This report is one ofa series of statistical reports mately 700 households in these segments, household prepared by the National Center for Health Statistics. members are interviewed concerning factors related to It is based on information collected in a continuing health. nationwide sample of households in the Health Interview Since the household members interviewed each I Survey, a major part of the program. week are a representative sample of the population,
The Health Interview Survey utilizes a questionnaire samples for successive weeks can be combined into which, in addition to personal and demographic charac - larger samples. Thus the design permits both conteristics, obtains information on illnesses, injuries, tinuous measurement of characteristics of high in-chronic conditions and impairments, and other health cidence or prevalence in the population, and through the topics. As data relating to each of these various broad larger consolidated samples, more detailed analysis of topics are tabulated and analyzed, separate reports are less common characteristics and smaller categories. issued which cover one or more of the specific topics. The continuous collection has administrative and op-The present report is based primarily on the consoli- erational advantages as well as technical assets, since dated sample for 208 weeks of interviewing ending it permits field work to be handled with an experienced, June 1961. stable staff. I
The population covered by Lhe sample for the Health Sample size and geographic detail .—l’he national Interview Survey is the civilian, noninstitutional popu- sample plan over the 4-year period ending June 1?61
lation of the United States living at the time of the included about 485,000 persons from 149,000 households interview. The sample does not include members of the in 25,000 segments. The overall sample was designed in Armed Forces, U.S. nationals living in foreign countries, such a fashion that tabulations can be provided for each or crews of vessels. of the major geographic regions and for urban and rural
sectors of the United States. Statistical Design of the Collection of data. —Field operations for the house-Health Interview Survey hold survey are performed by the Bureau of the Census
under specificati~ns established by the NatimM Center General plan.—The sampling plan of the survey for Health Statistics. In accordance with these specifi
follows a multistage probability design which permits cations the Bureau of the Census selects the sample; a continuous sampling of the civilian, noninstitutiona 1 conducts the field interviewing as an agent of the Center; population of the United States. During the first 18 and performs a manual edit and coding of the qUeStiOnmonths of the survey the first stage of this design naires. The Health Survey, using Center electronic consisted of drawing a sample of 372 from the 1,900 computers, carries out further editing and tabulates the geographically defined primary sampling units (PSU’S) edited data. into which the United States has been divided. A PSU is Estimating methods.— Each statistic produced by a county, a group of contiguous counties, or a standard the survey—for example, the number of disability days metropolitan statistical area. Beginning in January 1959 occurring in a specified period— is the result of two
(the sample size was increased to 500 PSU’S. However, stages of ratio estimation. In the first of these, the the basic sampling design and methods of estimating factor is the ratio of the 1950 decennial population count remained unchanged during the 4-year period covered to the 1950 estimated population in the National Health by this report. Survey’s first-stage sample of PSU’S. These factors
With no loss in general understanding, the remaining are applied for some 50 color-residence classes. Prior stages can be telescoped and treated in this discussicmt to January 1959 about 132 color-residence classes were as an ultimate stage. Within PSU’S, then, ultimate stage applied. units called segments are defined, also geographically, I.ater, ratios of sample-produced estimates of the in such a manner that each segment contains an expected population to official Bureau of the Census figures for
26
rurrtmt population in about 60 age-sex-color classes (76 betirre Janufiry 1959) are computed, and serve as swmd-stage thctors for ratio estimating.
lhe effect of the ratio estimating process is to muke the sample more closely representative of the population by age, sex, color, andresidence—thus reducing sampling variance.
As noted, each week’s sample represents thepopulation Iiving during that week as wellascharacteristics ofthnt population. Consolidation of samplea over atime period, say a calendar quarter, produces estimates of average characteristics of the U.S. population for that calendar quarter. Similarly, ppulation data for a year are averages of the four quarterly figures.
For statistics measuring thenumberofoccurrences during a specified time period, such asthe number of Mi-disabilitydays, asimilar computational procedure is used, but thestatistics haveadifferent interpretation. l’~w these items, the questionnaire asks for the resp~mdent’s experience over the 2 calendar weeks prior to the week of interview. In such instances, the estimated quarterly total for the statistic is simply 6.5 times the average 2-week estimate produced by the 13 successive samples taken during the period. The annual total is the sum of the four quarters. Thus, the experience of per-sons interviewed ~uring a year—experience which iwtually occurred for each person in a 2-calendar-week interval prior to week of interview—is treated as though it measured the total of such experience during the year. Such interpretation leads to no significant bias.
General Qualifications
. -.LData were adjusted for t-mmsponse by a procedure which imputes to persons in a household which was not interviewed the characteristics of per-sons in households in the same segment which were interviewed. ‘he total noninterview rate was 5 percent; i percent was refusal, and the remainder was primarily due to the failure to find any eligible household respondent after repeated trials.
The interview process.—The statistics presented in this report are based on replies secured in interviews of persons in the sampled household. Each adult available at the time of interview was interviewed individually. Proxy respondents within the household were employed for children and for adults not available at the time of the interview, provided the respondent waa closely related to the person aimttt whom information was being obtained,
l-here are limitations to the accuracy of diagnostic and other information collected in household interviews. For diagnostic information the household respondent can, at be$t, pass on to the interviewer only the informat Ion the physician has given the family. For conditions not medically attended, diagnostic information is often no more than a description of symptoms. However, other
types of facts such as those concerning the circumstances and consequences of illness or injury and the resulting action taken or sought by the individual can be obtained more accurately from household members than from any other source, since only the persons cone erned are in a position to report this information.
Rounding of numbers .—The original tabulations on which the data in this report are based show all estimates to the nearest whole unit. All consolidations were made from the original tabulations using the estimates to the nearest unit. In the final published tables the figures are rounded to the nearest thousand, although these are not necessarily accurate to that detail. De-vised statistics, such as rates and percent distributions, are computed after the estimates on which these are based have been rounded to the nearest thousand.
Population figures .—Some of the published tables include population figures for specified categories. Except for certain overall totals by age and sex, which are adjusted to independent estimates, these figures are based cm the sample of households in the National }Iealth Survey. These are given primarily to provide denominators for rate computation, and for this purpose are more appropriate for use with the accompanying measures of health characteristics than other population data that may be available. In some instances these will permit users to recombine published data into classes more suitable to their specific needs. With the exception of the overall totals by age and sex, mentioned above, the population figures differ from corresponding figures (which are derived from different sources) published in reports of the Bureau of the Census. For population data for general use, see the officiai estimates presented in Bureau of the Census reports in the P-20, P-25. and P-60 series.
Reliability of Estimates
Since the estimates are based on a sample, they will differ somewhat from the figures that would have been obtained if a complete census had been taken using the same schedules, instructions, and interviewing personnel and procedures. As in any survey, the results are also subject to measurement error.
The standard error is primarily a measure of sampling variability, that is, the variations that might occur by chance because only a sample of the population is surveyed. As calculated for this report, the standard error also reflects part of the variation which arises in the measurement process. It does not include estimates of any biases which might lie in the data. The chances are about 68 out of 100 that an estimate from the sample would differ from a complete census by less than the standard error. The chances are about 95 out of 100 that the difference would be less than twice the standard error and about 99 out of 100 that it would be less than 212times as large.
27
The relative standard error of an estimate is obtained by dividing the standard error of the estimate by the estimate itself and is expressed as a percentage of the estimate. Included in this Appendix are charts from which the relative standard errors can be determined for estimates shown in the report. In order to derive relative errors which would be applicable to a wide variety of health statistics and which could be prepared at a moderate cost, a number of approximations were required. As a result, the charts provide an estimate of the approximate relative standard error rather than the precise error for any specific aggregate or percentage.
Three classes of statistics for the health survey are identified for purposes of estimating variances.
Narrow range .—This class consists of(1) statistics which estimate a population attribute, e.g., the number of persons in a particular income group, and (2) stat is-tics for which the measure for a single individual for the period of reference is usually either O or 1, on occasion may take on the value 2, and very rarely, 3.
Medium range. —This class consists of other statistics for which the measure for a single individual for the period of reference will rarely lie outside the range o to 5.
Wide range. —This class consists of statistics for which the measure for a single individual for the period of reference frequently will range from O to a number in excess of 5, e.g., the number of days of bed disability experienced during the year.
In addition to classifying variables according to whether they are narrow-, medium-, or wide-range, statistics in the survey are further defined as:
Type A.—Statistics on prevalence, and incidence data for which the period of reference in the questionnaire is 12 months.
Type B.— Incidence-type statistics for which the period of reference in the questionnaire is 2 weeks.
Type C.—Statistics on data, such as hospitalization, for which the period of reference is 6 months.
Only the charts on sampling error applicable to data contained in this report are presented.
General rules for determining relative sampling errors —The “guide” on page 29, together with the fol-lowing rules, will enable the reader to determine approximate relative standard errors from the charts for estimates presented in this report.
Rule 1. Estimates ofaggr egates: Approximate relative standard errors of estimates for aggregates, such as the number of persons with a given characteristic, are obtained from appropriate curves on pages 30-32. The number of persons in the total U.S. population or in an age class of the total population is adjusted to official Bureau of the Census figures and is not subject to sampling error.
Rule 2. Estimates of percentages in a percent distribution: Relative standard errors for percentages in a percent distribution of a total are obtained from appropriate curves on pages 33-35. For values which do not fall on one of the curves presented in the chart, visual interpolation will provide a satisfactory approximation.
Rule 3. Estimates “of- ;ates where the numerator is a subclass of the denominator: This rule applies for prevalence rates or where a unit of the numerator occurs, with few exceptions, only once in the year for any one unit in the denominator. For example, in computing the rate of chronic conditions per 1,000 population, the numerator consisting of persons with the condition is a subclass of the denominator which in-eludes all persons in the population, Such rates if converted to rates per 1(JOmaybe treated as though they were percentages, and the relative standard errors obtained from the chart on page 33. Rates per 1,(10[1, or on any other base, must first he converted to rates per 100, then the percent. age chart will provide the relative standard error per 100.
Rule 4. Estimates of rates where the numerator is not a subclass of the denominator: This rule applies where a unit of the numerator often occurs more than once for any one unit in the denominator. For example, in computing the number of hospital dis. charges per 1,000 persons per year< it is possible that a person in the denominator could have had more than one of the hospital discharges included in the numerator. Approximate relative standard errors for rates of this kind may be computed as follows: (a) Where the denominator is the total U.S.
population, or includes all persons in one or more of the age groups of the the total population, the relative error of the rate is equivalent to the relative error of the numerator which can be obtained directly from the appropriate chart.
(b) In other cases, obtain the relative standard error of the numerator and of the denominator from the appropriate curve. Square each of these relative errors, add the resulting values, and extract the square root of the sum. This procedure will result in an upper bound and often will over-state the error.
28
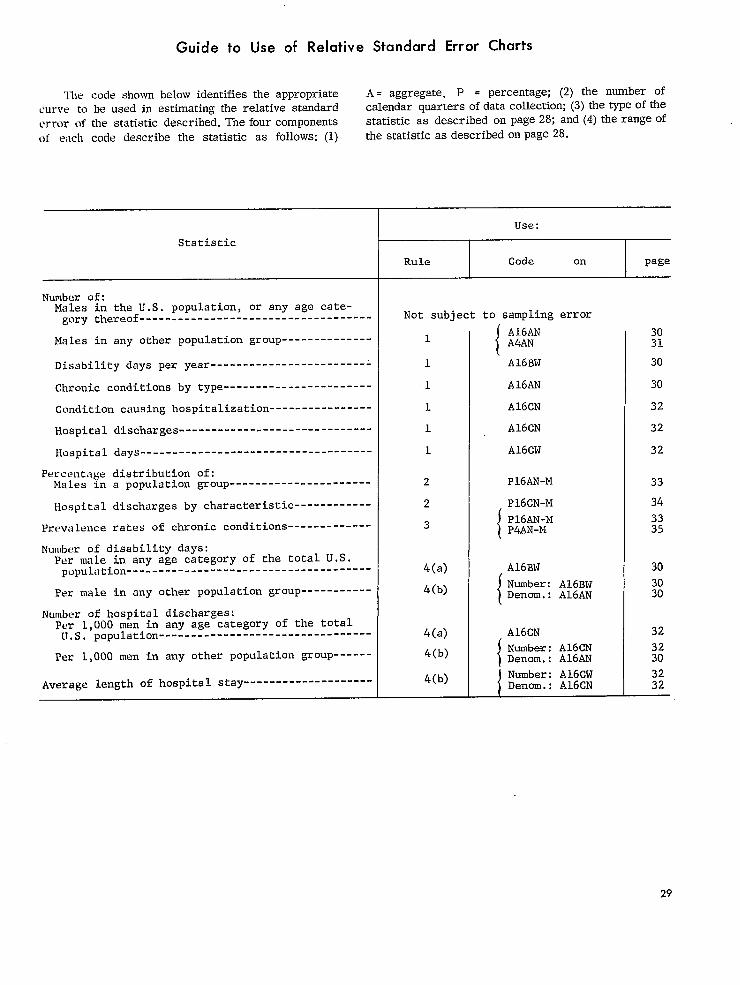
------------------------------------
--------------
-------------------------
-----------------------
----------------
------------------------------
------------------------------------
----------------------
------------
-------------
--------------------------------------
-----------
---------------------------------
--------------------
Guide to Use of Relative Standard Error Charts
‘llwcode shown belowidentifiestheappropriatecurve to be used in estimating standardtherelativeerrorof thestatistic The fourcomponentsdescribed.of each code describethe statistic (1)as follows:
Statistic
Number of:Males in the U.S. population,or any age cate-
A = aggregate,P = percentage;(2)the number ofcalendarquartersofdatacollectio~(3)thetypeofthestatisticas describedon page28;and(4)therangeofthestatistic onpage28.asdescribed
Use:
Rule Code on page
gory thereof Not subject to samplingerror
Malea in any other populationgrouP 1
{
A16AN A4AN
30 31
Disabilitydaya per year 1 A16BW 30
Chrunic conditionsby type 1 A16AN 30
Cunditioncausinghospitalization 1 A16CN 32
Hospital discharges 1 A16CN 32
Hospital days 1 A16CW 32
Percentagedistributionof: Males in a populationgroup 2 P16AN-M 33
Hospital dischargesby characteristic 2 P16CN-M 34
Prevalencerates of chronic conditions 3 P16AN-M P4AN-M{
33 35
Number of disabilitydays: Per male in any age categoryof the total U.S. population 4(a) ,A16BW 30
Number: A16BW 30Per male in any other populationgroup 4(b)
{ Denom.: A16AN 30
Number of hospital discharges: Per 1,000men in any age category of the total U.S. population 4(a) A16CN 32
Number: A16CN 32Per 1,000 men in any other population group------ 4(b)
{ Denom.: A16AN 30
Average length of hospital stay 4(b) 1Number: A16CW 32 Denom.: A16CN 32
29
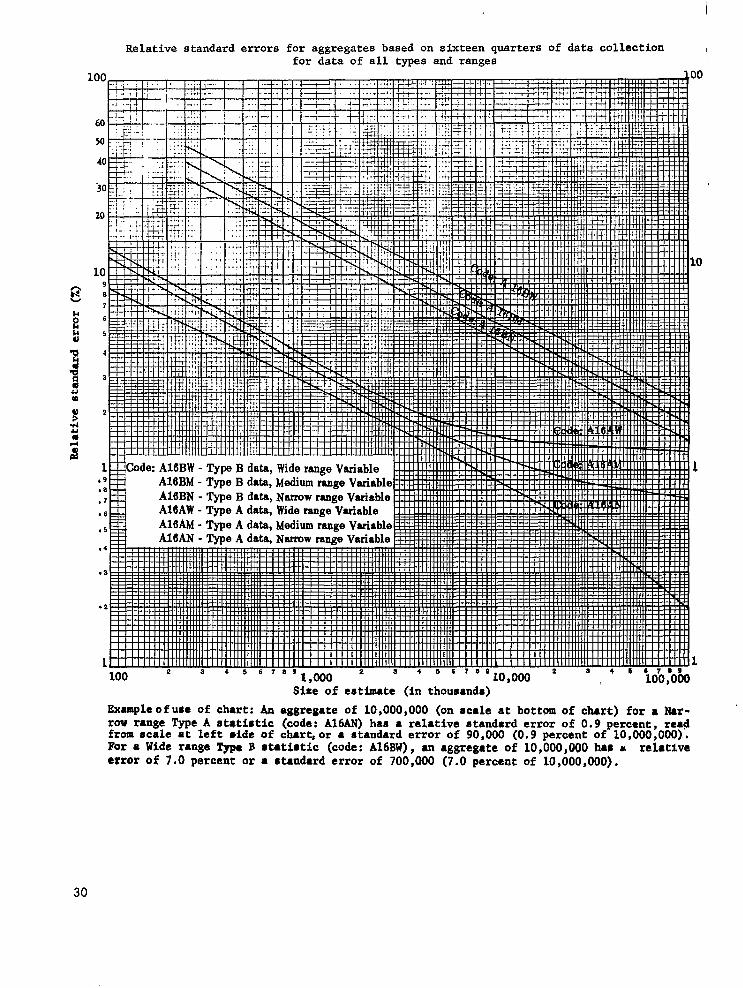
I
Relativestandarderrors for aggregatesbased on sixteenquartersof data collectionfor data of all types and ranges I
Size of eati.mate(in thousands)
Exempleofu#e of chart:h aggregateof 10,000,000(on scale at bottom of chart) for a Narrow range Type A eteti#tic (code:A16AN) hae � relativeetandarderror of 0.9 percent,read from scale at left side of chert,or a etanderderror of 90,000 (0.9perceqt of 10,000,000). For a Wide range Type B stat~stic (code:A16BW), an aggregateof 10,OOO,QOOhap a relative error of 7.0 percentor � etmdard error of 700,000 (7.0percentof 10,000,000).
30
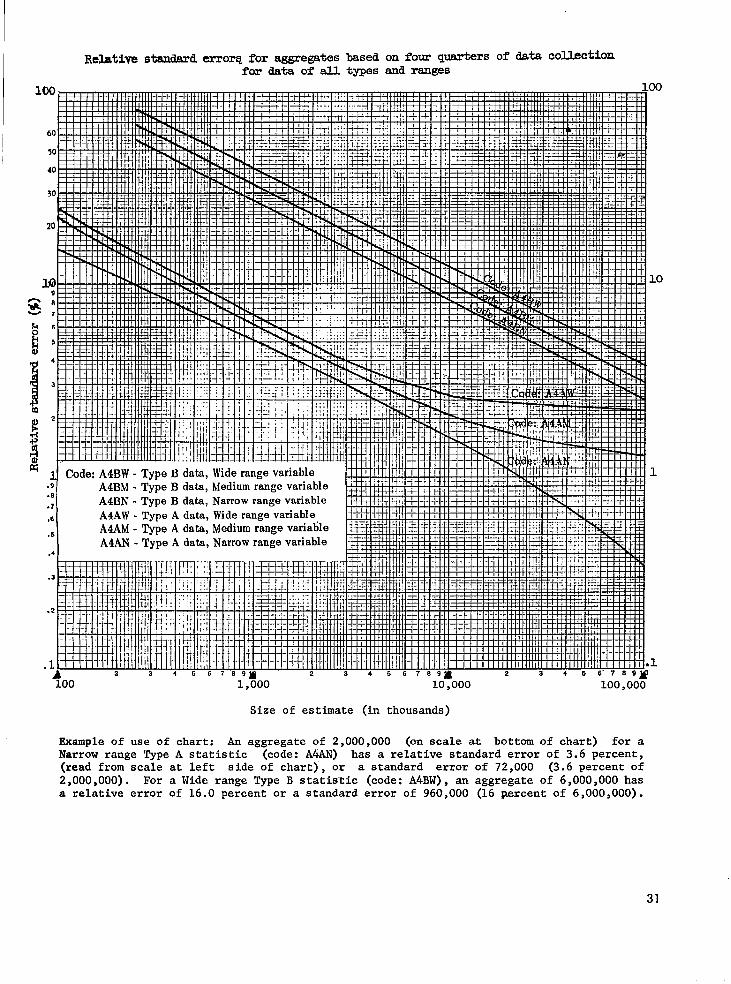
standmd errorq for aggregatesbased on four quar-krs of data collectionR&lativefor data of all types and ranges
ioo 1,300 10:000 100,006
Size of estimate (in thousands)
Example of use of chart: An aggregateof 2,000,000 (on scale at bottom of chart) for aNarrow range Type A statistic (code:A4AN) has a relative standarderror of 3.6 percent,(read from scale at left side of chart), or a standard error of 72,000 (3.6 percent of2,000,000). For a Wide range Type B statistic (code:A4Bw), an aggregateof 6,000,000has a relativeerror of 16.0 percent or a standarderror of 960,000 (16 ~cent of 6,000,000).
31
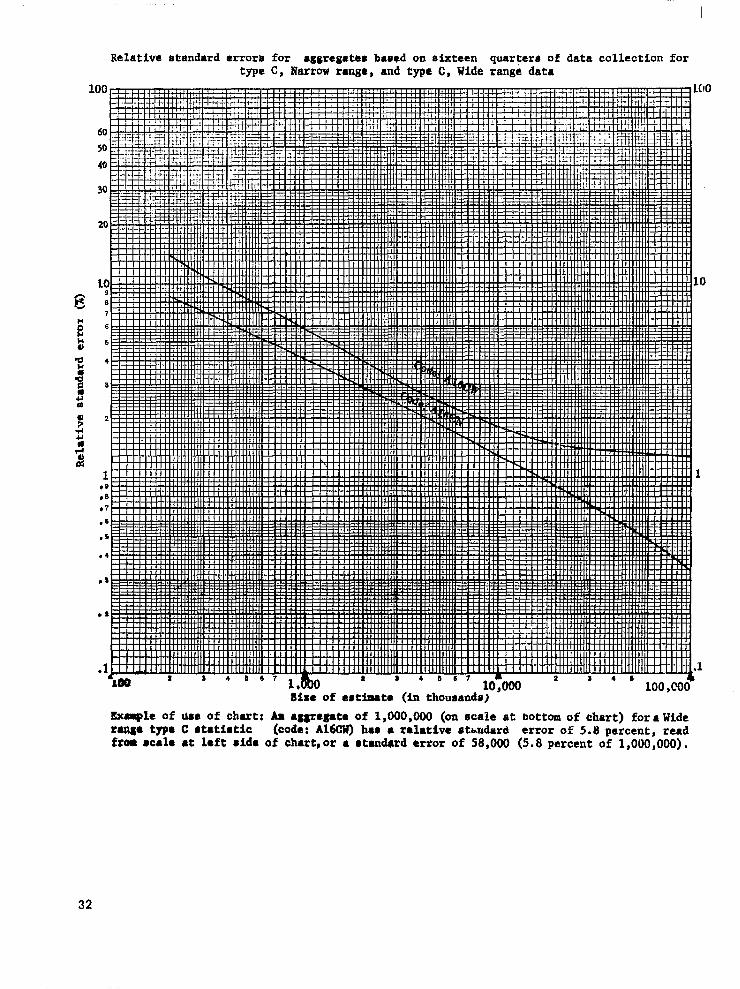
Relative standard error~ for aggregatesbae~d on eixteen quarters of datacollectionfor typeC, Narrowrange,and typeC, Widerangedata
1
Exqle of Me of chart:Aa �g~egat@ of 1,000,000(oncceleat bottomof chart)foraWide range typeC #tatisttc (code:A16CW)hm � relativeataudard errorof 5.8percent,read fvm scale�t leftsideof chart,or� stamkd �rrorof 58,000(5.8percentof 1,000,000),
32

Relative standard errcms for percentages based on sixteenquarters of data collectionfor type A data, Narrow and Medium range
(Baseof percentageshown on curves in millions)1
Estimatedpercentage
Example of use of chart:An estimateof 20 percent (on scale at bottom of chart) based onan estimateof 10,000,000has a relativestandarderror of 1.8 percent (read from the scaleat the left side of the chart), the point at which the curve for a base of 10,000,000in-tersectsthe vertical line for 20 percent.The standarderror in percentagepoints is equalto 20 percentX 1.8 percent or 0,36 percentagepoints.
33
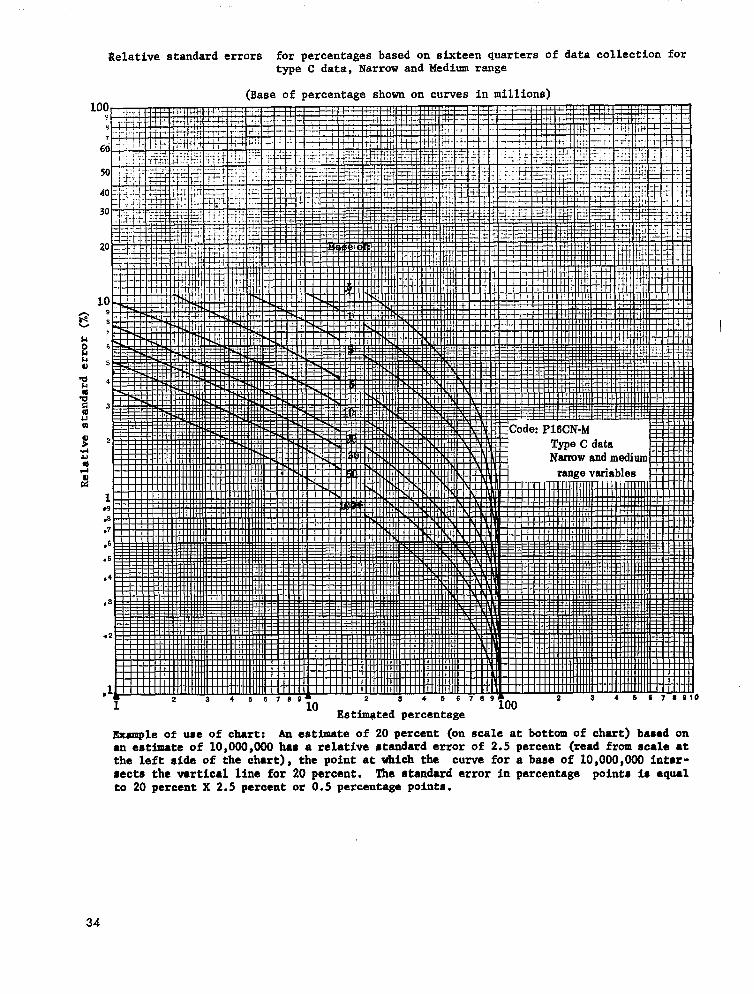
Relative standarderrors for percentagesbased on sixteen quartersof data collectionfortype C data, Narrow and Medium range
(Baseof percentageshown on curves in millions)
L 10 J.uu Estimatedpercentage
memple of use of chart: AIIeetimateof 20 percent (on scale at bottom of chart) baaad on �n estimate of 10,000,000 ha~ a relative standard error of 2.5 percent (read from scale at the left aide of the chart), the point at which the curve for a base of 10,000,000 inter-sects the vertical line for 20 percent. The standard error in percentage pointx in equal to 20 percent X 2.5 percent or 0.5 percentage points.
34
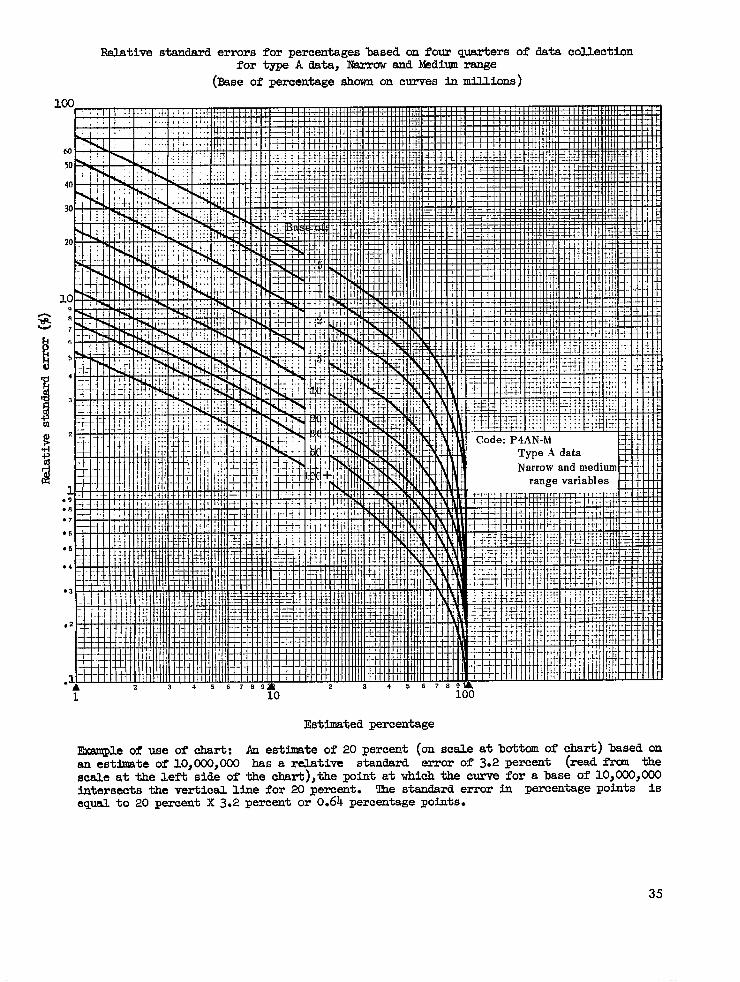
Relative standard errorsfor percentages ‘based on four wartera of data coUection for typeA data,Narrowand Mediumrange
(Baseof percentageshownon curvesin nd.Uions)
Est3matedpercentage
Exampleof use of chart: An estimateof 20 percent(onscaleat bottomof chart)basedon of 10,W, 000 has a rektive standard error of 3.2percent (readfrcm thean estchawte
scale@ the left sideof the chart),thepointat whiohthe curvefor a base of 10,000,000intersectsthe verticallinefor 20 percent. l?hestandarderrorin percentagepoints iseqti to 20 percentx 3.2percentor 0.64percentagepoints.
35
APPENDIX II
DEFINITIONS OF CERTAIN TERMS USED IN THIS REPORT
Terms Relating to Disability
Disability .—Disability is a general term used to describe any temporary or long-term reduction of a person’s activity asaresult ofilIness or injury.
Disability days are classified as follows: days of restricted activity, days of bed disability, and days lost from work. All hospital days are, by definition, days of bed disability; all days of bed disability are, by definition, days of restricted activity. The converse form of these statements is, of course, not true. Days lost from work is a special term which applies to the currently employed. These are also days of restricted activity. See the definition of “Work-loss day.”
Restricted-activity day.—A day of restricted activity is a day when a person cuts down on his usual activities for the whole of that day on account of an illness or an injury, The term’ ‘usual activities” for any day means the things that the person would ordinarily do on that day. For retired or elderly persons, “usual activities” might consist of almost no activity, but cutting down on even a small amount for as much as a day would constitute restricted activity. On Sundays or holidays “usual activities” are taken to be things the person usually does on such days–going to church, playing golf, visiting friends or relatives, or staying at home and listening to the radio, reading, watching television, and so forth. The type of reduction of usual ac. tivity varies with the age and occupation of the individual as well as with the day of the week or season of the year.
Restricted activity covers the range from substantial reduction to complete inactivity for the entire day. A day spent in bed or a day home from work or school because of illness or injury is, of course, a restricted-activity day.
Bed-disability day.—A day of bed disability is one on which a person stays in bed for all or most of the day because of a specific illness or injury. All or most of the day is defined as more than half the daylight hours. All hospital days for inpatie~ts are considered to be days of bed disahi]ity even if the patient was not actually in bed at the hospital.
Work-loss day.—A day is counted as lost from work if the person would have been going to work at a job or business that ,day but instead lost the entire work day because of an illness or an injury. If the person’s
regular work day is less than a whole day and the entire work day was lost, it would be counted as a whole work day lost. Work-loss days are determined only for currently employed persons 17 years of age and over.
Person-days of restricted activity, bed disability, ~. —Person-days of restricted activity, bed disability, and so forth are days of the various forms of disability experieu~ed by any one person, The sum of days for all persons in a group represents an unduplicated count of all days of disability for the group, i.e., a person with 2 condition-days of disability on a given day is included only once in the person-day count.
Terms Relating to Chronic Conditions
Condition. —A morbidity condition, or simply a condition, is any entry on the questionnaire which describes a departure from a state of physical or mental well-being. It results from a positive response to one of a series of “illness-recall” questions. In the coding and tabulating process, conditions are selected or classified according to a number of different criteria, such as, whether they were medicaHy attended; whether they resulted in disability; whether they were acute or chronic; or according to the type of disease, injury, impairment, or symptom re~rted. For the purposes of each published report or set of tables, only those conditions recorded on the questionnaire which satisfy certain stated criteria are included.
Conditions, except impairments, are coded by type according to the International Classification of Diseases with certain modifications adopted to make the code more suitable for a household-interview-type survey. Impairments are coded according to a special supplementary classification. (See definition of “Impairments. ” See also definitions of “Chronic condition,” “Injury condition,” and “Hospitalized condition.”)
Chronic condition .—A condition is considered to be chronic if (1) it is described by the respondent in terms of one of the chronic diseases on the “Check List of Chronic Conditions” (Appendix III, Card A) or in terms of one of the types of impairments on the “Check List of Selected Impairments” (Appendix 111,Card B) or (2) the condition is described by the respondent as having
been first noticed more than ‘i months before the wet?k of the interview.
36
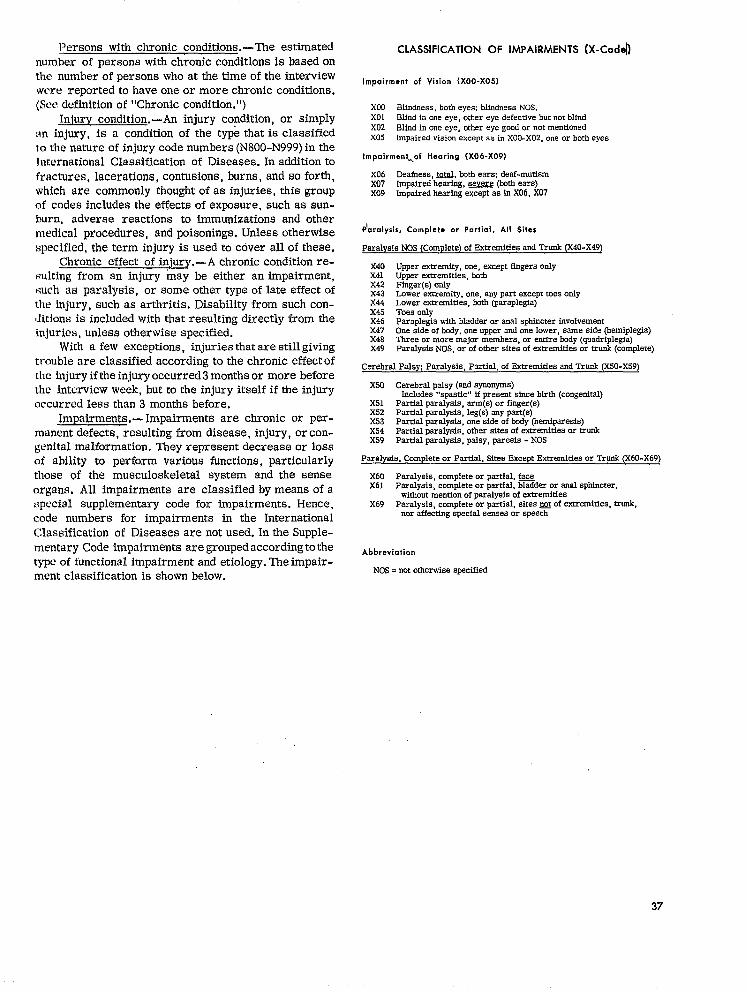
Persons with chronic conditions .—The estimated number of persons with chronic conditions is baaed on the number of persons who at the time of the interview wL’re reported to have one or more chronic conditions. (See definition of “Chronic condition.”)
Iniury condition.— An injury condition, or simply on injury, is a condition of the type that is classified to the nature of injury code numbers (N800-N999) in the International Classification of Diseases. In addition to fractures, lacerations, contusions, burns, and SQ forth, which are commonly thought of as injuries, this group of codes includes the effects of exposure, such as sun. burn, adverse reactions to immunizations and other medical procedures, and poisonings. Unless otherwise specified, the term injury is used to cover all of these.
Chronic effect of tiju ry.-A chronic condition resulting from an injury may be either an impairment, such as paralysis, or some other type of late effect of the injury, such as arthritis. Disability from such conditions is included with that resulting directly from the injuries, unless otherwise specified,
With a few exceptions, injuries that are still giving trouble are classified according to the chronic effect of the injury if the injury occurred 3 months or more before the interview week, but to tbe injury itself if the injury occurred less than 3 months before.
Impairments .- Impairments are chronic or permanent defects, resulting from disease, injury, or con-genital malformation. They represent decrease or loss of ability to perform various functions, particularly those of the musculoskeletal system and the sense organs. All impairments are classified by means of a special supplementary code for impairments. Hence, code numbers for impairments in the International Classification of Diseases are not used. In the Supplementary Code impairments are grouped according to the type of functional impairment and etiology. The impairment classification is shown below.
CLASSIFICATION OF IMPAIRMENTS (X-Code~
Impairment of Vision (XOO-X05)
XOO Slindness, both eyes blindness NOS.XOl Biind in one eye, other eye defective but not blindX02 Blind in one eye, other eye gccd or not mentionedX05 Impaired vision except as in XOO.X02. one or both eyes
Impairment-of Hearing (X06-X09)
x06 Ceafness, KM troth ears; denf-mutism X07 Impaired hearing. sever? (both ears) X09 Impafred hesring except as ia X06, X07
$aralysis, Complete or Partial, All Sites
PsralYsis NOS (Complete) of Extrernitiep nnd Trunk (X40.X4~
X40 Upper extremity, one, except fingers onlyX41 Upper extremities, MbX42 Finger(s) onlyX43 Lower extremity, one, my part except toes onlyX44 Lower extremities, Mb (paraplegia)X45 Toes onlyX46 Paraplegia with bladder or nnal spbfncter involvementx47 One side of body, one upper nnd one lower, same side (lvsmiplegia)X48 Three or more major members, or entire body (quadriplegla)X49 Pnralysis NOS, or of other sites of extremities or trunk (complete)
Cerebr~ PalsM Paralysis, Partfal, of Extremities and Trunk (X50-X59)
X50 Cerebrst palsy (and synonyms) Includes %pasticr’ if present sfnce bfrtb (congenital)
X51 Partial paralysis, nrnr(s) or fingez(s) x52 Partial paralysis, leg(s) my part(s) X53 Pnrtinl pnralysis, one side of body (lmmfparesls) X54 Partfat paralysis, other sites of exrrenrities or rrtmk X59 Partial parnlysis, palsy, paresis - NOS
Paralysfs. Complete or Parrird, Sites Except Exmernkies or Trunk (X60-X69)
x60 Paralysis, complete or Partia, f=X61 Parnlysis, cnmplete or pm-fat, bladdm or ansl sphtncter,
without mention of paralysis of extremities X69 Pnralysis, complete or psrtkl, sites D@of extremities, Gunk,
nor affecting special senses or speech
Abbreviation
NOS = not otherwise specified
37
Prevalence of conditions.— In general, prevalence of conditions is the estimated number of conditions of a specified type existing at a specified time or the average number existing during a specified interval of time. The number of chronic cases reported to be present or assumed to be present at the time of the interview are those reported by the respondent in terms of one of the chronic diaeaaes on the “Check List of Chronic Conditions” and reported to have been present at some time during the 12-month period prior to the interview.
Estimates of the prevalence of chronic conditions may be restricted to cases that satisfy certain additional stated criteria, such as cases involving a day or more in bed in the past year, cases still under medical care, or those with specified degrees of limitation. (See definitions of “Chronic limitation in ability to work” and “Chronic mobilitv limitation.”)
Medically a~tended condi’tion.-A condition about which a physician was consulted is called a medically attended condition. Consulting a physician includes consultation in person or by telephone for treatment or advice. Advice from the physician transmitted to the patient through the nurse is counted as medical consultation as well as visits to physicians in clinics or hospitals. If at one visit the physician is consulted about more than one condition for each of several patients, each condition is counted as medically attended.
For the purpose of this definition, “physician” includes doctors of medicine and osteopathic physicians. ‘The term “doctor” is used in the interview, rather than “physician,” because of the need to keep to popular usage. However, the concept toward which all instructions are directed is that which is described here.
A condition is counted as medically attended if a physician was consulted about it at its onset or at any time thereafter. However, the first medical attention for a condition that was present in the 2 weeks before the interview may not occur until after the end of the 2-week period. In fact, it may not occur until after the interview. Such cases are necessarily treated as though there had been no medical attention.
Under care. —This information is obtained only for chronic conditions. A chronic condition which is “under care” is one for which the person ia’ ‘under instruction” from a physician. By “under instruction” is meant one or more of the following: (1) taking certain medicine or treatment prescribed by a physician, (2) observing a certain systematic course of diet or activity, (3) visiting the physician regularly for checking on the condition, and (4) under instruction from the physician to return if some particular thing happens.
For the purposes of this definition “physician” is defined as in “Medically attended condition. ”
Terms Relating to Long-Term Disability
Chronic limitation in ability to work.— Persons, whose usual activity during the 12 months prior to inter-view was working, are classified as limited in their
ability to work if they indicate that they are unable to work at a job or business or that they are limited in the amount or kind of work, e.g., need special working aids or special rest periods at work, cannot work full time or for long perioda at a time, cannot do strenuous work.
Chronic mobility limitation. —Persons with chronic activity limitation of some degree as a result of one or more chronic conditions are classified as limited in their mobility if they are:
1. Confined to the house all the time except in emergencies.
2. Able to go outside but need the help of another person in getting around outside.
3. Able to go outside alone but have trouble getting around freely.
Terms Relating to Hospitalization
Hospital episode .—A hospital episode is any continuous period of stay of 1 or more nights in a hospital as an inpatient.
Hospital.— A hospital is defined as any institution meeting one of the following criteria: (1) named in the listing of hospitals in the current Guide Issue of Hospitals, the Journal of the American Hospital Association; (2) named in the listing of hospitals in the Directories of the American Osteopathic Hospital Association; or (3) named in the annual inventory of hospitals and related facilities submitted by the States to the Division of Hospital and Medical Facilities of the Public Health Service in conjunction with the Hill Burton program.
Hospital ownership. —Hospital ownership is a classification of hospitals according to the type of organization that controls and operates the hospital. The category to which an individual hospital is assigned and the definition of these categories follows the usage of the American Hospital Association.
Type of hospital service. —Type of hospitai service is a classification of hospitals according to the pre -dominant type of cases for which they provide care, The category to which an individual hospital is assigned and the definition of these categories follows the usage of the American Hospital Association.
Short-stay hospital. —A short-stay hospital is one for which the type of service is general; maternity; eye, ear, nose, and throat; children’s; osteopathic hospital; or hospital department of institution.
Hospital discharge, --A hospital discharge is a hospital episode that ended during a specified period of time covered by the survey. (See definition of “Hospital episode.”)
A hospital discharge is recorded whenever a present member of the household is reported to have been discharged from a hospital in the 12-month period prior to the interview week. For certain reports of the National Health Survey, estimates were based on discharges which occurred during the 6-month period prior to the interview.
38
Hospital daY.—A hospital day is a day on which a person is confined to a hospital. The day is counted as a hospital day only if the patient stays overnight. Thus, a patient who enters the hospital on Monday afternoon and leaves Wednesday noon is considered to have had 2 hospital days.
Estimates of the total number of hospital days are derived by summing the days for all hospital episodes of a particular type. See definition of’ ‘Hospital episode.”) For example, the number of hospital days may be summed for all hospital discharges. (See definition of “Hospital discharge.”)
Hospital days per year .—These are the total number of days for all hospital episodes in the 12-month period prior to the interview week. For the purposes of this estimate episodes overlapping the beginning or end of the 12-month period are subdivided so that only those days falling within the period are included.
Length of hospital sta y. —The length of hospital stay is the duration in days, exclusive of the day of discharge, of a hospital discharge. (See definition of “Hospital discharge.”)
Average length of hospital stay.—l%e average length of hospital stay per discharged patient is computed by dividing the total number of hospital days for a specified group by the total number of discharges for the same group.
Hospitalized condition.—A hospitalized condition is a condition responsible for a hospital episode. (See definition of “Hospital episode.”) If there is more than one hospitalized condition for any one episode, only that one believed to be chiefly responsible for the stay in the hospital is tabulated. If a person enters a hospital for diagnostic tests, or for an operation, the condition that made the tests or operation necessary is considered to be the hospitalized condition.
Conditions, except impairments, are coded by type according to the International Classification of Diseases with certain modifications adopted to make the code more suitable for a household-interview tYPe survey. For survey results included in this report the 1955 Revision of the International Classification was used. Impairments are coded according to a special supplementary classification. (See definition of “Impairments.”) The code numbers included in each of the diagnostic groups appear in an earlier report, Health Statistics, Series B, No. 32, p. 50.
Terms Relating to Specicsl Aids
Special aid. —A special aid is a device used to compensate for defects resulting from disease, injury, impairment, or congenital malformation. Information is recorded about special aids even though the persons possessing them do not use them.
Hearing aid. —Ahearing aid is any kind of mechanical or electrical device used to improve hearing.
Dental Terms
Edentulous persons. —Persons who have lost all of their permanent teeth or who have a congenital absence of permanent teeth are classed as edentulous persons. An edentulous person may have dentures but does not have any natural teeth.
Demographic, Social, Economic,
and Other Terms
&—The age recorded for each person is the age at last birthday. Age is recorded in single years and grouped in a variety of distributions depending upon the purpose of the table.
Income of family or of unrelated individuals .-Each member of a family is classified according to the total income of tbe family of which he is a member. Within the household all persons related to each other by blood, marriage, or adoption constitute a family. Unrelated individuals are classified according to their own income.
The income recorded is the total of all income received by members of the family in the 12-month period prior to the week of interview. Income from all sources is included, e.g., wages, salaries, rents from property, pensions, help from relatives, and so forth.
Veteran status .—In order to establish veteran status, information is secured concerning service in the Armed Forces. The information is obtained only for males 17 years of age and over.
Service in the Armed Forces means active duty for any period of time in the U.S. Army, Navy, Air Force, Marine Corps, or Coast Guard. Peacetime service in the Merchant Marine, in a National Guard unit, or in active reserve training is not considered to be service in the Armed Forces.
If a man has served in more than one war, he is classified according to the latest war in which he served.
When males 17 years of age and over are grouped into two classes, veterans and nonveterans, men with peacetime service only are included, with those having no military service as nonveterans.
Usual activity status .—All persons in the population are classified according to their usual activity status during the 12-month period prior to the week of inter-view. The “usual” activity status, in case more than one is reported, is the one at which the person spent the moat time during the 12-month period.
The categories of usual activity status used for persons aged 17 years and over are: usually working, retired, and other. For several reasons these categories are not comparable with somewhat similarly named categories in official Federal labor force statistics. First, the responses concerning usual activity status are accepted without detailed questioning, since the objective of the question is not to estimate the numbers of persons in labor force categories but to identify
39
crudely certain population groups which may have differing health problems. Second, the figures represent the usual activity status over the period of an entire year, whereas official labor force statistics relate to a much shorter period, usually 1 week. Third, the minimum age for usually working persons is age 17 in the National Health Survey and the official labor force categories include all persons age 14 or older. Finally in the definitions of specific categories which follow, certain marginal groups are classified differently to simplify procedures.
Usually working includes persons 17 years of age or older who are paid employees; self employed in their own business, profession, or in farming; or unpaid employees in a family business or farm. Work around the house, or volunteer or unpaid work, such as for a church, etc., is not counted as working.
Retired includes persons 45 years old or over who consider themselves to be retired. In case of doubt, a person 45 years of age or older is counted as retired if he has either voluntarily or in-voluntarily stopped working and is not looking for work. A retired person may or may not be unable to work.
-r .in this report includes males 17 years of age or older not classified as “working” or “retired.” Persons aged 17 years and over who are going to school are included in this group.
000
fie labor force. —This includes all persons 17 years of age and older who worked at or had a job or business or were looking for work during the 2-week period prior to week of interview. The labor force consists of persons currently employed and those unemployed as defined below.
Currently employed describes persons 17 years of age or over who reported that at any time during the 2-week period covered by the interview they either worked at, or had a job or business. Current employment includes paid work as an employee of someone else, self-employment in business, farming, or professional practice, and unpaid work in a family business or farm. Persons who were temporarily absent from their job or business because of a temporary illness, vacation, strike, or bad weather are considered as currently employed if they expected to work as soon as the particular event causing their absence no longer existed. Free-lance workers are considered as currently
employed if they had a definite arrangement with one or more employers to work for pay according to a weekly or monthly schedule either full time or part time. Excluded from the currently employed are such persons who have no definite employment schedule but work only when their services are needed.
40
APPENDIX 111
QUESTIONNAIRE
The Items below show the eXaCt content and wording of the questionnaire used in the household survey. The actual
questionnaire is designed for a household as a unit and includes additional spaces for reports on more than one person.
c. IS tbl. kWCM � fUmOr NCA?. . . . . . . . . . . . . . . . . . . . � 1.s � m
Id. mst istk t.x.kmemrhmsl If. IJm,ls ** kssd tim * (m ~mgf Iucditintiit (0 W* ofn-i~l m*lll-p~* ; cccl*
•1 1$=, mwt.m !O~*r
u Am them w .ihorIiviu 9arterm, -M or v-t,1.thlo
ASk St til ~itl �XC9Dt ~llt k.US9S kmildiu (qirtmcat) . . . . . . . . . . . . . . . . . . . . � res � IIIO E. Is tk.ro uetAarkildfm; m tkis Pm99rt7 fer
wOl* to 1110 I- - �itkm miod � nmt? .. . . . •r.~no
:1 14 mr. Old or .v.r. -k: I u mmr 14 8*nm I
41
---------------
--
--
---------------
---------------
--
.,If ml,. Ud 14 ,,,,s OXd.,,,. “,: O mm. orrd. 14 n..
b’titn?C. (m) Did ya m. mm i. tk dmd - or dietbitod n Y*S Olka If ,,1,.,- “k: (b) AN YMnomim tk. dmtd?orcn, motcomttig faerwom?
(If -x. *,, ,d*l,t* this mm.. from W.mtiom.ir,) * o V** c1 R.
(e) ~w*t~r-mi~ **g. ur.rrnit_ttimly7 o r-r D ***:b
11 Wu,- Mt: (d) krk � id mr dkdya “m 0 E4nhh A9mictn D m-11 rf 7.m,,-ti.r .anl,, ..k nw-1 o tar,= i (*) Yn n, ef yar.cticebwt= -* 27, lk50ud Jx17 31. 1%57
rf g xnra old w cw.r, uk
IO, (m) -t wsm YOU*imcrntt Of t&* 12mc9tks O lorklw (rnr real.. .v.r W: rn*isg, l-img ror rnrk, 0; bi8c 8DctMmg �lm? D Loc.klnsworkf.. (rc.rfhrnonrlefi wxblmr, ltilmctirrnh. k~lwti. .rti1mzm*imce1*? c1 C..c.irm ho”.. (Yor.hilar.n 6- :8): ~Jna to &l or tii.s rntblmc elme? o W1.K to school
If ‘M.tki.r .1..,,.b.ek.d, -d Dor.- 1. so Y..ra old or ov.r. “k: 0 Sm.thlms �Is.
(b) h m ratimd? 0 Y** n no
O Bwwnd.d for selflnt4rrin �A tilt v9m20 for himlf for wwsticua 11-26 & Table. 1, 1 I rr, tiA, iri)tlswhaw. Bitir cairn nhr of rOspxdent in .8th col~. ml. Il.. _ .“ r,,r.end,. t
Y9 uu I.tirutc,i i. ill kin- of 111.*w, *et&r 8erIr.as or not n res D m.
11!1*NJ08aid stay tim LwY BmmmswHS7
(q mtt1=tbeMattel? =4(b) hytkinc elye?
U. last - or tke W before did Ya have w ac.sidrnts or injuries, ettLer at k.!’ w �ny fI’M M? n Yes n no I[a) mat mr9 tbe9?
(b) w thtnc e18e?
for w14 last M or tbe W before did you take w sedi.me or treatmnt o Ye. o NO mndltbn (besldc, ,,. tiicb you tdd me tit)? (a) For &at ccaditi~s?
(b) ~tbtnc else?
15. At INE ~ TIE & you hove w .il.cats cm mdittcms tbst bmvt cza- n Y** c1 NO tinued for . Irnc tkme? (11 .%..) Evta tbawb tbw h, t tether YOU all tAe time?
(1) M9tamthey? (b) ~kAlnc alao?
1S. ~&~L&&~ fmi~ - ?-, Y-r--, eti. - bad w .1 tbue mildlti.x,. MEW ~ n Yes n Ho
[MU Cwd A, CQcdltion by condltlor,; record .ny cone, t,.ns . ..ti.nti la th. .01... ror th. Dem.”)
17. DC.rn wcae i8 h fmily b.ve ~ .f ti.~ mdicfi~.? (Ed -,d B. . ..dltl.n for the Dersol!,.,,tioll.d in the COlum
by o.mditlor!: r.c.rd w ..ndltlo.s o Yes n No
Table I - ILLNESSES, ItlPAl RYENTS AND ACCIDENTS
LAsrlmtDid ~.t did tie dcdor au it If . . l,p.lrm.”t ., .Y.st... .sk, ~t~imd of . . . trmble Yh.t Dut of the b~ mmnrss-Im w’? did he we my M .ffected? usr
did timw MM w tie caIse of (If eye FOES did
. . . ? trouble of ,0, .cwlse (If a-to,mettalk,d to . .“Y kl”d (If kind .1 trouble (If D.,t of bcdy ..” he WI f-a
‘-.. ” 1. ..1. (c)- roc.rd (If C*U. is *l,*WJY .3: :,yeu. .I, e,dy a“ter,d 1“ ,.1. d.ter,lned from ,“trl., :tx:p
& re.uond.nd*..riM (d-t), .1,.1, “X,- .lth- 1“ .01s. (d-1) throu,ht.. i.., ent.red in (d-1) .1,.1. .,,,, “~~ d.t mskl.s the westl.nl (d-4), ,1,.1. “x,,.Itheut Umti X.
k COl. o.,? (11 111-, ft,.ts of .,,1,,, ‘X-, .ithout .sklac the .Skl. t the w,stion) ;t# y :rln.
of *tlm
SCCldmt .1s. 2111 rob]. A, au**tlca)
::8EYW -d “ = . m- Ho. ?0, u Cccld.nt o, Injury * awl g SOY aco.rrlac d.rtr,s put2 [If acclaer!t
A)or 1*J WY. .ardlluly Ch,c 0“,
a ,,,k’, ,,k! fill Table .e.mwer cmiut .itb no v,,
matBut of tbe tcdJ .“ gluaea? FF bmt? Rut kind of imjwy (% + Us it? Mytbt”g elm,
cd.I(Q (b)
D
2.
(C)
Ho
(Also, 1111 T.ble A)
-1 @-2) !
I (d-3, !
I <d-,,
x I (d-$)
x I
,.
<., ,1,
(k),
c1 Y“ x c1 Yes
1 n w
TAtIYJt A (Accidents sad Injnries) L~-& L mat yut et & bady _ ~rt? ~at kid of isJuY m it? AwtbJmc eIse? � .midmt h.w+nti durinl ml. 1 gut 2 ..,ks
,,,,,,., Im,,.n.d 6“,1,, 2. w did Ithm? mritb Year ICBter only tb. ?.mr if Drier to 10$s)
� ~.t 2 .,,hm
3. � sm did tie ucidat h-?
O*m A, hW* (Insld. MJts1d. th. ho”.., � whil. 1. Ar..d s.,vl.e. a mm. oth.r .1..,
4. S- a cu. trmck, bs or otkmr rntar vcbicle WUld in tb* Occltit in my NY? � ,*1 •1 ,0
5. Yw9 w at M* at XUr Job or h!ml..” ditm mm ucidmt ,,,..,..,blw.ed? •1Y*. � !(0 � md.r t,.,m.,,..,0,
42
-----------------
.......
--------------
--
-----------------
----------------
--
......
�EDIcAL CARE
18, (a) MST 661 M ISE ~ BWULS did mwcae in PM fmilf - you Ymr--, etc. - talk n 1- 0:0$ to a doctor or M ti a ckxtmr,m of fia or clinlc? Wwe cise?
It v.,,, (b) lbmmaz tuesdirinr tbe Bamt 2 *rf so. oftlmn
(a) ~credidjau ttik to tbe&ctor7 ~ Ikw.
(d) llovmmy ttns at-- (h, 0111.., CSMQ. �tC. )? At . . . . . . . . . . . . . . . . _
IR...rd total [email protected] of tlm.n for 9.cb tYD. of Place) fit .aftlc . . . . . . . . . . . . . .
HmD1tml elzr.te . . . . . . _
Cw or imd.t”..._.Dmrt.l.r&m@_
mm, (Z?..lb)..,.
10, M@ didzw h“, he?
mIf �0r9 th.n . . . “hit t.1.~how c.lk belt
‘-did’mh”’etiem “’e {:(.. .
SO! If “NW to 9. 18,, “b
S0s 10EE ku ith mtnca ZOl Iuttubed� dxtc.rl —. —m.to n ~,t:!% u NwRr DENIAL CARE
W ~f) #s~, vetkor Om weak ‘bafora did -elm the hmily ~ to � demtimt? _ else? n Y“ 0 E !&&
I (b) ser .W ttm.m &rim a. _ z -., I “.. . . .- 1
XL mmt did you hwa date? If am-, th.m or,. VImlt:
‘Stdidwh”vobem‘*{i!?}““t’
If -we,, to a 21*, “k m.I— —. —~*.U BOWlea’ b“ it k stnce ya -t to m datht? lmmtba,m. Ozw,r I
1
24 1s kbera wan in & fmity ti ku 2ost a22 of kia teak? or. orb I
210SPITAL cAklE Z& (~) 0U2WW 118 PAST &2 2WSINL b“ me ti h fti,~ ~ . ~a~=t ,, ,
In r“ (WI. 11) mmbomitsl Qvermt*t or 2-2? 11 “Y,, -: (b) now ww timu mm Y.M i. th bc.mltas? 2m. of tzllm
m. (m) During Ph. ut 12 wntbs au _ h fsm f_i2J bom � mttd 10 s m2m2u = T“ (?abl. 11) 0 sobmmor S= 1iarium?
If 7.,,, (b) sowSw CIW, “m ~ ~ . “-g ~ ~r ~i~=, Sv. 01 M99
12 i.*icb tb*27. During tbe pastmonths mmoeia tamI.-bofm. r=ily fsn, ecw so. tht 1s, 2w# s, y.mr --,8, etc. ? (no. card H) Znclmk km- frm azl 9X-mdl u U298, U2utea, I’mti rra mtwmfJ, mticas, help f- I’el.tire*.&
Table 1 - ILLNESSES, IMPAIRMENTS Af If 6 yew. 016 Dfid w fi”t mottca . . . IO*O; r- rililtrwm. ;: “tsew saw �ay 0, ova-, “*
�- 0[ PA,” 0on2Ji0 m PAST 3 Wasss
M* IOK
a~s ~wwu
L“t wed or tb,
,* “y.,,. {T)yl.
or b+r.rm tb.t time’p
Did . . . start M)c::.
ftxlsa fsm Pm 12 2ad2ss or beram Pb8t
U* a S21 or W. mst of =’” m. mmly ‘Wk “ !&,&yr -t ::”;:’ ‘i’”’ tmda? ~e *? ~:db~m yyk:: B*~m 0.;1.1 ::my tb.t yy;tion (If durir,’ D,* I
mlking ,ith,ron 12 months, -k: at 1 j.’ ~ f~
~ ~an~~ �o.ttim
(If du,lns $.”t;foyy mid R92’?or kwl- ~mqnz (m - 2wicks. “t): ~ont ,“”,,
!;% 20 -1)? J, 9cAa0f) mltcb meek, l“t .th*r.1.~*xceDt (.)) W or tiefor ... ? “d before?
(6) (h) (1) [J) (k) (1) (.1 (=) (n)
~rcws m y** _ov* nhst nyfg, M.—
W* n NC+, D N. o N:. n W.,k “ rr. — . . . =Wfo,. oBir:h
I Table 11 - IIOSPITAL2ZATION OUIINE PAST 12 MONTHS
I 1 I
(i) I (1) I Y. e Ma
. . I
(II) For what..nditt.n? (b) 1, II .s.d all th. M., mostC4th. tlm., only occosl.nolly, ., . . . . . .s.d .OW?
1[ mOC...llySllys ot .Nc,q u,ed now,. .,k:
(c) Why la It thatyou ..”., US. tit?
w
Why IS i+thaty.. .s. lt ..ly . . .. SI...IIY7
I I
I I question .?4 cake” from Fixm NHS. Z.
43
:ard A Card C :ard E ;ard 6
NAT I OHAL HEALTH SURVEY HATIOMAL HEALTH SURVEY )IATI OHAL HEALTH SURVEY NATIONAL HEALTH SURVEY
Check List of Chronic Conditions For: For:
Workerx and other prmm except Children from 6 to 16 yom’e old �nd
Hbumwiveff and Ch I Idrm others going to school
1. Asthma 16. Kidney stones or other
2. Any allergy kidney trouble 1. Cannot work at al 1 at present. 1. Cannot go to school at all at t. Confined to the house all the 9. Tuberculosis 17. Arthritis or rheumat ism present time. time, except in energenc ies. Il.Chronic bronchitis Prostate trouble 2. Can work but limited in amount 5. Repeated attacks of sinus trouble 19. Diabetes or kind of work. 6. Rheumatic fever 20. Thyroid trouble or 2. Can go to school but 1 imited to 2. Can go outside but need the help
7. Hardening of the arteries goiter 3. Can work but limited in kind or certain types of schools or in of another person in getting
around outs ide.a. High blood pressure 21. Epilepsy or convulsions amount of outside activities. school attendance.
9. Heart trouble of any kind
0. Stroke 22. Mental or nervous 4. Hot 1 imited in any of these ways. 3. Can go to school bvt limited in $. Can go outside alone but have 1. Trouble with varicose veins trouble other activities. trouble in getting around freely.
2. Hemorrhoids or piles 23. Repeated trouble with
3. Gallbladder or liver trouble back or spine 4. NOt 1 imited in any of these ways. u. Not 1 imited in any of these ways. 8. Stomach ulcer 24. Tumor or cancer
5. Any other chronic 25. Chronic skin trouble
stomach $rouble .26. Hernia or rupture
Card B Card D Card F Wd H
MAT IOIIAL HEALTH SURVEY ll&TIOllAL HEALTH SURVEY liATIOtiAL HEALTH SURVEY NATIONAL HEALTH SURVEY
Check List of Imai ruente For: Housewife For: Chi Idrod under 6 years old FemilY Inc- during past
12 �onths
1. Deafness or serious trouble with hearing. 1.. Cannot keep house at all at 1. Cannot take part atal 1 in ord inar: 1, under s5D0 (Including loss) present. play with other children.
2. Serious trouble with seeing, even with glasses. 2. S500 - $999
2. Can keep house but 1 imited in 2. Can play with other children but3. Condition present since birth, such as cleft palate or amount or kind of housework. limited in amount or kind of plaY, 3, Sl, ooo - SI.999
club foot.
8. Stammering or other trouble with speech. 3. Can keep house but 1 imited in it. Hot 1 imited in any of these ways. u..$2.000 - S2.999
outside activities. 5. Hissing fingers, hand, or arm. 5. S30000 - S3,999
6. Hissing toes, foot, or leg. 4. Hot 1 imited in any of these ways. 6. S4,000 - S8,999
7. Cerebral palsy. 7. s5.000 - S6.999
8. Paralysis of any kind.
8. S7,000 - S9,9999. Any permanent stiffness or deformity of the foor or 1.$9,
fingers, arm, or back. 9. SIO, OOO and over.
REPORTS FROM THE NATIONAL CENTER FOR HEALTH STATISTICS Public Health Service Publication No. 1000
Series 1. Pronams and collection rm’ocedures So. 1. Origin, Program, and Operation of the U.S. N-ational Health Survey. 35 cents.
so. 2. Health Survey Procedure: Concepts, Questionnaire Development, and Definitions in the Health Interview Survey. -!5 cents. SO. 3. Development and h!aintenance of a National Inventmy of Hospitals and Institutions.
Series 2. Data evaluation and methods research
So. 1. Comparison of Two-Vision Testing Devices. 30 cents.No. 2. Measurement of Personal Health Expenditures. 45 cents.so. 3. The One-Hour Glucose Tolerance Test. 30 cents.So, 4. Comparison of Two Methods of Constructing .$bridged Life Tables. 15 cents.
Series 3. .%nalytical studies so. 1. The Change in Mortality Trend in the United States. 35 cents. so. 2. Recent Mortality Trends in Chile. 30 cents.
Series 4. Documents and committee reports
No reports tm date.
Series 10. Data From the Health Interview Survey
Xo. 1. Acute Conditions, Incidence and .Aseociated Disability, United States, July 1961-June 1962. 40 cents.so. 2. Family Income in Relation to Selected Health Characteristics, Unit.ad States. 40 cents.No. 3. Length of Convalescence After Surgery, United States, July 1960-June 1961. 35 cents.No. 4. Disability Days, United States, July 1961-June 1962, 40 cents.No. 5. Current Estimates From the Health Interview Survey, United States, July 1962-June 1963. 35 cents.No. 6. Impairments Due to Injury, by Class and Type of Accident, United States, July 1959-June 1961. 25 cents.No. 7. Disability Among persons in the Labor Force, by Employment Status, United States, July 1961-June 1962. 40 cents.h-0. 8. Types of Injuries, Incidence and Associated Disability, United States, July 1957-June 1961. 35 cents.No. 9. Medical Care, Health Status, and Family Income, United States. 55 cents.No. 10. Acute Conditions, Incidence and Associated Disability, United States, July 1962.June 1963. 45 cents.No. 11. Health Insurance Coverage, United States, July 1962-June 1963. 35 cents.No. 12. Bed Disability Among the Chronically Limited, United States, July 1957-June 1961. 45 cents.No. 13. Current Estimates From the Health Interview Survey, United States, JUIV 1963-June 1964.40 cents.
so. 14. Illness, Disability. and Hospitalization Among Veterans, United States; July 1957-June 1961.
Series 11. Data From the Health Examination Survey
No. 1. Cycle I of the Health Examination Survey: Sample and Response, United States, 1960-1962. 30 cents.No. 2. Glucose Tolerance of Adults, United States, 1960-1962. 25 cents.No. 3. Binocular Visual Acuity of Adults, United States, 1960-1962. 25 cents.No. 4. Blind Pressure of Adults, by Age and Sex, United States, 1960-1962. 35 cents.No. 5. Blood Pressure of Adults, by Race and Region, United States, 1960-1962. 25 cent-s.No. 6. Heart Disease in Adults, United States, 1960-1962. 35 cents.No. 7. Selected Dental Findings in Adults, Unitsd States, 1960-1962.
Series 12. Data From the Health Records Survey
No reports to date.
Series 20. Data on mortality No reports to date.
Series 21. Data on natalit~
No. 1. Natality Statistics Analysis, United States, 1962. 45 cents.
Series 22. Data on marriage and divorce
No reports to date.
Series 23. Data fmm the program of sample surveys related to vital records
No reports to date.