Embed Size (px)
Citation preview
Series 21No. 54
Prenatal Care in theUnited States, 1980–94
July 1996
Vital andHealth StatisticsFrom the CENTERS FOR DISEASE CONTROL AND PREVENTION /National Center for Health Statistics
U.S. DEPARTMENT OF HEALTH AND HUMAN SERVICESPublic Health Service
Centers for Disease Control and PreventionNational Center for Health Statistics

Copyright information
All material appearing in this report is in the public domain and may bereproduced or copied without permission; citation as to source, however, isappreciated.
Suggested citation
Lewis CT, Mathews TJ, Heuser RL. Prenatal care in the United States,1980–94. National Center for Health Statistics. Vital Health Stat 21(54). 1996.
Library of Congress Cataloging-in-Publication Data
Prenatal care in the United States, 1980–94.p. cm. — (Vital and health statistics. Series 21, Data from the national vital
statistics system ; no. 54) (DHHS publication ; no. (PHS) 96-1932)Includes bibliographical references.ISBN 0-8406-0518-81. Prenatal care—United States. 2. Prenatal care—United States—Statistics.
I. National Center for Health Statistics (U.S.) II. Series. III. Series: DHHSpublication ; no. (PHS) 96-1932.HA211.A3 no. 54[RG960]304.6'3'097302' s—dc20 96-9472[362.1'9824’0973] CIP
For sale by the U.S. Government Printing OfficeSuperintendent of DocumentsMail Stop: SSOPWashington, DC 20402-9328
Prenatal Care in theUnited States, 1980–94
Series 21Data on Natality, Marriage, andDivorceNo. 54
Hyattsville, MarylandJuly 1996DHHS Publication No. (PHS) 96-1932
Vital andHealth Statistics
U.S. DEPARTMENT OF HEALTH AND HUMAN SERVICESPublic Health ServiceCenters for Disease Control and PreventionNational Center for Health Statistics

National Center for Health StatisticsEdward J. Sondik, Ph.D.,Director
Jack R. Anderson,Deputy Director
Jacob J. Feldman, Ph.D.,Associate Director for Analysis,Epidemiology, and Health Promotion
Gail F. Fisher, Ph.D.,Associate Director for Planning andExtramural Programs
Jack R. Anderson,Acting Associate Director forInternational Statistics
Stephen E. Nieberding,Associate Director forManagement
Charles J. Rothwell,Associate Director for DataProcessing and Services
Monroe G. Sirken, Ph.D.,Associate Director for Researchand Methodology
Division of Vital Statistics
Mary Anne Freedman,Director
James A. Weed, Ph.D.,Deputy Director
Robert L. Heuser,Chief, Natality, Marriage and DivorceStatistics Branch
Nicholas F. Pace,Acting Chief, Systems and ProgrammingBranch
Robert Armstrong,Acting Chief, Statistical ResourcesBranch
f94.cer,er.an
hicrnomS).
erst
anofcen
reer-rsial,tesntanse
ot0.ereatalhond-notther
Abstract
Objectives. This report examines trends in timing oprenatal care in the United States from 1980 to 19Demographic characteristics examined include age, raHispanic origin, marital status, place of birth of motheeducational attainment of mother, and live-birth ordSocial characteristics discussed include barriers to carepregnancy wantedness.
Methods. The source of data for trends and demograpanalyses is the certificate of live birth filed for each child boin the United States. Data for social characteristics are frthe 1988 National Maternal and Infant Health Survey (NMIHData from the NMIHS are based on 9,953 responses.
Results. Very few groups of women have yet to achievthe goal of 90 percent initiating prenatal care in the fitrimester as set byHealthy People 2000. In 1994, 80 percentof all mothers initiated care in the first trimester. Cubmothers were the only mothers to reach the objective90 percent with Japanese mothers close behind at 89 per
,
d
t.
Mothers with the lowest percent initiating early prenatal cawere non-Hispanic black (68 percent), Puerto Rican (67 pcent), and American Indian mothers (65 percent). Mothewho have problems getting prenatal care due to financscheduling, transportation, or other problems have lower raof initiating early care. Mothers who wanted to be pregnawhen they did were more inclined to initiate early care thmothers who did not want to become pregnant or whopregnancies were mistimed.
Conclusions. Prenatal care use in the United States did nimprove in the 1980’s but has been improving since 199Variations in use by demographic characteristics persist. Thare wide gaps between mothers with easier access to prencare and those who encounter barriers to care. Mothers wwant to become pregnant also tend to seek help in understaing their pregnancy and its risks earlier than those who didintend to get pregnant or cared to become pregnant at anotime.
iii
Contents
Abstract. . . . . . . . . . . . . . . . . . . . . . . . . . . . . . . . . . . . . . . . . . . . . . . . . . . . . . . . . . . . . . . . . . . . . . . . . . . . . . . . . . . . . . . . . . . . . . . iii
Introduction . . . . . . . . . . . . . . . . . . . . . . . . . . . . . . . . . . . . . . . . . . . . . . . . . . . . . . . . . . . . . . . . . . . . . . . . . . . . . . . . . . . . . . . . . . . 1Background. . . . . . . . . . . . . . . . . . . . . . . . . . . . . . . . . . . . . . . . . . . . . . . . . . . . . . . . . . . . . . . . . . . . . . . . . . . . . . . . . . . . . . . . . 1Sources of data. . . . . . . . . . . . . . . . . . . . . . . . . . . . . . . . . . . . . . . . . . . . . . . . . . . . . . . . . . . . . . . . . . . . . . . . . . . . . . . . . . . . . . 2
Demographic characteristcs. . . . . . . . . . . . . . . . . . . . . . . . . . . . . . . . . . . . . . . . . . . . . . . . . . . . . . . . . . . . . . . . . . . . . . . . . . . . . . . 3Race of mother. . . . . . . . . . . . . . . . . . . . . . . . . . . . . . . . . . . . . . . . . . . . . . . . . . . . . . . . . . . . . . . . . . . . . . . . . . . . . . . . . . . . . . 3Hispanic origin of mother . . . . . . . . . . . . . . . . . . . . . . . . . . . . . . . . . . . . . . . . . . . . . . . . . . . . . . . . . . . . . . . . . . . . . . . . . . . . . 3Place of birth of mother. . . . . . . . . . . . . . . . . . . . . . . . . . . . . . . . . . . . . . . . . . . . . . . . . . . . . . . . . . . . . . . . . . . . . . . . . . . . . . . 3Age of mother. . . . . . . . . . . . . . . . . . . . . . . . . . . . . . . . . . . . . . . . . . . . . . . . . . . . . . . . . . . . . . . . . . . . . . . . . . . . . . . . . . . . . . . 3Live-birth order. . . . . . . . . . . . . . . . . . . . . . . . . . . . . . . . . . . . . . . . . . . . . . . . . . . . . . . . . . . . . . . . . . . . . . . . . . . . . . . . . . . . . . 3Educational attainment of mother. . . . . . . . . . . . . . . . . . . . . . . . . . . . . . . . . . . . . . . . . . . . . . . . . . . . . . . . . . . . . . . . . . . . . . . 4Marital status of mother. . . . . . . . . . . . . . . . . . . . . . . . . . . . . . . . . . . . . . . . . . . . . . . . . . . . . . . . . . . . . . . . . . . . . . . . . . . . . . . 4
Social characteristics. . . . . . . . . . . . . . . . . . . . . . . . . . . . . . . . . . . . . . . . . . . . . . . . . . . . . . . . . . . . . . . . . . . . . . . . . . . . . . . . . . . . 5Barriers to care. . . . . . . . . . . . . . . . . . . . . . . . . . . . . . . . . . . . . . . . . . . . . . . . . . . . . . . . . . . . . . . . . . . . . . . . . . . . . . . . . . . . . . 5Wantedness status. . . . . . . . . . . . . . . . . . . . . . . . . . . . . . . . . . . . . . . . . . . . . . . . . . . . . . . . . . . . . . . . . . . . . . . . . . . . . . . . . . . . 5
Summary . . . . . . . . . . . . . . . . . . . . . . . . . . . . . . . . . . . . . . . . . . . . . . . . . . . . . . . . . . . . . . . . . . . . . . . . . . . . . . . . . . . . . . . . . . . . . 6
References. . . . . . . . . . . . . . . . . . . . . . . . . . . . . . . . . . . . . . . . . . . . . . . . . . . . . . . . . . . . . . . . . . . . . . . . . . . . . . . . . . . . . . . . . . . . 7
List of detailed tables. . . . . . . . . . . . . . . . . . . . . . . . . . . . . . . . . . . . . . . . . . . . . . . . . . . . . . . . . . . . . . . . . . . . . . . . . . . . . . . . . . . . 8
Appendix
Technical notes. . . . . . . . . . . . . . . . . . . . . . . . . . . . . . . . . . . . . . . . . . . . . . . . . . . . . . . . . . . . . . . . . . . . . . . . . . . . . . . . . . . . . . . . . 17Computation of percents. . . . . . . . . . . . . . . . . . . . . . . . . . . . . . . . . . . . . . . . . . . . . . . . . . . . . . . . . . . . . . . . . . . . . . . . . . . . . . 17Accuracy of reporting. . . . . . . . . . . . . . . . . . . . . . . . . . . . . . . . . . . . . . . . . . . . . . . . . . . . . . . . . . . . . . . . . . . . . . . . . . . . . . . . . 17Tests of significance for the National Maternal and Infant Health Survey (NMIHS). . . . . . . . . . . . . . . . . . . . . . . . . . . . . . . 17
Figures
1. Percent of live births where mothers received early prenatal care by race: Reporting States, 1970–78 andUnited States, 1979–94. . . . . . . . . . . . . . . . . . . . . . . . . . . . . . . . . . . . . . . . . . . . . . . . . . . . . . . . . . . . . . . . . . . . . . . . . . . . . . 1
2. Percent of live births where mothers received early prenatal care, by age and race of mother: United States, 1994. . . . 43. Percent of live births where mothers received early prenatal care, by live-birth order and race of mother:
United States, 1994. . . . . . . . . . . . . . . . . . . . . . . . . . . . . . . . . . . . . . . . . . . . . . . . . . . . . . . . . . . . . . . . . . . . . . . . . . . . . . . . . 44. Percent of live births where mothers received late or no prenatal care, by educational attainment and race of mother:
United States, 1994. . . . . . . . . . . . . . . . . . . . . . . . . . . . . . . . . . . . . . . . . . . . . . . . . . . . . . . . . . . . . . . . . . . . . . . . . . . . . . . . . 4
Keywords: Prenatal carev Birth certificatev National Maternal and Infant Health Surveyv Year 2000 Health Objectives
v
ooo
ie
2)ityahahnothnboceanfe
rsanded.o-naleare
resed
ute in
por-orentt in
ingisssatth,tusinttleto.ftherob-arehebenot
hethesisedticalitedons
NOTE: For 1970-79 data are by race of child and for 1980-94 by race ofmother.
1970 1975 1980 1985 1990
Year
10
100
Per
cent
White
Black
All races
90807060
50
40
30
20
Figure 1. Percent of live births where mothers received earlyprenatal care by race: Reporting States, 1970–78 and UnitedStates 1979–94
Prenatal Care in the UnitedStates, 1980–94by Caroline T. Lewis, Bureau of Health Professions,Health Resources and Service Administration; T. J.Mathews, and Robert L. Heuser, Division of VitalStatistics
Introduction
Background
During the 1980’s and early 1990’s at least three outevery four infants in this country were born to women whbegan prenatal care in the first trimester. A minimum4 percent were born to women who began care as late asthird trimester or who received no care at all. Other studhave found that early prenatal care is associated withdecreased risk of low birthweight and preterm delivery (1,birth outcomes that are major predictors of infant morbidand mortality (3,4,5). Improvement in the timing of prenatcare is considered so crucial to our Nation’s health that itbeen included in the Year 2000 Health Objectives for tNation (6). Early care is critical to the health of the mother achild because it allows for early detection and treatmentexisting medical and obstetric conditions. It also providesopportunity for encouraging healthy behaviors and prevedisease by educating women early in their pregnancies aproper nutrition, adequate weight gain, safe sexual practidangers of smoking, alcohol, and drugs, environmentaloccupational hazards, and other factors that might afpregnancy outcome (7).
In this report national trends in the proportions of mothereceiving early care and late or no care between 19801994, as reported on live-birth certificates, are examinDifferential timing of prenatal care for various sociodemgraphic subgroups are reviewed. Data from the 1988 NatioMaternal and Infant Health Survey (NMIHS) show how somfactors beyond those available on the birth certificaterelated to initiation of prenatal care.
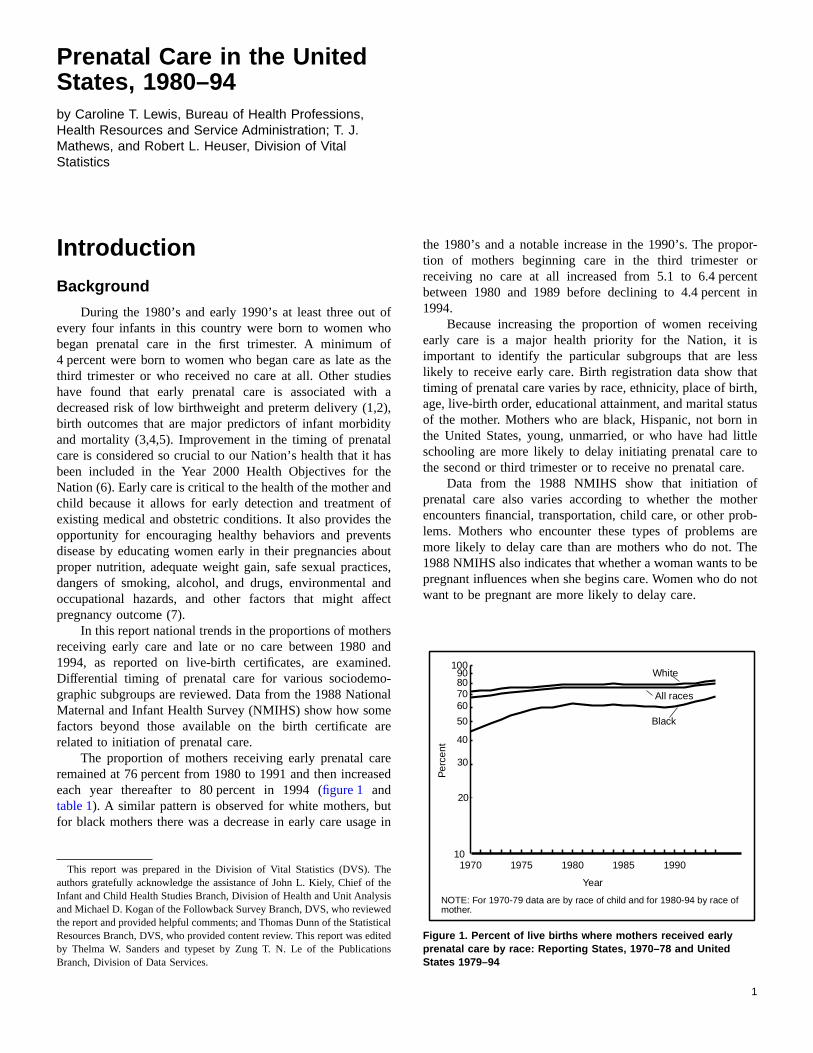
The proportion of mothers receiving early prenatal caremained at 76 percent from 1980 to 1991 and then increaeach year thereafter to 80 percent in 1994 (figure 1 andtable 1). A similar pattern is observed for white mothers, bfor black mothers there was a decrease in early care usag
This report was prepared in the Division of Vital Statistics (DVS). Tauthors gratefully acknowledge the assistance of John L. Kiely, Chief ofInfant and Child Health Studies Branch, Division of Health and Unit Analyand Michael D. Kogan of the Followback Survey Branch, DVS, who reviewthe report and provided helpful comments; and Thomas Dunn of the StatisResources Branch, DVS, who provided content review. This report was edby Thelma W. Sanders and typeset by Zung T. N. Le of the PublicatiBranch, Division of Data Services.
f
fthesa,
lsedfetsuts,dct
the 1980’s and a notable increase in the 1990’s. The protion of mothers beginning care in the third trimesterreceiving no care at all increased from 5.1 to 6.4 percbetween 1980 and 1989 before declining to 4.4 percen1994.
Because increasing the proportion of women receivearly care is a major health priority for the Nation, itimportant to identify the particular subgroups that are lelikely to receive early care. Birth registration data show thtiming of prenatal care varies by race, ethnicity, place of birage, live-birth order, educational attainment, and marital staof the mother. Mothers who are black, Hispanic, not bornthe United States, young, unmarried, or who have had lischooling are more likely to delay initiating prenatal carethe second or third trimester or to receive no prenatal care
Data from the 1988 NMIHS show that initiation oprenatal care also varies according to whether the moencounters financial, transportation, child care, or other prlems. Mothers who encounter these types of problemsmore likely to delay care than are mothers who do not. T1988 NMIHS also indicates that whether a woman wants topregnant influences when she begins care. Women who dowant to be pregnant are more likely to delay care.
1

tooeae
ehe
froe
ds,s.entnnd
rlth,Son-rme
Because the quality or content of prenatal care givenpregnant women cannot be evaluated from the informationthe birth certificate, the measure used in this report is thtiming of the first prenatal visit. Timing of care is used asproxy measure for adequacy of care because it indicates whcare began and suggests the duration of that care.
In this report ‘‘early care’’ is defined as care initiated inthe first trimester, ‘‘delayed care’’ refers to care begun in thsecond trimester, and ‘‘late care’’ refers to care started in tthird trimester.
Sources of data
Data shown intables 1–7for 1994 are based on 100 per-cent of the birth certificates in all States and the District oColumbia except where otherwise noted. The data are pvided to the National Center for Health Statistics through th
2
n
n
-
Vital Statistics Cooperative Program (VSCP). In 1984 anearlier years, the VSCP included a varying number of Statewhich provided data on 100 percent of their birth certificateData for States not in the VSCP were based on a 50-percsample of birth certificates filed in those States. Informatioon sampling procedures and sampling errors for 1984 aearlier years is provided in the annual reportVital Statistics ofthe United States, Volume I, Natality.
Data shown intables 8–12for 1988 are based on theNMIHS, which was conducted by the National Center foHealth Statistics to examine factors concerning maternal heapregnancy outcome, and infant health. Data from the NMIHare based on 9,953 responses. The NMIHS was made natially representative by the calculation of a sample weight foeach record that accounts for the survey’s sampling scheand for survey nonresponse.
0analyw
fca. Iirefo
tathtataltile
annth94iveitupcea
ndicaibae
eher
ataete4,ndinofash
ndsed.esckisidernm-diet
toastrentatalge,es-kinnsirmeersre
ote
Demographic characteristics
Race of mother
The Public Health Service included among the year 20infant health objectives a goal that 90 percent of pregnwomen in each racial and ethnic group receive prenatal cwithin the first trimester of pregnancy (6). In 1994 onJapanese mothers came close to achieving this goal89 percent receiving prenatal care in the first trimester (table 2).Other Asian and Pacific Islander subgroups had a range oto 86 percent, compared with 65 and 68 percent for AmeriIndian and black mothers and 83 percent for white mothers1994 the proportion of women who delayed care until the thtrimester or who received no care ranged from 2 to 5 percfor Asian and white mothers compared with 8 to 10 percentblack and American Indian mothers.
Hispanic origin of mother
Sixty-nine percent of Hispanic mothers began prenacare in the first trimester of pregnancy in 1994, nearlysame level as that for non-Hispanic black mothers but substially below that for non-Hispanic white mothers (87 percen(table 3). Cuban mothers achieved the year 2000 infant hegoal of 90 percent starting care in the first trimester whother Hispanic groups were much lower (67–72 percent).
Hispanic mothers are generally much more likely thnon-Hispanic white mothers to get care late or to receivecare at all. However, Hispanic and non-Hispanic black moers have similar proportions receiving late or no care. In 198 percent of Hispanic and non-Hispanic black mothers recelate or no care compared with 3 percent of non-Hispanic whmothers. The proportions for specified Hispanic subgrovaried between 2 percent for Cuban mothers and 7–8 perfor Mexican, Puerto Rican, and Central and South Americmothers.
Such differences among these Hispanic subgroups icate that the problem with timing of care among Hispanwomen is probably due to factors such as educational attment and income. For example, in 1994, 85 percent of Cumothers completed high school compared with only 41 pcent of Mexican mothers (8).
Place of birth of mother
Timing of care also varies by the place of birth of thmother. In 1994, 85 percent of white mothers born in tUnited States began care in the first trimester as compa
0tre
ith
76nndntr
len-)h
o-,desntn
i-
n-nr-
ed
with 71 percent of those born outside the United States (dnot shown). This sizable differential is due to the largproportion of births to Mexican-born mothers among whimothers who were not born in the United States. In 19954 percent of these births were to Mexican-born mothers aonly 64 percent of the mothers born in Mexico began carethe first trimester of pregnancy. These differences in timingprenatal care may be due, at least in part, to factors suchlanguage barriers or lack of familiarity with available healtcare systems and social services (9).
In contrast, the differential in receipt of early care betweeblack mothers who were and were not born in the UniteStates was not as great and the relationship was reverSixty-eight percent of black mothers born in the United Statreceived early care as compared with 72 percent of blamothers who were not born in the United States. Thisconsistent with other reports that black mothers born outsthe United States are relatively better off than their U.S.-bocounterparts in terms of income, years of schooling copleted, health status, and lifestyle characteristics such asand alcohol and tobacco use (10) .
Age of mother
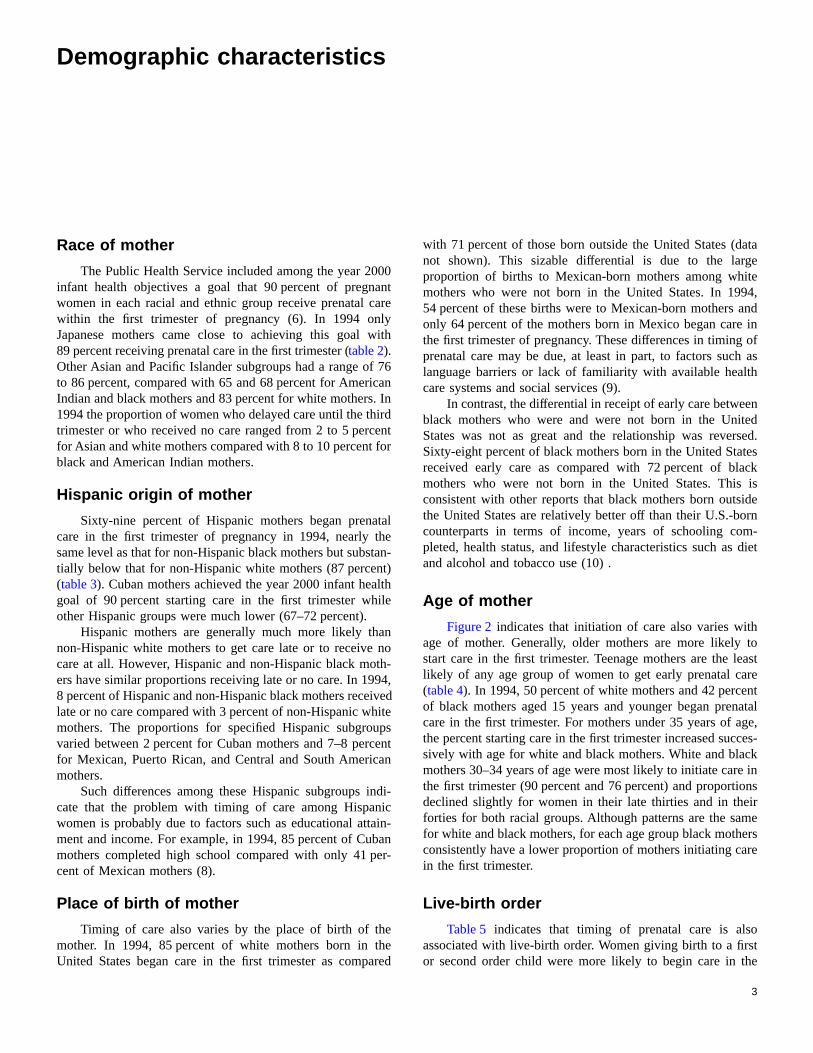
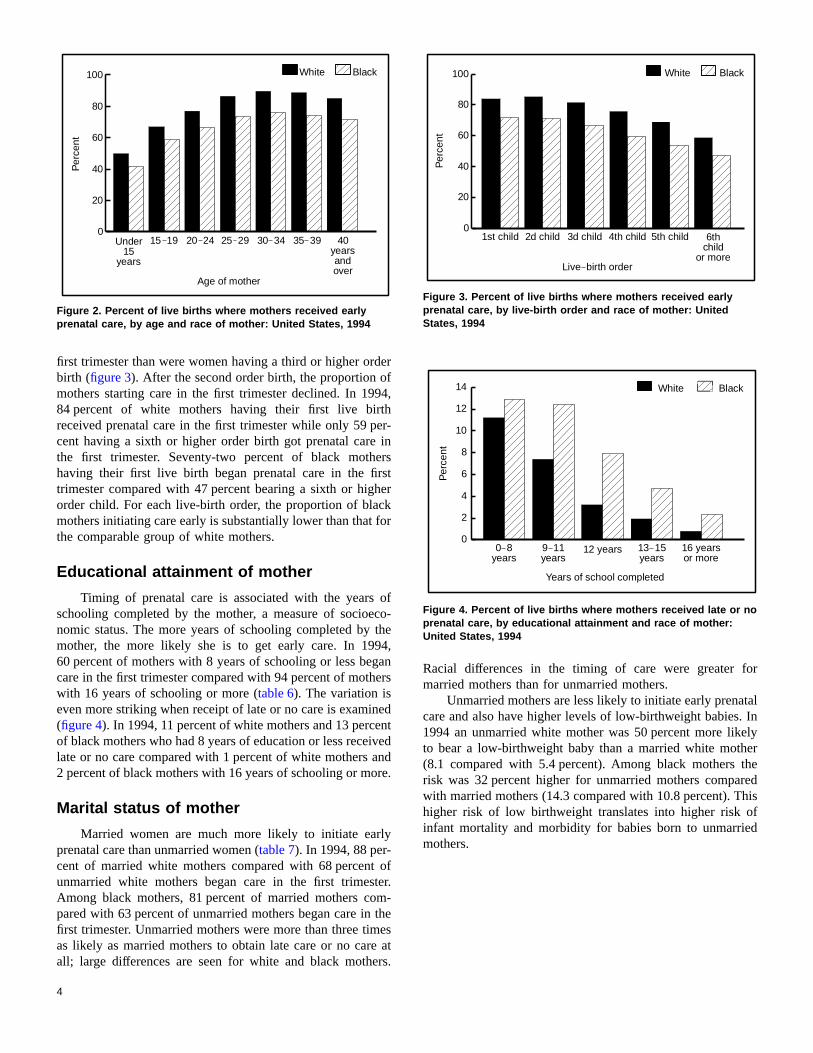
Figure 2indicates that initiation of care also varies withage of mother. Generally, older mothers are more likelystart care in the first trimester. Teenage mothers are the lelikely of any age group of women to get early prenatal ca(table 4). In 1994, 50 percent of white mothers and 42 perceof black mothers aged 15 years and younger began prencare in the first trimester. For mothers under 35 years of athe percent starting care in the first trimester increased succsively with age for white and black mothers. White and blacmothers 30–34 years of age were most likely to initiate carethe first trimester (90 percent and 76 percent) and proportiodeclined slightly for women in their late thirties and in theforties for both racial groups. Although patterns are the safor white and black mothers, for each age group black mothconsistently have a lower proportion of mothers initiating cain the first trimester.
Live-birth order
Table 5 indicates that timing of prenatal care is alsassociated with live-birth order. Women giving birth to a firsor second order child were more likely to begin care in th
3
erf94,ther-in
ersrstherckfor
ofco-the4,gaer
edeniveanre
ly
ofter.m-thees
e atrs.
for
tal. Inelyertheredhisofd
Under15
years
15 19 20 24 25 29 30 34 35 39 40yearsandover
Age of mother
0
20
40
60
80
100P
erce
ntWhite Black
Figure 2. Percent of live births where mothers received earlyprenatal care, by age and race of mother: United States, 1994
1st child 2d child 3d child 4th child 5th child 6thchild
or moreLive birth order
0
20
40
60
80
100
Per
cent
White Black
Figure 3. Percent of live births where mothers received earlyprenatal care, by live-birth order and race of mother: UnitedStates, 1994
0 8years
9 11years
12 years 13 15years
16 yearsor more
Years of school completed
0
2
4
6
8
10
12
14
Per
cent
White Black
Figure 4. Percent of live births where mothers received late or noprenatal care, by educational attainment and race of mother:United States, 1994
first trimester than were women having a third or higher ordbirth (figure 3). After the second order birth, the proportion omothers starting care in the first trimester declined. In 1984 percent of white mothers having their first live birreceived prenatal care in the first trimester while only 59 pcent having a sixth or higher order birth got prenatal carethe first trimester. Seventy-two percent of black mothhaving their first live birth began prenatal care in the fitrimester compared with 47 percent bearing a sixth or higorder child. For each live-birth order, the proportion of blamothers initiating care early is substantially lower than thatthe comparable group of white mothers.
Educational attainment of mother
Timing of prenatal care is associated with the yearsschooling completed by the mother, a measure of socioenomic status. The more years of schooling completed bymother, the more likely she is to get early care. In 19960 percent of mothers with 8 years of schooling or less becare in the first trimester compared with 94 percent of mothwith 16 years of schooling or more (table 6). The variation iseven more striking when receipt of late or no care is examin(figure 4). In 1994, 11 percent of white mothers and 13 percof black mothers who had 8 years of education or less recelate or no care compared with 1 percent of white mothers2 percent of black mothers with 16 years of schooling or mo
Marital status of mother
Married women are much more likely to initiate earprenatal care than unmarried women (table 7). In 1994, 88 per-cent of married white mothers compared with 68 percentunmarried white mothers began care in the first trimesAmong black mothers, 81 percent of married mothers copared with 63 percent of unmarried mothers began care infirst trimester. Unmarried mothers were more than three timas likely as married mothers to obtain late care or no carall; large differences are seen for white and black mothe
4
ns
tdd.
Racial differences in the timing of care were greatermarried mothers than for unmarried mothers.
Unmarried mothers are less likely to initiate early prenacare and also have higher levels of low-birthweight babies1994 an unmarried white mother was 50 percent more likto bear a low-birthweight baby than a married white moth(8.1 compared with 5.4 percent). Among black mothersrisk was 32 percent higher for unmarried mothers compawith married mothers (14.3 compared with 10.8 percent). Thigher risk of low birthweight translates into higher riskinfant mortality and morbidity for babies born to unmarriemothers.
tebdteiergenaheofof
edncithltht oarerere88mssteterhehitithl o
nce15rstet othonaltnrlyper-por-er’’er-nt
ersare,alinossrsr-per-oreatal
ith
herere
dthehoeg-e
rlyornoedfor
othersanersries
Social characteristics
Barriers to care
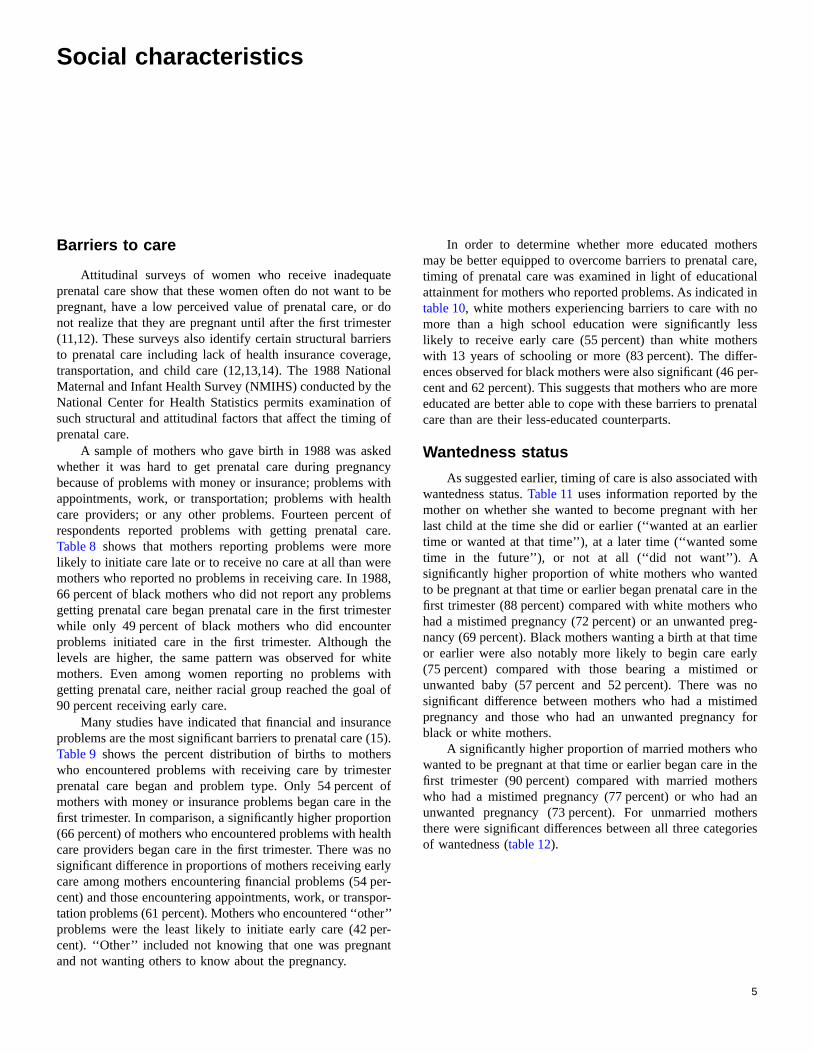
Attitudinal surveys of women who receive inadequaprenatal care show that these women often do not want topregnant, have a low perceived value of prenatal care, ornot realize that they are pregnant until after the first trimes(11,12). These surveys also identify certain structural barrto prenatal care including lack of health insurance coveratransportation, and child care (12,13,14). The 1988 NatioMaternal and Infant Health Survey (NMIHS) conducted by tNational Center for Health Statistics permits examinationsuch structural and attitudinal factors that affect the timingprenatal care.
A sample of mothers who gave birth in 1988 was askwhether it was hard to get prenatal care during pregnabecause of problems with money or insurance; problems wappointments, work, or transportation; problems with heacare providers; or any other problems. Fourteen percenrespondents reported problems with getting prenatal cTable 8 shows that mothers reporting problems were molikely to initiate care late or to receive no care at all than wemothers who reported no problems in receiving care. In 1966 percent of black mothers who did not report any problegetting prenatal care began prenatal care in the first trimewhile only 49 percent of black mothers who did encounproblems initiated care in the first trimester. Although tlevels are higher, the same pattern was observed for wmothers. Even among women reporting no problems wgetting prenatal care, neither racial group reached the goa90 percent receiving early care.
Many studies have indicated that financial and insuraproblems are the most significant barriers to prenatal care (Table 9 shows the percent distribution of births to mothewho encountered problems with receiving care by trimesprenatal care began and problem type. Only 54 percenmothers with money or insurance problems began care infirst trimester. In comparison, a significantly higher proporti(66 percent) of mothers who encountered problems with hecare providers began care in the first trimester. There wassignificant difference in proportions of mothers receiving eacare among mothers encountering financial problems (54cent) and those encountering appointments, work, or transtation problems (61 percent). Mothers who encountered ‘‘othproblems were the least likely to initiate early care (42 pcent). ‘‘Other’’ included not knowing that one was pregnaand not wanting others to know about the pregnancy.
eors,l
y
f.
,
r
e
f
).
rfe
ho
In order to determine whether more educated mothmay be better equipped to overcome barriers to prenatal ctiming of prenatal care was examined in light of educationattainment for mothers who reported problems. As indicatedtable 10, white mothers experiencing barriers to care with nmore than a high school education were significantly lelikely to receive early care (55 percent) than white mothewith 13 years of schooling or more (83 percent). The diffeences observed for black mothers were also significant (46cent and 62 percent). This suggests that mothers who are meducated are better able to cope with these barriers to prencare than are their less-educated counterparts.
Wantedness status
As suggested earlier, timing of care is also associated wwantedness status.Table 11uses information reported by themother on whether she wanted to become pregnant withlast child at the time she did or earlier (‘‘wanted at an earlitime or wanted at that time’’), at a later time (‘‘wanted somtime in the future’’), or not at all (‘‘did not want’’). Asignificantly higher proportion of white mothers who wanteto be pregnant at that time or earlier began prenatal care infirst trimester (88 percent) compared with white mothers whad a mistimed pregnancy (72 percent) or an unwanted prnancy (69 percent). Black mothers wanting a birth at that timor earlier were also notably more likely to begin care ea(75 percent) compared with those bearing a mistimedunwanted baby (57 percent and 52 percent). There wassignificant difference between mothers who had a mistimpregnancy and those who had an unwanted pregnancyblack or white mothers.
A significantly higher proportion of married mothers whwanted to be pregnant at that time or earlier began care infirst trimester (90 percent) compared with married mothewho had a mistimed pregnancy (77 percent) or who hadunwanted pregnancy (73 percent). For unmarried moththere were significant differences between all three categoof wantedness (table 12).
5
talanavreoonthrealtondietcoz-
inntssehiteherstheherstirthillby
Summary
Mothers who are the least likely to obtain early prenacare (that is, women who are black, Puerto Rican, AmericIndian, teenaged, poorly educated, unmarried, or who hproblems with money, insurance, transportation, or child caare also the ones whose infants have higher levels of poutcomes. Early prenatal care is essential for these womeincreased medical and social risk because it providesopportunity for interventions and education necessary to pvent or reduce the risks. Prenatal care visits give the hecare provider the opportunity to counsel expectant mothersthe benefits of proper nutrition, adequate weight gain, abreastfeeding as well as the negative effects of stress, anxdepression, extreme physical work and exercise, tobacalcohol, illicit drug use, and exposure to environmental haards (7).
6
e)rate-hn
y,,
The steady improvements in timing of care achievedthe 1970’s did not continue in the 1980’s but improvemehave occurred in the early 1990’s. Black mothers, whooverall prenatal care usage comes much later than wmothers, experienced decreases in the proportions of motreceiving early care in the 1980’s and improvements in1990’s. The proportion of mothers who initiated care in tfirst trimester is now at its highest point since 1969, the fiyear that prenatal care data were collected on the bcertificate. Continued improvements in the overall rate wdepend primarily upon the progress in obtaining early carethe high-risk groups discussed in this report.
References
1. Institute of Medicine. Preventing low birth weight. Washington:National Academy Press. 1985.
2. Singh S, Torres A, and Forrest JD. The need for prenatal care inthe United States: Evidence from the 1980 National NatalitySurvey. Family Planning Perspectives 17(3): 118–124. 1985
3. McCormick MC. The contribution of low birth weight to infantmortality and childhood morbidity. N Engl J Med 312:82–90.1985.
4. Hogue CJR, Buehler JW, Strauss LT, Smith JC. Overview of theNational Infant Mortality Surveillance (NIMS) project-design,method, results. Public Health Rep 102(2): 126–38. 1987.
5. Taffel SM. Trends in low birth weight: United States, 1978–85.National Center for Health Statistics. Vital Health Stat 21(48).1989.
6. U.S. Department of Health and Human Services. Healthypeople 2000: National health promotion and disease preventionobjectives for the nation. Washington: Public Health Service.1991.
7. Public Health Service Expert Panel on the Content of PrenatalCare. Caring for our future: The content of prenatal care.Washington: 1989.
8. Ventura SJ, Martin JA, Mathews TJ, Clarke SC. Advance reportof final natality statistics, 1994. Monthly vital statistics report;vol 44 no 11, suppl. Hyattsville, Maryland: National Center forHealth Statistics. 1996.
9. Institute of Medicine. Committee to Study Outreach for Prena-tal Care. Prenatal care: Reaching mothers, reaching infants.Washington: National Academy Press. 1988.
10. Cabral H, Fried LE, Levenson S, Amaro H, Zuckerman B.Foreign-born and US-born black women: Differences in healthbehaviors and birth outcomes. Am J Public Health 80:70–2.1990.
11. Sable MR, Stockbauer JW, Schramm WF, Land GH. Differen-tiating the barriers to adequate prenatal care in Missouri,1987–8. Public Health Reports 105(6): 549–55. 1990.
12. Poland ML, Ager JW, Olson, JM. Barriers to receiving adequateprenatal care. Am J Obstet Gynecol 157(2): 297–303. 1987.
13. Fingerhut LA, Makuc D, Kleinman JC. Delayed prenatal careand place of first visit: Differences by health insurance andeducation. Family Planning Perspectives 19(5): 212–34. 1987.
14. Kalmuss D, Fennelly K. Barriers to prenatal care amonglow-income women in New York City. Family Planning Per-spectives 22(5): 215–31. 1990.
15. National Commission to Prevent Infant Mortality. Troublingtrends persist: Shortchanging America’s next generation. Wash-ington: March 1992.
16. Schoendorf KC, Parker JD, Batkhan LZ, Kiely JL. Comparabil-ity of the birth certificate and the 1988 Maternal and InfantHealth Survey. National Center for Health Statistics. VitalHealth Stat 2(116). 1993.
7

List of detailed tables
1. Number and percent distribution of live births by trimesterof pregnancy prenatal care began, according to the race ofmother: United States, 1980–94. . . . . . . . . . . . . . . . . . 9
2. Number and percent distribution of live births by trimesterof pregnancy prenatal care began, according to the speci-fied race of mother: United States, 1994. . . . . . . . . . . . 10
3. Number and percent distribution of live births by trimesterof pregnancy prenatal care began, according to Hispanicorigin of mother and by race of mother for mothers ofnon-Hispanic origin: United States, 1994. . . . . . . . . . . . 10
4. Number and percent distribution of live births by trimesterof pregnancy prenatal care began, according to age andrace of mother: United States, 1994. . . . . . . . . . . . . . . 11
5. Number and percent distribution of live births by trimesterof pregnancy prenatal care began, according to live-birthorder and race of mother: United States, 1994. . . . . . . . 12
6. Number and percent distribution of live births by trimester ofpregnancy prenatal care began, according to educationalattainment and race of mother: United States, 1994. . . . . . 12
7. Number and percent distribution of live births bytrimester of pregnancy prenatal care began, according tomarital status and race of mother: United States, 1980and 1994. . . . . . . . . . . . . . . . . . . . . . . . . . . . . . . . . . . 13
8. Number and percent distribution of live births by trimesterof pregnancy prenatal care began, according to problemstatus with receiving prenatal care and race of child:United States, 1988 National Maternal and Infant HealthSurvey . . . . . . . . . . . . . . . . . . . . . . . . . . . . . . . . . . . . . 14
9. Number of live births to mothers who reported a problemreceiving prenatal care and percent distribution by trimes-ter of pregnancy prenatal care began, according to type ofproblem and race of child: United States, 1988 NationalMaternal and Infant Health Survey. . . . . . . . . . . . . . . . 14
10. Number and percent distribution of live births to moth-ers who reported a problem receiving prenatal care bytrimester of pregnancy prenatal care began, accordingto educational attainment of mother and race of child:United States, 1988 National Maternal and Infant HealthSurvey . . . . . . . . . . . . . . . . . . . . . . . . . . . . . . . . . . . . 15
11. Number and percent distribution of live births by trimesterof pregnancy prenatal care began, according to wantednessstatus and race of child: United States, 1988 NationalMaternal and Infant Health Survey. . . . . . . . . . . . . . . . 15
12. Number and percent distribution of live births by trimesterof pregnancy prenatal care began, according to wanted-ness and marital status: United States, 1988 NationalMaternal and Infant Health Survey. . . . . . . . . . . . . . . . 16
8
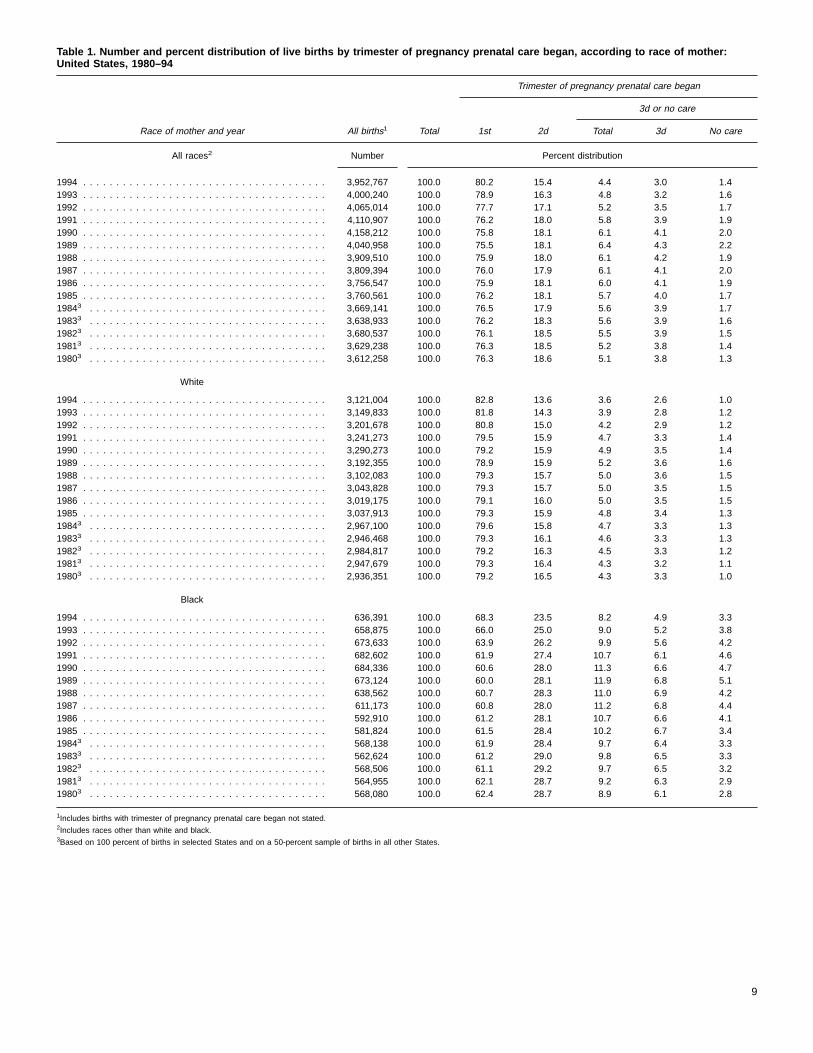
Table 1. Number and percent distribution of live births by trimester of pregnancy prenatal care began, according to race of mother:United States, 1980–94
Race of mother and year All births1 Total
Trimester of pregnancy prenatal care began
1st 2d
3d or no care
Total 3d No care
All races2 Number Percent distribution
1994 . . . . . . . . . . . . . . . . . . . . . . . . . . . . . . . . . . . . . 3,952,767 100.0 80.2 15.4 4.4 3.0 1.41993 . . . . . . . . . . . . . . . . . . . . . . . . . . . . . . . . . . . . . 4,000,240 100.0 78.9 16.3 4.8 3.2 1.61992 . . . . . . . . . . . . . . . . . . . . . . . . . . . . . . . . . . . . . 4,065,014 100.0 77.7 17.1 5.2 3.5 1.71991 . . . . . . . . . . . . . . . . . . . . . . . . . . . . . . . . . . . . . 4,110,907 100.0 76.2 18.0 5.8 3.9 1.91990 . . . . . . . . . . . . . . . . . . . . . . . . . . . . . . . . . . . . . 4,158,212 100.0 75.8 18.1 6.1 4.1 2.01989 . . . . . . . . . . . . . . . . . . . . . . . . . . . . . . . . . . . . . 4,040,958 100.0 75.5 18.1 6.4 4.3 2.21988 . . . . . . . . . . . . . . . . . . . . . . . . . . . . . . . . . . . . . 3,909,510 100.0 75.9 18.0 6.1 4.2 1.91987 . . . . . . . . . . . . . . . . . . . . . . . . . . . . . . . . . . . . . 3,809,394 100.0 76.0 17.9 6.1 4.1 2.01986 . . . . . . . . . . . . . . . . . . . . . . . . . . . . . . . . . . . . . 3,756,547 100.0 75.9 18.1 6.0 4.1 1.91985 . . . . . . . . . . . . . . . . . . . . . . . . . . . . . . . . . . . . . 3,760,561 100.0 76.2 18.1 5.7 4.0 1.719843 . . . . . . . . . . . . . . . . . . . . . . . . . . . . . . . . . . . . 3,669,141 100.0 76.5 17.9 5.6 3.9 1.719833 . . . . . . . . . . . . . . . . . . . . . . . . . . . . . . . . . . . . 3,638,933 100.0 76.2 18.3 5.6 3.9 1.619823 . . . . . . . . . . . . . . . . . . . . . . . . . . . . . . . . . . . . 3,680,537 100.0 76.1 18.5 5.5 3.9 1.519813 . . . . . . . . . . . . . . . . . . . . . . . . . . . . . . . . . . . . 3,629,238 100.0 76.3 18.5 5.2 3.8 1.419803 . . . . . . . . . . . . . . . . . . . . . . . . . . . . . . . . . . . . 3,612,258 100.0 76.3 18.6 5.1 3.8 1.3
White
1994 . . . . . . . . . . . . . . . . . . . . . . . . . . . . . . . . . . . . . 3,121,004 100.0 82.8 13.6 3.6 2.6 1.01993 . . . . . . . . . . . . . . . . . . . . . . . . . . . . . . . . . . . . . 3,149,833 100.0 81.8 14.3 3.9 2.8 1.21992 . . . . . . . . . . . . . . . . . . . . . . . . . . . . . . . . . . . . . 3,201,678 100.0 80.8 15.0 4.2 2.9 1.21991 . . . . . . . . . . . . . . . . . . . . . . . . . . . . . . . . . . . . . 3,241,273 100.0 79.5 15.9 4.7 3.3 1.41990 . . . . . . . . . . . . . . . . . . . . . . . . . . . . . . . . . . . . . 3,290,273 100.0 79.2 15.9 4.9 3.5 1.41989 . . . . . . . . . . . . . . . . . . . . . . . . . . . . . . . . . . . . . 3,192,355 100.0 78.9 15.9 5.2 3.6 1.61988 . . . . . . . . . . . . . . . . . . . . . . . . . . . . . . . . . . . . . 3,102,083 100.0 79.3 15.7 5.0 3.6 1.51987 . . . . . . . . . . . . . . . . . . . . . . . . . . . . . . . . . . . . . 3,043,828 100.0 79.3 15.7 5.0 3.5 1.51986 . . . . . . . . . . . . . . . . . . . . . . . . . . . . . . . . . . . . . 3,019,175 100.0 79.1 16.0 5.0 3.5 1.51985 . . . . . . . . . . . . . . . . . . . . . . . . . . . . . . . . . . . . . 3,037,913 100.0 79.3 15.9 4.8 3.4 1.319843 . . . . . . . . . . . . . . . . . . . . . . . . . . . . . . . . . . . . 2,967,100 100.0 79.6 15.8 4.7 3.3 1.319833 . . . . . . . . . . . . . . . . . . . . . . . . . . . . . . . . . . . . 2,946,468 100.0 79.3 16.1 4.6 3.3 1.319823 . . . . . . . . . . . . . . . . . . . . . . . . . . . . . . . . . . . . 2,984,817 100.0 79.2 16.3 4.5 3.3 1.219813 . . . . . . . . . . . . . . . . . . . . . . . . . . . . . . . . . . . . 2,947,679 100.0 79.3 16.4 4.3 3.2 1.119803 . . . . . . . . . . . . . . . . . . . . . . . . . . . . . . . . . . . . 2,936,351 100.0 79.2 16.5 4.3 3.3 1.0
Black
1994 . . . . . . . . . . . . . . . . . . . . . . . . . . . . . . . . . . . . . 636,391 100.0 68.3 23.5 8.2 4.9 3.31993 . . . . . . . . . . . . . . . . . . . . . . . . . . . . . . . . . . . . . 658,875 100.0 66.0 25.0 9.0 5.2 3.81992 . . . . . . . . . . . . . . . . . . . . . . . . . . . . . . . . . . . . . 673,633 100.0 63.9 26.2 9.9 5.6 4.21991 . . . . . . . . . . . . . . . . . . . . . . . . . . . . . . . . . . . . . 682,602 100.0 61.9 27.4 10.7 6.1 4.61990 . . . . . . . . . . . . . . . . . . . . . . . . . . . . . . . . . . . . . 684,336 100.0 60.6 28.0 11.3 6.6 4.71989 . . . . . . . . . . . . . . . . . . . . . . . . . . . . . . . . . . . . . 673,124 100.0 60.0 28.1 11.9 6.8 5.11988 . . . . . . . . . . . . . . . . . . . . . . . . . . . . . . . . . . . . . 638,562 100.0 60.7 28.3 11.0 6.9 4.21987 . . . . . . . . . . . . . . . . . . . . . . . . . . . . . . . . . . . . . 611,173 100.0 60.8 28.0 11.2 6.8 4.41986 . . . . . . . . . . . . . . . . . . . . . . . . . . . . . . . . . . . . . 592,910 100.0 61.2 28.1 10.7 6.6 4.11985 . . . . . . . . . . . . . . . . . . . . . . . . . . . . . . . . . . . . . 581,824 100.0 61.5 28.4 10.2 6.7 3.419843 . . . . . . . . . . . . . . . . . . . . . . . . . . . . . . . . . . . . 568,138 100.0 61.9 28.4 9.7 6.4 3.319833 . . . . . . . . . . . . . . . . . . . . . . . . . . . . . . . . . . . . 562,624 100.0 61.2 29.0 9.8 6.5 3.319823 . . . . . . . . . . . . . . . . . . . . . . . . . . . . . . . . . . . . 568,506 100.0 61.1 29.2 9.7 6.5 3.219813 . . . . . . . . . . . . . . . . . . . . . . . . . . . . . . . . . . . . 564,955 100.0 62.1 28.7 9.2 6.3 2.919803 . . . . . . . . . . . . . . . . . . . . . . . . . . . . . . . . . . . . 568,080 100.0 62.4 28.7 8.9 6.1 2.8
1Includes births with trimester of pregnancy prenatal care began not stated.2Includes races other than white and black.3Based on 100 percent of births in selected States and on a 50-percent sample of births in all other States.
9
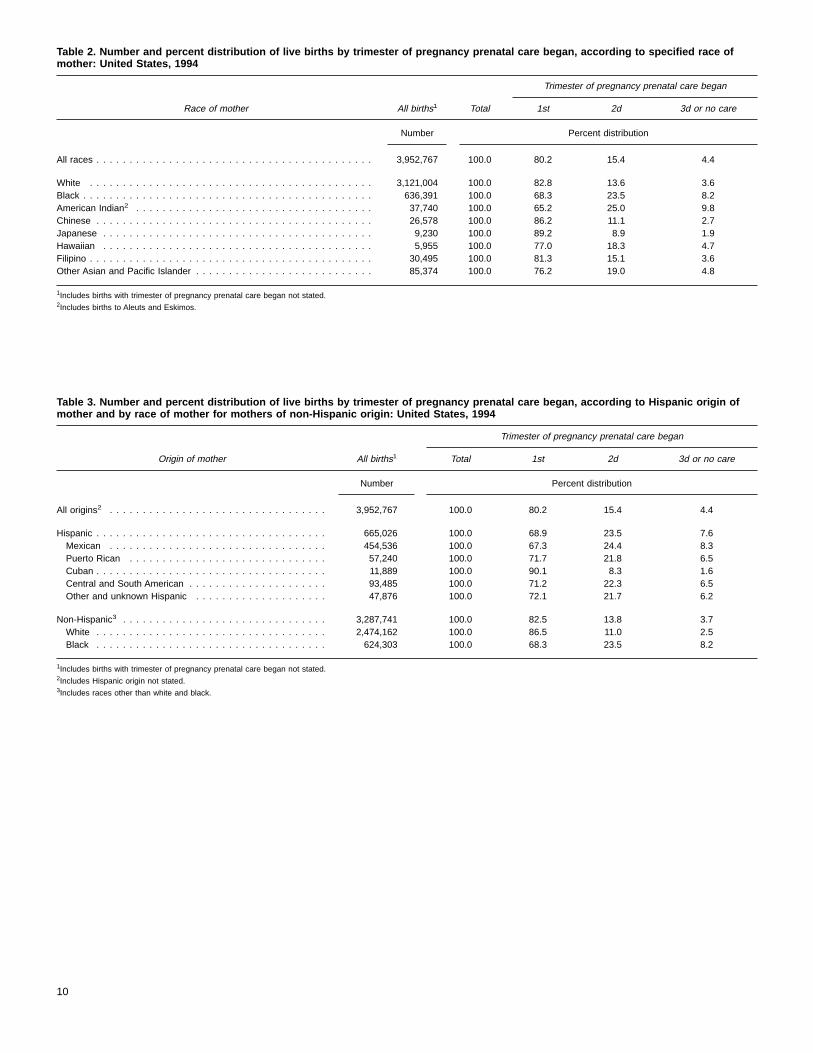
Table 2. Number and percent distribution of live births by trimester of pregnancy prenatal care began, according to specified race ofmother: United States, 1994
Race of mother All births1 Total
Trimester of pregnancy prenatal care began
1st 2d 3d or no care
Number Percent distribution
All races . . . . . . . . . . . . . . . . . . . . . . . . . . . . . . . . . . . . . . . . . . 3,952,767 100.0 80.2 15.4 4.4
White . . . . . . . . . . . . . . . . . . . . . . . . . . . . . . . . . . . . . . . . . . . 3,121,004 100.0 82.8 13.6 3.6Black . . . . . . . . . . . . . . . . . . . . . . . . . . . . . . . . . . . . . . . . . . . . 636,391 100.0 68.3 23.5 8.2American Indian2 . . . . . . . . . . . . . . . . . . . . . . . . . . . . . . . . . . . . 37,740 100.0 65.2 25.0 9.8Chinese . . . . . . . . . . . . . . . . . . . . . . . . . . . . . . . . . . . . . . . . . . 26,578 100.0 86.2 11.1 2.7Japanese . . . . . . . . . . . . . . . . . . . . . . . . . . . . . . . . . . . . . . . . . 9,230 100.0 89.2 8.9 1.9Hawaiian . . . . . . . . . . . . . . . . . . . . . . . . . . . . . . . . . . . . . . . . . 5,955 100.0 77.0 18.3 4.7Filipino . . . . . . . . . . . . . . . . . . . . . . . . . . . . . . . . . . . . . . . . . . . 30,495 100.0 81.3 15.1 3.6Other Asian and Pacific Islander . . . . . . . . . . . . . . . . . . . . . . . . . . . 85,374 100.0 76.2 19.0 4.8
1Includes births with trimester of pregnancy prenatal care began not stated.2Includes births to Aleuts and Eskimos.
Table 3. Number and percent distribution of live births by trimester of pregnancy prenatal care began, according to Hispanic origin ofmother and by race of mother for mothers of non-Hispanic origin: United States, 1994
Origin of mother All births1
Trimester of pregnancy prenatal care began
Total 1st 2d 3d or no care
Number Percent distribution
All origins2 . . . . . . . . . . . . . . . . . . . . . . . . . . . . . . . . . 3,952,767 100.0 80.2 15.4 4.4
Hispanic . . . . . . . . . . . . . . . . . . . . . . . . . . . . . . . . . . . 665,026 100.0 68.9 23.5 7.6Mexican . . . . . . . . . . . . . . . . . . . . . . . . . . . . . . . . . 454,536 100.0 67.3 24.4 8.3Puerto Rican . . . . . . . . . . . . . . . . . . . . . . . . . . . . . . 57,240 100.0 71.7 21.8 6.5Cuban . . . . . . . . . . . . . . . . . . . . . . . . . . . . . . . . . . . 11,889 100.0 90.1 8.3 1.6Central and South American . . . . . . . . . . . . . . . . . . . . . 93,485 100.0 71.2 22.3 6.5Other and unknown Hispanic . . . . . . . . . . . . . . . . . . . . 47,876 100.0 72.1 21.7 6.2
Non-Hispanic3 . . . . . . . . . . . . . . . . . . . . . . . . . . . . . . . 3,287,741 100.0 82.5 13.8 3.7White . . . . . . . . . . . . . . . . . . . . . . . . . . . . . . . . . . . 2,474,162 100.0 86.5 11.0 2.5Black . . . . . . . . . . . . . . . . . . . . . . . . . . . . . . . . . . . 624,303 100.0 68.3 23.5 8.2
1Includes births with trimester of pregnancy prenatal care began not stated.2Includes Hispanic origin not stated.3Includes races other than white and black.
10
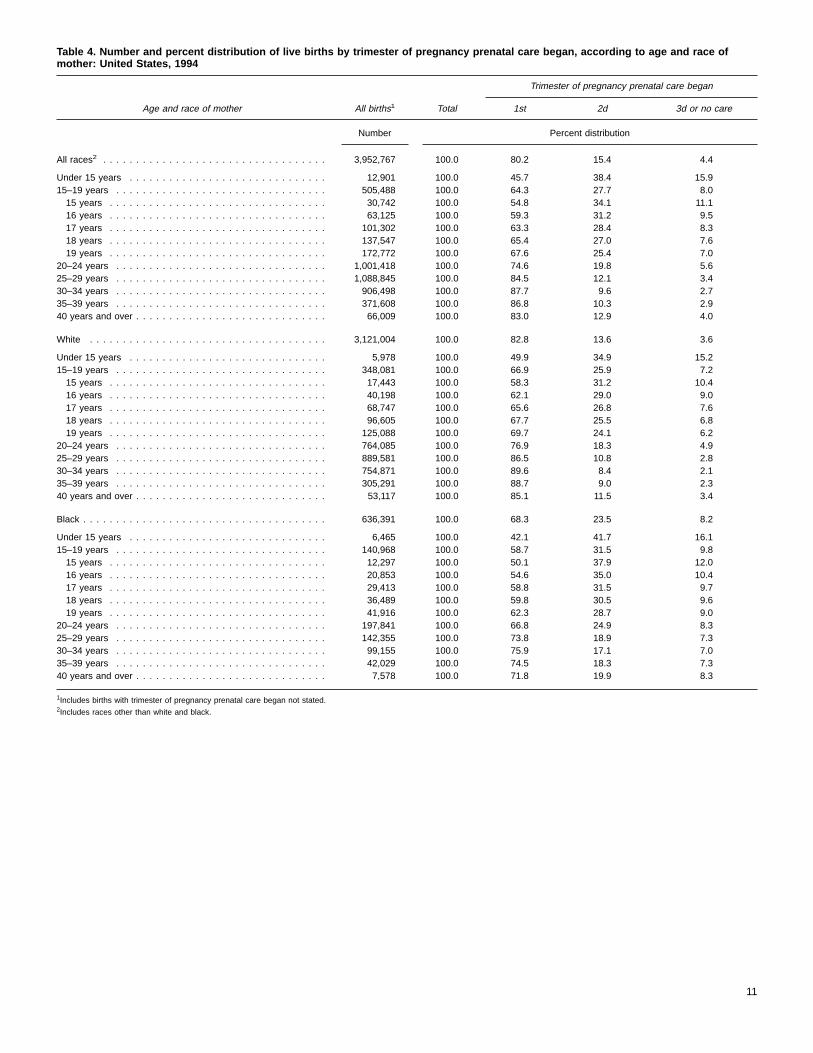
Table 4. Number and percent distribution of live births by trimester of pregnancy prenatal care began, according to age and race ofmother: United States, 1994
Age and race of mother All births1 Total
Trimester of pregnancy prenatal care began
1st 2d 3d or no care
Number Percent distribution
All races2 . . . . . . . . . . . . . . . . . . . . . . . . . . . . . . . . . . 3,952,767 100.0 80.2 15.4 4.4
Under 15 years . . . . . . . . . . . . . . . . . . . . . . . . . . . . . . 12,901 100.0 45.7 38.4 15.915–19 years . . . . . . . . . . . . . . . . . . . . . . . . . . . . . . . . 505,488 100.0 64.3 27.7 8.015 years . . . . . . . . . . . . . . . . . . . . . . . . . . . . . . . . . 30,742 100.0 54.8 34.1 11.116 years . . . . . . . . . . . . . . . . . . . . . . . . . . . . . . . . . 63,125 100.0 59.3 31.2 9.517 years . . . . . . . . . . . . . . . . . . . . . . . . . . . . . . . . . 101,302 100.0 63.3 28.4 8.318 years . . . . . . . . . . . . . . . . . . . . . . . . . . . . . . . . . 137,547 100.0 65.4 27.0 7.619 years . . . . . . . . . . . . . . . . . . . . . . . . . . . . . . . . . 172,772 100.0 67.6 25.4 7.0
20–24 years . . . . . . . . . . . . . . . . . . . . . . . . . . . . . . . . 1,001,418 100.0 74.6 19.8 5.625–29 years . . . . . . . . . . . . . . . . . . . . . . . . . . . . . . . . 1,088,845 100.0 84.5 12.1 3.430–34 years . . . . . . . . . . . . . . . . . . . . . . . . . . . . . . . . 906,498 100.0 87.7 9.6 2.735–39 years . . . . . . . . . . . . . . . . . . . . . . . . . . . . . . . . 371,608 100.0 86.8 10.3 2.940 years and over . . . . . . . . . . . . . . . . . . . . . . . . . . . . . 66,009 100.0 83.0 12.9 4.0
White . . . . . . . . . . . . . . . . . . . . . . . . . . . . . . . . . . . . 3,121,004 100.0 82.8 13.6 3.6
Under 15 years . . . . . . . . . . . . . . . . . . . . . . . . . . . . . . 5,978 100.0 49.9 34.9 15.215–19 years . . . . . . . . . . . . . . . . . . . . . . . . . . . . . . . . 348,081 100.0 66.9 25.9 7.215 years . . . . . . . . . . . . . . . . . . . . . . . . . . . . . . . . . 17,443 100.0 58.3 31.2 10.416 years . . . . . . . . . . . . . . . . . . . . . . . . . . . . . . . . . 40,198 100.0 62.1 29.0 9.017 years . . . . . . . . . . . . . . . . . . . . . . . . . . . . . . . . . 68,747 100.0 65.6 26.8 7.618 years . . . . . . . . . . . . . . . . . . . . . . . . . . . . . . . . . 96,605 100.0 67.7 25.5 6.819 years . . . . . . . . . . . . . . . . . . . . . . . . . . . . . . . . . 125,088 100.0 69.7 24.1 6.2
20–24 years . . . . . . . . . . . . . . . . . . . . . . . . . . . . . . . . 764,085 100.0 76.9 18.3 4.925–29 years . . . . . . . . . . . . . . . . . . . . . . . . . . . . . . . . 889,581 100.0 86.5 10.8 2.830–34 years . . . . . . . . . . . . . . . . . . . . . . . . . . . . . . . . 754,871 100.0 89.6 8.4 2.135–39 years . . . . . . . . . . . . . . . . . . . . . . . . . . . . . . . . 305,291 100.0 88.7 9.0 2.340 years and over . . . . . . . . . . . . . . . . . . . . . . . . . . . . . 53,117 100.0 85.1 11.5 3.4
Black . . . . . . . . . . . . . . . . . . . . . . . . . . . . . . . . . . . . . 636,391 100.0 68.3 23.5 8.2
Under 15 years . . . . . . . . . . . . . . . . . . . . . . . . . . . . . . 6,465 100.0 42.1 41.7 16.115–19 years . . . . . . . . . . . . . . . . . . . . . . . . . . . . . . . . 140,968 100.0 58.7 31.5 9.815 years . . . . . . . . . . . . . . . . . . . . . . . . . . . . . . . . . 12,297 100.0 50.1 37.9 12.016 years . . . . . . . . . . . . . . . . . . . . . . . . . . . . . . . . . 20,853 100.0 54.6 35.0 10.417 years . . . . . . . . . . . . . . . . . . . . . . . . . . . . . . . . . 29,413 100.0 58.8 31.5 9.718 years . . . . . . . . . . . . . . . . . . . . . . . . . . . . . . . . . 36,489 100.0 59.8 30.5 9.619 years . . . . . . . . . . . . . . . . . . . . . . . . . . . . . . . . . 41,916 100.0 62.3 28.7 9.0
20–24 years . . . . . . . . . . . . . . . . . . . . . . . . . . . . . . . . 197,841 100.0 66.8 24.9 8.325–29 years . . . . . . . . . . . . . . . . . . . . . . . . . . . . . . . . 142,355 100.0 73.8 18.9 7.330–34 years . . . . . . . . . . . . . . . . . . . . . . . . . . . . . . . . 99,155 100.0 75.9 17.1 7.035–39 years . . . . . . . . . . . . . . . . . . . . . . . . . . . . . . . . 42,029 100.0 74.5 18.3 7.340 years and over . . . . . . . . . . . . . . . . . . . . . . . . . . . . . 7,578 100.0 71.8 19.9 8.3
1Includes births with trimester of pregnancy prenatal care began not stated.2Includes races other than white and black.
11
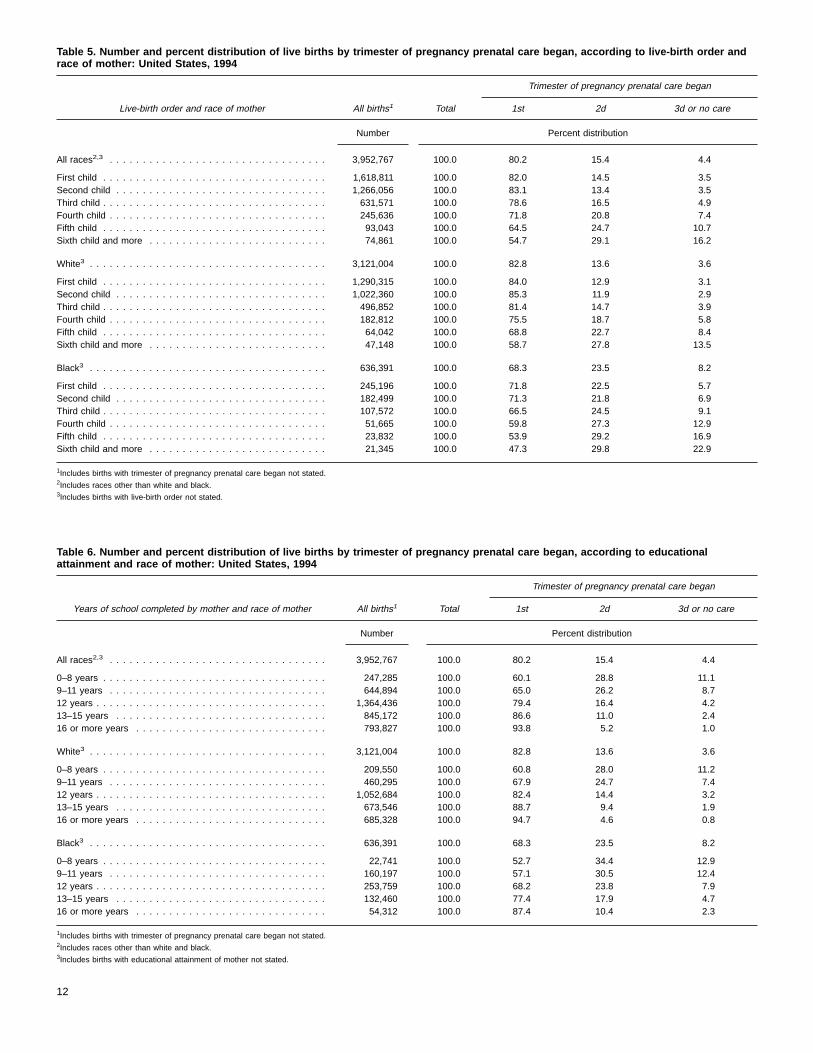
Table 5. Number and percent distribution of live births by trimester of pregnancy prenatal care began, according to live-birth order andrace of mother: United States, 1994
Live-birth order and race of mother All births1 Total
Trimester of pregnancy prenatal care began
1st 2d 3d or no care
Number Percent distribution
All races2,3 . . . . . . . . . . . . . . . . . . . . . . . . . . . . . . . . . 3,952,767 100.0 80.2 15.4 4.4
First child . . . . . . . . . . . . . . . . . . . . . . . . . . . . . . . . . . 1,618,811 100.0 82.0 14.5 3.5Second child . . . . . . . . . . . . . . . . . . . . . . . . . . . . . . . . 1,266,056 100.0 83.1 13.4 3.5Third child . . . . . . . . . . . . . . . . . . . . . . . . . . . . . . . . . . 631,571 100.0 78.6 16.5 4.9Fourth child . . . . . . . . . . . . . . . . . . . . . . . . . . . . . . . . . 245,636 100.0 71.8 20.8 7.4Fifth child . . . . . . . . . . . . . . . . . . . . . . . . . . . . . . . . . . 93,043 100.0 64.5 24.7 10.7Sixth child and more . . . . . . . . . . . . . . . . . . . . . . . . . . . 74,861 100.0 54.7 29.1 16.2
White3 . . . . . . . . . . . . . . . . . . . . . . . . . . . . . . . . . . . . 3,121,004 100.0 82.8 13.6 3.6
First child . . . . . . . . . . . . . . . . . . . . . . . . . . . . . . . . . . 1,290,315 100.0 84.0 12.9 3.1Second child . . . . . . . . . . . . . . . . . . . . . . . . . . . . . . . . 1,022,360 100.0 85.3 11.9 2.9Third child . . . . . . . . . . . . . . . . . . . . . . . . . . . . . . . . . . 496,852 100.0 81.4 14.7 3.9Fourth child . . . . . . . . . . . . . . . . . . . . . . . . . . . . . . . . . 182,812 100.0 75.5 18.7 5.8Fifth child . . . . . . . . . . . . . . . . . . . . . . . . . . . . . . . . . . 64,042 100.0 68.8 22.7 8.4Sixth child and more . . . . . . . . . . . . . . . . . . . . . . . . . . . 47,148 100.0 58.7 27.8 13.5
Black3 . . . . . . . . . . . . . . . . . . . . . . . . . . . . . . . . . . . . 636,391 100.0 68.3 23.5 8.2
First child . . . . . . . . . . . . . . . . . . . . . . . . . . . . . . . . . . 245,196 100.0 71.8 22.5 5.7Second child . . . . . . . . . . . . . . . . . . . . . . . . . . . . . . . . 182,499 100.0 71.3 21.8 6.9Third child . . . . . . . . . . . . . . . . . . . . . . . . . . . . . . . . . . 107,572 100.0 66.5 24.5 9.1Fourth child . . . . . . . . . . . . . . . . . . . . . . . . . . . . . . . . . 51,665 100.0 59.8 27.3 12.9Fifth child . . . . . . . . . . . . . . . . . . . . . . . . . . . . . . . . . . 23,832 100.0 53.9 29.2 16.9Sixth child and more . . . . . . . . . . . . . . . . . . . . . . . . . . . 21,345 100.0 47.3 29.8 22.9
1Includes births with trimester of pregnancy prenatal care began not stated.2Includes races other than white and black.3Includes births with live-birth order not stated.
Table 6. Number and percent distribution of live births by trimester of pregnancy prenatal care began, according to educationalattainment and race of mother: United States, 1994
Years of school completed by mother and race of mother All births1 Total
Trimester of pregnancy prenatal care began
1st 2d 3d or no care
Number Percent distribution
All races2,3 . . . . . . . . . . . . . . . . . . . . . . . . . . . . . . . . . 3,952,767 100.0 80.2 15.4 4.4
0–8 years . . . . . . . . . . . . . . . . . . . . . . . . . . . . . . . . . . 247,285 100.0 60.1 28.8 11.19–11 years . . . . . . . . . . . . . . . . . . . . . . . . . . . . . . . . . 644,894 100.0 65.0 26.2 8.712 years . . . . . . . . . . . . . . . . . . . . . . . . . . . . . . . . . . . 1,364,436 100.0 79.4 16.4 4.213–15 years . . . . . . . . . . . . . . . . . . . . . . . . . . . . . . . . 845,172 100.0 86.6 11.0 2.416 or more years . . . . . . . . . . . . . . . . . . . . . . . . . . . . . 793,827 100.0 93.8 5.2 1.0
White3 . . . . . . . . . . . . . . . . . . . . . . . . . . . . . . . . . . . . 3,121,004 100.0 82.8 13.6 3.6
0–8 years . . . . . . . . . . . . . . . . . . . . . . . . . . . . . . . . . . 209,550 100.0 60.8 28.0 11.29–11 years . . . . . . . . . . . . . . . . . . . . . . . . . . . . . . . . . 460,295 100.0 67.9 24.7 7.412 years . . . . . . . . . . . . . . . . . . . . . . . . . . . . . . . . . . . 1,052,684 100.0 82.4 14.4 3.213–15 years . . . . . . . . . . . . . . . . . . . . . . . . . . . . . . . . 673,546 100.0 88.7 9.4 1.916 or more years . . . . . . . . . . . . . . . . . . . . . . . . . . . . . 685,328 100.0 94.7 4.6 0.8
Black3 . . . . . . . . . . . . . . . . . . . . . . . . . . . . . . . . . . . . 636,391 100.0 68.3 23.5 8.2
0–8 years . . . . . . . . . . . . . . . . . . . . . . . . . . . . . . . . . . 22,741 100.0 52.7 34.4 12.99–11 years . . . . . . . . . . . . . . . . . . . . . . . . . . . . . . . . . 160,197 100.0 57.1 30.5 12.412 years . . . . . . . . . . . . . . . . . . . . . . . . . . . . . . . . . . . 253,759 100.0 68.2 23.8 7.913–15 years . . . . . . . . . . . . . . . . . . . . . . . . . . . . . . . . 132,460 100.0 77.4 17.9 4.716 or more years . . . . . . . . . . . . . . . . . . . . . . . . . . . . . 54,312 100.0 87.4 10.4 2.3
1Includes births with trimester of pregnancy prenatal care began not stated.2Includes races other than white and black.3Includes births with educational attainment of mother not stated.
12
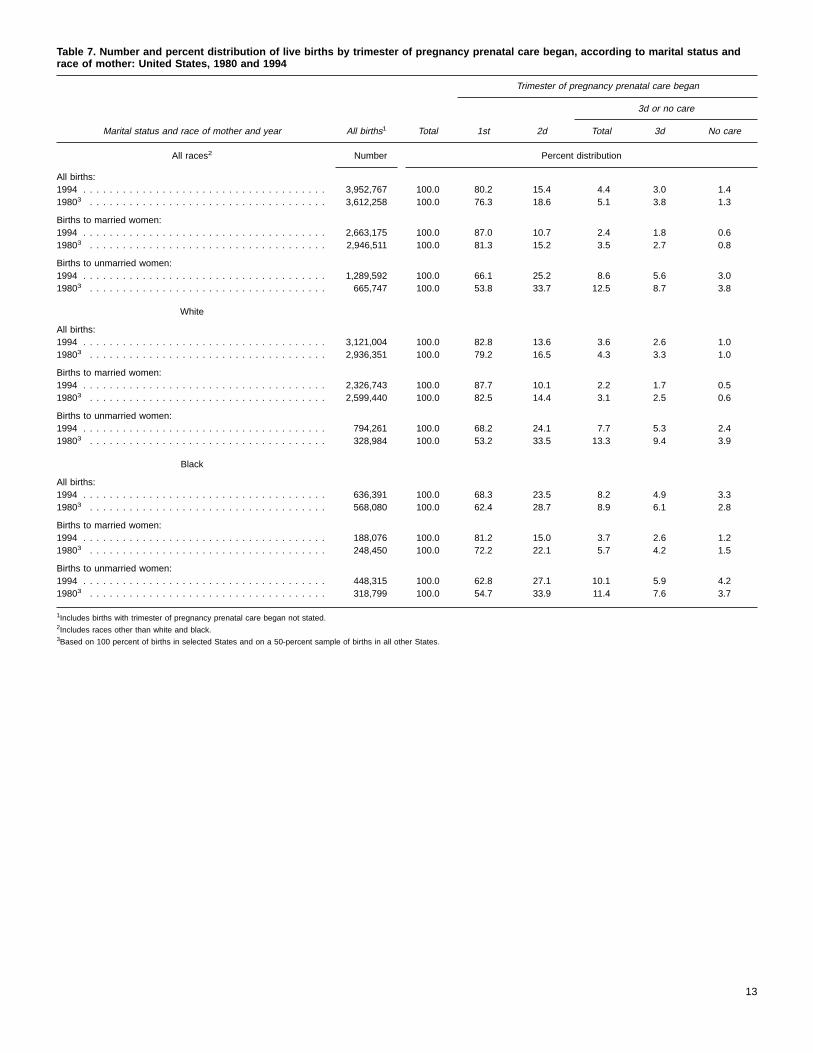
Table 7. Number and percent distribution of live births by trimester of pregnancy prenatal care began, according to marital status andrace of mother: United States, 1980 and 1994
Marital status and race of mother and year All births1 Total
Trimester of pregnancy prenatal care began
1st 2d
3d or no care
Total 3d No care
All races2 Number Percent distribution
All births:1994 . . . . . . . . . . . . . . . . . . . . . . . . . . . . . . . . . . . . . 3,952,767 100.0 80.2 15.4 4.4 3.0 1.419803 . . . . . . . . . . . . . . . . . . . . . . . . . . . . . . . . . . . . 3,612,258 100.0 76.3 18.6 5.1 3.8 1.3
Births to married women:1994 . . . . . . . . . . . . . . . . . . . . . . . . . . . . . . . . . . . . . 2,663,175 100.0 87.0 10.7 2.4 1.8 0.619803 . . . . . . . . . . . . . . . . . . . . . . . . . . . . . . . . . . . . 2,946,511 100.0 81.3 15.2 3.5 2.7 0.8
Births to unmarried women:1994 . . . . . . . . . . . . . . . . . . . . . . . . . . . . . . . . . . . . . 1,289,592 100.0 66.1 25.2 8.6 5.6 3.019803 . . . . . . . . . . . . . . . . . . . . . . . . . . . . . . . . . . . . 665,747 100.0 53.8 33.7 12.5 8.7 3.8
White
All births:1994 . . . . . . . . . . . . . . . . . . . . . . . . . . . . . . . . . . . . . 3,121,004 100.0 82.8 13.6 3.6 2.6 1.019803 . . . . . . . . . . . . . . . . . . . . . . . . . . . . . . . . . . . . 2,936,351 100.0 79.2 16.5 4.3 3.3 1.0
Births to married women:1994 . . . . . . . . . . . . . . . . . . . . . . . . . . . . . . . . . . . . . 2,326,743 100.0 87.7 10.1 2.2 1.7 0.519803 . . . . . . . . . . . . . . . . . . . . . . . . . . . . . . . . . . . . 2,599,440 100.0 82.5 14.4 3.1 2.5 0.6
Births to unmarried women:1994 . . . . . . . . . . . . . . . . . . . . . . . . . . . . . . . . . . . . . 794,261 100.0 68.2 24.1 7.7 5.3 2.419803 . . . . . . . . . . . . . . . . . . . . . . . . . . . . . . . . . . . . 328,984 100.0 53.2 33.5 13.3 9.4 3.9
Black
All births:1994 . . . . . . . . . . . . . . . . . . . . . . . . . . . . . . . . . . . . . 636,391 100.0 68.3 23.5 8.2 4.9 3.319803 . . . . . . . . . . . . . . . . . . . . . . . . . . . . . . . . . . . . 568,080 100.0 62.4 28.7 8.9 6.1 2.8
Births to married women:1994 . . . . . . . . . . . . . . . . . . . . . . . . . . . . . . . . . . . . . 188,076 100.0 81.2 15.0 3.7 2.6 1.219803 . . . . . . . . . . . . . . . . . . . . . . . . . . . . . . . . . . . . 248,450 100.0 72.2 22.1 5.7 4.2 1.5
Births to unmarried women:1994 . . . . . . . . . . . . . . . . . . . . . . . . . . . . . . . . . . . . . 448,315 100.0 62.8 27.1 10.1 5.9 4.219803 . . . . . . . . . . . . . . . . . . . . . . . . . . . . . . . . . . . . 318,799 100.0 54.7 33.9 11.4 7.6 3.7
1Includes births with trimester of pregnancy prenatal care began not stated.2Includes races other than white and black.3Based on 100 percent of births in selected States and on a 50-percent sample of births in all other States.
13
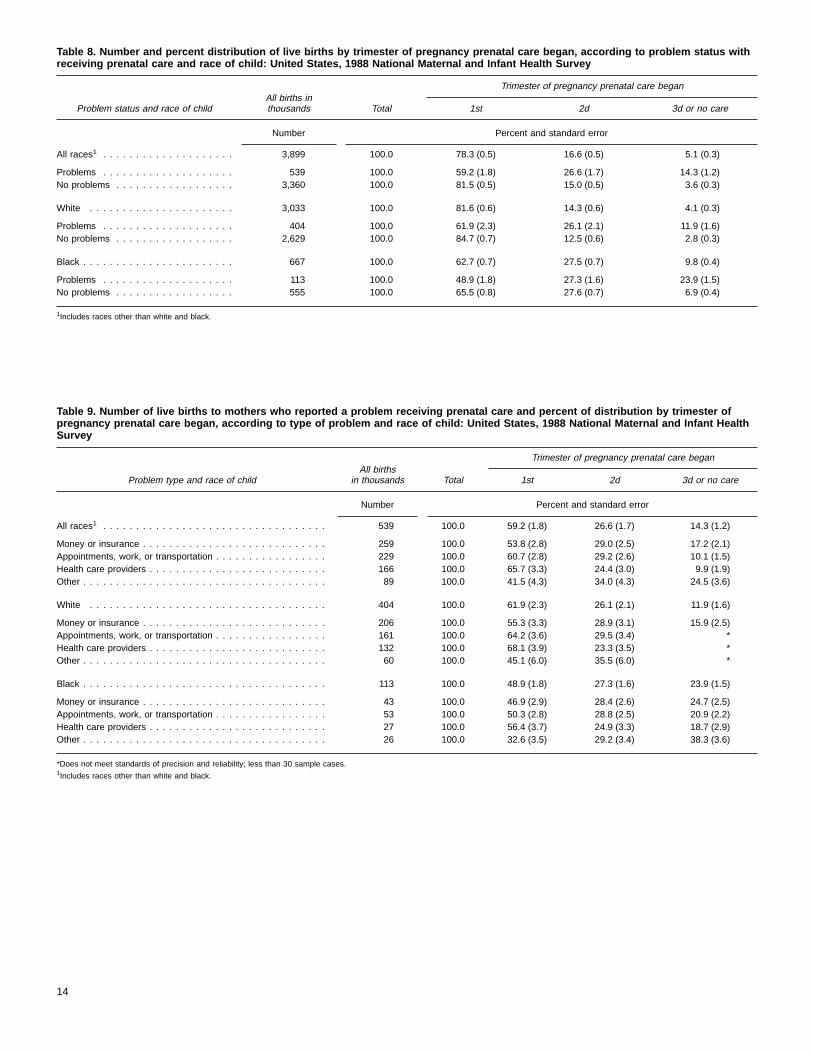
Table 8. Number and percent distribution of live births by trimester of pregnancy prenatal care began, according to problem status withreceiving prenatal care and race of child: United States, 1988 National Maternal and Infant Health Survey
Problem status and race of childAll births inthousands Total
Trimester of pregnancy prenatal care began
1st 2d 3d or no care
Number Percent and standard error
All races1 . . . . . . . . . . . . . . . . . . . . 3,899 100.0 78.3 (0.5) 16.6 (0.5) 5.1 (0.3)
Problems . . . . . . . . . . . . . . . . . . . . 539 100.0 59.2 (1.8) 26.6 (1.7) 14.3 (1.2)No problems . . . . . . . . . . . . . . . . . . 3,360 100.0 81.5 (0.5) 15.0 (0.5) 3.6 (0.3)
White . . . . . . . . . . . . . . . . . . . . . . 3,033 100.0 81.6 (0.6) 14.3 (0.6) 4.1 (0.3)
Problems . . . . . . . . . . . . . . . . . . . . 404 100.0 61.9 (2.3) 26.1 (2.1) 11.9 (1.6)No problems . . . . . . . . . . . . . . . . . . 2,629 100.0 84.7 (0.7) 12.5 (0.6) 2.8 (0.3)
Black . . . . . . . . . . . . . . . . . . . . . . . 667 100.0 62.7 (0.7) 27.5 (0.7) 9.8 (0.4)
Problems . . . . . . . . . . . . . . . . . . . . 113 100.0 48.9 (1.8) 27.3 (1.6) 23.9 (1.5)No problems . . . . . . . . . . . . . . . . . . 555 100.0 65.5 (0.8) 27.6 (0.7) 6.9 (0.4)
1Includes races other than white and black.
Table 9. Number of live births to mothers who reported a problem receiving prenatal care and percent of distribution by trimester ofpregnancy prenatal care began, according to type of problem and race of child: United States, 1988 National Maternal and Infant HealthSurvey
Problem type and race of childAll births
in thousands Total
Trimester of pregnancy prenatal care began
1st 2d 3d or no care
Number Percent and standard error
All races1 . . . . . . . . . . . . . . . . . . . . . . . . . . . . . . . . . . 539 100.0 59.2 (1.8) 26.6 (1.7) 14.3 (1.2)
Money or insurance . . . . . . . . . . . . . . . . . . . . . . . . . . . . 259 100.0 53.8 (2.8) 29.0 (2.5) 17.2 (2.1)Appointments, work, or transportation . . . . . . . . . . . . . . . . . 229 100.0 60.7 (2.8) 29.2 (2.6) 10.1 (1.5)Health care providers . . . . . . . . . . . . . . . . . . . . . . . . . . . 166 100.0 65.7 (3.3) 24.4 (3.0) 9.9 (1.9)Other . . . . . . . . . . . . . . . . . . . . . . . . . . . . . . . . . . . . . 89 100.0 41.5 (4.3) 34.0 (4.3) 24.5 (3.6)
White . . . . . . . . . . . . . . . . . . . . . . . . . . . . . . . . . . . . 404 100.0 61.9 (2.3) 26.1 (2.1) 11.9 (1.6)
Money or insurance . . . . . . . . . . . . . . . . . . . . . . . . . . . . 206 100.0 55.3 (3.3) 28.9 (3.1) 15.9 (2.5)Appointments, work, or transportation . . . . . . . . . . . . . . . . . 161 100.0 64.2 (3.6) 29.5 (3.4) *Health care providers . . . . . . . . . . . . . . . . . . . . . . . . . . . 132 100.0 68.1 (3.9) 23.3 (3.5) *Other . . . . . . . . . . . . . . . . . . . . . . . . . . . . . . . . . . . . . 60 100.0 45.1 (6.0) 35.5 (6.0) *
Black . . . . . . . . . . . . . . . . . . . . . . . . . . . . . . . . . . . . . 113 100.0 48.9 (1.8) 27.3 (1.6) 23.9 (1.5)
Money or insurance . . . . . . . . . . . . . . . . . . . . . . . . . . . . 43 100.0 46.9 (2.9) 28.4 (2.6) 24.7 (2.5)Appointments, work, or transportation . . . . . . . . . . . . . . . . . 53 100.0 50.3 (2.8) 28.8 (2.5) 20.9 (2.2)Health care providers . . . . . . . . . . . . . . . . . . . . . . . . . . . 27 100.0 56.4 (3.7) 24.9 (3.3) 18.7 (2.9)Other . . . . . . . . . . . . . . . . . . . . . . . . . . . . . . . . . . . . . 26 100.0 32.6 (3.5) 29.2 (3.4) 38.3 (3.6)
*Does not meet standards of precision and reliability; less than 30 sample cases.1Includes races other than white and black.
14
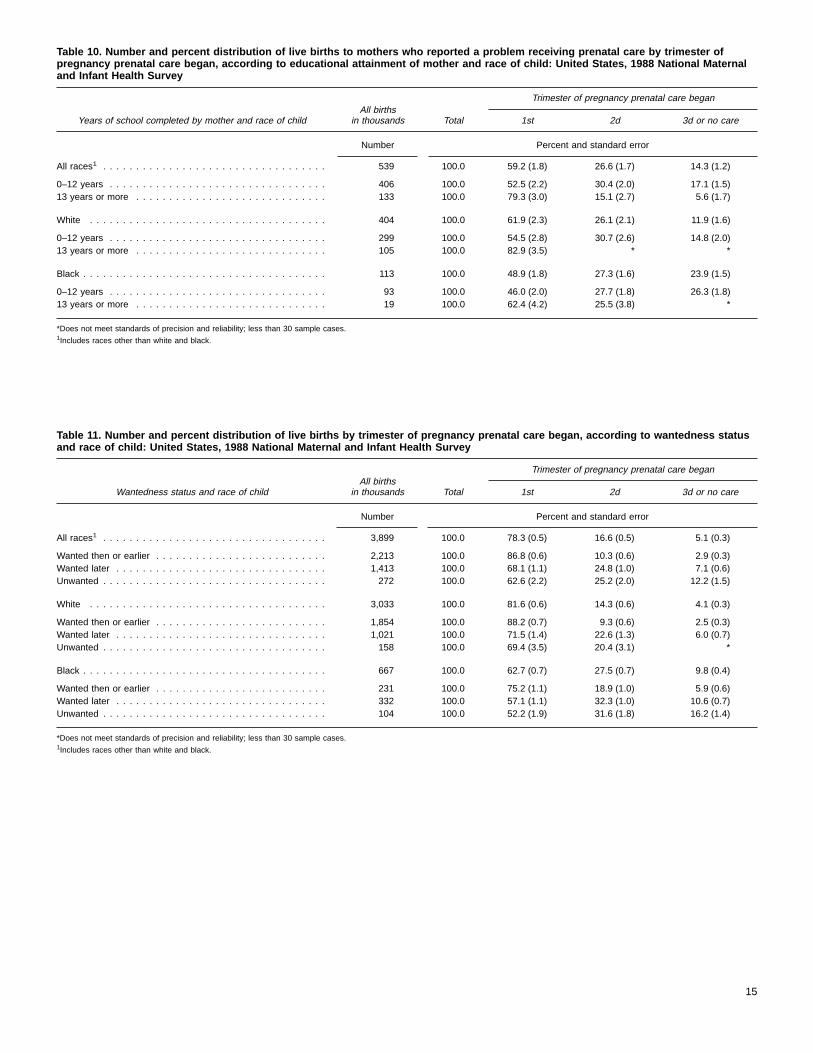
Table 10. Number and percent distribution of live births to mothers who reported a problem receiving prenatal care by trimester ofpregnancy prenatal care began, according to educational attainment of mother and race of child: United States, 1988 National Maternaland Infant Health Survey
Years of school completed by mother and race of childAll births
in thousands Total
Trimester of pregnancy prenatal care began
1st 2d 3d or no care
Number Percent and standard error
All races1 . . . . . . . . . . . . . . . . . . . . . . . . . . . . . . . . . . 539 100.0 59.2 (1.8) 26.6 (1.7) 14.3 (1.2)
0–12 years . . . . . . . . . . . . . . . . . . . . . . . . . . . . . . . . . 406 100.0 52.5 (2.2) 30.4 (2.0) 17.1 (1.5)13 years or more . . . . . . . . . . . . . . . . . . . . . . . . . . . . . 133 100.0 79.3 (3.0) 15.1 (2.7) 5.6 (1.7)
White . . . . . . . . . . . . . . . . . . . . . . . . . . . . . . . . . . . . 404 100.0 61.9 (2.3) 26.1 (2.1) 11.9 (1.6)
0–12 years . . . . . . . . . . . . . . . . . . . . . . . . . . . . . . . . . 299 100.0 54.5 (2.8) 30.7 (2.6) 14.8 (2.0)13 years or more . . . . . . . . . . . . . . . . . . . . . . . . . . . . . 105 100.0 82.9 (3.5) * *
Black . . . . . . . . . . . . . . . . . . . . . . . . . . . . . . . . . . . . . 113 100.0 48.9 (1.8) 27.3 (1.6) 23.9 (1.5)
0–12 years . . . . . . . . . . . . . . . . . . . . . . . . . . . . . . . . . 93 100.0 46.0 (2.0) 27.7 (1.8) 26.3 (1.8)13 years or more . . . . . . . . . . . . . . . . . . . . . . . . . . . . . 19 100.0 62.4 (4.2) 25.5 (3.8) *
*Does not meet standards of precision and reliability; less than 30 sample cases.1Includes races other than white and black.
Table 11. Number and percent distribution of live births by trimester of pregnancy prenatal care began, according to wantedness statusand race of child: United States, 1988 National Maternal and Infant Health Survey
Wantedness status and race of childAll births
in thousands Total
Trimester of pregnancy prenatal care began
1st 2d 3d or no care
Number Percent and standard error
All races1 . . . . . . . . . . . . . . . . . . . . . . . . . . . . . . . . . . 3,899 100.0 78.3 (0.5) 16.6 (0.5) 5.1 (0.3)
Wanted then or earlier . . . . . . . . . . . . . . . . . . . . . . . . . . 2,213 100.0 86.8 (0.6) 10.3 (0.6) 2.9 (0.3)Wanted later . . . . . . . . . . . . . . . . . . . . . . . . . . . . . . . . 1,413 100.0 68.1 (1.1) 24.8 (1.0) 7.1 (0.6)Unwanted . . . . . . . . . . . . . . . . . . . . . . . . . . . . . . . . . . 272 100.0 62.6 (2.2) 25.2 (2.0) 12.2 (1.5)
White . . . . . . . . . . . . . . . . . . . . . . . . . . . . . . . . . . . . 3,033 100.0 81.6 (0.6) 14.3 (0.6) 4.1 (0.3)
Wanted then or earlier . . . . . . . . . . . . . . . . . . . . . . . . . . 1,854 100.0 88.2 (0.7) 9.3 (0.6) 2.5 (0.3)Wanted later . . . . . . . . . . . . . . . . . . . . . . . . . . . . . . . . 1,021 100.0 71.5 (1.4) 22.6 (1.3) 6.0 (0.7)Unwanted . . . . . . . . . . . . . . . . . . . . . . . . . . . . . . . . . . 158 100.0 69.4 (3.5) 20.4 (3.1) *
Black . . . . . . . . . . . . . . . . . . . . . . . . . . . . . . . . . . . . . 667 100.0 62.7 (0.7) 27.5 (0.7) 9.8 (0.4)
Wanted then or earlier . . . . . . . . . . . . . . . . . . . . . . . . . . 231 100.0 75.2 (1.1) 18.9 (1.0) 5.9 (0.6)Wanted later . . . . . . . . . . . . . . . . . . . . . . . . . . . . . . . . 332 100.0 57.1 (1.1) 32.3 (1.0) 10.6 (0.7)Unwanted . . . . . . . . . . . . . . . . . . . . . . . . . . . . . . . . . . 104 100.0 52.2 (1.9) 31.6 (1.8) 16.2 (1.4)
*Does not meet standards of precision and reliability; less than 30 sample cases.1Includes races other than white and black.
15

Table 12. Number and percent distribution of live births by trimester of pregnancy prenatal care began, according to wantedness andmarital status: United States, 1988 National Maternal and Infant Health Survey
Wantedness and marital statusAll births
in thousands Total
Trimester of pregnancy prenatal care began
1st 2d 3d or no care
Number Percent and standard error
All births . . . . . . . . . . . . . . . . . . . . . . . . . . . . . . . . . . . 3,899 100.0 78.3 (0.5) 16.6 (0.5) 5.1 (0.3)
Wanted then or earlier . . . . . . . . . . . . . . . . . . . . . . . . . . 2,213 100.0 86.8 (0.6) 10.3 (0.6) 2.9 (0.3)Wanted later . . . . . . . . . . . . . . . . . . . . . . . . . . . . . . . . 1,413 100.0 68.1 (1.1) 24.8 (1.0) 7.1 (0.6)Unwanted . . . . . . . . . . . . . . . . . . . . . . . . . . . . . . . . . . 272 100.0 62.6 (2.2) 25.2 (2.0) 12.2 (1.5)
Married . . . . . . . . . . . . . . . . . . . . . . . . . . . . . . . . . . . 2,904 100.0 85.1 (0.6) 11.8 (0.5) 3.1 (0.3)
Wanted then or earlier . . . . . . . . . . . . . . . . . . . . . . . . . . 1,919 100.0 89.5 (0.6) 8.3 (0.6) 2.2 (0.3)Wanted later . . . . . . . . . . . . . . . . . . . . . . . . . . . . . . . . 821 100.0 77.2 (1.3) 18.3 (1.2) 4.6 (0.6)Unwanted . . . . . . . . . . . . . . . . . . . . . . . . . . . . . . . . . . 164 100.0 72.7 (3.0) 20.5 (2.7) 6.8 (1.7)
Unmarried . . . . . . . . . . . . . . . . . . . . . . . . . . . . . . . . . . 995 100.0 58.4 (1.3) 30.9 (1.2) 10.8 (0.8)
Wanted then or earlier . . . . . . . . . . . . . . . . . . . . . . . . . . 295 100.0 68.6 (2.4) 24.1 (2.2) 7.3 (1.3)Wanted later . . . . . . . . . . . . . . . . . . . . . . . . . . . . . . . . 591 100.0 55.3 (1.7) 34.0 (1.7) 10.7 (1.0)Unwanted . . . . . . . . . . . . . . . . . . . . . . . . . . . . . . . . . . 109 100.0 47.3 (3.1) 32.3 (2.9) 20.4 (2.6)
16

fontre
noenherve
theor
vel.
AppendixTechnical notes
Computation of percents
Percent distributions are computed using only eventswhich the characteristic is reported. The number of evewith information not stated is subtracted from the total befocomputation of these measures.
Accuracy of reporting
In 1994 month of pregnancy prenatal care began wasreported for 2.3 percent of the births. Information on whprenatal care is initiated is either self-reported by the motor derived from the medical record, both of which may hainaccuracies (16).
rs
t
Tests of significance for the NationalMaternal and Infant Health Survey (NMIHS)
The standard error (SE) may be used to assessstatistical signifance of the difference between two ratespercents. If the difference between two rates (R1-R2) exceeds:
1.96 √SE2R1 + SE2R2
it may be regarded as statistically significant at the 0.05 le
17
Vital and Health Statisticsseries descriptions
SERIES 1. Programs and Collection Procedures —These reportsdescribe the data collection programs of the National Centerfor Health Statistics. They include descriptions of the methodsused to collect and process the data, definitions, and othermaterial necessary for understanding the data.
SERIES 2. Data Evaluation and Methods Research —These reportsare studies of new statistical methods and include analyticaltechniques, objective evaluations of reliability of collecteddata, and contributions to statistical theory. These studies alsoinclude experimental tests of new survey methods andcomparisons of U.S. methodology with those of othercountries.
SERIES 3. Analytical and Epidemiological Studies —These reportspresent analytical or interpretive studies based on vital andhealth statistics. These reports carry the analyses further thanthe expository types of reports in the other series.
SERIES 4. Documents and Committee Reports —These are finalreports of major committees concerned with vital and healthstatistics and documents such as recommended model vitalregistration laws and revised birth and death certificates.
SERIES 5. International Vital and Health Statistics Reports —Thesereports are analytical or descriptive reports that compare U.S.vital and health statistics with those of other countries orpresent other international data of relevance to the healthstatistics system of the United States.
SERIES 6. Cognition and Survey Measurement —These reports arefrom the National Laboratory for Collaborative Research inCognition and Survey Measurement. They use methods ofcognitive science to design, evaluate, and test surveyinstruments.
SERIES 10. Data From the National Health Interview Survey —Thesereports contain statistics on illness; unintentional injuries;disability; use of hospital, medical, and other health services;and a wide range of special current health topics coveringmany aspects of health behaviors, health status, and healthcare utilization. They are based on data collected in acontinuing national household interview survey.
SERIES 11. Data From the National Health Examination Survey, theNational Health and Nutrition Examination Surveys, andthe Hispanic Health and Nutrition Examination Survey —Data from direct examination, testing, and measurement onrepresentative samples of the civilian noninstitutionalizedpopulation provide the basis for (1) medically defined totalprevalence of specific diseases or conditions in the UnitedStates and the distributions of the population with respect tophysical, physiological, and psychological characteristics, and(2) analyses of trends and relationships among variousmeasurements and between survey periods.
SERIES 12. Data From the Institutionalized Population Surveys —Discontinued in 1975. Reports from these surveys areincluded in Series 13.
SERIES 13. Data From the National Health Care Survey —Thesereports contain statistics on health resources and the public’suse of health care resources including ambulatory, hospital,and long-term care services based on data collected directlyfrom health care providers and provider records.
SERIES 14. Data on Health Resources: Manpower and Facilities —Discontinued in 1990. Reports on the numbers, geographicdistribution, and characteristics of health resources are nowincluded in Series 13.
SERIES 15. Data From Special Surveys —These reports containstatistics on health and health-related topics collected inspecial surveys that are not part of the continuing datasystems of the National Center for Health Statistics.
SERIES 16. Compilations of Advance Data From Vital and HealthStatistics —Advance Data Reports provide early release ofinformation from the National Center for Health Statistics’health and demographic surveys. They are compiled in theorder in which they are published. Some of these releasesmay be followed by detailed reports in Series 10–13.
SERIES 20. Data on Mortality —These reports contain statistics onmortality that are not included in regular, annual, or monthlyreports. Special analyses by cause of death, age, otherdemographic variables, and geographic and trend analysesare included.
SERIES 21. Data on Natality, Marriage, and Divorce —These reportscontain statistics on natality, marriage, and divorce that arenot included in regular, annual, or monthly reports. Specialanalyses by health and demographic variables andgeographic and trend analyses are included.
SERIES 22. Data From the National Mortality and Natality Surveys —Discontinued in 1975. Reports from these sample surveys,based on vital records, are now published in Series 20 or 21.
SERIES 23. Data From the National Survey of Family Growth —These reports contain statistics on factors that affect birthrates, including contraception, infertility, cohabitation,marriage, divorce, and remarriage; adoption; use of medicalcare for family planning and infertility; and related maternaland infant health topics. These statistics are based onnational surveys of childbearing age.
SERIES 24. Compilations of Data on Natality, Mortality, Marriage,Divorce, and Induced Terminations of Pregnancy —These include advance reports of births, deaths, marriages,and divorces based on final data from the National VitalStatistics System that were published as supplements to theMonthly Vital Statistics Report (MVSR). These reports providehighlights and summaries of detailed data subsequentlypublished in Vital Statistics of the United States. Othersupplements to the MVSR published here provide selectedfindings based on final data from the National Vital StatisticsSystem and may be followed by detailed reports in Series 20or 21.
For answers to questions about this report or for a list of reports publishedin these series, contact:
Data Dissemination BranchNational Center for Health StatisticsCenters for Disease Control and PreventionPublic Health Service6525 Belcrest Road, Room 1064Hyattsville, MD 20782
(301) 436–8500E-mail: [email protected]: http://www.cdc.gov/nchswww/nchshome.htm

Public Health ServiceCenters for Disease Control and PreventionNational Center for Health Statistics6525 Belcrest RoadHyattsville, Maryland 20782
OFFICIAL BUSINESSPENALTY FOR PRIVATE USE, $300
DHHS Publication No. (PHS) 96-1932, Series 21, No. 546-0394 (7/96)
BULK RATEPOSTAGE & FEES PAID
PHS/NCHSPERMIT NO. G-281
FOLD FOLDSPINE
COVER 4PRINTER: ADJUST SPINE TO FIT
PRINTER:
POSITIVE ART FOR BACK COVER (cover 4): PRINT SOLID PMS
NEGATIVE ART FOR FRONT COVER (cover 1): PRINT SOLID PMS