Embed Size (px)
Citation preview
National Center for Health Statistics Data Presentation Standards for Proportions
Vita
l and
Hea
lth S
tatis
tics
Serie
s 2,
Num
ber
175
A
ugus
t 201
7
Copyright information
All material appearing in this report is in the public domain and may be reproduced or copied without permission; citation as to source, however, is appreciated.
Suggested citation
Parker JD, Talih M, Malec DJ, et al. National Center for Health Statistics Data Presentation Standards for Proportions. National Center for Health Statistics. Vital Health Stat 2(175). 2017.
Library of Congress Cataloging-in-Publication Data
Names: National Center for Health Statistics (U.S.), issuing body. Title: National Center for Health Statistics Data Presentation Standards for Proportions. Other titles: Vital and health statistics. Series 2, Data evaluation and methods research ; no. 175. | DHHS publication ; no. (PHS) 2017-1375. 0276-4733 Description: Hyattsville, Maryland : U.S. Department of Health and Human Services, Centers for Disease Control and Prevention, National Center for Health Statistics, August 2017. | Series: Vital and health statistics. Series 2, Data evaluation and methods research ; number 175 | Series: DHHS pub ; number 2017-1375 | Includes bibliographical references and index. Identifiers: LCCN 2017033531 | ISBN 0840606826 (pbk. : alk. paper) Subjects: | MESH: National Center for Health Statistics (U.S.) | Data
Accuracy | Health Surveys--standards | Data Display--standards | Research Design | Statistics as Topic | United States Classification: LCC RA409 | NLM W2 A N148vb no.175 2017 | DDC 614.4/2--dc23 LC record available at https://lccn.loc.gov/2017033531
For sale by the U.S. Government Printing Office Superintendent of Documents Mail Stop: SSOP Washington, DC 20402–9328 Printed on acid-free paper.
Vital and Health Statistics
Series 2, Number 175
National Center for Health Statistics Data Presentation Standards for Proportions
Data Evaluation and Methods Research
U.S. DEPARTMENT OF HEALTH AND HUMAN SERVICES Centers for Disease Control and Prevention National Center for Health Statistics
Hyattsville, Maryland August 2017 DHHS Publication No. 2017–1375
National Center for Health Statistics Charles J. Rothwell, M.S., M.B.A., Director Jennifer H. Madans, Ph.D., Associate Director for Science
Division of Research and Methodology Charles J. Rothwell, M.S., M.B.A., Acting Director Donald J. Malec, Ph.D., Associate Director for Science
Office of Analysis and Epidemiology Irma E. Arispe, Ph.D., Director Makram Talih, Ph.D., Associate Director for Science
Division of Health and Nutrition Examination Surveys Kathryn S. Porter, M.D., M.S., Director Ryne Paulose-Ram, Ph.D., Associate Director for Science
Division of Health Interview Statistics Marcie L. Cynamon, Director Stephen J. Blumberg, Ph.D., Associate Director for Science
Division of Health Care Statistics Denys T. Lau, Ph.D., Acting Director Alexander Strashny, Ph.D., Associate Director for Science
Division of Vital Statistics Delton Atkinson, M.P.H., M.P.H., P.M.P., Director Hanyu Ni, Ph.D., M.P.H., Associate Director for Science
Contents
Acknowledgments . . . . . . . . . . . . . . . . . . . . . . . . . . . . . . . . . . . . . . . . . . . . . . . . . . . . . . . . . . . iv
Abstract . . . . . . . . . . . . . . . . . . . . . . . . . . . . . . . . . . . . . . . . . . . . . . . . . . . . . . . . . . . . . . . . .1
Introduction . . . . . . . . . . . . . . . . . . . . . . . . . . . . . . . . . . . . . . . . . . . . . . . . . . . . . . . . . . . . . . .1
NCHS Data Presentation Standards for Proportions . . . . . . . . . . . . . . . . . . . . . . . . . . . . . . . . . . . . . . . . . .2 Sample Size. . . . . . . . . . . . . . . . . . . . . . . . . . . . . . . . . . . . . . . . . . . . . . . . . . . . . . . . . . . . . .2 Confidence Intervals . . . . . . . . . . . . . . . . . . . . . . . . . . . . . . . . . . . . . . . . . . . . . . . . . . . . . . . . .3 Degrees of Freedom . . . . . . . . . . . . . . . . . . . . . . . . . . . . . . . . . . . . . . . . . . . . . . . . . . . . . . . . .4 Complementary Proportions . . . . . . . . . . . . . . . . . . . . . . . . . . . . . . . . . . . . . . . . . . . . . . . . . . . . .4
Discussion . . . . . . . . . . . . . . . . . . . . . . . . . . . . . . . . . . . . . . . . . . . . . . . . . . . . . . . . . . . . . . . .5
References . . . . . . . . . . . . . . . . . . . . . . . . . . . . . . . . . . . . . . . . . . . . . . . . . . . . . . . . . . . . . . . .6
Appendix I. Figure. Implementation of NCHS Data Presentation Standards for Proportions . . . . . . . . . . . . . . . . . . . . .7
Appendix II. Examples of the Application of NCHS Data Presentation Standards for Proportions . . . . . . . . . . . . . . . . . .8
Text Table NCHS Data Presentation Standards for Proportions . . . . . . . . . . . . . . . . . . . . . . . . . . . . . . . . . . . . . .2
Appendix Tables I. Percentage of children aged 8–17 years with elevated and normal or borderline blood pressure, by race and
Hispanic origin: United States, 2013–2014 . . . . . . . . . . . . . . . . . . . . . . . . . . . . . . . . . . . . . . . . . . .8 II. Percentage of adults aged 60 and over who are overweight, by sex and race and Hispanic origin:
United States, 2013–2014 . . . . . . . . . . . . . . . . . . . . . . . . . . . . . . . . . . . . . . . . . . . . . . . . . . . .9 III. Percentage of adults aged 18 and over with hearing difficulties, by race and Hispanic origin and
family income: United States, 2013 . . . . . . . . . . . . . . . . . . . . . . . . . . . . . . . . . . . . . . . . . . . . . . 10 IV. Percentage of ambulatory care visits, by setting type according to diagnosis: United States, 2009–2010 . . . . . . . . . . 11 V. Percentage of fathers aged 15–44 with children under age 5 years who live with their children,
by how often they played with their children in the last 4 weeks and father’s age: United States, 2006–2010. . . . . . . . 12 VI. Proportion of triplet and higher-order multiple births, by age and race and Hispanic origin of mother for
mothers aged 15–19 and 40–54: United States, 2015 . . . . . . . . . . . . . . . . . . . . . . . . . . . . . . . . . . . . . 14
iii
Acknowledgments
The authors would like to acknowledge the contribution of Cynthia A. Reuben, NCHS Office of Analysis and Epidemiology and the contributions of the following people who participated in sessions on this topic in 2015 at the Joint Statistical Meetings and the National Center for Health Statistics (NCHS) National Conference on Health Statistics: Michael Davern, NORC at the University of Chicago; Jennifer Madans, NCHS Associate Director for Science; Virginia Lesser, Oregon State University; Ron Jarmin, U.S. Census Bureau; and Arthur Hughes, Substance Abuse and Mental Health Services Administration. This report was edited and produced by the NCHS Office of Information Services, Information Design and Publishing Staff: Jen Hurlburt edited the report, typesetting was done by Erik L. Richardson (contractor), and graphics were produced by Dorothy M. Day.
iv
Abstract
Background The National Center for Health
Statistics (NCHS) disseminates information on a broad range of health topics through diverse publications. These publications must rely on clear and transparent presentation standards that can be broadly and efficiently applied. Standards are particularly important for large, cross-cutting reports where estimates cannot be individually evaluated and indicators of precision cannot be included alongside the estimates.
Objective This report describes the NCHS
Data Presentation Standards for Proportions.
Results The multistep NCHS Data
Presentation Standards for Proportions are based on a minimum denominator sample size and on the absolute and relative widths of a confidence interval calculated using the Clopper-Pearson method. Proportions (usually multiplied by 100 and expressed as percentages) are the most commonly reported estimates in NCHS reports.
Conclusions The NCHS Data Presentation
Standards for Proportions will be applied to all NCHS publications. Using these Standards, some estimates will be identified as unreliable and suppressed and some estimates will be flagged for statistical review. For reports where estimates are evaluated individually, a particular proportion not meeting the NCHS Data Presentation Standards could be identified as unreliable but not be suppressed if it can be interpreted appropriately in the context of subject-specific factors and report objectives.
Keywords: confidence interval • sample size • degrees of freedom • health surveys • vital statistics
National Center for Health Statistics Data Presentation Standards for Proportions by the Data Suppression Workgroup: Jennifer D. Parker, Ph.D., Division of Research and Methodology; Makram Talih, Ph.D., Office of Analysis and Epidemiology; Donald J. Malec, Ph.D., Division of Research and Methodology; Vladislav Beresovsky, Ph.D., Division of Research and Methodology; Margaret Carroll, M.S.P.H., Division of Health and Nutrition Examination Surveys; Joe Fred Gonzalez, Jr., M.S., Division of Research and Methodology; Brady E. Hamilton, Ph.D., Division of Vital Statistics; Deborah D. Ingram, Ph.D., Office of Analysis and Epidemiology; Kenneth Kochanek, M.A., Division of Vital Statistics; Frances McCarty, M.Ed., Ph.D., Division of Research and Methodology; Chris Moriarity, Ph.D., Division of Health Interview Statistics; Iris Shimizu, Ph.D., Division of Research and Methodology; Alexander Strashny, Ph.D., Division of Health Care Statistics; and Brian W. Ward, Ph.D., Division of Health Care Statistics
Introduction
The National Center for Health Statistics (NCHS) collects, analyzes, and disseminates information on a broad range of health topics through diverse publications, databases, and tables. Some data products present information based on a single data system, while others summarize information from many data systems. These reports and data products may include estimates on a wide range of topics or focus on a particular health outcome. Furthermore, data products may include estimates based on data sources outside of NCHS. However, many of these reports do not display supporting information about an estimate to provide the reader with information about the estimate’s reliability, such as its standard error (SE) or confidence interval (CI), due to space and format constraints. As a result, reports must rely on clear and transparent presentation criteria that can be broadly and efficiently implemented.
Statistical standards for data presentation vary across agencies, data systems, and data products (1). Differences among standards can be,
in part, attributed to each data system’s unique features and constraints. Standards also change over time, due to changes in the purpose and scope of the data’s use, the feasibility of users carefully reviewing published estimates, the ability to provide explanatory text discussing the precision of the published estimates, and advances in statistical methodology.
This report describes the NCHS Data Presentation Standards for Proportions. Proportions (usually multiplied by 100 and expressed as percentages) are the most commonly reported estimates in NCHS reports. For many NCHS reports, an automated rule is needed to determine whether or not estimates are sufficiently stable for publication. The multistep NCHS Data Presentation Standards for Proportions are based on a minimum denominator sample size and on criteria based on the absolute and relative widths of a CI calculated using the Clopper-Pearson method (2,3). The next section provides details about the Standards and their implementation. For all NCHS data products, the Standards will be applied and departures from the Standards will be justified. A flow chart
Page 1
Page 2 Series 2, No. 175
describing the Standards and examples of their implementation are provided in the appendices.
NCHS Data Presentation Standards for Proportions
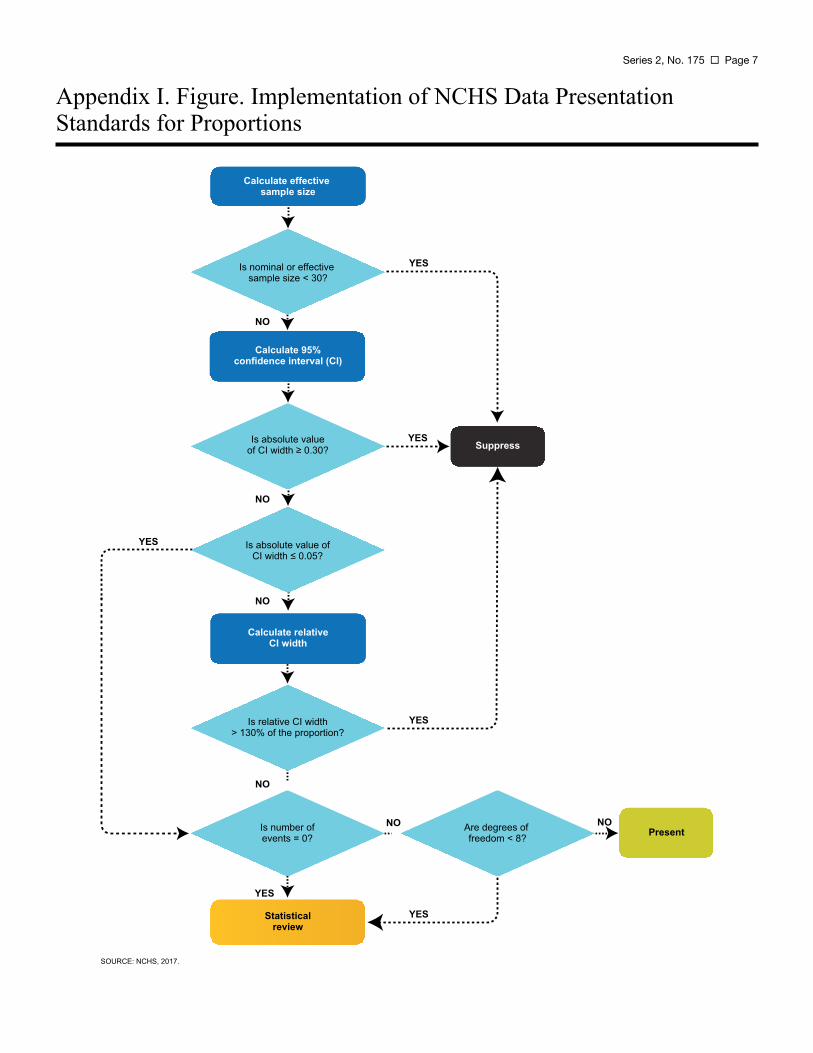
The Table summarizes the NCHS Data Presentation Standards for Proportions, and Appendix I shows the process used to implement the Standards. When applying the NCHS Data Presentation Standards for Proportions, estimates identified as unreliable will be suppressed. Other estimates will be flagged for statistical review by the clearance official. Flagged estimates may be suppressed or presented, depending on the outcome of the review. To ease production of large reports, the decision process for flagged estimates could be automated at the discretion of the clearance official, with the suppression of all flagged estimates. When an estimate is flagged or suppressed, a footnote indicating the reason the estimate has been flagged or suppressed should be provided in the publication.
The NCHS Data Presentation Standards for Proportions will be applied to all NCHS reports and data systems. Importantly, the Standards presented in this report apply to estimates that are known to meet all confidentiality requirements, or in the case of vital statistics, meet all agreements between NCHS and the states. Like other statistical agencies, NCHS may restrict access to certain data or estimates to protect the confidentiality of survey participants (4,5).
Departures from the Standards should be justified. In reports in which estimates are evaluated individually, a particular estimate not meeting the Standards could be identified as unreliable but not be suppressed if it can be interpreted appropriately in the context of subject-specific factors and report objectives. Currently such reports include, but are not limited to, Data Briefs, National Health Statistics Reports, multi-agency reports such as
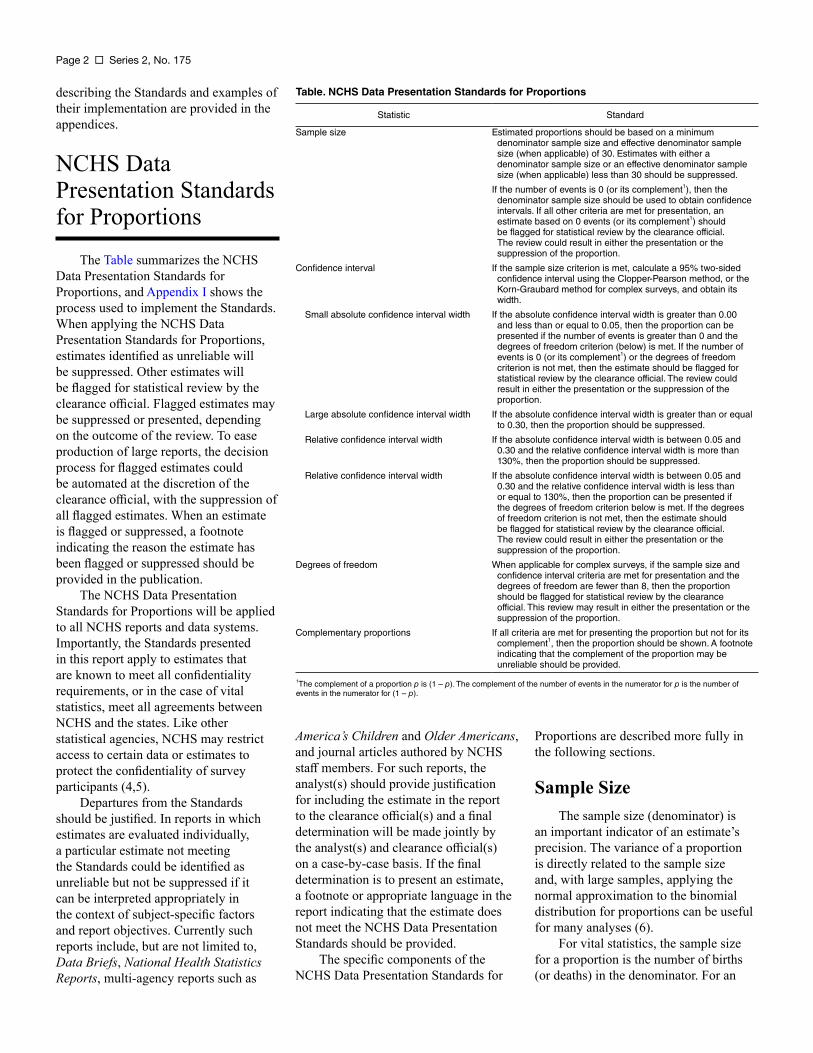
Table. NCHS Data Presentation Standards for Proportions
Statistic Standard
Sample size Estimated proportions should be based on a minimum denominator sample size and effective denominator sample size (when applicable) of 30. Estimates with either a denominator sample size or an effective denominator sample size (when applicable) less than 30 should be suppressed.
If the number of events is 0 (or its complement1), then the denominator sample size should be used to obtain confidence intervals. If all other criteria are met for presentation, an estimate based on 0 events (or its complement1) should be flagged for statistical review by the clearance official. The review could result in either the presentation or the suppression of the proportion.
Confidence interval If the sample size criterion is met, calculate a 95% two-sided confidence interval using the Clopper-Pearson method, or the Korn-Graubard method for complex surveys, and obtain its width.
Small absolute confidence interval width If the absolute confidence interval width is greater than 0.00 and less than or equal to 0.05, then the proportion can be presented if the number of events is greater than 0 and the degrees of freedom criterion (below) is met. If the number of events is 0 (or its complement1) or the degrees of freedom criterion is not met, then the estimate should be flagged for statistical review by the clearance official. The review could result in either the presentation or the suppression of the proportion.
Large absolute confidence interval width If the absolute confidence interval width is greater than or equal to 0.30, then the proportion should be suppressed.
Relative confidence interval width If the absolute confidence interval width is between 0.05 and 0.30 and the relative confidence interval width is more than 130%, then the proportion should be suppressed.
Relative confidence interval width If the absolute confidence interval width is between 0.05 and 0.30 and the relative confidence interval width is less than or equal to 130%, then the proportion can be presented if the degrees of freedom criterion below is met. If the degrees of freedom criterion is not met, then the estimate should be flagged for statistical review by the clearance official. The review could result in either the presentation or the suppression of the proportion.
Degrees of freedom When applicable for complex surveys, if the sample size and confidence interval criteria are met for presentation and the degrees of freedom are fewer than 8, then the proportion should be flagged for statistical review by the clearance official. This review may result in either the presentation or the suppression of the proportion.
Complementary proportions If all criteria are met for presenting the proportion but not for its complement1, then the proportion should be shown. A footnote indicating that the complement of the proportion may be unreliable should be provided.
1The complement of a proportion p is (1 – p). The complement of the number of events in the numerator for p is the number of events in the numerator for (1 – p).
America’s Children and Older Americans, and journal articles authored by NCHS staff members. For such reports, the analyst(s) should provide justification for including the estimate in the report to the clearance official(s) and a final determination will be made jointly by the analyst(s) and clearance official(s) on a case-by-case basis. If the final determination is to present an estimate, a footnote or appropriate language in the report indicating that the estimate does not meet the NCHS Data Presentation Standards should be provided.
The specific components of the NCHS Data Presentation Standards for
Proportions are described more fully in the following sections.
Sample Size The sample size (denominator) is
an important indicator of an estimate’s precision. The variance of a proportion is directly related to the sample size and, with large samples, applying the normal approximation to the binomial distribution for proportions can be useful for many analyses (6).
For vital statistics, the sample size for a proportion is the number of births (or deaths) in the denominator. For an
Series 2, No. 175 Page 3
estimate from a complex survey, the effective sample size, ne, is defined as the sample size, n, divided by the design effect (7). One approach used to calculate ne for estimated proportions from a complex sample survey is:
where, in this case, the design effect is:
Documentation for specific surveys should be consulted when calculating design effects, as approaches can differ among surveys and for specific analytic purposes.
If the number of numerator events is 0 or equal to the denominator (the complement of 0 events), the estimated proportion will be 0 or 1, respectively. As a result, the estimated variance of the proportion will be 0, and the effective sample size will be undefined. In these cases, the sample size should be used to determine whether the minimum sample size criterion is met, and it should also be used for CIs and other computations that include the effective sample size. Because observing no events or events for everyone in a category can provide important information (e.g., in the context of rare health outcomes or conditions), estimates based on 0 events (or the complement) that meet absolute CI and degrees of freedom criteria should be flagged and considered for presentation after statistical review by a clearance official to confirm the validity of the point and interval estimates.
For complex sample surveys, due to sampling design and variability, there may be cases where the effective sample size is greater than the sample size. When the effective sample size is greater than the sample size, the sample size should be used to determine whether the minimum sample size criterion is met, and it should also be used for CIs and other computations that include the effective sample size.
Standard ● Estimated proportions should be based
on a minimum denominator sample size and effective denominator sample size (when applicable) of 30. Estimates with either a denominator sample size or an effective denominator sample size (when applicable) less than 30 should be suppressed.
● If the number of numerator events is 0 (or its complement), then the denominator sample size should be used to obtain confidence intervals. If all other criteria are met for presentation, an estimate based on 0 events (or its complement) should be flagged for statistical review by the clearance official. The review could result in either the presentation or the suppression of the proportion.
Confidence Intervals The NCHS Data Presentation
Standards for Proportions are based on the evaluation of absolute and relative 95% CI widths. CIs provide a way to assess an estimate’s precision, and technical definitions are available in many standard statistical texts, including Bickel and Doksum (8) and Casela and Berger (9). More generally, under repeated sampling, if a proportion and its 95% CI are estimated from each sample, the true value of the proportion is expected to be contained in 95% of the calculated intervals. A handful of methods to calculate CIs for proportions are available and the expectation of 95% coverage may not be attained for some intervals or under some conditions. Methods used to calculate a CI lead to undercoverage if the true proportion is contained in fewer than the expected number of intervals (e.g., less than 95%). Conversely, methods are considered conservative if the true proportion is contained in more than the expected number of intervals.
The Clopper-Pearson CI (2) [adapted for complex surveys by Korn and Graubard (3) when applicable] should be used to determine whether or not the CI of a proportion meets the presentation criteria. For the purposes of setting thresholds for the Standards, the determinations of small and large in the context of absolute
and relative CI widths for estimated proportions are based on the 95% two-sided Clopper-Pearson CI. The Clopper-Pearson CI is known to perform well for estimated proportions with few events in the numerator. For complex sample surveys, the calculation of the Clopper-Pearson CI using the approach of Korn and Graubard incorporates information from the survey design, including the effective sample size and, when appropriate, the degrees of freedom. Finally, the coverage of a 95% Clopper-Pearson CI is generally conservative, meaning that the Clopper-Pearson CI includes the true proportion more than 95% of the time. Other intervals have been shown to have poorer coverage, meaning that a 95% CI includes the true proportion less than 95% of the time (10–12).
In particular, the commonly used Wald CI [p ± 1.96 × SE(p) for a two-sided 95% CI] is known to perform poorly for proportions (10–12). In addition to sometimes producing negative lower bounds for small proportions or upper bounds greater than 1 for large proportions, the Wald CI does not always produce adequate coverage. In other words, published simulation studies demonstrate that the true proportion is contained within a 95% Wald CI in less than 95% of the simulated CIs, with greater undercoverage for smaller and larger proportions.
From a calculated CI, the absolute CI width is obtained by subtracting the value of the lower confidence limit from the value of the upper confidence limit. The relative CI width is calculated as the absolute CI width divided by the proportion and multiplied by 100%. Past practice for many surveys has been to evaluate relative standard errors (RSEs), which are calculated by dividing the SE by the proportion and multiplying by 100%. However, when dividing the SE by very small proportions, the RSE can be too conservative, and when dividing the SE by very large proportions, the RSE can be too liberal. Because the relative CI width is calculated in a similar manner, this property of the RSE also applies to the relative CI width. The NCHS Data Presentation Standards for Proportions rely on both the relative and absolute CI widths to reduce the impact of this property.
Page 4 Series 2, No. 175
For complex sample surveys, default calculations from survey software may not be appropriate or feasible for all situations, including age-adjusted estimates, estimates based on multiple imputation, estimates for subgroups represented in only a subset of primary sampling units (PSUs) (e.g., some racial and ethnic groups and region-specific estimates), and when calculating annual or survey cycle estimates using a multiyear or multicycle data file. In these instances, the relevant information should be extracted and the CIs directly calculated.
Standard ● If the sample size criterion is met,
calculate a 95% two-sided confidence interval using the Clopper-Pearson method (2), or the Korn-Graubard method (3) for complex sample surveys, and obtain the width of the confidence interval. ○ If the absolute confidence
interval width is greater than 0.00 and less than or equal to 0.05, then the proportion can be presented if the number of events is greater than 0 and the degrees of freedom criterion (described in the next section) is met. If the number of events is 0 (or the complement) or the degrees of freedom criterion is not met, then the estimate should be flagged and statistically reviewed by the clearance official. This review may result in either the presentation or the suppression of the proportion.
○ If the absolute confidence interval width is greater than or equal to 0.30, then the proportion should be suppressed.
○ If the absolute confidence interval width is between 0.05 and 0.30 and the relative confidence interval width is more than 130%, then the proportion should be suppressed.
○ If the absolute confidence interval width is between 0.05 and 0.30 and the relative confidence interval width is
less than or equal to 130%, then if the degrees of freedom criterion described in the next section is met, the proportion can be presented. If the degrees of freedom criterion is not met, then the estimate should be flagged and statistically reviewed by the clearance official. This review may result in either the presentation or the suppression of the proportion.
Degrees of Freedom For complex sample surveys, the
precision of the estimated SE is inversely related to the square root of the degrees of freedom. Using SEs with low precision to assess estimated proportions may lead to poor measures of effective sample size and CI widths. Under certain conditions, the variance estimate has an approximate chi-squared distribution, and the RSE of the SE obtained from a complex sample survey can be approximated as
. From this expression, estimated proportions based on fewer than 8 degrees of freedom have an RSE of 50% or higher.
As one rule of thumb, the degrees of freedom can be calculated as the number of PSUs minus the number of strata. This calculation is used in most NCHS surveys and implemented in survey software, although specific calculations can vary across packages. However, default calculations of degrees of freedom from survey software may not be appropriate for subgroups represented in only a subset of PSUs (e.g., some racial and ethnic groups and region-specific estimates) and when calculating annual or survey cycle estimates using a multiyear or multicycle data file. In these instances, the relevant information should be extracted and the degrees of freedom directly calculated to assess estimate precision. The calculation of degrees of freedom as a measure of precision for the SE may not be applicable for all surveys (see survey-specific documentation) and does not apply to vital statistics. For additional information on degrees of freedom, see Korn and Graubard (13) and Valliant and Rust (14).
Standard ● When applicable for complex
surveys, if the sample size and CI criteria are met for presentation and the degrees of freedom are fewer than 8, then the proportion should be flagged for statistical review by the clearance official. This review may result in either the presentation or the suppression of the proportion.
Complementary Proportions
The SE and width of the CI for the complement of a proportion (1 – p) are the same as those for the proportion, p. As described in previous sections, relative measures for the smaller proportion are much larger than for its larger complement. Consequently, there is a range of proportions where the CI criteria will yield conflicting assessments of reliability. For these proportions, the relative CI width may indicate that a small proportion is unreliable but that its complement is not.
For a given health indicator or publication, the larger proportion may be the most salient measure, while for others, the smaller proportion may be the most important. Typically, both proportions are not shown (e.g., only the proportion with health insurance would be shown, not both the proportion with and the proportion without health insurance). Given that the complement of the presented proportion can be determined by subtraction, consideration of the precision of the complement is important. For some publications, the practice has been to suppress both proportions if one of the proportions is identified as unreliable. However, this practice may lead to the suppression of important information.
Standard ● If all criteria are met for presenting
the proportion but not for its complement, then the proportion should be shown. A footnote indicating that the complement of the proportion may be unreliable should be provided.
Discussion
The NCHS Data Presentation Standards for Proportions will be applied to all NCHS publications. Using these Standards, some estimates will be identified as unreliable and suppressed and some estimates will be flagged for statistical review. There are two scenarios where the estimates will be flagged for statistical review by a clearance official: a) when the number of events is 0 (or its complement, equal to the denominator); and b) for estimates from sample surveys with fewer than 8 degrees of freedom. Statistical review by a clearance official of flagged estimates will consider the recommendation of the analyst(s) and factors such as the estimate’s sample size, CI, and degrees of freedom; the report’s objectives and format (including the ability to present CIs or other measures of precision); and the other estimates in the report to determine whether to present or suppress the estimate. In some large reports, this process may be automated to ease the production process, with all flagged estimates suppressed without review.
When the NCHS Data Presentation Standards for Proportions are used for shorter, more focused reports, specific estimates that do not meet the standards may be reported after being evaluated individually by the analyst(s) and clearance official(s). Some estimates identified as unreliable based on the Standards may be important and can be interpreted appropriately in the context of measures of precision and other subject-specific information. In these cases, the estimate could be presented. Because report objectives and subject-specific factors vary widely, justification for presenting an unreliable estimate should be provided by the analyst(s) and final determination should be made by the analyst(s) and clearance official(s) on a case-by-case basis. In all publications, unreliable estimates, whether presented or suppressed, should be identified with a footnote.
Many NCHS data products include SEs so that data users can assess the precision of the point estimates. As stated
previously, measures derived solely from the SE (e.g., Wald CI and RSE) can perform poorly for proportions. Consequently, whenever space permits, appropriate CIs should be provided, rather than just SEs.
Age-adjusted estimates are often produced for national statistics. Age adjustment allows for a comparison of outcomes between two groups with differing age distributions, as many health outcomes are highly correlated with age (15,16). These estimates can be handled in a similar manner as unadjusted estimates. There may be instances in which the age-adjusted estimates will not meet the presentation criteria but the crude estimate would, or vice versa. In these cases, the estimate that meets the presentation criteria will be shown, and the one that does not will be suppressed. If CIs for age-adjusted estimates are not readily obtained from survey software, the relevant information can be extracted and the CIs can be directly calculated.
For the NCHS Data Presentation Standards for Proportions, there is no minimum number of events (i.e., numerator size). For the calculation of the Clopper-Pearson CI, a minimum numerator is not needed. A numerator with few events may provide useful information for some purposes. Although observing no events (or its complement, observing events for all records in the category) can provide important information (e.g., in the context of subgroup-specific analyses of rare [or prevalent] health outcomes), an estimate based on 0 events (or its complement) should be flagged for statistical review to confirm the validity of the point and interval estimates. In addition, inferences based on the normal approximation, including statistical comparisons of proportions between subgroups, require a minimum number of events. Finally, some estimates based on restricted data or vital statistics may require a minimum number of events to decrease disclosure risks, and reporting of these estimates may be based on different criteria (e.g., confidentiality).
Although most estimates produced in NCHS reports are proportions, other estimates, such as rates, percentiles, and
Series 2, No. 175 Page 5
means are also regularly reported. Death rates, for example, are calculated as the number of events reported in a calendar year divided by the corresponding census population estimate at the midpoint of the calendar year. The NCHS Standards were not developed to apply to these estimators. Although the principles considered by the workgroup for proportions can be considered for other estimators, including the evaluation of effective sample size and CIs to guide decisions, no specific thresholds for these estimators are provided by these Standards. Rates calculated from vital statistics will continue to use the criterion of requiring 20 or more events for reporting. In addition to precision, there are other statistical issues, not addressed here, that affect the quality of the estimates, including measurement error and survey nonresponse (17).
The NCHS Data Presentation Standards for Proportions can be considered in planning analytic studies or table shells for reports. Collapsing subgroups and aggregating years leads to estimates with less uncertainty and might be more appropriate for a specific report than disaggregated estimates, even when minimum presentation guidelines are met. Other items to be considered may include the intended use of the estimate, the amount and structure of supporting information about uncertainty that can be conveyed, and the availability of corresponding estimates for other subgroups or other time periods.
References
1. Klein RJ, Proctor SE, Boudreault MA, Turczyn KM. Healthy People 2010 criteria for data suppression. Statistical Notes, no 24. Hyattsville, MD: National Center for Health Statistics. 2002.
2. Clopper CJ, Pearson ES. The use of confidence or fiducial limits illustrated in the case of the binomial. Biometrika 26(4):404–13. 1934.
Page 6 Series 2, No. 175
3. Korn EL, Graubard BI. Confidence intervals for proportions with small expected number of positive counts estimated from survey data. Surv Methodol 24(2):193–201. 1998.
4. National Center for Health Statistics. NCHS staff manual on confidentiality. Available from: https://www.cdc.gov/nchs/data/misc/ staffmanual2004.pdf.
5. National Center for Health Statistics Research Data Center. Disclosure manual: Preventing disclosure: Rules for researchers. Available from: https://www.cdc.gov/rdc/data/ b4/disclosuremanual.pdf.
6. Johnson NL, Kotz S, Kemp AW. Univariate discrete distributions. 2nd edition. New York: John Wiley & Sons, Inc. 114. 1992.
7. Kish L. Survey sampling. New York: John Wiley & Sons, Inc. 1965.
8. Bickel PJ, Doksum KA. Mathematical statistics: Basic ideas and selected topics, Volume 1, Second Edition. Chapman & Hall/ CRC. 2015.
9. Casella G, Berger RL. Statistical inference. 2nd edition. Cengage Learning. 2001.
10. Dean N, Pagano M. Evaluating confidence interval methods for binomial proportions in clustered surveys. J Surv Stat Methodol 3(4):484–503. 2015.
11. Brown LD, Cai TT, Dasgupta A. Interval estimation for a binomial proportion. Stat Sci 16(2):101–17. 2001.
12. Newcombe RG. Two-sided confidence intervals for the single proportion: Comparison of seven methods. Stat Med 17(8):857–72. 1998.
13. Korn EL, Graubard BI. Chapter 5: Additional issues in variance estimation. In: Korn EL, Graubard BI. Analysis of health surveys. New York, NY: John Wiley & Sons, Inc. 192–234. 1999.
14. Valliant R, Rust KF. Degrees of freedom approximations and rulesof-thumb. J Off Stat 26(4):585–602. 2010.
15. Anderson RN, Rosenberg HM. Age standardization of death rates: Implementation of the year 2000 standard. National vital statistics reports; vol 47 no 3. Hyattsville, MD: National Center for Health Statistics. 1998.
16. National Center for Health Statistics. Health, United States, 2015: With special feature on racial and ethnic health disparities. Hyattsville, MD. 2016. Available from: https://www. cdc.gov/nchs/data/hus/hus15.pdf.
17. Groves RM, Fowler Jr FJ, Couper MP, Lepkowski JM, Singer E, Tourangeau R. Survey methodology. Hoboken, NJ: John Wiley & Sons. 2004.
18. National Center for Health Statistics. National Health and Nutrition Examination Survey. Available from: https://www.cdc.gov/nchs/ nhanes.htm.
19. National Center for Health Statistics. National Health Interview Survey. Available from: https://www.cdc. gov/nchs/nhis.htm.
20. Parsons VL, Moriarity C, Jonas K, et al. Design and estimation for the National Health Interview Survey, 2006–2015. National Center for Health Statistics. Vital Health Stat 2(165). 2014.
21. National Center for Health Statistics. Health, United States, 2014: With special feature on adults aged 55–64. Hyattsville, MD. 2015. Available from: https://www.cdc.gov/nchs/ data/hus/hus14.pdf.
22. National Center for Health Statistics. National Ambulatory Medical Care Survey. Available from: https://www.cdc.gov/nchs/ahcd/ about_ahcd.htm#NAMCSNAMCES.
23. National Center for Health Statistics. National Ambulatory Medical Care Survey: 2012 state and national summary tables. Available from: https://www.cdc.gov/nchs/data/ahcd/ namcs_summary/2012_namcs_web_ tables.pdf.
24. National Center for Health Statistics. National Survey of Family Growth. Available from: https://www.cdc. gov/nchs/nsfg.htm.
25. Jones J, Mosher WD. Fathers’ involvement with their children: United States, 2006–2010. National health statistics reports; no 71. Hyattsville, MD: National Center for Health Statistics. 2013.
26. National Center for Health Statistics. The public use natality file—2015 update. 2016. Available from: ftp:// ftp.cdc.gov/pub/Health_Statistics/ NCHS/Dataset_Documentation/ DVS/natality/UserGuide2015.pdf.
27. Martin JA, Hamilton BE, Osterman MJK, et al. Births: Final data for 2015. National vital statistics reports; vol 66 no 1. Hyattsville, MD: National Center for Health Statistics. 2017. Available from: https://www.cdc.gov/nchs/data/nvsr/ nvsr66/nvsr66_01.pdf.
Series 2, No. 175 Page 7
Appendix I. Figure. Implementation of NCHS Data Presentation Standards for Proportions
Calculate effective sample size
Is nominal or effective sample size < 30?
Is absolute value of CI width ≥ 0.30?
Is absolute value of CI width ≤ 0.05?
Is number of events = 0?
Statistical review
Are degrees of freedom < 8?
Calculate 95% confidence interval (CI)
Calculate relative CI width
Suppress
Present
YES
YES
YES
YES
NO
NO
NO
NO
NO NO
YES
YES
Is relative CI width > 130% of the proportion?
SOURCE: NCHS, 2017.
Page 8 Series 2, No. 175
Appendix II. Examples of the Application of NCHS Data Presentation Standards for Proportions
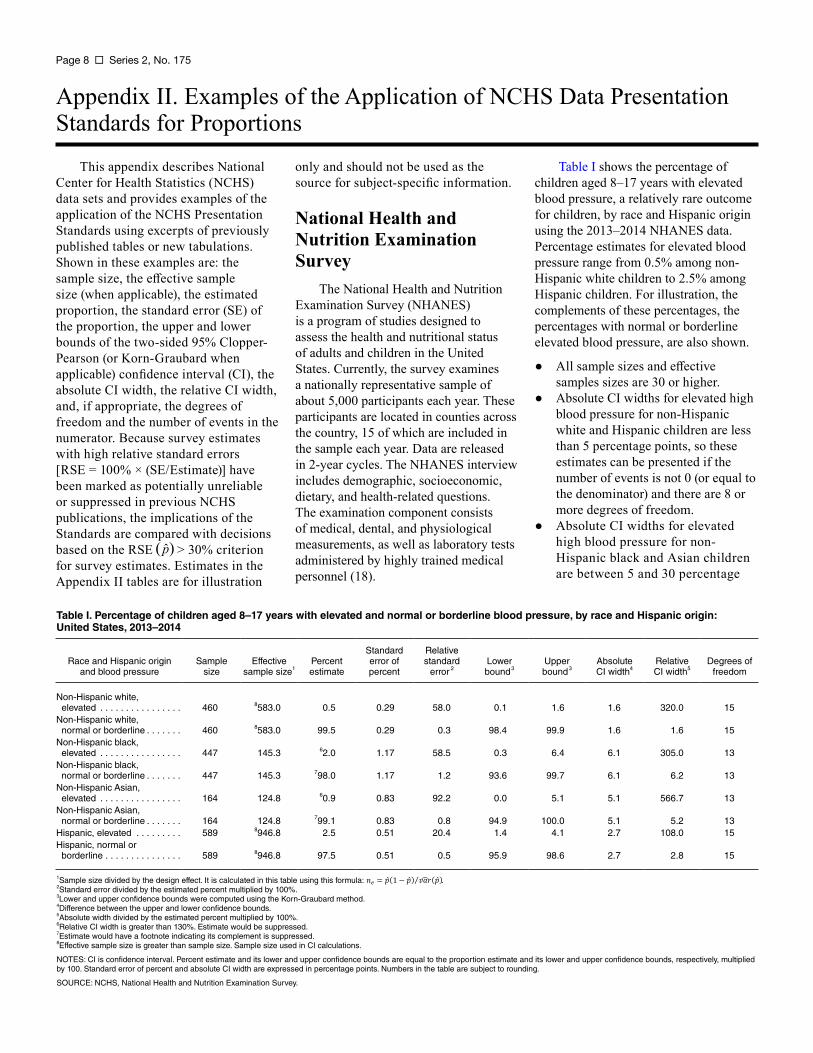
This appendix describes National Center for Health Statistics (NCHS) data sets and provides examples of the application of the NCHS Presentation Standards using excerpts of previously published tables or new tabulations. Shown in these examples are: the sample size, the effective sample size (when applicable), the estimated proportion, the standard error (SE) of the proportion, the upper and lower bounds of the two-sided 95% Clopper-Pearson (or Korn-Graubard when applicable) confidence interval (CI), the absolute CI width, the relative CI width, and, if appropriate, the degrees of freedom and the number of events in the numerator. Because survey estimates with high relative standard errors [RSE = 100% × (SE/Estimate)] have been marked as potentially unreliable or suppressed in previous NCHS publications, the implications of the Standards are compared with decisions based on the RSE > 30% criterion for survey estimates. Estimates in the Appendix II tables are for illustration
only and should not be used as the source for subject-specific information.
National Health and Nutrition Examination Survey
The National Health and Nutrition Examination Survey (NHANES) is a program of studies designed to assess the health and nutritional status of adults and children in the United States. Currently, the survey examines a nationally representative sample of about 5,000 participants each year. These participants are located in counties across the country, 15 of which are included in the sample each year. Data are released in 2-year cycles. The NHANES interview includes demographic, socioeconomic, dietary, and health-related questions. The examination component consists of medical, dental, and physiological measurements, as well as laboratory tests administered by highly trained medical personnel (18).
Table I shows the percentage of children aged 8–17 years with elevated blood pressure, a relatively rare outcome for children, by race and Hispanic origin using the 2013–2014 NHANES data. Percentage estimates for elevated blood pressure range from 0.5% among non-Hispanic white children to 2.5% among Hispanic children. For illustration, the complements of these percentages, the percentages with normal or borderline elevated blood pressure, are also shown.
● All sample sizes and effective samples sizes are 30 or higher.
● Absolute CI widths for elevated high blood pressure for non-Hispanic white and Hispanic children are less than 5 percentage points, so these estimates can be presented if the number of events is not 0 (or equal to the denominator) and there are 8 or more degrees of freedom.
● Absolute CI widths for elevated high blood pressure for non-Hispanic black and Asian children are between 5 and 30 percentage
Table I. Percentage of children aged 8–17 years with elevated and normal or borderline blood pressure, by race and Hispanic origin: United States, 2013–2014
Standard Relative Race and Hispanic origin
and blood pressure Sample
size Effective
sample size1 Percent estimate
error of percent
standard error 2
Lower bound3
Upper bound3
Absolute CI width4
Relative CI width5
Degrees of freedom
Non-Hispanic white, elevated . . . . . . . . . . . . . . . . 460 8583.0 0.5 0.29 58.0 0.1 1.6 1.6 320.0 15
Non-Hispanic white, normal or borderline . . . . . . . 460 8583.0 99.5 0.29 0.3 98.4 99.9 1.6 1.6 15
Non-Hispanic black, elevated . . . . . . . . . . . . . . . . 447 145.3 62.0 1.17 58.5 0.3 6.4 6.1 305.0 13
Non-Hispanic black, normal or borderline . . . . . . . 447 145.3 798.0 1.17 1.2 93.6 99.7 6.1 6.2 13
Non-Hispanic Asian, elevated . . . . . . . . . . . . . . . . 164 124.8 60.9 0.83 92.2 0.0 5.1 5.1 566.7 13
Non-Hispanic Asian, normal or borderline . . . . . . . 164 124.8 799.1 0.83 0.8 94.9 100.0 5.1 5.2 13
Hispanic, elevated . . . . . . . . . 589 8946.8 2.5 0.51 20.4 1.4 4.1 2.7 108.0 15 Hispanic, normal or
borderline . . . . . . . . . . . . . . . 589 8946.8 97.5 0.51 0.5 95.9 98.6 2.7 2.8 15
1Sample size divided by the design effect. It is calculated in this table using this formula: 2Standard error divided by the estimated percent multiplied by 100%. 3Lower and upper confidence bounds were computed using the Korn-Graubard method. 4Difference between the upper and lower confidence bounds. 5Absolute width divided by the estimated percent multiplied by 100%. 6Relative CI width is greater than 130%. Estimate would be suppressed. 7Estimate would have a footnote indicating its complement is suppressed. 8Effective sample size is greater than sample size. Sample size used in CI calculations.
.
NOTES: CI is confidence interval. Percent estimate and its lower and upper confidence bounds are equal to the proportion estimate and its lower and upper confidence bounds, respectively, multiplied by 100. Standard error of percent and absolute CI width are expressed in percentage points. Numbers in the table are subject to rounding.
SOURCE: NCHS, National Health and Nutrition Examination Survey.
Series 2, No. 175 Page 9
points, so the relative CI width should be examined.
● Relative CI widths for elevated high blood pressure for non-Hispanic black and non-Hispanic Asian children are greater than 130%, so these estimates would be suppressed.
● The number of events is greater than 0 (and not equal to the denominator) and there are more than 8 degrees of freedom for all estimates, so estimates that have met all other sample size and CI criteria would be presented.
● If the outcome of interest is the complement (normal or borderline high blood pressure), the absolute CI widths are the same. However, the relative CI widths for non-Hispanic black and non-Hispanic Asian children are less than 130%, so these estimates would be presented with a note indicating that their complements do not meet presentation standards.
● Estimates of elevated blood pressure for non-Hispanic white children would be presented using the NCHS Data Presentation Standards for Proportions but would have been suppressed or identified as unreliable based on the RSE > 30% criterion.
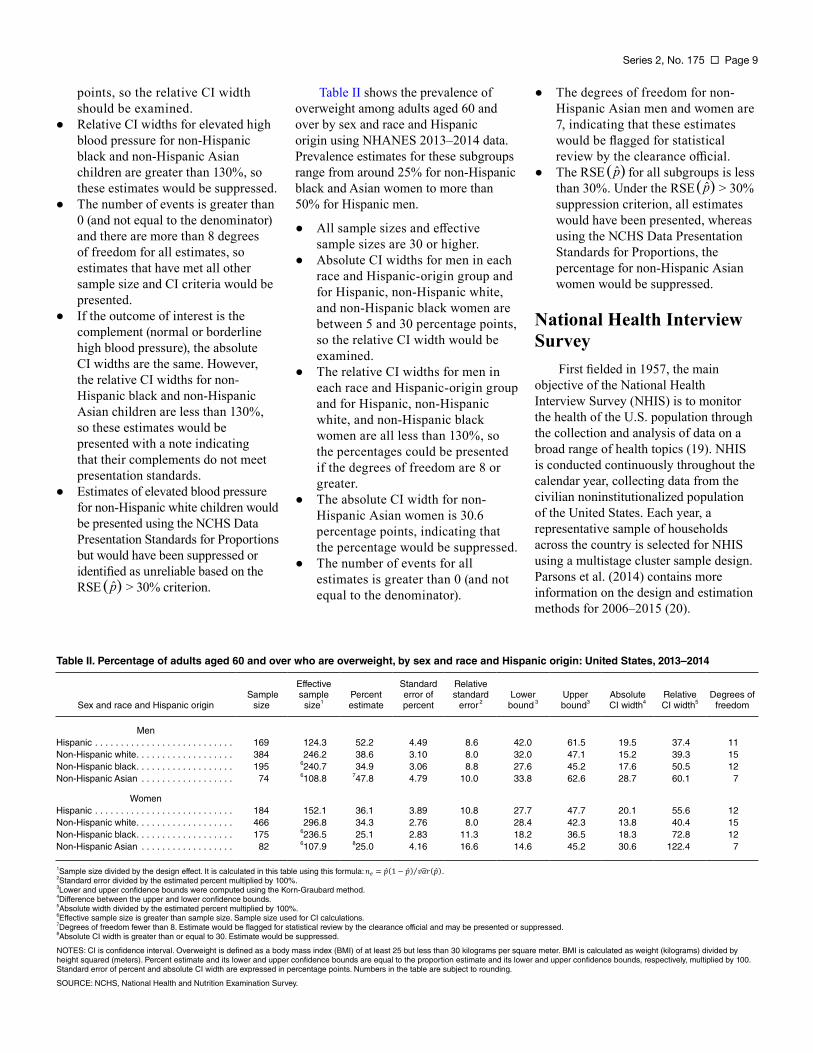
Table II shows the prevalence of overweight among adults aged 60 and over by sex and race and Hispanic origin using NHANES 2013–2014 data. Prevalence estimates for these subgroups range from around 25% for non-Hispanic black and Asian women to more than 50% for Hispanic men.
● All sample sizes and effective sample sizes are 30 or higher.
● Absolute CI widths for men in each race and Hispanic-origin group and for Hispanic, non-Hispanic white, and non-Hispanic black women are between 5 and 30 percentage points, so the relative CI width would be examined.
● The relative CI widths for men in each race and Hispanic-origin group and for Hispanic, non-Hispanic white, and non-Hispanic black women are all less than 130%, so the percentages could be presented if the degrees of freedom are 8 or greater.
● The absolute CI width for non-Hispanic Asian women is 30.6 percentage points, indicating that the percentage would be suppressed.
● The number of events for all estimates is greater than 0 (and not equal to the denominator).
● The degrees of freedom for non-Hispanic Asian men and women are 7, indicating that these estimates would be flagged for statistical review by the clearance official.
● The RSE for all subgroups is less than 30%. Under the RSE > 30% suppression criterion, all estimates would have been presented, whereas using the NCHS Data Presentation Standards for Proportions, the percentage for non-Hispanic Asian women would be suppressed.
National Health Interview Survey
First fielded in 1957, the main objective of the National Health Interview Survey (NHIS) is to monitor the health of the U.S. population through the collection and analysis of data on a broad range of health topics (19). NHIS is conducted continuously throughout the calendar year, collecting data from the civilian noninstitutionalized population of the United States. Each year, a representative sample of households across the country is selected for NHIS using a multistage cluster sample design. Parsons et al. (2014) contains more information on the design and estimation methods for 2006–2015 (20).
Table II. Percentage of adults aged 60 and over who are overweight, by sex and race and Hispanic origin: United States, 2013–2014
Effective Standard Relative
Sex and race and Hispanic origin Sample
size sample
size1 Percent estimate
error of percent
standard error 2
Lower bound 3
Upper bound3
Absolute CI width4
Relative CI width5
Degrees of freedom
Men Hispanic . . . . . . . . . . . . . . . . . . . . . . . . . . . 169 124.3 52.2 4.49 8.6 42.0 61.5 19.5 37.4 11 Non-Hispanic white. . . . . . . . . . . . . . . . . . . 384 246.2 38.6 3.10 8.0 32.0 47.1 15.2 39.3 15 Non-Hispanic black. . . . . . . . . . . . . . . . . . . 195 6240.7 34.9 3.06 8.8 27.6 45.2 17.6 50.5 12 Non-Hispanic Asian . . . . . . . . . . . . . . . . . . 74 6108.8 747.8 4.79 10.0 33.8 62.6 28.7 60.1 7
Women Hispanic . . . . . . . . . . . . . . . . . . . . . . . . . . . 184 152.1 36.1 3.89 10.8 27.7 47.7 20.1 55.6 12 Non-Hispanic white. . . . . . . . . . . . . . . . . . . 466 296.8 34.3 2.76 8.0 28.4 42.3 13.8 40.4 15 Non-Hispanic black. . . . . . . . . . . . . . . . . . . 175 6236.5 25.1 2.83 11.3 18.2 36.5 18.3 72.8 12 Non-Hispanic Asian . . . . . . . . . . . . . . . . . . 82 6107.9 825.0 4.16 16.6 14.6 45.2 30.6 122.4 7
1Sample size divided by the design effect. It is calculated in this table using this formula: . 2Standard error divided by the estimated percent multiplied by 100%. 3Lower and upper confidence bounds were computed using the Korn-Graubard method. 4Difference between the upper and lower confidence bounds. 5Absolute width divided by the estimated percent multiplied by 100%. 6Effective sample size is greater than sample size. Sample size used for CI calculations. 7Degrees of freedom fewer than 8. Estimate would be flagged for statistical review by the clearance official and may be presented or suppressed. 8Absolute CI width is greater than or equal to 30. Estimate would be suppressed.
NOTES: CI is confidence interval. Overweight is defined as a body mass index (BMI) of at least 25 but less than 30 kilograms per square meter. BMI is calculated as weight (kilograms) divided by height squared (meters). Percent estimate and its lower and upper confidence bounds are equal to the proportion estimate and its lower and upper confidence bounds, respectively, multiplied by 100. Standard error of percent and absolute CI width are expressed in percentage points. Numbers in the table are subject to rounding.
SOURCE: NCHS, National Health and Nutrition Examination Survey.

Page 10 Series 2, No. 175
Table III illustrates the application of the presentation standards using an excerpt of data from the 2013 NHIS, showing hearing difficulty among adults by race and Hispanic origin and family income relative to the federal poverty level (FPL). Percentage estimates range from 0.47% among non-Hispanic black adults with incomes 400% of the FPL and higher to 3.2% among non-Hispanic white adults with incomes below the FPL. NHIS guidelines do not recommend calculating degrees of freedom using variance units available on the data file (https://www.cdc.gov/nchs/data/ nhis/2006var.pdf). For national estimates, the degrees of freedom are assumed to be large enough for a normal approximation. Table III is based on Table 49 in Health, United States, 2014 (21).
● All sample sizes and effective sample sizes are 30 or higher.
● All absolute CI widths are less than 5 percentage points, so all percentages should be presented if the number of events is greater than 0 (and not equal to the denominator).
● The numbers of events are all greater than 0 (and not equal to the
denominator), so percentages that meet all other sample size and CI criteria for presentation would be presented.
● The RSE for several subgroups, including Hispanic adults with incomes below the FPL, 200%–399% of the FPL, and 400% of the FPL or higher and non-Hispanic black adults with incomes 200%–399% of the FPL and 400% of the FPL or higher is greater than 30%. Percentages for these subgroups would have been suppressed or identified as unreliable using the RSE > 30% criterion but would be presented using the NCHS Data Presentation Standards for Proportions.
National Ambulatory Medical Care Survey and National Hospital Ambulatory Medical Care Survey
The National Ambulatory Medical Care Survey (NAMCS) is an annual, nationally representative survey of visits to nonfederal office-based physicians (excluding pathologists,
anesthesiologists, and radiologists) and to community health centers. The sampling frames for physicians are constructed from the master files of the American Medical Association and the American Osteopathic Association; the sampling frames for community health centers are obtained from the federal Health Resources and Services Administration and the Indian Health Service. NAMCS data were collected on approximately 32,000 and 31,000 visits to office-based physician practices in samples of geographic primary sampling units (PSUs) in 2009 and 2010, respectively.
The National Hospital Ambulatory Medical Care Survey (NHAMCS) is a nationally representative survey of nonfederal general and short-stay hospitals that is conducted annually. NHAMCS uses a multistage probability design with samples of geographic PSUs, hospitals within PSUs, and patient visits within emergency and outpatient departments. NHAMCS data were collected on approximately 35,000 emergency department visits in both 2009 and 2010 and on approximately 34,000 and 35,000 outpatient department visits in 2009 and 2010, respectively.
Table III. Percentage of adults aged 18 and over with hearing difficulties, by race and Hispanic origin and family income: United States, 2013
Effective Standard Relative Race and Hispanic origin and
family income (percentage of FPL) Sample
size sample
size1 Percent estimate
error of percent
standard error 2
Lower bound3
Upper bound3
Absolute CI width4
Relative CI width5
Hispanic
Under 100% . . . . . . . . . . . . . . . . . . . . . 1,675 559.3 1.43 0.50 35.2 0.62 2.79 2.18 152.7 100%–199% . . . . . . . . . . . . . . . . . . . . . 1,744 1,061.7 1.55 0.38 24.4 0.90 2.49 1.59 102.6 200%–399% . . . . . . . . . . . . . . . . . . . . . 1,621 586.8 1.10 0.43 39.1 0.42 2.32 1.90 172.0 400% and higher . . . . . . . . . . . . . . . . . 903 516.1 0.80 0.39 49.1 0.22 2.00 1.78 223.6
Non-Hispanic white
Under 100% . . . . . . . . . . . . . . . . . . . . . 2,468 1,514.3 3.21 0.45 14.1 2.38 4.22 1.85 57.5 100%–199% . . . . . . . . . . . . . . . . . . . . . 3,650 3,167.7 2.86 0.30 10.3 2.31 3.51 1.19 41.7 200%–399% . . . . . . . . . . . . . . . . . . . . . 6,419 4,713.9 2.36 0.22 9.4 1.95 2.84 0.89 37.7 400% and higher . . . . . . . . . . . . . . . . . 8,020 4,909.4 1.78 0.19 10.5 1.43 2.19 0.76 42.7
Non-Hispanic black
Under 100% . . . . . . . . . . . . . . . . . . . . . 1,470 912.8 1.36 0.38 28.2 0.72 2.35 1.63 119.6 100%–199% . . . . . . . . . . . . . . . . . . . . . 1,367 61,421.8 1.11 0.28 25.0 0.63 1.83 1.20 107.4 200%–399% . . . . . . . . . . . . . . . . . . . . . 1,375 1,143.7 0.71 0.25 35.0 0.31 1.38 1.08 152.2 400% and higher . . . . . . . . . . . . . . . . . 940 61,301.5 0.47 0.19 40.3 0.14 1.15 1.01 214.9
1Sample size divided by the design effect. It is calculated in this table using this formula: . 2Standard error divided by the estimated percent multiplied by 100%. 3Lower and upper confidence bounds were computed using the Korn-Graubard method. 4Difference between the upper and lower confidence bounds. 5Absolute width divided by the estimated percent multiplied by 100%. 6Effective sample size is greater than the sample size. Sample size is used in CI calculations.
NOTES: FPL is federal poverty level. CI is confidence interval. Percent estimate and its lower and upper confidence bounds are equal to the proportion estimate and its lower and upper confidence bounds, respectively, multiplied by 100. Standard error of percent and absolute CI width are expressed in percentage points. This table is based on Health, United States, 2014 Table 49. Numbers in the table are subject to rounding.
SOURCE: NCHS, National Health Interview Survey.
Series 2, No. 175 Page 11
More details about the designs of NAMCS and NHAMCS are available elsewhere (22,23).
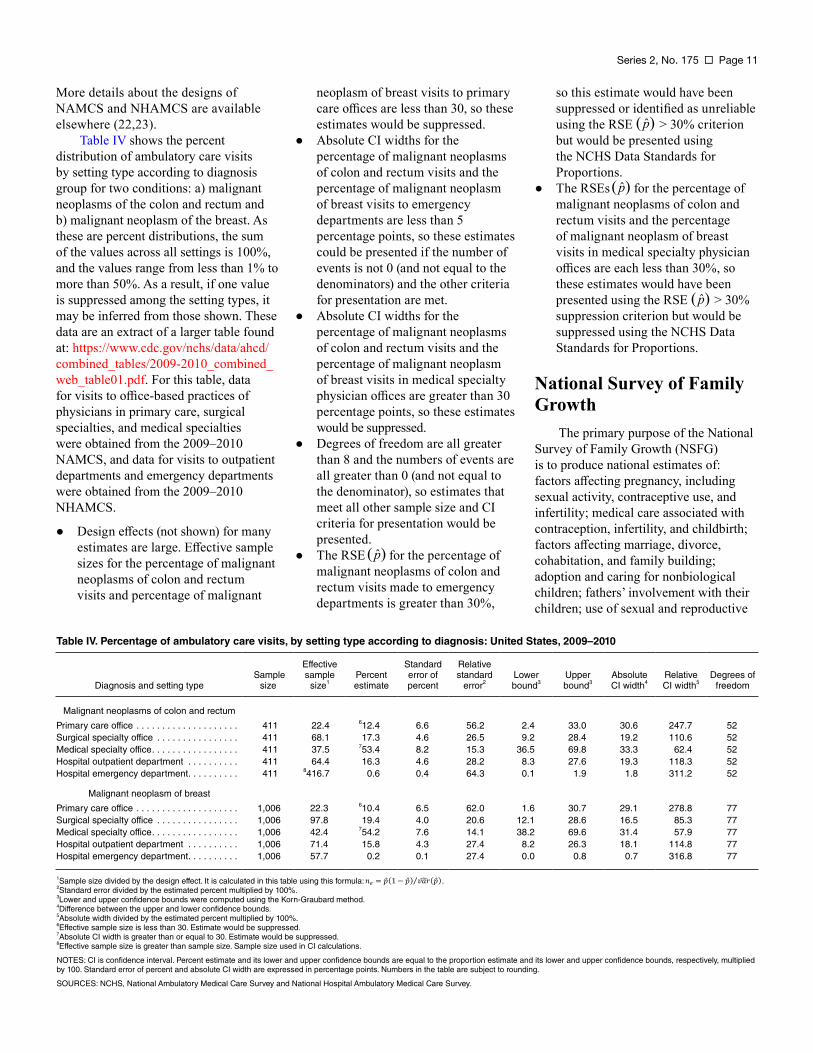
Table IV shows the percent distribution of ambulatory care visits by setting type according to diagnosis group for two conditions: a) malignant neoplasms of the colon and rectum and b) malignant neoplasm of the breast. As these are percent distributions, the sum of the values across all settings is 100%, and the values range from less than 1% to more than 50%. As a result, if one value is suppressed among the setting types, it may be inferred from those shown. These data are an extract of a larger table found at: https://www.cdc.gov/nchs/data/ahcd/ combined_tables/2009-2010_combined_ web_table01.pdf. For this table, data for visits to office-based practices of physicians in primary care, surgical specialties, and medical specialties were obtained from the 2009–2010 NAMCS, and data for visits to outpatient departments and emergency departments were obtained from the 2009–2010 NHAMCS.
● Design effects (not shown) for many estimates are large. Effective sample sizes for the percentage of malignant neoplasms of colon and rectum visits and percentage of malignant
neoplasm of breast visits to primary care offices are less than 30, so these estimates would be suppressed.
● Absolute CI widths for the percentage of malignant neoplasms of colon and rectum visits and the percentage of malignant neoplasm of breast visits to emergency departments are less than 5 percentage points, so these estimates could be presented if the number of events is not 0 (and not equal to the denominators) and the other criteria for presentation are met.
● Absolute CI widths for the percentage of malignant neoplasms of colon and rectum visits and the percentage of malignant neoplasm of breast visits in medical specialty physician offices are greater than 30 percentage points, so these estimates would be suppressed.
● Degrees of freedom are all greater than 8 and the numbers of events are all greater than 0 (and not equal to the denominator), so estimates that meet all other sample size and CI criteria for presentation would be presented.
● The RSE for the percentage of malignant neoplasms of colon and rectum visits made to emergency departments is greater than 30%,
so this estimate would have been suppressed or identified as unreliable using the RSE > 30% criterion but would be presented using the NCHS Data Standards for Proportions.
● The RSEs for the percentage of malignant neoplasms of colon and rectum visits and the percentage of malignant neoplasm of breast visits in medical specialty physician offices are each less than 30%, so these estimates would have been presented using the RSE > 30% suppression criterion but would be suppressed using the NCHS Data Standards for Proportions.
National Survey of Family Growth
The primary purpose of the National Survey of Family Growth (NSFG) is to produce national estimates of: factors affecting pregnancy, including sexual activity, contraceptive use, and infertility; medical care associated with contraception, infertility, and childbirth; factors affecting marriage, divorce, cohabitation, and family building; adoption and caring for nonbiological children; fathers’ involvement with their children; use of sexual and reproductive
Table IV. Percentage of ambulatory care visits, by setting type according to diagnosis: United States, 2009–2010
Effective Standard Relative
Diagnosis and setting type Sample
size sample
size1 Percent estimate
error of percent
standard error 2
Lower bound3
Upper bound3
Absolute CI width4
Relative CI width5
Degrees of freedom
Malignant neoplasms of colon and rectum
Primary care office . . . . . . . . . . . . . . . . . . . . 411 22.4 612.4 6.6 56.2 2.4 33.0 30.6 247.7 52 Surgical specialty office . . . . . . . . . . . . . . . . 411 68.1 17.3 4.6 26.5 9.2 28.4 19.2 110.6 52 Medical specialty office. . . . . . . . . . . . . . . . . 411 37.5 753.4 8.2 15.3 36.5 69.8 33.3 62.4 52 Hospital outpatient department . . . . . . . . . . 411 64.4 16.3 4.6 28.2 8.3 27.6 19.3 118.3 52 Hospital emergency department. . . . . . . . . . 411 8416.7 0.6 0.4 64.3 0.1 1.9 1.8 311.2 52
Malignant neoplasm of breast
Primary care office . . . . . . . . . . . . . . . . . . . . 1,006 22.3 610.4 6.5 62.0 1.6 30.7 29.1 278.8 77 Surgical specialty office . . . . . . . . . . . . . . . . 1,006 97.8 19.4 4.0 20.6 12.1 28.6 16.5 85.3 77 Medical specialty office. . . . . . . . . . . . . . . . . 1,006 42.4 754.2 7.6 14.1 38.2 69.6 31.4 57.9 77 Hospital outpatient department . . . . . . . . . . 1,006 71.4 15.8 4.3 27.4 8.2 26.3 18.1 114.8 77 Hospital emergency department. . . . . . . . . . 1,006 57.7 0.2 0.1 27.4 0.0 0.8 0.7 316.8 77
1Sample size divided by the design effect. It is calculated in this table using this formula: . 2Standard error divided by the estimated percent multiplied by 100%. 3Lower and upper confidence bounds were computed using the Korn-Graubard method. 4Difference between the upper and lower confidence bounds. 5Absolute width divided by the estimated percent multiplied by 100%. 6Effective sample size is less than 30. Estimate would be suppressed. 7Absolute CI width is greater than or equal to 30. Estimate would be suppressed. 8Effective sample size is greater than sample size. Sample size used in CI calculations.
NOTES: CI is confidence interval. Percent estimate and its lower and upper confidence bounds are equal to the proportion estimate and its lower and upper confidence bounds, respectively, multiplied by 100. Standard error of percent and absolute CI width are expressed in percentage points. Numbers in the table are subject to rounding.
SOURCES: NCHS, National Ambulatory Medical Care Survey and National Hospital Ambulatory Medical Care Survey.
Page 12 Series 2, No. 175
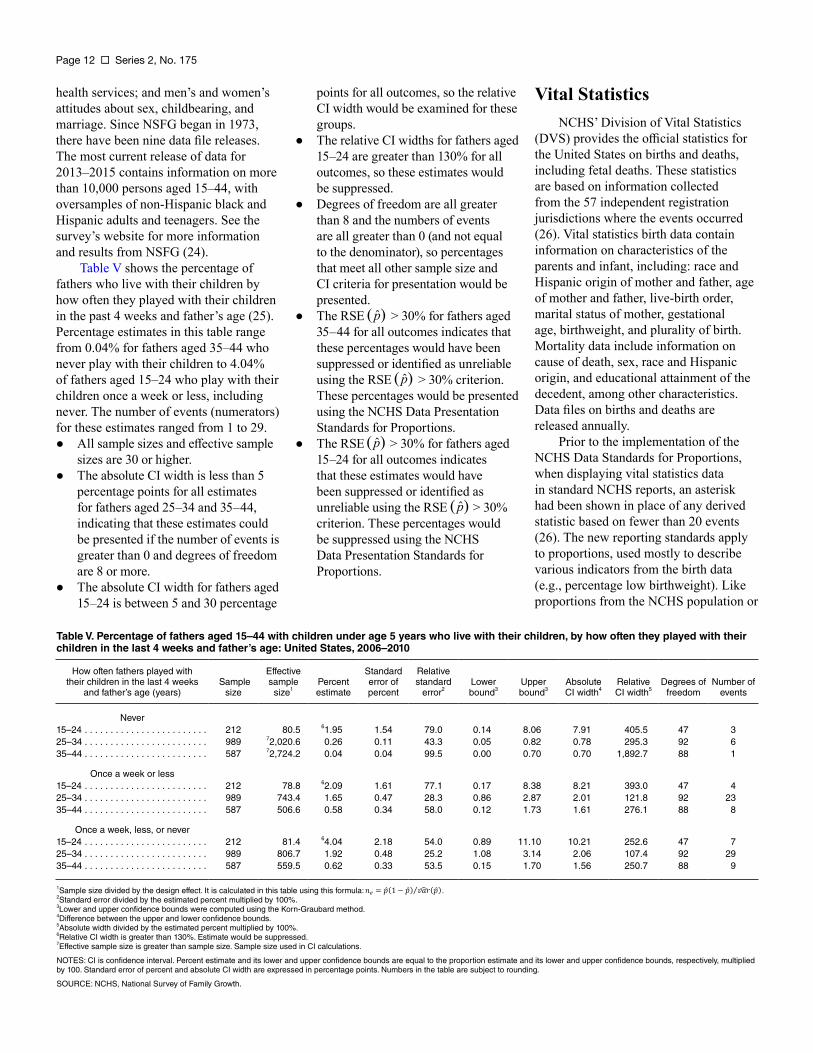
health services; and men’s and women’s points for all outcomes, so the relative attitudes about sex, childbearing, and CI width would be examined for these marriage. Since NSFG began in 1973, groups. there have been nine data file releases. ● The relative CI widths for fathers aged The most current release of data for 15–24 are greater than 130% for all 2013–2015 contains information on more outcomes, so these estimates would than 10,000 persons aged 15–44, with be suppressed. oversamples of non-Hispanic black and ● Degrees of freedom are all greater Hispanic adults and teenagers. See the than 8 and the numbers of events survey’s website for more information are all greater than 0 (and not equal and results from NSFG (24). to the denominator), so percentages
Table V shows the percentage of that meet all other sample size and fathers who live with their children by CI criteria for presentation would be how often they played with their children presented. in the past 4 weeks and father’s age (25). ● The RSE > 30% for fathers aged Percentage estimates in this table range 35–44 for all outcomes indicates that from 0.04% for fathers aged 35–44 who these percentages would have been never play with their children to 4.04% suppressed or identified as unreliable of fathers aged 15–24 who play with their using the RSE > 30% criterion. children once a week or less, including These percentages would be presented never. The number of events (numerators) using the NCHS Data Presentation for these estimates ranged from 1 to 29. Standards for Proportions. ● All sample sizes and effective sample ● The RSE > 30% for fathers aged
sizes are 30 or higher. 15–24 for all outcomes indicates ● The absolute CI width is less than 5 that these estimates would have
percentage points for all estimates been suppressed or identified as for fathers aged 25–34 and 35–44, unreliable using the RSE > 30% indicating that these estimates could criterion. These percentages would be presented if the number of events is be suppressed using the NCHS greater than 0 and degrees of freedom Data Presentation Standards for are 8 or more. Proportions.
● The absolute CI width for fathers aged 15–24 is between 5 and 30 percentage
Vital Statistics NCHS’ Division of Vital Statistics
(DVS) provides the official statistics for the United States on births and deaths, including fetal deaths. These statistics are based on information collected from the 57 independent registration jurisdictions where the events occurred (26). Vital statistics birth data contain information on characteristics of the parents and infant, including: race and Hispanic origin of mother and father, age of mother and father, live-birth order, marital status of mother, gestational age, birthweight, and plurality of birth. Mortality data include information on cause of death, sex, race and Hispanic origin, and educational attainment of the decedent, among other characteristics. Data files on births and deaths are released annually.
Prior to the implementation of the NCHS Data Standards for Proportions, when displaying vital statistics data in standard NCHS reports, an asterisk had been shown in place of any derived statistic based on fewer than 20 events (26). The new reporting standards apply to proportions, used mostly to describe various indicators from the birth data (e.g., percentage low birthweight). Like proportions from the NCHS population or
Table V. Percentage of fathers aged 15–44 with children under age 5 years who live with their children, by how often they played with their children in the last 4 weeks and father’s age: United States, 2006–2010
How often fathers played with Effective Standard Relative their children in the last 4 weeks
and father’s age (years) Sample
size sample
size1 Percent estimate
error of percent
standard error 2
Lower bound3
Upper bound3
Absolute CI width4
Relative CI width5
Degrees of freedom
Number of events
Never 15–24 . . . . . . . . . . . . . . . . . . . . . . . . 212 80.5 61.95 1.54 79.0 0.14 8.06 7.91 405.5 47 3 25–34 . . . . . . . . . . . . . . . . . . . . . . . . 989 72,020.6 0.26 0.11 43.3 0.05 0.82 0.78 295.3 92 6 35–44 . . . . . . . . . . . . . . . . . . . . . . . . 587 72,724.2 0.04 0.04 99.5 0.00 0.70 0.70 1,892.7 88 1
Once a week or less 15–24 . . . . . . . . . . . . . . . . . . . . . . . . 212 78.8 62.09 1.61 77.1 0.17 8.38 8.21 393.0 47 4 25–34 . . . . . . . . . . . . . . . . . . . . . . . . 989 743.4 1.65 0.47 28.3 0.86 2.87 2.01 121.8 92 23 35–44 . . . . . . . . . . . . . . . . . . . . . . . . 587 506.6 0.58 0.34 58.0 0.12 1.73 1.61 276.1 88 8
Once a week, less, or never 15–24 . . . . . . . . . . . . . . . . . . . . . . . . 212 81.4 64.04 2.18 54.0 0.89 11.10 10.21 252.6 47 7 25–34 . . . . . . . . . . . . . . . . . . . . . . . . 989 806.7 1.92 0.48 25.2 1.08 3.14 2.06 107.4 92 29 35–44 . . . . . . . . . . . . . . . . . . . . . . . . 587 559.5 0.62 0.33 53.5 0.15 1.70 1.56 250.7 88 9
1Sample size divided by the design effect. It is calculated in this table using this formula: . 2Standard error divided by the estimated percent multiplied by 100%. 3Lower and upper confidence bounds were computed using the Korn-Graubard method. 4Difference between the upper and lower confidence bounds. 5Absolute width divided by the estimated percent multiplied by 100%. 6Relative CI width is greater than 130%. Estimate would be suppressed. 7Effective sample size is greater than sample size. Sample size used in CI calculations.
NOTES: CI is confidence interval. Percent estimate and its lower and upper confidence bounds are equal to the proportion estimate and its lower and upper confidence bounds, respectively, multiplied by 100. Standard error of percent and absolute CI width are expressed in percentage points. Numbers in the table are subject to rounding.
SOURCE: NCHS, National Survey of Family Growth.
Series 2, No. 173 Page 13
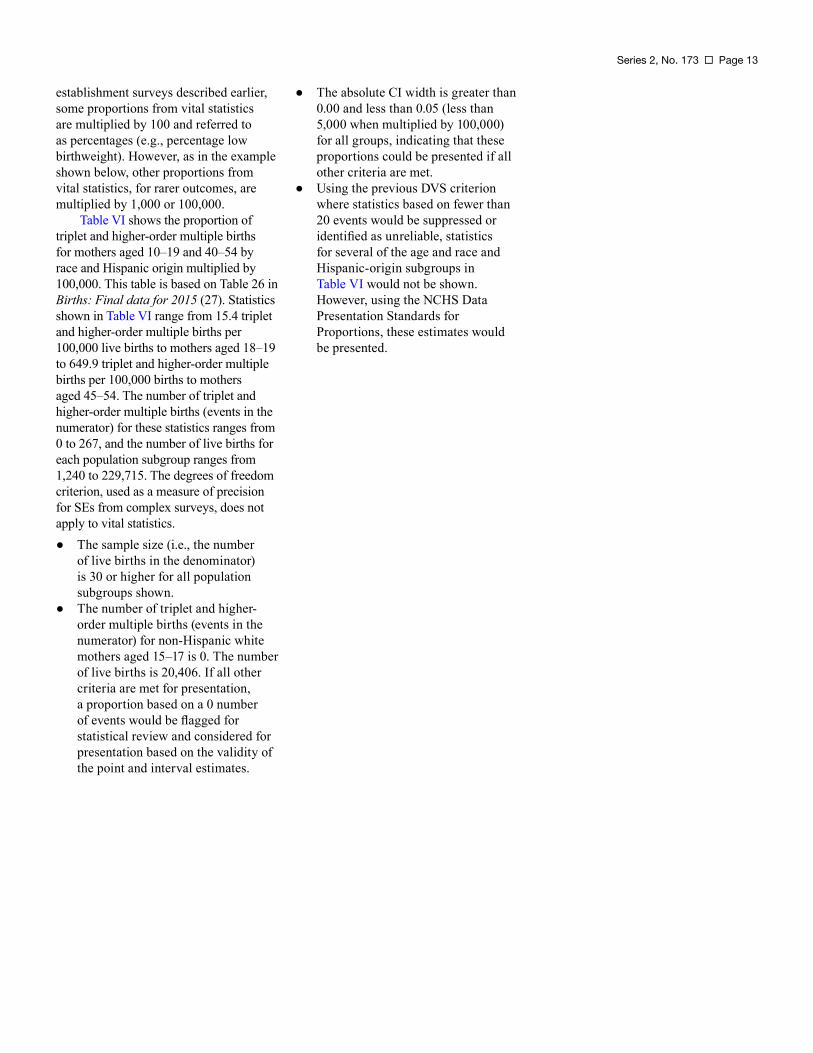
establishment surveys described earlier, ● The absolute CI width is greater than some proportions from vital statistics 0.00 and less than 0.05 (less than are multiplied by 100 and referred to 5,000 when multiplied by 100,000) as percentages (e.g., percentage low for all groups, indicating that these birthweight). However, as in the example proportions could be presented if all shown below, other proportions from other criteria are met. vital statistics, for rarer outcomes, are ● Using the previous DVS criterion multiplied by 1,000 or 100,000. where statistics based on fewer than
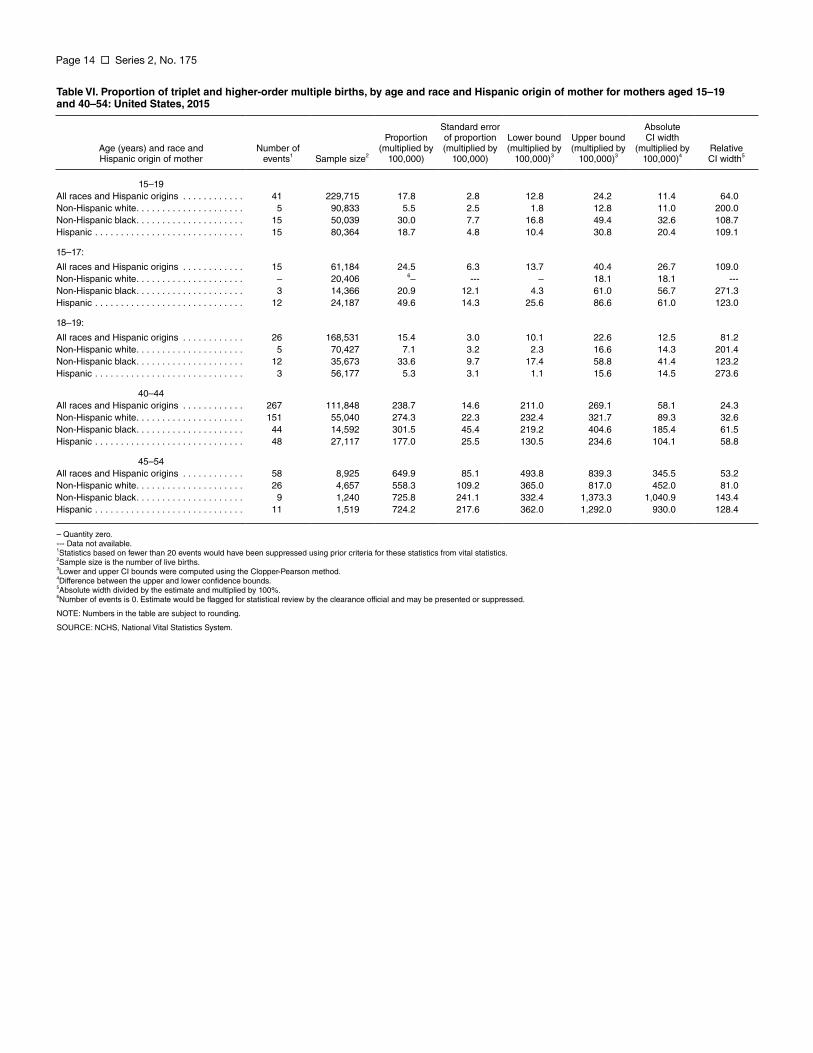
Table VI shows the proportion of 20 events would be suppressed or triplet and higher-order multiple births identified as unreliable, statistics for mothers aged 10–19 and 40–54 by for several of the age and race and race and Hispanic origin multiplied by Hispanic-origin subgroups in 100,000. This table is based on Table 26 in Table VI would not be shown. Births: Final data for 2015 (27). Statistics However, using the NCHS Data shown in Table VI range from 15.4 triplet Presentation Standards for and higher-order multiple births per Proportions, these estimates would 100,000 live births to mothers aged 18–19 be presented. to 649.9 triplet and higher-order multiple births per 100,000 births to mothers aged 45–54. The number of triplet and higher-order multiple births (events in the numerator) for these statistics ranges from 0 to 267, and the number of live births for each population subgroup ranges from 1,240 to 229,715. The degrees of freedom criterion, used as a measure of precision for SEs from complex surveys, does not apply to vital statistics. ● The sample size (i.e., the number
of live births in the denominator) is 30 or higher for all population subgroups shown.
● The number of triplet and higher-order multiple births (events in the numerator) for non-Hispanic white mothers aged 15–17 is 0. The number of live births is 20,406. If all other criteria are met for presentation, a proportion based on a 0 number of events would be flagged for statistical review and considered for presentation based on the validity of the point and interval estimates.
Page 14 Series 2, No. 175
Table VI. Proportion of triplet and higher-order multiple births, by age and race and Hispanic origin of mother for mothers aged 15–19 and 40–54: United States, 2015
Standard error Absolute Proportion of proportion Lower bound Upper bound CI width
Age (years) and race and Hispanic origin of mother
Number of events1 Sample size2
(multiplied by 100,000)
(multiplied by 100,000)
(multiplied by 100,000)3
(multiplied by 100,000)3
(multiplied by 100,000)4
Relative CI width5
15–19 All races and Hispanic origins . . . . . . . . . . . . 41 229,715 17.8 2.8 12.8 24.2 11.4 64.0 Non-Hispanic white. . . . . . . . . . . . . . . . . . . . . 5 90,833 5.5 2.5 1.8 12.8 11.0 200.0 Non-Hispanic black. . . . . . . . . . . . . . . . . . . . . 15 50,039 30.0 7.7 16.8 49.4 32.6 108.7 Hispanic . . . . . . . . . . . . . . . . . . . . . . . . . . . . . 15 80,364 18.7 4.8 10.4 30.8 20.4 109.1
15–17:
All races and Hispanic origins . . . . . . . . . . . . 15 61,184 24.5 6.3 13.7 40.4 26.7 109.0 Non-Hispanic white. . . . . . . . . . . . . . . . . . . . . – 20,406 6 – -- – 18.1 18.1 --Non-Hispanic black. . . . . . . . . . . . . . . . . . . . . 3 14,366 20.9 12.1 4.3 61.0 56.7 271.3 Hispanic . . . . . . . . . . . . . . . . . . . . . . . . . . . . . 12 24,187 49.6 14.3 25.6 86.6 61.0 123.0
18–19:
All races and Hispanic origins . . . . . . . . . . . . 26 168,531 15.4 3.0 10.1 22.6 12.5 81.2 Non-Hispanic white. . . . . . . . . . . . . . . . . . . . . 5 70,427 7.1 3.2 2.3 16.6 14.3 201.4 Non-Hispanic black. . . . . . . . . . . . . . . . . . . . . 12 35,673 33.6 9.7 17.4 58.8 41.4 123.2 Hispanic . . . . . . . . . . . . . . . . . . . . . . . . . . . . . 3 56,177 5.3 3.1 1.1 15.6 14.5 273.6
40–44 All races and Hispanic origins . . . . . . . . . . . . 267 111,848 238.7 14.6 211.0 269.1 58.1 24.3 Non-Hispanic white. . . . . . . . . . . . . . . . . . . . . 151 55,040 274.3 22.3 232.4 321.7 89.3 32.6 Non-Hispanic black. . . . . . . . . . . . . . . . . . . . . 44 14,592 301.5 45.4 219.2 404.6 185.4 61.5 Hispanic . . . . . . . . . . . . . . . . . . . . . . . . . . . . . 48 27,117 177.0 25.5 130.5 234.6 104.1 58.8
45–54 All races and Hispanic origins . . . . . . . . . . . . 58 8,925 649.9 85.1 493.8 839.3 345.5 53.2 Non-Hispanic white. . . . . . . . . . . . . . . . . . . . . 26 4,657 558.3 109.2 365.0 817.0 452.0 81.0 Non-Hispanic black. . . . . . . . . . . . . . . . . . . . . 9 1,240 725.8 241.1 332.4 1,373.3 1,040.9 143.4 Hispanic . . . . . . . . . . . . . . . . . . . . . . . . . . . . . 11 1,519 724.2 217.6 362.0 1,292.0 930.0 128.4
– Quantity zero. --- Data not available. 1Statistics based on fewer than 20 events would have been suppressed using prior criteria for these statistics from vital statistics. 2Sample size is the number of live births. 3Lower and upper CI bounds were computed using the Clopper-Pearson method. 4Difference between the upper and lower confidence bounds. 5Absolute width divided by the estimate and multiplied by 100%. 6Number of events is 0. Estimate would be flagged for statistical review by the clearance official and may be presented or suppressed.
NOTE: Numbers in the table are subject to rounding.
SOURCE: NCHS, National Vital Statistics System.
Series 2, No. 175 Page 15
Vital and Health Statistics Series Descriptions
Active Series Series 1. Programs and Collection Procedures
Reports describe the programs and data systems of the National Center for Health Statistics, and the data collection and survey methods used. Series 1 reports also include definitions, survey design, estimation, and other material necessary for understanding and analyzing the data.
Series 2. Data Evaluation and Methods Research Reports present new statistical methodology including experimental tests of new survey methods, studies of vital and health statistics collection methods, new analytical techniques, objective evaluations of reliability of collected data, and contributions to statistical theory. Reports also include comparison of U.S. methodology with those of other countries.
Series 3. Analytical and Epidemiological Studies Reports present data analyses, epidemiological studies, and descriptive statistics based on national surveys and data systems. As of 2015, Series 3 includes reports that would have previously been published in Series 5, 10–15, and 20–23.
Discontinued Series Series 4. Documents and Committee Reports
Reports contain findings of major committees concerned with vital and health statistics and documents. The last Series 4 report was published in 2002; these are now included in Series 2 or another appropriate series.
Series 5. International Vital and Health Statistics Reports Reports present analytical and descriptive comparisons of U.S. vital and health statistics with those of other countries. The last Series 5 report was published in 2003; these are now included in Series 3 or another appropriate series.
Series 6. Cognition and Survey Measurement Reports use methods of cognitive science to design, evaluate, and test survey instruments. The last Series 6 report was published in 1999; these are now included in Series 2.
Series 10. Data From the National Health Interview Survey Reports present statistics on illness; accidental injuries; disability; use of hospital, medical, dental, and other services; and other health-related topics. As of 2015, these are included in Series 3.
Series 11. Data From the National Health Examination Survey, the National Health and Nutrition Examination Surveys, and the Hispanic Health and Nutrition Examination Survey Reports present 1) estimates of the medically defined prevalence of specific diseases in the United States and the distribution of the population with respect to physical, physiological, and psychological characteristics and 2) analysis of relationships among the various measurements. As of 2015, these are included in Series 3.
Series 12. Data From the Institutionalized Population Surveys The last Series 12 report was published in 1974; these reports were included in Series 13, and as of 2015 are in Series 3.
Series 13. Data From the National Health Care Survey Reports present statistics on health resources and use of health care resources based on data collected from health care providers and provider records. As of 2015, these reports are included in Series 3.
Series 14. Data on Health Resources: Manpower and Facilities The last Series 14 report was published in 1989; these reports were included in Series 13, and are now included in Series 3.
Series 15. Data From Special Surveys Reports contain statistics on health and health-related topics from surveys that are not a part of the continuing data systems of the National Center for Health Statistics. The last Series 15 report was published in 2002; these reports are now included in Series 3.
Series 16. Compilations of Advance Data From Vital and Health Statistics The last Series 16 report was published in 1996. All reports are available online; compilations are no longer needed.
Series 20. Data on Mortality Reports include analyses by cause of death and demographic variables, and geographic and trend analyses. The last Series 20 report was published in 2007; these reports are now included in Series 3.
Series 21. Data on Natality, Marriage, and Divorce Reports include analyses by health and demographic variables, and geographic and trend analyses. The last Series 21 report was published in 2006; these reports are now included in Series 3.
Series 22. Data From the National Mortality and Natality Surveys The last Series 22 report was published in 1973. Reports from sample surveys of vital records were included in Series 20 or 21, and are now included in Series 3.
Series 23. Data From the National Survey of Family Growth Reports contain statistics on factors that affect birth rates, factors affecting the formation and dissolution of families, and behavior related to the risk of HIV and other sexually transmitted diseases. The last Series 23 report was published in 2011; these reports are now included in Series 3.
Series 24. Compilations of Data on Natality, Mortality, Marriage, and Divorce The last Series 24 report was published in 1996. All reports are available online; compilations are no longer needed.
For answers to questions about this report or for a list of reports published in these series, contact:
Information Dissemination Staff National Center for Health Statistics Centers for Disease Control and Prevention 3311 Toledo Road, Room 4551, MS P08 Hyattsville, MD 20782
Tel: 1–800–CDC–INFO (1–800–232–4636) TTY: 1–888–232–6348 Internet: https://www.cdc.gov/nchs Online request form: https://www.cdc.gov/info For e-mail updates on NCHS publication releases, subscribe
online at: https://www.cdc.gov/nchs/govdelivery.htm.
U.S. DEPARTMENT OF HEALTH & HUMAN SERVICES
Centers for Disease Control and Prevention National Center for Health Statistics 3311 Toledo Road, Room 4551, MS P08 Hyattsville, MD 20782–2064
OFFICIAL BUSINESS PENALTY FOR PRIVATE USE, $300
FIRST CLASS MAIL POSTAGE & FEES PAID
CDC/NCHS PERMIT NO. G-284
DHHS Publication No. 2017–1375, Series 2, No. 175 CS280166