Embed Size (px)
Citation preview
VISUM – State-of-the-Art Travel Demand Modeling
VISUM –Travel DemandModeling
VISUM is a PC-based programme using
MS Windows and offers data and image
exchange in the Windows environment
via clipboard or interfaces to industry
standard formats. In addition, VISUM
has an open object-oriented concept
that enables users to programme their
own applications using Visual Basic or
the programming language of their
choice. PTV Vision® is more than just
traditional demand modelling. Our
software integrates demand modelling
with microscopic traffic and pedestrian
simulation (VISSIM), providing trans-
portation professionals with the most
complete suite of analysis tools. To
round out the software package, VISUM
includes embedded components from
other leading software packages such
as ArcGISTM from our business part-
ner ESRI for better GIS integration.
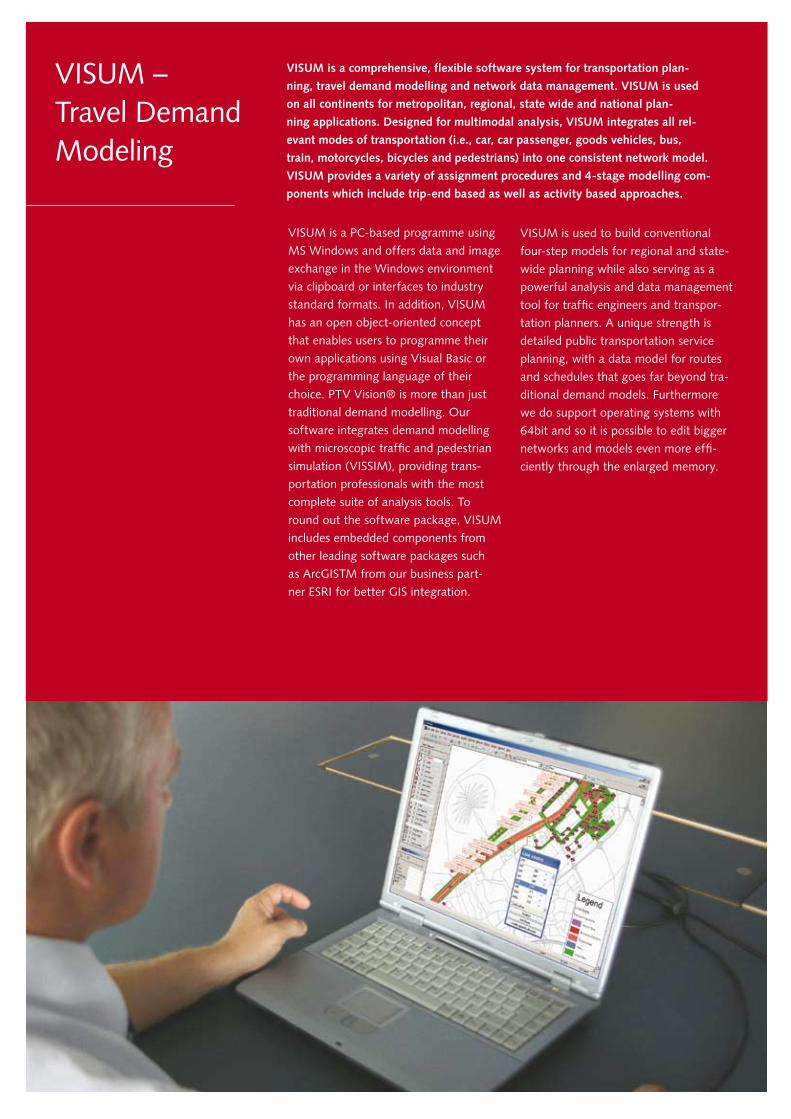
VISUM is a comprehensive, flexible software system for transportation plan-
ning, travel demand modelling and network data management. VISUM is used
on all continents for metropolitan, regional, state wide and national plan-
ning applications. Designed for multimodal analysis, VISUM integrates all rel-
evant modes of transportation (i.e., car, car passenger, goods vehicles, bus,
train, motorcycles, bicycles and pedestrians) into one consistent network model.
VISUM provides a variety of assignment procedures and 4-stage modelling com-
ponents which include trip-end based as well as activity based approaches.
VISUM is used to build conventional
four-step models for regional and state-
wide planning while also serving as a
powerful analysis and data management
tool for traffic engineers and transpor-
tation planners. A unique strength is
detailed public transportation service
planning, with a data model for routes
and schedules that goes far beyond tra-
ditional demand models. Furthermore
we do support operating systems with
64bit and so it is possible to edit bigger
networks and models even more effi-
ciently through the enlarged memory.
VISUM
VISUM Features – A Close Up View
3
Interactive Use of VISUM:
VISUM is an extremely flexible visualisa-
tion environment. The VISUM Graphical
User Interface (GUI) is easy to learn and
to use. Selection and editing of network
objects in the Geographical Information
Systems (GIS) style is highly intuitive. With
the junction editor for example all relevant
details of an intersection can be modelled.
This reaches from the node and turn
attributes all the way through the whole
junction model. Also the network object
toolbar lets you toggle the visibility of lay-
ers and filter settings. Using the spatial
selection users can select any collection
of network objects they want to edit.
VISUM speeds up your transportation
planning analysis workflows. Just one
example for this is Multi-Threading, which
helps to split each task into multiple parts
which run concurrently. Through this
parallelisation the computationally
intense procedures can be speeded up.
Furthermore the Network object toolbar
and context menus give you fast access to
functionalities such as graphic parameters,
visibility of layers, listings and/or filters.
The listings for each network object work
like a spreadsheet programme, which
allows for fast and efficient editing of
model data. Network editor and listings
are synchronised. Different synchronisa-
tion modes make it possible to work par-
allel in the listings and network editor.
VISUM includes integrated “Undo” and
“Redo” commands that restore network
integrity after a complex series of user
interactions and network modifications.
Even data for very large models can be
easily accessed and modified via VISUM‘s
GUI. All model steps, such as assignments
can be interactively started from the menu.
With the print preview mode, users can
access a “what-you-see-is-what-you-get”
view.
A Quick View window allows the users to
view and edit attributes of the currently
marked objects without opening any dia-
logs. This speeds up the network editing
process significantly. For creating different
map views, the graphics parameter selector
can be used for changing between graphi-
cal settings with just one mouse click.
GIS Integration
One of the most exciting features of VISUM is
its ability to merge GIS-data and transpor-
tation data into a common database with
several layers including: Traffic Analysis
Zones and jurisdiction boundaries; trans-
portation network with connectivity, street
centrelines, intersection turns and public
transport routes; user defined attributes
and user defined object classes; and back-
ground maps. In addition the linkage to
the personal geo database of ESRI or shape
files can be used to populate additional
geography layers in VISUM which then can
be intersected and buffered with the trans-
portation network of VISUM. This GIS
integration enables networks to be coded
in a geographically accurate way.
VISUM alone is sufficient to design pow-
erful maps including flexible legends, no
other GIS software is needed for post-
processing and presentations. Only a few
steps are necessary to make use of the
many visual options. To enrich the graphi-
cal capabilities all standard vector formats
as well as image and bitmap formats can
be imported. This includes aerial imagery
file formats such as MrSID and ECW.
Script Based Use of VISUM
VISUM provides a COM interface based
on MS Windows technology and can be
integrated with other COM-compliant
Windows products like MS Office and
ArcGIS. Users can programme applica-
tions using Python, Visual Basic, C, C++
and others. Based on this concept, VISUM
is an open system that enables users to
create and run customised pre-process-
ing and post-processing utilities and to
control advanced multi-stage model runs.
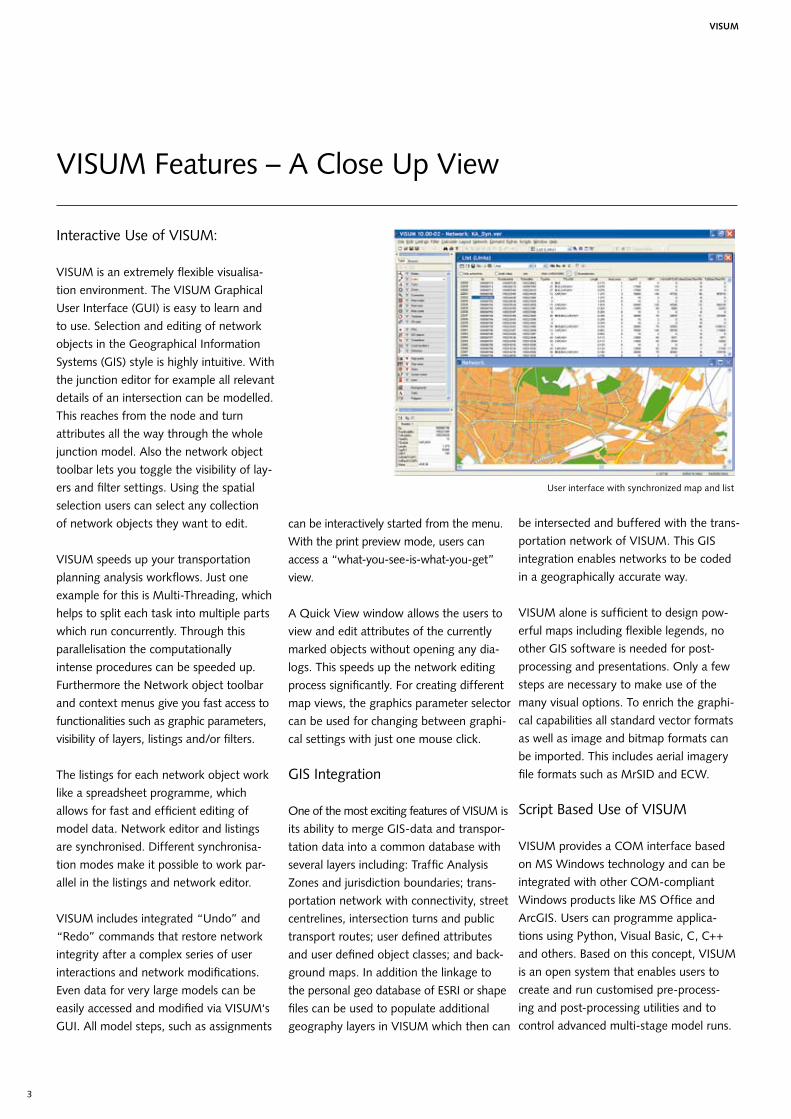
User interface with synchronized map and list
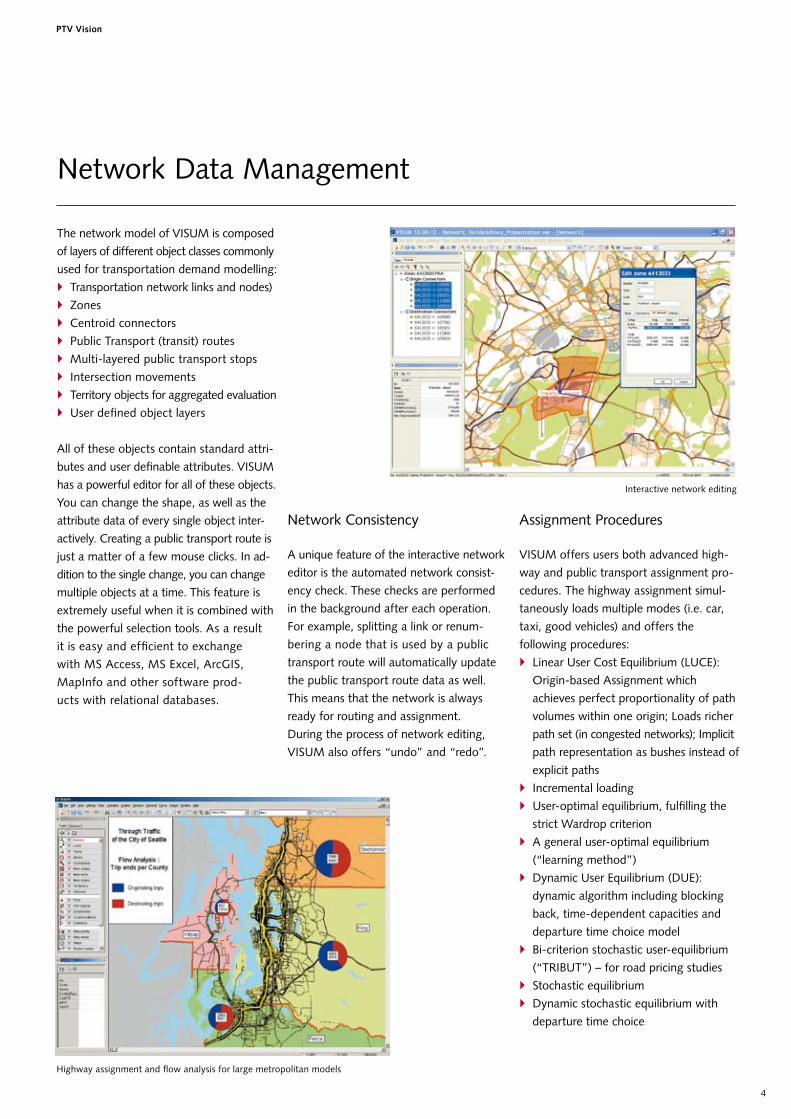
Network Data Management
The network model of VISUM is composed
of layers of different object classes commonly
used for transportation demand modelling:
Transportation network links and nodes)
Zones
Centroid connectors
Public Transport (transit) routes
Multi-layered public transport stops
Intersection movements
Territory objects for aggregated evaluation
User defined object layers
All of these objects contain standard attri-
butes and user definable attributes. VISUM
has a powerful editor for all of these objects.
You can change the shape, as well as the
attribute data of every single object inter-
actively. Creating a public transport route is
just a matter of a few mouse clicks. In ad-
dition to the single change, you can change
multiple objects at a time. This feature is
extremely useful when it is combined with
the powerful selection tools. As a result
it is easy and efficient to exchange
with MS Access, MS Excel, ArcGIS,
MapInfo and other software prod-
ucts with relational databases.
PTV Vision
4
Network Consistency
A unique feature of the interactive network
editor is the automated network consist-
ency check. These checks are performed
in the background after each operation.
For example, splitting a link or renum-
bering a node that is used by a public
transport route will automatically update
the public transport route data as well.
This means that the network is always
ready for routing and assignment.
During the process of network editing,
VISUM also offers “undo” and “redo”.
Assignment Procedures
VISUM offers users both advanced high-
way and public transport assignment pro-
cedures. The highway assignment simul-
taneously loads multiple modes (i.e. car,
taxi, good vehicles) and offers the
following procedures:
Linear User Cost Equilibrium (LUCE):
Origin-based Assignment which
achieves perfect proportionality of path
volumes within one origin; Loads richer
path set (in congested networks); Implicit
path representation as bushes instead of
explicit paths
Incremental loading
User-optimal equilibrium, fulfilling the
strict Wardrop criterion
A general user-optimal equilibrium
(“learning method”)
Dynamic User Equilibrium (DUE):
dynamic algorithm including blocking
back, time-dependent capacities and
departure time choice model
Bi-criterion stochastic user-equilibrium
(“TRIBUT”) – for road pricing studies
Stochastic equilibrium
Dynamic stochastic equilibrium with
departure time choice
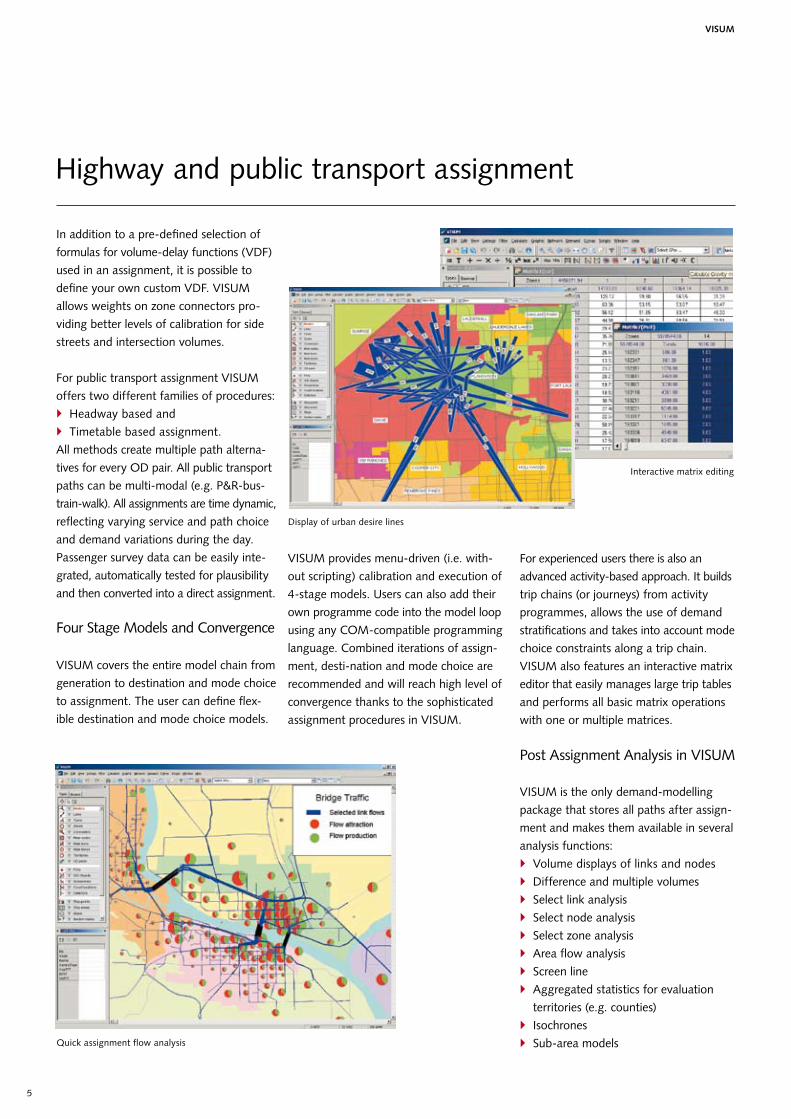
Highway assignment and flow analysis for large metropolitan models
Interactive network editing
5
In addition to a pre-defined selection of
formulas for volume-delay functions (VDF)
used in an assignment, it is possible to
define your own custom VDF. VISUM
allows weights on zone connectors pro-
viding better levels of calibration for side
streets and intersection volumes.
For public transport assignment VISUM
offers two different families of procedures:
Headway based and
Timetable based assignment.
All methods create multiple path alterna-
tives for every OD pair. All public transport
paths can be multi-modal (e.g. P&R-bus-
train-walk). All assignments are time dynamic,
reflecting varying service and path choice
and demand variations during the day.
Passenger survey data can be easily inte-
grated, automatically tested for plausibility
and then converted into a direct assignment.
Four Stage Models and Convergence
VISUM covers the entire model chain from
generation to destination and mode choice
to assignment. The user can define flex-
ible destination and mode choice models.
Highway and public transport assignment
VISUM
VISUM provides menu-driven (i.e. with-
out scripting) calibration and execution of
4-stage models. Users can also add their
own programme code into the model loop
using any COM-compatible programming
language. Combined iterations of assign-
ment, desti-nation and mode choice are
recommended and will reach high level of
convergence thanks to the sophisticated
assignment procedures in VISUM.
For experienced users there is also an
advanced activity-based approach. It builds
trip chains (or journeys) from activity
programmes, allows the use of demand
stratifications and takes into account mode
choice constraints along a trip chain.
VISUM also features an interactive matrix
editor that easily manages large trip tables
and performs all basic matrix operations
with one or multiple matrices.
Post Assignment Analysis in VISUM
VISUM is the only demand-modelling
package that stores all paths after assign-
ment and makes them available in several
analysis functions:
Volume displays of links and nodes
Difference and multiple volumes
Select link analysis
Select node analysis
Select zone analysis
Area flow analysis
Screen line
Aggregated statistics for evaluation
territories (e.g. counties)
Isochrones
Sub-area models
Quick assignment flow analysis
Display of urban desire lines
Interactive matrix editing
PTV Vision
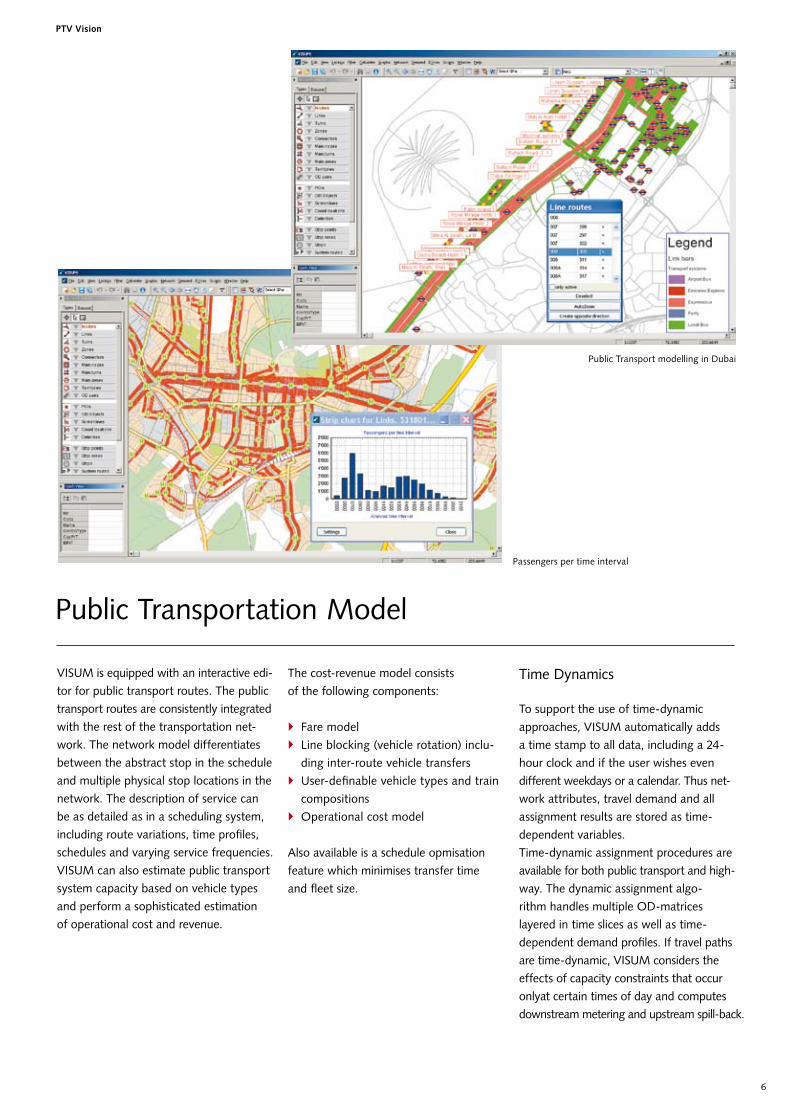
VISUM is equipped with an interactive edi-
tor for public transport routes. The public
transport routes are consistently integrated
with the rest of the transportation net-
work. The network model differentiates
between the abstract stop in the schedule
and multiple physical stop locations in the
network. The description of service can
be as detailed as in a scheduling system,
including route variations, time profiles,
schedules and varying service frequencies.
VISUM can also estimate public transport
system capacity based on vehicle types
and perform a sophisticated estimation
of operational cost and revenue.
6
Public Transportation Model
Public Transport modelling in Dubai
The cost-revenue model consists
of the following components:
Fare model
Line blocking (vehicle rotation) inclu-
ding inter-route vehicle transfers
User-definable vehicle types and train
compositions
Operational cost model
Also available is a schedule opmisation
feature which minimises transfer time
and fleet size.
Time Dynamics
To support the use of time-dynamic
approaches, VISUM automatically adds
a time stamp to all data, including a 24-
hour clock and if the user wishes even
different weekdays or a calendar. Thus net-
work attributes, travel demand and all
assignment results are stored as time-
dependent variables.
Time-dynamic assignment procedures are
available for both public transport and high-
way. The dynamic assignment algo-
rithm handles multiple OD-matrices
layered in time slices as well as time-
dependent demand profiles. If travel paths
are time-dynamic, VISUM considers the
effects of capacity constraints that occur
onlyat certain times of day and computes
downstream metering and upstream spill-back.
Passengers per time interval
VISUM
7
Intersection Models and Level of Service (LOS) Analysis
During highway assignment, delays can
be computed for nodes (intersections)
in addition to links. There are several
approaches for node delay. One plan-
ning oriented approach defines capacity
constraints for intersections as a func-
tion of node type, link class ranking,
relation to major flow, and movement
type (left, right, through, U-turn).
Another approach is inherited from the
TMODEL software, deriving delays from a
node capacity that is applied to some or to
all turns.
section data such as signal timing and
intersection geometry. Intersection Capacity
Analysis (ICA) computes intersection
delays and level of service (LOS) conform-
ing to the Highway Capacity Manual
(HCM) 2000 and other LOS standards.
Intersection delay and LOS can either
be used during the assignment process,
or simply be generated as post-assign-
ment statistics. This capability in com-
bination with the integrated NCHRP
255 turn flow post-processing proce-
dure makes VISUM a very efficient
analysis tool for infrastructure plan-
ning projects such as Major Investment
Studies (MIS) and Corridor Studies.
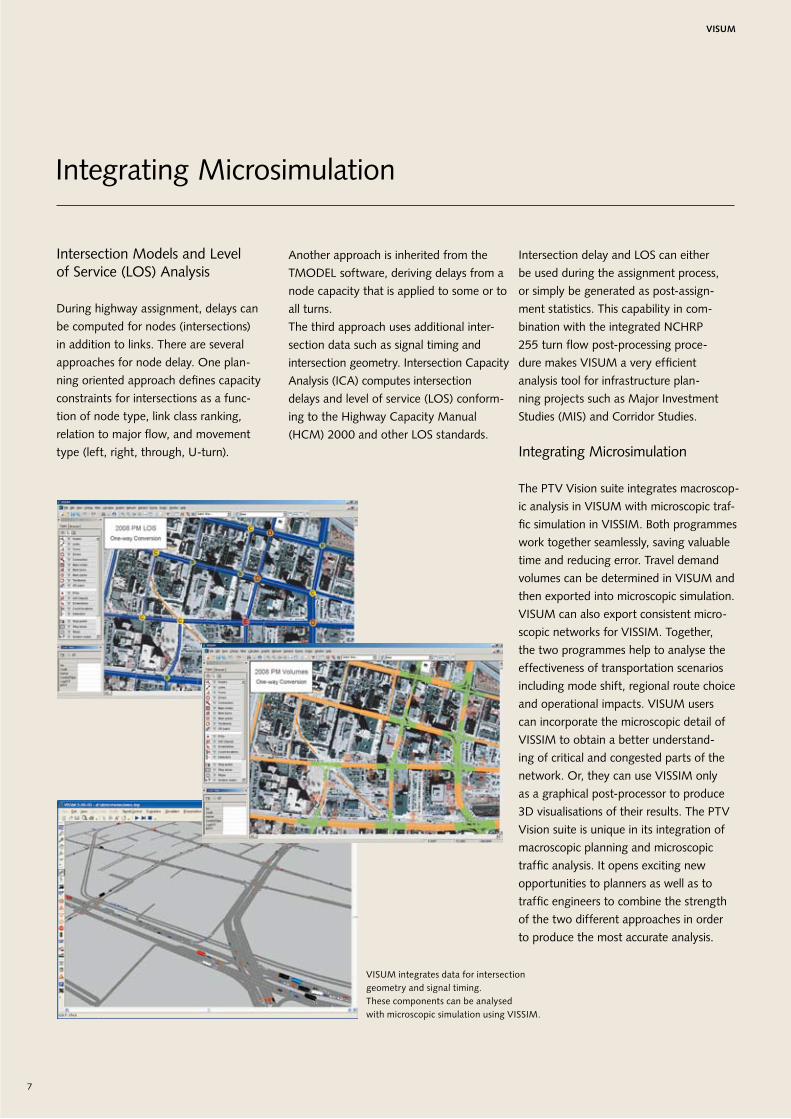
Integrating Microsimulation
The PTV Vision suite integrates macroscop-
ic analysis in VISUM with microscopic traf-
fic simulation in VISSIM. Both programmes
work together seamlessly, saving valuable
time and reducing error. Travel demand
volumes can be determined in VISUM and
then exported into microscopic simulation.
VISUM can also export consistent micro-
scopic networks for VISSIM. Together,
the two programmes help to analyse the
effectiveness of transportation scenarios
including mode shift, regional route choice
and operational impacts. VISUM users
can incorporate the microscopic detail of
VISSIM to obtain a better understand-
ing of critical and congested parts of the
network. Or, they can use VISSIM only
as a graphical post-processor to produce
3D visualisations of their results. The PTV
Vision suite is unique in its integration of
macroscopic planning and microscopic
traffic analysis. It opens exciting new
opportunities to planners as well as to
traffic engineers to combine the strength
of the two different approaches in order
to produce the most accurate analysis.
VISUM integrates data for intersection geometry and signal timing.These components can be analysedwith microscopic simulation using VISSIM.
Integrating Microsimulation
The third approach uses additional inter-
Logistics Software Transport Consulting
PTV Vision – VISUM
VISU
M_Brochure_e_20
09.indd
VISUM – State-of-the-Art Travel Demand Modelling
Your benefits of VISUM at a glance:
Display of all relevant traffic data in
one model
Detailed analysis and planning
possibilities
High data quality through consistent
network models
GIS-orientated and detailed
Individual and customised through
open system concepts
Numerous efficient calculation
procedures
User-defined level of detail
Close linkage to VISSIM for traffic
simulation and to ITS
VISUM sets a new benchmark
With VISUM at the core of PTV Vision,
transportation planners and engineers
can calculate traffic flows, operational
measures of effectiveness as well as
noise and air quality impacts. VISUM by
far surpasses the present level of detail
in a network model for both private
and public transport. Prominent fea-
tures are time dynamics and the exten-
sion of public transport modelling.
PTV’s Focus on the Users
Fore more than 15 years, the PTV Vision
development team has been setting
new standards that our clients value
and our competitors aspire to. Today,
PTV Vision is helping increase the pro-
ductivity of transportation profession-
als and the value they provide to their
countries in more than 90 countries.
We view our clients as a pivotal
resource for ideas. Our industry lead-
ing products combined with our desire
and motivation to continue setting
new standards guarantees a sound
investment for years to come.
Traffic Software Brisbane
PO Box 1791
Milton BCQLD 4064
Melbourne
PO Box 694
RichmondVIC 3121T +61 3 9429 2212
Singapore10 Anson Rd
Singapore 079903T +61 7 3369 8896
#35-09 international Plaza
T +65 6323 2746
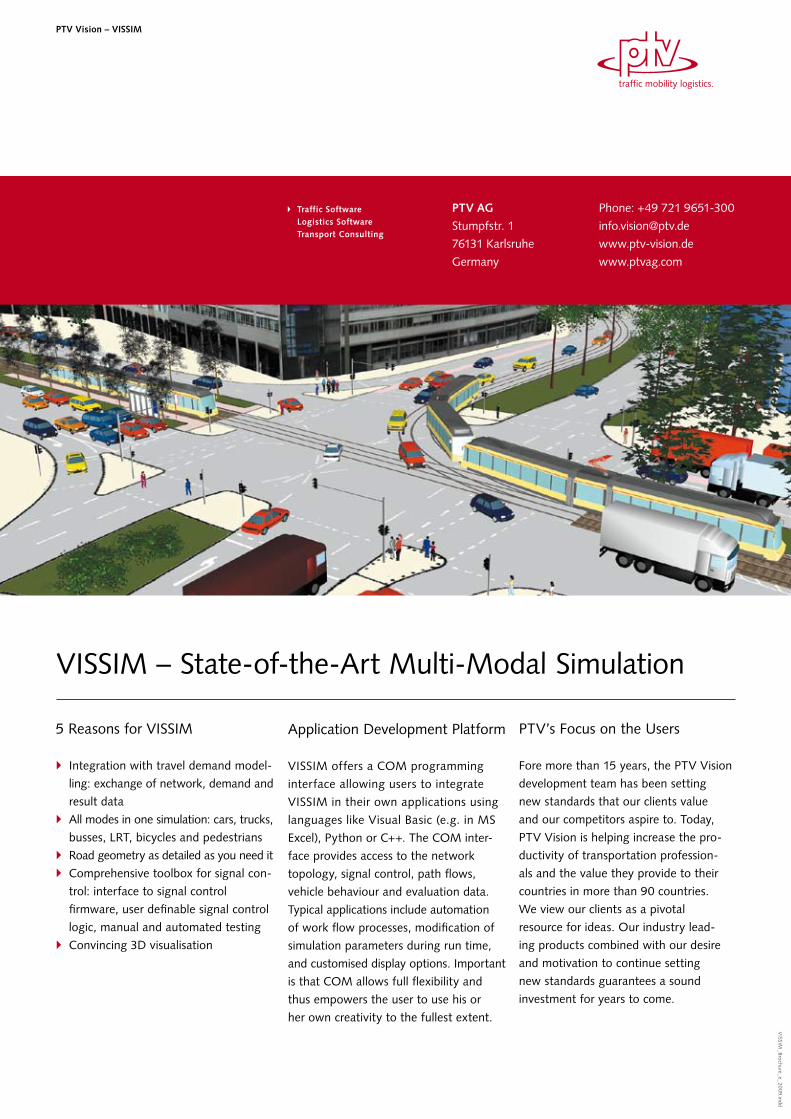
VISSIM – State-of-the-Art Multi-Modal Simulation
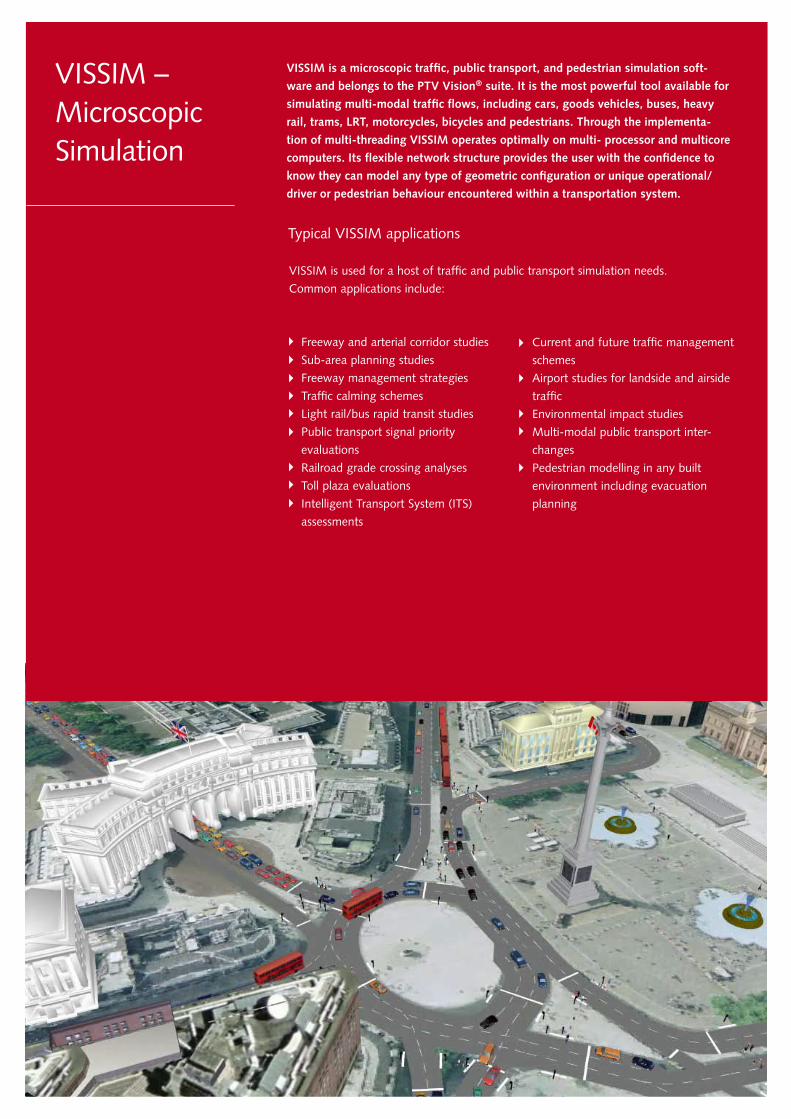
VISSIM –MicroscopicSimulation
Typical VISSIM applications
Freeway and arterial corridor studies
Sub-area planning studies
Freeway management strategies
Traffic calming schemes
Light rail/bus rapid transit studies
Public transport signal priority
evaluations
Railroad grade crossing analyses
Toll plaza evaluations
Intelligent Transport System (ITS)
assessments
VISSIM is a microscopic traffic, public transport, and pedestrian simulation soft-
ware and belongs to the PTV Vision® suite. It is the most powerful tool available for
simulating multi-modal traffic flows, including cars, goods vehicles, buses, heavy
rail, trams, LRT, motorcycles, bicycles and pedestrians. Through the implementa-
tion of multi-threading VISSIM operates optimally on multi- processor and multicore
computers. Its flexible network structure provides the user with the confidence to
know they can model any type of geometric configuration or unique operational/
driver or pedestrian behaviour encountered within a transportation system.
Current and future traffic management
schemes
Airport studies for landside and airside
traffic
Environmental impact studies
Multi-modal public transport inter-
changes
Pedestrian modelling in any built
environment including evacuation
planning
VISSIM is used for a host of traffic and public transport simulation needs.
Common applications include:
VISSIM
VISSIM Features – A Close Up View
3
What Makes VISSIM Special?
VISSIM is based on decades of intensive
research at various academic institutions.
Core algorithms are well documented.
Open interfaces provide compatibility
with external software. Its link-connec-
tor topology allows the highest versatil-
ity combined with vehicle movements in
a detailed 1/10s resolution. Since being
introduced to the market in 1992, VISSIM
has set the standard for simulation soft-
ware; intensive research and a large user
community worldwide guarantee VISSIM
to be the leading edge software of its
kind. Furthermore, the PTV Vision suite
has been the first of its kind to integrate
microscopic simulation with strategic trans-
port planning/travel demand modelling.
Network
VISSIM has been used to analyse net-
works of all sizes ranging from individual
intersections to entire metropolitan areas.
Within these transportation networks,
VISSIM is able to model all roadway
functional classifications from freeways
(motorways) to driveways. VISSIM’s
breadth of network applications also
includes public transport, bicycle and
pedestrian facilities. Many common, as
well as unique, geometric and operational
conditions exist throughout the transpor-
tation system which VISSIM can simulate.
Some examples include:
Multi-lane freeways, interchanges,
roadway grades
High Occupancy Vehicles (HOV) and
High Occupancy Toll (HOT) lanes
Merging and weaving areas
Complex signalised and unsignalised
intersections
U-turns, exclusive lanes, mixed flow
lanes
2-way left turn lanes
Bike lanes
Multi-modal lane sharing and passing
(e.g. bikes and cars)
Angle and parallel parking
Roundabouts, continuous flow inter-
sections
Airport curbside drop-off areas
Exclusive lanes, mixed-flow lanes,
queue jumps, queue-bypass lanes
Public transport stops, terminals
Centre and side-running LRT align-
ments
Pedestrian queuing
Pedestrian - vehicle interaction
Railroad lines
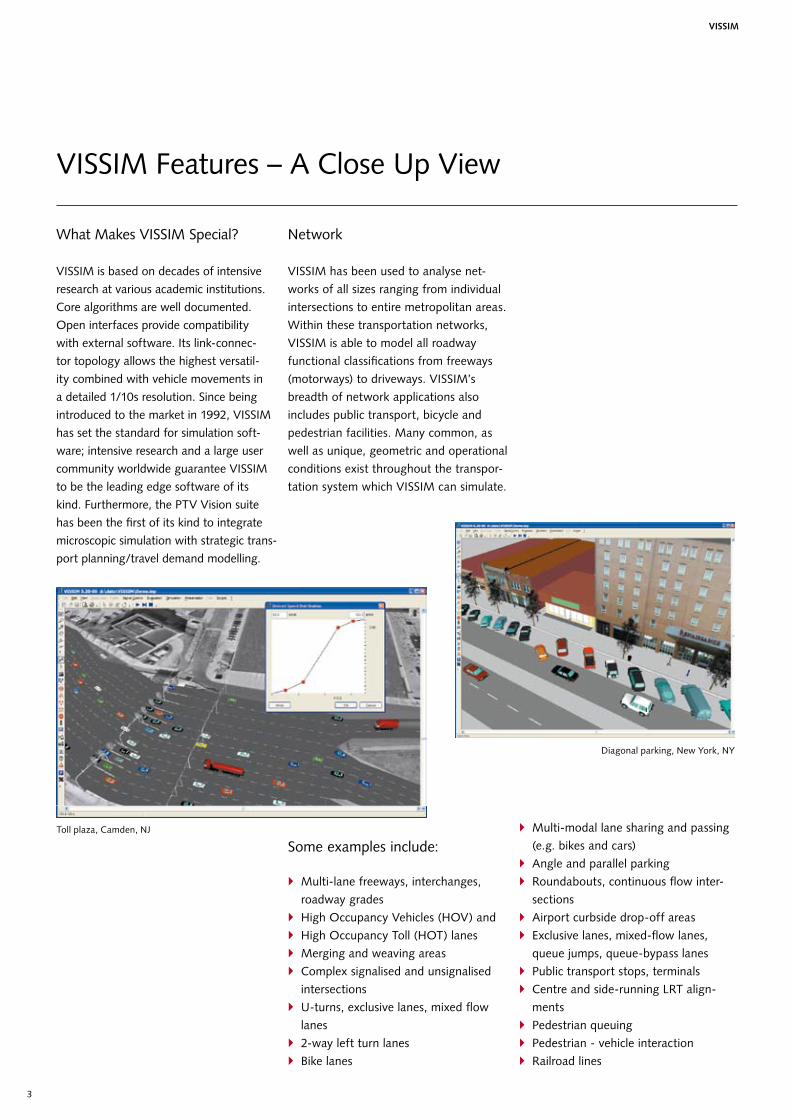
Toll plaza, Camden, NJ
Diagonal parking, New York, NY
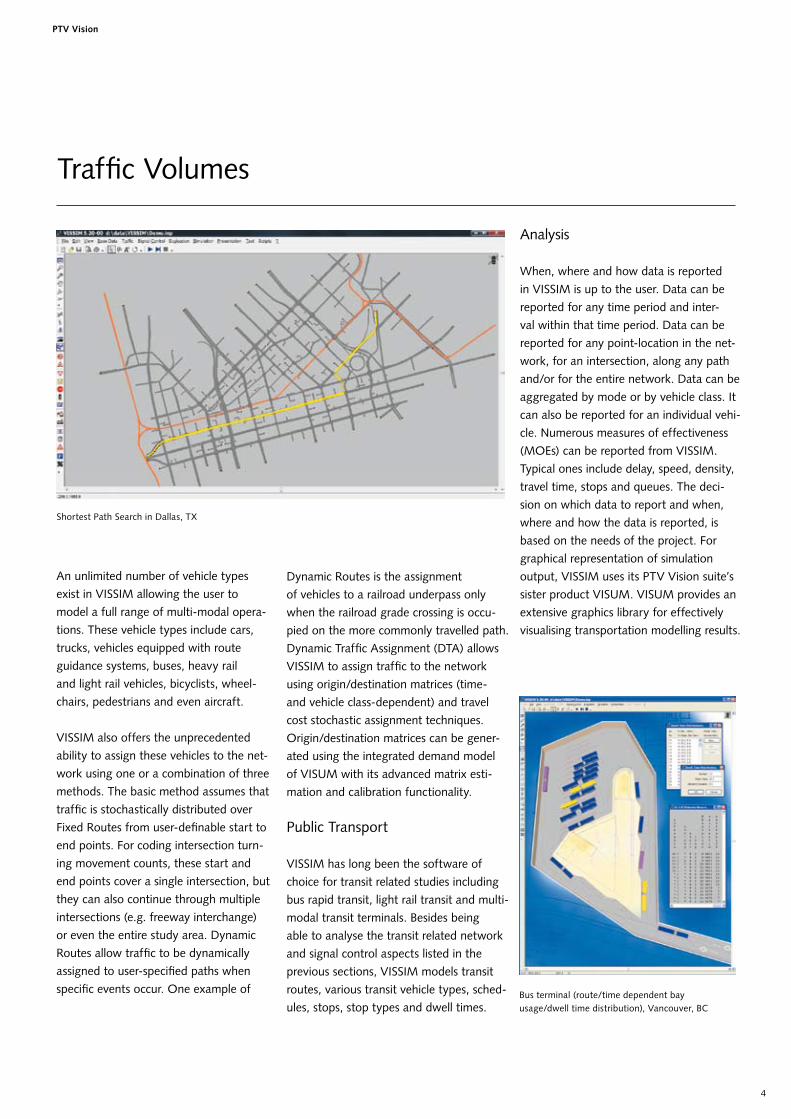
Traffic Volumes
An unlimited number of vehicle types
exist in VISSIM allowing the user to
model a full range of multi-modal opera-
tions. These vehicle types include cars,
trucks, vehicles equipped with route
guidance systems, buses, heavy rail
and light rail vehicles, bicyclists, wheel-
chairs, pedestrians and even aircraft.
VISSIM also offers the unprecedented
ability to assign these vehicles to the net-
work using one or a combination of three
methods. The basic method assumes that
traffic is stochastically distributed over
Fixed Routes from user-definable start to
end points. For coding intersection turn-
ing movement counts, these start and
end points cover a single intersection, but
they can also continue through multiple
intersections (e.g. freeway interchange)
or even the entire study area. Dynamic
Routes allow traffic to be dynamically
assigned to user-specified paths when
specific events occur. One example of
PTV Vision
4
Dynamic Routes is the assignment
of vehicles to a railroad underpass only
when the railroad grade crossing is occu-
pied on the more commonly travelled path.
Dynamic Traffic Assignment (DTA) allows
VISSIM to assign traffic to the network
using origin/destination matrices (time-
and vehicle class-dependent) and travel
cost stochastic assignment techniques.
Origin/destination matrices can be gener-
ated using the integrated demand model
of VISUM with its advanced matrix esti-
mation and calibration functionality.
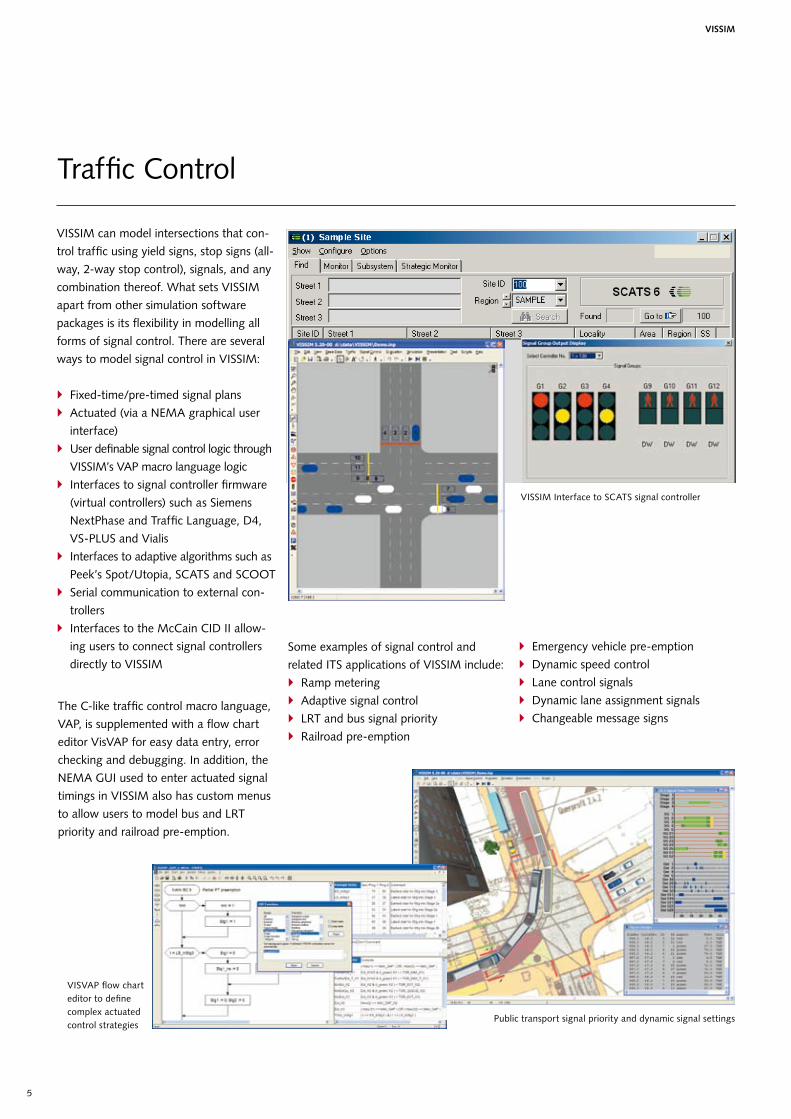
Public Transport
VISSIM has long been the software of
choice for transit related studies including
bus rapid transit, light rail transit and multi-
modal transit terminals. Besides being
able to analyse the transit related network
and signal control aspects listed in the
previous sections, VISSIM models transit
routes, various transit vehicle types, sched-
ules, stops, stop types and dwell times.
Analysis
When, where and how data is reported
in VISSIM is up to the user. Data can be
reported for any time period and inter-
val within that time period. Data can be
reported for any point-location in the net-
work, for an intersection, along any path
and/or for the entire network. Data can be
aggregated by mode or by vehicle class. It
can also be reported for an individual vehi-
cle. Numerous measures of effectiveness
(MOEs) can be reported from VISSIM.
Typical ones include delay, speed, density,
travel time, stops and queues. The deci-
sion on which data to report and when,
where and how the data is reported, is
based on the needs of the project. For
graphical representation of simulation
output, VISSIM uses its PTV Vision suite’s
sister product VISUM. VISUM provides an
extensive graphics library for effectively
visualising transportation modelling results.
Bus terminal (route/time dependent bayusage/dwell time distribution), Vancouver, BC
Shortest Path Search in Dallas, TX
5
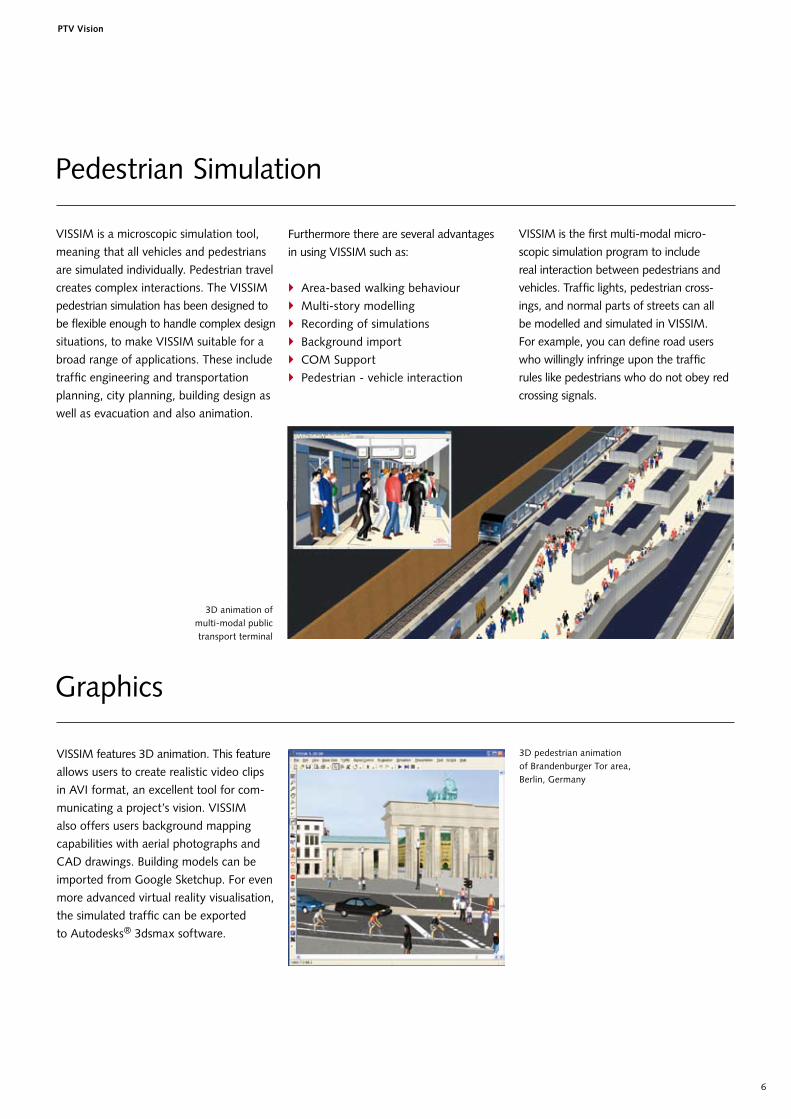
VISSIM can model intersections that con-
trol traffic using yield signs, stop signs (all-
way, 2-way stop control), signals, and any
combination thereof. What sets VISSIM
apart from other simulation software
packages is its flexibility in modelling all
forms of signal control. There are several
ways to model signal control in VISSIM:
Fixed-time/pre-timed signal plans
Actuated (via a NEMA graphical user
interface)
User definable signal control logic through
VISSIM’s VAP macro language logic
Interfaces to signal controller firmware
(virtual controllers) such as Siemens
NextPhase and Traffic Language, D4,
VS-PLUS and Vialis
Interfaces to adaptive algorithms such as
Peek’s Spot/Utopia, SCATS and SCOOT
Serial communication to external con-
trollers
Interfaces to the McCain CID II allow-
ing users to connect signal controllers
directly to VISSIM
Traffic Control
VISSIM Interface to SCATS signal controller
VISSIM
The C-like traffic control macro language,
VAP, is supplemented with a flow chart
editor VisVAP for easy data entry, error
checking and debugging. In addition, the
NEMA GUI used to enter actuated signal
timings in VISSIM also has custom menus
to allow users to model bus and LRT
priority and railroad pre-emption.
Some examples of signal control and
related ITS applications of VISSIM include:
Ramp metering
Adaptive signal control
LRT and bus signal priority
Railroad pre-emption
Emergency vehicle pre-emption
Dynamic speed control
Lane control signals
Dynamic lane assignment signals
Changeable message signs
VISVAP flow charteditor to definecomplex actuatedcontrol strategies
Public transport signal priority and dynamic signal settings
PTV Vision
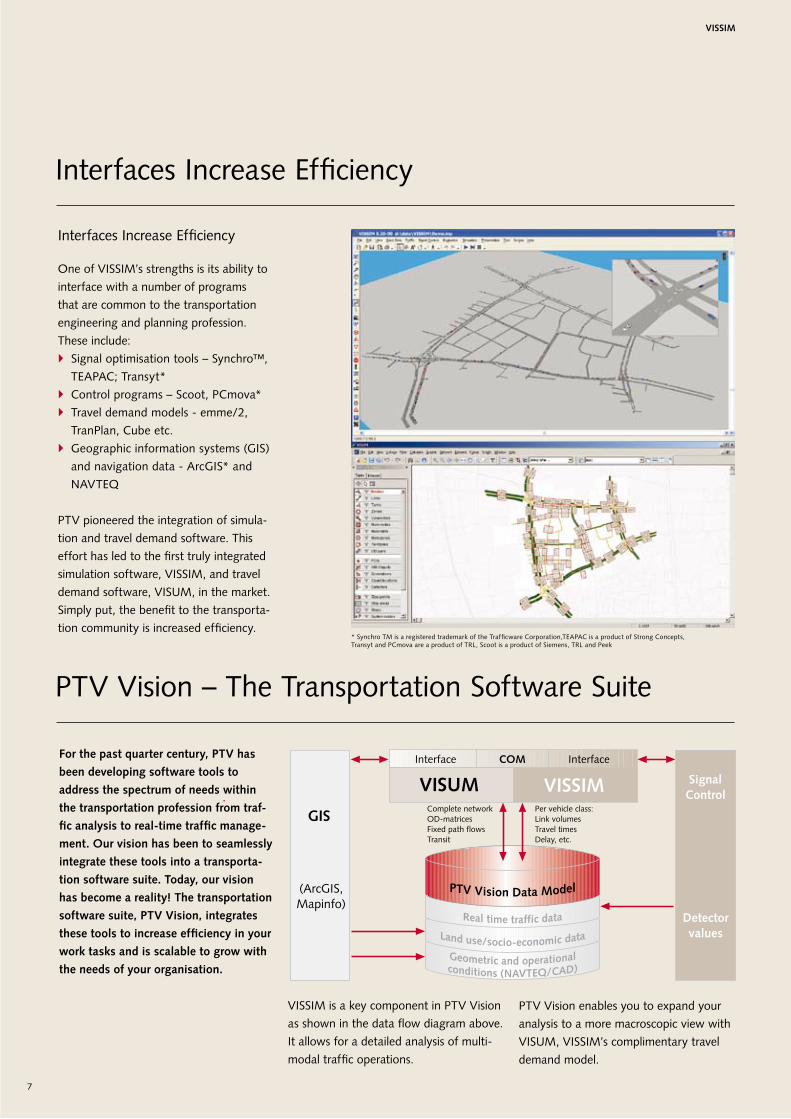
VISSIM is a microscopic simulation tool,
meaning that all vehicles and pedestrians
are simulated individually. Pedestrian travel
creates complex interactions. The VISSIM
pedestrian simulation has been designed to
be flexible enough to handle complex design
situations, to make VISSIM suitable for a
broad range of applications. These include
traffic engineering and transportation
planning, city planning, building design as
well as evacuation and also animation.
3D pedestrian animation of Brandenburger Tor area, Berlin, Germany
6
Graphics
3D animation ofmulti-modal publictransport terminal
VISSIM is the first multi-modal micro-
scopic simulation program to include
real interaction between pedestrians and
vehicles. Traffic lights, pedestrian cross-
ings, and normal parts of streets can all
be modelled and simulated in VISSIM.
For example, you can define road users
who willingly infringe upon the traffic
rules like pedestrians who do not obey red
crossing signals.
Pedestrian Simulation
VISSIM features 3D animation. This feature
allows users to create realistic video clips
in AVI format, an excellent tool for com-
municating a project’s vision. VISSIM
also offers users background mapping
capabilities with aerial photographs and
CAD drawings. Building models can be
imported from Google Sketchup. For even
more advanced virtual reality visualisation,
the simulated traffic can be exported
to Autodesks® 3dsmax software.
Furthermore there are several advantages
in using VISSIM such as:
Area-based walking behaviour
Multi-story modelling
Recording of simulations
Background import
COM Support
Pedestrian - vehicle interaction
�����������������������������������������������������
����� ��������������������������������������������������������
�������������������������������������������������
�������������
���
��������������
����������������
��� ������ ���� �����
���� ���� ������� ����
���� ������������������ ����
��������� ��� ��������������������� ������������
VISSIM is a key component in PTV Vision
as shown in the data flow diagram above.
It allows for a detailed analysis of multi-
modal traffic operations.
VISSIM
For the past quarter century, PTV has
been developing software tools to
address the spectrum of needs within
the transportation profession from traf-
fic analysis to real-time traffic manage-
ment. Our vision has been to seamlessly
integrate these tools into a transporta-
tion software suite. Today, our vision
has become a reality! The transportation
software suite, PTV Vision, integrates
these tools to increase efficiency in your
work tasks and is scalable to grow with
the needs of your organisation.
7
Interfaces Increase Efficiency
Interfaces Increase Efficiency
One of VISSIM’s strengths is its ability to
interface with a number of programs
that are common to the transportation
engineering and planning profession.
These include:
Signal optimisation tools – Synchro™,
TEAPAC; Transyt*
Control programs – Scoot, PCmova*
Travel demand models - emme/2,
TranPlan, Cube etc.
Geographic information systems (GIS)
and navigation data - ArcGIS* and
NAVTEQ
PTV pioneered the integration of simula-
tion and travel demand software. This
effort has led to the first truly integrated
simulation software, VISSIM, and travel
demand software, VISUM, in the market.
Simply put, the benefit to the transporta-
tion community is increased efficiency.
* Synchro TM is a registered trademark of the Trafficware Corporation,TEAPAC is a product of Strong Concepts, Transyt and PCmova are a product of TRL, Scoot is a product of Siemens, TRL and Peek
PTV Vision – The Transportation Software Suite
PTV Vision enables you to expand your
analysis to a more macroscopic view with
VISUM, VISSIM’s complimentary travel
demand model.
PTV AG
Stumpfstr. 1
76131 Karlsruhe
Germany
Traffic Software
Logistics Software Transport Consulting
PTV Vision – VISSIM
VISSIM
_Brochure_e_200
9.indd
Phone: +49 721 9651-300
www.ptv-vision.de
www.ptvag.com
VISSIM – State-of-the-Art Multi-Modal Simulation
5 Reasons for VISSIM
Integration with travel demand model-
ling: exchange of network, demand and
result data
All modes in one simulation: cars, trucks,
busses, LRT, bicycles and pedestrians
Road geometry as detailed as you need it
Comprehensive toolbox for signal con-
trol: interface to signal control
firmware, user definable signal control
logic, manual and automated testing
Convincing 3D visualisation
Application Development Platform
VISSIM offers a COM programming
interface allowing users to integrate
VISSIM in their own applications using
languages like Visual Basic (e.g. in MS
Excel), Python or C++. The COM inter-
face provides access to the network
topology, signal control, path flows,
vehicle behaviour and evaluation data.
Typical applications include automation
of work flow processes, modification of
simulation parameters during run time,
and customised display options. Important
is that COM allows full flexibility and
thus empowers the user to use his or
her own creativity to the fullest extent.
PTV’s Focus on the Users
Fore more than 15 years, the PTV Vision
development team has been setting
new standards that our clients value
and our competitors aspire to. Today,
PTV Vision is helping increase the pro-
ductivity of transportation profession-
als and the value they provide to their
countries in more than 90 countries.
We view our clients as a pivotal
resource for ideas. Our industry lead-
ing products combined with our desire
and motivation to continue setting
new standards guarantees a sound
investment for years to come.
Walk this way
VISWALK – Pedestrian Simulation
VISWALK – PEDESTRIAN SIMULATION
What you get out of it
Dynamic routing
VISWALK enables you to perform a simulation where
pedestrians not only choose the shortest but also the
fastest route to get to their destination – because time
really does matter.
Analytical output
Produce with VISWALK high value analytical outputs such
as journey times, density levels, level of services (LOS),
queuing times and waiting times.
Scientific-validated results
VISWALK was developed in cooperation with the world’s
leading scientists and researchers and is therefore in simulation
allowing you to consider the psychology of walking people.
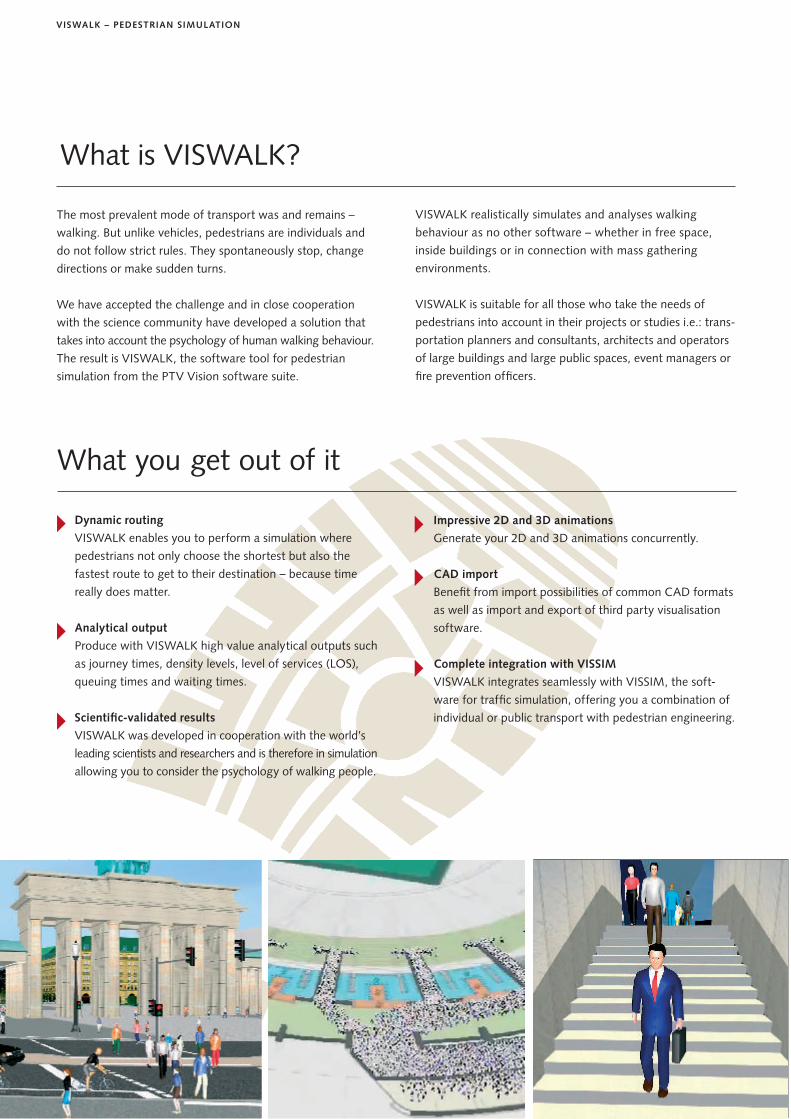
What is VISWALK?
The most prevalent mode of transport was and remains –
walking. But unlike vehicles, pedestrians are individuals and
do not follow strict rules. They spontaneously stop, change
directions or make sudden turns.
We have accepted the challenge and in close cooperation
with the science community have developed a solution that
takes into account the psychology of human walking behaviour.
The result is VISWALK, the software tool for pedestrian
simulation from the PTV Vision software suite.
VISWALK realistically simulates and analyses walking
behaviour as no other software – whether in free space,
inside buildings or in connection with mass gathering
environments.
VISWALK is suitable for all those who take the needs of
pedestrians into account in their projects or studies i.e.: trans-
portation planners and consultants, architects and operators
of large buildings and large public spaces, event managers or
fire prevention officers.
Impressive 2D and 3D animations
Generate your 2D and 3D animations concurrently.
CAD import
Benefit from import possibilities of common CAD formats
as well as import and export of third party visualisation
software.
Complete integration with VISSIM
VISWALK integrates seamlessly with VISSIM, the soft-
ware for traffic simulation, offering you a combination of
individual or public transport with pedestrian engineering.
VISWALK – PEDESTRIAN SIMULATION
BenefitsUse cases
Scientific approach
Use simulation software based on latest scientific insights
and validated against empirical measurements.
High levels of demand
Accommodate an extensive population density of more
than 100,000 in a single simulation.
Efficiency
Reduce costs and project times by concurrently building
your 2D and 3D models directly in VISWALK.
Usability
Start immediately your work and concentrate on your project,
thanks to easy handling and comprehensive functionality
of VISWALK.
Visualisation
Simulate 2D and 3D output with just a click of a button.
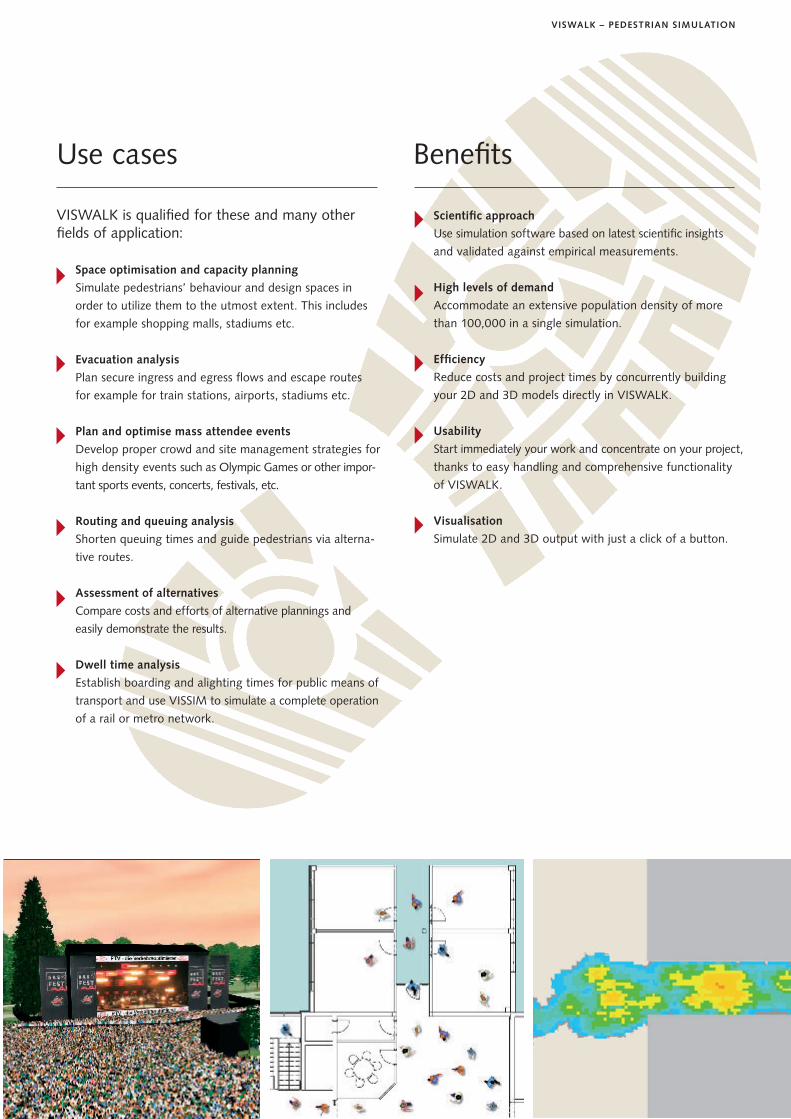
VISWALK is qualified for these and many other fields of application:
Space optimisation and capacity planning
Simulate pedestrians’ behaviour and design spaces in
order to utilize them to the utmost extent. This includes
for example shopping malls, stadiums etc.
Evacuation analysis
Plan secure ingress and egress flows and escape routes
for example for train stations, airports, stadiums etc.
Plan and optimise mass attendee events
Develop proper crowd and site management strategies for
high density events such as Olympic Games or other impor-
tant sports events, concerts, festivals, etc.
Routing and queuing analysis
Shorten queuing times and guide pedestrians via alterna-
tive routes.
Assessment of alternatives
Compare costs and efforts of alternative plannings and
easily demonstrate the results.
Dwell time analysis
Establish boarding and alighting times for public means of
transport and use VISSIM to simulate a complete operation
of a rail or metro network.
More than pure pedestrian analysis: VISWALK + VISSIM
VISSIM, the traffic simulation solution from the PTV Vision
software suite, started “on the street”. For analysis and
simulation of complex traffic situations, it has been used
around the world for many years.
Whether you implement urban design plans or plan intersec-
tion or junction sequences – with VISSIM you model your
influence on traffic flow in the simulation.
Furthermore you are able to measure the impact of traffic
and traffic signal control on the respective waiting times.
VISWALK and VISSIM is the fully integrated package from
PTV that allows you to simulate the interaction of pedes-
trians and road traffic.
The world of
PTV Vision is the worldwide leading software suite for trans-
vides a full range of solutions – including VISUM, VISSIM,
strategic planning, transport operations and traffic engineering
for macro-, meso- and microscopic application levels.
Get VISWALK
For more information on VISWALK visit:
VIS
WA
LK_B
roch
ure_
e_20
11.in
dd
PO Box 1168
T +61 7 3871 2757 T +61 2 9516 1292
QLD 4066Toowong
PO Box 1902
Representative offices in Auckland, Bangkok, Hong Kong, Jakarta, Macau, Manila, Penang and Taipei
[email protected] www.ptv-vision.com
Transport ConsultingLogistics Software
Traffic Software Brisbane Melbourne
PO Box 694
RichmondVIC 3121T +61 3 9429 2212
Sydney
NewtownNSW 2042
Singapore02-01 Red Dot Traffic
28 Maxwell RoadSingapore 069120
T +65 6323 2746
suite offers a high level of integration within the overall
transportation planning process and, in particular, between
VISWALK and further complementary modules. The software
portation planning and operations analyses. PTV Vision pro- www.ptv-vision.com/viswalk