Embed Size (px)
Citation preview
Visualization of CONCERTO Data
Dan GutuProf. Andreas Wagner
Workshop on data status and first CONCERTO Premium resultsBrussels, October 23rd 2012
Karlsruhe Institute of Technology (KIT)
1
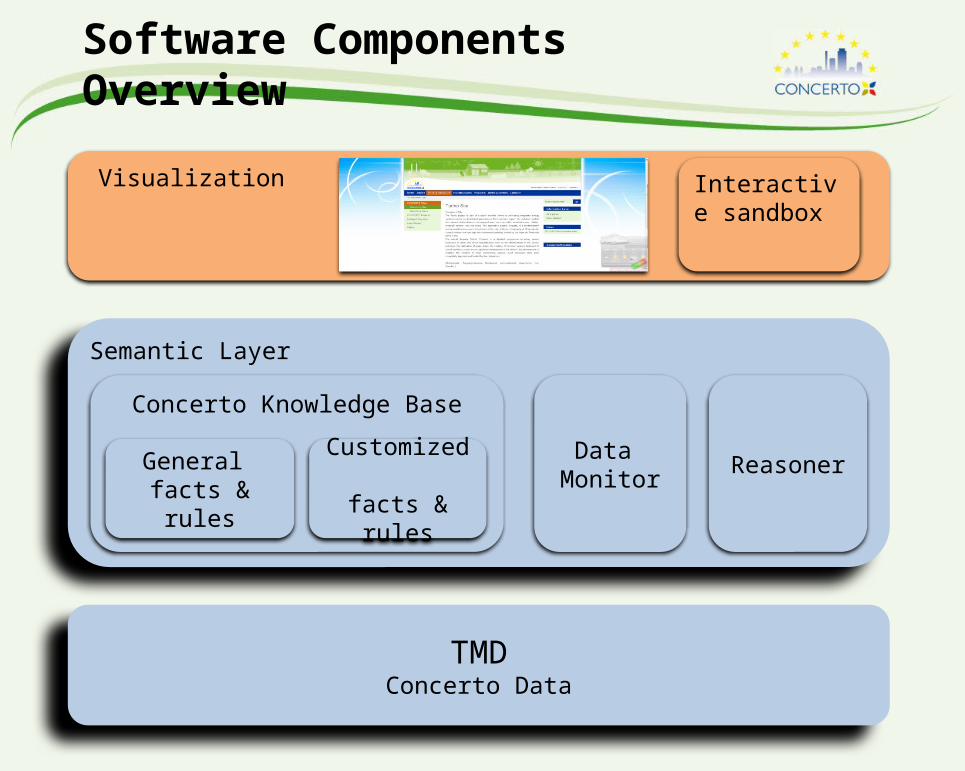
Software Components Overview
TMDConcerto Data
Semantic Layer
Concerto Knowledge Base
General facts & rules
Customized facts & rules
Data Monitor
Visualization
Reasoner
Interactive sandbox

Objectives of Visualization
Provide visual support for the decision making processes regarding energy efficiency measures
Realization through a user-friendly visualization approach of data and indicators related to Buildings and Energy Supply Units
3
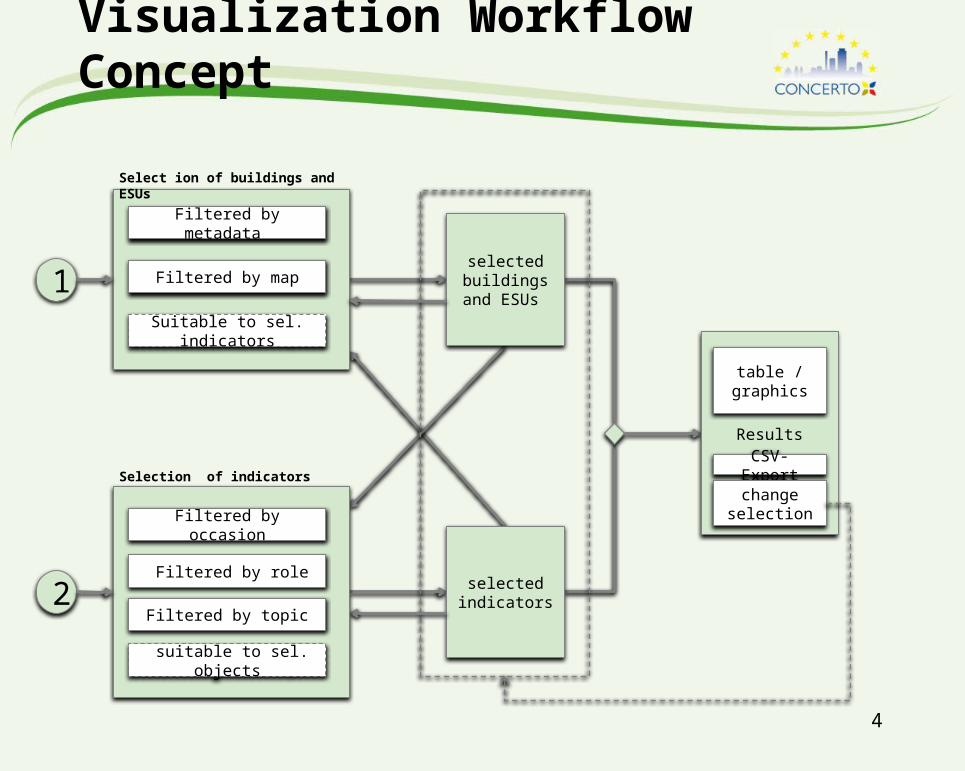
Visualization Workflow Concept
4
Filtered by metadata
Filtered by map1
Select ion of buildings and ESUs
Suitable to sel. indicators
selected buildings and
ESUs
selected indicators
Results
CSV-Export
table / graphics
change selection
Filtered by occasion
2 Filtered by role
Filtered by topic
Selection of indicators
suitable to sel. objects
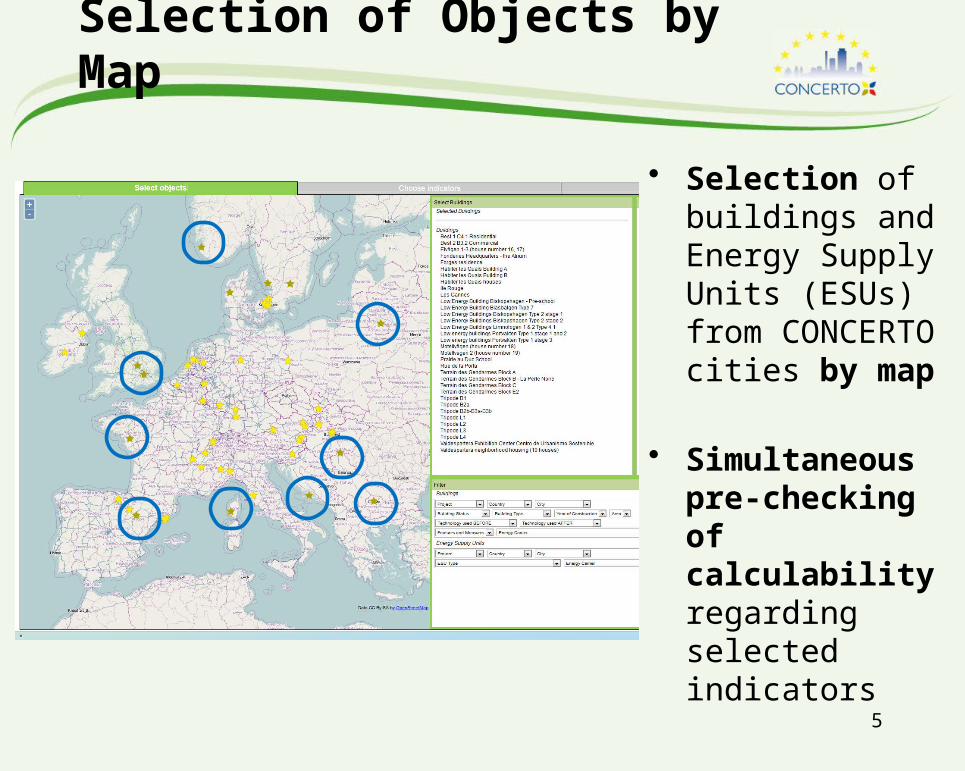
Selection of Objects by Map
5
• Selection of buildings and Energy Supply Units (ESUs) from CONCERTO cities by map
• Simultaneous pre-checking of calculability regarding selected indicators

Selection of Objects by Filtered List
6
• Selection of buildings and ESUs from lists
• Metadata-based filtering of listed buildings and ESUs
• Simultaneous pre-checking of calculability with respect to selected indicators

Selection of Indicators
7
• Selection of indicators for buildings and ESUs from lists
• Metadata-based filtering of listed indicators
• Simultaneous pre-checking of calculability with respect to selected buildings and ESUs
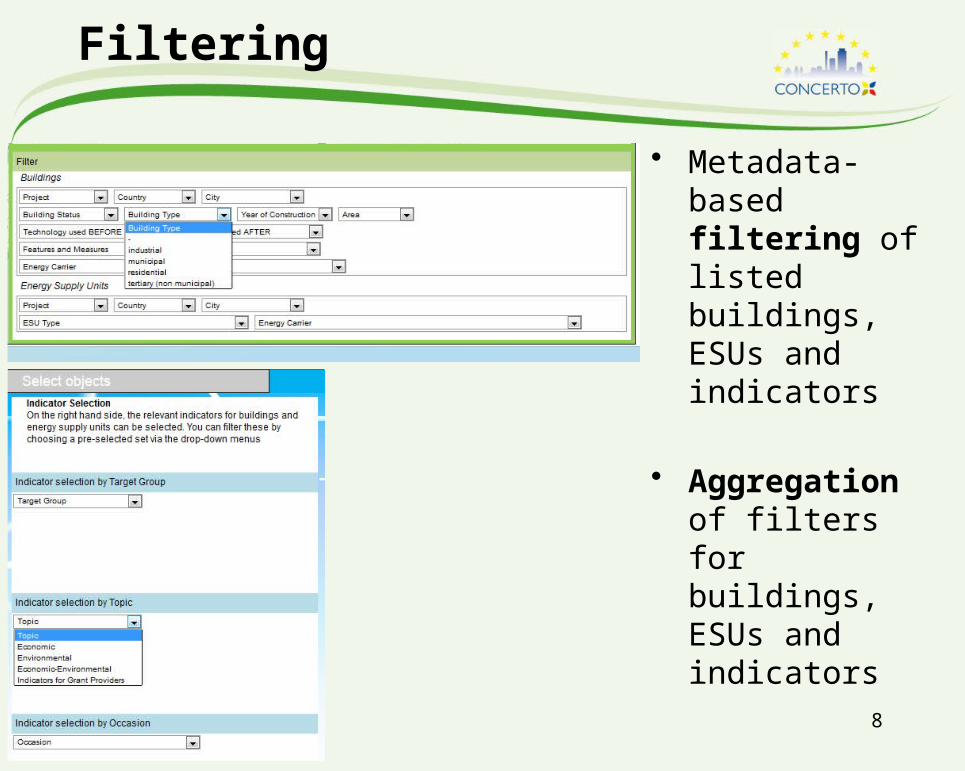
Filtering
8
• Metadata-based filtering of listed buildings, ESUs and indicators
• Aggregation of filters for buildings, ESUs and indicators
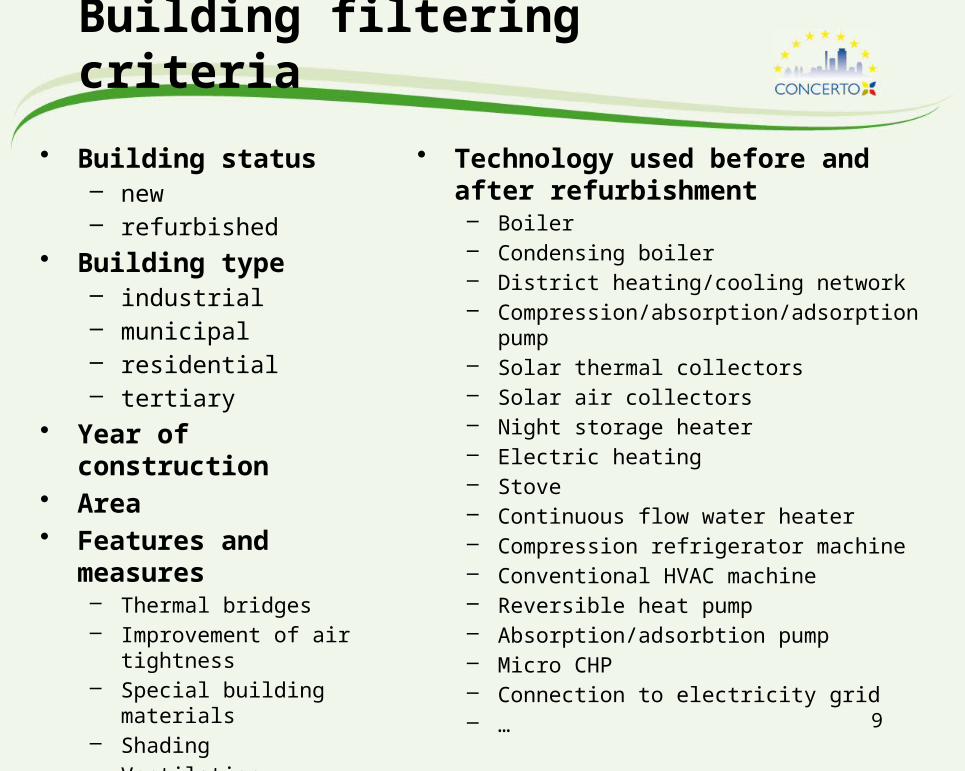
Building filtering criteria
9
• Building status– new – refurbished
• Building type – industrial – municipal – residential – tertiary
• Year of construction • Area • Features and measures
– Thermal bridges – Improvement of air tightness– Special building materials – Shading– Ventilation – …
• Technology used before and after refurbishment – Boiler– Condensing boiler– District heating/cooling network – Compression/absorption/adsorption pump– Solar thermal collectors – Solar air collectors – Night storage heater– Electric heating – Stove – Continuous flow water heater – Compression refrigerator machine – Conventional HVAC machine – Reversible heat pump – Absorption/adsorbtion pump – Micro CHP – Connection to electricity grid – …

ESU filtering criteria
10
• ESU type – Boiler – Solar-thermal – Heat pump – Micro CHP – Photovoltaic– Chiller– Biomass– Geothermal – Wind power– Hydro power– District heating – Thermal storage– Biogas – …
• ESU energy carrier – Light/heavy oil – Domestic gas – grid bound/from tank – Liquefied petroleum gas – Hard coal – Lignite – Wood chips – Pellets – Bio waste– Energy crops – Biogas – District heat/cold – Solar radiation – Ambient air– Geothermal heat – Wind energy – Potential energy – Electricity/’Green’ electricity – …
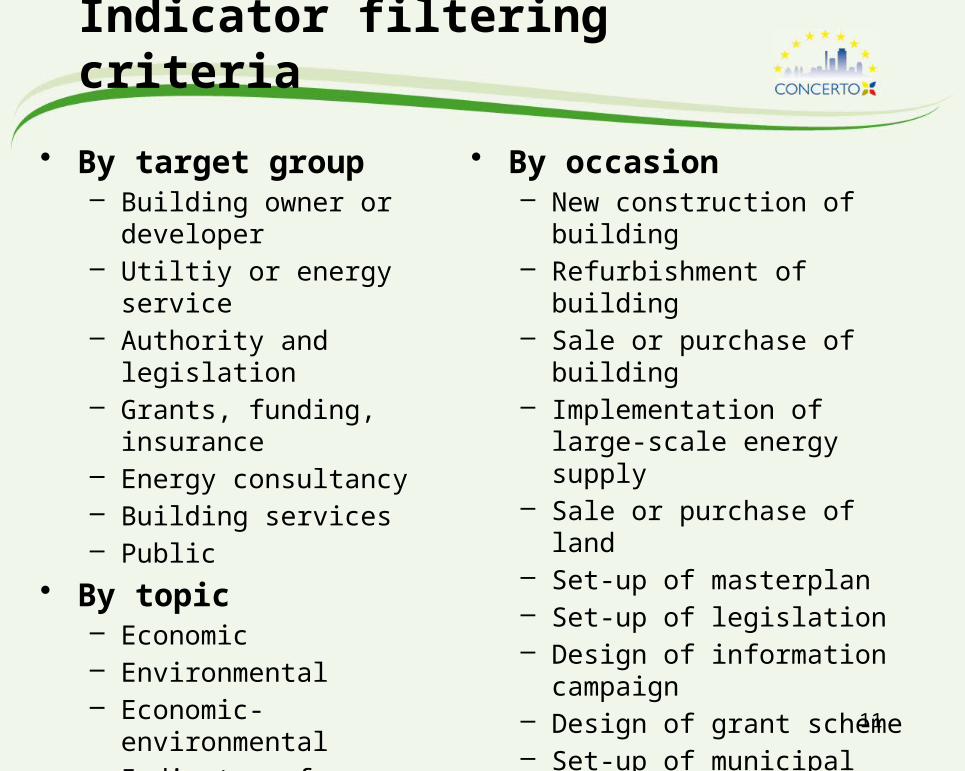
Indicator filtering criteria
11
• By target group – Building owner or
developer– Utiltiy or energy service– Authority and legislation – Grants, funding, insurance – Energy consultancy – Building services– Public
• By topic– Economic – Environmental – Economic-environmental – Indicators for grant
providers
• By occasion – New construction of building– Refurbishment of building – Sale or purchase of building – Implementation of large-scale
energy supply – Sale or purchase of land – Set-up of masterplan – Set-up of legislation – Design of information
campaign – Design of grant scheme – Set-up of municipal targets
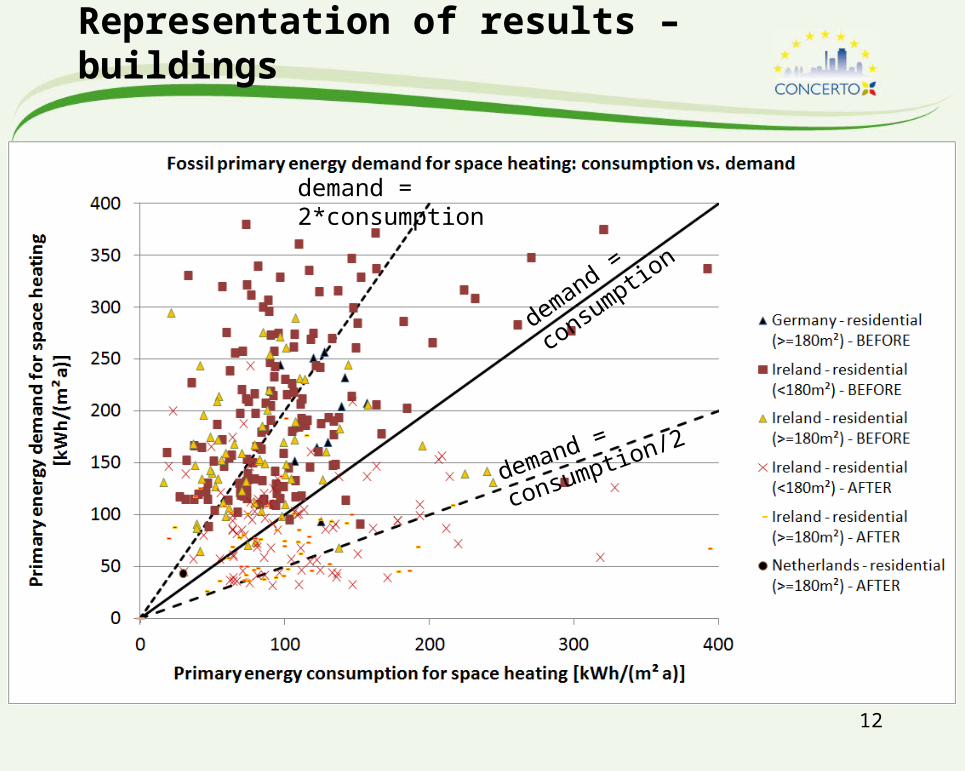
Representation of results – buildings
12
demand = consu
mption
demand = consumption/2
demand = 2*consumption

Representation of results – buildings
13
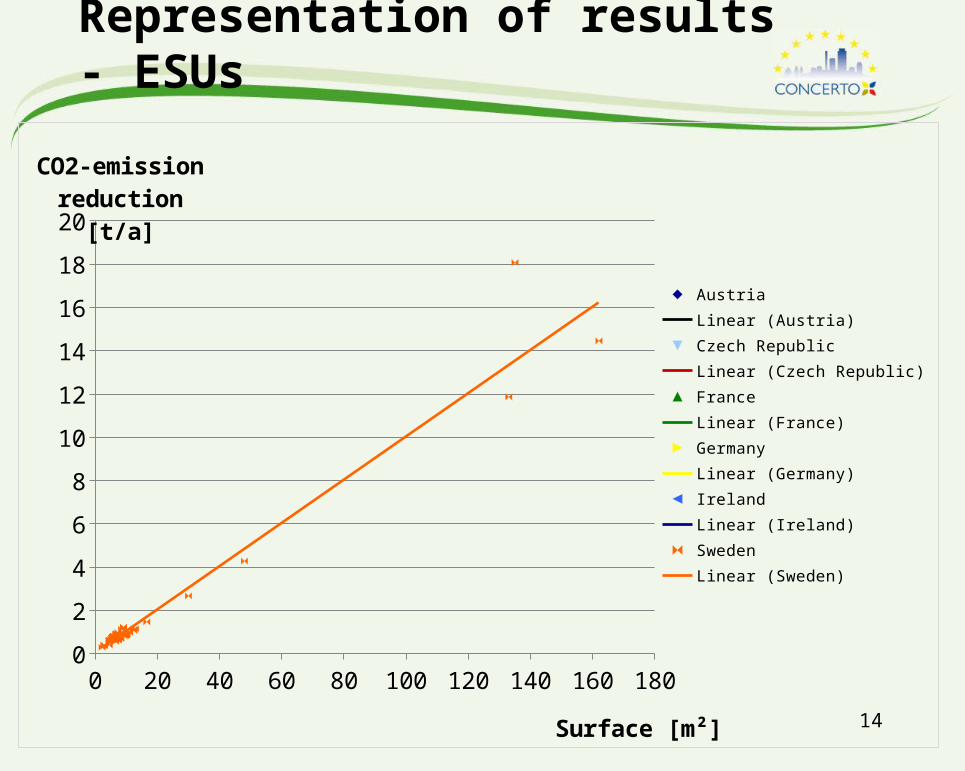
Representation of results - ESUs
14
0 20 40 60 80 100 120 140 160 1800
2
4
6
8
10
12
14
16
18
20
AustriaLinear (Austria)Czech RepublicLinear (Czech Republic)FranceLinear (France)GermanyLinear (Germany)IrelandLinear (Ireland)SwedenLinear (Sweden)
Surface [m²]
CO2-emission reduction [t/a]
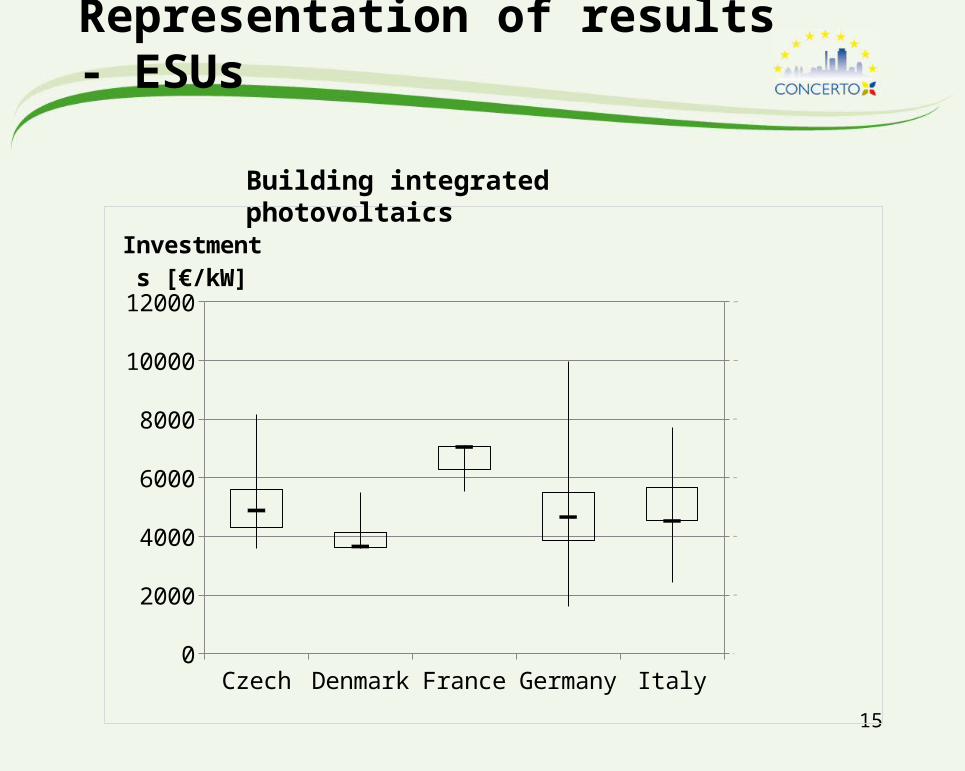
Representation of results - ESUs
15
Czech Denmark France Germany Italy0
2000
4000
6000
8000
10000
12000
0
2 0 0 0
4 0 0 0
6 0 0 0
8 0 0 0
1 0 0 0 0
1 2 0 0 0
Investments [€/kW]
Building integrated photovoltaics

Demonstration – Scenario
16


![Karlsruhe Institute of Technology arXiv:2006.16852v2 [cs.MS] 1 … · 2020-07-02 · PRATIK NAYAK, Karlsruhe Institute of Technology TOBIAS RIBIZEL, Karlsruhe Institute of Technology](https://img.pdfslide.us/doc/110x75/5f2e04912fb8123cdf7552b6/karlsruhe-institute-of-technology-arxiv200616852v2-csms-1-2020-07-02-pratik.jpg)