Embed Size (px)
Citation preview

A Guide to Inform Institutions about Participation in PJM’s Demand Response Programs
John Soden & Robin Aldina
Dr. Dalia Patiño-Echeverri, Advisor
May 2013
Masters Project submitted in partial fulfillment of the requirements for the Master of Environmental
Management degree in the Nicholas School of the Environment of Duke University
2013

Contents Figures .......................................................................................................................................................... 4
Tables ............................................................................................................................................................ 5
Appendices .................................................................................................................................................... 6
Abstract ......................................................................................................................................................... 7
Acronyms ...................................................................................................................................................... 8
Key Terms ..................................................................................................................................................... 9
1 Introduction ......................................................................................................................................... 11
2 State of Research ................................................................................................................................. 11
2.1 Introduction ................................................................................................................................. 11
2.2 Available Information ................................................................................................................. 12
3 Methods and Analysis ......................................................................................................................... 14
4 Electricity Markets .............................................................................................................................. 15
4.1 Introduction ................................................................................................................................. 15
4.2 Wholesale Electricity Markets .................................................................................................... 15
4.3 Market Structures ........................................................................................................................ 19
4.4 PJM Interconnection LLC ........................................................................................................... 22
4.5 PJM’s Market Structure: An Overview ...................................................................................... 24
4.5.1 PJM’s Energy Market: An Overview .................................................................................. 25
4.5.2 PJM’s Capacity Market: An Overview ............................................................................... 25
4.5.3 PJM’s Ancillary Services Market: An Overview ................................................................ 26
4.5.4 PJM’s Financial Transmission Rights (FTR) Market: An Overview ................................. 27
4.6 Demand Response: An Industry Overview ................................................................................. 27
4.7 Demand Response in PJM .......................................................................................................... 32
4.8 Economic Load Response Program ............................................................................................ 33
4.8.1 Program Introduction .......................................................................................................... 33
4.8.2 Registration in the Economic Program ............................................................................... 34
4.8.3 Market Engagement ............................................................................................................ 35
4.8.4 Metering .............................................................................................................................. 35
4.8.5 Settlement ........................................................................................................................... 36
4.9 Emergency Load Response Program .......................................................................................... 36
4.9.1 Program Introduction .......................................................................................................... 36
4.9.2 Registration in the Emergency Program ............................................................................. 38
4.9.3 Market Engagement ............................................................................................................ 42
4.9.4 Metering .............................................................................................................................. 42
4.9.5 Emergency Operations ........................................................................................................ 43
4.9.6 Event Compliance ............................................................................................................... 43

4.9.7 Settlement ........................................................................................................................... 44
4.9.8 Auditing .............................................................................................................................. 44
4.9.9 Penalties .............................................................................................................................. 46
5 Decision Support Tool ........................................................................................................................ 47
5.1 Introduction ................................................................................................................................. 47
5.2 Capacity Market .......................................................................................................................... 47
5.3 Capacity Revenue ....................................................................................................................... 49
5.4 Revenue Calculator ..................................................................................................................... 49
5.4.1 Revenue Calculation ........................................................................................................... 49
5.4.2 Market Price ........................................................................................................................ 51
5.4.3 Market Price Estimation ...................................................................................................... 51
5.4.4 Inputs ................................................................................................................................... 54
5.4.5 Outputs ................................................................................................................................ 55
5.4.6 Scenario Analysis ................................................................................................................ 56
5.4.7 Alternative Market Price Estimation ................................................................................... 58
5.4.8 Environmental Impacts ....................................................................................................... 59
6 Conclusion .......................................................................................................................................... 61
6.1 General Conclusions ................................................................................................................... 61
6.2 Further Research ......................................................................................................................... 62
Figures FIGURE 1: VISUAL GRAPHIC OF INFORMATION STREAM AND THIS STUDY’S PURPOSE ................................................. 13
FIGURE 2: MAP OF ELECTRICITY RESTRUCTURING ....................................................................................................... 16
FIGURE 3: MAP OF THE NORTH AMERICAN ISOS/RTOS ............................................................................................... 17
FIGURE 4: REGULATED VS. DEREGULATED ELECTRICITY INDUSTRY STRUCTURE ........................................................ 18
FIGURE 5: WHOLESALE VS. RETAIL ELECTRICITY MARKETS ....................................................................................... 19
FIGURE 6: MAP OF PJM’S TERRITORY .......................................................................................................................... 23
FIGURE 7: PJM MARKET OVERVIEW ............................................................................................................................ 24
FIGURE 8: GRAPHICAL ILLUSTRATION OF BRA RESULTS DELIVERY YEAR 2012/2013 ................................................ 26
FIGURE 9: UNITED STATES CONSUMPTION FOR ELECTRICITY GENERATION (1949-2010) ............................................ 28
FIGURE 10: IMPACTS OF DEMAND ELASTICITY ON WHOLESALE PRICE ........................................................................ 29
FIGURE 11: TOTAL REPORTED POTENTIAL PEAK REDUCTION IN THE 2006 THROUGH 2012 FERC SURVEYS ............... 30
FIGURE 12: REPORTED POTENTIAL PEAK REDUCTION BY CUSTOMER CLASS IN 2006, 2008, 2010 AND 2012 .............. 31
FIGURE 13: REPORTED POTENTIAL PEAK REDUCTION BY PROGRAM TYPE AND BY CUSTOMER CLASS IN 2012 FERC
SURVEY ............................................................................................................................................................... 32
FIGURE 14: THE STRUCTURE OF PJM’S DEMAND RESPONSE PROGRAMS ..................................................................... 33
FIGURE 15: THE STRUCTURE OF THE ECONOMIC PROGRAM ......................................................................................... 34
FIGURE 16: THE STRUCTURE OF EMERGENCY LOAD RESPONSE PROGRAM .................................................................. 37
FIGURE 17: SOURCES AND BUSINESS SEGMENTS FOR EMERGENCY DR ACTIVITY FOR DELIVERY YEAR 2012/2013 ... 38
FIGURE 18: ESTIMATION OF REVENUE EARNED BY DEMAND RESOURCES IN PJM MARKETS ...................................... 48
FIGURE 19: ZONAL CAPACITY PRICES OVER TIME ....................................................................................................... 52
FIGURE 20: USER INPUT SCREEN OF THE REVENUE CALCULATOR ................................................................................ 55
FIGURE 21: OUTPUT SCREEN OF THE REVENUE CALCULATOR ...................................................................................... 56
FIGURE 22: ANALYSIS OF THE EFFECT OF PRODUCT TYPE ON REVENUE ........................................................................ 57
FIGURE 23: ANALYSIS OF THE EFFECT OF LDA ON REVENUE ....................................................................................... 57
FIGURE 24: ANALYSIS OF MINIMUM AND MAXIMUM HISTORIC CAPACITY PRICES ......................................................... 58

Tables TABLE 1: DESCRIPTION OF U.S. BASED ISOS/RTOS .................................................................................................... 19
TABLE 2: PJM STATISTICS ........................................................................................................................................... 23
TABLE 3: GENERAL REQUIREMENTS FOR DEMAND RESPONSE RESOURCES IN THE RPM ............................................. 38
TABLE 4: EMERGENCY PROGRAM ENROLLMENT OPTIONS ........................................................................................... 39
TABLE 5: DEMAND RESPONSE ASSET CLASSIFICATION FOR EMERGENCY PROGRAM ................................................... 40
TABLE 6: LOAD MANAGEMENT PROGRAMS ................................................................................................................. 41
TABLE 7: PRODUCT TYPES ........................................................................................................................................... 41
TABLE 8: PJM METERING EQUIPMENT REQUIREMENTS ............................................................................................... 43
TABLE 9: COMPLIANCE DETERMINATION BY LOAD MANAGEMENT PROGRAM ............................................................ 44
TABLE 10: GENERAL TESTING PARAMETERS ............................................................................................................... 45
TABLE 11: AUDITING PARAMETERS BY PRODUCT TYPE ............................................................................................... 45
TABLE 12: VARIABLES USED IN THE CALCULATION OF CAPACITY PAYMENTS .............................................................. 50
TABLE 13: VARIABLES USED IN THE DETERMINATION OF MARKET-CLEARING PRICES .................................................. 51
TABLE 14: AVERAGE, MINIMUM, MAXIMUM, AND STANDARD DEVIATION OF HISTORICAL NON-LDA CAPACITY PRICES
............................................................................................................................................................................ 53

Appendices APPENDIX A: TIMING AND STRUCTURE OF PJM’S ENERGY MARKET ........................................................................... 64
APPENDIX B: RELIABILITY PRICING MODEL TIMELINE ................................................................................................ 65
APPENDIX C: HISTORY OF PJM .................................................................................................................................... 66

Abstract
Increasing reliability concerns over the last decade have led stakeholders within the Energy Industry to
place a great deal of attention on the management of electricity load. Traditionally, consumers have been
shielded from the price signals that indicated high stress on the electricity grid, but through a process
known as Demand Response (DR), customers are now being offered incentives to actively manage their
load for increased reliability. Attention on DR has grown with its profusion into electricity markets; at
both the wholesale and retail levels. Focusing on institutional customers and DR programs within the
PJM wholesale electricity market, this study provides a comprehensive resource to answer questions
associated with (1) the regulatory structure of PJM’s markets for DR and (2) the possible benefits that can
result from market participation. As a first step in addressing these objectives, this report first provides an
analysis of the current publically available information, and establishes that there is no single resource
that provides sufficient information to resolve all the questions an institution may have. This report then
offers clear and concise content by which institutional customers can assess the framework of PJM’s DR
programs. Further, a tool for estimating the potential revenue available from participation in the capacity
auction was created to help institutions understand the profitability of engaging in the capacity market.
Finally, this report concludes that while participation in PJM’s demand response programs is a
complicated undertaking, there are a wide variety of options available to meet the unique needs of
individual customers, as well as significant financial incentives.

Acronyms
Acronym: Definition:
BRA Base Residual Auction
CSP Curtailment Service Provider
DASR Day-Ahead Scheduling Reserve
DR Demand Response
EDC Electricity Distribution Company
FERC Federal Energy Regulatory Commission
FRR Fixed Resource Requirement
FTR Financial Transmission Rights
ISOs/RTOs Independent System Operators
LMP Locational Marginal Price
LSE Load Serving Entity
OATT Open Access Transmission Tariff
PJM PJM Interconnection LLC
PLC Peak Load contribution
REG Regulation
RPM Reliability Pricing Model
RTO Regional Transmission Organizations
SR Synchronized Reserve

Key Terms
Term: Definition:
Behind the
Meter
Generation
“A generating unit that delivers energy to load without using the Transmission
System or any distribution facilities unless the entity that owns or leases the
distribution facilities consented to such use of the distribution facilities and such
consent has been demonstrated to the satisfaction of the Office of Interconnection.
Behind the Meter Generation may not include at any time any portion of a
generating unit’s capacity that is designated as a Capacity Resource or any portion of
the output of a generating unit that is sold to another entity for consumption at
another electrical location or into the PJM Interchange Energy Market at any time.”1
Bilateral
Agreement
“An agreement between two entities (one or both being PJM Members) for the sale
and delivery of a service.”2
Bilateral Market “Provides LSEs the opportunity to hedge the Locational Reliability Charge
determined through the BRA and Second Incremental Auction. The Bilateral Market
also provides resource providers an opportunity to cover any auction commitment
shortages.”3
Capacity
Resource
“Includes megawatts of net capacity from existing or planned generation capacity
resources or load reduction capability provided by Demand Resources or ILR in the
PJM Region.”4
Curtailment
Service Provider
(CSP)
“Member or Special Member, whose action on behalf of itself or one or more other
Members or non-members, participates in the PJM Interchange Market by causing a
reduction in demand.”5
Daily Unforced
Capacity
Obligation
“The capacity obligation of a Load Serving Entity during the Delivery Year.”6
Delivery Year
(DY)
“Planning period for which resources are being committed and for which a constant
load obligation for the entire PJM region exists. For example, the 2007/2008
Delivery Year corresponds to the June 1, 2007 – May 31, 2008 Planning Period.”7
Electric
Distribution
Company (EDC)
“PJM Member that owns or leases with rights equivalent to ownership electric
distribution facilities that are used to provide electric distribution service to electric
load within the PJM Control Area.”8
eMKT “Allows PJM members to submit information and obtain data needed to conduct
business in the Day-Ahead, Regulation and Synchronized Reserve markets.”9
Locational
Marginal Price
(LMP)
“The hourly integrated market clearing marginal price for energy at the location the
energy is delivered or received.”10
1 PJM Manual 35: Definitions and Acronyms. Revision: 19, Effective Date: June 24, 2011. Section 2, Page 11.
2 PJM Manual 35: Definitions and Acronyms. Revision: 19, Effective Date: June 24, 2011. Section 2, Page. 11.
3PJM Manual 35: Definitions and Acronyms. Revision: 19, Effective Date: June 24, 2011. Section 2, Page 11.
4PJM Manual 35: Definitions and Acronyms. Revision: 19, Effective Date: June 24, 2011. Section 2, Page 14.
5PJM Manual 35: Definitions and Acronyms. Revision: 19, Effective Date: June 24, 2011. Section 2, Page 18.
6PJM OATT, Attachment DD: Reliability Pricing Model, Effective Date: 9/17/2010. Section 2.18: Daily Unforced
Capacity Obligation, Page 2416. 7PJM Manual 35: Definitions and Acronyms. Revision: 19, Effective Date: June 24, 2011. Section 2, Page 20.
8PJM Manual 35: Definitions and Acronyms. Revision: 19, Effective Date: June 24, 2011. Section 2, Page 25.
9PJM website: eMKT. Source: http://www.pjm.com/markets-and-operations/etools/emkt.aspx
10PJM Manual 35: Definitions and Acronyms. Revision: 19, Effective Date: June 24, 2011. Section 2, Page 45.

Open Access
Transmission
Tariff (OATT)
“The PJM Open Access Transmission Tariff on file with the Federal Energy
Regulatory Commission, as it may be amended from time to time.”11
Peak Load
Contribution
(PLC)
“A customer’s contribution to a zone’s normalized summer peak load, as estimated
by the zone’s Electric Distribution Company. Used in determining a Load Serving
Entity’s obligation Peak Load.”12
PJM Operating
Agreement
“Governs how PJM operates. Members sign this agreement to be a part of PJM.”13
11
PJM Manual 35: Definitions and Acronyms. Revision: 19, Effective Date: June 24, 2011. Section 2, Page 77. 12
PJM Manual 35: Definitions and Acronyms. Revision: 19, Effective Date: June 24, 2011. Section 2, Page 58. 13
PJM website: Agreements / Governing Documents. Source: http://pjm.com/documents/agreements.aspx

1 Introduction
Demand Response is the act of managing electricity load such that electricity consumers can change usual
demand patterns in response to the price of electricity or when the electric grid system is in an
emergency.14
This ability to reduce demand during times of high-stress is likely to have important
environmental and economic benefits because it reduces the need to build new power generation
infrastructure and/or transmission lines that can be costly, and it may also reduce the need to dispatch
expensive and polluting electric power generators. Historically only a few of the largest commercial and
industrial customers were contracted by their utilities to participate, but recent technological
advancements such as the proliferation of advanced meter infrastructure, and changes in regulatory policy
at the federal, state, and market levels has substantially improved the ability of all consumer classes to
actively manage their load. One such group of customers is institutions such as colleges and universities
which have high levels of demand, but are also typically progressive in their stance on environmental
issues.
With more customers enabled to participate, and increased integration at both the wholesale and retail
levels, Demand Response (DR) has received a great deal of attention in recent years. This attention has
been beneficial in that more research, time, and effort is being spent on DR, yet it has also led to an
overwhelming amount of written material that is unorganized and difficult to understand for those
unfamiliar with the subject. Thus, this study aims to provide institutional customers located within the
PJM Interconnection’s (PJM) territory a comprehensive resource to answer important questions for
institutions associated with (1) the regulatory structure of PJM’s markets for DR and (2) the possible
benefits that can result from market participation. The end goal is to offer a stand-alone document that
empowers institutional customers with the information of how DR programs operate within PJM and a
decision support tool that enables them to assess the benefits of such undertakings.
The content contained in the subsequent sections follows this two-pronged purpose of this study. In
Section 2 there is a discussion of the State of Research, including a broad review and consolidation of the
material currently available to institutions regarding DR. Section 3 articulates the methods and research
used to fulfill the aforementioned purposes of this report. Section 4 explains the framework for
understanding the regulatory structure of PJM’s DR programs by starting with an overview of electricity
markets and eventually outlining the way DR operates within the markets overall governance structure.
Section 5 delves into the decision support tool, including a description of PJM’s capacity market, a
discussion of market-clearing prices, and scenario analysis of the revenue potential from participation.
Finally, Section 6 offers general conclusions found while producing this study, as well as identifies
further research that could be done to augment the information presented.
2 State of Research 2.1 Introduction
In the last decade, stakeholders within the Energy Industry have placed a great deal of attention on DR.
This attention has grown proportionally with DR’s integration into electricity markets; at both the
wholesale and retail levels. Currently, there are many entities studying, analyzing, and researching DR in
an effort to answer varying questions relating to profitability, reliability, and applicability. These entities
range from industry participants such as market governing agencies, to national laboratories and
consultants. Thus, the purpose of this section is to review the material that is currently available to
institutional customers within PJM’s territory, as well as to examine flow of this information.
14
FERC website: Reports on Demand Response & Advanced Metering. Source:
http://www.ferc.gov/industries/electric/indus-act/demand-response/dem-res-adv-metering.asp

2.2 Available Information
Information regarding DR is abundant and publically available from a variety of sources (this study
reviewed forty-seven different resources). Focusing on the PJM Interconnection, those sources of
information come from the following entities:
1. Market administrator:
Specifically, PJM’s Manuals, Operating Agreement, Reliability Assurance Agreement, and
OATT. These documents describe the regulatory structure of PJM’s market and associated
DR programs.
2. Market participants:
These are actively participating CSPs15
. These entities release whitepapers and professional
service information in an effort to disseminate information and garner market participation.
3. Industry consultants:
Consulting firms with Energy Industry cliental such as DNV KEMA Energy & Sustainability,
The Brattle Group, Booz Allen Hamilton, and Deloitte offer reports on the industry related
issues.
4. Third party research entities:
Entities such as the National Laboratories and the ISO/RTO Council that provide insightful
information and analysis on the market for DR.
5. Other federal regulatory agencies:
Agencies such as the FERC, EPA, and DOE that provide reports on the status of the market
as well as help to set market trends and enact policy.
While the information from these resources is valuable and pertinent to participating in PJM’s DR
programs, it can be overwhelming to institutional customers who are trying to understand the regulatory
structure of the market and the potential benefits of participation in DR programs (Figure 1 offers a visual
representation of the information stream and this study’s purpose). This study aims to provide a single
source that answers the questions associated with (1) understanding the regulatory structure of PJM’s DR
programs and (2) assessing the possible benefits that can result from market participation. Using
currently available information from the aforementioned sources, the following sections of this study
offer clear and concise content by which institutional DR resources can assess the framework of PJM’s
DR programs and begin to understand the profitability of such undertakings.
15
List of active CSPs in PJM is available here: http://pjm.com/markets-and-operations/demand-response/csps.aspx

Figure 1: Visual Graphic of Information Stream and this Study’s Purpose

3 Methods and Analysis
Upon assessing information available to institutions interested in participating in PJM’s DR programs it is
clear that while there are a variety of sources producing large quantities of material, this is often
incomplete, dispersed, and difficult to grasp for those not familiar with the operations of a wholesale
electricity markets. This guide is an effort to produce a comprehensive and easy to read resource for
institutions to gain the relevant knowledge needed to become a demand resource in the PJM markets. To
this end, two products were produced: (1) a framework of the regulatory structure of the PJM markets and
(2) a decision support tool aimed at quantifying the revenue potential of participation in the PJM capacity
market -one of the possible markets where DR resources can participate-.
Crafting the framework of the regulatory structure involved an extensive literature review of forty-seven
documents to give institutional customers an understanding of DR, wholesale electricity markets, the PJM
Interconnection, and the specific Economic and Emergency Load Response Programs. Once all the
pertinent information was gathered, it was synthesized into a single-source document to provide an easily
understandable outline of the most important material, complemented with bibliographic references for
users in need of additional explanation. This synthesis of the regulatory framework is presented in
Section 4 of this document.
The second product of this masters project; the decision support tool, involved an assessment of the
methods and equations by which PJM establishes supply and demand in the capacity market, as well as
how capacity payments are calculated. Further, an assessment of historical market-clearing prices was
used to produce a forecast of prices in the demand year 2016 capacity auction. This data was then pulled
together to create a Revenue Calculator that is capable of estimating the potential revenue any customer
could earn from participation in the PJM capacity auction as a DR resource. Section 5 details the decision
support tool.

4 Electricity Markets 4.1 Introduction
The purpose of this Electricity Markets section is to provide an overview of the regulatory structure of
electricity markets, focusing on PJM and its programs for DR. In order to gain a comprehensive
understanding of how DR functions within PJM, however, it is necessary to begin the assessment by
addressing wholesale markets and finally drilling down into a discussion of the DR programs offered by
PJM.
4.2 Wholesale Electricity Markets
In a similar fashion to the airline, trucking, telecommunication, and banking industries, deregulation (also
referred to as restructuring) has introduced competition into the electricity industry through a series of
legislative acts over the course of the last century.16
Although each of the acts approved over the course
of history have played a contributing role to the current state of the electricity industry, many industry
professionals agree that Orders 888 and 889 issued by the Federal Energy Regulatory Commission
(FERC) set the foundation for creating competitive wholesale power markets.17
Prior to these FERC
Orders, the electricity industry had been stymied by monopolies and wealthy holding companies. As
authors Daniel Kirschen and Goran Strbac of Fundamentals of Power System Economics point out, “For
most of the twentieth century, when consumers wanted to buy electrical energy, they had no choice. They
had to buy it from the utility that held the monopoly for the supply of electricity in the area where these
consumers were located.”18
Although some states still regulate traditionally vertically integrated utilities,
there are presently multiple wholesale markets for electricity in which participants may be suppliers,
consumers, and/or brokers, buy and sell electricity in a market exchange. Figure 2 offers a map of which
states are active, suspended, and not active in restructuring their electricity markets.
16
Electric Power Supply Association website: Electricity Primer - The Basics of Power and Competitive Markets,
February 13, 2013. Source: http://www.epsa.org/industry/primer/?fa=wholesaleMarket 17
Energy Information Administration: The Changing Structure of the Electric Power Industry 2000: An Update.
October 2000. Section 7: Wholesale Power Markets and Restructuring the U.S. Power Transmission System, Page
61. 18
Daniel Kirschen and Goran Strbac: Fundamentals of Power System Economics. 2004. Introduction: Section 1.1
Why Competition, Page 1.

Figure 2: Map of Electricity Restructuring
19
The introduction of competition in electricity markets; along with the continued support of the FERC has
led to the formation of Independent System Operators and Regional Transmission Organizations
(ISOs/RTOs).20
More specifically, FERC issued Order 2000 in December 1999 calling for the voluntary
creation of ISOs/RTOs throughout the United States.21
The establishment of ISOs/RTOs was to bolster
the continued movement towards greater competition, while ensuring efficiency, reliability, and security
within the industry. As shown by Figure 3, there are currently ten ISOs/RTOs serving two-thirds of
electricity consumers in the North America22
, six of which are regulated by the FERC.
19
U.S. Energy Information Administration website: Status of Electricity Restructuring by State. Source:
http://www.eia.gov/cneaf/electricity/page/restructuring/restructure_elect.html 20
U.S. Energy Information Administration: The Changing Structure of the Electric Power Industry 2000: An
Update. October 2000. Section 7: Wholesale Power Markets and Restructuring the U.S. Power Transmission
System, Page 62. 21
Energy Information Administration: The Changing Structure of the Electric Power Industry 2000: An Update,
October 2000. Section 7: Wholesale Power Markets and Restructuring the U.S. Power Transmission System, Page
67. 22
ISO/RTO website. The ISO/RTO Council. Source:
http://www.isorto.org/site/c.jhKQIZPBImE/b.2603295/k.BEAD/Home.htm

Figure 3: Map of the North American ISOs/RTOs
23
Previously, the structure of traditional (“vertically integrated”) utility was such that a single entity
generated the electricity, transmitted it from power plants to the load centers, and distributed it to
individual consumers.24
In some cases, the utility could purchase power from independent power
producers, but by-and-large the utility held a monopoly over the market. Since restructuring, the
framework of the market has changed (as shown in Figure 4). The market is centrally managed by the
ISO/RTO and generation owners submit supply offers while load serving entities submit asks to buy.
Allowing for the market to dictate the price at which electricity will be bought and sold; this price is
known as the Clearing Price.
23
FERC: Electric Market Overview: RTO Map, May 1, 2012. Source: http://www.ferc.gov/market-oversight/mkt-
electric/overview/elec-ovr-rto-map.pdf 24
Daniel Kirschen and Goran Strbac: Fundamentals of Power System Economics. 2004. Introduction: Section 1.1
Why Competition. Page 1.

Figure 4: Regulated vs. Deregulated Electricity Industry Structure
25
This new framework has resulted in the creation of distinct Wholesale and Retail markets (see Figure 5).
The market for the bulk sale of electricity, known as the Wholesale Market, encompasses generation and
transmission of bulk electricity. On the other hand, the market for distribution and sale to end-use
customers is known as the Retail Market. Both the Wholesale and Retail markets operate within the
territory of the ISO/RTO.
25
U.S. Department of Energy: A Primer on Electric Utilities, Deregulation, and Restructuring of U.S. Electricity
Markets, May 2002. Page 59. Source: http://www1.eere.energy.gov/femp/pdfs/primer.pdf

Figure 5: Wholesale vs. Retail Electricity Markets
26
4.3 Market Structures
Through the issuances of FERC Orders 888, 889 and 2000, ISOs/RTOs were created on a voluntary basis.
As a result of this balkanized effort to create regional electricity markets, each ISO/RTO is unique in their
policies, procedures, and market operations. The similarities and differences, as pointed out by FERC,
are highlighted in Table 1.
Table 1: Description of U.S. Based ISOs/RTOs
Name of ISO/RTO: States Covered: Market Options:
California (CAISO)
California “CAISO’s Energy Market is a three
settlement (day-ahead, hour-ahead, and
real-time) Spot Market that uses
locational marginal pricing.
Additionally there are programs for
Ancillary services, and Financial
Transmission Rights market.”27
26
NYISO website: Wholesale vs. Retail Electricity. Source:
http://www.nyiso.com/public/about_nyiso/understanding_the_markets/wholesale_retail/index.jsp 27
FERC website: Electric Power Markets: National Overview. Source: http://ferc.gov/market-oversight/mkt-
electric/overview.asp

Midwest (MISO)
All or most of
North Dakota,
South Dakota,
Nebraska,
Minnesota, Iowa,
Wisconsin, Illinois,
Indiana, Michigan
and parts of
Montana, Missouri,
Kentucky, and
Ohio.
“MISO administers a two-settlement
(day-ahead and real-time) Energy Market
known as the Day-2 market. It produces
hourly LMPs that are rolled up into 5
regional hub prices. MISO also
administers a monthly Financial
Transmission Rights allocation and
auction. Moreover, Midwest bilateral
trading is active on the Intercontinental
Exchange at the Cinergy Hub and
Northern Illinois Hub.”28
New England (ISO-NE)
Connecticut,
Maine,
Massachusetts,
New Hampshire,
Rhode Island and
Vermont.
“Within ISO-NE the Energy Market is a
two-settlement (day-ahead and real-time)
spot market with locational marginal
pricing (an internal hub, eight load zones
and more than 500 nodes). There is a
Capacity Market, Forward Reserves
Market, Regulation Market, and
Financial Transmission Rights market.”29
New York (NYISO)
New York “NYISO’s Energy Market is a two-
settlement (day-ahead and real-time) spot
market with locational marginal pricing.
There is a Regional and Locational
Capacity Market, and Financial
Transmission Rights market.”30
PJM Interconnection LLC (PJM)
Delaware, District
of Columbia,
Maryland, New
Jersey, Ohio,
Pennsylvania,
“PJM’s Energy Market is a two-
settlement (day-ahead and real-time) spot
market with locational marginal pricing.
There is a Capacity Market, Ancillary
Services Markets, and Financial
28
FERC website: Electric Power Markets: National Overview. Source: http://ferc.gov/market-oversight/mkt-
electric/overview.asp 29
FERC website: Electric Power Markets: National Overview. Source: http://ferc.gov/market-oversight/mkt-
electric/overview.asp 30
FERC website: Electric Power Markets: National Overview. Source: http://ferc.gov/market-oversight/mkt-
electric/overview.asp

Virginia and West
Virginia. Parts of
Indiana, Illinois,
Kentucky,
Michigan, North
Carolina and
Tennessee.
Transmission Rights Market. Energy
and capacity in the region are also traded
bilaterally through brokers and the
Intercontinental Exchange.”31
Southwest Power Pool (SPP)
Kansas, Oklahoma,
most of Nebraska,
and parts of New
Mexico, Texas,
Louisiana,
Missouri,
Mississippi and
Arkansas.
“SPP provides transmission service on
the transmission facilities owned by its
members and operates the region's real-
time energy imbalance service market.
Market participants trade physical
electricity bilaterally, either directly or
through brokers, and through the EIS
market.”32
Texas (ERCOT)
Texas “ERCOT schedules and centrally
dispatches the grid within a single
control area, ensures transmission
reliability and wholesale open access,
and manages financial settlement in the
wholesale power market. It also
administers the Texas competitive retail
market, including customer switching.
ERCOT operates wholesale markets for
Balancing Energy, Ancillary service
markets with zonal congestion
management. Market participants trade
electricity bilaterally directly, through
brokers and through the Intercontinental
Exchange. Physical products
predominantly use the ERCOT hub
pricing point, but physical and financial
products priced at the four ERCOT zones
are also traded.”33
According to the ISO/RTO Council, an industry organization consisting of representatives from the North
American ISOs/RTOs, many of the benefits from organized wholesale electricity markets are derived
from two key features of ISO/RTO operation: (1) Security-constrained economic dispatch in which all
31
FERC website: Electric Power Markets: National Overview. Source: http://ferc.gov/market-oversight/mkt-
electric/overview.asp 32
FERC website: Electric Power Markets: National Overview. Source: http://ferc.gov/market-oversight/mkt-
electric/overview.asp 33
FERC website: Electric Power Markets: National Overview. Source: http://ferc.gov/market-oversight/mkt-
electric/overview.asp

wholesale market participants can participate; and (2) An associated spot market in which these entities
can buy and sell power, typically at locational marginal prices (LMPs). Security-constrained economic
dispatch and open access to the spot market can provide substantial benefits by allowing market
participants to procure generation in forward capacity markets or by buying power on the spot market to
meet imbalances; this efficiency reduces cost and improves reliability.34
The PJM Interconnection LLC is
one of the six FERC regulated whole electricity markets and is the chosen market of interest for this
report.
4.4 PJM Interconnection LLC
The formation of PJM Interconnection LLC (PJM) began in 1927, but the transition to becoming an RTO
began in 1993 when the PJM Interconnection Association was formed to administer a power pool. By
2001 the organization became the nation’s first fully functioning RTO (a timeline of PJM’s history can be
found in Appendix C).35
As a non-for-profit entity, the responsibility of an RTO is to balance supply and
demand while ensuring system reliability. PJM acts as the grid operator (the entity responsible for
running the wholesale electricity market) for more than 51 million people in all or parts of Delaware,
Illinois, Indiana, Kentucky, Maryland, Michigan, New Jersey, North Carolina, Ohio, Pennsylvania,
Tennessee, Virginia, West Virginia and the District of Columbia ( as shown in Figure 6).36
34
ISO/RTO Council: 2009 State of the Markets Report. Page 6. Source:
http://www.isorto.org/atf/cf/%7B5B4E85C6-7EAC-40A0-8DC3-
003829518EBD%7D/2009%20IRC%20State%20of%20Markets%20Report.pdf 35
PJM website: PJM History. Source: http://pjm.com/about-pjm/who-we-are/pjm-history.aspx 36
ISO/RTO Council: 2010 ISO/RTO Metrics Report. Page 261. Source:
http://www.isorto.org/atf/cf/%7B5B4E85C6-7EAC-40A0-8DC3-003829518EBD%7D/2010%20ISO-
RTO%20Metrics%20Report.pdf

Figure 6: Map of PJM’s Territory
37
PJM boasts several impressive statistics relating to Generating Capacity, Peak Demand, and Population
Served that are the highest amongst all the competitive markets.38
Table 2 offers a summary of those data
points.
Table 2: PJM Statistics39
Memberships 750
Generating Capacity 185,600 MW
Peak Demand 158,448 MW
37
Monitoring Analytics, LLC: State of the Market Report for PJM. March 3, 2012, Page 2. Source:
http://pjm.com/documents/reports/state-of-market-reports/~/media/documents/reports/state-of-market/2011/2011-
som-pjm-volume1.ashx 38
ISO/RTO Council website: IRC Members. Source:
http://www.isorto.org/site/c.jhKQIZPBImE/b.2604455/k.C323/Members.htm 39
PJM: PJM 2011 Annual Report. Page 29. Source: http://pjm.com/~/media/about-pjm/newsroom/annual-
reports/2011-annual-report.ashx
Miles of Transmission Lines 65,441
Gigawatt-hours or Annual Energy 778,000
Annual Billings $35.9 billion
Square Miles 214,000
Population Served 60 million
4.5 PJM’s Market Structure: An Overview
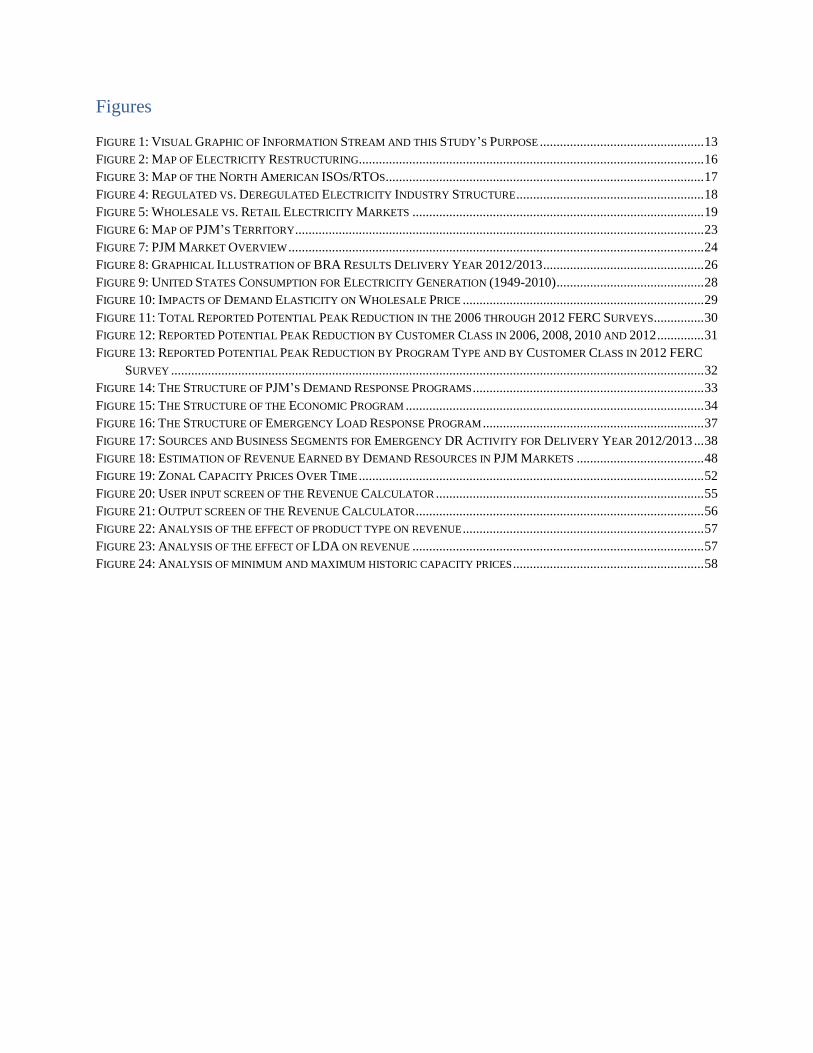
Presently, PJM’s electricity market structure consists of the following four segments: (1) Energy Market,
(2) Capacity Market, (3) Ancillary Services Market, and (4) Financial Transmission Rights (FTR) Market.
As shown in Figure 7, Bilateral Agreements, which constitute sales and deliveries of services, are
conducted in both the Energy and Capacity Markets. What’s more, the programs for Demand Response
(discussed in greater detail below) function through the structures of the Energy Market, Capacity Market,
and Ancillary Services Market.
Figure 7: PJM Market Overview
PJM
Energy Market
Real-Time Market
Day-Ahead Market
Bilateral Market for Energy
Capacity Market
Reliability Pricing Model
Bilateral Market for Capacity
Ancillary Services Market
Synchronized Reserves
Regulation Market
Black Start Services Financial
Transmission Rights (FTR) Market

4.5.1 PJM’s Energy Market: An Overview
PJM’s Energy Market is comprised of two markets (also referred to as settlement periods): the Day-
Ahead Market and the Real-Time Market. According to PJM Manual 11: Energy & Ancillary Services
Market Operations, “The Day-Ahead Market is a forward market in which hourly clearing prices are
calculated for each hour of the next operating day. The balancing market is the Real-Time energy market
in which the clearing prices are calculated every five minutes.”40
Electricity price calculations and
settlements in both the Day-Ahead Market and the Real-Time Market are determined using Locational
Marginal Prices (LMPs); the Day-Ahead Market uses Day-Ahead LMPs and the Real-Time Market uses
Real-Time LMPs. Market participants within the Energy Market also have the option to procure Bilateral
Agreements (Appendix A provides a graphical illustration of time timing and structure of PJM’s Energy
Market). Finally, demand response resources can participate in both the Day-Ahead Market and the Real-
Time Market as each market has its own Economic Load Response Program (discussed in greater detail
below).
4.5.2 PJM’s Capacity Market: An Overview
The Capacity Market in PJM is more formally known as the Reliability Pricing Model (RPM). Initiated
in 2007, the RPM is composed of a series of auctions, starting with the Base Residual Auction (BRA),
that occur during a three year period before the actually delivery of electricity is performed. The RPM
can also be referred to as a Forward Capacity Market (vernacular used across all ISOs/RTOs with
capacity markets), because its purpose is to give long-term price signals to retain and attract investment in
generation within PJM’s region.41
As stated by PJM’s Manual 18: PJM Capacity Market, “The goal of
RPM is to align capacity pricing with system reliability requirements and to provide transparent
information to all market participants far enough in advance for actionable response to the information.”42
The RPM consists of multiple auctions happening over the three year period before the participating
entities are expected to deliver their committed capacity resources. For instance, the Base Residual
Auction (BRA) for Delivery Year June 1, 2015 to May 31, 2016 was initiated in May of 2012. The
design of the RPM is to ensure sufficient procurement of resources to satisfy PJM reliability criterion. It
manages to accomplish this task through several sequential market mechanisms. The first is the BRA
which helps to balance long-term supply and demand such that a market clearing house price for capacity
commitments can be determined (see Figure 8 for a graphical representation of the BRA results for
Delivery Year 2012/2013).
40
PJM Manual 11: Energy & Ancillary Services Market Operations. Revision: 56, Effective Date: November 29,
2012. Section 2: Overview of the PJM Energy Markets, Page 16. 41
PJM website: Reliability Pricing Model. Source: http://www.pjm.com/markets-and-operations/rpm.aspx 42
PJM Manual 18: PJM Capacity Market. Revision: 17, Effective Date: 12/20/2012. Section 1: Overview of the
PJM Capacity Market, Page 3.

Figure 8: Graphical Illustration of BRA Results Delivery Year 2012/2013
43
After the BRA there are three Incremental Auctions to allow load-serving entities to secure additional
capacity commitments needed to protect themselves from potential changes in market (Appendix B
provides a graphical illustration of time timing and structure of PJM’s RPM). Additionally, the RPM
allows for Bilateral Agreements to be made in the Bilateral Market, which provides load-serving entities
an opportunity to sign contractual agreements for capacity commitments outside of the auction.
Furthermore, the Bilateral Market affords load serving entities the opportunity to hedge against the
resulting clearinghouse prices from the auctions.44
4.5.3 PJM’s Ancillary Services Market: An Overview
PJM’s market for Ancillary Services is composed of three services: Synchronized Reserve, Regulation,
and Black Start. These market services help to support the reliable operation of PJM’s transmission grid,
and each is addressed individually in this section.
Synchronized Reserves are resources that provide power to the grid if there is an unexpected generation
shortage or other short-term disruption in supply. Typically this service is provided by generators or
loads that are already providing service to the grid and have the capability to ramp up/down quickly to
help bring the grid back into balance.45
The Market for Synchronized Reserves provides the mechanism
for PJM participants to buy and sell available ancillary services. This market has two settlement periods:
Real-Time and Day-Ahead Scheduling Reserves. PJM takes offers from both of these settlement periods
together with energy offers and resource schedules to calculate hourly Synchronized Reserve Market
43
PJM website: Reliability Pricing Model RPM Auctions. 10/29/2012, Page 41. Source:
http://www.pjm.com/~/media/training/core-curriculum/ip-rpm/rpm-training-section-d-auctions.ashx 44
PJM Manual 18: PJM Capacity Market. Revision: 17, Effective Date: 12/20/2012. Section 5.1: Overview of
RPM Auctions, Page 77. 45
PJM website: Synchronized Reserve. Source: http://www.pjm.com/markets-and-operations/ancillary-
services/synchronized-service.aspx

Clearing Prices and Day-Ahead Scheduling Reserves Clearing Prices, which are used to determine how
many reserves should be procured and how much they should be compensated.46
Regulation service acts to provide the grid with greater stability by balancing the frequency at which
generation meets load. Once again, this service is typically provided by generators or loads that are
already providing service to the grid and can alter their frequency quickly.47
In this respect the Market for
Regulation provides participants with the mechanism by which they can submit buy and sell offers for
regulation resources. In a similar fashion to the Synchronized Reserve, PJM uses the bid price and
quantities, along with the energy offers and resource schedules, to calculate a Regulation Market
Performance Clearing Price. This price is used to determine the extent of Regulation services needed and
how those services will be rewarded.48
Black Start services supply the grid with electricity in the unlikely event that the system fails and all
power is lost. This service is provided by stand-by generators that can help restore the grid to normal
operating conditions.49
The Market for Black Start services provides the mechanism by which PJM
members can submit bids to provide this service and PJM can dispatch available resources at the least
cost.
4.5.4 PJM’s Financial Transmission Rights (FTR) Market: An Overview
The purpose of the FTR Market is to aid market participants in evading price risk when delivering
electricity to the grid. In essence, FTRs are available for those participants buying and selling electricity
wanting to hedge against transmission costs. FTRs can provide market participants with a stream of
revenue or charges based on the congestion on the grid. It is important to note that FTR market
participants do not need to be buying or selling electricity.50
4.6 Demand Response: An Industry Overview
From 2000 to 2008, demand for electricity in the United States grew an average of 0.9 percent per year
(as shown by the graphical representation in Figure 9).51
Historically, utilities and grid operators have
been able to meet this continual growth in electricity consumption by building more generation;
essentially attacking the challenge from the supply side.
46
PJM Manual 11: Energy & Ancillary Services Market Operations. Revision: 56, Effective Date: November 29,
2012. Section 4: Overview of the PJM Synchronized Reserve Market, Page 67. 47
PJM website: Market-Based Regulation. Source: http://www.pjm.com/markets-and-operations/ancillary-
services/mkt-based-regulation.aspx 48
PJM Manual 11: Energy & Ancillary Services Market Operations. Revision: 56, Effective Date: November 29,
2012. Section 3: Overview of the PJM Regulation Market, Page 51. 49
PJM website: Black Start Service. Source: http://www.pjm.com/markets-and-operations/ancillary-services/black-
start-service.aspx 50
PJM website: Financial Transmission Rights. Source: http://pjm.com/markets-and-operations/ftr.aspx 51
U.S. Energy Information Administration: Annual Energy Outlook. Page 1. Source:
http://www.eia.gov/oiaf/aeo/pdf/trend_3.pdf

Figure 9: United States Consumption for Electricity Generation (1949-2010)
52
Demand Response (DR) offers an alternative method to resolve the continual growth in electricity
consumption and moderate investment in new power generation units designed to meet peak loads. In
economic terms, DR accomplishes this task by making the demand curve for electricity more elastic;
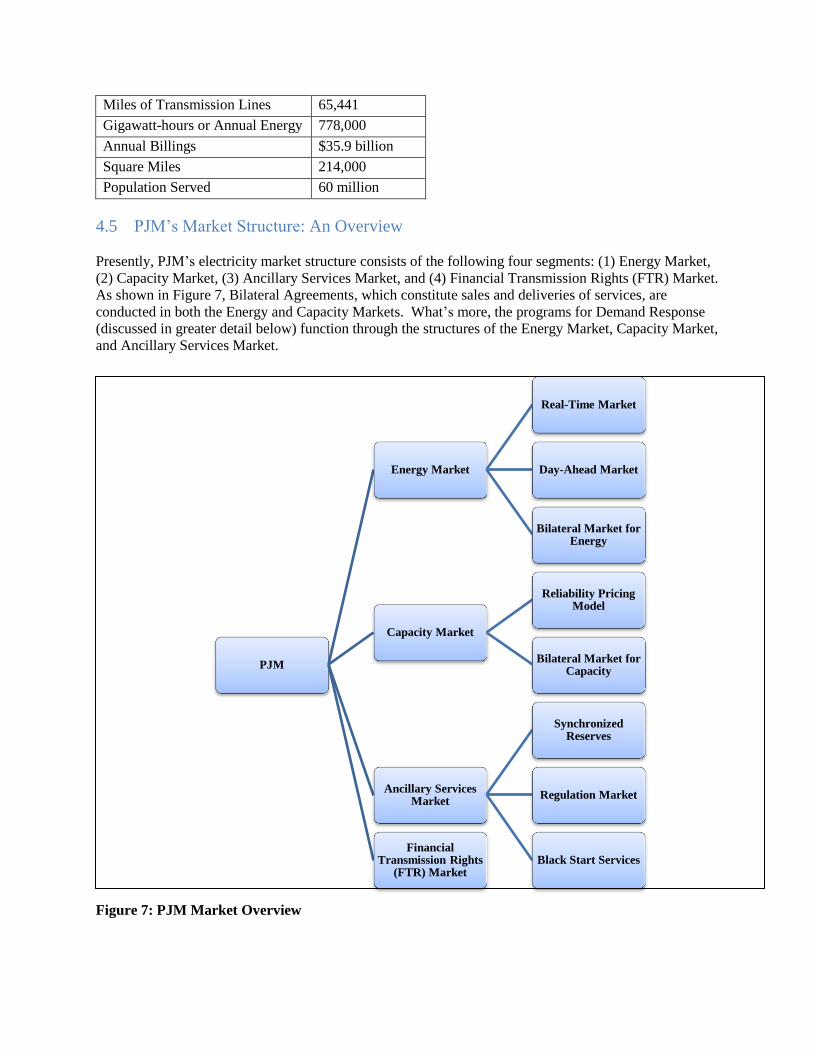
essentially allowing consumers to become more sensitive to prices. As shown in Figure 10, in a market
without DR the demand curve (D1) is inelastic, which results in a higher marginal price (P1) because the
marginal cost of electricity between quantities Q2 and Q1 increases substantially due to limited supply.
On the other hand, when DR is integrated into the market it makes the demand curve more elastic;
enabling the demand curve shifts down to D2 as consumers react to high prices. Thus, when prices are at
P1 and capacity (supply) is limited, DR can be dispatched to moderate the increase in price; shifting price
down to P2.
52
U.S. Energy Information Administration: Annual Energy Review, Table 8.4a Consumption for Electricity
Generation by Energy Source: Total (All Sectors), 1949-2011. Source:
http://www.eia.gov/totalenergy/data/annual/showtext.cfm?t=ptb0804a
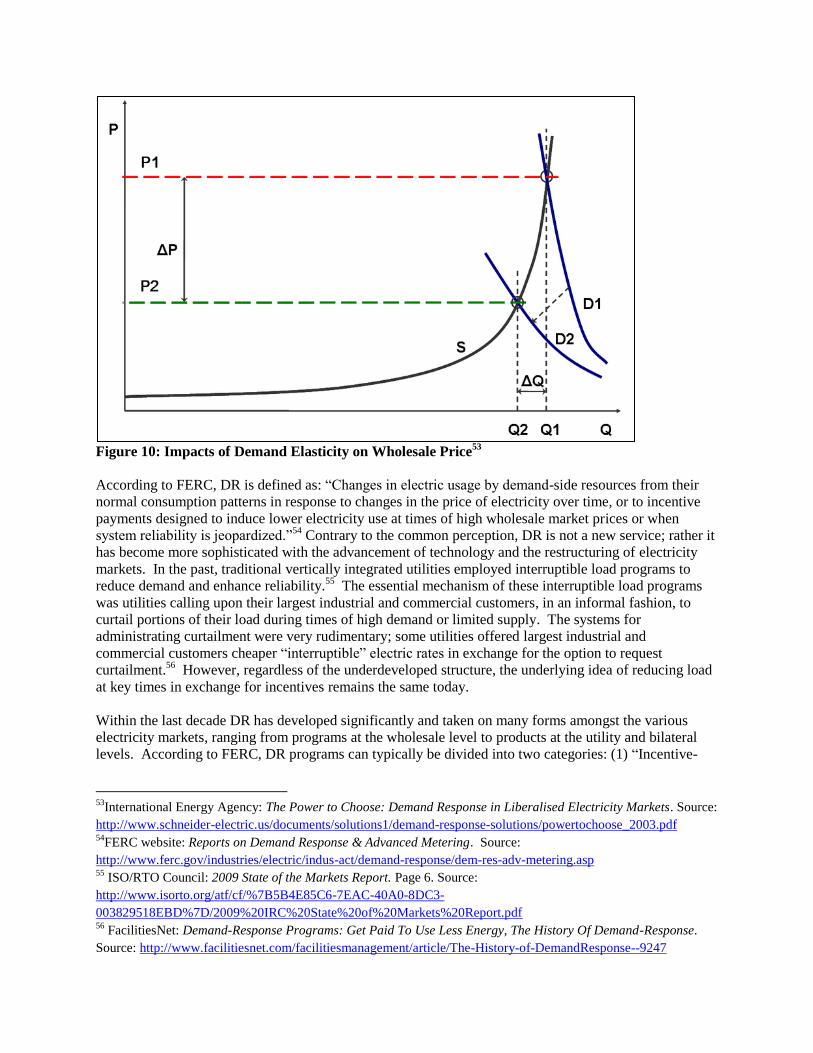
Figure 10: Impacts of Demand Elasticity on Wholesale Price
53
According to FERC, DR is defined as: “Changes in electric usage by demand-side resources from their
normal consumption patterns in response to changes in the price of electricity over time, or to incentive
payments designed to induce lower electricity use at times of high wholesale market prices or when
system reliability is jeopardized.”54
Contrary to the common perception, DR is not a new service; rather it
has become more sophisticated with the advancement of technology and the restructuring of electricity
markets. In the past, traditional vertically integrated utilities employed interruptible load programs to
reduce demand and enhance reliability.55
The essential mechanism of these interruptible load programs
was utilities calling upon their largest industrial and commercial customers, in an informal fashion, to
curtail portions of their load during times of high demand or limited supply. The systems for
administrating curtailment were very rudimentary; some utilities offered largest industrial and
commercial customers cheaper “interruptible” electric rates in exchange for the option to request
curtailment.56
However, regardless of the underdeveloped structure, the underlying idea of reducing load
at key times in exchange for incentives remains the same today.
Within the last decade DR has developed significantly and taken on many forms amongst the various
electricity markets, ranging from programs at the wholesale level to products at the utility and bilateral
levels. According to FERC, DR programs can typically be divided into two categories: (1) “Incentive-
53
International Energy Agency: The Power to Choose: Demand Response in Liberalised Electricity Markets. Source:
http://www.schneider-electric.us/documents/solutions1/demand-response-solutions/powertochoose_2003.pdf 54
FERC website: Reports on Demand Response & Advanced Metering. Source:
http://www.ferc.gov/industries/electric/indus-act/demand-response/dem-res-adv-metering.asp 55
ISO/RTO Council: 2009 State of the Markets Report. Page 6. Source:
http://www.isorto.org/atf/cf/%7B5B4E85C6-7EAC-40A0-8DC3-
003829518EBD%7D/2009%20IRC%20State%20of%20Markets%20Report.pdf 56
FacilitiesNet: Demand-Response Programs: Get Paid To Use Less Energy, The History Of Demand-Response.
Source: http://www.facilitiesnet.com/facilitiesmanagement/article/The-History-of-DemandResponse--9247
Based Programs” and (2) “Time Based Programs”.57
Thus, as the structures of DR programs have
developed, market size and customer class participation have grown. Figure 11 and Figure 12 provide a
clear depiction of this development. Figure 11 shows the growth in the total reported potential peak
reduction in the 2006 through 2012; which essentially demonstrates that the market for DR has in an
overall sense been growing rapidly since 2006.
Figure 11: Total Reported Potential Peak Reduction in the 2006 through 2012 FERC Surveys
58
Figure 12 depicts the reported potential peak reduction by customer class in 2006, 2008, 2010 and 2012
helps to provide an understanding of where that growth is coming from. As illustrated, the growth has
been largely due to increased participation from Commercial & Industrial and Wholesale customer
classes.
57
FERC: 2012 Assessment of Demand Response and Advanced Metering Staff Report, December 2012, Page 21.
Source: http://www.ferc.gov/legal/staff-reports/12-20-12-demand-response.pdf 58
FERC: 2012 Assessment of Demand Response and Advanced Metering Staff Report, December 2012. Page 23.
Source: http://www.ferc.gov/legal/staff-reports/12-20-12-demand-response.pdf
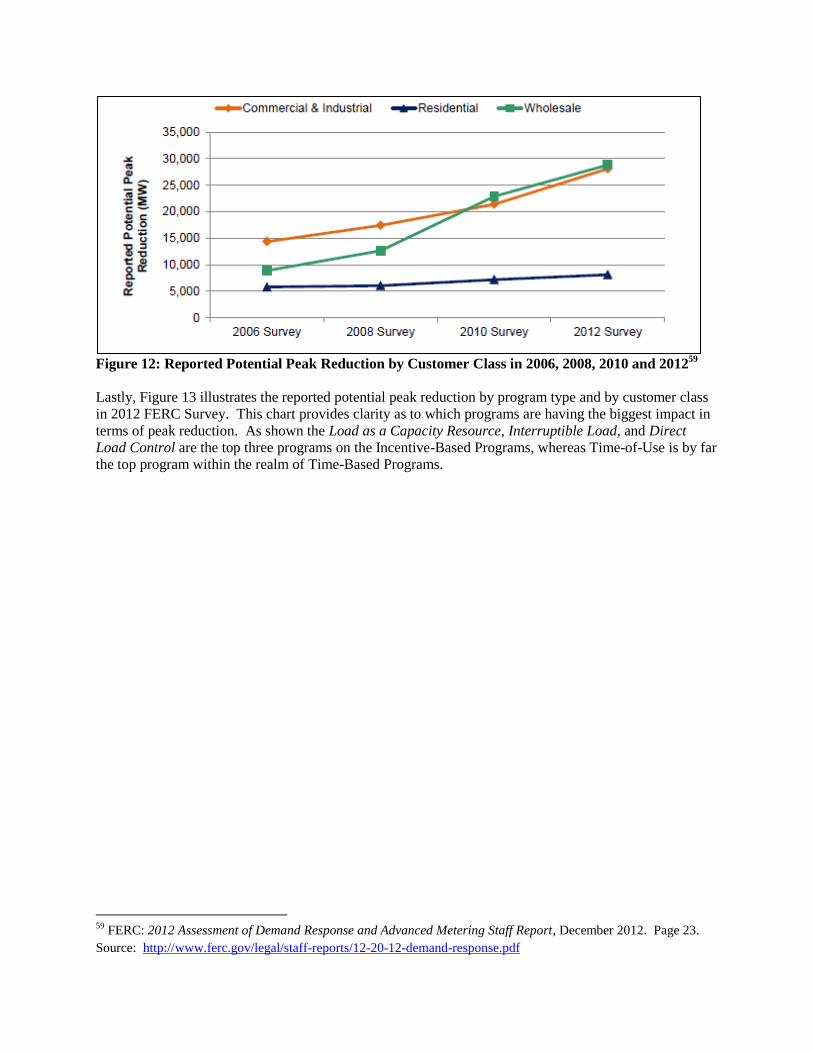
Figure 12: Reported Potential Peak Reduction by Customer Class in 2006, 2008, 2010 and 2012
59
Lastly, Figure 13 illustrates the reported potential peak reduction by program type and by customer class
in 2012 FERC Survey. This chart provides clarity as to which programs are having the biggest impact in
terms of peak reduction. As shown the Load as a Capacity Resource, Interruptible Load, and Direct
Load Control are the top three programs on the Incentive-Based Programs, whereas Time-of-Use is by far
the top program within the realm of Time-Based Programs.
59
FERC: 2012 Assessment of Demand Response and Advanced Metering Staff Report, December 2012. Page 23.
Source: http://www.ferc.gov/legal/staff-reports/12-20-12-demand-response.pdf

Figure 13: Reported Potential Peak Reduction by Program Type and by Customer Class in 2012
FERC Survey60
Demand Response is truly a product of evolution, as it has been an available service to electricity markets
for years. Since origination it has taken many forms, ranging from rudimentary to highly sophisticated.
It has only been within the last decade, however, that DR has emerged as a truly useful market
mechanism. This emergence is attributable to technology innovation, regulatory openings, and the
entrance of third-party energy management businesses. PJM is one of the wholesale markets that have
embraced DR; having established several strong programs for DR participation, and is reaping substantial
benefits from its incorporation.
4.7 Demand Response in PJM
All DR programs in PJM can be grouped into either Economic Load Response or Emergency Load
Response. As shown by Figure 14, the Emergency Load Response Program functions within the Capacity
Market, while the Economic Load Response Program is divided into programs that operate in the Energy
Market as well as the Market for Ancillary Services; each of these programs will be discussed in greater
detail in the following sections.61
60
FERC: 2012 Assessment of Demand Response and Advanced Metering Staff Report, December 2012. Page 116.
Source: http://www.ferc.gov/legal/staff-reports/12-20-12-demand-response.pdf 61
ISO/RTO Council website: North American Wholesale Electricity Demand Response Program Comparison.
January 24, 2012. Source:
http://www.isorto.org/site/c.jhKQIZPBImE/b.2604461/k.6151/Documents_and_Issues.htm

The Emergency Load Response Program is based on the commitments from DR resources procured
through the forward capacity market to reduce load when PJM’s system is in an emergency condition.
Resources within this program are typically referred to as capacity resources.62
Alternatively, the
Economic Load Response Program operates in the Energy Market and the Market for Ancillary Services
and provides the market participants with the opportunity to reduce load in response to an economic price
signal.
Figure 14: The Structure of PJM’s Demand Response Programs
It is important to make a clear distinction between capacity and energy when thinking about how PJM has
structured its DR programs. In short, capacity is the willingness and ability to provide electricity in terms
of generation or curtailment, while energy is the actual amount of electricity generated or curtailed during
a particular moment.
4.8 Economic Load Response Program 4.8.1 Program Introduction
The Economic Load Response Program (Economic Program) is designed to enable customers to respond
to economic conditions in the wholesale electricity market.63
In this program, participation is voluntary
and takes three different forms: DR resources can respond to prices in the Energy Market (Real-Time or
Day-Ahead), Synchronized Reserve prices, and/or Day-Ahead Scheduling Reserve prices by reducing
62
PJM Manual 35: Definitions and Acronyms. Revision: 19, Effective Date: June 24, 2011. Section 2, Page 26. 63
PJM Presentation: PJM Economic Demand Side Response. 10/4/2012. Source:
http://www.pjm.com/training/~/media/training/core-curriculum/ip-dsr/economic-demand-side-response-
training.ashx
PJM
Emergency Load Response Program
Capacity Market Based Program
Economic Load Response Program
Energy Market Based Programs
Day-Ahead Market
Real-Time Market
Ancillary Services Market Based Programs
Synchronized Reserves Market
Day-ahead Scheduling
Reserves Market
Regulation Market

consumption and receiving a payment for the reduction. Regarding the Regulation Market, demand
resources can be compensated for reducing or increasing their load frequency.64
The details of
participation will be described in more detail in the follow sections.
The structure of the Economic Program is complex as it encompasses DR participation in both the Energy
Market and the Market for Ancillary Services. As shown in Figure 15, within each of these markets there
are several different options for participating. Within the Energy Market, it is possible for DR resources to
participate in the Day-Ahead and Real-Time Markets, which each have their own payment system based
on the LMPs that are calculated for those markets. Alternatively, the Market for Ancillary Services offers
the possibility to participate in DR as part of the Synchronized Reserve, Day-Ahead Scheduling, and
Regulation Markets; these market segments also have their own systems of compensation.
Figure 15: The Structure of the Economic Program
65
4.8.2 Registration in the Economic Program
All Economic Program registrations, except Economic Regulation Only registrations, must go through the
Customer Baseline Load (CBL) certification process. This process determines whether a registration is a
Variable or Non-Variable load. The category into which a DR resource is classified is based on hourly
load data. Non-Variable Loads are those for which the CBL calculation and adjustment methods result in
a relative root mean square hourly error of twenty percent or less compared to the actual hourly loads; all
other loads shall be Variable Loads.66
A resource should calculate a relative root mean square hourly
64
PJM Manual 11: Energy & Ancillary Services Market Operations. Revision: 56, Effective Date: November 29,
2012. Section 3: Overview of the PJM Regulation Market, Page 51. 65
PJM Presentation: PJM Economic Demand Side Response. 10/4/2012. Source:
http://www.pjm.com/training/~/media/training/core-curriculum/ip-dsr/economic-demand-side-response-
training.ashx 66
PJM Manual 11: Energy & Ancillary Services Market Operations. Revision: 56, Effective Date: November 29,
2012. Section 10.2: Demand Resource Registration Requirements, Page 114.
PJM Economic Load
Response Program
Energy Market Based Programs
Day-Ahead Market
Real-Time Market
Ancillary Services Market Based Programs
Synchronized Reserve Market
Day-Ahead Scheduling Reserves
Regulation Market

error for the standard CBL defined in the OATT unless approved to use another method.67
Once the
necessary calculations have been made, the resulting data must be submitted for review and approval.
Once a resource is enrolled into PJM’s Market and has been registered, PJM then has thirty days to
review the information that has been submitted.68
After this review PJM will inform the resource of its
acceptance into the program. Soon after there is a review by the electric distribution company (EDC) and
load serving entity (LSE) from where the DR resource is located69
. Given the approval of PJM and the
EDC and/or LSE, the registration is then able to engage in the market.
4.8.3 Market Engagement
Resources within the Economic Program submit bids to the market based on their registrations. For
instance, the Day-Ahead Market option provides the mechanism by which a market participant may offer
to reduce load ahead of real-time operations in which the resource would then receive payments based on
Day-Ahead LMP for the reductions. The Real-Time Market option provides the mechanism by which a
market participant may offer to commit to a reduction and receive payments based on real-time LMP for
the reductions.70
Any resource that plans to participate in either market must submit a bid. Those bid submissions must
include specified information. 71
Once this information is submitted into PJM’s system, clearing house
prices are determined for the Day-Ahead and Real-Time Markets which dictate which demand resources
are dispatched and what price is paid.
Similarly to the added complexity in the registration process, DR assets registered in the Ancillary
Service Market based programs must submit additional data for participation.72
4.8.4 Metering
DR resources must install and maintain meters that provide integrated hourly kWh data. PJM requires
that the metering equipment meet the local EDC standards/requirements for accuracy, or the meter must
have a maximum error of two percent over the full range. The hourly load data obtained by the meters
must be submitted to PJM within sixty days of the load reduction event, with all the necessary data
needed to calculate settlement payments.73
In the case that on-site generation is used to enable the end-
use customer to participate in the Economic Load Response Program then the CSP may be requested by
67
PJM Manual 11: Energy & Ancillary Services Market Operations. Revision: 56, Effective Date: November 29,
2012. Section 10.2.5: CBL Certification Process, Page 122. 68
PJM Manual 11: Energy & Ancillary Services Market Operations. Revision: 56, Effective Date: November 29,
2012. Section 10.1.1: Economic Load Response Participant Review Process, Page 113. 69
PJM Manual 11: Energy & Ancillary Services Market Operations. Revision: 56, Effective Date: November 29,
2012. Section 10.2.4: Electric Distribution Company (“EDC”) and Load Serving Entity (“LSE”) activities, Page
122. 70
PJM Manual 11: Energy & Ancillary Services Market Operations. Revision: 56, Effective Date: November 29,
2012. Section 10.3: Economic Energy Market Participation, Page 124. 71
PJM Manual 11: Energy & Ancillary Services Market Operations. Revision: 56, Effective Date: November 29,
2012. Section 10.3: Economic Energy Market Participation, Page 124. 72
PJM Manual 11: Energy & Ancillary Services Market Operations. Revision: 56, Effective Date: November 29,
2012. Section 3.2.1: Regulation Market Eligibility, Page 52. 73
Operating Agreement of PJM, Effective Date: 1/17/2013. Section 1.5A.4: Metering and Electronic Dispatch
Signal, Page 203.

PJM to submit generation meter data. Furthermore, if a market participant intends to use an on-site
generation then it must state in writing to PJM that it holds all necessary environmental permits
applicable for operation.74
Sub-meter load data is only used to support compliance in Regulation Market. According to PJM, a Sub-
meter is defined as, “a metering point for electricity consumption that does not include all electricity
consumption for the end-use customer as defined by the electric distribution company account number.”75
If the DR resource elects to use this method then they must comply with an additional set of specified
requirements.76
These additional requirements are subject to timely audits by PJM to ensure that the
equipment and data is maintained and accurate.
4.8.5 Settlement
Settlement payments for the Economic Program are calculated using a Customer Baseline Load (CBL)
calculation. The purpose of the CBL is to calculate what the electricity consumption of a DR resource
would have been if no DR event had taken place and/or if the DR resource was not dispatched. In other
words, it is a mathematical method for proving that during a DR event the DR resource actually altered
their normal consumption pattern. The calculated difference between the CBL and the DR resource’s
actual consumption is then used to determine the payment amount.
4.9 Emergency Load Response Program 4.9.1 Program Introduction
The Emergency Load Response Program (Emergency Program) is designed to provide a mechanism by
which end-use customers may be compensated by PJM for reducing load during an emergency event.77
This program was established in 2007 along with the implementation of the Reliability Pricing Model and
is sometimes referred to as PJM’s Load Management Program.78
Originally it was divided into two
different sets of programs: (1) Interruptible Load for Reliability (ILR) and (2) Demand Resources.79
The
ILR program, however, was eliminated in 2009.
The current structure of the Emergency Program (shown in Figure 16) is such that it offers market
participants two options for engagement; a Full Option Program and an Energy Only Option Program.
The nuances of these options are explained in greater detail in the following section.
The Emergency Program necessitates a classification of DR resources. Participants can not only engage
in this program through load reduction, but also by incorporating on-site generation. As will be
74
Operating Agreement of PJM, Effective Date: 1/17/2013. Section 1.5A.5: On-Site Generators, Page 204. 75
PJM Manual 11: Energy & Ancillary Services Market Operations. Revision: 56, Effective Date: November 29,
2012. Section 10.7: Use of Sub-meter load data to support demand response regulation compliance, Page 138. 76
PJM Manual 11: Energy & Ancillary Services Market Operations. Revision: 56, Effective Date: November 29,
2012. Section 10.7: Use of Sub-meter load data to support demand response regulation compliance, Page 138. 77
Operating Agreement of PJM, Effective Date: 1/17/2013. Section: Emergency Load Response Program, Page
405. 78
Monitoring Analytics, LLC: State of the Market Report for PJM. March 3, 2012, Page 123. Source:
http://pjm.com/documents/reports/state-of-market-reports/~/media/documents/reports/state-of-market/2011/2011-
som-pjm-volume1.ashx 79
Monitoring Analytics, LLC: State of the Market Report for PJM. March 3, 2012, Page 123. Source:
http://pjm.com/documents/reports/state-of-market-reports/~/media/documents/reports/state-of-market/2011/2011-
som-pjm-volume1.ashx

discussed, this capability garners more participation but involves higher regulatory management as there
are penalty payments for nonperformance and under-performance. The payment mechanism for the
Emergency Program happens through the various auctions in the RPM, with prices varying by auction.
Figure 16: The Structure of Emergency Load Response Program
Since the Emergency Program is based on DR resources curtailing load during an emergency event, it is
important to understand how PJM defines this term. According to PJM’s Manual 35: Definitions and
Acronyms, “An Emergency is an abnormal system condition requiring manual or automatic action to
maintain system frequency, or to prevent loss of firm load, equipment damage, or tripping of system
elements that could adversely affect the reliability of an electric system or the safety of persons or
property; a fuel shortage requiring departure from normal operating procedures in order to minimize the
use of such scarce fuel; or a condition that requires implementation of emergency procedures as defined
in the PJM Manuals.”80
Any of the aforementioned emergencies can trigger an emergency in which the
resources within the Emergency Program can be dispatched to curtail.
Figure 17 depicts the sources and business segments for DR activity in the Emergency Program for
Delivery Year 2012/2013. The top three sources for DR in PJM are manufacturing, HVAC, and on-site
generation. Additionally, the business segment chart shows that the majority of the DR activity is coming
from Industrial/Manufacturing facilities, and only seven percent coming from schools and institutional
facilities.
80
PJM Manual 35: Definitions and Acronyms. Revision: 19, Effective Date: June 24, 2011. Section 2, Page 26.
PJM Emergency Load
Response Program
Full Option Program
Payment: RPM Clearing Price
Energy Only Option Program
Payment: The greater of LMP or minimum dispatch
price.

Figure 17: Sources and Business Segments for Emergency DR Activity for Delivery Year
2012/201381
4.9.2 Registration in the Emergency Program
In order to enroll DR assets into the RPM, there are a series of general criteria that DR resources must be
in compliance with. These requirements relate to the ability of a resource to reliably administer and
manage their assets in the Emergency Program. Those general requirements are summarized in Table 3.
Table 3: General Requirements for Demand Response Resources in the RPM
“Demand response resources must be able to reduce at least a 100kW of load.” 82
“Demand response resources must have the capability to retrieve electronic messages from PJM which
notify CSPs of emergency events.” 83
“Demand response resources must provide (or contract with another party to provide) supplemental status
reports during the Delivery Year, detailing availability of the load management resource, as requested by
PJM System Operations.” 84
81
PJM Presentation: Load Response Activity Report January 2013, January 14, 2013. Source:
http://www.pjm.com/~/media/markets-ops/dsr/2012-dsr-activity-report-20130118.ashx 82
PJM Manual 18: PJM Capacity Market. Revision: 17, Effective Date: 12/20/2012. Section 4.3.1: Requirements
of Load Management Products in RPM, Page 48. 83
PJM Manual 18: PJM Capacity Market. Revision: 17, Effective Date: 12/20/2012. Section 4.3.1: Requirements
of Load Management Products in RPM, Page 48.
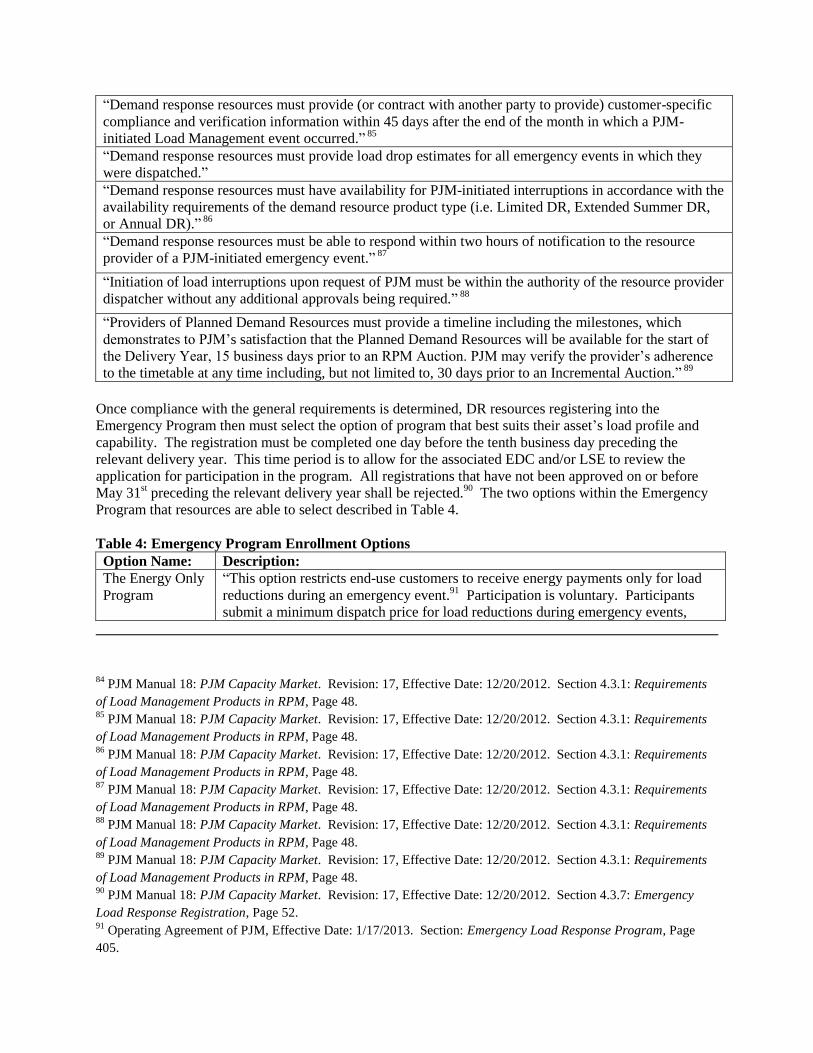
“Demand response resources must provide (or contract with another party to provide) customer-specific
compliance and verification information within 45 days after the end of the month in which a PJM-
initiated Load Management event occurred.” 85
“Demand response resources must provide load drop estimates for all emergency events in which they
were dispatched.”
“Demand response resources must have availability for PJM-initiated interruptions in accordance with the
availability requirements of the demand resource product type (i.e. Limited DR, Extended Summer DR,
or Annual DR).” 86
“Demand response resources must be able to respond within two hours of notification to the resource
provider of a PJM-initiated emergency event.” 87
“Initiation of load interruptions upon request of PJM must be within the authority of the resource provider
dispatcher without any additional approvals being required.” 88
“Providers of Planned Demand Resources must provide a timeline including the milestones, which
demonstrates to PJM’s satisfaction that the Planned Demand Resources will be available for the start of
the Delivery Year, 15 business days prior to an RPM Auction. PJM may verify the provider’s adherence
to the timetable at any time including, but not limited to, 30 days prior to an Incremental Auction.” 89
Once compliance with the general requirements is determined, DR resources registering into the
Emergency Program then must select the option of program that best suits their asset’s load profile and
capability. The registration must be completed one day before the tenth business day preceding the
relevant delivery year. This time period is to allow for the associated EDC and/or LSE to review the
application for participation in the program. All registrations that have not been approved on or before
May 31st preceding the relevant delivery year shall be rejected.
90 The two options within the Emergency
Program that resources are able to select described in Table 4.
Table 4: Emergency Program Enrollment Options
Option Name: Description:
The Energy Only
Program
“This option restricts end-use customers to receive energy payments only for load
reductions during an emergency event.91
Participation is voluntary. Participants
submit a minimum dispatch price for load reductions during emergency events,
84 PJM Manual 18: PJM Capacity Market. Revision: 17, Effective Date: 12/20/2012. Section 4.3.1: Requirements
of Load Management Products in RPM, Page 48. 85
PJM Manual 18: PJM Capacity Market. Revision: 17, Effective Date: 12/20/2012. Section 4.3.1: Requirements
of Load Management Products in RPM, Page 48. 86
PJM Manual 18: PJM Capacity Market. Revision: 17, Effective Date: 12/20/2012. Section 4.3.1: Requirements
of Load Management Products in RPM, Page 48. 87
PJM Manual 18: PJM Capacity Market. Revision: 17, Effective Date: 12/20/2012. Section 4.3.1: Requirements
of Load Management Products in RPM, Page 48. 88
PJM Manual 18: PJM Capacity Market. Revision: 17, Effective Date: 12/20/2012. Section 4.3.1: Requirements
of Load Management Products in RPM, Page 48. 89
PJM Manual 18: PJM Capacity Market. Revision: 17, Effective Date: 12/20/2012. Section 4.3.1: Requirements
of Load Management Products in RPM, Page 48. 90
PJM Manual 18: PJM Capacity Market. Revision: 17, Effective Date: 12/20/2012. Section 4.3.7: Emergency
Load Response Registration, Page 52. 91
Operating Agreement of PJM, Effective Date: 1/17/2013. Section: Emergency Load Response Program, Page
405.

which include shutdown costs and a minimum duration. This option of the
Emergency Program is similar to the Economic Program in that it provides only
energy payments and all participation is voluntary. However, compensation differs
significantly between the two programs as Energy Only participants in the
Emergency Program receive the greater of LMP or the value of the submitted
minimum dispatch price, including shutdown, for the duration of the emergency
reduction.”92
The Full Option
Program
“This option allows participants to receive energy payments for load reductions
during emergency events as well as capacity payments for participating in the
Reliability Pricing Model (PJM’s Forward Capacity Market). Participation is
mandatory and failure to reduce will result in a compliance test failure charge.
Similar to the Energy Only option, participants in the Full Emergency option submit
minimum dispatch prices associated with reductions during emergency events.”93
Within each of these program enrollment options, DR resources (those assets for which registrations are
created) are classified as either On-Site Generator or Load Reduction (see Table 5).
Table 5: Demand Response Asset Classification for Emergency Program
Asset Classification: Description:
On-Site Generator “A generator (including Behind The Meter Generation) can be either
synchronized or non-synchronized to the grid. Capacity Resources are not
eligible for compensation under this program. Injections into the grid by
local generators also will not be eligible for compensation under this
program.”94
Load Reduction “A participant that has the ability to reduce a measurable and verifiable
portion of its load, as metered on an EDC account basis.”95
For those DR resources that intend to use on-site generation for the purpose of participating in the
Emergency Program, it must hold all applicable environmental and use permits for running the generator.
These can include but are not limited to federal, state, and local permitting and licensing. On a forward going basis, participation in this program by a DR resource with on-site generation is determined by the
resource’s ability to continue operating the on-site generating unit in accordance with this program, and in
compliance with all applicable permits, including any emissions, run-time limit or other constraint on
plant operations that may be imposed by such permits.96
Once the participant has selected the enrollment
options and asset classifications for its DR resources, then it is time to elect the load management
program (outlined in Table 6).
92
Monitoring Analytics, LLC: State of the Market Report for PJM. March 3, 2012, Page 124. Source:
http://pjm.com/documents/reports/state-of-market-reports/~/media/documents/reports/state-of-market/2011/2011-
som-pjm-volume1.ashx 93
Monitoring Analytics, LLC: State of the Market Report for PJM. March 3, 2012, Page 124. Source:
http://pjm.com/documents/reports/state-of-market-reports/~/media/documents/reports/state-of-market/2011/2011-
som-pjm-volume1.ashx 94
Operating Agreement of PJM, Effective Date: 1/17/2013. Section: Emergency Load Response Program,
Participant Qualifications, Page 406. 95
Operating Agreement of PJM, Effective Date: 1/17/2013. Section: Emergency Load Response Program,
Participant Qualifications, Page 406. 96
Operating Agreement of PJM, Effective Date: 1/17/2013. Section: Emergency Load Response Program,
Participant Qualifications, Page 412.

Table 6: Load Management Programs
Acronym: Name: Description:
FSL Firm Service Level “Load management achieved by a customer reducing its load to a
pre-determined level (the Firm Service Level), upon notification
from the resource provider’s market operations center or its
agent.”97
DLC Direct Load Control “Load management that is initiated directly by the resource
provider’s market operations center or its agent, employing a
communication signal to cycle equipment (typically water heaters
or central air conditioners).”98
GLD Guaranteed Load Drop “Load management achieved by a customer reducing its load by a
pre-determined amount (the Guaranteed Load Drop), upon
notification from the resource provider’s market operations center
or its agent. Typically, the load reduction is achieved through
running customer-owned backup generators, or by shutting down
process equipment.”99
In addition to selecting the Load Management Program, the resource must register its preferred Product
Type. The Product Type provides PJM with sense of a DR resource’s availability, as each Product Type
outlines the time windows in which the DR resource should be ready to be notified to curtail. The three
product types are summarized in Table 7.
Table 7: Product Types100
Name: Description:
Limited DR “DR resource is available for interruption for at least 10 times during the summer
period of June through September in the Delivery Year, and will be capable of
maintaining each such interruption for at least a 6-hour duration. At a minimum,
the Limited Demand Resource shall be available for such interruptions on
weekdays, other than NERC holidays, from 12:00PM to 8:00PM EST.”101
Extended Summer DR “DR resource is available for an unlimited number of interruptions during an
extended summer period of June through October and the following May, and
will be capable of maintaining each such interruption for at least a 10-hour
duration between the hours of 10:00AM to 10:00PM EST.”102
97
PJM Manual 18: PJM Capacity Market. Revision: 17, Effective Date: 12/20/2012. Section 4.3.2: Types of Load
Management Programs, Page 49. 98
PJM Manual 18: PJM Capacity Market. Revision: 17, Effective Date: 12/20/2012. Section 4.3.2: Types of Load
Management Programs, Page 49. 99
PJM Manual 18: PJM Capacity Market. Revision: 17, Effective Date: 12/20/2012. Section 4.3.2: Types of Load
Management Programs, Page 49. 100
PJM Manual 18: PJM Capacity Market. Revision: 17, Effective Date: 12/20/2012. Section 4.3.1: Requirements
of Load Management Products in RPM, Page 45. 101
PJM Manual 18: PJM Capacity Market. Revision: 17, Effective Date: 12/20/2012. Section 4.3.1: Requirements
of Load Management Products in RPM, Page 45. 102
PJM Manual 18: PJM Capacity Market. Revision: 17, Effective Date: 12/20/2012. Section 4.3.1: Requirements
of Load Management Products in RPM, Page 45.

Annual DR “DR resource is available for an unlimited number of interruptions during the
Delivery Year, and will be capable of maintaining each such interruption for at
least a 10-hour duration between the hours of 10:00AM to 10:00PM EST for the
months of June through October and the following May, and 6:00AM through
9:00PM EST for the months of November through April unless there is an Office
of the Interconnection approved maintenance outage during October through
April.”103
4.9.3 Market Engagement
In the Energy Only Option Program, participants submit a minimum dispatch price for load reductions
during emergency events, which include shutdown costs and a minimum duration time. In this option all
participation is voluntary. In this facet, the Energy Only Option Program of the Emergency Load
Response Program is very similar to the Economic Program. Compensation, however, differs
significantly between the two programs in that Energy Only participants in the Emergency Program
receive the greater of the nodal LMP or the value of the submitted minimum dispatch price, including
shutdown costs for the duration of the emergency reduction.104
Participants in the Full Option Program also submit minimum dispatch prices for emergency events, but
more importantly these resources are considered committed capacity resources and receive capacity
payments. Capacity payments are the reason why this program is more profitable than the Economic
Program. Participation during an emergency event or capacity testing is mandatory and failure to reduce
will result in a compliance test failure charge.105
During an emergency event, participants registered in the Full Option Program and the Energy Only
Option Program will be paid the higher of the submitted minimum strike price or the zonal real-time LMP
for emergency reductions. The minimum dispatch price, which is submitted by the participant, acts as a
floor for energy compensation during an emergency event.106
4.9.4 Metering
DR resources are responsible for ensuring it has metering equipment that provides integrated hourly kWh
values. The meters should either meet the standards of the EDC or have a maximum error of two percent
over the full range of the metering equipment (these accuracy requirements are same as it is in the
Economic Program). The installed metering equipment must be one of the types described in Table 8.
103
PJM Manual 18: PJM Capacity Market. Revision: 17, Effective Date: 12/20/2012. Section 4.3.1: Requirements
of Load Management Products in RPM, Page 45. 104
Monitoring Analytics, LLC: State of the Market Report for PJM. March 3, 2012, Page 124. Source:
http://pjm.com/documents/reports/state-of-market-reports/~/media/documents/reports/state-of-market/2011/2011-
som-pjm-volume1.ashx 105
Monitoring Analytics, LLC: State of the Market Report for PJM. March 3, 2012, Page 124. Source:
http://pjm.com/documents/reports/state-of-market-reports/~/media/documents/reports/state-of-market/2011/2011-
som-pjm-volume1.ashxM 106
Monitoring Analytics, LLC: State of the Market Report for PJM. March 3, 2012, Page 124. Source:
http://pjm.com/documents/reports/state-of-market-reports/~/media/documents/reports/state-of-market/2011/2011-
som-pjm-volume1.ashx

Table 8: PJM Metering Equipment Requirements
“Metering equipment used for retail electric service.”107
“Customer-owned metering equipment or metering equipment acquired by the Curtailment Service
Provider, approved by PJM, that is read electronically by PJM in accordance with the requirements
herein and in the PJM Manuals.”108
“Customer-owned metering equipment or metering equipment acquired by the Curtailment Service
Provider, approved by PJM, that is read by the customer (or the Curtailment Service Provider), and
such readings are then forwarded to PJM, in accordance with the requirements set forth herein and in
the PJM Manuals.”109
Load reduction meter data must be submitted to PJM within sixty days of the event. If meter data is not
received by PJM within sixty days, then the CSP will receive no compensation. Meter data must be
provided for all relevant hours during the window of an event or performance test. Meter data will be
forwarded to the EDC or LSE when it arrives to PJM, and from that time the EDC or LSE has ten
business days to provide feedback to PJM.110
4.9.5 Emergency Operations
Emergency Operations are employed whenever pre-scheduled capacity is not sufficient to serve load and
maintain reserves or maintain system reliability. PJM initiates an emergency event by sending an
electronic message to registered DR resources. When an event has been declared, voluntary resources
should perform curtailment if available and if it is deemed profitable; in others words if by shutting down
operations, their revenue from DR participation will be greater than their opportunity cost of not
curtailing. Committed resources, such as those committed in the capacity market, are expected to curtail
in accordance with their registration.
PJM will announce when the event is over with another All-Call communication. Depending on the
program, lead time can be as much as two hours before an end-use customer is expected to curtail.111
PJM refers to these as Long and Short Lead Times; long meaning between one to two hours and short
meaning one-hour notice.
4.9.6 Event Compliance
PJM verifies event compliance on an individual DR resource registration basis by reviewing the
submitted data. There is a separate method for assessing compliance for each type of Load Management
Program; the details are articulated in Table 9.
107
Operating Agreement of PJM, Effective Date: 1/17/2013. Section: Emergency Load Response Program,
Metering Requirements, Page 407. 108
Operating Agreement of PJM, Effective Date: 1/17/2013. Section: Emergency Load Response Program,
Metering Requirements, Page 407. 109
Operating Agreement of PJM, Effective Date: 1/17/2013. Section: Emergency Load Response Program,
Metering Requirements, Page 407. 110
Operating Agreement of PJM, Effective Date: 1/17/2013. Section: Emergency Load Response Program,
Verification, Page 415. 111
PJM Presentation: PJM Load Management; PJM State & Member Training. 1/4/2013. Source:
http://www.pjm.com/training/~/media/training/core-curriculum/ip-dsr/load-management-in-rpm.ashx

Table 9: Compliance Determination by Load Management Program
Name of Load
Management
Program:
Compliance Determination Description:
Firm Service Level
(FSL)
“Determined by comparing actual load during the event to the nominated firm
service level. Resource providers must submit load data for all hours of the event
and test day and for all days required for PJM to calculate compliance through the
Load Response system.”112
Direct Load Control
(DLC)
“Considers only the transmission of the control signal. CSPs are required to
report the time period (during the Load Management event) that the control signal
was started and stopped. Failure to start the signal by the start of the event and
continue the signal for the duration of the event will result in a deficiency for that
end-use customer.”113
Guaranteed Load
Drop (GLD)
“Determined by comparing actual load dropped during the event to the nominated
amount of load drop. Resource providers must submit load data for all hours of the
event and test day and for all days required for PJM to calculate compliance.”114
4.9.7 Settlement
Capacity compliance data must be submitted within forty-five days after the end of the event month,
whereas energy settlements must be submitted within sixty days of the event. If no data is submitted in
this window then the participant will not receive compensation. Meter data must be provided for all hours
of the emergency event or the load management performance test.115
Compensation is made for curtailments in energy consumption during emergency events by Full Program
Option participants and Energy Only Option participants regardless of whether the participant’s load
during the event exceeds its peak load contribution for the applicable delivery year. Payment is equal to
the measured curtailments. DR resources cleared in the capacity market receive the corresponding
Capacity Resource Clearing Price as determined in the respective auction.116
4.9.8 Auditing
DR resources will be tested in a zone if PJM has not called an event in that zone by August. The purpose
of this auditing exercise is to prove at summer’s end that if there was an event that year, that the DR
resource would have had the capability to perform. However, it is important to note that if an event is
112
PJM Manual 18: PJM Capacity Market. Revision: 17, Effective Date: 12/20/2012. Section 8.5.1: Measuring
Event Compliance, Page 134. 113
PJM Manual 18: PJM Capacity Market. Revision: 17, Effective Date: 12/20/2012. Section 8.5.1: Measuring
Event Compliance, Page 134. 114
PJM Manual 18: PJM Capacity Market. Revision: 17, Effective Date: 12/20/2012. Section 8.5.1: Measuring
Event Compliance, Page 134. 115
PJM Presentation: PJM Load Management; PJM State & Member Training. 1/4/2013. Source:
http://www.pjm.com/training/~/media/training/core-curriculum/ip-dsr/load-management-in-rpm.ashx 116
PJM OATT, Attachment DD: PROCEDURES FOR DEMAND RESOURCES, ILR, AND ENERGY
EFFICIENCY, Effective Date: 9/17/2010. Page 2532.
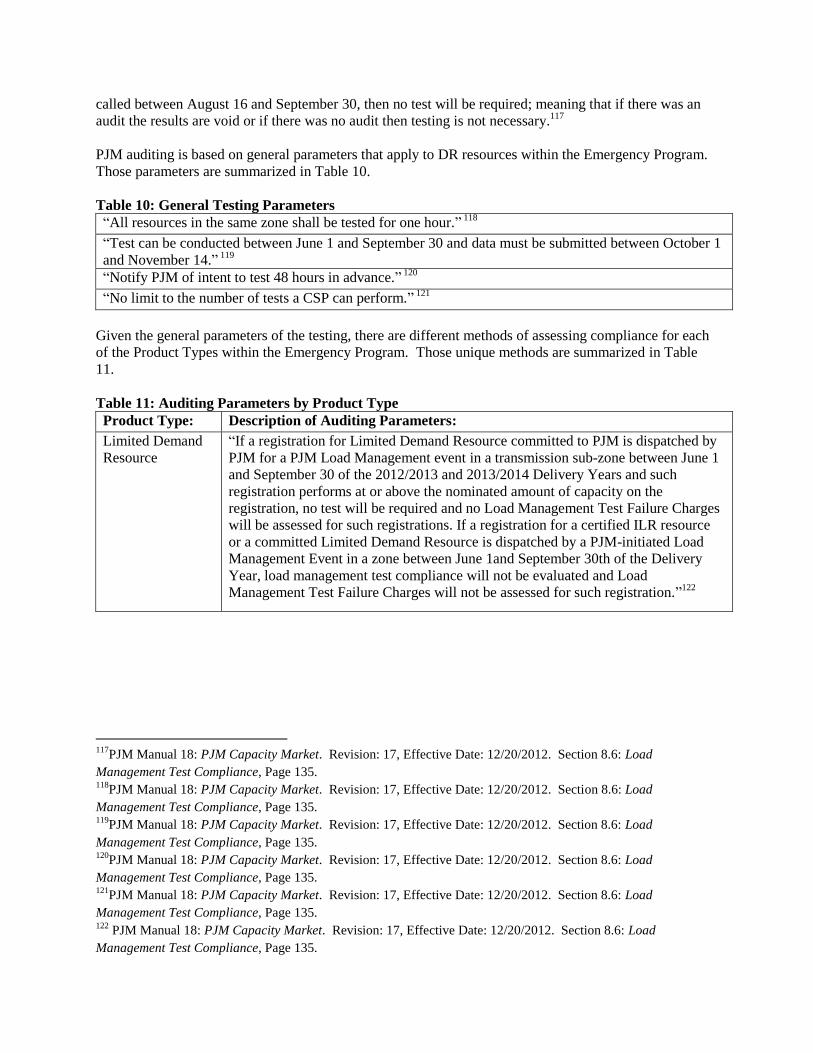
called between August 16 and September 30, then no test will be required; meaning that if there was an
audit the results are void or if there was no audit then testing is not necessary.117
PJM auditing is based on general parameters that apply to DR resources within the Emergency Program.
Those parameters are summarized in Table 10.
Table 10: General Testing Parameters
“All resources in the same zone shall be tested for one hour.” 118
“Test can be conducted between June 1 and September 30 and data must be submitted between October 1
and November 14.” 119
“Notify PJM of intent to test 48 hours in advance.” 120
“No limit to the number of tests a CSP can perform.” 121
Given the general parameters of the testing, there are different methods of assessing compliance for each
of the Product Types within the Emergency Program. Those unique methods are summarized in Table
11.
Table 11: Auditing Parameters by Product Type
Product Type: Description of Auditing Parameters:
Limited Demand
Resource
“If a registration for Limited Demand Resource committed to PJM is dispatched by
PJM for a PJM Load Management event in a transmission sub-zone between June 1
and September 30 of the 2012/2013 and 2013/2014 Delivery Years and such
registration performs at or above the nominated amount of capacity on the
registration, no test will be required and no Load Management Test Failure Charges
will be assessed for such registrations. If a registration for a certified ILR resource
or a committed Limited Demand Resource is dispatched by a PJM-initiated Load
Management Event in a zone between June 1and September 30th of the Delivery
Year, load management test compliance will not be evaluated and Load
Management Test Failure Charges will not be assessed for such registration.”122
117
PJM Manual 18: PJM Capacity Market. Revision: 17, Effective Date: 12/20/2012. Section 8.6: Load
Management Test Compliance, Page 135. 118
PJM Manual 18: PJM Capacity Market. Revision: 17, Effective Date: 12/20/2012. Section 8.6: Load
Management Test Compliance, Page 135. 119
PJM Manual 18: PJM Capacity Market. Revision: 17, Effective Date: 12/20/2012. Section 8.6: Load
Management Test Compliance, Page 135. 120
PJM Manual 18: PJM Capacity Market. Revision: 17, Effective Date: 12/20/2012. Section 8.6: Load
Management Test Compliance, Page 135. 121
PJM Manual 18: PJM Capacity Market. Revision: 17, Effective Date: 12/20/2012. Section 8.6: Load
Management Test Compliance, Page 135. 122
PJM Manual 18: PJM Capacity Market. Revision: 17, Effective Date: 12/20/2012. Section 8.6: Load
Management Test Compliance, Page 135.

Annual Demand
Resource
“If a registration for a Annual Demand Resource is not dispatched by PJM for a
Load Management Event in a Delivery Year, then such registration must
demonstrate that it was tested simultaneously with other non-dispatched Annual
Demand Resource registrations in the zone for a one-hour period during any hour
when a PJM Load Management Event may be called during June through October
or the following May of the Delivery Year. If a registration for a Annual Demand
Resource is dispatched by PJM for a Load Management Event during the Delivery
Year, then no test will be required for such registration and no Load Management
Test Failure Charges will be assessed for such registration.”123
Extended Summer
Demand Resource
“If a registration for an Extended Summer Demand Resource is not dispatched by
PJM for a Load Management Event during June through October or the following
May in a Delivery Year, then such registration must demonstrate that it was tested
simultaneously with other non-dispatched Extended Summer Demand Resource
registrations in the zone for a one-hour period during any hour when a PJM Load
Management Event may be called during June through October or the following
May of the Delivery Year. If a registration for an Extended Summer Demand
Resource is dispatched by PJM for a Load Management Event during June through
October or the following May of the Delivery Year, then no test will be required for
such registration and no Load Management Test Failure Charges will be assessed
for such registration.”124
DR resource tests are measured in the same fashion as emergency event. A DR resource with a positive
net testing shortfall in a zone for a product type will be assessed a Zonal Load Management Test Failure
Charge.125
4.9.9 Penalties
Participants in the Emergency Program that fail to provide a specified load reduction when dispatched by
PJM during emergency events or annual audit event must pay penalties and/or charges for their
nonperformance or underperformance. For each type of event, the calculation for assessing the penalty is
different, but the methods are similar. It is important to note the nonperformance or underperformance is
based from the amount of capacity that was bid into the RPM.
A DR resource Compliance Penalty Charge is assessed to DR resources that under-complied during an
event. The Compliance Penalty Charge is the consequence of underperformance. This charge is based on
the amount of underperformance (or Under-Compliance Megawatts) times a higher rate than what the
CSP would have made in revenue from its DR resources (Load Management Compliance Penalty
Rate).126
123
PJM Manual 18: PJM Capacity Market. Revision: 17, Effective Date: 12/20/2012. Section 8.6: Load
Management Test Compliance, Page 135. 124
PJM Manual 18: PJM Capacity Market. Revision: 17, Effective Date: 12/20/2012. Section 8.6: Load
Management Test Compliance, Page 135. 125
PJM Manual 18: PJM Capacity Market. Revision: 17, Effective Date: 12/20/2012. Section 8.6: Load
Management Test Compliance, Page 135. 126
PJM Manual 18: PJM Capacity Market. Revision: 17, Effective Date: 12/20/2012. Section 9.1.9: Demand
Resource and ILR Compliance Penalty Charge, Page 147.

The Daily Load Management Test Failure Charge which is a penalty payment based on the
underperformance of a DR resource during a test event. This charge is equal to the Under-Compliance
Megawatts (MWs) in the zone for the product type tested times the LM Test Failure Charge Rate.127
In
other words, it is the amount of underperformance (MW-day) times a higher rate than what the DR
resources would have made in revenue.
5 Decision Support Tool
5.1 Introduction
The preceding sections detail the intricate structure of the PJM markets, the role of demand side resources
in those markets, and the complicated process of becoming a PJM member. Given the density of this
material it is important for potential market participants to be made aware of the upside of involvement in
a clear fashion. Beyond the potentially wide reaching and well understood environmental and economic
benefits of demand side management, consumers are likely to be most interested by the revenue potential
that market participation represents. Whether it is a CSP attempting to attract a new customer, or an
energy manager trying to convince the board that taking part in the PJM DR markets is a worthwhile
endeavor; an indication of the potential cash flow is certainly advantageous in drawing attention away
from the associated red-tape.
The aim of this portion of the project was to develop an estimate of the revenue that could be earned by a
hypothetical demand side resource through participation in the PJM markets. This was accomplished
through the creation of a Revenue Calculator that provides potential market participants with an estimate
of the economic value of their load in the PJM markets. Ultimately, greater insight into the financial
benefits available to demand resources should encourage end users to strongly consider participation in
DR programs.
5.2 Capacity Market The variety of markets and multitude of registration options available to demand resources within the
PJM RTO/ISO have been described in Section 4.8, but estimations of revenue potential made in this
section focus solely on the returns available from participation in PJM’s capacity market known as the
Reliability Pricing Model. The decision to focus on only this one market was made due to a variety of
factors related to creating the most accurate and applicable model possible. These considerations include
participation rates, ease of forecasting, and user accessibility.
First, historical data shows that the vast majority of revenue earned by demand resources in PJM markets
has come in the form of capacity payments from participation in the RPM (Figure 18). Assuming that
this trend continues for CSPs or anyone else interested in garnering greater demand resource participation
in the PJM markets would be well served by illustrating the earnings potential of this market.
127
PJM Manual 18: PJM Capacity Market. Revision: 17, Effective Date: 12/20/2012. Section 9.1.7: Load
Management Test Failure Charge, Page 146.

Figure 18: Estimation of Revenue Earned by Demand Resources in PJM Markets
128
Second, the other markets present distinct challenges in representing theoretical revenue streams. As is
detailed in previous sections, load reductions in the energy and ancillary services markets within PJM are
entirely voluntary. While this provides the customer with the advantage of being able to self-schedule
load reductions, and avoids any penalties associated with non-performance during emergency events, it
also presents a variety of modeling challenges associated with the additional scheduling freedom.
Customers in those markets have the opportunity to earn arbitrage profits when their marginal costs of
making load reductions is less than the locational marginal price in their zone at that time. Thus, an
estimation of the potential earnings available in the energy markets would require both a forecast of
hourly LMPs, as well as a thorough understanding of the cost to the consumer to make reductions.129
Finally, the capacity market offers participants the greatest predictability of payments. With payments
based on the results of the BRA and Incremental Auctions, customers can gain an understanding of the
revenue they can expect to receive well in advance. Contingent on performance during emergency
events, participants earn regular monthly payments during the delivery year.130
Thus, forecasting revenue
is relatively straightforward in comparison to the other PJM markets, and can be estimated on an annual
time scale, which is most meaningful for the majority of consumers.
128
PJM Presentation: Load Response Activity Report January 2013, January 14, 2013. Source:
http://www.pjm.com/~/media/markets-ops/dsr/2012-dsr-activity-report-20130118.ashx 129
PJM Presentation: PJM Demand Side Response. Source: http://www.pjm.com/~/media/training/core-
curriculum/ip-dsr/pjm-demand-side-response-slides.ashx 130
PJM Training Materials: Reliability Pricing Model Training: Demand Response and Energy Efficiency. Source:
http://www.pjm.com/~/media/markets-ops/rpm/20090406-dr-ee-in-rpm-collateral.ashx

Given that the capacity market represents the greatest potential source of revenue for demand resources,
with the most easily forecasted annual payments, this study focused primarily on this option. It is also
worth noting that while the energy markets have generated less revenue for demand resources in the past,
and are more difficult to model, they also carry less associated risk as there are no non-performance
penalties.131
5.3 Capacity Revenue As the first ISO, and later the first RTO, approved by the Federal Energy Regulatory Commission, PJM is
responsible for operating transmission systems to provide open access for non-utility users. To this end,
they are tasked with maintaining the reliability of the electricity grid to the standard set-forth by the
Reliability First Corporation (PJM’s NERC region) in the Planned Resource Adequacy Assessment. This
regulation states that PJM must calculate a reserve margin that results in a probability of being unable to
meet the peak load during the demand year of 0.1, or a Loss of Load Expectation of “one day in ten
years.”132
PJM is thus concerned with attaining an adequate amount of resources to meet the peak demand
throughout the year. To this end, PJM has set-up a capacity market known as the Reliability Pricing
Model (RPM), which is designed to ensure there are enough resources available to meet peak demand
throughout the demand year.133
Due to the fact that demand varies drastically throughout the year, with
only a few hours during the summer representing a much higher demand level than the rest of the year,
PJM must provide an incentive for additional resources to be available during times of high demand,
despite the fact that they will likely only be called upon to operate for a few hours each year. The RPM
provides capacity payments throughout the year regardless of whether a resource is called to perform or
not, which encourage both the retention of existing resources, and the development of new resources in
the PJM region.
5.4 Revenue Calculator In an effort to make clear the profitability of participating in the RPM as a demand resource, a decision
support tool was created to estimate the revenue a particular customer could receive from bidding their
load reductions or behind the meter generation into the market. This Revenue Calculator utilizes basic
customer metrics, product choices, and market defined variables to estimate the potential payout from the
RPM. Central to the function of the calculator is a forecast for the market price for capacity based on
historical data of RPM clearing prices. This forecast model is described in greater detail below in the
“Market Price Estimation” section.
5.4.1 Revenue Calculation
The calculation of payments a demand resource may receive from the RPM is dependent on more than
just the market price and quantity of capacity provided. While these are both key components of the
calculation, additional considerations are needed to account for the physics behind the transmission of
electricity, as well as the performance of a typical demand resource. Table 12 lists the variables that are
131
PJM Presentation: Reliability Pricing Model Training: Resource Performance Assessments. 10/29/2012.
http://www.pjm.com/~/media/training/core-curriculum/ip-rpm/rpm-training-section-f-performance-assessment-
examples.ashx 132
Reliability First Corporation: BAL-502-RFC-02, Planned Resource Adequacy Analysis, Assessment and
Documentation, Page 1. 133
PJM Manual 18: PJM Capacity Market. Revision: 17, Effective Date: 12/20/2012. Section 1.1: Overview of the
PJM Capacity Market, Page 3.

directly used in the calculation of annual capacity payments, along with a brief description of their
purpose within the equation. More detailed descriptions can be found at the provided sources.
Table 12: Variables used in the calculation of capacity payments
Variable Units Abbreviation Definition
Capacity Factor134
- -
A multiplier used to account for the
transmission losses that would
occur if electricity had to be
provided to the demand resource.
Demand Resource Factor135
- DR Factor
The percentage of time that a
demand resource is expected to be
available to perform taking into
account outages for maintenance or
other shut-downs.
Forecast Pool Requirement136
- FPR
The amount of unforced capacity
needed to meet PJM's reliability
criterion.
Installed Capacity137
MW ICAP The total available capacity of a
demand resource.
Load Under Management MW -
The amount of load that a customer
is committed to curtailing during an
emergency event.
Peak Load Contribution138
MW PLC
A baseline measure of a customer's
peak electricity usage. Defined as
the average consumption during the
five hours of highest peak during
the previous demand year.
Unforced Capacity139
MW UCAP
The available capacity of a demand
resource after taking into account
presumed outages.
The essential process of revenue calculation is to determine the amount of usable resource that is being
provided to the ISO/RTO and multiply that by the prevailing market price (in dollars per megawatt-day)
to generate the resulting capacity payments. Equations 1-4 below details how the above variables are
utilized to calculate the annual revenue a demand resource would receive from participation in the
RPM.140
It is important to note that nominated in this context is used to describe the capacity that a
134
PJM Manual 13: Emergency Operations. Revision: 47, Effective Date: 1/1/2012. Attachment B: PJM Open
Access Transmission Tariff, Emergency Load Response Program. Page 1696. 135
PJM Manual 18: PJM Capacity Market. Revision: 17, Effective Date: 12/20/2012. Attachment A: Glossary of
Terms, Page 164. 136
PJM Manual 18: PJM Capacity Market. Revision: 17, Effective Date: 12/20/2012. Section 2.1.4: Forecast Pool
Requirement, Page 9. 137
PJM Manual 18: PJM Capacity Market. Revision: 17, Effective Date: 12/20/2012. Section 2.4: Reliability
Requirements, Page 12. 138
Baltimore Gas and Electric. “Peak Load Contribution (PLC) Overview.” Source:
https://supplier.bge.com/LoadProfiles_EnergySettlement/plcoverview.htm 139
PJM Manual 18: PJM Capacity Market. Revision: 17, Effective Date: 12/20/2012. Section 2.4: Reliability
Requirements, Page 12. 140
PJM Manual 18: PJM Capacity Market. Revision: 17, Effective Date: 12/20/2012. Section 4.3.7: Determination
of Nominated Value for Load Management, Page 49.

resource has elected to bid into the market. Also, there are different calculations for each of the three load
management options, Firm Service Level (FSL), Guaranteed Load Drop (GLD, and Direct Load Control
(DLC), which are described in detail in Table 25.
(1)
(2)
(3)
(4)
5.4.2 Market Price
The market-clearing price for capacity in the RPM is determined in much the same way as in other
markets, by the intersection of supply and demand. In this case demand is predetermined by the market
operator and is expressed in the form of a downward sloping demand curve that is known as the variable
resource requirement (VRR). The VRR is established for the RTO as a whole and for each Locational
Delivery Area (LDA) using two specific parameters: the Installed Reserve Margin (IRM), and the cost of
New Entry (CONE). Table 13 below gives brief definitions of LDA, IRM, and CONE, with more
detailed descriptions given in the related references. In general the VRR curve is set forth by PJM to
elicit the correct amount of capacity in a given region at the correct price.
Table 13: Variables used in the determination of market-clearing prices
Variable Units Abbreviation Definition
Cost of New Entry141
$/MW-Day CONE
The estimated cost of bringing a new
combustion-turbine online in the
specified zone.
Installed Reserve
Margin142
% IRM
A measure used to calculate the
amount of installed capacity needed
to ensure reliability.
Locational Delivery
Area143
- LDA
A sub-region within PJM that is
defined as being constrained by
having inadequate transmission or
generation to meet the reliability
requirement.
5.4.3 Market Price Estimation
Given that the capacity market in PJM has only been in operation since the 2007 demand year, there is
only a limited amount of historical data on market-clearing prices. Additionally, PJM’s territory has
changed since the implementation of the RPM, meaning that some zones have come or gone, leading to
further inconsistences in the data. Thus, the Revenue Calculator utilizes a simple historic average of zonal
market-clearing prices to forecast the zonal prices in the subsequent auction.
141
PJM Manual 18: PJM Capacity Market. Revision: 17, Effective Date: 12/20/2012. Section 3.3.1: Cost of New
Entry, Page 17. 142
PJM Manual 18: PJM Capacity Market. Revision: 17, Effective Date: 12/20/2012. Section 2.1.1: Installed
Reserve Margin, Page 7. 143
PJM Manual 18: PJM Capacity Market. Revision: 17, Effective Date: 12/20/2012. Section 3.3: Parameters of
the Variable Resource Requirement, Page 16.

Figure 19 below shows the historical capacity prices in each PJM zone since the market’s inception in the
2007 demand year. These prices show clear variability over time, but the market clearing prices in the
2014 and 2015 seem to be converging around the middle of the range of prices. This observation
suggests that prices in the RPM are stabilizing.144
Figure 19: Zonal Capacity Prices Over Time
The Revenue Calculator utilizes the above data and the historical average to make a prediction of what
the market-clearing price in the RPM will be in the 2016 demand year. Unfortunately, the capacity
market in PJM has only been through nine iterations and some zones, such as ATSI, have only been
added to the market recently. This means that there is a very limited amount of data on which the price
forecasts can be made. For this reason, the forecast for the base market-clearing price in each zone was
assumed to be the average of the historical non-LDA prices for that particular zone. This was done to
allow for users to select whether their particular zone had been designated as an LDA for the 2016
demand year auction, and thus avoid the assumption that certain zones would remain constrained or non-
constrained. Table 14 below shows the statistics of historic zonal market-clearing prices.
144
PJM Auction User Information: Delivery Year 2007/2008 – 20015/2016. Source: http://www.pjm.com/markets-
and-operations/rpm/rpm-auction-user-info.aspx
0.00
50.00
100.00
150.00
200.00
250.00
300.00
350.00
400.00
2006 2007 2008 2009 2010 2011 2012 2013 2014 2015 2016
Cap
acit
y P
rice
($
/MW
-Day
)
Demand Year
Capacity Prices Over Time
AE AEP APS ATSI BGE
COMED DAYTON DEOK DLCO DOM
DPL DUQ JCPL METED PECO
PENLC PEPCO PL PS RECO

Table 14: Average, Minimum, Maximum, and Standard Deviation of historical non-LDA capacity
prices
Zone
Average Zonal
Capacity Price
($/MW-Day)
Minimum Zonal
Capacity Price
($/MW-Day)
Maximum Zonal
Capacity Price
($/MW-Day)
Standard
Deviation Zonal
Non-LDA
Average Capacity
Price ($/MW-Day
AE 142.15 110.00 174.29 32.15
AEP 93.79 16.74 174.29 50.50
APS 92.76 16.74 174.29 53.47
ATSI 76.83 27.73 125.94 49.10
BGE 142.15 110.00 174.29 32.15
COMED 93.79 16.74 174.29 50.50
DAYTON 93.79 16.74 174.29 50.50
DEOK 130.28 125.94 134.62 4.34
DLCO 76.26 16.74 134.62 54.25
DOM 117.94 16.74 245.09 63.45
DUQ 129.42 102.04 174.29 31.99
DPL 110.00 110.00 110.00 0.00
JCPL 142.15 110.00 174.29 32.15
METED 109.25 40.80 174.29 47.23
PECO 142.15 110.00 174.29 32.15
PENLC 109.25 40.80 174.29 47.23
PEPCO 157.61 110.00 188.54 34.16
PL 109.25 40.80 174.29 47.23
PS 142.15 110.00 174.29 32.15
RECO 142.15 110.00 174.29 32.15
One of the key determinations of the price that a demand resource could receive for their capacity within
the RPM is their location within PJM’s territory. Prior to the auction, PJM designates particular regions
as being capacity constrained, meaning that there is either insufficient generation or transmission
resources to reliably meet peak demand. The regions are deemed Constrained Locational Delivery Areas
or LDAs. In an effort to signal additional resources to these areas, PJM defines individual VRR curves
for each of these areas. These curves represent a higher capacity target for the area and thus a higher
price for that capacity.145
As mentioned above, the Revenue Calculator uses historic non-LDA prices to create a base market-
clearing price forecast each zone. In order to account of the higher prices that are seen in zones located
145
PJM Manual 18: PJM Capacity Market. Revision: 17, Effective Date: 12/20/2012. Section 2.3: Locational
Constraints in the Reliability Pricing Model, Page 10.

within an LDA, an estimate for a price adder was made using a difference of means and confirmed with a
one-sided T-Test. Average LDA market-clearing prices were compared with average non-LDA market-
clearing prices and determined to be approximately $69.32 higher. This difference was confirmed to be
significant by a one-sided T-Test p-value > 0.01. Thus, should the Revenue Calculator user indicate that
their zone has been defined as an LDA; the forecast market-clearing price will be the base price for that
zone plus the $69.32 LDA adder.
Additionally, beginning in the 2014 demand year auction, demand resources have been given the option
to select one of three product types: Limited Summer DR, Extended Summer DR, and Annual DR. These
products carry varying hours during which participating resources may be called to perform, with
Extended Summer and Annual DR products carrying an increasing number of hours that a resource would
be obligated to curtail load should they be called to do so. Accordingly, the Extended Summer and
Annual DR are afforded additional payments to Limited DR. The history of these additions, however, is
extremely limited and thus it is very difficult to forecast what the price increase associated with selecting
these products might be in the future. For the purpose of the Revenue Calculator, the mean of historical
prices was used estimate what the prices for Extended Summer and Annual DR products might be.
5.4.4 Inputs
The Revenue Calculator was designed to be a user-friendly application for producing a rough estimate of
the monetary gains that could be made from participation as a demand resource in PJM’s capacity market.
To this end, the interface is quite straight-forward, and requires only minimal input from the user
regarding the amount of load the user would like to nominate into the auction. Shown below is a screen
shot of the user-input screen (Figure 20).

Figure 20: User input screen of the Revenue Calculator
In this screen the user is prompted to enter basic information needed for revenue calculation, such as their
zone within PJM, their peak load contribution, and the amount of load reductions they would like to bid
into the auction (see Section 6.2 for a discussion of how they might attain a reasonable estimate of
potential load reductions). Further down the screen the user would be prompted to select one of the three
load management options mentioned above, as well as the demand response product type they desire.
Finally, the user is asked to enter the values for Forecast Pool Requirement and Demand Resource Factor
from the Planning Period Parameters, which are released in February prior to the base auction. Direct
input of these values allows for a more accurate estimation of revenues and they are readily available to
any potential market participant. Also included in these planning period inputs is a drop-down for
selecting whether the user’s zone has been designated as an LDA for that auction or not.
5.4.5 Outputs
Once the user has input all the relevant information, the Revenue Calculator utilizes the equations
mentioned in Section 5.4.1 above, along with the appropriate forecasted market price and any appropriate
adders for LDA or DR product, to produce an estimate of the revenue potential for a specific demand
resource. The user would see displayed this estimation along with brief descriptions of the selected load
management type and DR product selected. Additionally, the user is given a simple estimation of costs
based on the membership fees associated with participation in the RPM and an assumed $15,000 in
personnel costs necessary to employ someone to manage the logistics of operating as a demand resource.
Finally, a bar graph representing the base, high, and low estimates for revenue is produced based on a
75% confidence interval for the appropriate market price. Figure 21 below shows a screen-shot of the
outputs interface a user of the Revenue Calculator would be presented with.
Figure 21: Output screen of the Revenue Calculator
5.4.6 Scenario Analysis
In order to gain additional insights from the Revenue Calculator, a number of unique scenarios were run
to determine the changing revenues that a potential consumer might expect. In all cases a representative
demand resource was modeled with a peak load contribution of 10MW and varying amounts of load
nominated for management from 0.1 to 10MW. Note that revenues level off in the scenarios where the
resource has reached its maximum unforced capacity level (in this case approximately 9.3MW).
Figure 22 below shows a comparison of how revenues might differ depending on the user selecting
amongst the different demand response products. As might be expected users that allow themselves the
possibility of being called upon for a greater number of hours during the year are accordingly
compensated to a higher degree.

Figure 22: Analysis of the effect of product type on revenue
Additionally, Figure 23 below gives a visual comparison of the revenue increase that a demand resource
might expect if it were to be located in a designated LDA zone versus an unconstrained area. Clearly the
LDA adder makes revenue potential in these areas significantly higher, with the estimated maximum
potential revenue for a 10MW PLC customer being $936,315 were the AE to be defined as an LDA,
verses $540,174 if that same customer were in an unconstrained zone.
Figure 23: Analysis of the effect of LDA on revenue
Finally, given that revenue estimation in the Revenue Calculator is derived from a forecast model based
on historical prices, it is inherently never going to predict the exact market-clearing prices that will
$0
$200,000
$400,000
$600,000
$800,000
$1,000,000
0 1 2 3 4 5 6 7 8 9 10
An
nu
al R
eve
nu
e (
$)
Load Under Management (MW)
Scenario Analysis - Product Type
Annual Revenue - AE, LDA, GLD ($) Limited DR
Annual Revenue - AE, LDA, GLD ($) Extented Summer DR
Annual Revenue - AE, LDA, GLD ($) Annual DR
$0
$200,000
$400,000
$600,000
$800,000
$1,000,000
0 1 2 3 4 5 6 7 8 9 10
An
nu
al R
eve
nu
e (
$)
Load Under Managment (MW)
Scenario Analysis - LDA Zone
Annual Revenue - AE, GLD, Annual ($) Non-LDA
Annual Revenue - AE, GLD, Annual ($) LDA

actually occur in the market. For that reason it is worthwhile exploring the best and worst cases of
market prices to get an understanding for the complete range of potential revenues. Figure 24 below
shows an example of the potential revenue for a hypothetic demand resource given the absolute minimum
(corresponding to $16.74/MW-Day in multiple zones during the 2012 DY) and absolute maximum
(corresponding to $377.23/MW-Day for an Annual DR Resource in ATSI during the 2015 DY) market
prices that have been observed in the past.
Figure 24: Analysis of minimum and maximum historic capacity prices
5.4.7 Alternative Market Price Estimation
As stated in Section 4.5.2, the purpose of the PJM capacity market is to provide incentives to attract and
retain generation to ensure that there are adequate resources available to meet the highest levels of
demand while maintaining the reliability criterion of a loss of load expectation of once in ten years.146
The
decision support tool provided in Section 5 offers an estimation of potential revenues for a demand
resource participating in this market using a next-year price forecast based on historical data. The
Revenue Calculator assumes that upfront costs of becoming a demand resource are so low as to be
essentially negligible. While this may be a reasonable assumption for the majority of institutions, some
others may need to consider significant capital expenditures in order to enable load curtailment. To
justify incurring significant capital expenses such institutions will need to forecast long term revenues and
therefore may wish to have a deeper understanding of the theory behind the capacity market and the
mechanism of capacity payments. This section attempts to provide greater insight into the PJM capacity
market and offers an alternative technique for estimating the long-term compensation that a resource
might expect.
In order to understand the structure of capacity markets, it is important to remember some of the history
of the electric utility industry. From the inception of the industry until the mid-1990s, generating
resources were built and owned by utilities best classified as government-regulated monopolies.147
These
146
PJM Manual 18: PJM Capacity Market. Revision: 17, Effective Date: 12/20/2012. Section 2.3: Locational
Constraints in the Reliability Pricing Model, Page 10. 147
Geddes, R. Richard. A Historical Perspective on Electric Utility Regulation. CATO Review of Business and
Government. 1992.
$0
$200,000
$400,000
$600,000
$800,000
$1,000,000
$1,200,000
$1,400,000
$1,600,000
0 1 2 3 4 5 6 7 8 9 10
An
nu
al R
eve
nu
e (
$)
Load Under Management (MW)
Minimum and Maximum Revenue
Annual Revenue - ($) Minimum Case Annual Revenue - ($) Maximum Case
utilities were allowed to receive compensation from the sale of electricity based only on the variable costs
associated with production, and with return for their investment in infrastructure collected through a
separate demand charge on customer’s bills.148
As explained earlier in this document, today, electricity
markets have been restructured and vertically integrated utilities have given way to an increase in
independently owned generation. These generators, however, are still subject to receiving payments
based on their marginal costs of producing energy, which is insufficient to cover all the associated capital,
financing, and fixed operating and maintenance costs.149
For this reason, resources wishing to enter the
market must rely on capacity payments to supplement their revenues and cover their fixed costs.
PJM attempts to offer resources this “missing money” by allowing them to participate in a forward
capacity market. Unfortunately, the current structure of the RPM only provides resources with a price
signal for a single year, while investors will be concerned with the payments that they can expect over the
lifetime of their asset. Therefore market participants may need to develop a model of the capacity market
that allows forecasting long-term price signals. Understanding the RPM market mechanism can facilitate
such process.
Like many other markets, prices in RPM are determined by the intersection of supply and demand. PJM
determines the market’s demand for capacity, or the Variable Resource Requirement (VRR), based on the
Cost of New Entry (CONE) and the Installed Reserve Margin (IRM). The CONE value represents an
estimate of the levelized capital and fixed operating costs of bringing a new natural gas combustion
turbine (NGCT) online within the PJM territory. By subtracting the energy and ancillary services earnings
a typical NGCT might expect based on an estimated number of operating hours, the additional revenue
required to meet fixed and costs can be calculated. This difference between expected and needed
revenues represents the amount that a new generator would need to earn through capacity payments to
find the PJM market profitable. Given that the goal of the capacity market is to attract this type of
investment, long-term capacity payments can be assumed to roughly equal this additional revenue
requirement of a NGCT.150
Therefore, anyone interested in estimating the long-term capacity revenues
would be well served by estimating the costs of associated with NGCT through the use of the Integrated
Environmental Control Model151
, the U.S. Energy Information Administration’s Levelized Cost of New
Generation Resources Outlook152
, or the Brattle Group’s CONE report.153
5.4.8 Environmental Impacts
Recently, colleges and universities have begun to place an increased emphasis on managing their
environmental impacts. As a result, they have realized both financial benefits in the form of cost savings,
as well as improved public-perception from becoming more environmentally friendly. While the above
sections make clear the financial incentives of DR, the environmental benefits available to institutions are
less transparent. This section provides a brief analysis of the potential impacts DR could have on the
environment in the short and long terms.
Initially, the dispatch of a demand resource in response to an emergency event means that conventional
power generating units are not required to ramp-up or turn-on to match the increased load. Avoiding this
148
Griffith, Mark. Capacity Markets Demystified. Published: October 2008 by Ventyx. 149
Griffith, Mark. Capacity Markets Demystified. Published: October 2008 by Ventyx 150
Griffith, Mark. Capacity Markets Demystified. Published: October 2008 by Ventyx 151
Carnegie Mellon University. Integrated Environmental Control Model. Source: http://www.cmu.edu/epp/iecm/ 152
U.S. Energy Information Administration. Levelized Cost of New Generation Resources in the Annual Energy
Outlook 2012. 153
The Brattle Group. Cost of New Entry Estimates for Combustion Turbine and Combined-Cycle Plants in PJM.
8/14/2011.

peaking generation reduces fuel consumption and consequently also reduces the corresponding air
emissions.
Further, because DR can respond quickly to mismatches between electricity supply and demand it will
facilitate integrating into the grid variable and intermittent energy resources such as wind and solar.
Also, DR may further contribute to integrating these renewable sources and reducing emissions by
shifting load from peak hours to the hours of day that these variable energy resources are operating at
their highest capacity.154
In the mid-term, DR reduces the need for additional infrastructure investment to meet increasing demand
over time. The peak-reductions afforded by widespread DR negate the need to build either new
transmission lines or generators that would only operate during a few of the highest demand hours during
the year. These changes lead to reductions in impacts from the procurement of this infrastructure.
Conversely, DR can have some detrimental long-term environmental effects. First, delaying the build-out
of new infrastructure postpones the replacement of older, dirtier plants. Also, utilizing DR to meet peak
load only affects the generation mix during a few hours during the year, while if a new natural gas
combined cycle plant were built, it would likely participate in the energy market and would be called
upon to run for a higher percentage of hours, displacing older and dirtier generation.155
Additionally, it is important to consider the fact that PJM allows demand resources to use behind-the-
meter generation, which usually takes the form of emergency diesel generators, to meet load curtailment
requirements rather than shedding load. Given the US Environmental Protection Agency’s recent
decision to increase the annual hours this type of generation is allowed to run, DR may not be producing
its anticipated environmental impacts.156
Finally, it is worth considering the impacts that DR is having on prices and both the positive and negative
results. The integration of DR in the PJM capacity market has led to drastic reductions in the market-
clearing prices in the past, dropping from $40.15/kW-yr in 2011/2012 to just $6/kW-yr in 2012/2013.157
As mentioned above this discourages the construction of new generation of all kinds. Were a variable
resource, such as wind or solar attempt to enter the PJM territory they would likely need to be
compensated for more than just the energy they produced, and lower capacity prices would make it more
difficult for these projects to become economically viable.
Clearly, there are a variety of factors that will determine the exact effects DR will have on the
environment, and in order to ensure that DR achieves its positive potential outcomes additional
regulations are going to be required. Closely monitoring the amount of backup generation used to meet
curtailment obligations will ensure that DR is truly a clean energy source rather than a marginally less, or
even more emitting than the current generation mix. Incorporating strict minimum and maximum bids for
capacity will help keep prices in line, and strong air quality standards and aggressive renewable portfolio
standards will be required to ensure a more environmentally friendly generation portfolio in the future.
154
Ruscoe, A.G.; Ault, G. Supporting High Penetrations of Renewable Generation Via Implementation of Real-Time
Electricity Pricing and Demand Response. IET Renewable Power Generation. 4.4 (2010): 369-382. 155
Hibbard, Paul. Reliability and Emission Impacts of Stationary Engine-Backed Demand Response in Regional
Power Markets. Analysis Group. 8/2012. 156
U.S. Environmental Protection Agency. National Emissions Standards for Hazardous Air Pollutants for
Reciprocating Internal Combustion Engines; New Source Performance Standards for Stationary Internal
Combustion Engines. Federal Register. 1/30/2013 157
King, Chris. How Demand Response Cuts Wholesale Power Costs. E-meter.com. 7/24/2012

6 Conclusion
6.1 General Conclusions Institutions such as colleges and universities typically have large electricity loads, and some degree of
flexibility in their usage patterns. This makes them prime candidates for participation in DR programs.
With a large number of institutions located within their territory, and robust markets available to demand
resources, the PJM RTO/ISO offers these customers an opportunity to earn incentives and contribute to
realization of the environmental and greater economic benefits of demand response. Unfortunately,
information about how to participate is difficult to understand for those unfamiliar with wholesale
electricity markets. In striving to empower customers with the knowledge of how to get involved in PJM’
DR programs and the associated benefits of participation, this project focused on developing a
comprehensive resource that offered (1) a framework of the regulatory structure surrounding the PJM
markets, and (2) a tool for estimation the revenue potential participating in demand response had for an
individual customer. Creation of this guide has yielded insights into both DR in general, as well as its
role within the PJM’s wholesale electricity markets. Additionally, analysis of revenue potential for a
demand resource in the capacity market has produced some conclusions about the economic benefits that
an institutional customer may obtain.
DR has clearly evolved significantly since its origins as simple wink-and-nod deals with utilities biggest
customers, and has become an integral part of PJM’s wholesale electricity markets, providing increased
reliability of the transmission network during times of high stress, and helping to lower electricity prices
by negating the need for additional generation resources. The importance of DR with PJM can be seen in
how it is contributing in all resource categories, from capacity, to real-time energy, to ancillary services.
Additional, it is important to recognize that PJM offers its members a wide variety of registration options
designed to accommodate the capabilities of individual demand resources. Thus, a wide range of
customers will be able to find a service that they can perform as a demand resource. One major
difference that is important for potential demand resources to keep in mind is that enrollment in the
Economic program requires only voluntary reductions in load to earn incentives, whereas enrollment in
the Emergency program carries the obligation of making specific load reductions when called on to
perform. Failure to meet these obligations in the Emergency program carries the repercussion of being
forced to pay non-performance penalties. This increased risk exposure in the Emergency program is
balanced with generally higher payments than the less-risky Economic program.
Given the plethora of registration options available to demand resources in the PJM markets, and complex
natural of participation, enticing institutions towards participation will likely require some determination
of the benefits available to them. To this end, the Revenue Calculator created as a part of this study aims
to support potential customers in their decision to become a DR resource. Results produced by the
Revenue calculator show that participation in PJM’s capacity market does indeed result in economic
benefits, which corresponded directly to the amount of useful capacity a resource is able to provide.
Thus, larger institutions stand to gain greater revenues from the RPM. It is also worth noting that PJM
places additional value on resources in constrained areas, and according those resources located in zones
that are determined to be Constrained Location Delivery Areas stand to gain increase revenues when
compared to unconstrained zones. Additionally, PJM provides greater compensation to those resources
that select to be available to perform a greater number of hours during the year by choosing to participate
in Extended Summer or Annual DR products. Finally, analysis of market-clearing prices in the RPM
shows a high degree of variability historically, but recent auctions suggest that they may be gaining
stability. This increased price stability may make it easier for potential demand resources to predict their
individual benefits and thus encourage their registration.

6.2 Further Research While this guide offers institutional electricity customers both a detailed framework of the rules and
regulations of PJM’s demand response programs, and a user-friendly tool to estimate the revenue
potential of participation in the capacity market, it could be further improved to include additional
resources. Of particular interest to institutions considering become demand response providers would be
a technique for determining what load reductions could be actualized and offered into the markets, as well
as a method for assessing the reactions of stakeholders forced to make behavioral changes. Finally, the
Revenue Calculator tool could be both expanded to include additional markets, and improved in its
abilities to forecast market prices.
Considering that participation in demand response, by definition, requires a customer to draw less
electricity from the grid during times when demand is at its highest, an in-depth knowledge of their
current energy consumption, as well as an understanding of how and when reductions in that consumption
could be made, would be imperative to DR participation. A Curtailment Model would effectively
accomplish each of these tasks. Creation of such a model would first require gathering data about the
building(s) that a customer would be placing under management. This would include determination of
the typical load pattern throughout the day and the year, as well as what operations or equipment was
responsible for consuming that load. Production of an energy model using software such as Trace 700
would likely be helpful in making these determinations.158
Next, an identification of which of loads were
non-essential during certain time periods would be necessary in figuring out the extent of the reductions
that could be made at any given time. At this point it would be possible to match the load reductions
possible at the customer’s site with the PJM market and program that best fit their capabilities.
Realization of the load reductions mentioned above without the use to behind the meter generation would
likely require significant changes in operations and behaviors for most institutional customers. In
considering implementation of a demand response program, most institutions would be well served by
assessing how these changes affected the various stakeholders involved. This would entail surveying
groups such as students, faculty, facilities and maintenance staff, and administration, to gather
information on how these reductions would affect their day-to-day behaviors and whether they would be
amenable to such changes. Implementation of a demand response program that had modest returns, but
caused major disruptions to primary operation or greatly diminished the quality of life on campus, would
likely not be received well nor would it be very successful.
Currently, the Revenue Calculator included in this guide utilizes historical prices to make a forecast for
the next market-clearing price in the RPM. While this provides a relatively accurate estimate of what
prices can be expected, it is unable to take into account any confounding factors. For example, the prices
in demand year 2012 were unusually low likely because of the 2008 economic downturn and subsequent
reductions in energy use. Such anomalies will always be problematic for forecasting models, but the
estimation of market prices may be improved by accounting for factors outside of the market, such as the
state of the economy.
Finally, given that the capacity market has accounted for the vast majority of revenue demand resources
have received from PJM in the past, and it continues to gain participation from DR it was the logical
choice for initial study. It would, however, be very useful to create a tool that assessed the revenue
generation potential of participating in the energy markets and Economic Load Response program. With
load curtailments being completely voluntary in these programs and thus carrying no penalties for non-
performance, institutions would be exposed to less risk. Additionally, the different registration options
available in the Economic program could allow for market participation with little to no up-front costs.
158
Trane Analysis Tool: Trace 700. Source: http://www.trane.com/Commercial/Dna/View.aspx?i=1136

Both of these factors may be helpful in encouraging some hesitant institutions to more seriously consider
becoming a demand resource. This type of analysis, however, would require a detailed knowledge of the
cost to the customer of making load reductions, and comparing those marginal costs of reducing with the
hourly LMP in their zone to determine what times it would be economically beneficial for them to make
those curtailments.

Appendix A: Timing and Structure of PJM’s Energy Market
Timing and Structure of PJM’s Energy Market:159
159
PJM Manual 11: Energy & Ancillary Services Market Operations. Revision: 56, Effective Date: November 29,
2012. Section 1: Overview of Energy & Ancillary Services Market Operations, Page 11.

Appendix B: Reliability Pricing Model Timeline
Reliability Pricing Model Timeline:160
160
PJM Presentation: Reliability Pricing Model Training. 10/29/2012. Source:
http://www.pjm.com/~/media/training/core-curriculum/ip-rpm/rpm-training-section-a-c-intro-demand-and-supply-
curve.ashx

Appendix C: History of PJM
History of PJM:161
161
PJM website: PJM History. Source: http://pjm.com/about-pjm/who-we-are/pjm-history.aspx