Embed Size (px)
Citation preview
Duke Energy Carolinas
South Carolina Integrated Resource Plan
(Annual Report)
September 1, 2015
Confidential
PUBLIC
DEC SC 2015 IRP TABLE OF CONTENTS
SECTION: PAGE:
1. INTRODUCTION............................................................................................................... 2
2. 2015 IRP SUMMARY ........................................................................................................ 3
3. IRP PROCESS OVERVIEW............................................................................................. 5
4. SIGNIFICANT CHANGES SINCE 2014 IRP ................................................................. 7
5. LOAD FORECAST .......................................................................................................... 18
6. ENERGY EFFICIENCY AND DEMAND SIDE MANAGEMENT ........................... 29
7. DEVELOPMENT OF THE RESOURCE PLAN .......................................................... 55
8. SHORT-TERM ACTION PLAN .................................................................................... 65
9. OWNED GENERATION ................................................................................................. 72
10. CONCLUSIONS ............................................................................................................... 84
11. NON-UTILITY GENERATION & WHOLESALE ...................................................... 86
Duke Energy Carolinas
South Carolina
2015 IRP Update Report
Integrated Resource Plan
September 1, 2015
2
1. INTRODUCTION:
For more than a century, Duke Energy Carolinas (DEC) has provided affordable and reliable
electricity to customers in South Carolina (SC) and North Carolina (NC) now totaling more than
2.4 million in number. The Company continues to serve its customers by planning for future
demand requirements in the most reliable and economic way possible.
Historically, each year, as required by the Public Service Commission of South Carolina
(PSCSC) and the North Carolina Utilities Commission (NCUC), DEC submits a long-range
planning document called the Integrated Resource Plan (IRP) detailing potential infrastructure
needed to match the forecasted electricity requirements for our customers over the next 15 years.
As per the PSCSC Order No. 91-885 Approving Least-Cost Integrated Resource Planning
Process, the Company is providing a Short-Term Action Plan, a 15 year plan and other pertinent
information compliant with said Order.
The Company files separate 2015 IRPs for South Carolina and North Carolina. However, the
IRP analyzes the system as one DEC utility across both states including customer demand,
energy efficiency (EE), demand side management (DSM), renewable resources and traditional
supply-side resources. As such, the quantitative analysis contained in both the South Carolina
and North Carolina filings is identical, while certain sections dealing with state-specific issues
such as state renewable standards or environmental standards may be specific to that state’s IRP.
Duke Energy Carolinas
South Carolina
2015 IRP Update Report
Integrated Resource Plan
September 1, 2015
3
2. 2015 IRP SUMMARY:
As 2015 is an update year for the IRP, DEC developed two cases based on the results of the 2014
IRP. The first case, or the “Base Case” is an update to the presented Base Case in the 2014 IRP
which includes the expectation of carbon legislation beginning in 2020. Additionally, a “No
Carbon Sensitivity” was developed in which no carbon legislation is considered. All results
presented in this IRP represent the Base Case, except where otherwise noted.
As shown in the IRP Base Case plan, projected incremental needs are driven by load growth and
the retirement of aging coal-fired resources. The 2015 IRP seeks to achieve a reliable, economic
long term power supply through a balance of incremental renewable resources, EE, DSM,
nuclear, and traditional supply-side resources planned over the coming years. In order to reliably
and affordably meet our customers’ needs into the future, the Company projects the need for
incremental investments in these resources as depicted in the charts below.
Duke Energy Carolinas
South Carolina
2015 IRP Update Report
Integrated Resource Plan
September 1, 2015
4
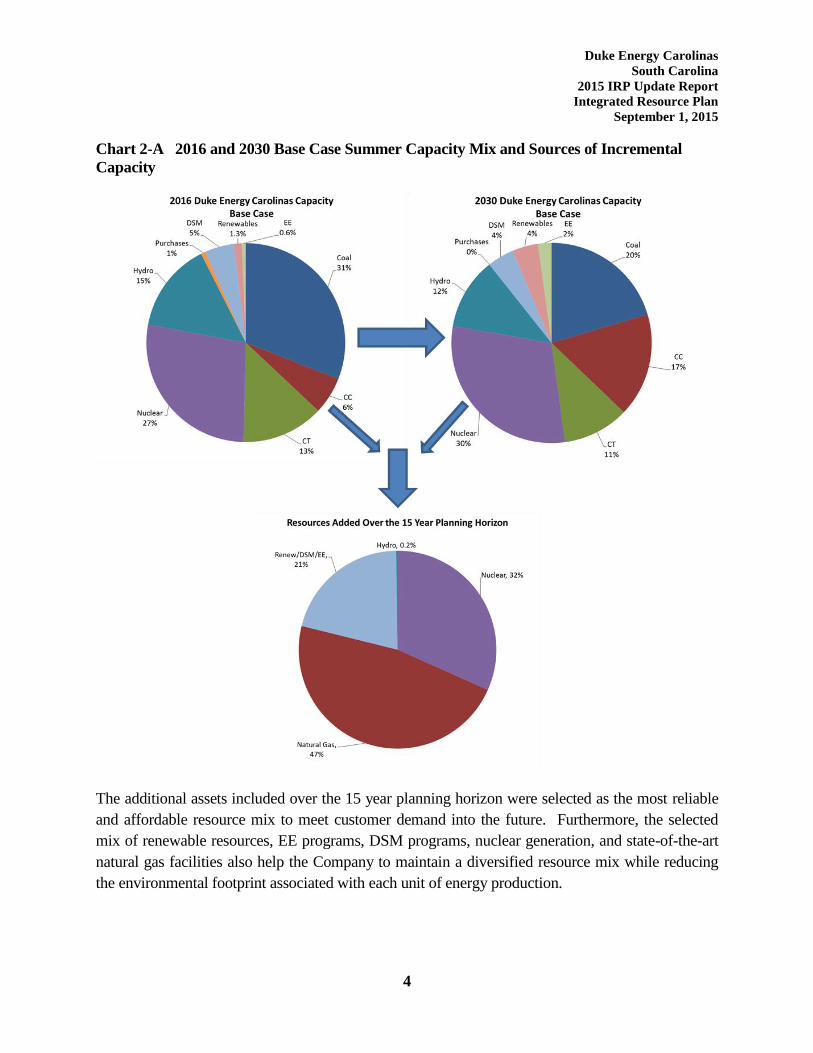
Chart 2-A 2016 and 2030 Base Case Summer Capacity Mix and Sources of Incremental
Capacity
The additional assets included over the 15 year planning horizon were selected as the most reliable
and affordable resource mix to meet customer demand into the future. Furthermore, the selected
mix of renewable resources, EE programs, DSM programs, nuclear generation, and state-of-the-art
natural gas facilities also help the Company to maintain a diversified resource mix while reducing
the environmental footprint associated with each unit of energy production.
Duke Energy Carolinas
South Carolina
2015 IRP Update Report
Integrated Resource Plan
September 1, 2015
5
3. IRP PROCESS OVERVIEW:
To meet the future needs of DEC’s customers, it is necessary for the Company to adequately
understand the load and resource balance. For each year of the planning horizon, the Company
develops a load forecast of cumulative energy sales and hourly peak demand. To determine total
resources needed, the Company considers the peak demand load obligation plus a 17% minimum
planning reserve margin. The projected capability of existing resources, including generating units,
EE and DSM, renewable resources and purchased power contracts, is measured against the total
resource need. Any deficit in future years will be met by a mix of additional resources that reliably
and cost effectively meet the load obligation and planning reserve margin while complying with all
environmental and regulatory requirements. It should be noted that DEC considers the non-firm
energy purchases and sales associated with the Joint Dispatch Agreement (JDA) with Duke Energy
Progress (DEP) in the development of its independent Base Case. To accomplish this, DEC and
DEP plans are determined simultaneously to minimize revenue requirements of the combined
jointly-dispatched system while maintaining independent reserve margins for each company.
The use of a 17% reserve margin represents an increase over last year’s IRP and is discussed in
more detail in Chapter 4. As discussed in Chapter 4, this increase does not materially impact the
near-term resource needs of the Company as projected in the Short-Term Action Plan but rather
influences the subsequent years of the plan.
For the 2015 Update IRP, the Company presents a Base Case with a CO2 tax beginning in 2020.
The current assumption of a CO2 tax is intended to serve as a placeholder for future carbon
regulation. Consistent with this assumption, the final Environmental Protection Agency (EPA)
Clean Power Plan (CPP) was released in mid-August and each state is in the process of developing
individual state plans to comply with the rule as discussed in Chapter 4. Furthermore, a primary
focus of this update IRP is the Short-Term Action Plan (STAP) which runs from 2016 to 2020. It
was determined that the inclusion of the CO2 tax did not have a significant impact on the STAP, and
therefore the majority of the data presented in this report is taken from the CO2 case (Base Case).
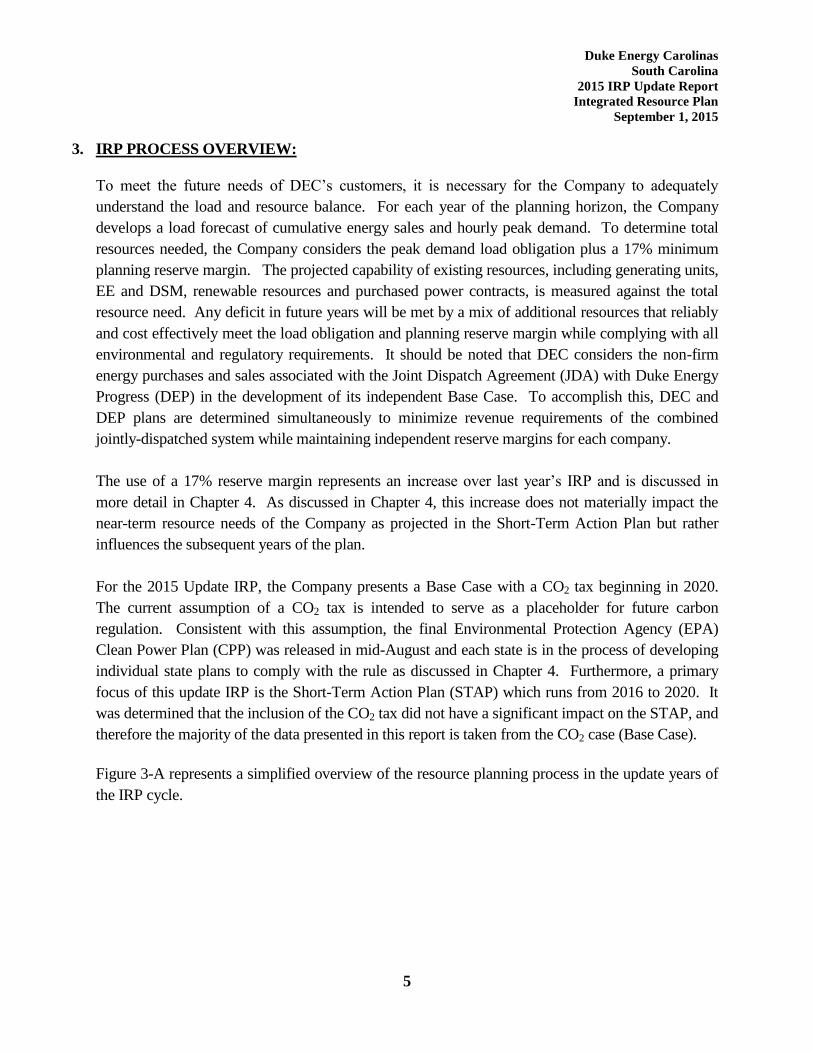
Figure 3-A represents a simplified overview of the resource planning process in the update years of
the IRP cycle.
Duke Energy Carolinas
South Carolina
2015 IRP Update Report
Integrated Resource Plan
September 1, 2015
Figure 3-A Simplified IRP Process
6
Duke Energy Carolinas
South Carolina
2015 IRP Update Report
Integrated Resource Plan
September 1, 2015
7
4. SIGNIFICANT CHANGES FROM THE 2014 IRP:
As an initial step in the IRP process, all production cost modeling data is updated to include the
most current and relative data. Throughout the year, best practices are implemented to ensure the
IRP best represents the Company’s generation system, conservation programs, renewable energy
and fuel costs. The data and methodologies are regularly updated and reviewed to determine if
adjustments can be made to further improve the IRP process and results.
As part of the review process, certain data elements, with varying impacts on the IRP, inevitably
change. A discussion of newly included or updated data elements that had the most substantial
impact on the 2015 IRP is provided below.
a) Load Forecast:
The 2015 DEC Spring Load Forecast is updated to include the most current data. The process
and models for the load forecast remain the same, however the method by which utility energy
efficiency (UEE)1 impacts are incorporated into the load forecast has changed since the 2014
IRP. UEE programs are energy efficiency programs that were developed and offered to
customers by the Company. The impacts of UEE on the load forecast do not include load
reductions from free-riders. Free-riders are those customers who would have adopted the
energy efficiency program regardless of incentives provided by the Company.
Program lives of UEE programs were previously considered indefinite in the IRP process, but in
this year’s IRP, are more clearly incorporated in the load forecast. Many UEE programs have a
finite program life, much like the useful life of any generating resource. By including the useful
life of the programs, the Company is better able to account for the UEE programs available to
the DEC system, and as such, represent a more realistic and accurate representation of these
programs. A numerical representation of the impacts of these changes and impacts to the load
forecast are included in Chapter 5.
In the development of the load forecast, many variables may cause the load forecast projection
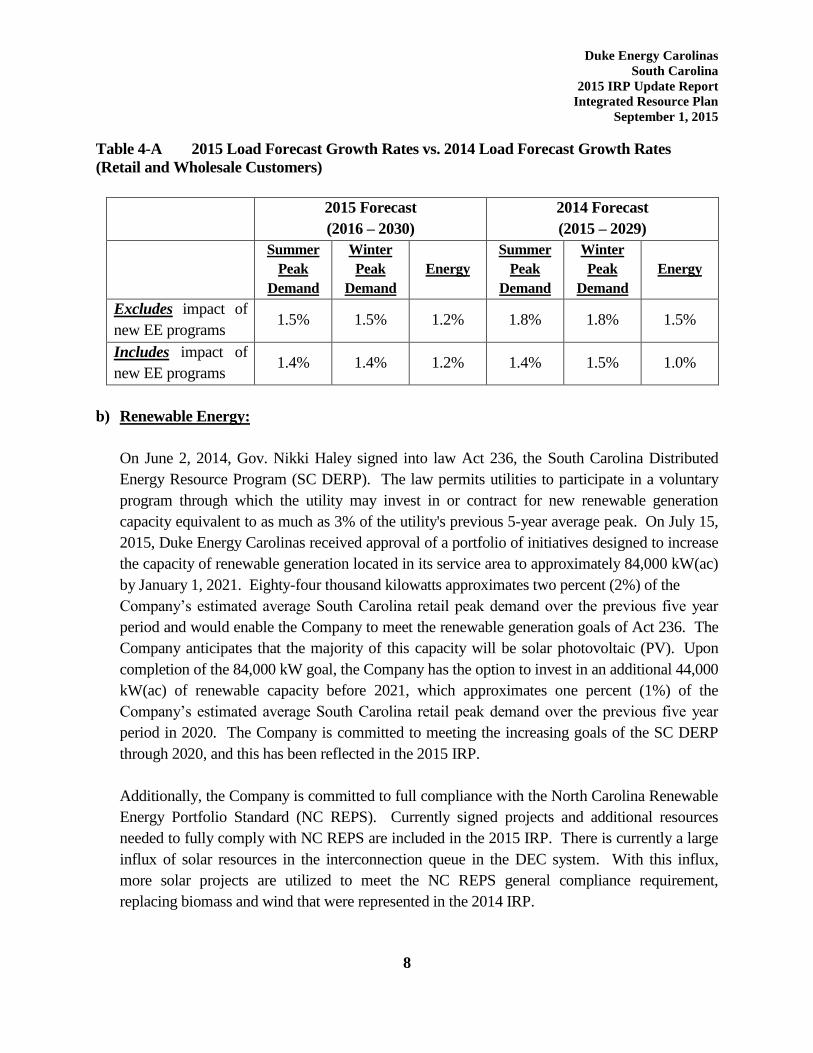
to change. A brief comparison of the growth of the DEC load forecast is presented in Table 4-A
and a more detailed discussion can be found in Chapter 5.
1 The term UEE is utilized in the load forecasting sections which represents utility-sponsored EE impacts net of free
riders. The term “Gross EE” represents UEE plus naturally occurring energy efficiency in the marketplace.
Duke Energy Carolinas
South Carolina
2015 IRP Update Report
Integrated Resource Plan
September 1, 2015
8
Table 4-A 2015 Load Forecast Growth Rates vs. 2014 Load Forecast Growth Rates
(Retail and Wholesale Customers)
2015 Forecast
(2016 – 2030)
2014 Forecast
(2015 – 2029)
Summer
Peak
Demand
Winter
Peak
Demand
Energy
Summer
Peak
Demand
Winter
Peak
Demand
Energy
Excludes impact of
new EE programs 1.5% 1.5% 1.2% 1.8% 1.8% 1.5%
Includes impact of
new EE programs 1.4% 1.4% 1.2% 1.4% 1.5% 1.0%
b) Renewable Energy:
On June 2, 2014, Gov. Nikki Haley signed into law Act 236, the South Carolina Distributed
Energy Resource Program (SC DERP). The law permits utilities to participate in a voluntary
program through which the utility may invest in or contract for new renewable generation
capacity equivalent to as much as 3% of the utility's previous 5-year average peak. On July 15,
2015, Duke Energy Carolinas received approval of a portfolio of initiatives designed to increase
the capacity of renewable generation located in its service area to approximately 84,000 kW(ac)
by January 1, 2021. Eighty-four thousand kilowatts approximates two percent (2%) of the
Company’s estimated average South Carolina retail peak demand over the previous five year
period and would enable the Company to meet the renewable generation goals of Act 236. The
Company anticipates that the majority of this capacity will be solar photovoltaic (PV). Upon
completion of the 84,000 kW goal, the Company has the option to invest in an additional 44,000
kW(ac) of renewable capacity before 2021, which approximates one percent (1%) of the
Company’s estimated average South Carolina retail peak demand over the previous five year
period in 2020. The Company is committed to meeting the increasing goals of the SC DERP
through 2020, and this has been reflected in the 2015 IRP.
Additionally, the Company is committed to full compliance with the North Carolina Renewable
Energy Portfolio Standard (NC REPS). Currently signed projects and additional resources
needed to fully comply with NC REPS are included in the 2015 IRP. There is currently a large
influx of solar resources in the interconnection queue in the DEC system. With this influx,
more solar projects are utilized to meet the NC REPS general compliance requirement,
replacing biomass and wind that were represented in the 2014 IRP.
Duke Energy Carolinas
South Carolina
2015 IRP Update Report
Integrated Resource Plan
September 1, 2015
9
Finally, growing customer demand for renewable generation is driving the need for additional
solar resources. These resources are included as Green Source projects and are projected in the
IRP. Such projects are incremental to SC DERP and NC REPS compliance renewables. Green
Source projects include expected projects, whether Company-owned or procured that will
increase the capacity of renewable generation on the DEC system.
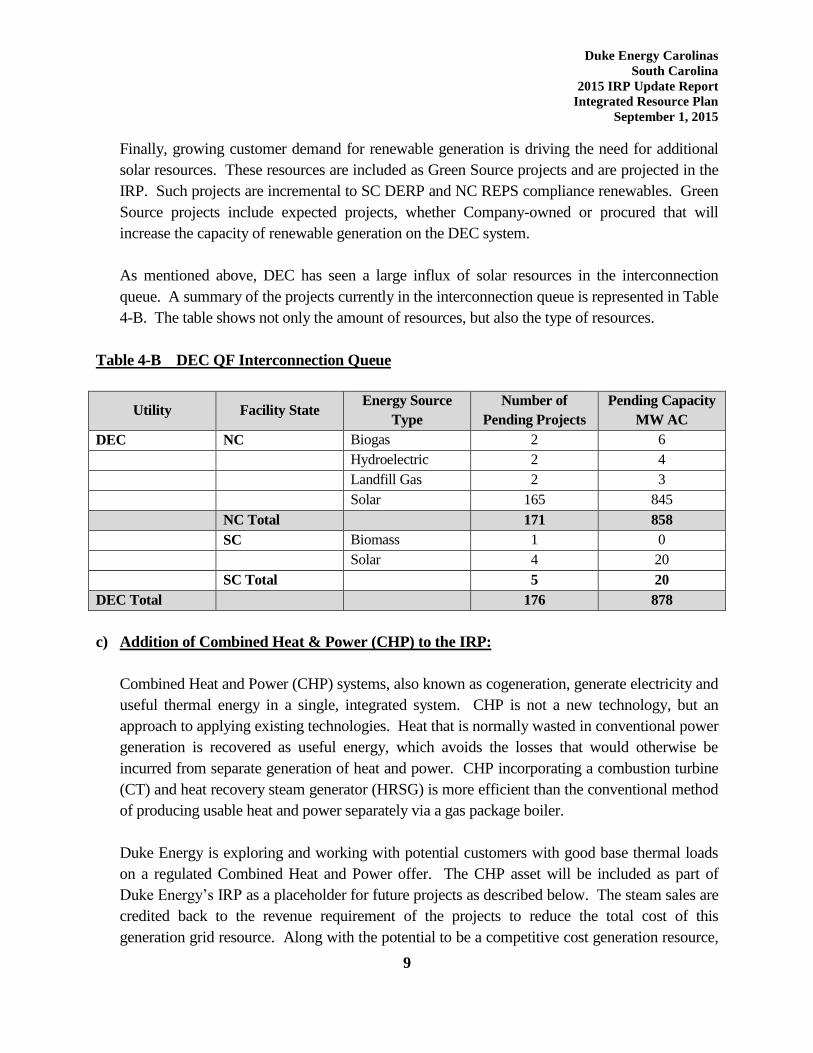
As mentioned above, DEC has seen a large influx of solar resources in the interconnection
queue. A summary of the projects currently in the interconnection queue is represented in Table
4-B. The table shows not only the amount of resources, but also the type of resources.
Table 4-B DEC QF Interconnection Queue
Utility Facility State Energy Source
Type
Number of
Pending Projects
Pending Capacity
MW AC
DEC NC Biogas 2 6
Hydroelectric 2 4
Landfill Gas 2 3
Solar 165 845
NC Total 171 858
SC Biomass 1 0
Solar 4 20
SC Total 5 20
DEC Total 176 878
c) Addition of Combined Heat & Power (CHP) to the IRP:
Combined Heat and Power (CHP) systems, also known as cogeneration, generate electricity and
useful thermal energy in a single, integrated system. CHP is not a new technology, but an
approach to applying existing technologies. Heat that is normally wasted in conventional power
generation is recovered as useful energy, which avoids the losses that would otherwise be
incurred from separate generation of heat and power. CHP incorporating a combustion turbine
(CT) and heat recovery steam generator (HRSG) is more efficient than the conventional method
of producing usable heat and power separately via a gas package boiler.
Duke Energy is exploring and working with potential customers with good base thermal loads
on a regulated Combined Heat and Power offer. The CHP asset will be included as part of
Duke Energy’s IRP as a placeholder for future projects as described below. The steam sales are
credited back to the revenue requirement of the projects to reduce the total cost of this
generation grid resource. Along with the potential to be a competitive cost generation resource,
Duke Energy Carolinas
South Carolina
2015 IRP Update Report
Integrated Resource Plan
September 1, 2015
10
CHP can result in CO2 emission reductions, and present economic development opportunities
for the state.
Projections for CHP have been included in the following quantities in the 2015 IRP:
2018: 20 MW
2020: 20 MW
As CHP continues to be pursued, future IRP processes will incorporate additional CHP, as
appropriate.
Additional technologies evaluated as part of the 2015 IRP are discussed in Chapter 7.
d) Reserve Margin:
In 2012, DEC and DEP (the Companies) hired Astrape Consulting to conduct a reserve margin
study for each utility. Astrape conducted a detailed resource adequacy assessment that
incorporated the uncertainty of weather, economic load growth, unit availability and
transmission availability for emergency tie assistance. Astrape analyzed the optimal planning
reserve margin based on providing an acceptable level of physical reliability and minimizing
economic costs to customers. The most common physical metric used in the industry is to
target a system reserve margin that satisfies the one day in 10 years Loss of Load Expectation
(LOLE) standard. This standard is interpreted as one firm load shed event every 10 years due to
a shortage of generating capacity. From an economic perspective, as planning reserve margin
increases, the total cost of reserves increases while the costs related to reliability events decline.
Similarly, as planning reserve margin decreases, the cost of reserves decreases while the costs
related to reliability events increase, including the costs to customers of loss of power. Thus,
there is an economic optimum point where the cost of additional reserves plus the cost of
reliability events to customers is minimized. Based on past reliability assessments, results of the
Astrape analysis, and to enhance consistency and communication regarding reserve targets, both
DEC and DEP had adopted a 14.5% minimum summer planning reserve margin for scheduling
new resource additions.
In 2015, DEC and DEP have contracted again with Astrape Consulting to perform an updated
resource adequacy study. The Companies believe that the study was warranted at this time due
to several factors. First, the severe, extreme weather experienced in the service territory the last
two winter periods was so impactful to the systems that additional review with the inclusion of
recent years’ weather history was warranted. Second, since the last reliability study the system
Duke Energy Carolinas
South Carolina
2015 IRP Update Report
Integrated Resource Plan
September 1, 2015
11
has added, and projects to add, a large amount of resources that provide meaningful capacity
benefits in the summer only. From a peak reduction perspective such summer oriented
resources include solar generation, HVAC load control and chiller uprates to existing natural gas
combined cycle units. The interconnection queue for solar facilities shows potential to add
significantly to the solar resources already incorporated in the system.
Initial results of this updated study indicate that a 17% summer planning reserve margin is
required to maintain the one day in 10 year LOLE standard. As such, DEC has utilized a 17%
planning reserve margin in the 2015 IRP as opposed to the 14.5% reserve margin used in the
2014 IRP. However, preliminary findings also indicate that a summer-only reserve margin
target may not be adequate for providing long term reliability given the increasing levels of
summer-only resources. Additional study is needed to determine whether dual summer/winter
planning reserve margin targets are required in the future. Once the final results are determined,
any changes will be included in the 2016 IRP.
Adequacy of Projected Reserves
DEC’s resource plan reflects summer reserve margins ranging from 17.0% to 25.6%.
Reserves projected in DEC’s IRP meet the minimum planning reserve margin target and
thus satisfy the one day in 10 years LOLE criterion. The projected reserve margin exceeds
the minimum 17% target by 3% or more in in 2022, 2028 and 2030 as a result of the
economic addition of large combined cycle facilities in those years. Also, the reserve margin
exceeds the minimum target by 3% in 2024 through 2027 due to the addition of baseload
nuclear units in 2024 and 2026.
The IRP provides general guidance in the type and timing of resource additions. Since capacity
is generally added in large blocks to take advantage of economies of scale, it should be noted
that projected planning reserve margins in years immediately following new generation
additions will often be somewhat higher than the minimum target. Large resource additions
are deemed economic only if they have a lower Present Value Revenue Requirement
(PVRR) over the life of the asset as compared to smaller resources that better fit the
short-term reserve margin need. Development of detailed self-build projects and utilization of
the Request for Proposals (RFP) process to consider purchased power alternatives will ensure
the Company selects the most cost-effective resource additions. Reserves projected in DEC’s
IRP are appropriate for providing an economic and reliable power supply.
Duke Energy Carolinas
South Carolina
2015 IRP Update Report
Integrated Resource Plan
September 1, 2015
12
e) Fuel Costs:
In the 2014 IRP, the first 5 years of natural gas prices were based on market data and the
remaining years were based off of fundamental pricing. Market prices represent liquid, tradable
gas prices offered at the present time, also called “future or forward prices.” These prices
represent an actual contractually agreed upon price that willing buyers and sellers agree to
transact upon at a specified future date. As such, assuming market liquidity, they represent the
markets view of spot prices for a given point in the future. Fundamental prices developed
through external econometric modeling, represent a projection of fuel prices into the future
taking into account changing supply and demand assumptions of the external marketplace. The
natural gas market has become more liquid, and there are now multiple buyers and sellers of
natural gas in the marketplace that are willing to transact at longer transaction terms. Due to the
evolving natural gas market, DEC and DEP are using market based prices for the first 10 years
of the planning period (2016 – 2025). Following the 10 years of market prices, the Companies
transition to fundamental pricing over a 5 year period with 100% fundamental pricing in 2030
and beyond.
As in the 2014 IRP, coal prices continue to be based on 5 years of market data in the 2015 IRP.
In order to account for the impact on coal prices by using a longer market based natural gas
price, the Companies are transitioning to fundamental coal pricing over a 10 year period (2021
to 2030), using the same growth rate as natural gas through that time period. Previously the
Companies moved to fundamental coal prices once market prices were unavailable, but the
Companies believe this creates an unrealistic disconnect between coal and natural gas prices in
the medium term.
f) EPA Clean Power Plan (CPP):
On August 3, 2015, the EPA signed the final CO2 emission limits rule for existing fossil-fuel
power plants, known as the Clean Power Plan. The regulation is promulgated under Section
111(d) of the Clean Air Act and is sometimes referred to as 111(d). The rule is both lengthy
(over 1550 pages) and complex. There have been considerable legal questions raised since the
initial proposal and the rule remains controversial both at the state and federal levels.
EPA has made substantial changes from the proposed rule it released in June 2014 and a
complete analysis will take time. The rule maintains a building block approach and preserves
the first three building blocks of heat rate improvement re-dispatch to natural gas and
construction of renewables. Building block 4, which in the proposal established energy
efficiency targets, has been eliminated from the final rule. There are new elements in the final
Duke Energy Carolinas
South Carolina
2015 IRP Update Report
Integrated Resource Plan
September 1, 2015
13
rule including additional compliance options, a model trading program and a “clean energy
incentive program” to encourage early investments in renewable generation and demand-side
energy efficiency.
Regulation under Section 111(d) of the Clean Air Act requires EPA to set the program
requirements in a guideline document it issues to the states. The document must include:
“An emission guideline that reflects the application of the best system of emission reduction …
that has been adequately demonstrated for designated facilities,” taking into account both the
“cost of achieving such emission reductions” as well as the “remaining useful life of sources.”
States use the EPA guidance document to develop their own regulations – often referred to as a
state implementation plan (SIP). States have primary implementation and enforcement
authority and responsibility for the regulation.
State emission reduction goals were calculated based on EPA’s determination of the “Best
System of Emission Reduction” (BSER) for existing plants. Since no technology is
commercially available to reduce CO2 emissions at fossil fueled power plants, EPA proposed
that the application of building blocks across the entire electric generation system was
appropriate for determining the degree of emission reduction that would be achievable.
States have until September 6, 2016 to submit a complete plan or a partial plan with an
extension request. States receiving an extension must submit a final state implementation plan
(SIP) by September 6, 2018. EPA plans to take one year to review state plans (this could be a
significant challenge for the Agency to accomplish). Duke Energy’s compliance obligations will
be finalized once a state compliance plan has been approved. If a state chooses not to submit a
plan or a plan is deemed to be inadequate, EPA will impose a federal plan on the state.
South Carolina
The South Carolina 2030 rate target increased from 772 lbs. CO2/MWh (proposed rule) to 1,156
lbs./MWh (final rule). In addition, the final rule includes a 2030 mass cap for South Carolina of
25,998,968 tons of CO2. The SC Department of Health and Environmental Control has a robust
stakeholder group evaluating options and intends to apply for the two year extension, pushing
back the date for submittal of a final rule to September 2018. Duke Energy operates no coal-
fired generation in South Carolina, so the impact of the rule is anticipated to be minimal.
Duke Energy Carolinas
South Carolina
2015 IRP Update Report
Integrated Resource Plan
September 1, 2015
14
North Carolina
The North Carolina 2030 rate target increased from 992 lbs. CO2/MWh (proposed rule) to 1,136
lbs./MWh (final rule). In addition, the final rule includes a 2030 mass cap for North Carolina of
51,266,234 tons of CO2. It remains unclear if this increased rate will make it easier or more
difficult to comply given the uncertainty surrounding the treatment of new natural gas combined
cycle (NGCC) units. Early indications are that the NC Department of Environment and Natural
Resources will pursue submittal of a final plan based on what utilities can achieve at the
individual affected unit, referred to as ‘Building Block 1’, to the EPA by the September 2016
deadline. With seven operational coal-fired stations and a growing fleet of NGCC units, the
final rule and implementation plan will certainly impact generation in North Carolina, but the
extent of these impacts remains unclear.
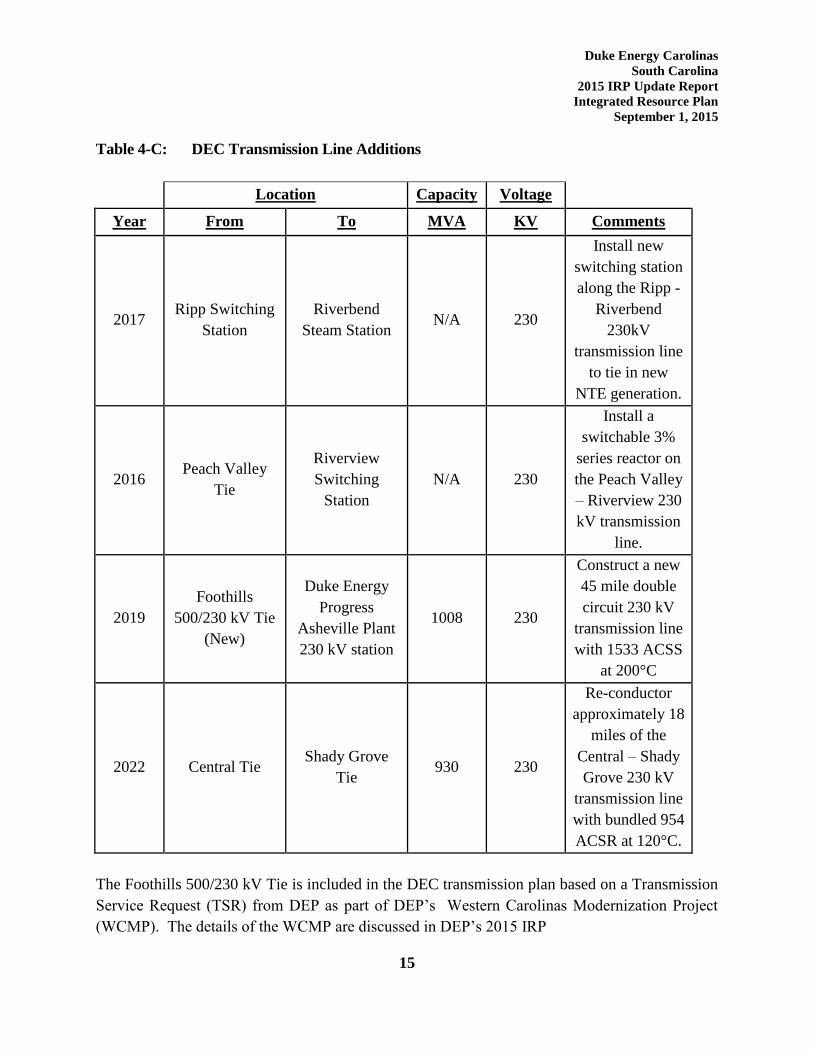
g) Transmission Planned or Under Construction:
This section contains the planned transmission line additions since the 2014 IRP. Only those
projects added since the 2014 IRP are included. Additionally, a discussion of the system
adequacy of DEC’s transmission system is included. Table 4-C lists the line projects that are
planned to meet reliability needs.
Duke Energy Carolinas
South Carolina
2015 IRP Update Report
Integrated Resource Plan
September 1, 2015
15
Table 4-C: DEC Transmission Line Additions
Location Capacity Voltage
Year From To MVA KV Comments
2017 Ripp Switching
Station
Riverbend
Steam Station N/A 230
Install new
switching station
along the Ripp -
Riverbend
230kV
transmission line
to tie in new
NTE generation.
2016 Peach Valley
Tie
Riverview
Switching
Station
N/A 230
Install a
switchable 3%
series reactor on
the Peach Valley
– Riverview 230
kV transmission
line.
2019
Foothills
500/230 kV Tie
(New)
Duke Energy
Progress
Asheville Plant
230 kV station
1008 230
Construct a new
45 mile double
circuit 230 kV
transmission line
with 1533 ACSS
at 200°C
2022 Central Tie Shady Grove
Tie 930 230
Re-conductor
approximately 18
miles of the
Central – Shady
Grove 230 kV
transmission line
with bundled 954
ACSR at 120°C.
The Foothills 500/230 kV Tie is included in the DEC transmission plan based on a Transmission
Service Request (TSR) from DEP as part of DEP’s Western Carolinas Modernization Project
(WCMP). The details of the WCMP are discussed in DEP’s 2015 IRP
Duke Energy Carolinas
South Carolina
2015 IRP Update Report
Integrated Resource Plan
September 1, 2015
16
DEC Transmission System Adequacy:
Duke Energy Carolinas monitors the adequacy and reliability of its transmission system and
interconnections through internal analysis and participation in regional reliability groups. Internal
transmission planning looks 10 years ahead at available generating resources and projected load to
identify transmission system upgrade and expansion requirements. Corrective actions are planned
and implemented in advance to ensure continued cost-effective and high-quality service. The DEC
transmission model is incorporated into models used by regional reliability groups in developing
plans to maintain interconnected transmission system reliability. DEC works with DEP, North
Carolina Electric Membership Corporation (NCEMC) and ElectriCities to develop an annual NC
Transmission Planning Collaborative (NCTPC) plan for the DEC and DEP systems in both South
and North Carolina. In addition, transmission planning is coordinated with neighboring systems
including South Carolina Electric & Gas (SCE&G) and Santee Cooper under a number of
mechanisms including legacy interchange agreements between SCE&G, Santee Cooper, DEP and
DEC.
The Company monitors transmission system reliability by evaluating changes in load, generating
capacity, transactions and topography. A detailed annual screening ensures compliance with DEC’s
Transmission Planning Guidelines for voltage and thermal loading. The annual screening uses
methods that comply with Southeastern Reliability Corporation (SERC) policy and North American
Electric Reliability Corporation (NERC) Reliability Standards and the screening results identify the
need for future transmission system expansion and upgrades.
Transmission planning and requests for transmission service and generator interconnection are
interrelated to the resource planning process. DEC currently evaluates all transmission reservation
requests for impact on transfer capability, as well as compliance with the Company’s Transmission
Planning Guidelines and the Federal Energy Regulatory Commission (FERC) Open Access
Transmission Tariff (OATT). The Company performs studies to ensure transfer capability is
acceptable to meet reliability needs and customers’ expected use of the transmission system.
Generator interconnection requests are studied in accordance with the Large and Small Generator
Interconnection Procedures in the OATT.
SERC audits DEC every three years for compliance with NERC Reliability Standards. Specifically,
the audit requires DEC to demonstrate that its transmission planning practices meet NERC
standards and to provide data supporting the Company’s annual compliance filing certifications.
SERC conducted a NERC Reliability Standards compliance audit of DEC in May 2014. The scope
of this audit included standards impacting the Transmission Planning area. DEC received “No
Findings” from the audit team in the Transmission Planning area.
Duke Energy Carolinas
South Carolina
2015 IRP Update Report
Integrated Resource Plan
September 1, 2015
17
DEC participates in a number of regional reliability groups to coordinate analysis of regional, sub-
regional and inter-balancing authority area transfer capability and interconnection reliability. The
reliability groups’ purpose is to:
Assess the interconnected system’s capability to handle large firm and non-firm
transactions for purposes of economic access to resources and system reliability;
Ensure that planned future transmission system improvements do not adversely
affect neighboring systems; and
Ensure interconnected system compliance with NERC Reliability Standards.
Regional reliability groups evaluate transfer capability and compliance with NERC Reliability
Standards for the upcoming peak season and five- and ten-year periods. The groups also perform
computer simulation tests for high transfer levels to verify satisfactory transfer capability.
Application of the practices and procedures described above have ensured DEC’s transmission
system is expected to continue to provide reliable service to its native load and firm transmission
customers.
Duke Energy Carolinas
South Carolina
2015 IRP Update Report
Integrated Resource Plan
September 1, 2015
18
5. LOAD FORECAST:
The Duke Energy Carolinas’ Spring 2015 Forecast provides projections of the energy and peak
demand needs for its service area. The forecast covers the time period of 2016 – 2030 and
represents the needs of the following customer classes:
Residential
Commercial
Industrial
Other Retail
Wholesale
Energy projections are developed with econometric models using key economic factors such as
income, electricity prices, industrial production indices, along with weather and appliance efficiency
trends. Population is also used in the Residential customer model. While regression analysis has
consistently yielded reasonable results over the years, processes are continually reviewed and
compared between jurisdictions in an effort to improve upon the load forecasting process. Large
unforeseen events, however, such as the “great recession” or the loss of large wholesale customers,
will cause forecasts to differ from actual results.
The economic projections used in the Spring 2015 Forecast are obtained from Moody’s Analytics, a
nationally recognized economic forecasting firm, and include economic forecasts for the states of
South Carolina and North Carolina.
The Retail forecast consists of the three major classes: Residential, Commercial and Industrial.
The Residential class sales forecast is comprised of two projections. The first is the number of
residential customers, which is driven by population. The second is energy usage per customer,
which is driven by weather, regional economic and demographic trends, electric price and appliance
efficiencies.
The usage per customer forecast was derived using a Statistical Adjusted End-Use Model (SAE).
This is a regression based framework that uses projected appliance saturation and efficiency trends
developed by Itron using Energy Information Administration (EIA) data. It incorporates naturally
occurring efficiency trends and government mandates more explicitly than other models. The
outlook for usage per customer is essentially flat through much of the forecast horizon, so most of
the growth is primarily due to customer increases. The projected growth rate of Residential in the
Duke Energy Carolinas
South Carolina
2015 IRP Update Report
Integrated Resource Plan
September 1, 2015
19
Spring 2015 Forecast after all adjustments for UEE programs, Solar and Electric Vehicles from
2016-2030 is 1.3%.
The Commercial forecast also uses a SAE model in an effort to reflect naturally occurring, as well
as government mandated efficiency changes. The three largest sectors in the Commercial class are
Offices, Education and Retail. Commercial is expected to be the fastest growing Class, with a
projected growth rate of 1.5%, after all adjustments.
The Industrial class is forecasted by a standard econometric model, with drivers such as total
manufacturing output, textile output, and the price of electricity. Overall, Industrial sales are
expected to grow 0.8% over the forecast horizon, after all adjustments.
County population projections are obtained from the South Carolina Budget and Control Board as
well as the North Carolina Office of State Budget and Management. These are then used to derive
the total population forecast for the counties that comprise the DEC service area.
Weather impacts are incorporated into the models by using Heating Degree Days and Cooling
Degree Days with a base temperature of 65 degrees. The forecast of degree days is based on a 10-
year average.
The appliance saturation and efficiency trends are developed by Itron using data from the EIA.
Itron is a recognized firm providing forecasting services to the electric utility industry. These
appliance trends are used in the residential and commercial sales models.
Peak demands were projected using the SAE approach in the Spring 2015 Forecast. The peak
forecast was developed using a monthly SAE model, similar to the sales SAE models, which
includes monthly appliance saturations and efficiencies, interacted with weather and the fraction of
each appliance type that is in use at the time of monthly peak.
Assumptions:
Below are the projected average annual growth rates of several key drivers from DEC’s Spring
2015 Forecast:
2016-2030
Real Income 2.7%
Mfg. IPI 2.1%
Population 1.0%
Duke Energy Carolinas
South Carolina
2015 IRP Update Report
Integrated Resource Plan
September 1, 2015
20
In addition to economic, demographic, and efficiency trends, the forecast also incorporates the
expected impacts of utility-sponsored energy efficient programs, as well as projected effects of
electric vehicles and behind the meter solar technology.
Wholesale:
The wholesale contracts that are included in the load forecast are listed in Table 9-A in Chapter 9.
Historical Values:
It should be noted that the long-term structural decline of the Textile industry and the recession of
2008-2009 have had an adverse impact on DEC sales. The worst of the Textile decline appears to
be over, and Moody’s Analytics expects the Carolina’s economy to show solid growth going
forward.
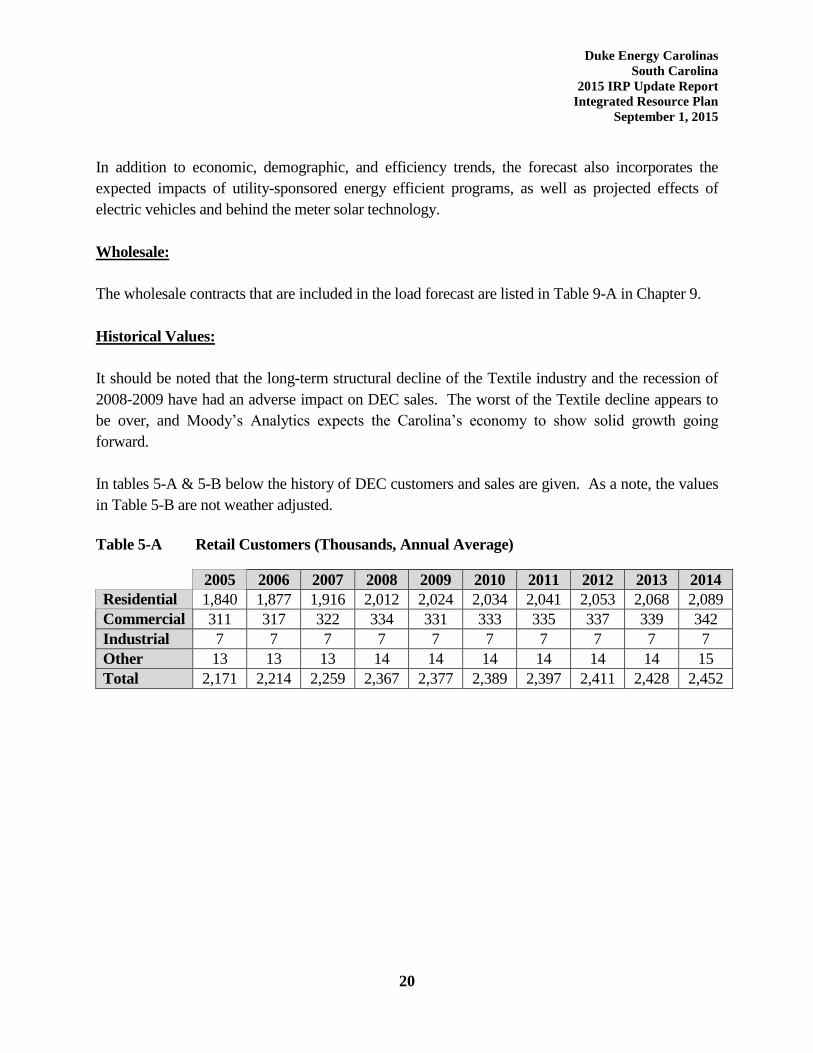
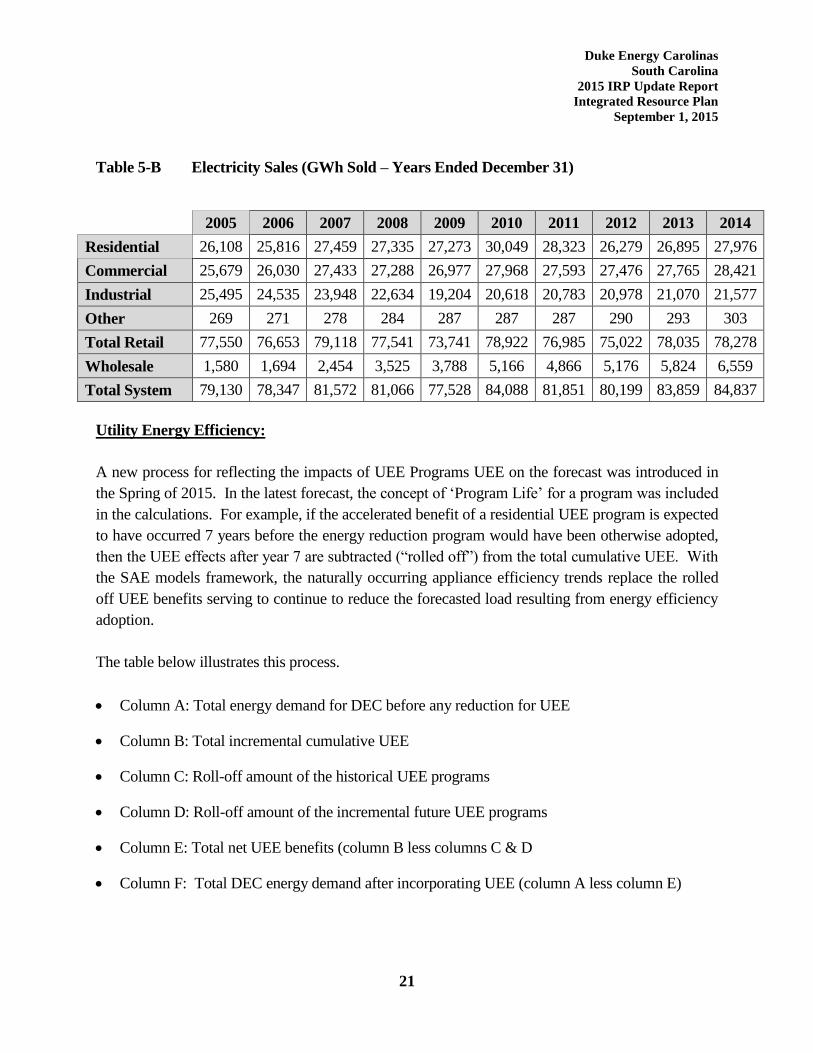
In tables 5-A & 5-B below the history of DEC customers and sales are given. As a note, the values
in Table 5-B are not weather adjusted.
Table 5-A Retail Customers (Thousands, Annual Average)
2005 2006 2007 2008 2009 2010 2011 2012 2013 2014
Residential 1,840 1,877 1,916 2,012 2,024 2,034 2,041 2,053 2,068 2,089
Commercial 311 317 322 334 331 333 335 337 339 342
Industrial 7 7 7 7 7 7 7 7 7 7
Other 13 13 13 14 14 14 14 14 14 15
Total 2,171 2,214 2,259 2,367 2,377 2,389 2,397 2,411 2,428 2,452
Duke Energy Carolinas
South Carolina
2015 IRP Update Report
Integrated Resource Plan
September 1, 2015
21
Table 5-B Electricity Sales (GWh Sold – Years Ended December 31)
2005 2006 2007 2008 2009 2010 2011 2012 2013 2014
Residential 26,108 25,816 27,459 27,335 27,273 30,049 28,323 26,279 26,895 27,976
Commercial 25,679 26,030 27,433 27,288 26,977 27,968 27,593 27,476 27,765 28,421
Industrial 25,495 24,535 23,948 22,634 19,204 20,618 20,783 20,978 21,070 21,577
Other 269 271 278 284 287 287 287 290 293 303
Total Retail 77,550 76,653 79,118 77,541 73,741 78,922 76,985 75,022 78,035 78,278
Wholesale 1,580 1,694 2,454 3,525 3,788 5,166 4,866 5,176 5,824 6,559
Total System 79,130 78,347 81,572 81,066 77,528 84,088 81,851 80,199 83,859 84,837
Utility Energy Efficiency:
A new process for reflecting the impacts of UEE Programs UEE on the forecast was introduced in
the Spring of 2015. In the latest forecast, the concept of ‘Program Life’ for a program was included
in the calculations. For example, if the accelerated benefit of a residential UEE program is expected
to have occurred 7 years before the energy reduction program would have been otherwise adopted,
then the UEE effects after year 7 are subtracted (“rolled off”) from the total cumulative UEE. With
the SAE models framework, the naturally occurring appliance efficiency trends replace the rolled
off UEE benefits serving to continue to reduce the forecasted load resulting from energy efficiency
adoption.
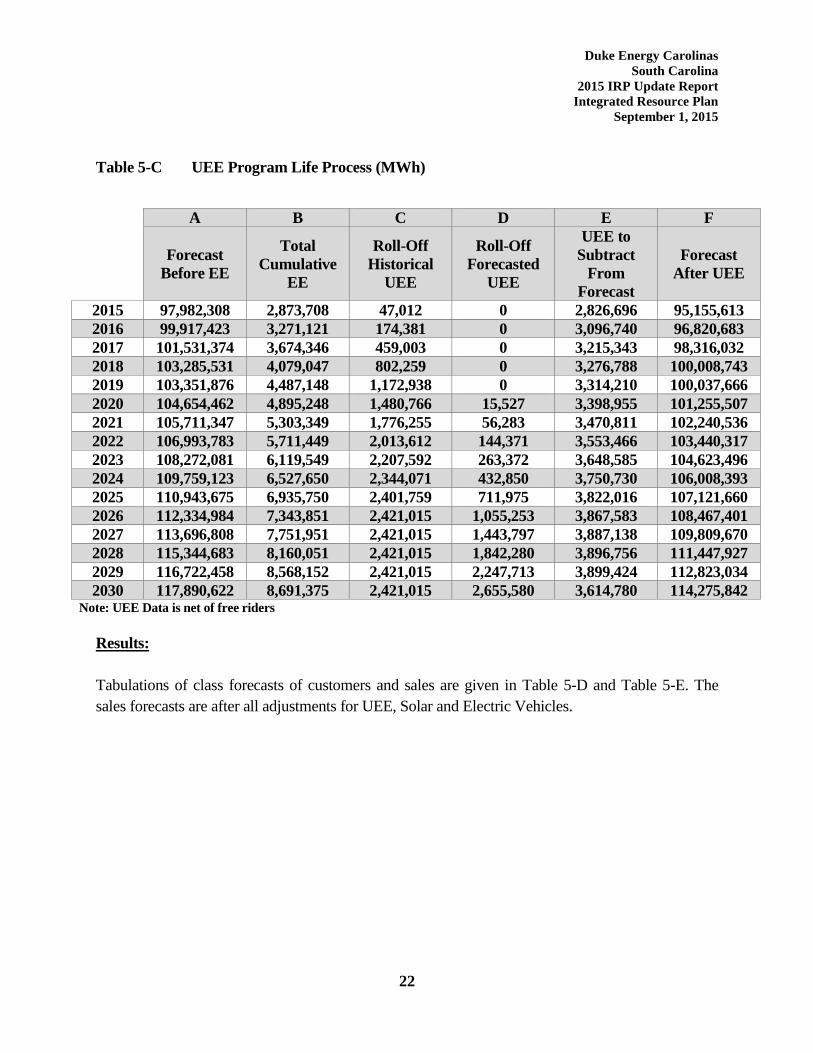
The table below illustrates this process.
Column A: Total energy demand for DEC before any reduction for UEE
Column B: Total incremental cumulative UEE
Column C: Roll-off amount of the historical UEE programs
Column D: Roll-off amount of the incremental future UEE programs
Column E: Total net UEE benefits (column B less columns C & D
Column F: Total DEC energy demand after incorporating UEE (column A less column E)
Duke Energy Carolinas
South Carolina
2015 IRP Update Report
Integrated Resource Plan
September 1, 2015
22
Table 5-C UEE Program Life Process (MWh)
A B C D E F
Forecast
Before EE
Total
Cumulative
EE
Roll-Off
Historical
UEE
Roll-Off
Forecasted
UEE
UEE to
Subtract
From
Forecast
Forecast
After UEE
2015 97,982,308 2,873,708 47,012 0 2,826,696 95,155,613
2016 99,917,423 3,271,121 174,381 0 3,096,740 96,820,683
2017 101,531,374 3,674,346 459,003 0 3,215,343 98,316,032
2018 103,285,531 4,079,047 802,259 0 3,276,788 100,008,743
2019 103,351,876 4,487,148 1,172,938 0 3,314,210 100,037,666
2020 104,654,462 4,895,248 1,480,766 15,527 3,398,955 101,255,507
2021 105,711,347 5,303,349 1,776,255 56,283 3,470,811 102,240,536
2022 106,993,783 5,711,449 2,013,612 144,371 3,553,466 103,440,317
2023 108,272,081 6,119,549 2,207,592 263,372 3,648,585 104,623,496
2024 109,759,123 6,527,650 2,344,071 432,850 3,750,730 106,008,393
2025 110,943,675 6,935,750 2,401,759 711,975 3,822,016 107,121,660
2026 112,334,984 7,343,851 2,421,015 1,055,253 3,867,583 108,467,401
2027 113,696,808 7,751,951 2,421,015 1,443,797 3,887,138 109,809,670
2028 115,344,683 8,160,051 2,421,015 1,842,280 3,896,756 111,447,927
2029 116,722,458 8,568,152 2,421,015 2,247,713 3,899,424 112,823,034
2030 117,890,622 8,691,375 2,421,015 2,655,580 3,614,780 114,275,842 Note: UEE Data is net of free riders
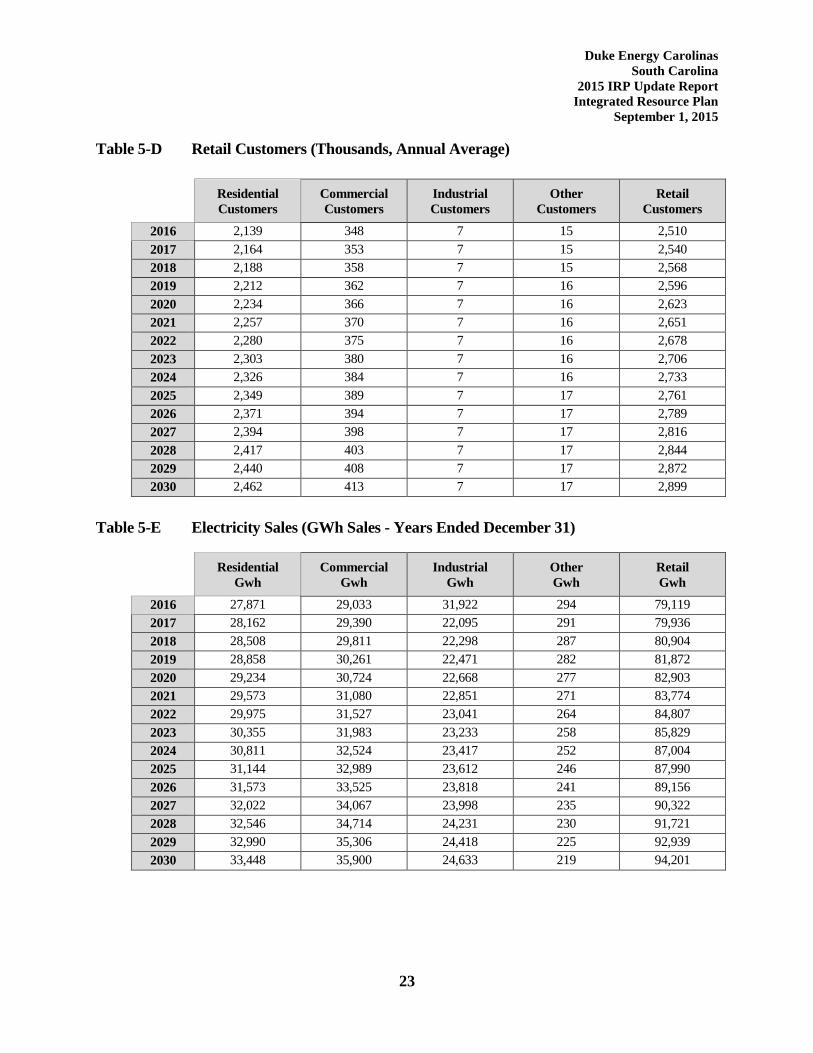
Results:
Tabulations of class forecasts of customers and sales are given in Table 5-D and Table 5-E. The
sales forecasts are after all adjustments for UEE, Solar and Electric Vehicles.
Duke Energy Carolinas
South Carolina
2015 IRP Update Report
Integrated Resource Plan
September 1, 2015
23
Table 5-D Retail Customers (Thousands, Annual Average)
Residential
Customers
Commercial
Customers
Industrial
Customers
Other
Customers
Retail
Customers
2016 2,139 348 7 15 2,510
2017 2,164 353 7 15 2,540
2018 2,188 358 7 15 2,568
2019 2,212 362 7 16 2,596
2020 2,234 366 7 16 2,623
2021 2,257 370 7 16 2,651
2022 2,280 375 7 16 2,678
2023 2,303 380 7 16 2,706
2024 2,326 384 7 16 2,733
2025 2,349 389 7 17 2,761
2026 2,371 394 7 17 2,789
2027 2,394 398 7 17 2,816
2028 2,417 403 7 17 2,844
2029 2,440 408 7 17 2,872
2030 2,462 413 7 17 2,899
Table 5-E Electricity Sales (GWh Sales - Years Ended December 31)
Residential
Gwh
Commercial
Gwh
Industrial
Gwh
Other
Gwh
Retail
Gwh
2016 27,871 29,033 31,922 294 79,119
2017 28,162 29,390 22,095 291 79,936
2018 28,508 29,811 22,298 287 80,904
2019 28,858 30,261 22,471 282 81,872
2020 29,234 30,724 22,668 277 82,903
2021 29,573 31,080 22,851 271 83,774
2022 29,975 31,527 23,041 264 84,807
2023 30,355 31,983 23,233 258 85,829
2024 30,811 32,524 23,417 252 87,004
2025 31,144 32,989 23,612 246 87,990
2026 31,573 33,525 23,818 241 89,156
2027 32,022 34,067 23,998 235 90,322
2028 32,546 34,714 24,231 230 91,721
2029 32,990 35,306 24,418 225 92,939
2030 33,448 35,900 24,633 219 94,201
Duke Energy Carolinas
South Carolina
2015 IRP Update Report
Integrated Resource Plan
September 1, 2015
24
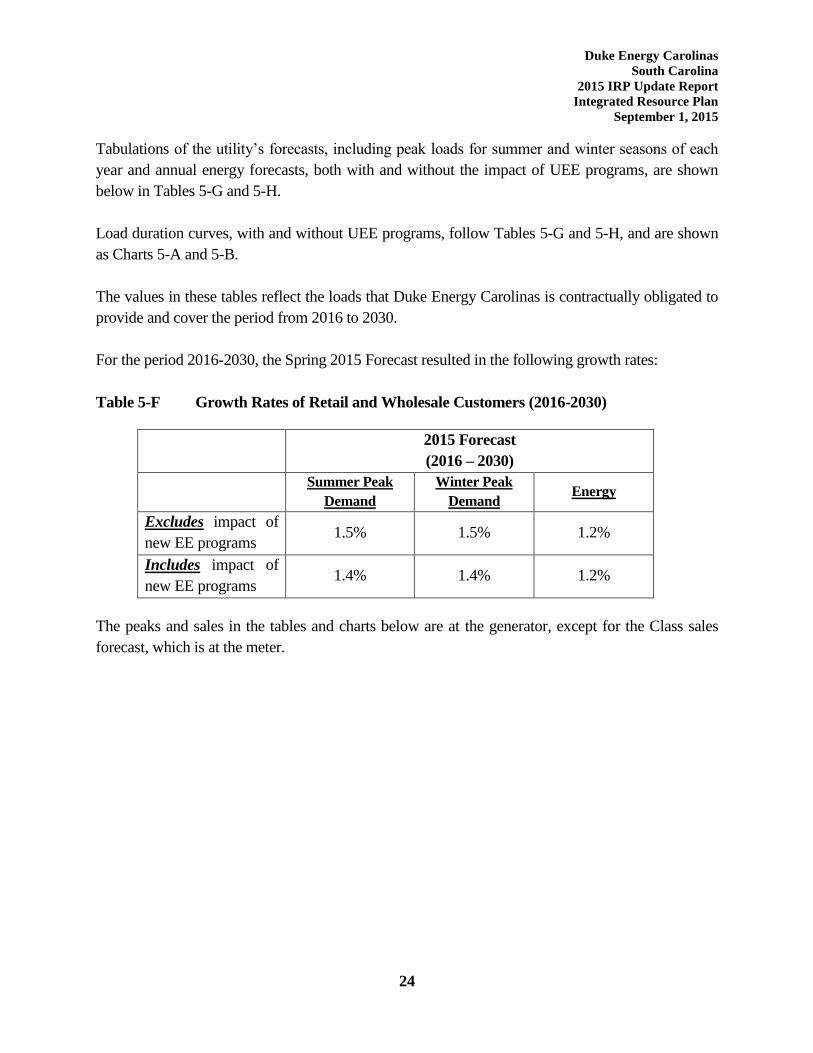
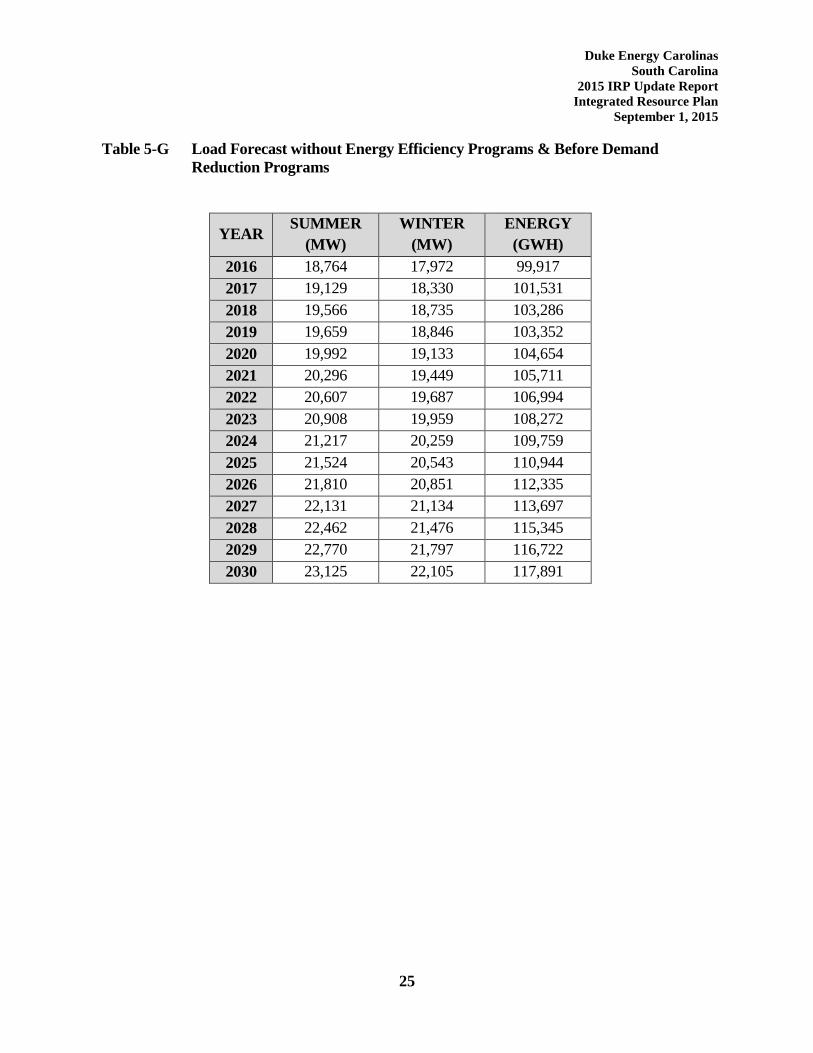
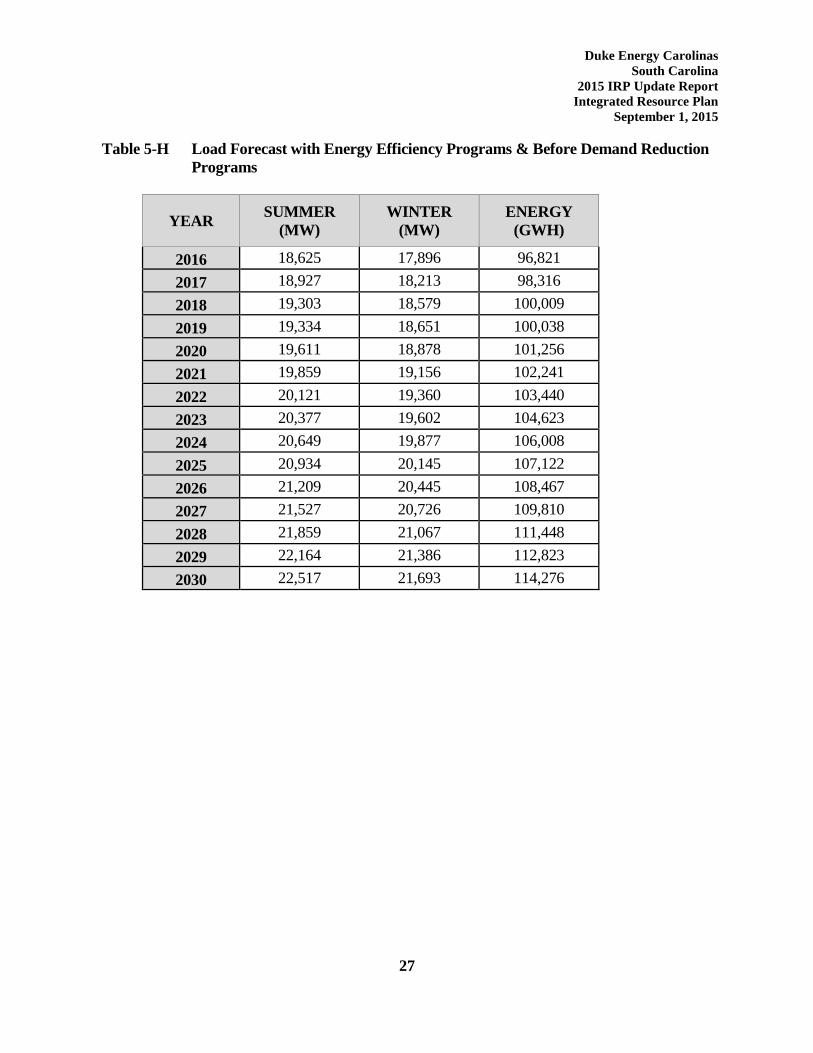
Tabulations of the utility’s forecasts, including peak loads for summer and winter seasons of each
year and annual energy forecasts, both with and without the impact of UEE programs, are shown
below in Tables 5-G and 5-H.
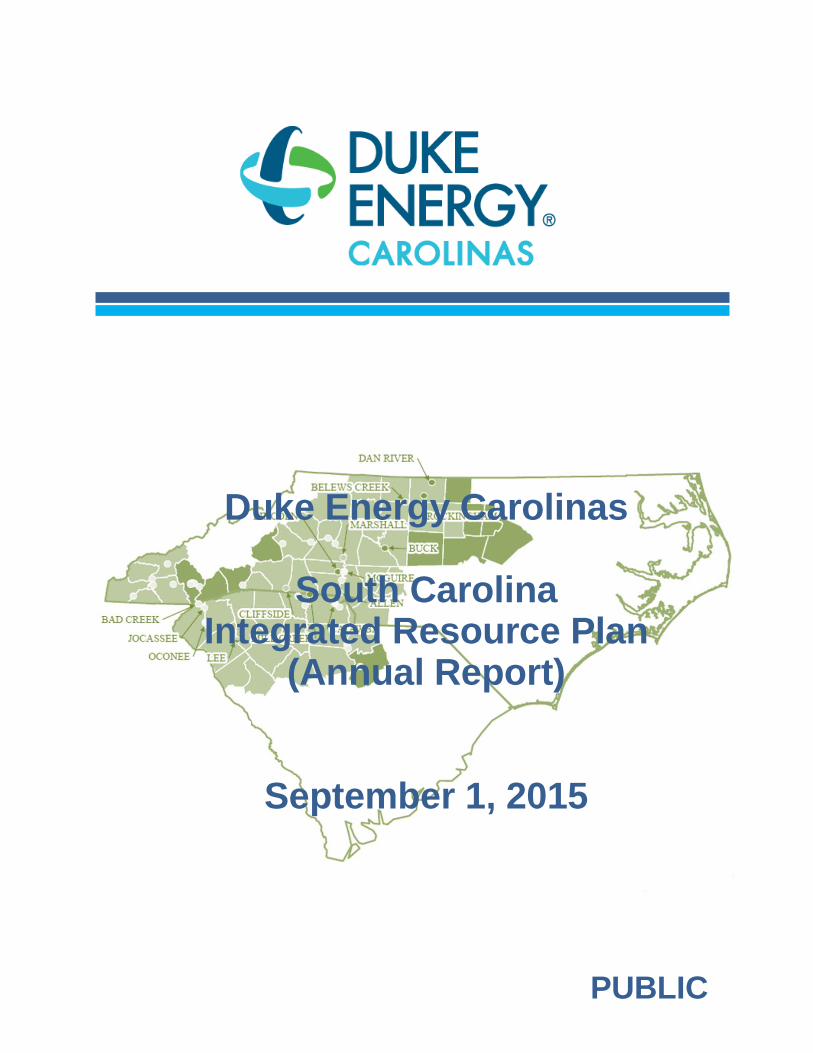
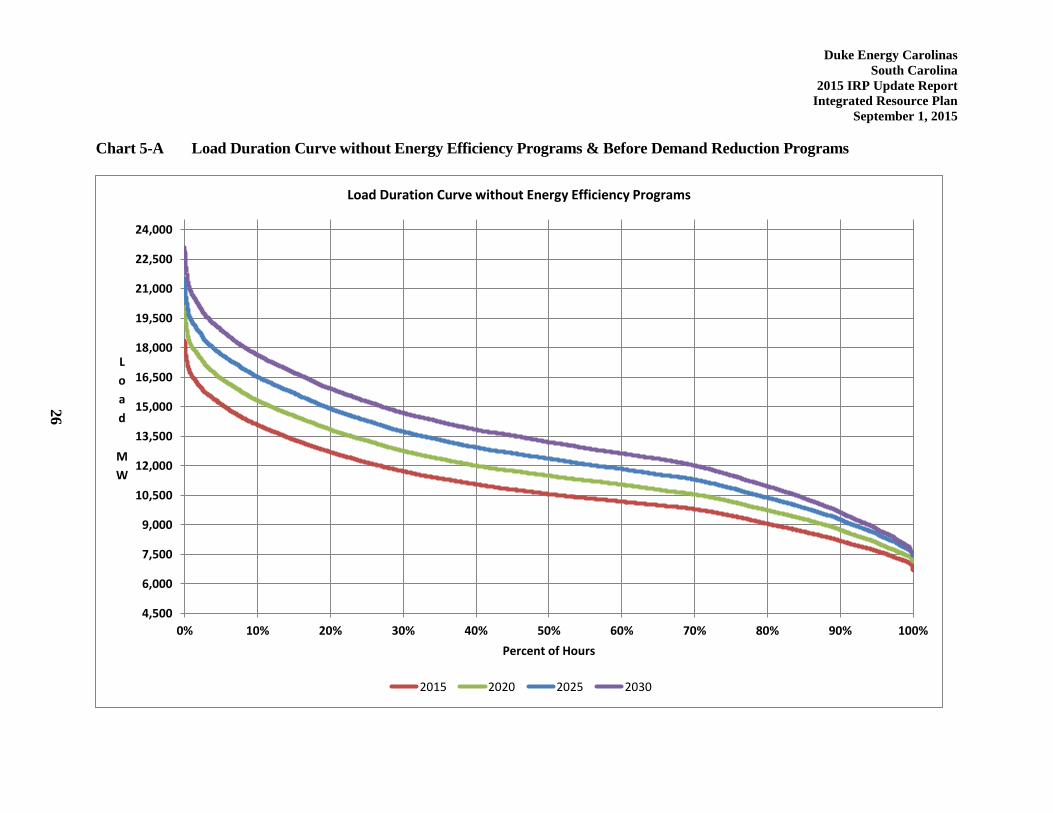
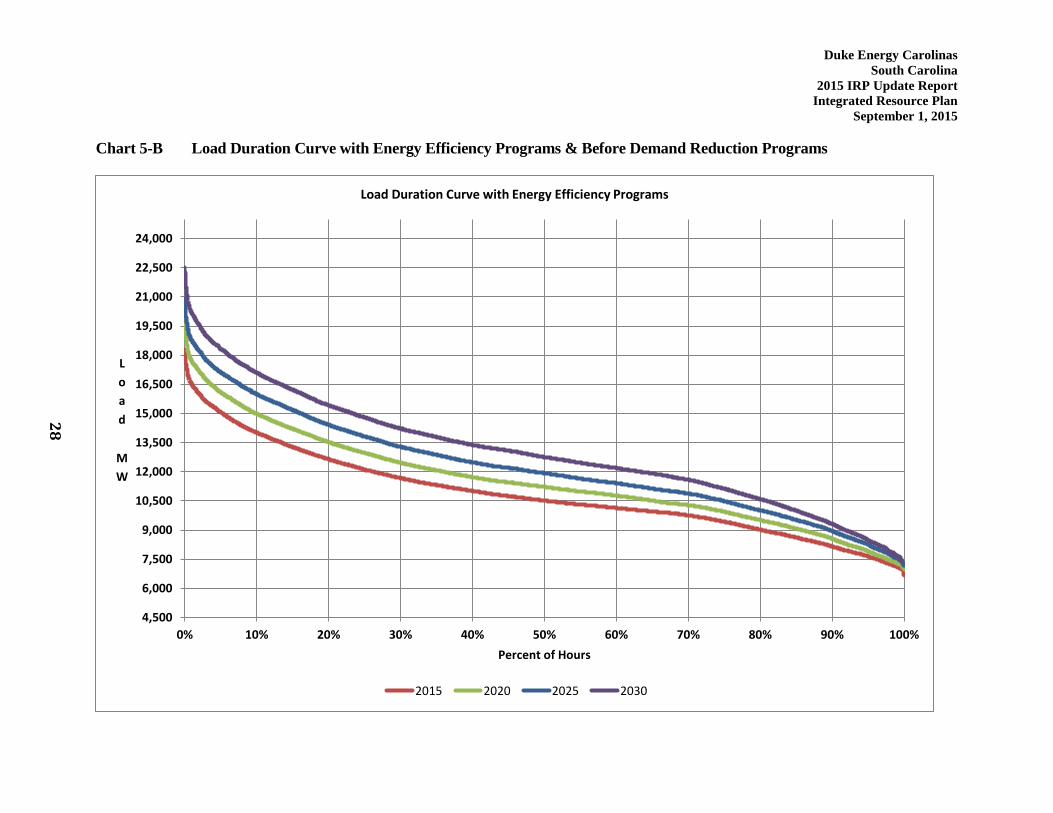
Load duration curves, with and without UEE programs, follow Tables 5-G and 5-H, and are shown
as Charts 5-A and 5-B.
The values in these tables reflect the loads that Duke Energy Carolinas is contractually obligated to
provide and cover the period from 2016 to 2030.
For the period 2016-2030, the Spring 2015 Forecast resulted in the following growth rates:
Table 5-F Growth Rates of Retail and Wholesale Customers (2016-2030)
2015 Forecast
(2016 – 2030)
Summer Peak
Demand
Winter Peak
Demand Energy
Excludes impact of
new EE programs 1.5% 1.5% 1.2%
Includes impact of
new EE programs 1.4% 1.4% 1.2%
The peaks and sales in the tables and charts below are at the generator, except for the Class sales
forecast, which is at the meter.
Duke Energy Carolinas
South Carolina
2015 IRP Update Report
Integrated Resource Plan
September 1, 2015
25
Table 5-G Load Forecast without Energy Efficiency Programs & Before Demand
Reduction Programs
YEAR SUMMER
(MW)
WINTER
(MW)
ENERGY
(GWH)
2016 18,764 17,972 99,917
2017 19,129 18,330 101,531
2018 19,566 18,735 103,286
2019 19,659 18,846 103,352
2020 19,992 19,133 104,654
2021 20,296 19,449 105,711
2022 20,607 19,687 106,994
2023 20,908 19,959 108,272
2024 21,217 20,259 109,759
2025 21,524 20,543 110,944
2026 21,810 20,851 112,335
2027 22,131 21,134 113,697
2028 22,462 21,476 115,345
2029 22,770 21,797 116,722
2030 23,125 22,105 117,891
Duke Energy Carolinas
South Carolina
2015 IRP Update Report
Integrated Resource Plan
September 1, 2015
Chart 5-A Load Duration Curve without Energy Efficiency Programs & Before Demand Reduction Programs
4,500
6,000
7,500
9,000
10,500
12,000
13,500
15,000
16,500
18,000
19,500
21,000
22,500
24,000
0% 10% 20% 30% 40% 50% 60% 70% 80% 90% 100%
L
o
a
d
M
W
Percent of Hours
Load Duration Curve without Energy Efficiency Programs
2015 2020 2025 2030
26
Duke Energy Carolinas
South Carolina
2015 IRP Update Report
Integrated Resource Plan
September 1, 2015
27
Table 5-H Load Forecast with Energy Efficiency Programs & Before Demand Reduction
Programs
YEAR SUMMER
(MW)
WINTER
(MW)
ENERGY
(GWH)
2016 18,625 17,896 96,821
2017 18,927 18,213 98,316
2018 19,303 18,579 100,009
2019 19,334 18,651 100,038
2020 19,611 18,878 101,256
2021 19,859 19,156 102,241
2022 20,121 19,360 103,440
2023 20,377 19,602 104,623
2024 20,649 19,877 106,008
2025 20,934 20,145 107,122
2026 21,209 20,445 108,467
2027 21,527 20,726 109,810
2028 21,859 21,067 111,448
2029 22,164 21,386 112,823
2030 22,517 21,693 114,276
Duke Energy Carolinas
South Carolina
2015 IRP Update Report
Integrated Resource Plan
September 1, 2015
Chart 5-B Load Duration Curve with Energy Efficiency Programs & Before Demand Reduction Programs
4,500
6,000
7,500
9,000
10,500
12,000
13,500
15,000
16,500
18,000
19,500
21,000
22,500
24,000
0% 10% 20% 30% 40% 50% 60% 70% 80% 90% 100%
L
o
a
d
M
W
Percent of Hours
Load Duration Curve with Energy Efficiency Programs
2015 2020 2025 2030
28
Duke Energy Carolinas
South Carolina
2015 IRP Update Report
Integrated Resource Plan
September 1, 2015
29
6. ENERGY EFFICIENCY AND DEMAND SIDE MANAGEMENT:
Current Energy Efficiency and Demand-Side Management Programs
In 2013, DEC filed its application for approval of Energy Efficiency and Demand Side Management
programs under South Carolina Docket 2013-298-E and North Carolina Docket No. E-7, Sub 1032 .
This new portfolio was a replacement for the save-a-watt programs approved in 2009/2010. The
Company received the final order for approval for these programs from the PSCSC in December
2013 and from the NCUC in October 2013.
DEC uses EE and DSM programs in its IRP to efficiently and cost-effectively alter customer
demands and reduce the long-run supply costs for energy and peak demand. These programs can
vary greatly in their dispatch characteristics, size and duration of load response, certainty of load
response, and level and frequency of customer participation. In general, programs are offered in
two primary categories: EE programs that reduce energy consumption and DSM programs that
reduce peak demand (demand-side management or demand response programs and certain rate
structure programs). Following are the EE and DSM programs currently available through DEC:
Residential Customer Programs
Appliance Recycling Program
Energy Assessments Program
Energy Efficiency Education Program
Energy Efficient Appliances and Devices
Heating, Ventilation and Air Conditioning (HVAC) Energy Efficiency Program
Multi-Family Energy Efficiency Program
My Home Energy Report
Income-Qualified Energy Efficiency and Weatherization Program
Power Manager
Non-Residential Customer Programs
Non-Residential Smart $aver® Energy Efficient Food Service Products Program
Non-Residential Smart $aver® Energy Efficient HVAC Products Program
Non-Residential Smart $aver® Energy Efficient IT Products Program
Non-Residential Smart $aver ®Energy Efficient Lighting Products Program
Non-Residential Smart $aver® Energy Efficient Process Equipment Products Program
Non-Residential Smart $aver® Energy Efficient Pumps and Drives Products Program
Non-Residential Smart $aver® Custom Program
Non-Residential Smart $aver® Custom Energy Assessments Program
Duke Energy Carolinas
South Carolina
2015 IRP Update Report
Integrated Resource Plan
September 1, 2015
30
PowerShare®
PowerShare® CallOption
In addition, based on feedback from stakeholders, the Company has developed a pilot program
for non-residential customers and has included it in this filing for Commission approval, so that
it may determine the potential impacts and cost-effectiveness of this new program.
Pilot Program:
Energy Management and Information Services Program
Energy Efficiency Programs
These programs are typically non-dispatchable education or incentive programs. Energy and
capacity savings are achieved by changing customer behavior or through the installation of more
energy-efficient equipment or structures. All cumulative effects (gross of Free Riders, at the Plant2
)
since the inception of these existing programs through the end of 2014 are summarized below.
Please note that the cumulative impacts listed below include the impact of any Measurement and
Verification (M&V) performed since program inception. The following provides more detail on
DEC’s existing EE programs:
Residential Programs:
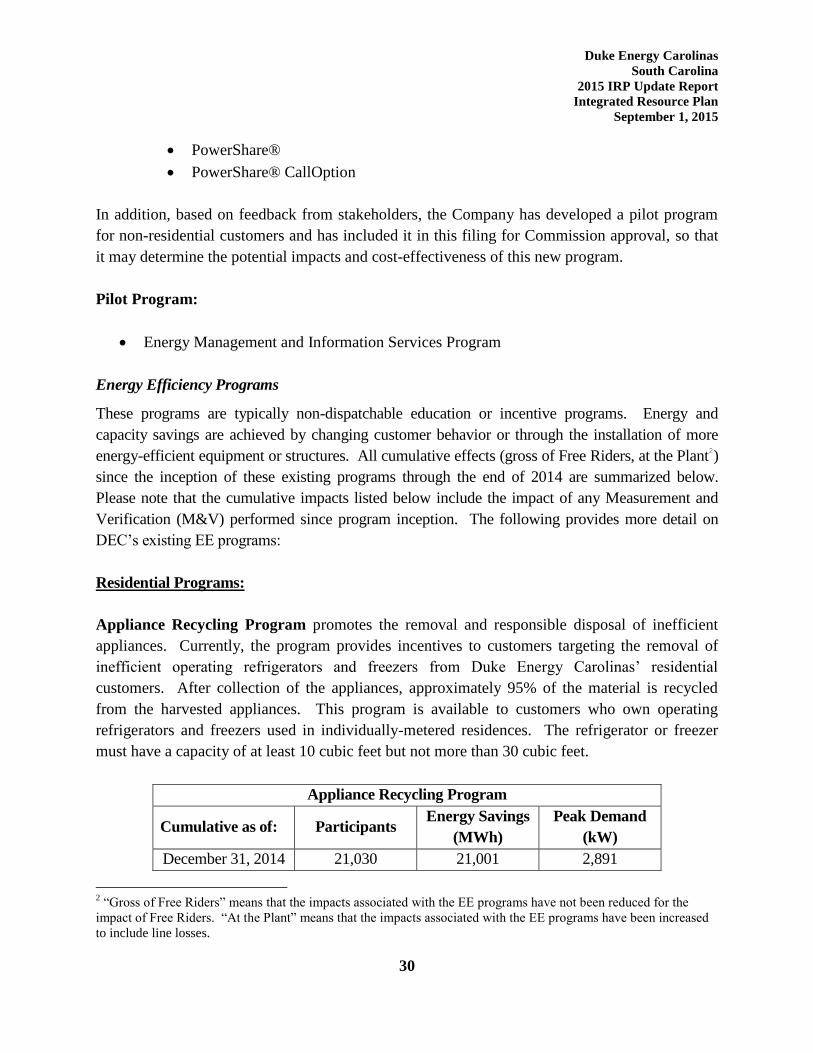
Appliance Recycling Program promotes the removal and responsible disposal of inefficient
appliances. Currently, the program provides incentives to customers targeting the removal of
inefficient operating refrigerators and freezers from Duke Energy Carolinas’ residential
customers. After collection of the appliances, approximately 95% of the material is recycled
from the harvested appliances. This program is available to customers who own operating
refrigerators and freezers used in individually-metered residences. The refrigerator or freezer
must have a capacity of at least 10 cubic feet but not more than 30 cubic feet.
Appliance Recycling Program
Cumulative as of: Participants Energy Savings
(MWh)
Peak Demand
(kW)
December 31, 2014 21,030 21,001 2,891
2 “Gross of Free Riders” means that the impacts associated with the EE programs have not been reduced for the
impact of Free Riders. “At the Plant” means that the impacts associated with the EE programs have been increased
to include line losses.
Duke Energy Carolinas
South Carolina
2015 IRP Update Report
Integrated Resource Plan
September 1, 2015
31
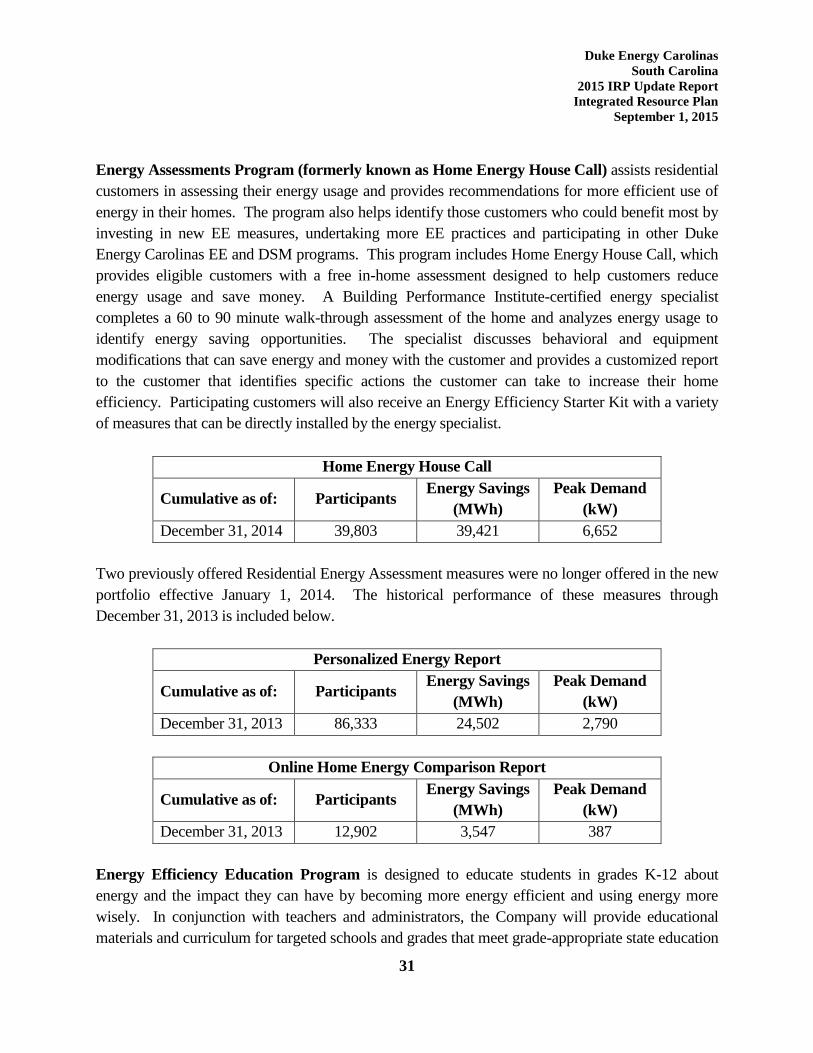
Energy Assessments Program (formerly known as Home Energy House Call) assists residential
customers in assessing their energy usage and provides recommendations for more efficient use of
energy in their homes. The program also helps identify those customers who could benefit most by
investing in new EE measures, undertaking more EE practices and participating in other Duke
Energy Carolinas EE and DSM programs. This program includes Home Energy House Call, which
provides eligible customers with a free in-home assessment designed to help customers reduce
energy usage and save money. A Building Performance Institute-certified energy specialist
completes a 60 to 90 minute walk-through assessment of the home and analyzes energy usage to
identify energy saving opportunities. The specialist discusses behavioral and equipment
modifications that can save energy and money with the customer and provides a customized report
to the customer that identifies specific actions the customer can take to increase their home
efficiency. Participating customers will also receive an Energy Efficiency Starter Kit with a variety
of measures that can be directly installed by the energy specialist.
Home Energy House Call
Cumulative as of: Participants Energy Savings
(MWh)
Peak Demand
(kW)
December 31, 2014 39,803 39,421 6,652
Two previously offered Residential Energy Assessment measures were no longer offered in the new
portfolio effective January 1, 2014. The historical performance of these measures through
December 31, 2013 is included below.
Personalized Energy Report
Cumulative as of: Participants Energy Savings
(MWh)
Peak Demand
(kW)
December 31, 2013 86,333 24,502 2,790
Online Home Energy Comparison Report
Cumulative as of: Participants Energy Savings
(MWh)
Peak Demand
(kW)
December 31, 2013 12,902 3,547 387
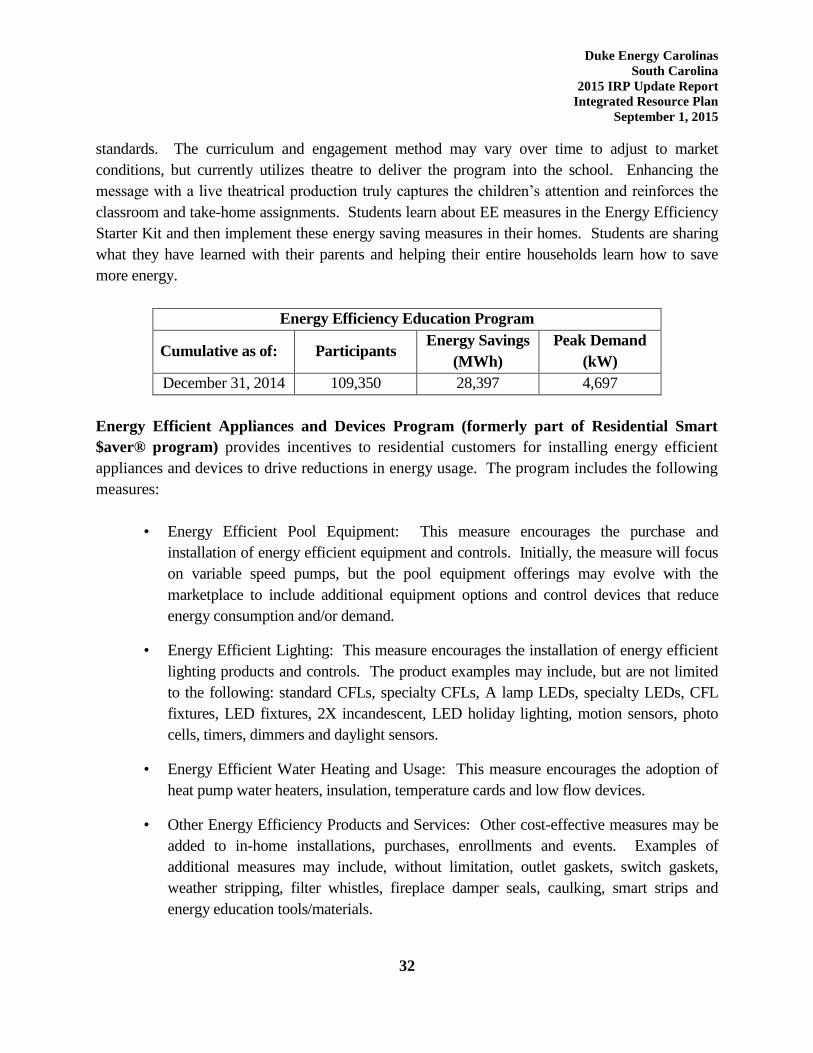
Energy Efficiency Education Program is designed to educate students in grades K-12 about
energy and the impact they can have by becoming more energy efficient and using energy more
wisely. In conjunction with teachers and administrators, the Company will provide educational
materials and curriculum for targeted schools and grades that meet grade-appropriate state education
Duke Energy Carolinas
South Carolina
2015 IRP Update Report
Integrated Resource Plan
September 1, 2015
32
standards. The curriculum and engagement method may vary over time to adjust to market
conditions, but currently utilizes theatre to deliver the program into the school. Enhancing the
message with a live theatrical production truly captures the children’s attention and reinforces the
classroom and take-home assignments. Students learn about EE measures in the Energy Efficiency
Starter Kit and then implement these energy saving measures in their homes. Students are sharing
what they have learned with their parents and helping their entire households learn how to save
more energy.
Energy Efficiency Education Program
Cumulative as of: Participants Energy Savings
(MWh)
Peak Demand
(kW)
December 31, 2014 109,350 28,397 4,697
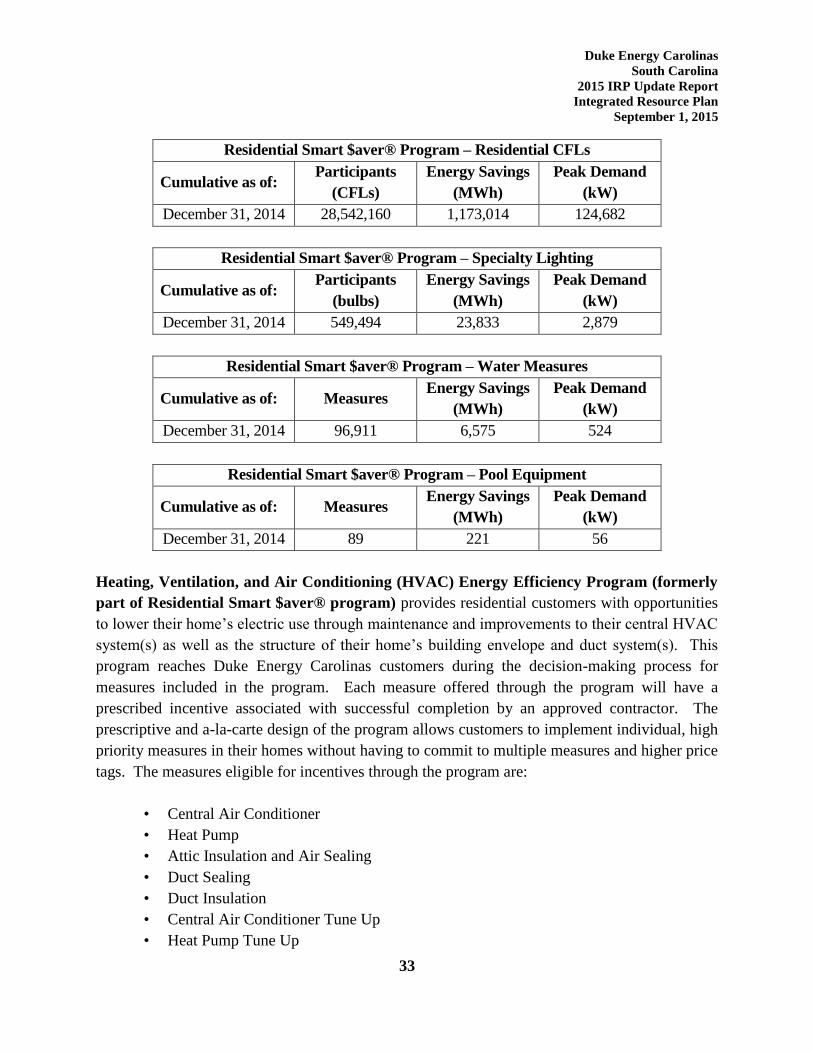
Energy Efficient Appliances and Devices Program (formerly part of Residential Smart
$aver® program) provides incentives to residential customers for installing energy efficient
appliances and devices to drive reductions in energy usage. The program includes the following
measures:
• Energy Efficient Pool Equipment: This measure encourages the purchase and
installation of energy efficient equipment and controls. Initially, the measure will focus
on variable speed pumps, but the pool equipment offerings may evolve with the
marketplace to include additional equipment options and control devices that reduce
energy consumption and/or demand.
• Energy Efficient Lighting: This measure encourages the installation of energy efficient
lighting products and controls. The product examples may include, but are not limited
to the following: standard CFLs, specialty CFLs, A lamp LEDs, specialty LEDs, CFL
fixtures, LED fixtures, 2X incandescent, LED holiday lighting, motion sensors, photo
cells, timers, dimmers and daylight sensors.
• Energy Efficient Water Heating and Usage: This measure encourages the adoption of
heat pump water heaters, insulation, temperature cards and low flow devices.
• Other Energy Efficiency Products and Services: Other cost-effective measures may be
added to in-home installations, purchases, enrollments and events. Examples of
additional measures may include, without limitation, outlet gaskets, switch gaskets,
weather stripping, filter whistles, fireplace damper seals, caulking, smart strips and
energy education tools/materials.
Duke Energy Carolinas
South Carolina
2015 IRP Update Report
Integrated Resource Plan
September 1, 2015
33
Residential Smart $aver® Program – Residential CFLs
Cumulative as of: Participants
(CFLs)
Energy Savings
(MWh)
Peak Demand
(kW)
December 31, 2014 28,542,160 1,173,014 124,682
Residential Smart $aver® Program – Specialty Lighting
Cumulative as of: Participants
(bulbs)
Energy Savings
(MWh)
Peak Demand
(kW)
December 31, 2014 549,494 23,833 2,879
Residential Smart $aver® Program – Water Measures
Cumulative as of: Measures Energy Savings
(MWh)
Peak Demand
(kW)
December 31, 2014 96,911 6,575 524
Residential Smart $aver® Program – Pool Equipment
Cumulative as of: Measures Energy Savings
(MWh)
Peak Demand
(kW)
December 31, 2014 89 221 56
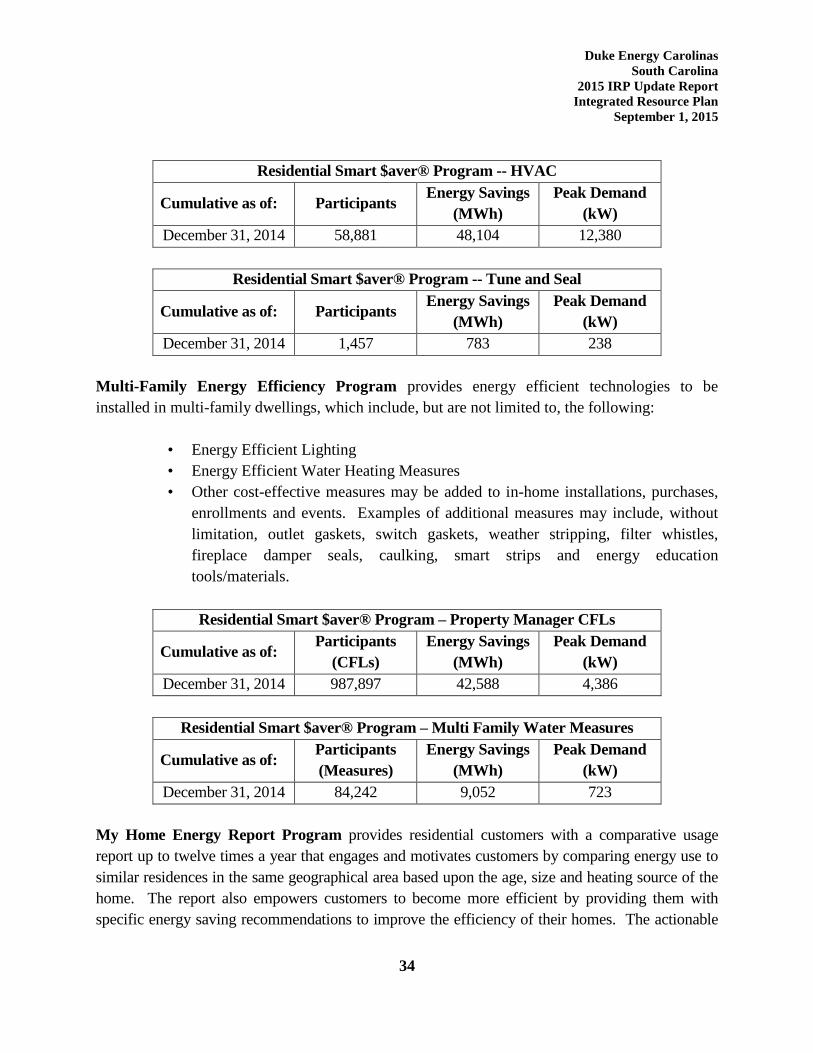
Heating, Ventilation, and Air Conditioning (HVAC) Energy Efficiency Program (formerly
part of Residential Smart $aver® program) provides residential customers with opportunities
to lower their home’s electric use through maintenance and improvements to their central HVAC
system(s) as well as the structure of their home’s building envelope and duct system(s). This
program reaches Duke Energy Carolinas customers during the decision-making process for
measures included in the program. Each measure offered through the program will have a
prescribed incentive associated with successful completion by an approved contractor. The
prescriptive and a-la-carte design of the program allows customers to implement individual, high
priority measures in their homes without having to commit to multiple measures and higher price
tags. The measures eligible for incentives through the program are:
• Central Air Conditioner
• Heat Pump
• Attic Insulation and Air Sealing
• Duct Sealing
• Duct Insulation
• Central Air Conditioner Tune Up
• Heat Pump Tune Up
Duke Energy Carolinas
South Carolina
2015 IRP Update Report
Integrated Resource Plan
September 1, 2015
34
Residential Smart $aver® Program -- HVAC
Cumulative as of: Participants Energy Savings
(MWh)
Peak Demand
(kW)
December 31, 2014 58,881 48,104 12,380
Residential Smart $aver® Program -- Tune and Seal
Cumulative as of: Participants Energy Savings
(MWh)
Peak Demand
(kW)
December 31, 2014 1,457 783 238
Multi-Family Energy Efficiency Program provides energy efficient technologies to be
installed in multi-family dwellings, which include, but are not limited to, the following:
• Energy Efficient Lighting
• Energy Efficient Water Heating Measures
• Other cost-effective measures may be added to in-home installations, purchases,
enrollments and events. Examples of additional measures may include, without
limitation, outlet gaskets, switch gaskets, weather stripping, filter whistles,
fireplace damper seals, caulking, smart strips and energy education
tools/materials.
Residential Smart $aver® Program – Property Manager CFLs
Cumulative as of: Participants
(CFLs)
Energy Savings
(MWh)
Peak Demand
(kW)
December 31, 2014 987,897 42,588 4,386
Residential Smart $aver® Program – Multi Family Water Measures
Cumulative as of: Participants
(Measures)
Energy Savings
(MWh)
Peak Demand
(kW)
December 31, 2014 84,242 9,052 723
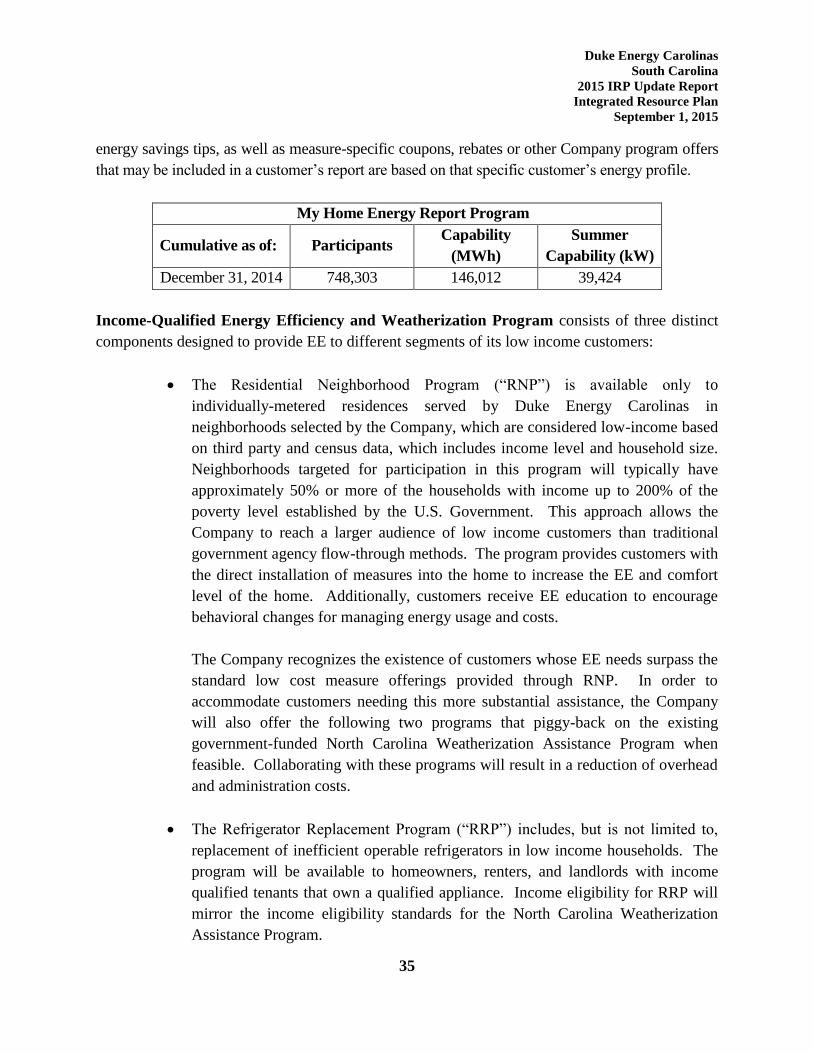
My Home Energy Report Program provides residential customers with a comparative usage
report up to twelve times a year that engages and motivates customers by comparing energy use to
similar residences in the same geographical area based upon the age, size and heating source of the
home. The report also empowers customers to become more efficient by providing them with
specific energy saving recommendations to improve the efficiency of their homes. The actionable
Duke Energy Carolinas
South Carolina
2015 IRP Update Report
Integrated Resource Plan
September 1, 2015
35
energy savings tips, as well as measure-specific coupons, rebates or other Company program offers
that may be included in a customer’s report are based on that specific customer’s energy profile.
My Home Energy Report Program
Cumulative as of: Participants Capability
(MWh)
Summer
Capability (kW)
December 31, 2014 748,303 146,012 39,424
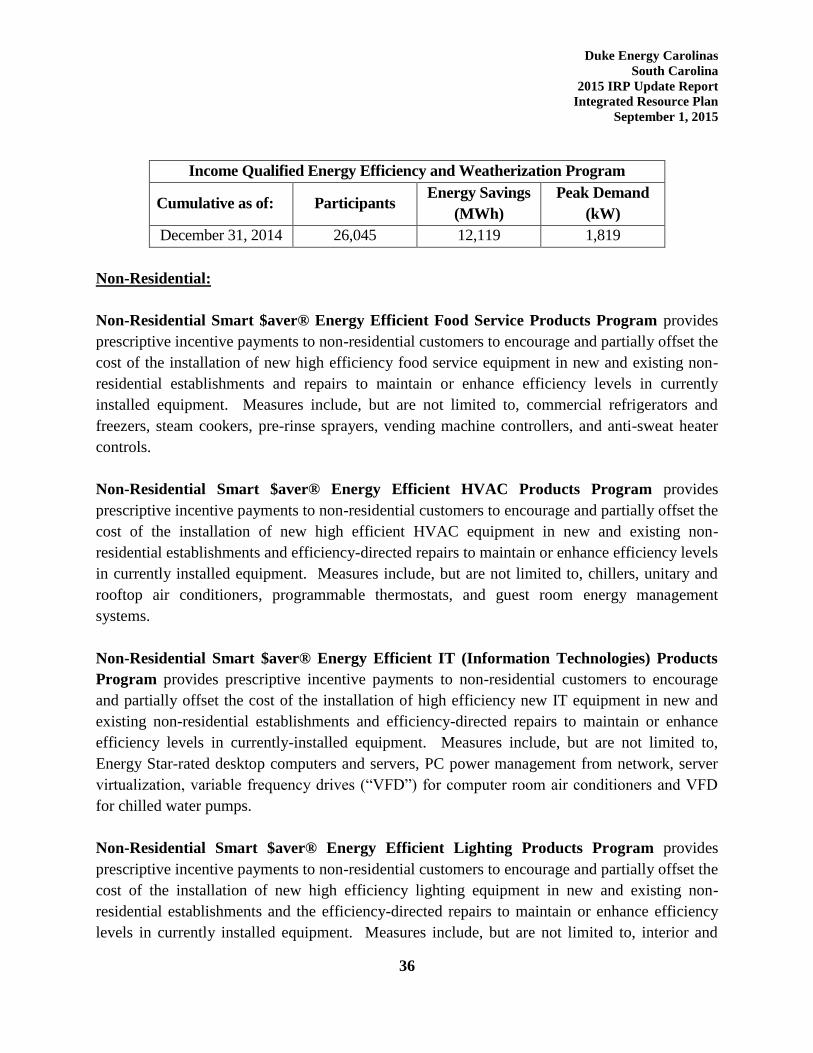
Income-Qualified Energy Efficiency and Weatherization Program consists of three distinct
components designed to provide EE to different segments of its low income customers:
The Residential Neighborhood Program (“RNP”) is available only to
individually-metered residences served by Duke Energy Carolinas in
neighborhoods selected by the Company, which are considered low-income based
on third party and census data, which includes income level and household size.
Neighborhoods targeted for participation in this program will typically have
approximately 50% or more of the households with income up to 200% of the
poverty level established by the U.S. Government. This approach allows the
Company to reach a larger audience of low income customers than traditional
government agency flow-through methods. The program provides customers with
the direct installation of measures into the home to increase the EE and comfort
level of the home. Additionally, customers receive EE education to encourage
behavioral changes for managing energy usage and costs.
The Company recognizes the existence of customers whose EE needs surpass the
standard low cost measure offerings provided through RNP. In order to
accommodate customers needing this more substantial assistance, the Company
will also offer the following two programs that piggy-back on the existing
government-funded North Carolina Weatherization Assistance Program when
feasible. Collaborating with these programs will result in a reduction of overhead
and administration costs.
The Refrigerator Replacement Program (“RRP”) includes, but is not limited to,
replacement of inefficient operable refrigerators in low income households. The
program will be available to homeowners, renters, and landlords with income
qualified tenants that own a qualified appliance. Income eligibility for RRP will
mirror the income eligibility standards for the North Carolina Weatherization
Assistance Program.
Duke Energy Carolinas
South Carolina
2015 IRP Update Report
Integrated Resource Plan
September 1, 2015
36
Income Qualified Energy Efficiency and Weatherization Program
Cumulative as of: Participants Energy Savings
(MWh)
Peak Demand
(kW)
December 31, 2014 26,045 12,119 1,819
Non-Residential:
Non-Residential Smart $aver® Energy Efficient Food Service Products Program provides
prescriptive incentive payments to non-residential customers to encourage and partially offset the
cost of the installation of new high efficiency food service equipment in new and existing non-
residential establishments and repairs to maintain or enhance efficiency levels in currently
installed equipment. Measures include, but are not limited to, commercial refrigerators and
freezers, steam cookers, pre-rinse sprayers, vending machine controllers, and anti-sweat heater
controls.
Non-Residential Smart $aver® Energy Efficient HVAC Products Program provides
prescriptive incentive payments to non-residential customers to encourage and partially offset the
cost of the installation of new high efficient HVAC equipment in new and existing non-
residential establishments and efficiency-directed repairs to maintain or enhance efficiency levels
in currently installed equipment. Measures include, but are not limited to, chillers, unitary and
rooftop air conditioners, programmable thermostats, and guest room energy management
systems.
Non-Residential Smart $aver® Energy Efficient IT (Information Technologies) Products
Program provides prescriptive incentive payments to non-residential customers to encourage
and partially offset the cost of the installation of high efficiency new IT equipment in new and
existing non-residential establishments and efficiency-directed repairs to maintain or enhance
efficiency levels in currently-installed equipment. Measures include, but are not limited to,
Energy Star-rated desktop computers and servers, PC power management from network, server
virtualization, variable frequency drives (“VFD”) for computer room air conditioners and VFD
for chilled water pumps.
Non-Residential Smart $aver® Energy Efficient Lighting Products Program provides
prescriptive incentive payments to non-residential customers to encourage and partially offset the
cost of the installation of new high efficiency lighting equipment in new and existing non-
residential establishments and the efficiency-directed repairs to maintain or enhance efficiency
levels in currently installed equipment. Measures include, but are not limited to, interior and
Duke Energy Carolinas
South Carolina
2015 IRP Update Report
Integrated Resource Plan
September 1, 2015
37
exterior LED lamps and fixtures, reduced wattage and high performance T8 systems, T8 and T5
high bay fixtures, and occupancy sensors.
Non-Residential Smart $aver® Energy Efficient Process Equipment Products Program
provides prescriptive incentive payments to non-residential customers to encourage and partially
offset the cost of the installation of new high efficiency equipment in new and existing non-
residential establishments and efficiency-directed repairs to maintain or enhance high efficiency
levels in currently installed equipment. Measures include, but are not limited to, VFD air
compressors, barrel wraps, and pellet dryer insulation.
Non-Residential Smart $aver® Energy Efficient Pumps and Drives Products Program
provides prescriptive incentive payments to non-residential customers to encourage and partially
offset the cost of the installation of new high efficiency equipment in new and existing non-
residential establishments and efficiency-directed repairs to maintain or enhance efficiency levels
in currently installed equipment. Measures include, but are not limited to, pumps and VFD on
HVAC pumps and fans.
Non-Residential Smart $aver® Custom Program provides custom incentive payments to non-
residential customers to encourage and partially offset the cost of the installation of new high
efficiency equipment in new and existing non-residential establishments. This program allows
for eligible customers to apply for and the Company to provide custom incentives in the amount
up to 75% of the installed cost difference between standard equipment and new higher efficiency
equipment or efficiency-directed repair activities in order to cover measures and efficiency-
driven activities that are not offered in the various Non-Residential Smart $aver prescriptive
programs.
Non-Residential Smart $aver® Custom Energy Assessments Program provides customers
who may be unaware of EE opportunities at their facilities with a custom incentive payment in
the amount up to 50% of the costs of a qualifying energy assessment. The purpose of this
component of the program is to overcome financial barriers by off-setting a customer’s upfront
costs to identify and evaluate EE projects that will lead to the installation of energy efficient
measures. The scope of an energy assessment may include but is not limited to a facility energy
audit, a new construction/renovation energy performance simulation, a system energy study and
retro-commissioning service. After the energy assessment is complete, program participants
may receive an additional custom incentive payment in the amount of up to 75% of the installed
cost difference between standard equipment and higher efficiency equipment or efficiency-
directed repair activities.
Duke Energy Carolinas
South Carolina
2015 IRP Update Report
Integrated Resource Plan
September 1, 2015
38
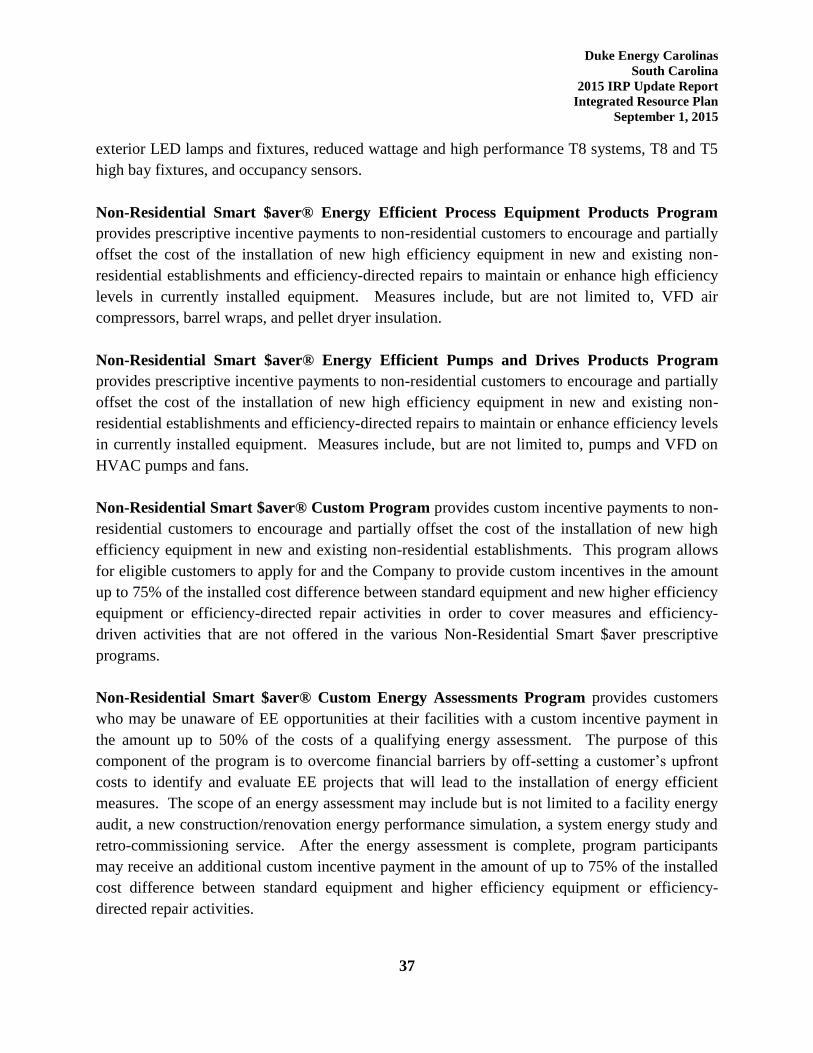
Non-Residential Smart $aver® Program
Cumulative as of: Measures Energy Savings
(MWh)
Peak Demand
(kW)
December 31, 2014 2,942,356 1,055,182 170,446
Small Business Energy Saver Program is designed to reduce energy usage by improving
energy efficiency through the offer and installation of eligible energy efficiency measures.
Program measures address major end-uses in lighting, refrigeration, and HVAC applications.
The Program is available to existing non-residential establishments served on a Duke Energy
Carolinas general service or industrial rate schedule from the Duke Energy Carolinas’ retail
distribution system that are not opted-out of the EE portion of Rider EE. Program participants
must have an average annual demand of 100 kW or less per active account. Participants may be
owner-occupied or tenant facilities with owner permission.
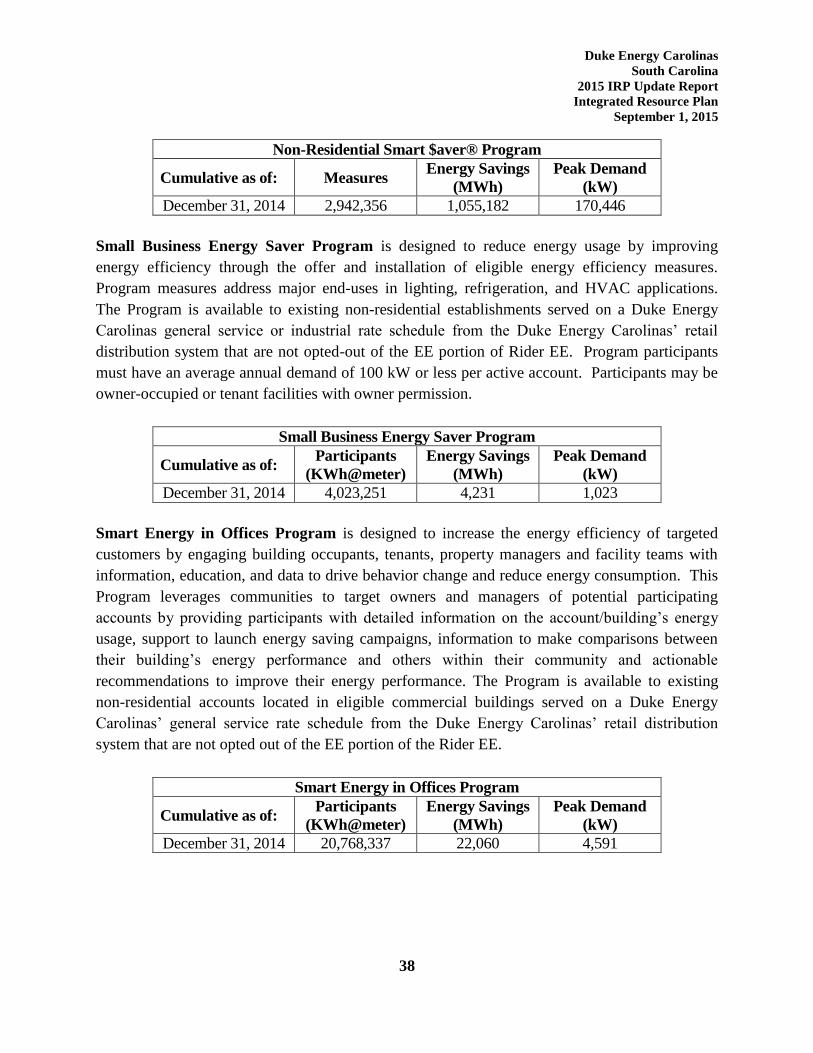
Small Business Energy Saver Program
Cumulative as of: Participants
(KWh@meter)
Energy Savings
(MWh)
Peak Demand
(kW)
December 31, 2014 4,023,251 4,231 1,023
Smart Energy in Offices Program is designed to increase the energy efficiency of targeted
customers by engaging building occupants, tenants, property managers and facility teams with
information, education, and data to drive behavior change and reduce energy consumption. This
Program leverages communities to target owners and managers of potential participating
accounts by providing participants with detailed information on the account/building’s energy
usage, support to launch energy saving campaigns, information to make comparisons between
their building’s energy performance and others within their community and actionable
recommendations to improve their energy performance. The Program is available to existing
non-residential accounts located in eligible commercial buildings served on a Duke Energy
Carolinas’ general service rate schedule from the Duke Energy Carolinas’ retail distribution
system that are not opted out of the EE portion of the Rider EE.
Smart Energy in Offices Program
Cumulative as of: Participants
(KWh@meter)
Energy Savings
(MWh)
Peak Demand
(kW)
December 31, 2014 20,768,337 22,060 4,591
Duke Energy Carolinas
South Carolina
2015 IRP Update Report
Integrated Resource Plan
September 1, 2015
39
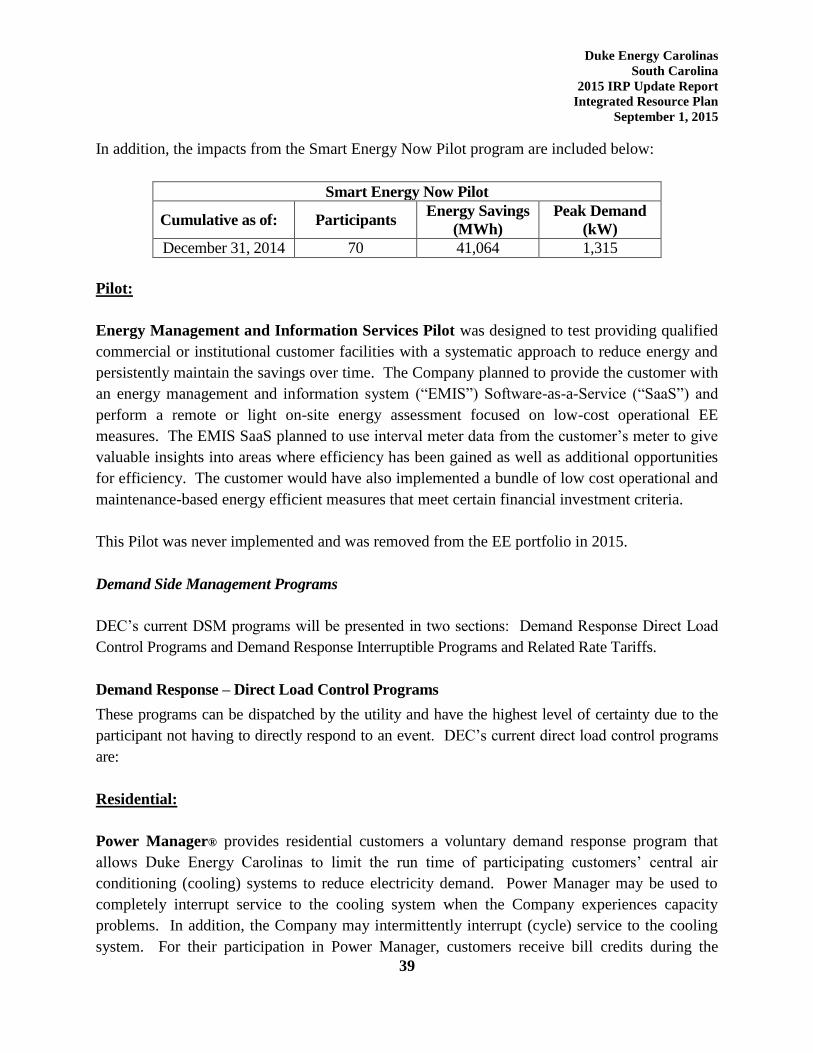
In addition, the impacts from the Smart Energy Now Pilot program are included below:
Smart Energy Now Pilot
Cumulative as of: Participants Energy Savings
(MWh)
Peak Demand
(kW)
December 31, 2014 70 41,064 1,315
Pilot:
Energy Management and Information Services Pilot was designed to test providing qualified
commercial or institutional customer facilities with a systematic approach to reduce energy and
persistently maintain the savings over time. The Company planned to provide the customer with
an energy management and information system (“EMIS”) Software-as-a-Service (“SaaS”) and
perform a remote or light on-site energy assessment focused on low-cost operational EE
measures. The EMIS SaaS planned to use interval meter data from the customer’s meter to give
valuable insights into areas where efficiency has been gained as well as additional opportunities
for efficiency. The customer would have also implemented a bundle of low cost operational and
maintenance-based energy efficient measures that meet certain financial investment criteria.
This Pilot was never implemented and was removed from the EE portfolio in 2015.
Demand Side Management Programs
DEC’s current DSM programs will be presented in two sections: Demand Response Direct Load
Control Programs and Demand Response Interruptible Programs and Related Rate Tariffs.
Demand Response – Direct Load Control Programs
These programs can be dispatched by the utility and have the highest level of certainty due to the
participant not having to directly respond to an event. DEC’s current direct load control programs
are:
Residential:
Power Manager® provides residential customers a voluntary demand response program that
allows Duke Energy Carolinas to limit the run time of participating customers’ central air
conditioning (cooling) systems to reduce electricity demand. Power Manager may be used to
completely interrupt service to the cooling system when the Company experiences capacity
problems. In addition, the Company may intermittently interrupt (cycle) service to the cooling
system. For their participation in Power Manager, customers receive bill credits during the
Duke Energy Carolinas
South Carolina
2015 IRP Update Report
Integrated Resource Plan
September 1, 2015
40
billing months of June through September.
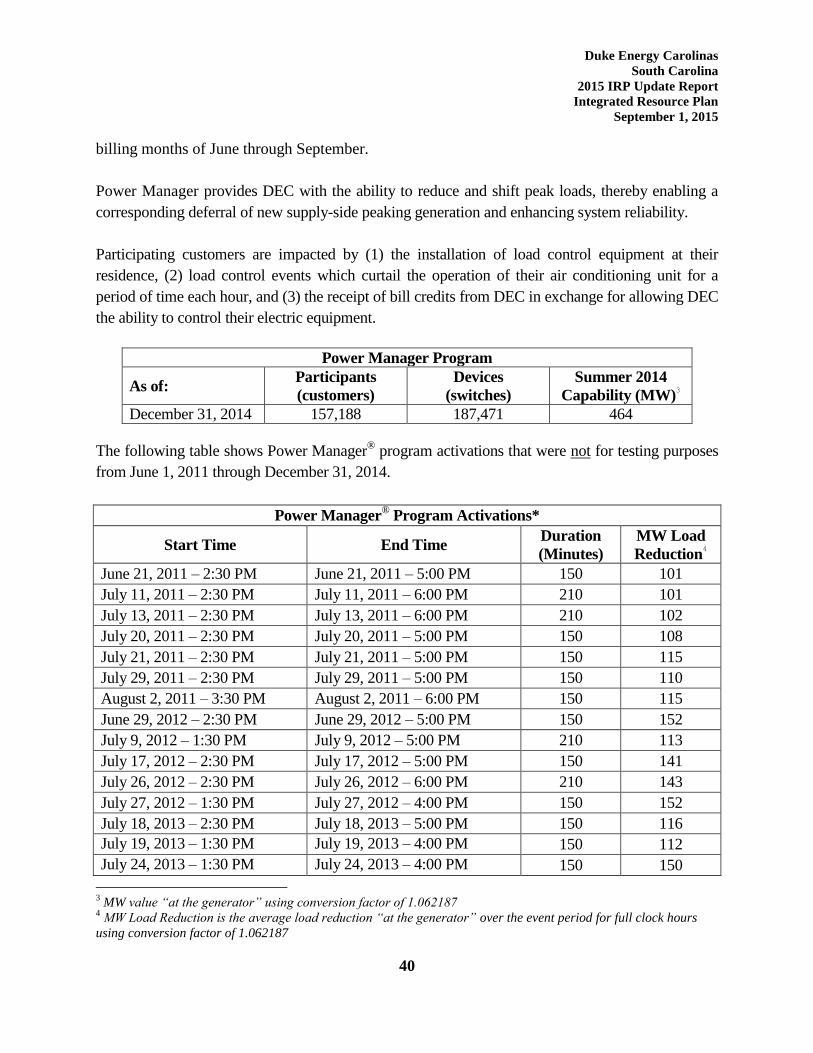
Power Manager provides DEC with the ability to reduce and shift peak loads, thereby enabling a
corresponding deferral of new supply-side peaking generation and enhancing system reliability.
Participating customers are impacted by (1) the installation of load control equipment at their
residence, (2) load control events which curtail the operation of their air conditioning unit for a
period of time each hour, and (3) the receipt of bill credits from DEC in exchange for allowing DEC
the ability to control their electric equipment.
Power Manager Program
As of: Participants
(customers)
Devices
(switches)
Summer 2014
Capability (MW)3
December 31, 2014 157,188 187,471 464
The following table shows Power Manager® program activations that were not for testing purposes
from June 1, 2011 through December 31, 2014.
Power Manager® Program Activations*
Start Time End Time Duration
(Minutes)
MW Load
Reduction4
June 21, 2011 – 2:30 PM June 21, 2011 – 5:00 PM 150 101
July 11, 2011 – 2:30 PM July 11, 2011 – 6:00 PM 210 101
July 13, 2011 – 2:30 PM July 13, 2011 – 6:00 PM 210 102
July 20, 2011 – 2:30 PM July 20, 2011 – 5:00 PM 150 108
July 21, 2011 – 2:30 PM July 21, 2011 – 5:00 PM 150 115
July 29, 2011 – 2:30 PM July 29, 2011 – 5:00 PM 150 110
August 2, 2011 – 3:30 PM August 2, 2011 – 6:00 PM 150 115
June 29, 2012 – 2:30 PM June 29, 2012 – 5:00 PM 150 152
July 9, 2012 – 1:30 PM July 9, 2012 – 5:00 PM 210 113
July 17, 2012 – 2:30 PM July 17, 2012 – 5:00 PM 150 141
July 26, 2012 – 2:30 PM July 26, 2012 – 6:00 PM 210 143
July 27, 2012 – 1:30 PM July 27, 2012 – 4:00 PM 150 152
July 18, 2013 – 2:30 PM July 18, 2013 – 5:00 PM 150 116
July 19, 2013 – 1:30 PM July 19, 2013 – 4:00 PM 150 112
July 24, 2013 – 1:30 PM July 24, 2013 – 4:00 PM 150 150
3 MW value “at the generator” using conversion factor of 1.062187
4 MW Load Reduction is the average load reduction “at the generator” over the event period for full clock hours
using conversion factor of 1.062187
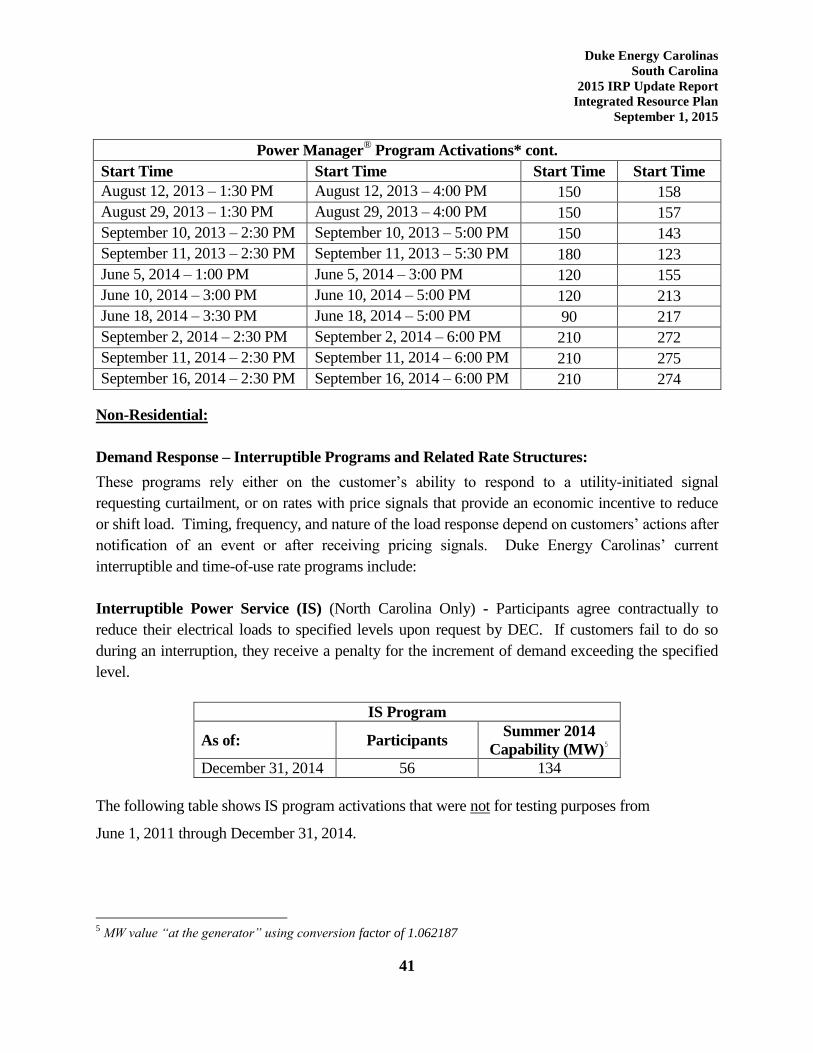
Duke Energy Carolinas
South Carolina
2015 IRP Update Report
Integrated Resource Plan
September 1, 2015
41
Power Manager® Program Activations* cont.
Start Time Start Time Start Time Start Time
August 12, 2013 – 1:30 PM August 12, 2013 – 4:00 PM 150 158
August 29, 2013 – 1:30 PM August 29, 2013 – 4:00 PM 150 157
September 10, 2013 – 2:30 PM September 10, 2013 – 5:00 PM 150 143
September 11, 2013 – 2:30 PM September 11, 2013 – 5:30 PM 180 123
June 5, 2014 – 1:00 PM June 5, 2014 – 3:00 PM 120 155
June 10, 2014 – 3:00 PM June 10, 2014 – 5:00 PM 120 213
June 18, 2014 – 3:30 PM June 18, 2014 – 5:00 PM 90 217
September 2, 2014 – 2:30 PM September 2, 2014 – 6:00 PM 210 272
September 11, 2014 – 2:30 PM September 11, 2014 – 6:00 PM 210 275
September 16, 2014 – 2:30 PM September 16, 2014 – 6:00 PM 210 274
Non-Residential:
Demand Response – Interruptible Programs and Related Rate Structures:
These programs rely either on the customer’s ability to respond to a utility-initiated signal
requesting curtailment, or on rates with price signals that provide an economic incentive to reduce
or shift load. Timing, frequency, and nature of the load response depend on customers’ actions after
notification of an event or after receiving pricing signals. Duke Energy Carolinas’ current
interruptible and time-of-use rate programs include:
Interruptible Power Service (IS) (North Carolina Only) - Participants agree contractually to
reduce their electrical loads to specified levels upon request by DEC. If customers fail to do so
during an interruption, they receive a penalty for the increment of demand exceeding the specified
level.
IS Program
As of: Participants Summer 2014
Capability (MW)5
December 31, 2014 56 134
The following table shows IS program activations that were not for testing purposes from
June 1, 2011 through December 31, 2014.
5 MW value “at the generator” using conversion factor of 1.062187
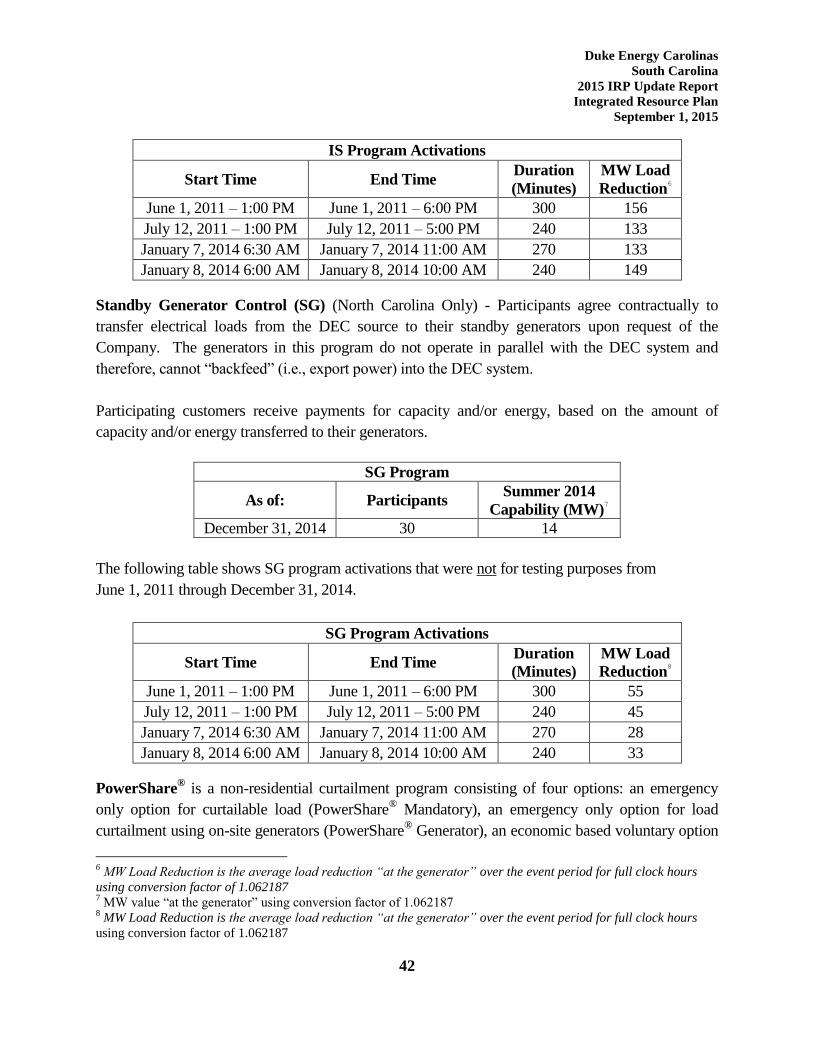
Duke Energy Carolinas
South Carolina
2015 IRP Update Report
Integrated Resource Plan
September 1, 2015
42
IS Program Activations
Start Time End Time Duration
(Minutes)
MW Load
Reduction6
June 1, 2011 – 1:00 PM June 1, 2011 – 6:00 PM 300 156
July 12, 2011 – 1:00 PM July 12, 2011 – 5:00 PM 240 133
January 7, 2014 6:30 AM January 7, 2014 11:00 AM 270 133
January 8, 2014 6:00 AM January 8, 2014 10:00 AM 240 149
Standby Generator Control (SG) (North Carolina Only) - Participants agree contractually to
transfer electrical loads from the DEC source to their standby generators upon request of the
Company. The generators in this program do not operate in parallel with the DEC system and
therefore, cannot “backfeed” (i.e., export power) into the DEC system.
Participating customers receive payments for capacity and/or energy, based on the amount of
capacity and/or energy transferred to their generators.
SG Program
As of: Participants Summer 2014
Capability (MW)7
December 31, 2014 30 14
The following table shows SG program activations that were not for testing purposes from
June 1, 2011 through December 31, 2014.
SG Program Activations
Start Time End Time Duration
(Minutes)
MW Load
Reduction8
June 1, 2011 – 1:00 PM June 1, 2011 – 6:00 PM 300 55
July 12, 2011 – 1:00 PM July 12, 2011 – 5:00 PM 240 45
January 7, 2014 6:30 AM January 7, 2014 11:00 AM 270 28
January 8, 2014 6:00 AM January 8, 2014 10:00 AM 240 33
PowerShare® is a non-residential curtailment program consisting of four options: an emergency
only option for curtailable load (PowerShare® Mandatory), an emergency only option for load
curtailment using on-site generators (PowerShare® Generator), an economic based voluntary option
6 MW Load Reduction is the average load reduction “at the generator” over the event period for full clock hours
using conversion factor of 1.062187 7 MW value “at the generator” using conversion factor of 1.062187
8 MW Load Reduction is the average load reduction “at the generator” over the event period for full clock hours
using conversion factor of 1.062187
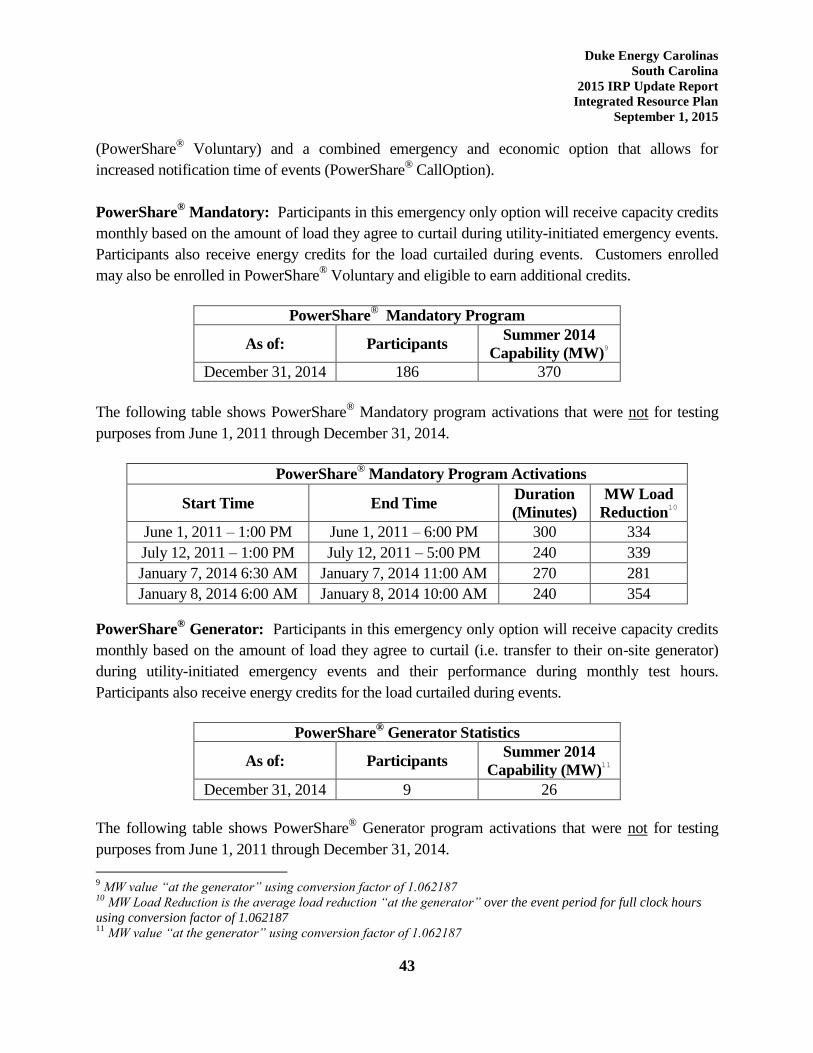
Duke Energy Carolinas
South Carolina
2015 IRP Update Report
Integrated Resource Plan
September 1, 2015
43
(PowerShare® Voluntary) and a combined emergency and economic option that allows for
increased notification time of events (PowerShare® CallOption).
PowerShare® Mandatory: Participants in this emergency only option will receive capacity credits
monthly based on the amount of load they agree to curtail during utility-initiated emergency events.
Participants also receive energy credits for the load curtailed during events. Customers enrolled
may also be enrolled in PowerShare® Voluntary and eligible to earn additional credits.
PowerShare® Mandatory Program
As of: Participants Summer 2014
Capability (MW)9
December 31, 2014 186 370
The following table shows PowerShare® Mandatory program activations that were not for testing
purposes from June 1, 2011 through December 31, 2014.
PowerShare® Mandatory Program Activations
Start Time End Time Duration
(Minutes)
MW Load
Reduction10
June 1, 2011 – 1:00 PM June 1, 2011 – 6:00 PM 300 334
July 12, 2011 – 1:00 PM July 12, 2011 – 5:00 PM 240 339
January 7, 2014 6:30 AM January 7, 2014 11:00 AM 270 281
January 8, 2014 6:00 AM January 8, 2014 10:00 AM 240 354
PowerShare® Generator: Participants in this emergency only option will receive capacity credits
monthly based on the amount of load they agree to curtail (i.e. transfer to their on-site generator)
during utility-initiated emergency events and their performance during monthly test hours.
Participants also receive energy credits for the load curtailed during events.
PowerShare® Generator Statistics
As of: Participants Summer 2014
Capability (MW)11
December 31, 2014 9 26
The following table shows PowerShare® Generator program activations that were not for testing
purposes from June 1, 2011 through December 31, 2014.
9 MW value “at the generator” using conversion factor of 1.062187
10 MW Load Reduction is the average load reduction “at the generator” over the event period for full clock hours
using conversion factor of 1.062187 11
MW value “at the generator” using conversion factor of 1.062187
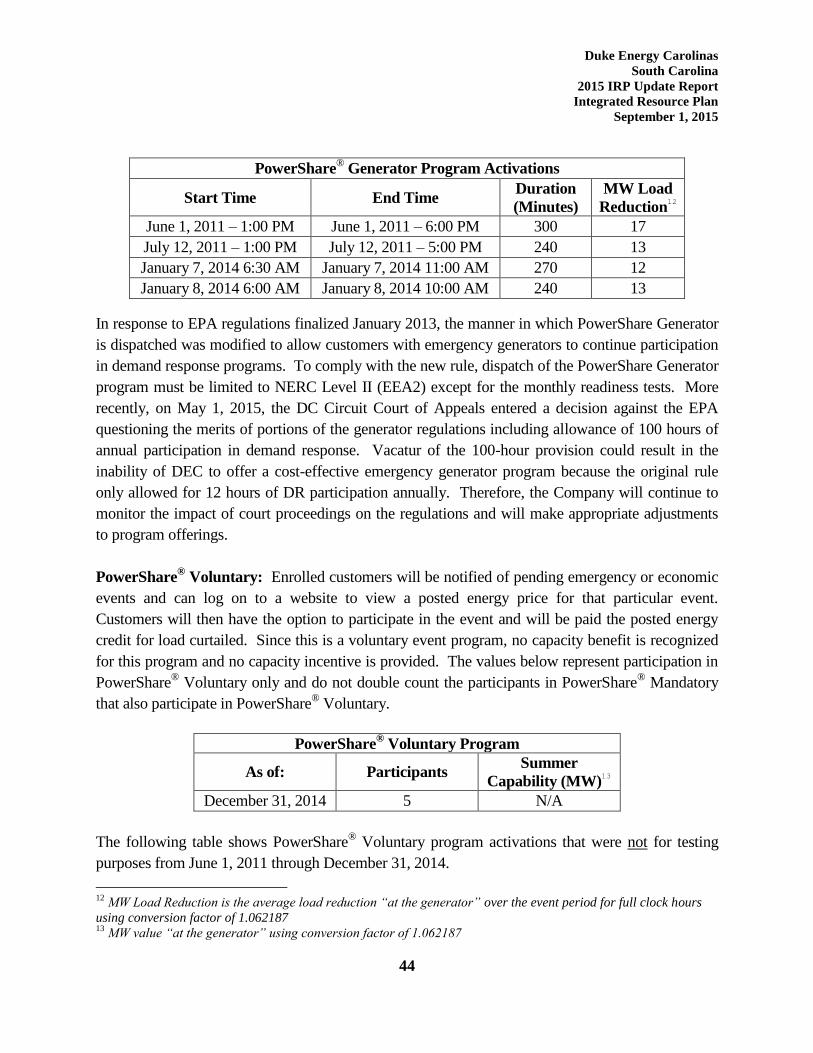
Duke Energy Carolinas
South Carolina
2015 IRP Update Report
Integrated Resource Plan
September 1, 2015
44
PowerShare® Generator Program Activations
Start Time End Time Duration
(Minutes)
MW Load
Reduction12
June 1, 2011 – 1:00 PM June 1, 2011 – 6:00 PM 300 17
July 12, 2011 – 1:00 PM July 12, 2011 – 5:00 PM 240 13
January 7, 2014 6:30 AM January 7, 2014 11:00 AM 270 12
January 8, 2014 6:00 AM January 8, 2014 10:00 AM 240 13
In response to EPA regulations finalized January 2013, the manner in which PowerShare Generator
is dispatched was modified to allow customers with emergency generators to continue participation
in demand response programs. To comply with the new rule, dispatch of the PowerShare Generator
program must be limited to NERC Level II (EEA2) except for the monthly readiness tests. More
recently, on May 1, 2015, the DC Circuit Court of Appeals entered a decision against the EPA
questioning the merits of portions of the generator regulations including allowance of 100 hours of
annual participation in demand response. Vacatur of the 100-hour provision could result in the
inability of DEC to offer a cost-effective emergency generator program because the original rule
only allowed for 12 hours of DR participation annually. Therefore, the Company will continue to
monitor the impact of court proceedings on the regulations and will make appropriate adjustments
to program offerings.
PowerShare® Voluntary: Enrolled customers will be notified of pending emergency or economic
events and can log on to a website to view a posted energy price for that particular event.
Customers will then have the option to participate in the event and will be paid the posted energy
credit for load curtailed. Since this is a voluntary event program, no capacity benefit is recognized
for this program and no capacity incentive is provided. The values below represent participation in
PowerShare® Voluntary only and do not double count the participants in PowerShare
® Mandatory
that also participate in PowerShare® Voluntary.
PowerShare® Voluntary Program
As of: Participants Summer
Capability (MW)13
December 31, 2014 5 N/A
The following table shows PowerShare® Voluntary program activations that were not for testing
purposes from June 1, 2011 through December 31, 2014.
12
MW Load Reduction is the average load reduction “at the generator” over the event period for full clock hours
using conversion factor of 1.062187 13
MW value “at the generator” using conversion factor of 1.062187
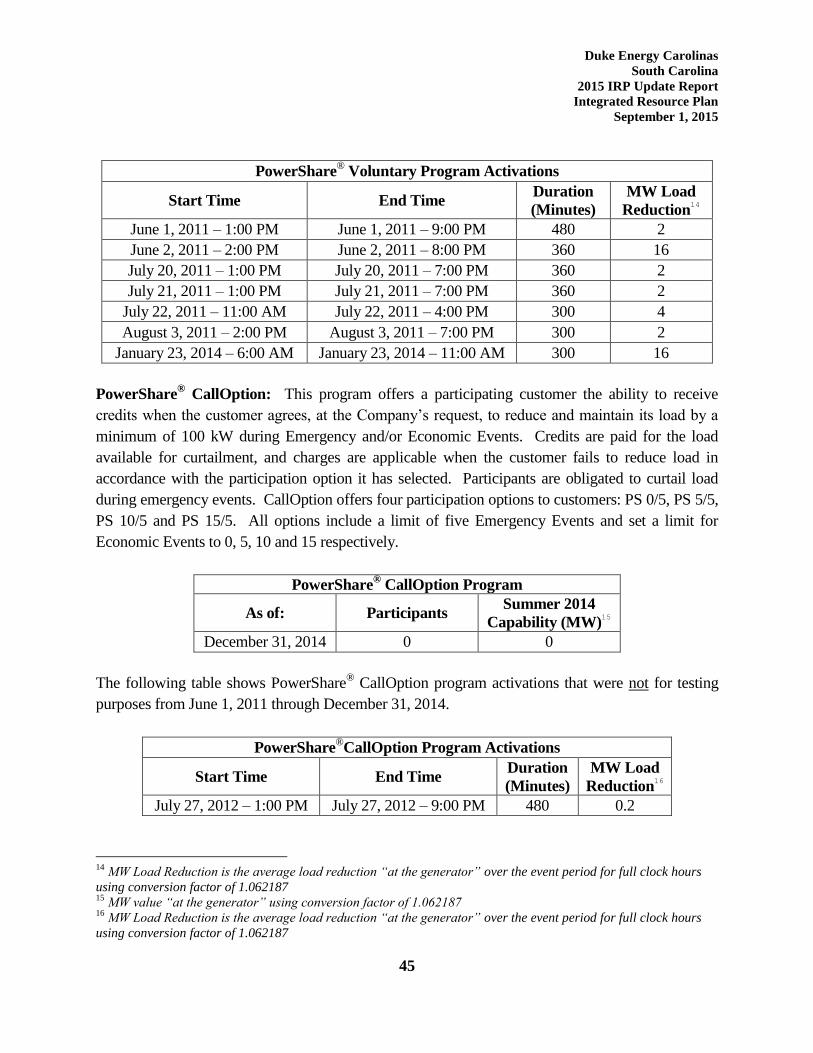
Duke Energy Carolinas
South Carolina
2015 IRP Update Report
Integrated Resource Plan
September 1, 2015
45
PowerShare® Voluntary Program Activations
Start Time End Time Duration
(Minutes)
MW Load
Reduction14
June 1, 2011 – 1:00 PM June 1, 2011 – 9:00 PM 480 2
June 2, 2011 – 2:00 PM June 2, 2011 – 8:00 PM 360 16
July 20, 2011 – 1:00 PM July 20, 2011 – 7:00 PM 360 2
July 21, 2011 – 1:00 PM July 21, 2011 – 7:00 PM 360 2
July 22, 2011 – 11:00 AM July 22, 2011 – 4:00 PM 300 4
August 3, 2011 – 2:00 PM August 3, 2011 – 7:00 PM 300 2
January 23, 2014 – 6:00 AM January 23, 2014 – 11:00 AM 300 16
PowerShare® CallOption: This program offers a participating customer the ability to receive
credits when the customer agrees, at the Company’s request, to reduce and maintain its load by a
minimum of 100 kW during Emergency and/or Economic Events. Credits are paid for the load
available for curtailment, and charges are applicable when the customer fails to reduce load in
accordance with the participation option it has selected. Participants are obligated to curtail load
during emergency events. CallOption offers four participation options to customers: PS 0/5, PS 5/5,
PS 10/5 and PS 15/5. All options include a limit of five Emergency Events and set a limit for
Economic Events to 0, 5, 10 and 15 respectively.
PowerShare® CallOption Program
As of: Participants Summer 2014
Capability (MW)15
December 31, 2014 0 0
The following table shows PowerShare® CallOption program activations that were not for testing
purposes from June 1, 2011 through December 31, 2014.
PowerShare®CallOption Program Activations
Start Time End Time Duration
(Minutes)
MW Load
Reduction16
July 27, 2012 – 1:00 PM July 27, 2012 – 9:00 PM 480 0.2
14
MW Load Reduction is the average load reduction “at the generator” over the event period for full clock hours
using conversion factor of 1.062187 15
MW value “at the generator” using conversion factor of 1.062187 16
MW Load Reduction is the average load reduction “at the generator” over the event period for full clock hours
using conversion factor of 1.062187
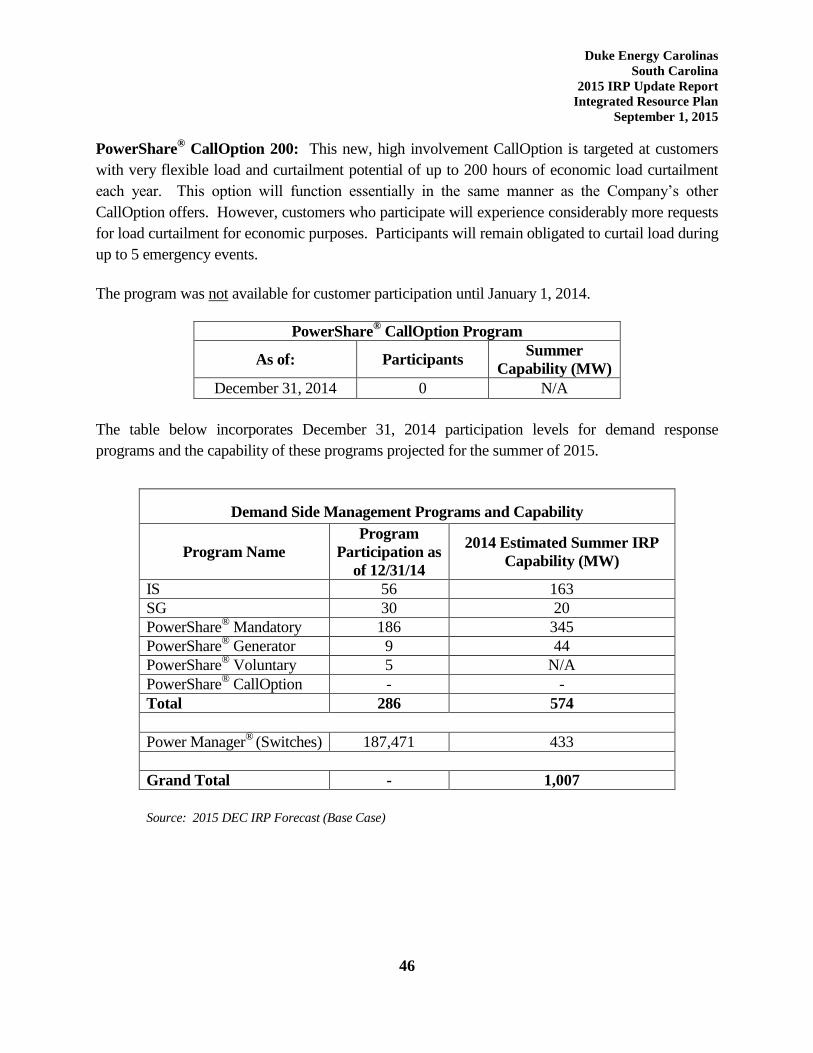
Duke Energy Carolinas
South Carolina
2015 IRP Update Report
Integrated Resource Plan
September 1, 2015
46
PowerShare® CallOption 200: This new, high involvement CallOption is targeted at customers
with very flexible load and curtailment potential of up to 200 hours of economic load curtailment
each year. This option will function essentially in the same manner as the Company’s other
CallOption offers. However, customers who participate will experience considerably more requests
for load curtailment for economic purposes. Participants will remain obligated to curtail load during
up to 5 emergency events.
The program was not available for customer participation until January 1, 2014.
PowerShare® CallOption Program
As of: Participants Summer
Capability (MW)
December 31, 2014 0 N/A
The table below incorporates December 31, 2014 participation levels for demand response
programs and the capability of these programs projected for the summer of 2015.
Demand Side Management Programs and Capability
Program Name
Program
Participation as
of 12/31/14
2014 Estimated Summer IRP
Capability (MW)
IS 56 163
SG 30 20
PowerShare® Mandatory 186 345
PowerShare® Generator 9 44
PowerShare® Voluntary 5 N/A
PowerShare® CallOption - -
Total 286 574
Power Manager®
(Switches) 187,471 433
Grand Total - 1,007
Source: 2015 DEC IRP Forecast (Base Case)
Duke Energy Carolinas
South Carolina
2015 IRP Update Report
Integrated Resource Plan
September 1, 2015
47
Future EE and DSM Programs:
DEC is continually seeking to enhance its EE and DSM portfolio by: (1) adding new programs or
expanding existing programs to include additional measures, (2) program modifications to account
for changing market conditions and new M&V results, and (3) other EE pilots. .17
Potential new programs and/or measures will be reviewed with the DSM Collaborative then
submitted to the Public Utility Commissions as required for approval.
Two programs currently being developed for filing and approval are Residential HVAC Referrals
program and Small Business Demand Response. Both of these programs have been presented to the
DSM Collaborative and final preparation of the actual filing documents was underway at the time
this IRP was being created. However, because these programs have not yet been approved by the
Commissions, the expected impacts from these programs have not been included in this year’s
analysis of generation needs
EE and DSM Program Screening:
The Company uses the DSMore model to evaluate the costs, benefits, and risks of EE and DSM
programs and measures. DSMore is a financial analysis tool designed to estimate of the capacity
and energy values of EE and DSM measures at an hourly level across distributions of weather
conditions and/or energy costs or prices. By examining projected program performance and cost
effectiveness over a wide variety of weather and cost conditions, the Company is in a better position
to measure the risks and benefits of employing EE and DSM measures versus traditional generation
capacity additions, and further, to ensure that DSM resources are compared to supply side resources
on a level playing field.
The analysis of energy efficiency and demand side management cost-effectiveness has traditionally
focused primarily on the calculation of specific metrics, often referred to as the California Standard
tests: Utility Cost Test (UCT), Rate Impact Measure (RIM) Test, Total Resource Cost (TRC) Test
and Participant Test. DSMore provides the results of those tests for any type of EE or DSM
program.
The UCT compares utility benefits (avoided costs) to the costs incurred by the utility to
implement the program, and does not consider other benefits such as participant savings or
17
DEC has not included “Pay As You Go” as a potential EE program at this time. The Company will make a
determination regarding the viability of an associated EE program upon completion of the Pilot Program.
Duke Energy Carolinas
South Carolina
2015 IRP Update Report
Integrated Resource Plan
September 1, 2015
48
societal impacts. This test compares the cost (to the utility) to implement the measures with
the savings or avoided costs (to the utility) resulting from the change in magnitude and/or
the pattern of electricity consumption caused by implementation of the program. Avoided
costs are considered in the evaluation of cost-effectiveness based on the projected cost of
power, including the projected cost of the utility’s environmental compliance for known
regulatory requirements. The cost-effectiveness analyses also incorporate avoided
transmission and distribution costs, and load (line) losses.
The RIM Test, or non-participants test, indicates if rates increase or decrease over the long-
run as a result of implementing the program.
The TRC Test compares the total benefits to the utility and to participants relative to the
costs to the utility to implement the program along with the costs to the participant. The
benefits to the utility are the same as those computed under the UCT. The benefits to the
participant are the same as those computed under the Participant Test, however, customer
incentives are considered to be a pass-through benefit to customers. As such, customer
incentives or rebates are not included in the TRC.
The Participant Test evaluates programs from the perspective of the program’s participants.
The benefits include reductions in utility bills, incentives paid by the utility and any State,
Federal or local tax benefits received.
The use of multiple tests can ensure the development of a reasonable set of cost-effective DSM and
EE programs and indicate the likelihood that customers will participate.
Energy Efficiency and Demand-Side Management Program Forecasts:
The Public Staff, in their comments on the 2013 IRP filing, Docket E-100, Sub137, made the
following recommendations relative to EE/DSM analysis and forecasts:
9. The IOUs should continue to monitor and report any changes of more than 10% in the energy and
capacity savings derived from DSM / EE between successive IRPs, and evaluate and discuss any
changes on a program specific basis. Any issues impacting program deployment should be thoroughly
explained and quantified in future IRPs.
10. The IOUs should develop a consistent method of evaluating their DSM / EE portfolios and incorporate
the savings in a manner that provides a clearer understanding of the year-by-year changes occurring in
the portfolios and their impact on the load forecast and resource plan in future IRPs. The savings
impacts should be represented on a net basis, taking into account any NTG impacts derived through
EM&V processes.
Duke Energy Carolinas
South Carolina
2015 IRP Update Report
Integrated Resource Plan
September 1, 2015
49
11. DEP and DEC should specifically identify the values of DSM / EE portfolio capacity and energy savings
separately in their load forecast tables and not embed these values in the system peak load or energy.
12. The IOUs should account for all of their DSM / EE program savings from programs approved pursuant
to G.S. 62-133.9 and Commission Rule R8-68, regardless of when those measures were installed.
13. DEP and DEC should each adopt one methodology of evaluating the DSM / EE components of the IRP
and remain consistent year-to-year. If an IOU determines that a change in methodology is required or
appropriate, these changes should be thoroughly explained, justified, and reconciled to the savings
projected in the previous IRP.
In response to these Recommendations above, the company has included the following information.
Forecast Methodology:
In 2011, DEC commissioned a new EE market potential study to obtain new estimates of the
technical, economic and achievable potential for EE savings within the DEC service area. The final
report was prepared by Forefront Economics Inc. and H. Gil Peach and Associates, LLC and was
completed on February 23, 2012 and included an achievable potential for planning year 5 and an
economic potential for planning year 20.
The Forefront study results are suitable for IRP purposes and for use in long-range system planning
models. This study also helps to inform utility program planners regarding the extent of EE
opportunities and to provide broadly defined approaches for acquiring savings. This study did not,
however, attempt to closely forecast EE achievements in the short-term or from year to year. Such
an annual accounting is highly sensitive to the nature of programs adopted as well as the timing of
the introduction of those programs. As a result, it was not designed to provide detailed
specifications and work plans required for program implementation. The study provides part of the
picture for planning EE programs. Fully implementable EE program plans are best developed
considering this study along with the experience gained from currently running programs, input
from DEC program managers and EE planners, feedback from the DSM Collaborative and with the
possible assistance of implementation contractors.
As part of its annual planning process, DEC created a detailed Base Case forecast of its EE and
DSM portfolio for the upcoming 5 year planning horizon. In addition, DEC also developed a long
run load forecast for the next 25 years under the assumption that no incremental new Utility
sponsored EE would be implemented. This “before EE” forecast was then used to project the long
run Economic potential for DEC based on the results of the Market Potential Study by multiplying
the Load Forecast times the expected Economic Potential as a percentage of Retail sales. This
Duke Energy Carolinas
South Carolina
2015 IRP Update Report
Integrated Resource Plan
September 1, 2015
50
Economic Potential was further adjusted to account for the cumulative actual EE portfolio
achievements since the creation of the Market Potential Study. This overall Economic Potential
was then multiplied times an Achievable Potential factor consistent with information provided in the
most recent energy efficiency market potential study conducted by EPRI18
.
Using this Achievable Potential as an upper boundary for the cumulative EE Achievement along
with the projection of the first 5 years (2015-19) from the Company’s annual planning process, a
long run EE forecast was created by extrapolating the incremental achievements for Year 5 (2019)
until such time as the cumulative EE Achievement, including actual achievement since the analysis
performed in the Market Potential Study, reached the Achievable Potential factor of approximately
60% of the Economic Potential. In the forecast, after inclusion of approximately 1,533 GWh
achieved since 2011, the projected EE achievement reaches this level by the year 2029.
For periods beyond 2029, the annual incremental EE achievements were set to maintain the same
percentage achievement of the Economic Potential, i.e. the achievements were set to essentially
keep up with the growth in the retail sales forecast.
The table below provides the Base Case projected MWh load impacts of all DEC EE programs
implemented since the approval of the save-a-watt recovery mechanism in 2009 on a Gross and Net
of Free Riders basis (responsive to Recommendation Number 10 above). The Company assumes
total EE savings will continue to grow on an annual basis throughout the planning period until
reaching approximately 60% of the Economic Potential in approximately 2029, however, the
components of future programs are uncertain at this time and will be informed by the experience
gained under the current plan. Please note that, in response to Recommendation Number 12 above,
this table includes a column that shows historical EE program savings since the inception of the EE
programs in 2009 through the end of 2014, which accounts for approximately an additional 2,702
GWh of energy. These projections also do not include savings from DEC’s proposed Integrated
Voltage-VAR Control program, which will be discussed later in this document.
18
http://www.epri.com/abstracts/Pages/ProductAbstract.aspx?ProductId=000000000001025477
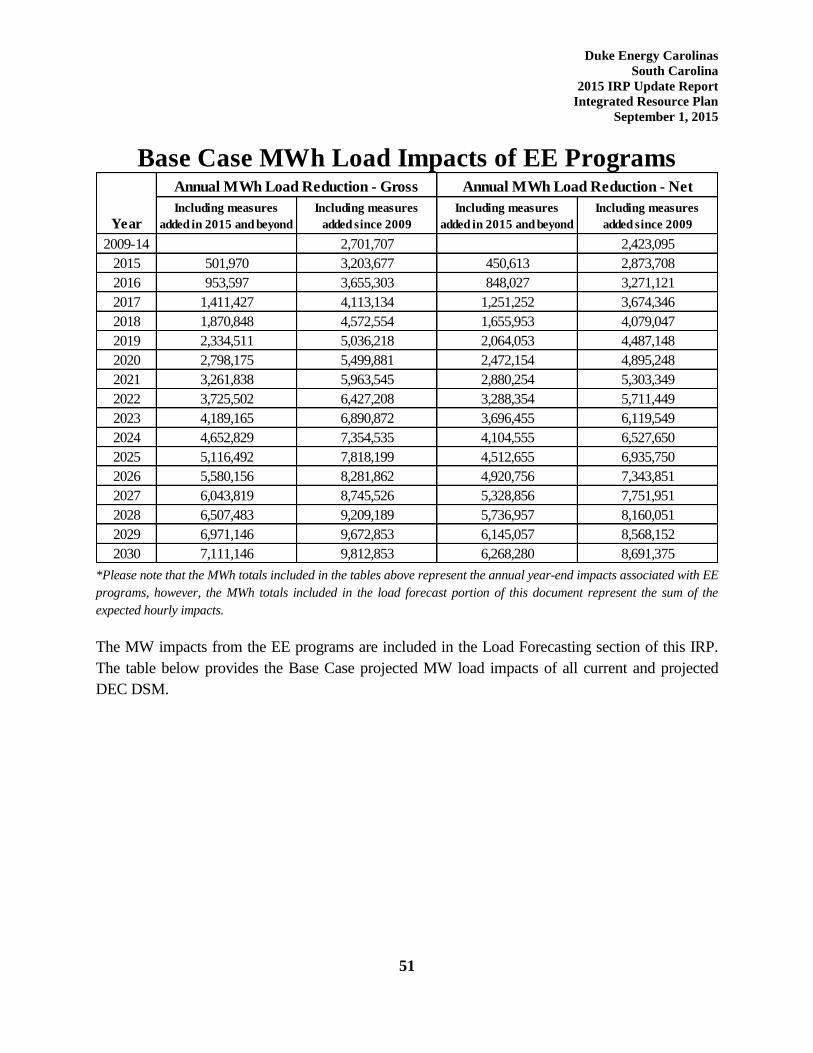
Duke Energy Carolinas
South Carolina
2015 IRP Update Report
Integrated Resource Plan
September 1, 2015
51
*Please note that the MWh totals included in the tables above represent the annual year-end impacts associated with EE
programs, however, the MWh totals included in the load forecast portion of this document represent the sum of the
expected hourly impacts.
The MW impacts from the EE programs are included in the Load Forecasting section of this IRP.
The table below provides the Base Case projected MW load impacts of all current and projected
DEC DSM.
Including measures
added in 2015 and beyond
Including measures
added since 2009
Including measures
added in 2015 and beyond
Including measures
added since 2009
2009-14 2,701,707 2,423,095
2015 501,970 3,203,677 450,613 2,873,708
2016 953,597 3,655,303 848,027 3,271,121
2017 1,411,427 4,113,134 1,251,252 3,674,346
2018 1,870,848 4,572,554 1,655,953 4,079,047
2019 2,334,511 5,036,218 2,064,053 4,487,148
2020 2,798,175 5,499,881 2,472,154 4,895,248
2021 3,261,838 5,963,545 2,880,254 5,303,349
2022 3,725,502 6,427,208 3,288,354 5,711,449
2023 4,189,165 6,890,872 3,696,455 6,119,549
2024 4,652,829 7,354,535 4,104,555 6,527,650
2025 5,116,492 7,818,199 4,512,655 6,935,750
2026 5,580,156 8,281,862 4,920,756 7,343,851
2027 6,043,819 8,745,526 5,328,856 7,751,951
2028 6,507,483 9,209,189 5,736,957 8,160,051
2029 6,971,146 9,672,853 6,145,057 8,568,152
2030 7,111,146 9,812,853 6,268,280 8,691,375
Base Case MWh Load Impacts of EE ProgramsAnnual MWh Load Reduction - Gross Annual MWh Load Reduction - Net
Year
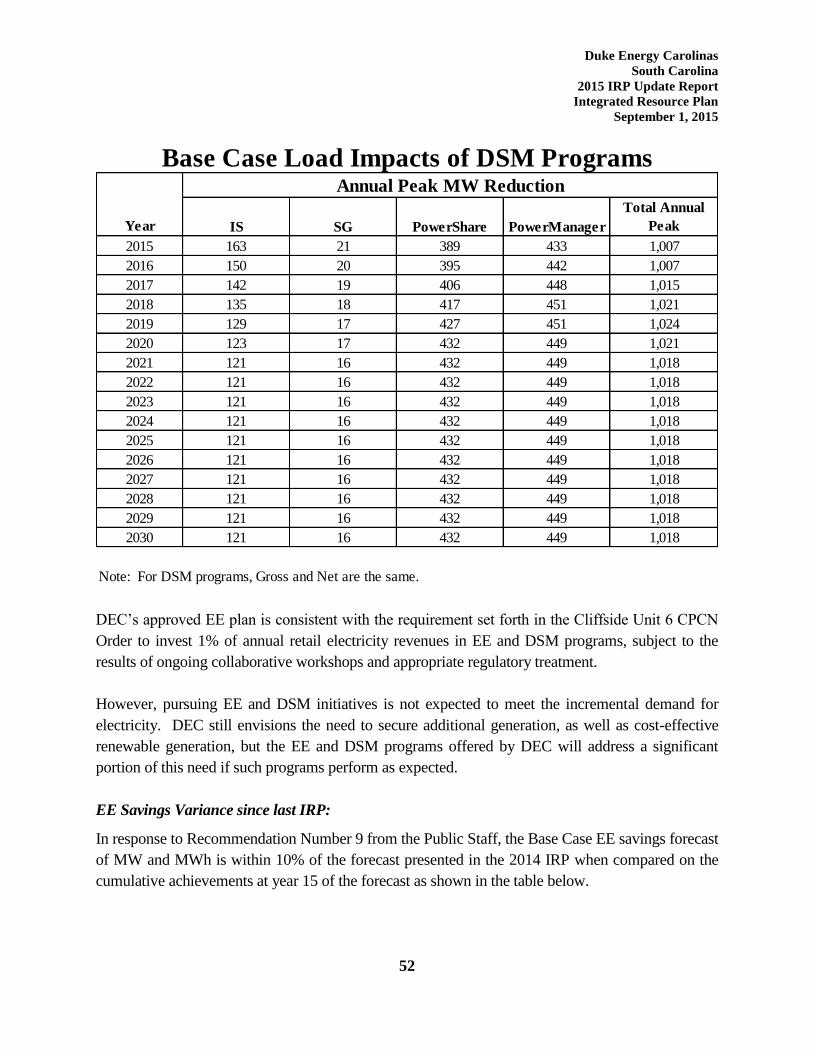
Duke Energy Carolinas
South Carolina
2015 IRP Update Report
Integrated Resource Plan
September 1, 2015
52
DEC’s approved EE plan is consistent with the requirement set forth in the Cliffside Unit 6 CPCN
Order to invest 1% of annual retail electricity revenues in EE and DSM programs, subject to the
results of ongoing collaborative workshops and appropriate regulatory treatment.
However, pursuing EE and DSM initiatives is not expected to meet the incremental demand for
electricity. DEC still envisions the need to secure additional generation, as well as cost-effective
renewable generation, but the EE and DSM programs offered by DEC will address a significant
portion of this need if such programs perform as expected.
EE Savings Variance since last IRP:
In response to Recommendation Number 9 from the Public Staff, the Base Case EE savings forecast
of MW and MWh is within 10% of the forecast presented in the 2014 IRP when compared on the
cumulative achievements at year 15 of the forecast as shown in the table below.
IS SG PowerShare PowerManager
Total Annual
Peak
2015 163 21 389 433 1,007
2016 150 20 395 442 1,007
2017 142 19 406 448 1,015
2018 135 18 417 451 1,021
2019 129 17 427 451 1,024
2020 123 17 432 449 1,021
2021 121 16 432 449 1,018
2022 121 16 432 449 1,018
2023 121 16 432 449 1,018
2024 121 16 432 449 1,018
2025 121 16 432 449 1,018
2026 121 16 432 449 1,018
2027 121 16 432 449 1,018
2028 121 16 432 449 1,018
2029 121 16 432 449 1,018
2030 121 16 432 449 1,018
Note: For DSM programs, Gross and Net are the same.
Base Case Load Impacts of DSM ProgramsAnnual Peak MW Reduction
Year
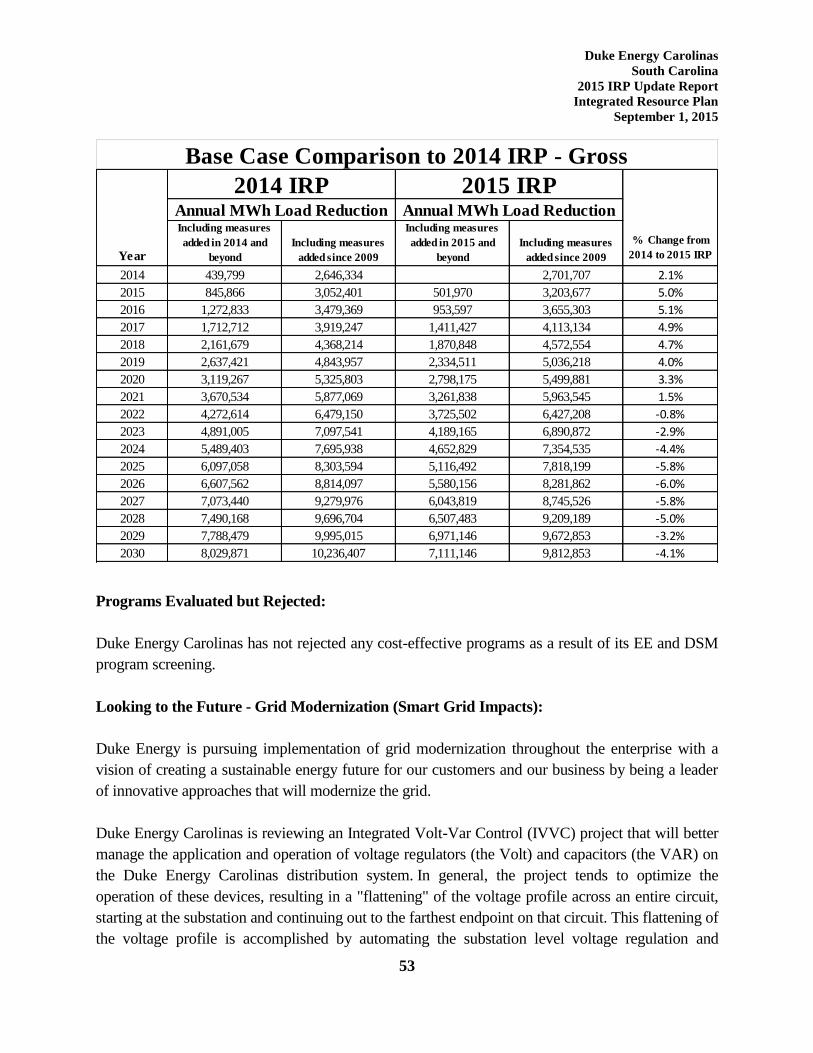
Duke Energy Carolinas
South Carolina
2015 IRP Update Report
Integrated Resource Plan
September 1, 2015
53
Programs Evaluated but Rejected:
Duke Energy Carolinas has not rejected any cost-effective programs as a result of its EE and DSM
program screening.
Looking to the Future - Grid Modernization (Smart Grid Impacts):
Duke Energy is pursuing implementation of grid modernization throughout the enterprise with a
vision of creating a sustainable energy future for our customers and our business by being a leader
of innovative approaches that will modernize the grid.
Duke Energy Carolinas is reviewing an Integrated Volt-Var Control (IVVC) project that will better
manage the application and operation of voltage regulators (the Volt) and capacitors (the VAR) on
the Duke Energy Carolinas distribution system. In general, the project tends to optimize the
operation of these devices, resulting in a "flattening" of the voltage profile across an entire circuit,
starting at the substation and continuing out to the farthest endpoint on that circuit. This flattening of
the voltage profile is accomplished by automating the substation level voltage regulation and
Including measures
added in 2014 and
beyond
Including measures
added since 2009
Including measures
added in 2015 and
beyond
Including measures
added since 2009
2014 439,799 2,646,334 2,701,707 2.1%
2015 845,866 3,052,401 501,970 3,203,677 5.0%
2016 1,272,833 3,479,369 953,597 3,655,303 5.1%
2017 1,712,712 3,919,247 1,411,427 4,113,134 4.9%
2018 2,161,679 4,368,214 1,870,848 4,572,554 4.7%
2019 2,637,421 4,843,957 2,334,511 5,036,218 4.0%
2020 3,119,267 5,325,803 2,798,175 5,499,881 3.3%
2021 3,670,534 5,877,069 3,261,838 5,963,545 1.5%
2022 4,272,614 6,479,150 3,725,502 6,427,208 -0.8%
2023 4,891,005 7,097,541 4,189,165 6,890,872 -2.9%
2024 5,489,403 7,695,938 4,652,829 7,354,535 -4.4%
2025 6,097,058 8,303,594 5,116,492 7,818,199 -5.8%
2026 6,607,562 8,814,097 5,580,156 8,281,862 -6.0%
2027 7,073,440 9,279,976 6,043,819 8,745,526 -5.8%
2028 7,490,168 9,696,704 6,507,483 9,209,189 -5.0%
2029 7,788,479 9,995,015 6,971,146 9,672,853 -3.2%
2030 8,029,871 10,236,407 7,111,146 9,812,853 -4.1%
Base Case Comparison to 2014 IRP - Gross
Year
% Change from
2014 to 2015 IRP
2014 IRP 2015 IRPAnnual MWh Load Reduction Annual MWh Load Reduction
Duke Energy Carolinas
South Carolina
2015 IRP Update Report
Integrated Resource Plan
September 1, 2015
54
capacitors, line capacitors and line voltage regulators while integrating them into a single control
system. This control system continuously monitors and operates the voltage regulators and
capacitors to maintain the desired "flat" voltage profile. Once the system is operating with a
relatively flat voltage profile across an entire circuit, the resulting circuit voltage at the substation
can then be operated at a lower overall level. Lowering the circuit voltage at the substation results
in an immediate reduction of system loading.
The deployment of an IVVC program for Duke Energy Carolinas is anticipated to take
approximately 4 years following project approval. This IVVC program is projected to reduce future
distribution-only peak needs by 0.20% in 2018, 0.4% in 2019, 0.6% in 2020, 1.0% in 2021 and
beyond.
While the subject of grid modernization is very broad, only the supply and demand impacts of the
IVVC program is included in the IRP process.
Duke Energy Carolinas
South Carolina
2015 IRP Update Report
Integrated Resource Plan
September 1, 2015
55
7. DEVELOPMENT OF THE RESOURCE PLAN:
The following section details the Company’s expansion plan and resource mix that is required to
meet the needs of DEC’s customers over the next 15 years. The section also includes a
discussion of the various technologies considered during the development of the IRP, as well as,
a summary of the resources required in the “No Carbon” sensitivity case.
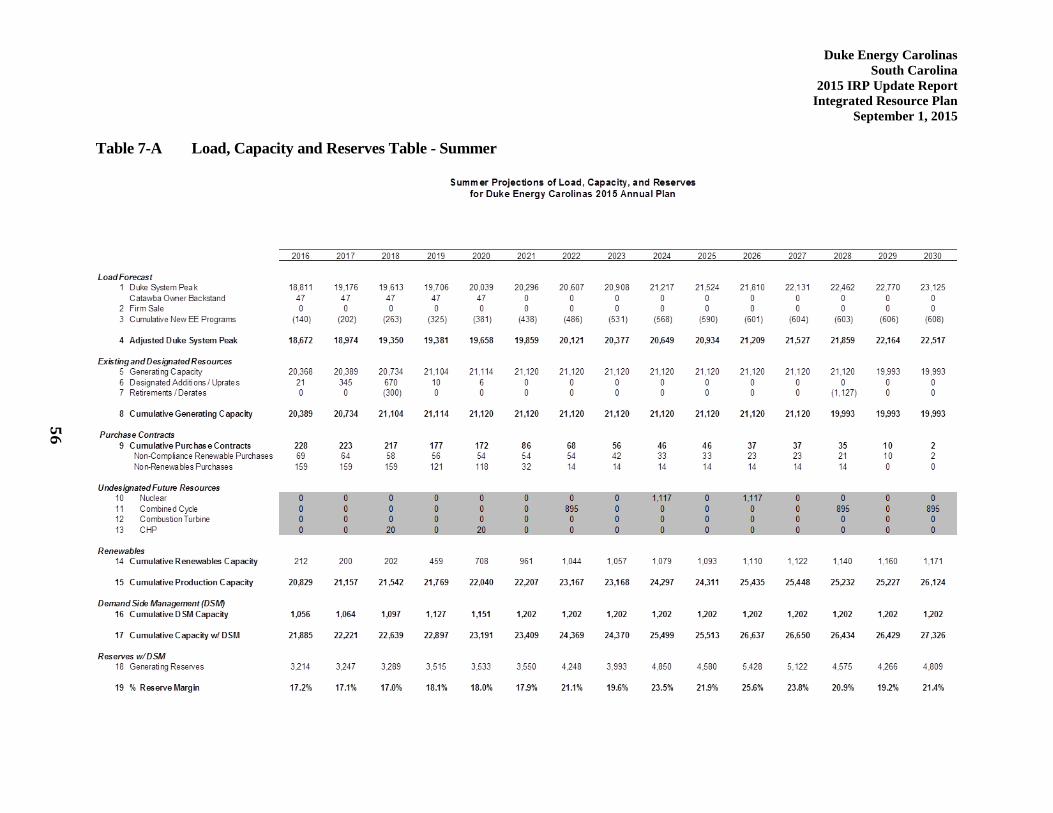
Duke Energy Carolinas
South Carolina
2015 IRP Update Report
Integrated Resource Plan
September 1, 2015
Table 7-A Load, Capacity and Reserves Table - Summer
56
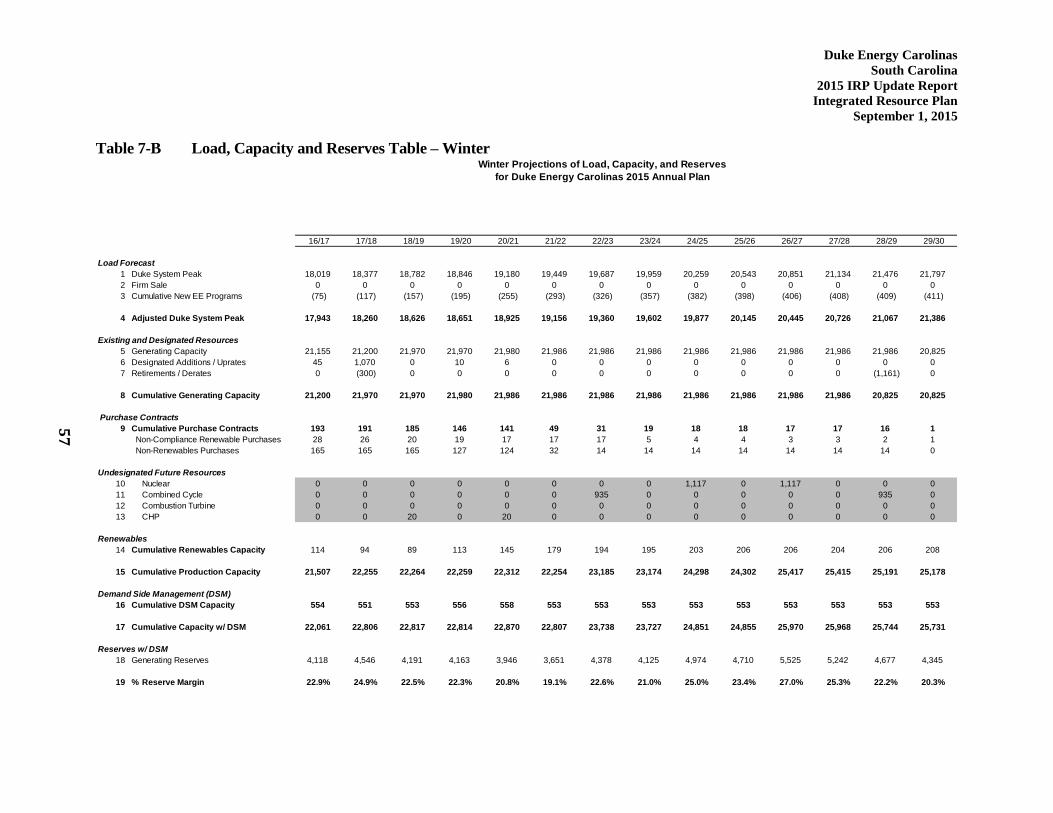
Duke Energy Carolinas
South Carolina
2015 IRP Update Report
Integrated Resource Plan
September 1, 2015
Table 7-B Load, Capacity and Reserves Table – Winter Winter Projections of Load, Capacity, and Reserves
for Duke Energy Carolinas 2015 Annual Plan
16/17 17/18 18/19 19/20 20/21 21/22 22/23 23/24 24/25 25/26 26/27 27/28 28/29 29/30
Load Forecast
1 Duke System Peak 18,019 18,377 18,782 18,846 19,180 19,449 19,687 19,959 20,259 20,543 20,851 21,134 21,476 21,797
2 Firm Sale 0 0 0 0 0 0 0 0 0 0 0 0 0 0
3 Cumulative New EE Programs (75) (117) (157) (195) (255) (293) (326) (357) (382) (398) (406) (408) (409) (411)
4 Adjusted Duke System Peak 17,943 18,260 18,626 18,651 18,925 19,156 19,360 19,602 19,877 20,145 20,445 20,726 21,067 21,386
Existing and Designated Resources
5 Generating Capacity 21,155 21,200 21,970 21,970 21,980 21,986 21,986 21,986 21,986 21,986 21,986 21,986 21,986 20,825
6 Designated Additions / Uprates 45 1,070 0 10 6 0 0 0 0 0 0 0 0 0
7 Retirements / Derates 0 (300) 0 0 0 0 0 0 0 0 0 0 (1,161) 0
8 Cumulative Generating Capacity 21,200 21,970 21,970 21,980 21,986 21,986 21,986 21,986 21,986 21,986 21,986 21,986 20,825 20,825
Purchase Contracts
9 Cumulative Purchase Contracts 193 191 185 146 141 49 31 19 18 18 17 17 16 1
Non-Compliance Renewable Purchases 28 26 20 19 17 17 17 5 4 4 3 3 2 1
Non-Renewables Purchases 165 165 165 127 124 32 14 14 14 14 14 14 14 0
Undesignated Future Resources
10 Nuclear 0 0 0 0 0 0 0 0 1,117 0 1,117 0 0 0
11 Combined Cycle 0 0 0 0 0 0 935 0 0 0 0 0 935 0
12 Combustion Turbine 0 0 0 0 0 0 0 0 0 0 0 0 0 0
13 CHP 0 0 20 0 20 0 0 0 0 0 0 0 0 0
Renewables
14 Cumulative Renewables Capacity 114 94 89 113 145 179 194 195 203 206 206 204 206 208
15 Cumulative Production Capacity 21,507 22,255 22,264 22,259 22,312 22,254 23,185 23,174 24,298 24,302 25,417 25,415 25,191 25,178
Demand Side Management (DSM)
16 Cumulative DSM Capacity 554 551 553 556 558 553 553 553 553 553 553 553 553 553
17 Cumulative Capacity w/ DSM 22,061 22,806 22,817 22,814 22,870 22,807 23,738 23,727 24,851 24,855 25,970 25,968 25,744 25,731
Reserves w/ DSM
18 Generating Reserves 4,118 4,546 4,191 4,163 3,946 3,651 4,378 4,125 4,974 4,710 5,525 5,242 4,677 4,345
19 % Reserve Margin 22.9% 24.9% 22.5% 22.3% 20.8% 19.1% 22.6% 21.0% 25.0% 23.4% 27.0% 25.3% 22.2% 20.3%
57
Duke Energy Carolinas
South Carolina
2015 IRP Update Report
Integrated Resource Plan
September 1, 2015
58
DEC - Assumptions of Load, Capacity, and Reserves Table
The following notes are numbered to match the line numbers on the Summer Projections of Load,
Capacity, and Reserves tables. All values are MW except where shown as a Percent.
1. Planning is done for the peak demand for the Duke System including Nantahala.
A firm wholesale backstand agreement for 47 MW between Duke Energy Carolinas and PMPA
starts on 1/1/2014 and continues through the end of 2020. This backstand is included in Line 1.
2. No additional firm sales are included.
3. Cumulative new energy efficiency and conservation programs (does not include demand
response programs).
4. Peak load adjusted for firm sales and cumulative energy efficiency.
5. Existing generating capacity reflecting designated additions, planned uprates, retirements and
derates as of January 2015.
Includes 101 MW Nantahala hydro capacity, and total capacity for Catawba Nuclear Station less
832 MW to account for NCMPA1 firm capacity sale.
6. A short-term 300 MW PPA is included in 2017, and removed in the fall of 2017.
This PPA is a placeholder to ensure compliance with the minimum planning reserve margin and
will be re-evaluated in the coming months.
Lee Combined Cycle is reflected in 2018 (670 MW). This is the DEC capacity net of 100 MW
to be owned by NCEMC.
Capacity Additions include Duke Energy Carolinas hydro units scheduled to be repaired and
returned to service. The units are returned to service in the 2016-2020 timeframe and total 17
MW.
Also included is a 65 MW capacity increase due to nuclear uprates at Catawba, McGuire, and
Oconee. Timing of these uprates is shown from 2016-2017.
7. The short-term 300 MW PPA is removed in the fall of 2017.
A planning assumption for coal retirements has been included in the 2015 IRP.
Allen Steam Station (1127 MW) is assumed to retire in 2028.
Duke Energy Carolinas
South Carolina
2015 IRP Update Report
Integrated Resource Plan
September 1, 2015
59
DEC - Assumptions of Load, Capacity, and Reserves Table (cont.)
Nuclear Stations are assumed to retire at the end of their current license extension.
No nuclear facilities are assumed to retire in the 15 year study period.
The Hydro facilities for which Duke has submitted an application to FERC for license renewal
are assumed to continue operation through the planning horizon.
All retirement dates are subject to review on an ongoing basis.
8. Sum of lines 5 through 7.
9. Cumulative Purchase Contracts including purchased capacity from PURPA Qualifying
Facilities, an 86 MW Cherokee County Cogeneration Partners contract which began in June
1998 and expires June 2020 and miscellaneous other QF projects.
Additional line items are shown under the total line item to show the amounts of renewable and
traditional QF purchases.
Renewables in these line items are not used for NC REPS compliance.
10. New nuclear resources economically selected to meet load and minimum planning reserve
margin.
Capacity must be on-line by June 1 to be included in available capacity for the summer peak of
that year and by December 1 to be included in available capacity for the winter peak of that
year.
Addition of 1,117 MW Lee Nuclear Unit additions in 2024 and 2026.
11. New combined cycle resources economically selected to meet load and minimum planning
reserve margin.
Capacity must be on-line by June 1 to be included in available capacity for the summer peak of
that year and by December 1 to be included in available capacity for the winter peak of that
year.
Addition of 895 MW of combined cycle capacity in 2022, 2028 and 2030.
12. New combustion turbine resources economically selected to meet load and minimum planning
reserve margin.
Duke Energy Carolinas
South Carolina
2015 IRP Update Report
Integrated Resource Plan
September 1, 2015
60
DEC - Assumptions of Load, Capacity, and Reserves Table (cont.)
Capacity must be on-line by June 1 to be included in available capacity for the summer peak of
that year and by December 1 to be included in available capacity for the winter peak of that
year.
No combustion turbine resources were selected in the Base Case.
13. New 20 MW combined heat and power units included in 2018 and 2020. The 2015 IRP
represents the first time that CHP resources have been included in the IRP.
14. Cumulative solar, biomass, hydro and wind resources to meet NC REPS and SC DERP
compliance.
Also includes Green Source solar projects.
15. Sum of lines 8 through 14.
16. Cumulative Demand Response programs including load control and DSDR.
17. Sum of lines 15 and 16.
18. The difference between lines 17 and 4.
19. Reserve Margin = (Cumulative Capacity-System Peak Demand)/System Peak Demand
Line 18 divided by Line 4.
Minimum target planning reserve margin is 17%.
Duke Energy Carolinas
South Carolina
2015 IRP Update Report
Integrated Resource Plan
September 1, 2015
61
Technologies Considered:
Similar to the 2014 IRP, the Company considered a diverse range of technology choices utilizing a
variety of different fuels in order to meet future generation needs in the 2015 IRP.
As in the 2014 IRP, the Company conducted an economic screening analysis of various
technologies. Through the screening process the following technologies were considered as part of
the more detailed quantitative analysis phase of the planning process in the 2015 IRP, with changes
from the 2014 IRP highlighted and explained in further detail below.
• Base load – 723 MW Supercritical Pulverized Coal with CCS
• Base load – 525 MW IGCC with CCS
• Base load – 2 x 1,117 MW Nuclear units (AP1000)
• Base load – 895 MW – 2x2x1 Advanced Combined Cycle (Inlet Chiller and Duct Fired)
• Base load – 20 MW – CHP (CT with HRSG)
• Peaking/Intermediate – 828 MW 4-7FA CTs
• Renewable – 150 MW Wind - On-Shore
• Renewable – 5 MW Landfill Gas
• Renewable – 25 MW Solar Photovoltaic (PV)
Combined Cycle base capacities and technologies: Based on proprietary third party engineering
studies, the 2x2x1 Advanced CC saw an increase in base load of 29 MWs. The older version base
2x1 CC and the 3x1 Advanced CC were not considered in the updated IRP. However, as the
Company begins the process of evaluating particular technologies for future undesignated
generation needs, these technologies, along with other new technologies, may be considered based
on factors such as generation requirements, plot size, new environmental regulations, etc.
Combustion Turbine base capacities and technologies: Based on proprietary third party
engineering studies, the F-Frame CT technology saw an increase in base load of 36 MWs. The
LM6000 CTs were not considered in the updated IRP. However, as the Company begins the
process of evaluating particular technologies for future undesignated generation needs, these
technologies, along with other new technologies, may be considered based on factors such as
generation requirements, plot size, new environmental regulations, etc.
CHP: As mentioned previously, two 20-MW Combined Heat & Power units are considered in the
2015 IRPs and are included as resources for meeting future generation needs. Duke Energy is
exploring and working with potential customers with good base thermal loads on a regulated CHP
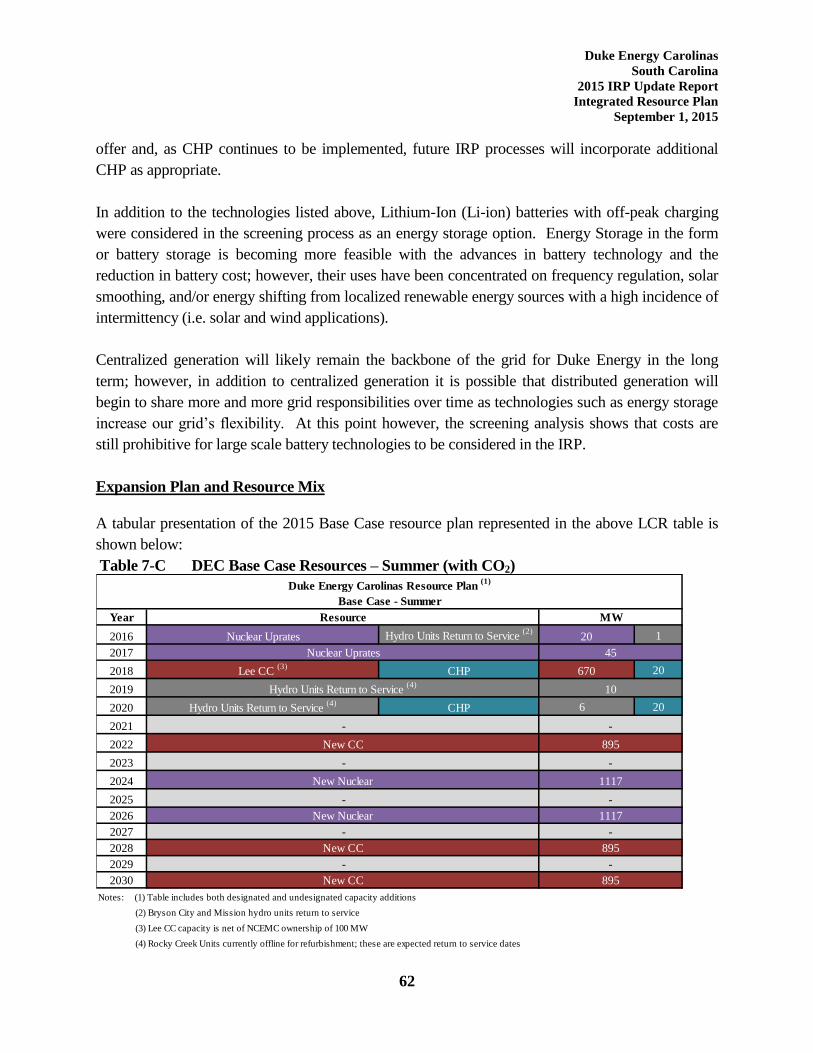
Duke Energy Carolinas
South Carolina
2015 IRP Update Report
Integrated Resource Plan
September 1, 2015
62
offer and, as CHP continues to be implemented, future IRP processes will incorporate additional
CHP as appropriate.
In addition to the technologies listed above, Lithium-Ion (Li-ion) batteries with off-peak charging
were considered in the screening process as an energy storage option. Energy Storage in the form
or battery storage is becoming more feasible with the advances in battery technology and the
reduction in battery cost; however, their uses have been concentrated on frequency regulation, solar
smoothing, and/or energy shifting from localized renewable energy sources with a high incidence of
intermittency (i.e. solar and wind applications).
Centralized generation will likely remain the backbone of the grid for Duke Energy in the long
term; however, in addition to centralized generation it is possible that distributed generation will
begin to share more and more grid responsibilities over time as technologies such as energy storage
increase our grid’s flexibility. At this point however, the screening analysis shows that costs are
still prohibitive for large scale battery technologies to be considered in the IRP.
Expansion Plan and Resource Mix
A tabular presentation of the 2015 Base Case resource plan represented in the above LCR table is
shown below:
Table 7-C DEC Base Case Resources – Summer (with CO2)
Year
2016 Hydro Units Return to Service (2)
1
2017
2018 CHP 20
2019
2020 CHP 6 20
2021
2022
2023
2024
2025
2026
2027
2028
2029
2030
Notes: (1) Table includes both designated and undesignated capacity additions
(2) Bryson City and Mission hydro units return to service
(3) Lee CC capacity is net of NCEMC ownership of 100 MW
(4) Rocky Creek Units currently offline for refurbishment; these are expected return to service dates
New CC 895
-
-
895
-
New CC
-
MW
20
Base Case - Summer
Hydro Units Return to Service (4)
Lee CC (3)
670
Nuclear Uprates
Resource
Duke Energy Carolinas Resource Plan (1)
45
Nuclear Uprates
-
New Nuclear
Hydro Units Return to Service (4)
-
10
-
-
1117
New CC
-
New Nuclear
895
-
1117
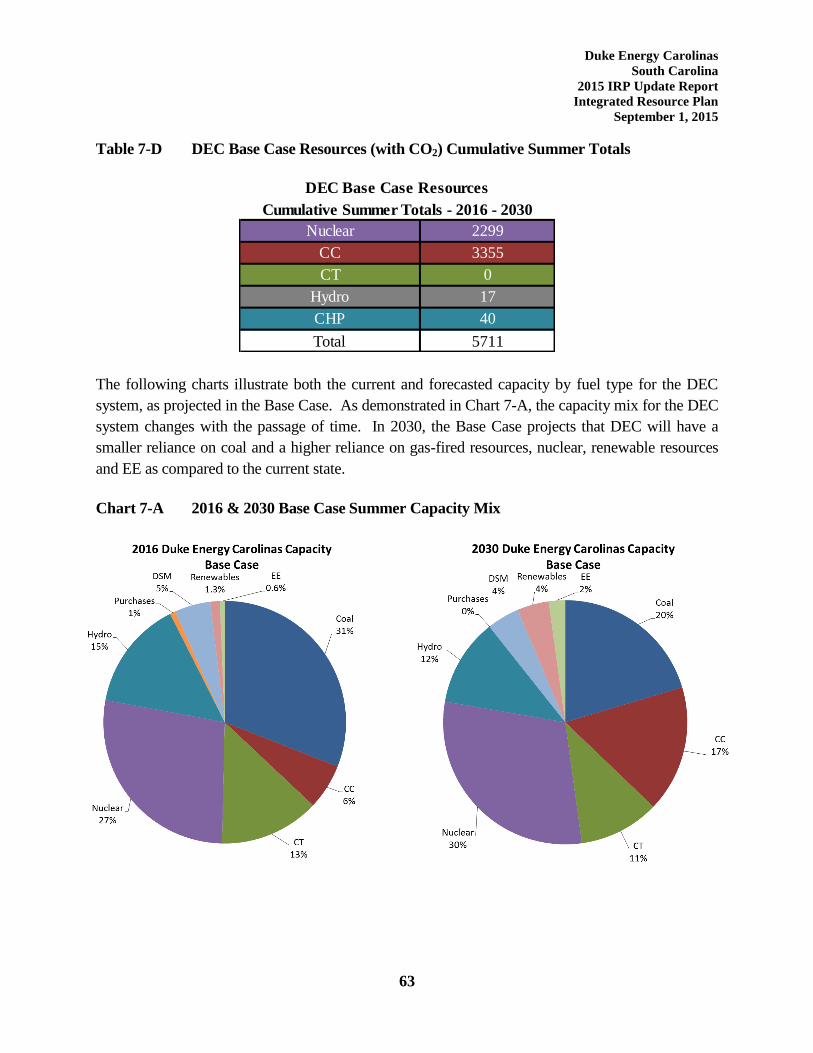
Duke Energy Carolinas
South Carolina
2015 IRP Update Report
Integrated Resource Plan
September 1, 2015
63
Table 7-D DEC Base Case Resources (with CO2) Cumulative Summer Totals
The following charts illustrate both the current and forecasted capacity by fuel type for the DEC
system, as projected in the Base Case. As demonstrated in Chart 7-A, the capacity mix for the DEC
system changes with the passage of time. In 2030, the Base Case projects that DEC will have a
smaller reliance on coal and a higher reliance on gas-fired resources, nuclear, renewable resources
and EE as compared to the current state.
Chart 7-A 2016 & 2030 Base Case Summer Capacity Mix
Nuclear 2299
CC 3355
CT 0
Hydro 17
CHP 40
Total 5711
Cumulative Summer Totals - 2016 - 2030
DEC Base Case Resources
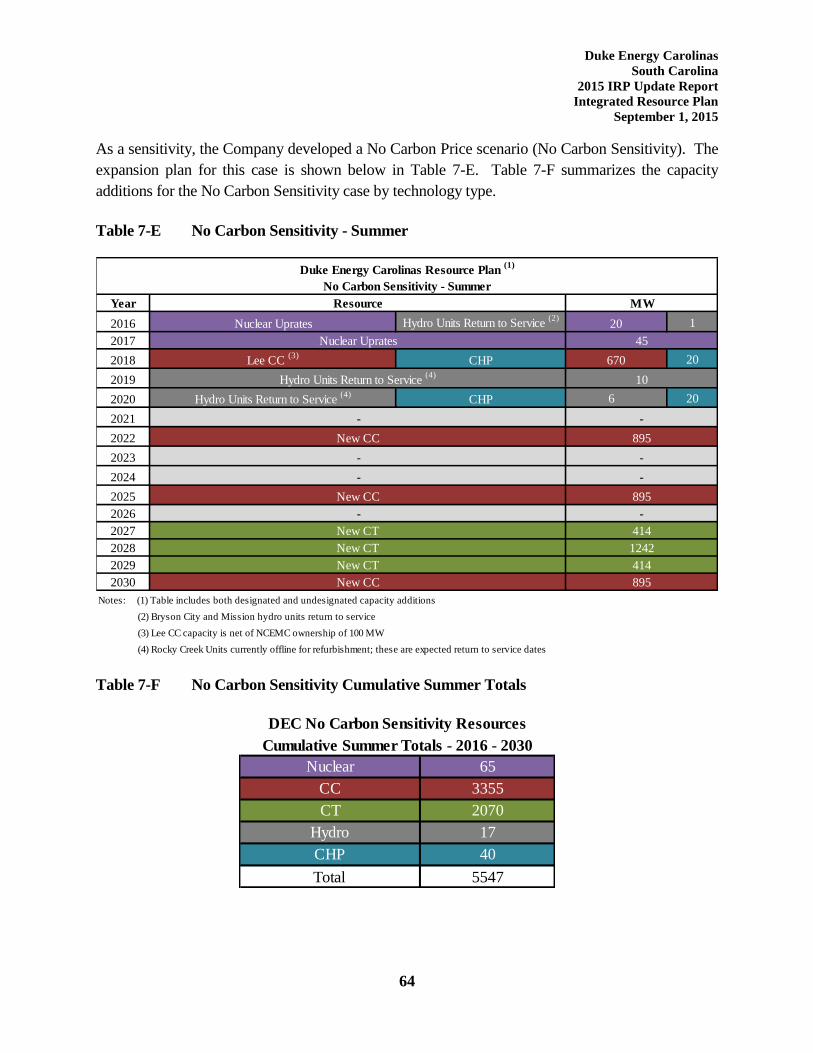
Duke Energy Carolinas
South Carolina
2015 IRP Update Report
Integrated Resource Plan
September 1, 2015
64
As a sensitivity, the Company developed a No Carbon Price scenario (No Carbon Sensitivity). The
expansion plan for this case is shown below in Table 7-E. Table 7-F summarizes the capacity
additions for the No Carbon Sensitivity case by technology type.
Table 7-E No Carbon Sensitivity - Summer
Table 7-F No Carbon Sensitivity Cumulative Summer Totals
Year
2016 Hydro Units Return to Service (2)
1
2017
2018 CHP 20
2019
2020 CHP 6 20
2021
2022
2023
2024
2025
2026
2027
2028
2029
2030
Notes: (1) Table includes both designated and undesignated capacity additions
(2) Bryson City and Mission hydro units return to service
(3) Lee CC capacity is net of NCEMC ownership of 100 MW
(4) Rocky Creek Units currently offline for refurbishment; these are expected return to service dates
Duke Energy Carolinas Resource Plan (1)
Resource MW
Hydro Units Return to Service (4)
- -
New CC
No Carbon Sensitivity - Summer
Hydro Units Return to Service (4)
10
Nuclear Uprates 20
Nuclear Uprates 45
Lee CC (3)
670
895
- -
- -
New CC 895
-
New CT 414
New CC 895
New CT 1242
New CT 414
-
Nuclear 65
CC 3355
CT 2070
Hydro 17
CHP 40
Total 5547
DEC No Carbon Sensitivity Resources
Cumulative Summer Totals - 2016 - 2030
Duke Energy Carolinas
South Carolina
2015 IRP Update Report
Integrated Resource Plan
September 1, 2015
65
8. SHORT-TERM ACTION PLAN:
The Company’s Short-Term Action Plan, which identifies accomplishments in the past year and
actions to be taken over the next five years, is summarized below:
Continued Reliance on EE and DSM Resources:
The Company is committed to continuing to grow the amount of EE and DSM resources utilized to
meet customer growth. The following are the ways in which DEC will increase these resources:
Continue to execute the Company’s EE and DSM plan, which includes a diverse portfolio
of EE and DSM programs spanning the residential, commercial and industrial classes.
Continue on-going collaborative work to develop and implement additional cost-effective
EE and DSM products and services.
Continue to seek enhancements to the Company’s EE/DSM portfolio by: (1) adding new
or expanding existing programs to include additional measures, (2) modifying programs
to account for changing market conditions and new measurement and verification (M&V)
results and (3) considering other EE research and development pilots.
Over the 5 year period represented by the Short-Term Action Plan, DEC projects to add an
incremental 241 MW of EE, and 95 MW of DSM.
Continued Focus on Renewable Energy Resources:
DEC is committed to full compliance with SC DERP in South Carolina and NC REPS in
North Carolina. Due to pending expiries of Federal and State tax subsidies for solar
development, the Company has experienced a substantial increase in solar QFs in the
interconnection queue. With this significant level of interest in solar development, DEC
continues to procure renewable purchase power resources, when economically viable, as
part of its Compliance Plans. DEC is also pursuing the addition of new utility-owned solar
on the DEC system.
DEC continues to evaluate market options for renewable generation and procure capacity, as
appropriate. PPAs have been signed with developers of solar PV and landfill gas resources.
Additionally, REC purchase agreements have been executed for purchases of unbundled
RECs from wind, solar PV, solar thermal and hydroelectric facilities.
Duke Energy Carolinas
South Carolina
2015 IRP Update Report
Integrated Resource Plan
September 1, 2015
66
In the 2015 IRP, over the 5 year period represented by the Short-Term Action Plan, DEC
projects to add an incremental 1,093 MW of renewable resources (nameplate).
DEC continues to pursue CHP opportunities, as appropriate.
Continue to Pursue New Nuclear:
Duke Energy Carolinas sees significant value in new nuclear generation. Today, nuclear and gas
generation are effectively the only base load electrical generating options available for construction,
and new nuclear generation is the only carbon-free, base load generation option available. Coupling
that situation with Duke Energy’s long term aspiration to reduce carbon dioxide emissions and the
EPA’s recently released Clean Power Plan, that value is patently evident. Furthermore, Oconee
Nuclear Station's operating licenses expire in 2033-2034. The NRC is expected to finalize its
guidance for Second License Renewal (SLR) in mid-2017. The Company believes Oconee Nuclear
Station is an excellent candidate for SLR; however before a decision is made the scope, cost and
complexity of required modifications, upgrades, and other improvements need to be fully
understood and evaluated once the NRC issues its SLR guidance.
Duke Energy continues the work necessary to obtain combined construction and operating licenses
(COLs) for the William States Lee III Nuclear Station (Lee Nuclear). The Lee COL application
references and incorporates the Westinghouse AP1000 NRC certified design. As that design is
refined and modified through Westinghouse’s design finalization activities and construction of
AP1000 units in China and the United States, a handful of issues have arisen that must be resolved
by the Nuclear Regulatory Commission (NRC) prior to issuance of the Lee COL. Assuming no
new significant issues are identified, issuance of the COL is expected by late 2016.
Given the long cycle times to license and build a new nuclear electric generation station, it is
essential to continue the licensing work on Lee Nuclear as a hedge against extensive carbon dioxide
regulation, uncertain load growth, volatile fuel prices, and the possibility of not relicensing the
existing operating nuclear stations.
Addition of Clean Natural Gas Resources:
Continue construction of the Lee combined cycle plant (Lee CC) at the Lee Steam Station
site located in Anderson, SC. As demonstrated in recent IRP plans, a capacity need was
identified in 2017/2018 to allow DEC to meet its customers’ load demands. The Company
received a Certificate of Environmental Compatibility and Public Convenience and Necessity
(CECPCN) in an order dated May 2, 2014, to move forward with the construction of the Lee
Duke Energy Carolinas
South Carolina
2015 IRP Update Report
Integrated Resource Plan
September 1, 2015
67
CC. For the Lee CC project, site clearing and grubbing is complete and the project site is to
grade. The engineering phase is approximately 50% complete through the end of June and
the first foundation is planned to be placed by mid-August.
Operate Lee Steam Station Unit 3 as a natural gas-fired unit. Lee Unit 3 was successfully
converted to a natural gas-fired facility. This conversion was completed in April 2015. The
unit was available for the summer peak of 2015.
Expiration of Wholesale Sales Contracts: (CONFIDENTIAL)
In the 2016-2020 timeframe, DEC has 255 MW of wholesale sales contracts that are scheduled
to expire. At this time, DEC is not relying on contract extensions for these contracts. As such,
these contract expirations are included in the IRP and Short-Term Action Plan. A summary of
those expirations is shown in Table 8-A below. In addition to the expirations shown in this five
year period, additional contracts expire during the 15 year IRP study period.
Table 8-A Wholesale Sales Contracts Expiration (CONFIDENTIAL)
DEC
Wholesale Sales Contract
Expirations
2016 -
2017 -
2018 -
2019
255 MW
(Concord - 174 MW;
Kings Mountain - 22 MW)
Greenwood - 59 MW)
2020 -
Total 255 MW
Duke Energy Carolinas
South Carolina
2015 IRP Update Report
Integrated Resource Plan
September 1, 2015
68
Expiration of Wholesale Purchase Contracts: (CONFIDENTIAL)
In the 2016-2020 timeframe, DEC has 41 MW of wholesale purchases that are scheduled to
expire. At this time, DEC is not relying on contract extensions on these contracts. As such,
these contract expirations are included in the IRP and Short-Term Action Plan. A summary of
those expirations is shown in Table 8-B below. In addition to the expirations shown in this five
year period, additional contracts expire during the 15 year IRP study period.
Table 8-B Wholesale Purchase Contract Expirations: (CONFIDENTIAL)
DEC
Purchase Contract Expirations
2016 -
2017 -
2018 -
2019 38 MW
(Concord - 29 MW;
Kings Mountain - 9.5 MW)
2020 3 MW
(CP&L)
Total 41 MW
Continued Focus on System Reliability and Resource Adequacy for DEC System:
As previously stated, DEC has retained Astrape Consulting to conduct a reserve margin study to
examine the resource adequacy of the DEC system. Based upon the recent extreme winter weather,
the potential for continued extreme weather, and the large amount of expected summer-only
resource additions, the Company felt that new examination of the reliability of the system and the
adequacy of the resources was warranted.
Initial results of this updated study indicate that a 17% summer planning reserve margin is required
to maintain the one day in 10 year LOLE. As such, DEC has utilized a 17% planning reserve
margin in the 2015 IRP as opposed to the 14.5% reserve margin used in the 2014 IRP. However,
preliminary findings also indicate that a summer-only reserve margin target may not be adequate for
providing long term reliability given the increasing levels of summer-only resources. Additional
study is needed to determine whether dual summer/winter planning reserve margin targets are
required in the future. Once the final results are determined, any changes will be included in the
2016 IRP.
Duke Energy Carolinas
South Carolina
2015 IRP Update Report
Integrated Resource Plan
September 1, 2015
69
The 2015 IRP includes a placeholder for a short-term 300 MW purchased power agreement (PPA)
in the summer of 2017 to satisfy the increase in the planning reserve margin to 17%. The need for
this short-term PPA will be reevaluated after the reserve margin study is completed and there is
greater certainty regarding reserve margin target(s), load and resource needs.
Continued Focus on Regulatory, Environmental Compliance & Wholesale Activities:
Retire older coal generation. As of April 2015, Duke Energy Carolinas has no remaining
older, un-scrubbed coal units in operation. The Company has retired approximately 1,700
MW of un-scrubbed, older coal units.
Continue to be on target for compliance with the Cliffside 6 Air Quality Permit Plan by 2018:
o Completed retirement of Buck, Riverbend, Dan River and Lee coal units.
o Completed Bridgewater hydro units capacity increase.
o EE, DSM, renewable energy, and nuclear uprates currently achieved combined
with future projections continue to exceed the total annual required emission
reduction by 2018.
o Updated projected emission reductions based on the 2015 IRP are 9,298,091 tons
of CO2 equivalent emissions.
Continue to prepare for the final rule of EPA’s Clean Power Plan.
Continue to investigate the future environmental control requirements and resulting operational
impacts associated with existing and potential environmental regulations such as MATS, the
Coal Combustion Residuals rule, the Cross-State Air Pollution Rule (CSAPR), and the new
ozone National Ambient Air Quality Standard (NAAQS).
Aggressively pursue compliance in South Carolina and North Carolina in addressing coal ash
management and ash pond remediation. Ensure timely compliance plans and their associated
costs are contemplated within the planning process and future integrated resource plans, as
appropriate.
Continue to pursue existing and potential opportunities for wholesale power sales agreements
within the Duke Energy balancing authority area.
Duke Energy Carolinas
South Carolina
2015 IRP Update Report
Integrated Resource Plan
September 1, 2015
70
Continue to monitor energy-related statutory and regulatory activities.
Continue to examine the benefits of joint capacity planning and pursue appropriate regulatory
actions.
A summarization of the capacity resources for the Base Case in the 2015 IRP is shown in Table
8-C below. Capacity retirements and additions are presented as incremental values in the year in
which the change is projected to occur. The values shown for renewable resources, EE and DSM
represent cumulative totals.
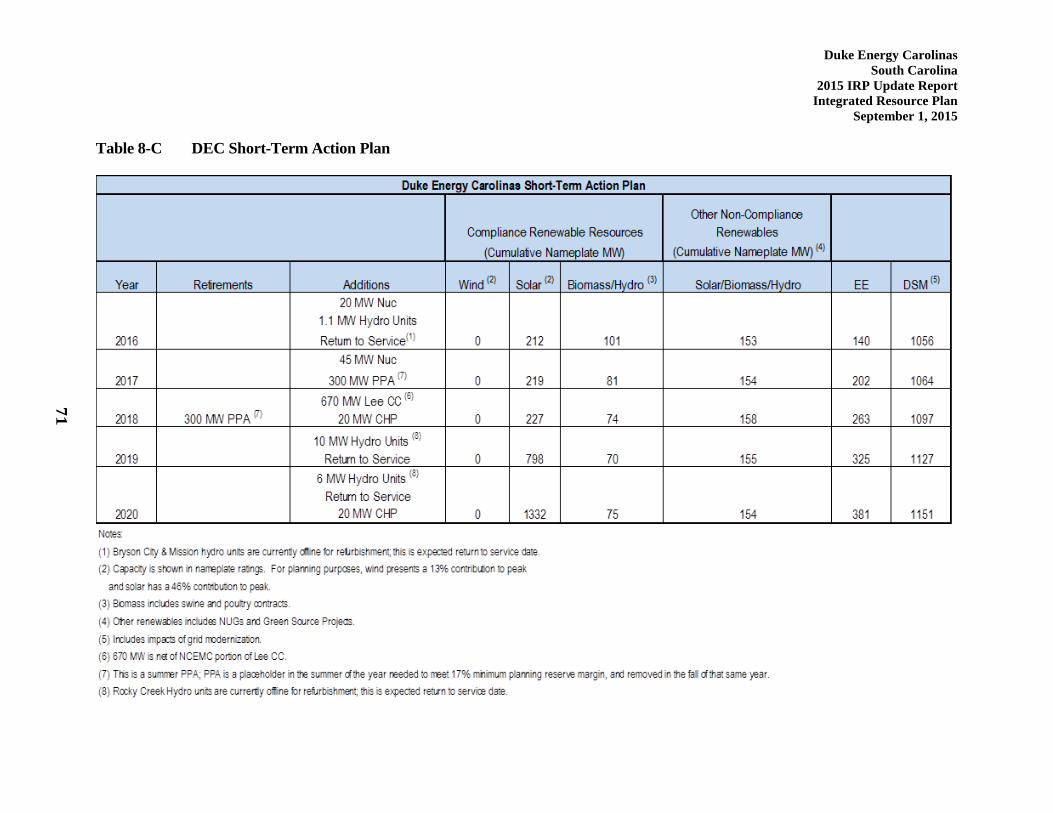
Duke Energy Carolinas
South Carolina
2015 IRP Update Report
Integrated Resource Plan
September 1, 2015
Table 8-C DEC Short-Term Action Plan
71
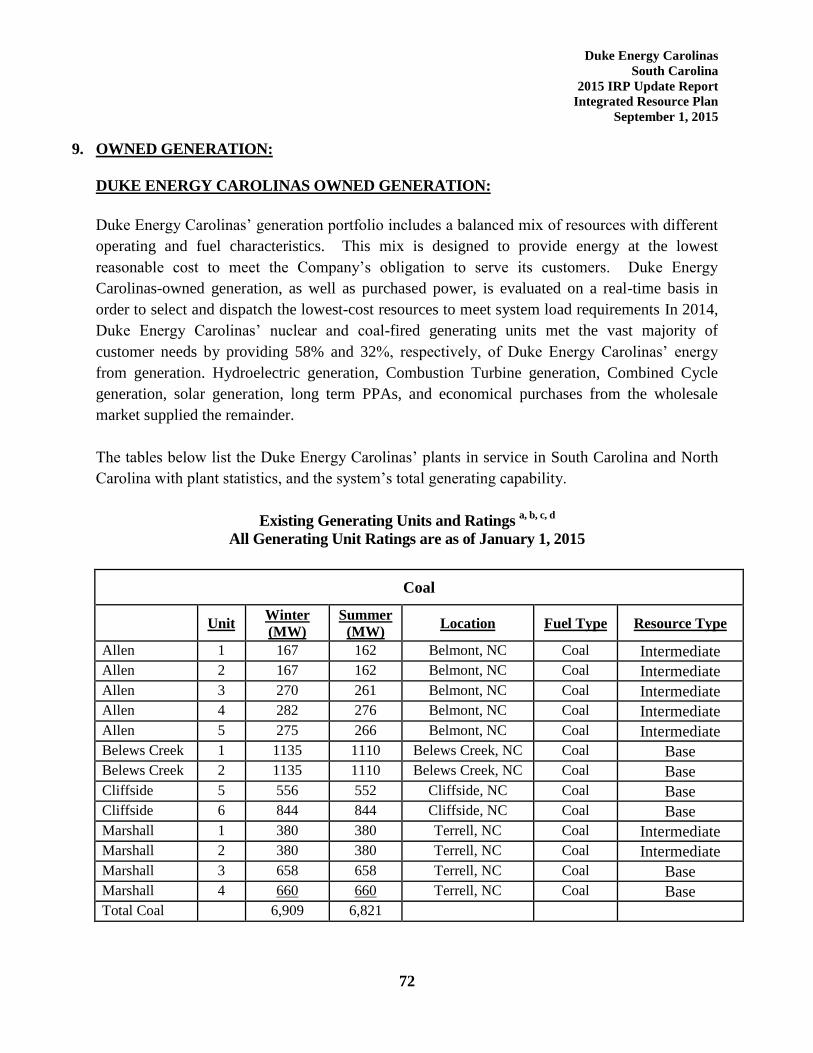
Duke Energy Carolinas
South Carolina
2015 IRP Update Report
Integrated Resource Plan
September 1, 2015
72
9. OWNED GENERATION:
DUKE ENERGY CAROLINAS OWNED GENERATION:
Duke Energy Carolinas’ generation portfolio includes a balanced mix of resources with different
operating and fuel characteristics. This mix is designed to provide energy at the lowest
reasonable cost to meet the Company’s obligation to serve its customers. Duke Energy
Carolinas-owned generation, as well as purchased power, is evaluated on a real-time basis in
order to select and dispatch the lowest-cost resources to meet system load requirements In 2014,
Duke Energy Carolinas’ nuclear and coal-fired generating units met the vast majority of
customer needs by providing 58% and 32%, respectively, of Duke Energy Carolinas’ energy
from generation. Hydroelectric generation, Combustion Turbine generation, Combined Cycle
generation, solar generation, long term PPAs, and economical purchases from the wholesale
market supplied the remainder.
The tables below list the Duke Energy Carolinas’ plants in service in South Carolina and North
Carolina with plant statistics, and the system’s total generating capability.
Existing Generating Units and Ratings a, b, c, d
All Generating Unit Ratings are as of January 1, 2015
Coal
Unit
Winter
(MW)
Summer
(MW) Location Fuel Type Resource Type
Allen 1 167 162 Belmont, NC Coal Intermediate
Allen 2 167 162 Belmont, NC Coal Intermediate
Allen 3 270 261 Belmont, NC Coal Intermediate
Allen 4 282 276 Belmont, NC Coal Intermediate
Allen 5 275 266 Belmont, NC Coal Intermediate
Belews Creek 1 1135 1110 Belews Creek, NC Coal Base
Belews Creek 2 1135 1110 Belews Creek, NC Coal Base
Cliffside 5 556 552 Cliffside, NC Coal Base
Cliffside 6 844 844 Cliffside, NC Coal Base
Marshall 1 380 380 Terrell, NC Coal Intermediate
Marshall 2 380 380 Terrell, NC Coal Intermediate
Marshall 3 658 658 Terrell, NC Coal Base
Marshall 4 660 660 Terrell, NC Coal Base
Total Coal 6,909 6,821
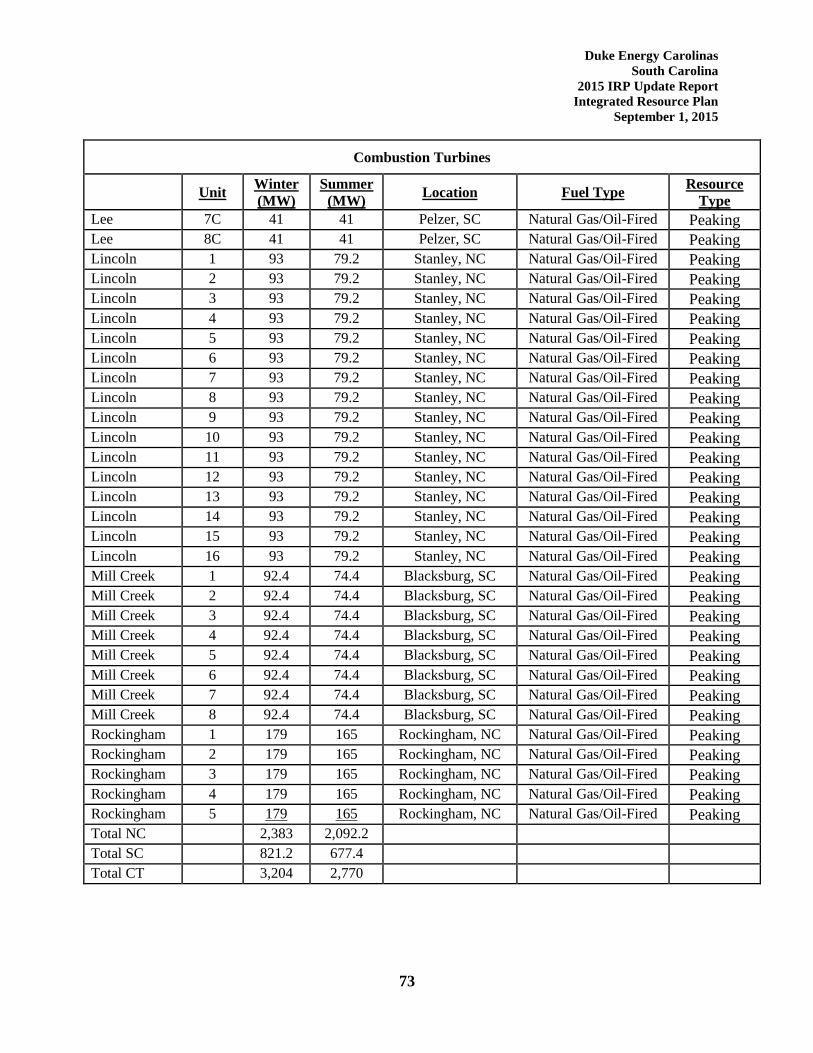
Duke Energy Carolinas
South Carolina
2015 IRP Update Report
Integrated Resource Plan
September 1, 2015
73
Combustion Turbines
Unit
Winter
(MW)
Summer
(MW) Location Fuel Type
Resource
Type
Lee 7C 41 41 Pelzer, SC Natural Gas/Oil-Fired Peaking
Lee 8C 41 41 Pelzer, SC Natural Gas/Oil-Fired Peaking
Lincoln 1 93 79.2 Stanley, NC Natural Gas/Oil-Fired Peaking
Lincoln 2 93 79.2 Stanley, NC Natural Gas/Oil-Fired Peaking
Lincoln 3 93 79.2 Stanley, NC Natural Gas/Oil-Fired Peaking
Lincoln 4 93 79.2 Stanley, NC Natural Gas/Oil-Fired Peaking
Lincoln 5 93 79.2 Stanley, NC Natural Gas/Oil-Fired Peaking
Lincoln 6 93 79.2 Stanley, NC Natural Gas/Oil-Fired Peaking
Lincoln 7 93 79.2 Stanley, NC Natural Gas/Oil-Fired Peaking
Lincoln 8 93 79.2 Stanley, NC Natural Gas/Oil-Fired Peaking
Lincoln 9 93 79.2 Stanley, NC Natural Gas/Oil-Fired Peaking
Lincoln 10 93 79.2 Stanley, NC Natural Gas/Oil-Fired Peaking
Lincoln 11 93 79.2 Stanley, NC Natural Gas/Oil-Fired Peaking
Lincoln 12 93 79.2 Stanley, NC Natural Gas/Oil-Fired Peaking
Lincoln 13 93 79.2 Stanley, NC Natural Gas/Oil-Fired Peaking
Lincoln 14 93 79.2 Stanley, NC Natural Gas/Oil-Fired Peaking
Lincoln 15 93 79.2 Stanley, NC Natural Gas/Oil-Fired Peaking
Lincoln 16 93 79.2 Stanley, NC Natural Gas/Oil-Fired Peaking
Mill Creek 1 92.4 74.4 Blacksburg, SC Natural Gas/Oil-Fired Peaking
Mill Creek 2 92.4 74.4 Blacksburg, SC Natural Gas/Oil-Fired Peaking
Mill Creek 3 92.4 74.4 Blacksburg, SC Natural Gas/Oil-Fired Peaking
Mill Creek 4 92.4 74.4 Blacksburg, SC Natural Gas/Oil-Fired Peaking
Mill Creek 5 92.4 74.4 Blacksburg, SC Natural Gas/Oil-Fired Peaking
Mill Creek 6 92.4 74.4 Blacksburg, SC Natural Gas/Oil-Fired Peaking
Mill Creek 7 92.4 74.4 Blacksburg, SC Natural Gas/Oil-Fired Peaking
Mill Creek 8 92.4 74.4 Blacksburg, SC Natural Gas/Oil-Fired Peaking
Rockingham 1 179 165 Rockingham, NC Natural Gas/Oil-Fired Peaking
Rockingham 2 179 165 Rockingham, NC Natural Gas/Oil-Fired Peaking
Rockingham 3 179 165 Rockingham, NC Natural Gas/Oil-Fired Peaking
Rockingham 4 179 165 Rockingham, NC Natural Gas/Oil-Fired Peaking
Rockingham 5 179 165 Rockingham, NC Natural Gas/Oil-Fired Peaking
Total NC 2,383 2,092.2
Total SC 821.2 677.4
Total CT 3,204 2,770
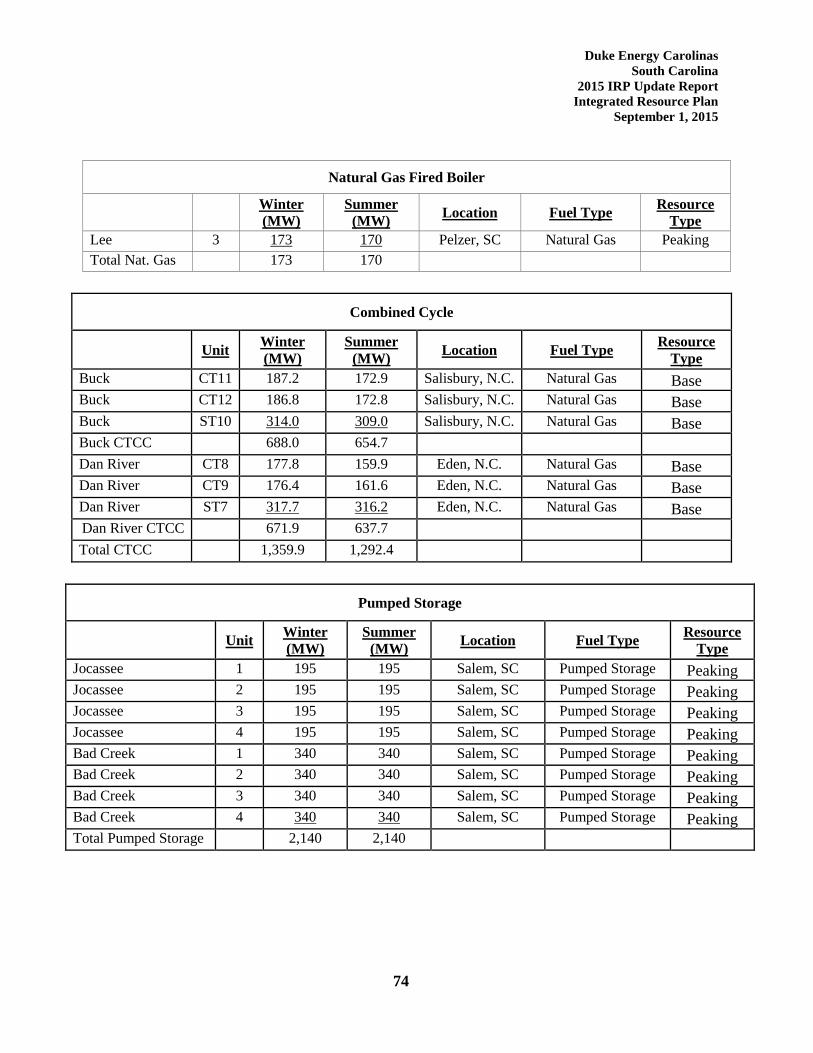
Duke Energy Carolinas
South Carolina
2015 IRP Update Report
Integrated Resource Plan
September 1, 2015
74
Natural Gas Fired Boiler
Winter
(MW)
Summer
(MW) Location Fuel Type
Resource
Type
Lee 3 173 170 Pelzer, SC Natural Gas Peaking
Total Nat. Gas 173 170
Combined Cycle
Unit
Winter
(MW)
Summer
(MW) Location Fuel Type
Resource
Type
Buck CT11 187.2 172.9 Salisbury, N.C. Natural Gas Base
Buck CT12 186.8 172.8 Salisbury, N.C. Natural Gas Base
Buck ST10 314.0 309.0 Salisbury, N.C. Natural Gas Base
Buck CTCC 688.0 654.7
Dan River CT8 177.8 159.9 Eden, N.C. Natural Gas Base
Dan River CT9 176.4 161.6 Eden, N.C. Natural Gas Base
Dan River ST7 317.7 316.2 Eden, N.C. Natural Gas Base
Dan River CTCC 671.9 637.7
Total CTCC 1,359.9 1,292.4
Pumped Storage
Unit
Winter
(MW)
Summer
(MW) Location Fuel Type
Resource
Type
Jocassee 1 195 195 Salem, SC Pumped Storage Peaking
Jocassee 2 195 195 Salem, SC Pumped Storage Peaking
Jocassee 3 195 195 Salem, SC Pumped Storage Peaking
Jocassee 4 195 195 Salem, SC Pumped Storage Peaking
Bad Creek 1 340 340 Salem, SC Pumped Storage Peaking
Bad Creek 2 340 340 Salem, SC Pumped Storage Peaking
Bad Creek 3 340 340 Salem, SC Pumped Storage Peaking
Bad Creek 4 340 340 Salem, SC Pumped Storage Peaking
Total Pumped Storage 2,140 2,140
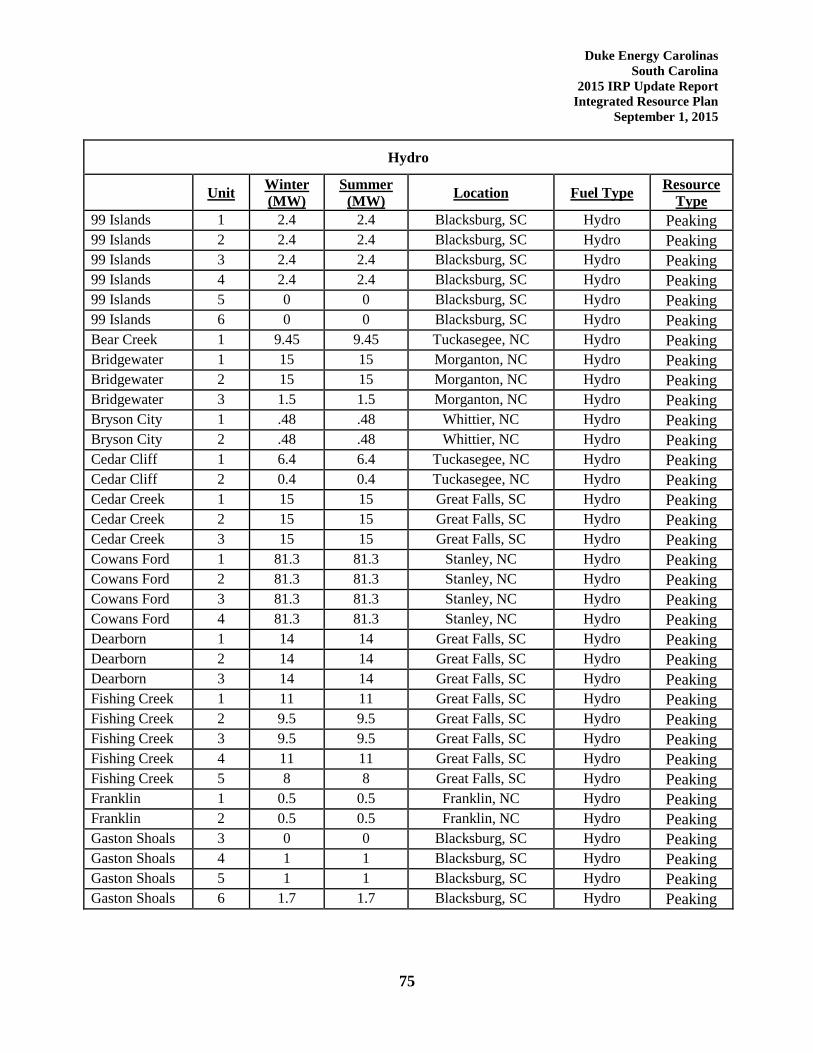
Duke Energy Carolinas
South Carolina
2015 IRP Update Report
Integrated Resource Plan
September 1, 2015
75
Hydro
Unit
Winter
(MW)
Summer
(MW) Location Fuel Type
Resource
Type
99 Islands 1 2.4 2.4 Blacksburg, SC Hydro Peaking
99 Islands 2 2.4 2.4 Blacksburg, SC Hydro Peaking
99 Islands 3 2.4 2.4 Blacksburg, SC Hydro Peaking
99 Islands 4 2.4 2.4 Blacksburg, SC Hydro Peaking
99 Islands 5 0 0 Blacksburg, SC Hydro Peaking
99 Islands 6 0 0 Blacksburg, SC Hydro Peaking
Bear Creek 1 9.45 9.45 Tuckasegee, NC Hydro Peaking
Bridgewater 1 15 15 Morganton, NC Hydro Peaking
Bridgewater 2 15 15 Morganton, NC Hydro Peaking
Bridgewater 3 1.5 1.5 Morganton, NC Hydro Peaking
Bryson City 1 .48 .48 Whittier, NC Hydro Peaking
Bryson City 2 .48 .48 Whittier, NC Hydro Peaking
Cedar Cliff 1 6.4 6.4 Tuckasegee, NC Hydro Peaking
Cedar Cliff 2 0.4 0.4 Tuckasegee, NC Hydro Peaking
Cedar Creek 1 15 15 Great Falls, SC Hydro Peaking
Cedar Creek 2 15 15 Great Falls, SC Hydro Peaking
Cedar Creek 3 15 15 Great Falls, SC Hydro Peaking
Cowans Ford 1 81.3 81.3 Stanley, NC Hydro Peaking
Cowans Ford 2 81.3 81.3 Stanley, NC Hydro Peaking
Cowans Ford 3 81.3 81.3 Stanley, NC Hydro Peaking
Cowans Ford 4 81.3 81.3 Stanley, NC Hydro Peaking
Dearborn 1 14 14 Great Falls, SC Hydro Peaking
Dearborn 2 14 14 Great Falls, SC Hydro Peaking
Dearborn 3 14 14 Great Falls, SC Hydro Peaking
Fishing Creek 1 11 11 Great Falls, SC Hydro Peaking
Fishing Creek 2 9.5 9.5 Great Falls, SC Hydro Peaking
Fishing Creek 3 9.5 9.5 Great Falls, SC Hydro Peaking
Fishing Creek 4 11 11 Great Falls, SC Hydro Peaking
Fishing Creek 5 8 8 Great Falls, SC Hydro Peaking
Franklin 1 0.5 0.5 Franklin, NC Hydro Peaking
Franklin 2 0.5 0.5 Franklin, NC Hydro Peaking
Gaston Shoals 3 0 0 Blacksburg, SC Hydro Peaking
Gaston Shoals 4 1 1 Blacksburg, SC Hydro Peaking
Gaston Shoals 5 1 1 Blacksburg, SC Hydro Peaking
Gaston Shoals 6 1.7 1.7 Blacksburg, SC Hydro Peaking
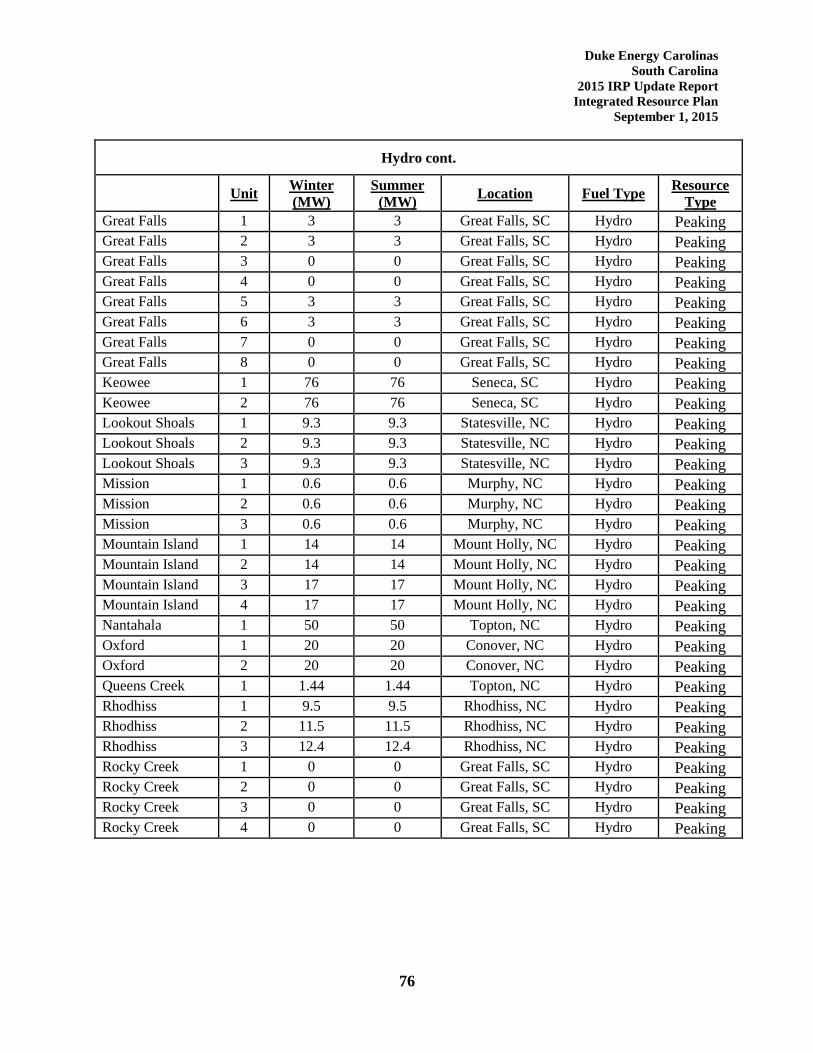
Duke Energy Carolinas
South Carolina
2015 IRP Update Report
Integrated Resource Plan
September 1, 2015
76
Hydro cont.
Unit
Winter
(MW)
Summer
(MW) Location Fuel Type
Resource
Type
Great Falls 1 3 3 Great Falls, SC Hydro Peaking
Great Falls 2 3 3 Great Falls, SC Hydro Peaking
Great Falls 3 0 0 Great Falls, SC Hydro Peaking
Great Falls 4 0 0 Great Falls, SC Hydro Peaking
Great Falls 5 3 3 Great Falls, SC Hydro Peaking
Great Falls 6 3 3 Great Falls, SC Hydro Peaking
Great Falls 7 0 0 Great Falls, SC Hydro Peaking
Great Falls 8 0 0 Great Falls, SC Hydro Peaking
Keowee 1 76 76 Seneca, SC Hydro Peaking
Keowee 2 76 76 Seneca, SC Hydro Peaking
Lookout Shoals 1 9.3 9.3 Statesville, NC Hydro Peaking
Lookout Shoals 2 9.3 9.3 Statesville, NC Hydro Peaking
Lookout Shoals 3 9.3 9.3 Statesville, NC Hydro Peaking
Mission 1 0.6 0.6 Murphy, NC Hydro Peaking
Mission 2 0.6 0.6 Murphy, NC Hydro Peaking
Mission 3 0.6 0.6 Murphy, NC Hydro Peaking
Mountain Island 1 14 14 Mount Holly, NC Hydro Peaking
Mountain Island 2 14 14 Mount Holly, NC Hydro Peaking
Mountain Island 3 17 17 Mount Holly, NC Hydro Peaking
Mountain Island 4 17 17 Mount Holly, NC Hydro Peaking
Nantahala 1 50 50 Topton, NC Hydro Peaking
Oxford 1 20 20 Conover, NC Hydro Peaking
Oxford 2 20 20 Conover, NC Hydro Peaking
Queens Creek 1 1.44 1.44 Topton, NC Hydro Peaking
Rhodhiss 1 9.5 9.5 Rhodhiss, NC Hydro Peaking
Rhodhiss 2 11.5 11.5 Rhodhiss, NC Hydro Peaking
Rhodhiss 3 12.4 12.4 Rhodhiss, NC Hydro Peaking
Rocky Creek 1 0 0 Great Falls, SC Hydro Peaking
Rocky Creek 2 0 0 Great Falls, SC Hydro Peaking
Rocky Creek 3 0 0 Great Falls, SC Hydro Peaking
Rocky Creek 4 0 0 Great Falls, SC Hydro Peaking
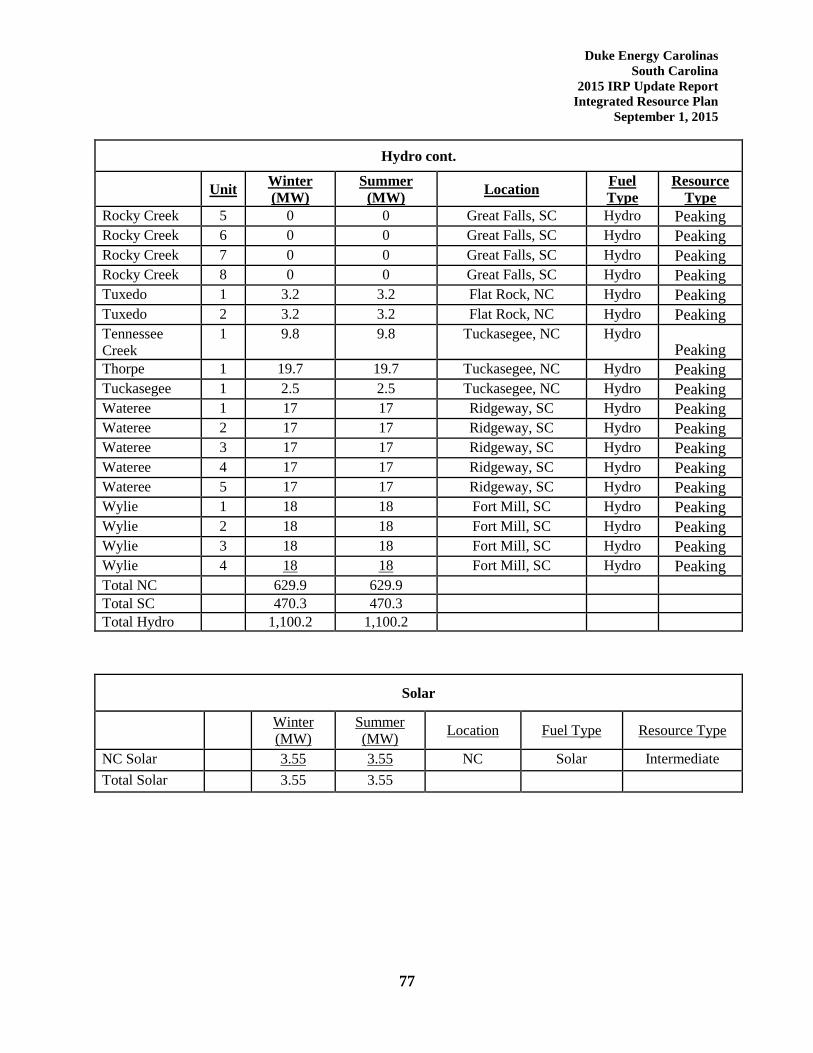
Duke Energy Carolinas
South Carolina
2015 IRP Update Report
Integrated Resource Plan
September 1, 2015
77
Hydro cont.
Unit
Winter
(MW)
Summer
(MW) Location
Fuel
Type
Resource
Type
Rocky Creek 5 0 0 Great Falls, SC Hydro Peaking
Rocky Creek 6 0 0 Great Falls, SC Hydro Peaking
Rocky Creek 7 0 0 Great Falls, SC Hydro Peaking
Rocky Creek 8 0 0 Great Falls, SC Hydro Peaking
Tuxedo 1 3.2 3.2 Flat Rock, NC Hydro Peaking
Tuxedo 2 3.2 3.2 Flat Rock, NC Hydro Peaking
Tennessee
Creek
1 9.8 9.8 Tuckasegee, NC Hydro Peaking
Thorpe 1 19.7 19.7 Tuckasegee, NC Hydro Peaking
Tuckasegee 1 2.5 2.5 Tuckasegee, NC Hydro Peaking
Wateree 1 17 17 Ridgeway, SC Hydro Peaking
Wateree 2 17 17 Ridgeway, SC Hydro Peaking
Wateree 3 17 17 Ridgeway, SC Hydro Peaking
Wateree 4 17 17 Ridgeway, SC Hydro Peaking
Wateree 5 17 17 Ridgeway, SC Hydro Peaking
Wylie 1 18 18 Fort Mill, SC Hydro Peaking
Wylie 2 18 18 Fort Mill, SC Hydro Peaking
Wylie 3 18 18 Fort Mill, SC Hydro Peaking
Wylie 4 18 18 Fort Mill, SC Hydro Peaking
Total NC 629.9 629.9
Total SC 470.3 470.3
Total Hydro 1,100.2 1,100.2
Solar
Winter
(MW)
Summer
(MW) Location Fuel Type Resource Type
NC Solar 3.55 3.55 NC Solar Intermediate
Total Solar 3.55 3.55
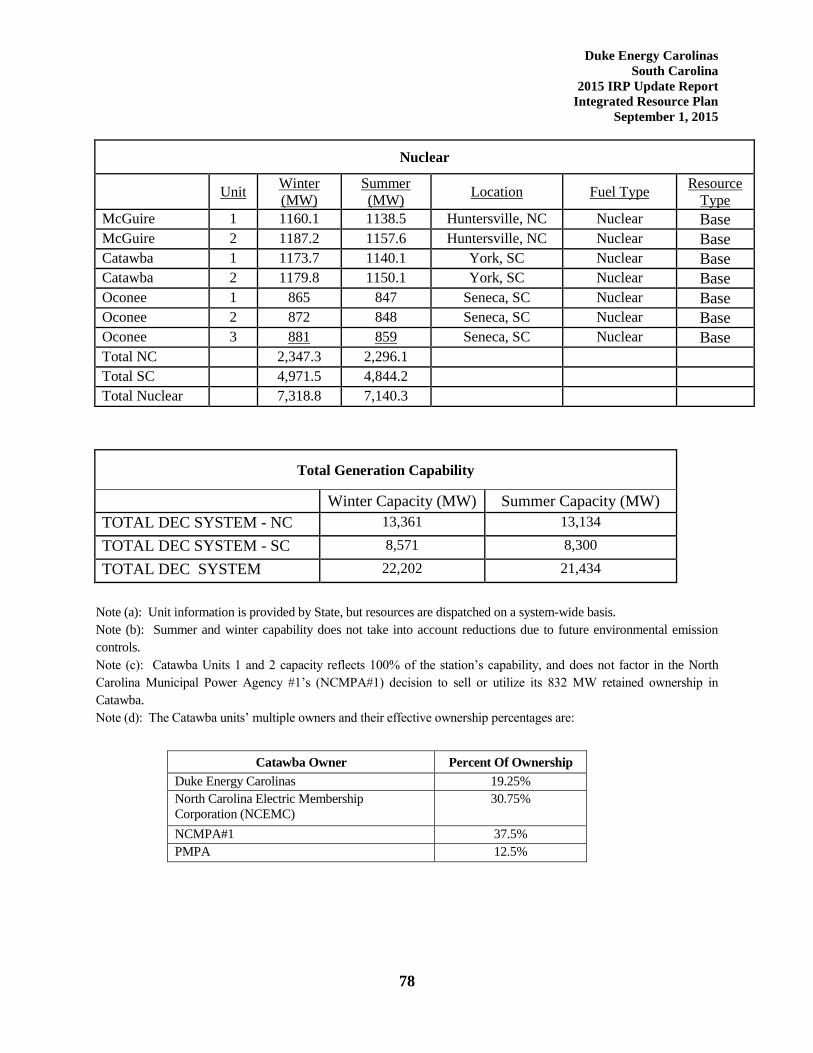
Duke Energy Carolinas
South Carolina
2015 IRP Update Report
Integrated Resource Plan
September 1, 2015
78
Nuclear
Unit
Winter
(MW)
Summer
(MW) Location Fuel Type
Resource
Type
McGuire 1 1160.1 1138.5 Huntersville, NC Nuclear Base
McGuire 2 1187.2 1157.6 Huntersville, NC Nuclear Base
Catawba 1 1173.7 1140.1 York, SC Nuclear Base
Catawba 2 1179.8 1150.1 York, SC Nuclear Base
Oconee 1 865 847 Seneca, SC Nuclear Base
Oconee 2 872 848 Seneca, SC Nuclear Base
Oconee 3 881 859 Seneca, SC Nuclear Base
Total NC 2,347.3 2,296.1
Total SC 4,971.5 4,844.2
Total Nuclear 7,318.8 7,140.3
Total Generation Capability
Winter Capacity (MW) Summer Capacity (MW)
TOTAL DEC SYSTEM - NC 13,361 13,134
TOTAL DEC SYSTEM - SC 8,571 8,300
TOTAL DEC SYSTEM 22,202 21,434
Note (a): Unit information is provided by State, but resources are dispatched on a system-wide basis.
Note (b): Summer and winter capability does not take into account reductions due to future environmental emission
controls.
Note (c): Catawba Units 1 and 2 capacity reflects 100% of the station’s capability, and does not factor in the North
Carolina Municipal Power Agency #1’s (NCMPA#1) decision to sell or utilize its 832 MW retained ownership in
Catawba.
Note (d): The Catawba units’ multiple owners and their effective ownership percentages are:
Catawba Owner Percent Of Ownership
Duke Energy Carolinas 19.25%
North Carolina Electric Membership
Corporation (NCEMC)
30.75%
NCMPA#1 37.5%
PMPA 12.5%
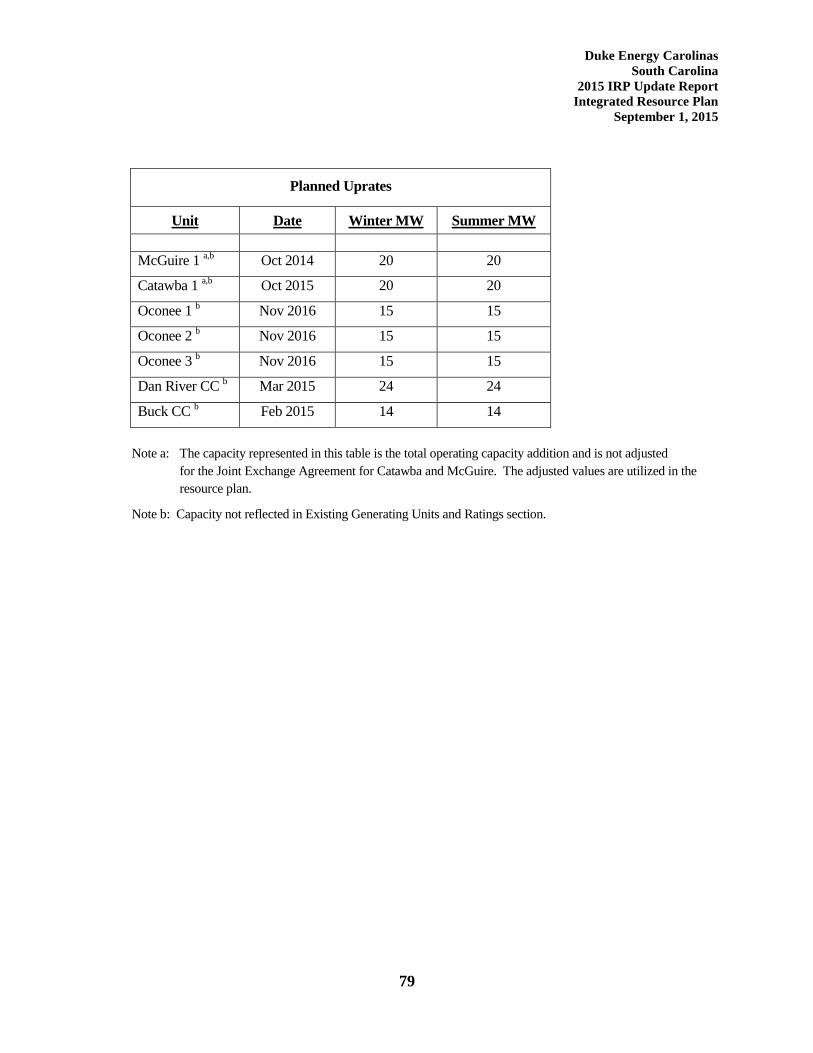
Duke Energy Carolinas
South Carolina
2015 IRP Update Report
Integrated Resource Plan
September 1, 2015
79
Planned Uprates
Unit Date Winter MW Summer MW
McGuire 1 a,b
Oct 2014 20 20
Catawba 1 a,b
Oct 2015 20 20
Oconee 1 b Nov 2016 15 15
Oconee 2 b Nov 2016 15 15
Oconee 3 b Nov 2016 15 15
Dan River CC b Mar 2015 24 24
Buck CC b Feb 2015 14 14
Note a: The capacity represented in this table is the total operating capacity addition and is not adjusted
for the Joint Exchange Agreement for Catawba and McGuire. The adjusted values are utilized in the
resource plan.
Note b: Capacity not reflected in Existing Generating Units and Ratings section.
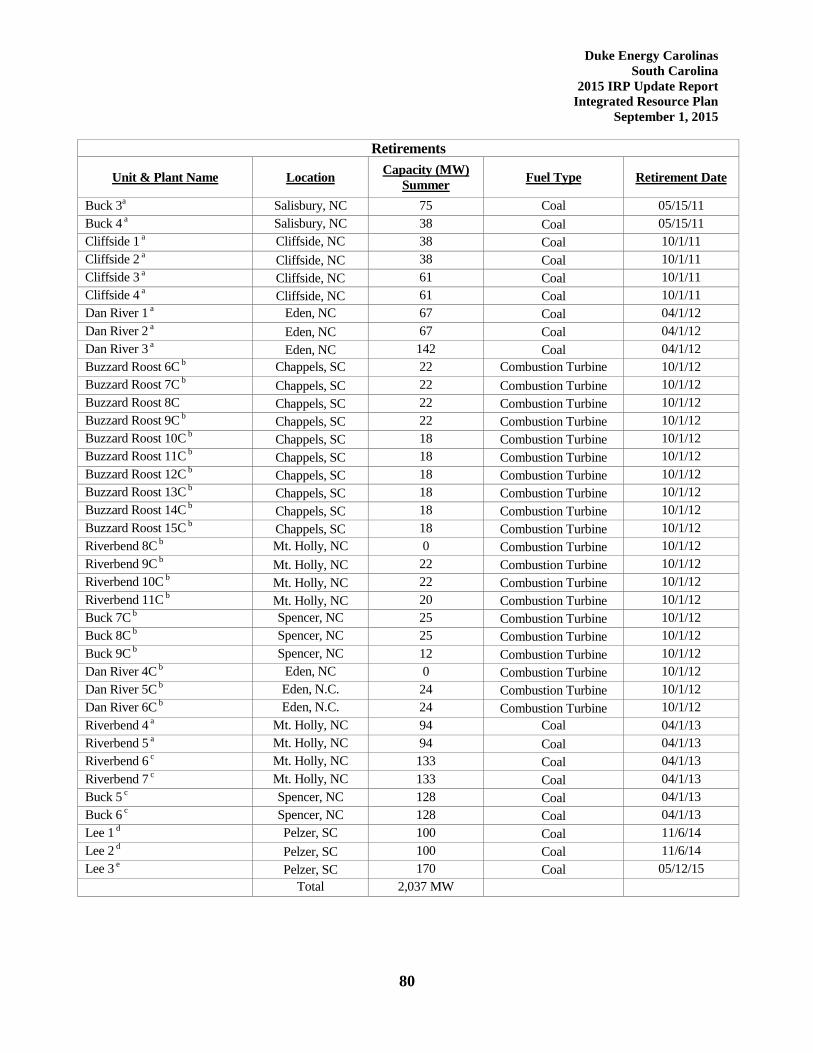
Duke Energy Carolinas
South Carolina
2015 IRP Update Report
Integrated Resource Plan
September 1, 2015
80
Retirements
Unit & Plant Name Location Capacity (MW)
Summer Fuel Type Retirement Date
Buck 3a Salisbury, NC 75 Coal 05/15/11
Buck 4 a Salisbury, NC 38 Coal 05/15/11
Cliffside 1 a Cliffside, NC 38 Coal 10/1/11
Cliffside 2 a Cliffside, NC 38 Coal 10/1/11
Cliffside 3 a Cliffside, NC 61 Coal 10/1/11
Cliffside 4 a Cliffside, NC 61 Coal 10/1/11
Dan River 1 a Eden, NC 67 Coal 04/1/12
Dan River 2 a Eden, NC 67 Coal 04/1/12
Dan River 3 a Eden, NC 142 Coal 04/1/12
Buzzard Roost 6C b Chappels, SC 22 Combustion Turbine 10/1/12
Buzzard Roost 7C b Chappels, SC 22 Combustion Turbine 10/1/12
Buzzard Roost 8C Chappels, SC 22 Combustion Turbine 10/1/12
Buzzard Roost 9C b Chappels, SC 22 Combustion Turbine 10/1/12
Buzzard Roost 10C b Chappels, SC 18 Combustion Turbine 10/1/12
Buzzard Roost 11C b Chappels, SC 18 Combustion Turbine 10/1/12
Buzzard Roost 12C b Chappels, SC 18 Combustion Turbine 10/1/12
Buzzard Roost 13C b Chappels, SC 18 Combustion Turbine 10/1/12
Buzzard Roost 14C b Chappels, SC 18 Combustion Turbine 10/1/12
Buzzard Roost 15C b Chappels, SC 18 Combustion Turbine 10/1/12
Riverbend 8C b Mt. Holly, NC 0 Combustion Turbine 10/1/12
Riverbend 9C b Mt. Holly, NC 22 Combustion Turbine 10/1/12
Riverbend 10C b Mt. Holly, NC 22 Combustion Turbine 10/1/12
Riverbend 11C b Mt. Holly, NC 20 Combustion Turbine 10/1/12
Buck 7C b Spencer, NC 25 Combustion Turbine 10/1/12
Buck 8C b Spencer, NC 25 Combustion Turbine 10/1/12
Buck 9C b Spencer, NC 12 Combustion Turbine 10/1/12
Dan River 4C b Eden, NC 0 Combustion Turbine 10/1/12
Dan River 5C b Eden, N.C. 24 Combustion Turbine 10/1/12
Dan River 6C b Eden, N.C. 24 Combustion Turbine 10/1/12
Riverbend 4 a Mt. Holly, NC 94 Coal 04/1/13
Riverbend 5 a Mt. Holly, NC 94 Coal 04/1/13
Riverbend 6 c Mt. Holly, NC 133 Coal 04/1/13
Riverbend 7 c Mt. Holly, NC 133 Coal 04/1/13
Buck 5 c Spencer, NC 128 Coal 04/1/13
Buck 6 c Spencer, NC 128 Coal 04/1/13
Lee 1 d Pelzer, SC 100 Coal 11/6/14
Lee 2 d Pelzer, SC 100 Coal 11/6/14
Lee 3 e Pelzer, SC 170 Coal 05/12/15
Total 2,037 MW
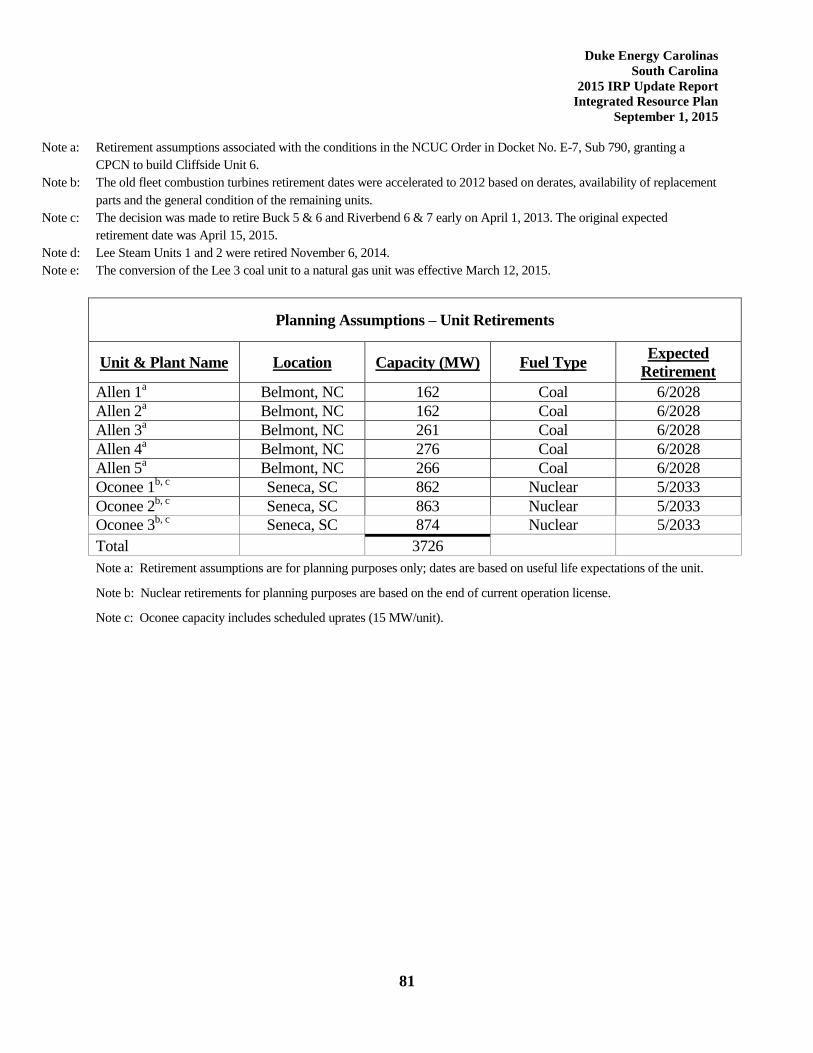
Duke Energy Carolinas
South Carolina
2015 IRP Update Report
Integrated Resource Plan
September 1, 2015
81
Note a: Retirement assumptions associated with the conditions in the NCUC Order in Docket No. E-7, Sub 790, granting a
CPCN to build Cliffside Unit 6.
Note b: The old fleet combustion turbines retirement dates were accelerated to 2012 based on derates, availability of replacement
parts and the general condition of the remaining units.
Note c: The decision was made to retire Buck 5 & 6 and Riverbend 6 & 7 early on April 1, 2013. The original expected
retirement date was April 15, 2015.
Note d: Lee Steam Units 1 and 2 were retired November 6, 2014.
Note e: The conversion of the Lee 3 coal unit to a natural gas unit was effective March 12, 2015.
Planning Assumptions – Unit Retirements
Unit & Plant Name Location Capacity (MW) Fuel Type Expected
Retirement
Allen 1a Belmont, NC 162 Coal 6/2028
Allen 2a Belmont, NC 162 Coal 6/2028
Allen 3a Belmont, NC 261 Coal 6/2028
Allen 4a Belmont, NC 276 Coal 6/2028
Allen 5a Belmont, NC 266 Coal 6/2028
Oconee 1b, c
Seneca, SC 862 Nuclear 5/2033
Oconee 2b, c Seneca, SC 863 Nuclear 5/2033
Oconee 3b, c Seneca, SC 874 Nuclear 5/2033
Total 3726
Note a: Retirement assumptions are for planning purposes only; dates are based on useful life expectations of the unit.
Note b: Nuclear retirements for planning purposes are based on the end of current operation license.
Note c: Oconee capacity includes scheduled uprates (15 MW/unit).
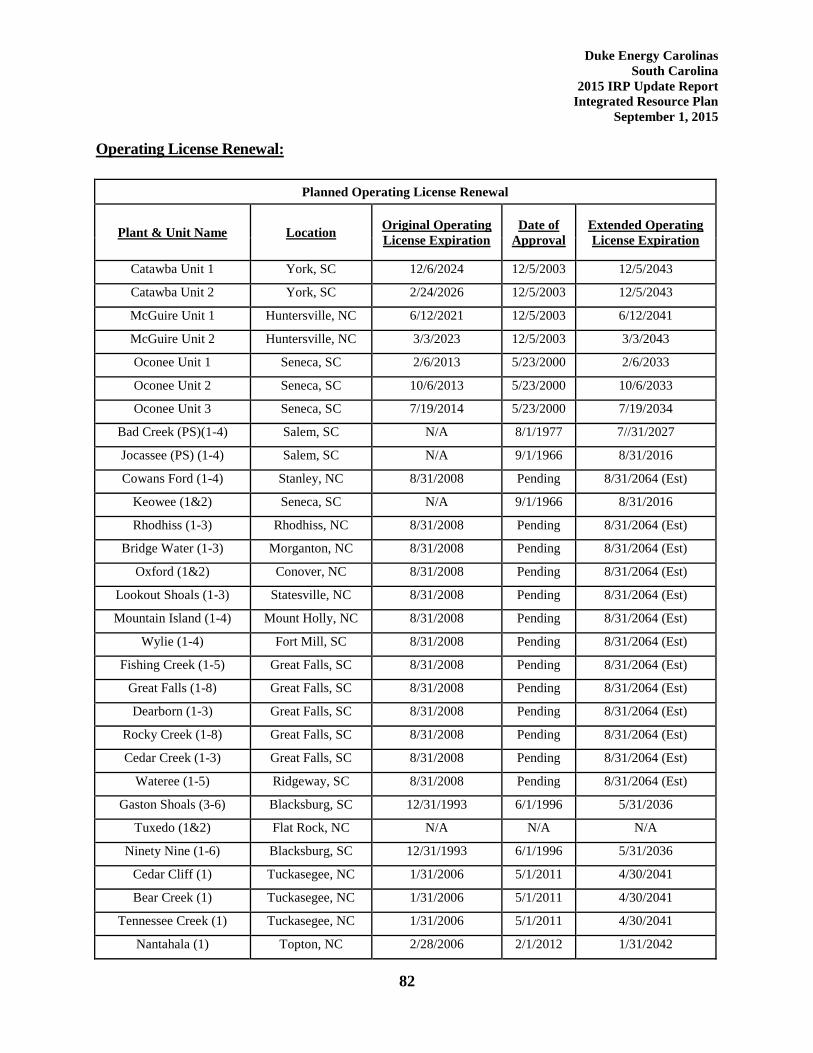
Duke Energy Carolinas
South Carolina
2015 IRP Update Report
Integrated Resource Plan
September 1, 2015
82
Operating License Renewal:
Planned Operating License Renewal
Plant & Unit Name Location Original Operating
License Expiration
Date of
Approval
Extended Operating
License Expiration
Catawba Unit 1 York, SC 12/6/2024 12/5/2003 12/5/2043
Catawba Unit 2 York, SC 2/24/2026 12/5/2003 12/5/2043
McGuire Unit 1 Huntersville, NC 6/12/2021 12/5/2003 6/12/2041
McGuire Unit 2 Huntersville, NC 3/3/2023 12/5/2003 3/3/2043
Oconee Unit 1 Seneca, SC 2/6/2013 5/23/2000 2/6/2033
Oconee Unit 2 Seneca, SC 10/6/2013 5/23/2000 10/6/2033
Oconee Unit 3 Seneca, SC 7/19/2014 5/23/2000 7/19/2034
Bad Creek (PS)(1-4) Salem, SC N/A 8/1/1977 7//31/2027
Jocassee (PS) (1-4) Salem, SC N/A 9/1/1966 8/31/2016
Cowans Ford (1-4) Stanley, NC 8/31/2008 Pending 8/31/2064 (Est)
Keowee (1&2) Seneca, SC N/A 9/1/1966 8/31/2016
Rhodhiss (1-3) Rhodhiss, NC 8/31/2008 Pending 8/31/2064 (Est)
Bridge Water (1-3) Morganton, NC 8/31/2008 Pending 8/31/2064 (Est)
Oxford (1&2) Conover, NC 8/31/2008 Pending 8/31/2064 (Est)
Lookout Shoals (1-3) Statesville, NC 8/31/2008 Pending 8/31/2064 (Est)
Mountain Island (1-4) Mount Holly, NC 8/31/2008 Pending 8/31/2064 (Est)
Wylie (1-4) Fort Mill, SC 8/31/2008 Pending 8/31/2064 (Est)
Fishing Creek (1-5) Great Falls, SC 8/31/2008 Pending 8/31/2064 (Est)
Great Falls (1-8) Great Falls, SC 8/31/2008 Pending 8/31/2064 (Est)
Dearborn (1-3) Great Falls, SC 8/31/2008 Pending 8/31/2064 (Est)
Rocky Creek (1-8) Great Falls, SC 8/31/2008 Pending 8/31/2064 (Est)
Cedar Creek (1-3) Great Falls, SC 8/31/2008 Pending 8/31/2064 (Est)
Wateree (1-5) Ridgeway, SC 8/31/2008 Pending 8/31/2064 (Est)
Gaston Shoals (3-6) Blacksburg, SC 12/31/1993 6/1/1996 5/31/2036
Tuxedo (1&2) Flat Rock, NC N/A N/A N/A
Ninety Nine (1-6) Blacksburg, SC 12/31/1993 6/1/1996 5/31/2036
Cedar Cliff (1) Tuckasegee, NC 1/31/2006 5/1/2011 4/30/2041
Bear Creek (1) Tuckasegee, NC 1/31/2006 5/1/2011 4/30/2041
Tennessee Creek (1) Tuckasegee, NC 1/31/2006 5/1/2011 4/30/2041
Nantahala (1) Topton, NC 2/28/2006 2/1/2012 1/31/2042
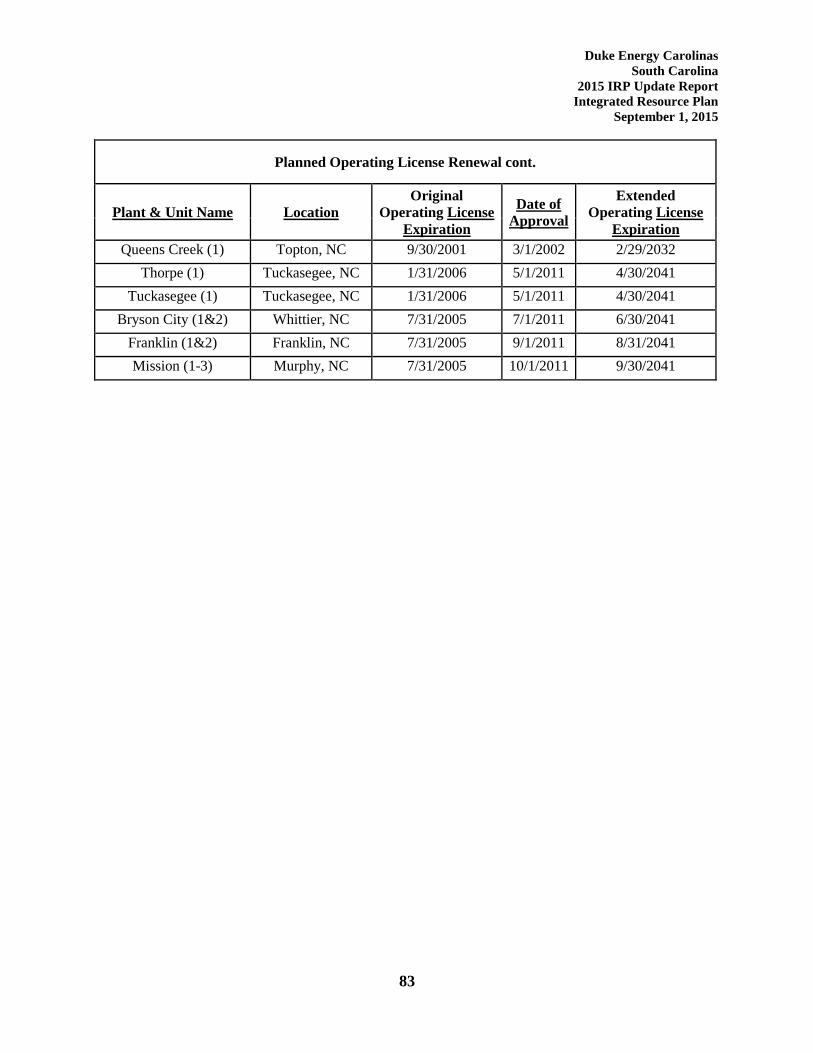
Duke Energy Carolinas
South Carolina
2015 IRP Update Report
Integrated Resource Plan
September 1, 2015
83
Planned Operating License Renewal cont.
Plant & Unit Name Location
Original
Operating License
Expiration
Date of
Approval
Extended
Operating License
Expiration
Queens Creek (1) Topton, NC 9/30/2001 3/1/2002 2/29/2032
Thorpe (1) Tuckasegee, NC 1/31/2006 5/1/2011 4/30/2041
Tuckasegee (1) Tuckasegee, NC 1/31/2006 5/1/2011 4/30/2041
Bryson City (1&2) Whittier, NC 7/31/2005 7/1/2011 6/30/2041
Franklin (1&2) Franklin, NC 7/31/2005 9/1/2011 8/31/2041
Mission (1-3) Murphy, NC 7/31/2005 10/1/2011 9/30/2041
Duke Energy Carolinas
South Carolina
2015 IRP Update Report
Integrated Resource Plan
September 1, 2015
84
10. CONCLUSIONS:
DEC continues to focus on the needs of customers by meeting the growing demand in the most
economical and reliable manner possible. The Company continues to improve the IRP process
by determining best practices and making changes to more accurately and realistically
represent the DEC System in its planning practices. The 2015 IRP represents a 15 year
projection of the Company’s plan to balance future customer demand and supply resources to
meet this demand plus a 17% minimum planning reserve margin. Over the 15-year planning
horizon, DEC expects to require 5,711 MW of additional generating resources in addition to
the incremental renewable resources, EE and DSM already in the resource plan.
The Company focuses on the needs of the short-term, while keeping a close watch on market
trends and technology advancements to meet the demands of customers in the long-term. The
Company’s short-term and long-term plans are summarized below:
Short-Term:
Over the next 5 years, DEC’s 2015 IRP focuses on the following:
Complete construction of the Lee CC plant in Anderson, SC scheduled for operation in
November of 2017.
Continue the work necessary to obtain COLs for Lee Nuclear.
Complete the resource adequacy study currently underway with Astrape Consulting.
Procure CHP resources as cost-effective and diverse generation sources as appropriate.
Continue to meet SC DERP and NC REPS compliance plans by adding additional
renewable resources and EE to the DEC system.
Continue to grow DSM in the Carolinas region.
Long-Term:
Beyond the next 5 years, DEC’s 2015 IRP focuses on the following:
Continue to seek the most cost-effective, reliable resources to meet the growing customer
demand in the service territory. Currently, those are new combined cycle units and nuclear
units in the 15 year planning horizon.
Procure CHP resources as cost-effective and diverse generation sources as appropriate.
Continue to meet SC DERP and NC REPS compliance plans by investing in additional
renewable resources and EE on the DEC system.
Continue to invest in DSM in the Carolinas region.

Duke Energy Carolinas
South Carolina
2015 IRP Update Report
Integrated Resource Plan
September 1, 2015
85
DEC’s goal is to continue to diversify the DEC system by adding a variety of cost-effective,
reliable, clean resources to meet customer demand. Over the next 15 years, the Company projects
filling the increasing demand with investments in natural gas, nuclear, renewables and EE and
DSM.
Duke Energy Carolinas
South Carolina
2015 IRP Update Report
Integrated Resource Plan
September 1, 2015
86
11. NON-UTILITY GENERATION & WHOLESALE:
The following information describes the tables included in this chapter.
Wholesale Sales Contracts
This table includes wholesale sales contracts that are included in the 2015 Load Forecast. This
information is CONFIDENTIAL.
Wholesale Purchase Contracts
This table includes all wholesale purchase contracts that are included as resources in the 2015
IRP. This information is CONFIDENTIAL.
Duke Energy Carolinas
South Carolina
2015 IRP Update Report
Integrated Resource Plan
September 1, 2015
Table 11-A Wholesale Sales Contracts (CONFIDENTIAL)
Customer Product Term 2015 2016 2017 2018 2019 2020 2021 2022 2023 2024
Concord Partial Requirements 2009-2018 167 169 171 174 0 0 0 0 0 0
Dallas Partial Requirements 2009-2028 11 12 12 12 12 12 13 13 13 13
Due West Partial Requirements 2009-2018 3 3 3 3 3 3 3 3 3 3
Forest City Partial Requirements 2009-2028 18 18 18 18 19 19 19 20 20 20
Greenwood Full Requirements 2010-2018 58 58 59 59 0 0 0 0 0 0
Highlands Full Requirements 2010-2029 8 8 8 8 8 8 8 8 8 8
Kings Mountain Partial Requirements 2009-2018 21 21 21 22 0 0 0 0 0 0
Lockhart Partial Requirements 2009-2018 51 41 41 41 42 42 42 43 43 44
Prosperity Partial Requirements 2009-2028 2 2 2 2 2 2 2 2 3 3
Western Carolina Full Requirements 2010-2021 5 5 5 5 6 6 6 6 6 6
Blue Ridge EMC Full Requirements 2010-2031 229 232 234 237 239 242 245 248 251 255
Central EPC Partial Requirements 2013-2030 361 504 640 778 864 871 886 899 910 920
Haywood EMC Full Requirements 2009-2021 21 21 22 22 23 23 23 23 24 24
NCEMC Fixed Load Shape 2009-2038 72 72 72 72 72 72 72 72 72 72
NCEMC Backstand 1985-2043 107 107 107 107 107 107 107 107 107 107
Piedmont EMC Full Requirements 2010-2031 91 92 92 93 94 94 95 96 97 99
PMPA Backstand 2014-2020 47 47 47 47 47 47 0 0 0 0
Rutherford EMC Partial Requirements 2010-2031 213 215 218 220 222 226 229 232 236 240
Notes:
- Backstand contract values represent the reserve margin amount. For example, for NCEMC Backstand of Catawba 1, 17% * 630 = 107 MWs
- For wholesale contracts, Duke Carolinas/Duke Progress assumes all wholesale contracts will renew unless there is an indication that the contract will not be renewed.
- For the period that the wholesale load is undesignated, contract volumes are projected using the same methodology as was assumed in the original contract (e.g.
econometric modeling, past volumes with weather normalization and growth rates, etc.).
87
Duke Energy Carolinas
South Carolina
2015 IRP Update Report
Integrated Resource Plan
September 1, 2015
Table 11-B Firm Wholesale Purchased Power Contracts (CONFIDENTIAL)
Purchased Power Contract
Primary
Fuel Type
Summer
Capacity
(MW)
Capacity
Designation
Location
Term
Volume of
Purchases
(MWh)
Jul 14-Jun 15
Cherokee County
Cogeneration Partners, LLC 1 Gas 86 Peaking Gaffney, SC 12/31/2020 498,625
Blue Ridge EMC Hydro 7 Peaking GA-AL-SC system EOP 11,506
Blue Ridge EMC Nuclear 32 Base Boone, NC EOP 279,984
Blue Ridge EMC Fuel Oil 5 Peaking Boone, NC 12/31/2021 25
City of Concord, NC Fuel Oil 29 Peaking Concord, NC 12/31/2018 1,045
City of Dallas, NC Fuel Oil 3 Peaking Dallas, NC 12/31/2018 0
City of Forest City, NC Fuel Oil 11 Peaking Forest City, NC 12/31/2018 0
City of Kings Mountain, NC Fuel Oil 10 Peaking Kings Mountain, NC 12/31/2018 0
Haywood EMC Gas 4 Peaking Waynesville, NC 12/31/2021 332
Haywood EMC Nuclear 3 Base Waynesville, NC EOP 26,208
Haywood EMC Gas 1 Peaking Waynesville, NC 12/31/2021 331
Haywood EMC Hydro 1 Peaking GA-AL-SC system EOP 1,470
Haywood EMC System 3 Base Waynesville, NC 12/31/2019 24,284
Haywood EMC System 2 Base Waynesville, NC 12/31/2021 17,519
Haywood EMC System 2 Intermediate Waynesville, NC 12/31/2021 8,987
Piedmont EMC Nuclear 16 Base Hillsborough, NC EOP 139,968
Notes: EOP: End of study period
The capacities shown are delivered to the DEC system and may differ from the contracted amount.
Renewables purchases are listed in the NC REPS Compliance Plan in the Attachment to this IRP.
Data represented above represents contractual agreements. These resources may be modeled differently in our analyses.
88